
Residential Locations and Health Effects on Multitasking Behaviours and Day Experiences


1
Department of Civil and Environmental Engineering, Universiti Teknologi PETRONAS, Seri Iskandar 32610, Perak Darul Ridzuan, Malaysia
2
Institute of Transport and Infrastructure, Universiti Teknologi PETRONAS, Seri Iskandar 32610, Perak Darul Ridzuan, Malaysia
3
School of Architecture, Planning and Policy Development, Bandung Institute of Technology, Bandung 40132, Indonesia
4
Institute for Transport Studies, Department of Landscape, Spatial and Infrastructure Science, University of Natural Resources and Life Sciences, Peter-Jordan-Strasse 82, 1190 Vienna, Austria
5
Department of Civil Engineering, Parahyangan Catholic University, Jalan Ciumbuleuit 94, Bandung 40117, Indonesia
*
Author to whom correspondence should be addressed.
Sustainability 2021, 13(20), 11347; https://doi.org/10.3390/su132011347
Submission received: 27 July 2021
/
Revised: 8 September 2021
/
Accepted: 10 September 2021
/
Published: 14 October 2021
(This article belongs to the Section Sustainability in Geographic Science)
Abstract
:There has been a substantial amount of research on travel-based multitasking and its effect on travel and life satisfaction. Previous studies, however, have not considered the effect of built environment, health, and daily activity duration on such analyses. There is also a lack of knowledge about the effect of such multitasking on individuals’ daily experience and how built environment, health, and activity duration correlate with one’s daily satisfaction and cognitive well-being. The inclusion of time-space prism elements provides deeper insights into reasons and trade-off behaviours of individuals engaging in multitasking, through explaining interdependencies between trips and multitasking behaviours and their impacts on their activity engagement satisfaction and well-being appreciation. Using a three-week time-use diary from Indonesia, this study found that the influences of built environment and physical health on multitasking activities are relatively stronger than activity duration and trip parameters. The results also demonstrated positive correlations between polycentric city designs and people’s day experiences. Whilst evidence from developed countries has shown that the effect of gender on multitasking is significant, this study found that the gender effects on multitasking activities participation were weaker than built environment and physical health factors.
1. Introduction
In a modern, competitive, fast-moving, and connected society, multitasking is becoming an essential and repetitive behaviour in daily life. Multitasking can be seen as a burden in that it involves contaminating a primary activity with a secondary activity. Whilst it can be distracting and/or exhausting, undertaking passive leisure during various primary activities can also be seen as an effort to increase enjoyment while completing a task [1,2].
There has been abundant research on participation in multitasking, especially multitasking during travel in developed (e.g., [3,4,5,6,7]) and developing countries (e.g., [8,9,10]). Multitasking is also performed during non-travel activities (e.g., [1,2,11]) but studies on these activities have been mostly conducted in developed countries. Different socio-economic, built environment, welfare, and cultural contexts in developing countries provide individuals with very different constraints and opportunities as compared to those in developed countries, thus leading to different evaluations and appreciations of multitasking activity. To date, most multitasking studies have focused on the influence of socio-demographic variables, contextual variables (e.g., trip-related variables and the presence of other people), and attitudes [2,3,9,10,12]. Little attention has been given to the influence of residential location situations (RLS), health, and the day-to-day effects of activity durations. Ohmori and Harata [13] and Malokin et al. [9] collected activity durations over a single day and ignored the variations in activity and travel duration on a daily basis. Susilo and Liu [14,15] investigated the effects of day-to-day variability and BE on health, but any correlation between BE, health, and multitasking activities was overlooked.
From time-space prism perspectives, activity durations and perceived health conditions could be considered proxies for some constraints (e.g., capability and coupling constraints), whereas RLS could be considered opportunities offered by spatial conditions to shape people’s activity-travel patterns [16,17,18]. Health effects that cover people’s physical, social, and mental limitations might reveal another component of capability constraints not revealed by conventional spatiotemporal variables. Since multitasking might correlate with well-being, including health in a multitasking study may provide insight into ways health might help in reducing or increasing multitasking that correlate with improving well-being.
In the last decade, well-being has been used as an alternative indicator to measure the benefit and/or subjective appreciation of undertaking an activity or a single trip [19,20,21]. The theory is closer to the original conception of Bentham’s pleasures and pain experiences [19,20]. Despite their importance, previous research on multitasking and well-being has mostly focused on the relationships between multitasking while travelling and travel satisfaction [5,12,20,21,22,23,24], and its relationship with global subjective well-being (GSWB, [2,20,21]). There is a lack of knowledge on the effect of multitasking on satisfaction and cognitive well-being on a multiday basis (referred to as day experience, DE). Since well-being can have daily and weekly variations, DE is different from GSWB; DE can be defined as efforts to reach better GSWB on a daily basis [25,26]. Extending the investigations on which multitasking activities can correlate with positive DE might help in defining which multitasking activities are useful.
This study aims to contribute to the existing research by investigating the effects of activity durations, trip parameters, RLS, and health on multitasking, and in turn the effects of multitasking on daily satisfaction and cognitive well-being, for three different activities, i.e., grocery shopping, travelling, and work. Grocery shopping, similarly to other discretionary activities (e.g., socialising and relaxing), offers greater spatial and temporal flexibility, whereas work tends to be more fixed and limit participation in discretionary activities [27,28] and is considered less enjoyable [29]. Since grocery shopping and working are activities performed in destinations, travelling is added into the analysis to represent activities that are not undertaken in destinations or function as intermediate activities to move people between different destinations/places [1,16,17]. Multitasking in travel is hypothesised to be shaped by trip arrangements and travel modes, whereas multitasking during non-travel activities or during activities in destinations is hypothesised to be correlated with daily activity and trip arrangements. Figuring out the effects of multitasking during travel and non-travel on well-being might help in recommending during which primary activities multitasking should be undertaken and how a time-space prism perspective can provide insight in understanding constraint–opportunity relationships, interdependency between trips and multitasking activities, effects of out-of-home activity configurations, and effects of in-home and out-of-home activity configurations, RLS, and health on multitasking behaviour. The trade-off between activity durations, RLS, and health might suggest integrated transport, land use, health, and social policies that can make the effects of multitasking correlate to positive DE. In addition, because ‘passive leisure’ was found to be the dominant secondary activity involved in multitasking, including when driving a vehicle or taking the bus [30,31] and non-travel activities [1,11], multitasking is defined in this study as engagement in passive leisure during travel and non-travel.
The 2013 Bandung Metropolitan Area (BMA) dataset will be used to enrich our hitherto scant knowledge of the roles of spatiotemporal and health variables, particularly on the roles of multitasking during non-travel, in a developing country context. Whilst Indonesia is one of the countries with the highest number of Internet users in the world [32], back in 2013, the use of ICT for working and online leisure activity participations was not common. Modified structural equation modelling (SEM) will be used to deal some endogeneity problems raised among multitasking, other spatiotemporal variables, and health on DE.
A literature review and the studied area and dataset used in this study will be described in the next section. Section 5 and Section 6 describe the proposed model and method, and its estimated results, respectively. The discussions’ conclusions are clarified in Section 7, whereas recommendations and limitations are in Section 8.
2. Literature Review
2.1. Multitasking Activities
Multitasking can be performed during activities that are somewhat flexible in terms of scheduling (e.g., grocery shopping), during more fixed types of non-travel activities (e.g., working and studying) and during travelling [1]. In time-space prism perspectives, imposed constraints and opportunities are hypothesised to explain why people choose to perform multitasking within more flexible activities (e.g., grocery shopping) or more fixed activities (e.g., working and studying). Passive leisure is the most common type of secondary multitasking activity found during non-travel and driving tasks [1,11]. By employing a time-use survey, the allocations of additional time to passive leisure were found to be around 160% [1]. Whilst there have been a number of studies of multitasking activities in developed countries, multitasking activity behaviours during non-travel in developing countries is not yet widely studied.
Beside socio-demographic variables, trip characteristics, household structure, and attitude variables, the durations of each of multiple activity on the given day can provide insight into whether time poverty makes people multitask. Time poverty due to spending longer obligation activity time (e.g., working, studying, childcare) might make people engage more often in multitasking activities during some discretionary activities [7,11]. However, when the full pictures of people’s daily activity-travel configurations are included, it becomes evident that longer obligation time might not be always the reasons why people engage in multitasking during discretionary activities. Flexible or tighter time-space constraints due to different trip configurations either within one or several trip chains are hypothesised to make people opt to multitask or not during travel. It is also hypothesised that more out-of-home discretionary activity commitments might limit people’s engagements in multitasking during working. In-home and out-of-home activity configurations are also hypothesised to correlate with multitasking.
RLS factors, on the other hand, represent characteristics of residential locations in terms of land use shape, congestion level, and travel time/distance to reach the city centre and various public amenities. Residing in an area closer to various public amenities is hypothesised to provide the travellers with opportunities for undertaking discretionary trips more often and with much less time expenditures, which may correspond to more time availability and lower participation rates of multitasking. In contrast, increasing the distance to various public amenities might increase the total daily travel time, thus potentially contributing to the time stress [33,34]. Therefore, the increased distance is hypothesised to increase multitasking participation.
It is also worth considering health variables as additional proxies for capability constraints [14,35]. These variables can explain why people limit or perform some activities including multitasking due to their physical, social, or mental health conditions, which are difficult to discover in terms of traditional activity duration, socio-demographic, and built environment variables.
2.2. The Effect of Multitasking, Activity Duration, RLS. and Health on Well-Being
Daily activities and trips (which including multitasking) can be defined as individuals’ efforts to fulfil higher-level needs (e.g., social relationships and self-realisation) or specific life domain satisfaction (e.g., family, leisure), which in turn correspond with high/low life satisfaction on a daily basis [36,37]. The influence of activity and travel participation on subjective well-being is found to be indirect, through satisfaction with either travel or activity [21]. However, the influence of activity-travel patterns on subjective well-being can also be direct [19].
Well-being can include the cognitive or affective aspects, or both, of one’s state of being at a given time [19,20,21]. It can relate to the whole life domain (global subjective well-being) or to a specific life domain (e.g., family, health, or work). DE is part of domain-specific well-being that measures daily satisfaction and cognitive well-being [17,21]. Aggregate measurements of DE comprise a daily accumulation of all activities, trips, and built environment situations, not just a single trip/activity, and not those which occur over one-day (which is the approach taken when observing overall and specific-life domain well-being). Due to the aggregate of measurements, daily activity-travel patterns are hypothesised to have a direct effect on DE. Previous studies (e.g., [23,24]) have found that someone may still report a low-level daily travel satisfaction whilst reporting high satisfaction for a single trip. Multitasking during an activity (e.g., during socialising or leisure activities) or a trip might be enough to correlate with positive well-being during that episode of trip/activity, but it might not significantly correlate with positive DE.
With regard to RLS and well-being, RLS shows how spatial situations support people in fulfilling their higher-level needs or specific life domains. Density, mixed-use level [21,38], distance to the city centre, public transport, various public amenities [36], and perceptions of neighbourhoods [39] have been used as indicators to show the effects of objective and subjective spatial situations on well-being. However, most studies used global well-being indicators such as life satisfactions and affective well-being or its proxy (e.g., psychological distress and depression) [40], and personal relationship satisfaction [36] in measuring geographical effects on well-being. RLS conditions have been found to correlate with different activity-travel patterns due to having a different mixed-used level, and distance to the city centre and various public amenities [41,42,43]. Therefore, it is hypothesised that RLS can also significantly correlate with DE. However, the effects of RLS on DE are rarely found in the current literatures.
Positive well-being is found to correlate with overall mental health and low anxiety and depression [44]. People with better well-being also experience better physical health and fewer unpleasant physical symptoms [45]; it also supports social interactions as a proxy for better social health [46]. However, to the authors’ knowledge, investigations of the effects of health on well-being have been limited, particularly with regard to how health correlates with longitudinal measurements of well-being (e.g., DE). Bearing in mind that health is a part of capability constraints that limit or enable people to perform some activities and considering the intersections of measuring mental health and affective well-being, health is hypothesised to have significant correlations with DE.
2.3. The Nesting Effect of Day-to-Day and Other Household Members’ Activity-Travel Patterns
Each day’s activities and travels are distinct due to changing daily needs, constraints, and resources [47,48]. At the same time, interactions with and responsibilities towards household members and compulsory activities mean that some individuals have shared and joined activities that they can negotiate and/or repeat on a daily basis [49,50]. The inclusion of other household members’ activity-travel patterns may represent the effects of social interactions at the household level that can correlate with activity-travel pattern and well-being. Day-to-day variations and changing social interaction with other household member variations are overlooked in multitasking studies; thus, this study will fill the gap.
3. Bandung Metropolitan Area
The Bandung Metropolitan Area (BMA) contains Bandung city, Bandung regency, West Bandung regency, Cimahi city, and six districts within Sumedang regency with around 3500.38 km2 of area [51]. The population increased from 7.89 million people in 2010 to around 8.8 million people in 2018 [51] showing growth of around 1.44%/year. Population density increased from 2332.33/km2 in 2010 to 2601.33/km2 in 2018 [51], whilst the densest areas are Bandung (14,068.50/km2) and Cimahi city (14,079.80/km2), with only covering 5.93% of total BMA area.
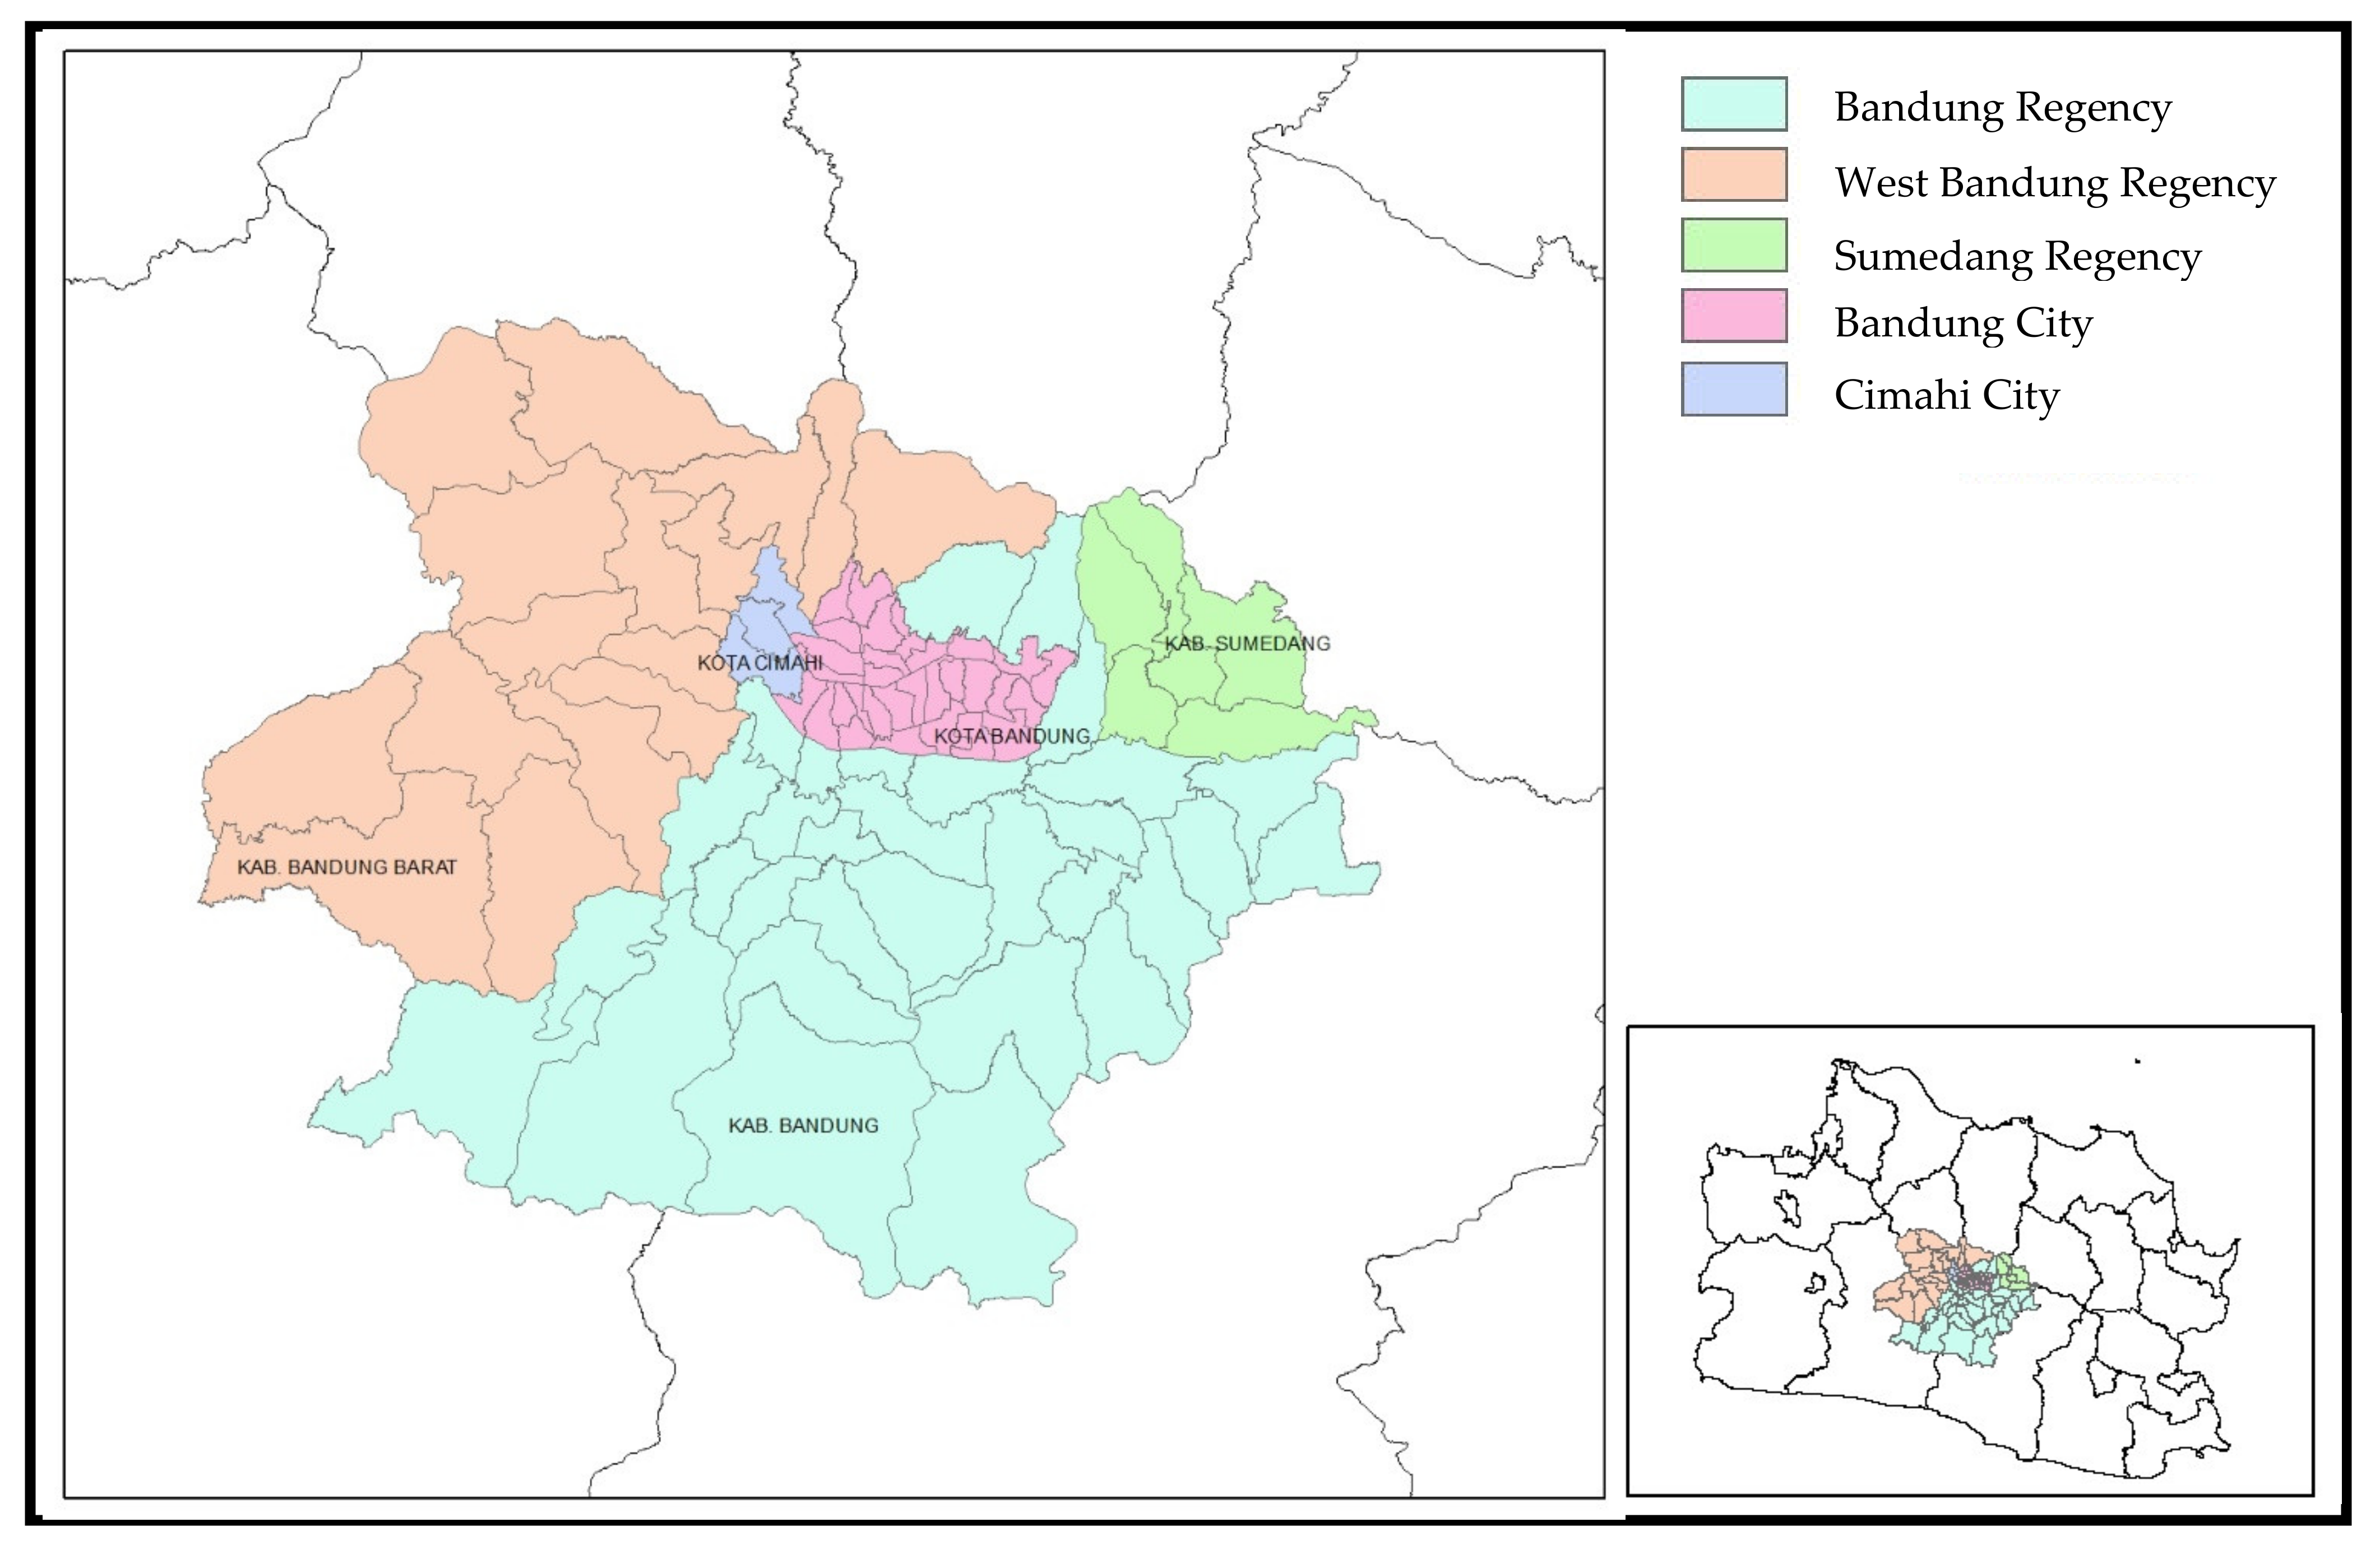
In 2013, for Bandung city and its core areas, poor road performance resulted from high usage of private cars and motorcycles (or defined as private vehicles) with a 77% market share, in conjunction with low performances of public transport [52]. By 2018, the public transports share further reduced due to increasing population compounded by low public infrastructure development from 2013 to 2018. This led to a boom in private vehicle usage during this period, leading to heavy congestion [53]. Public transport networks include bus routes, angkots, and ojegs. Angkots are minibuses with relatively fixed routes but without fixed stops and timetables, whereas ojegs look like motorcycle taxis that have no fixed routes and stops [54]. Angkots can modify the routes to get more passengers, thus the operations, to some extents, like ojegs are usually defined as paratransit [53,54]. BMA also has a very high, market driven, mixed land use patterns. Such land use patterns, on the one hand, give travellers more choices within closer distances, but, on the other hand, provide uneven development across the cities and high level of side friction due to mixed and high intensity activities along the transport infrastructure [55]. Figure 1 shows the map of BMA.
4. 2013 Bandung Metropolitan Area (BMA) Dataset
4.1. Data Collection Design
A 21-day panel activity diary was collected along with individuals’ socio-demographic information. This was a household survey where all members of the households were included. In total, the sample consisted of 191 households and 732 individuals using the probability proportional to size (PPS) method. The respondents represented 0.02% of the BMA population at that time [57]. In PPS, areas with larger population are sampled at higher levels than areas with smaller populations. In the survey, respondents received incentives which were more than token but smaller than real payments [57]. No ethical standards for the activity diary and socio-demographic survey were imposed by authorities in Indonesia. However, the respondents were informed that their privacy was protected.
The respondents were adults and dependent children (≤14 years old). In terms of adults, those who were in studying stage (15–22 years old) and senior citizens or those of at retirement age (>55 years old in the case of Indonesia) were distinguished from the working age populations (23–55 years old). Moreover, those aged between 23 and 45 and those 46 to 55 might have different time-space constraints due to their different life stage; for instance, the latter might have higher income or older children than the former [58] particularly in an Indonesian context [57]. Income was based on household income as many in Indonesia are single earner households, thus personal income is not appropriate to represent this indicator. For the present study, children’s data were excluded, and the individual data that have no built environment information were also deleted. Approximately 584 respondents were included. A detailed description of the data is provided by [55]. The profile of the 584 respondents is illustrated in Table 1.
4.2. The Classifications of Activity Types and Multitasking
According to Meloni et al. [59], time-use and activity participation can be classified as either mandatory or discretionary. This classification is used by Dharmowijoyo [57]. Modes of travel recorded in this study comprise private vehicles, public transport, and non-motorised modes only. When the data were collected in 2013, ride-sourcing services did not widely operate.
Multitasking has been defined as the switching, interleaving, or overlaying of two or more activities undertaken by the same person at a given time [60,61]. In this study, multitasking is defined as a concurrent activity that comprises a primary and a secondary activity conducted at the same time [60]. A secondary activity is defined as one with a lower degree of continuity and active attentions than the primary activity. Secondary activities can thus be suddenly stopped or postponed when more continuity and active attentions are required for the primary activity. For example, people can read or work while listening to the radio or turning on the TV news. Other examples, such as performing non-intensive socialising (e.g., having a short conversation) or making a coffee during a five or ten-minute break in working time can be classified as a secondary activity during work time. Other types of activities, for instance, sport, might have a higher degree of continuity in engagements and attentions than non-intensive socialising that can be undertaken during sport time. Therefore, sport is defined as a primary activity.
During time recorded for the survey, passive leisure (e.g., listening to radio/music, watching TV, a break to make a coffee or taking snacks from the kitchens/cupboards, non-intensive socialising during various primary activities) were the only activities classified as secondary activities, the definition of which was explained by the surveyors to the respondents before the survey. People were questioned as to whether they multitask during different activities and types of travels (e.g., commuting and non-commuting).
4.3. Residential Locations and Day Experiences
To measure the impacts of RLS factors, both objective and perceived measurements were used. Digital land use data were used to measure the density of various land use types in all areas [61]. Due to the past time’s leniencies and flexibilities when dealing with market driven developments in BMA areas [62], currently, there are too many developments which do not comply with the official land use development plan. Thus, not all the locations of current public amenities can be effectively captured in the current digital land use data. To tackle this, perceived accessibility was used to understand how people perceive travel time using private vehicles (as the main mode of most respondents) to access various public transport nodes, public amenities, government offices, green spaces/parks, agriculture areas, and the city centre based on their daily patterns and spatial understanding. Whilst BMA has tried to create polycentric structures, areas near the city centre tend to still be more compact with shorter distances to various public amenities whereas suburban and Greater BMA tend to be more dispersed [63].
In accordance with Rasouli and Timmermans [5], to capture DE, each individual was asked ‘What is your day experience with regard to activity-travel participation and built environment conditions?’ A seven-point Likert scale was used and ranging from very bad to very good.
4.4. Health Variables
Health variables were derived from Short Form-36 (SF-36) questions as inspired by Suzukamo et al. [64]. Health comprises broader aspects than the absence of disease and infirmity, but excludes physical, social, and mental well-being or the social dimensions of health [64,65] and that which is defined as health-related quality of life [66]. Physical, social, and mental problems due to health issues such as obesity, diabetes, asthma, heart, and respiratory diseases are covered by this definition of health. Suzukamo et al. [64] defined eight parameters in SF-36; among them were physical functioning (PF), limitations on role function according to physical health (RP), general health (GH), and bodily pain (BP) as observed variables of physical health. RP, social functioning (SF), and limitations on role functioning due to emotional problems (RE) define social health, whereas mental health is explained by BP, SF, GH, vitality (VT), and mental health (MH).
Following Suzukamo et al. [64], confirmatory factor analysis (CFA) was used to define each health variable. The loading factors of each observed variable on each health variable are shown in Table 2. As suggested by Hair et al. [67], factor scores were estimated to create a composite value for subsequent analysis that reflects the relative contributions of each of the observed variables as a result of CFA. Factor scores have no unit, and it is a standardised value as a Z score metric with a mean of zero and a value range from −3 to 3 across the sample [67]. Equation (1) shows how to find factor score value () as a product of the factor loading matrix () as a result of CFA, the inverse of covariance matrix (Σ−1), and observed variables (yi). The results of factor scores estimation including mean, standard deviations, and maximum and minimum values are shown in Table 3. As shown in Table 2, the loading factors show different weights, thus factor scores are better at representing health variables in the regression analysis than summated scales (‘average’ or ‘mean’ values).
4.5. Descriptive Analysis
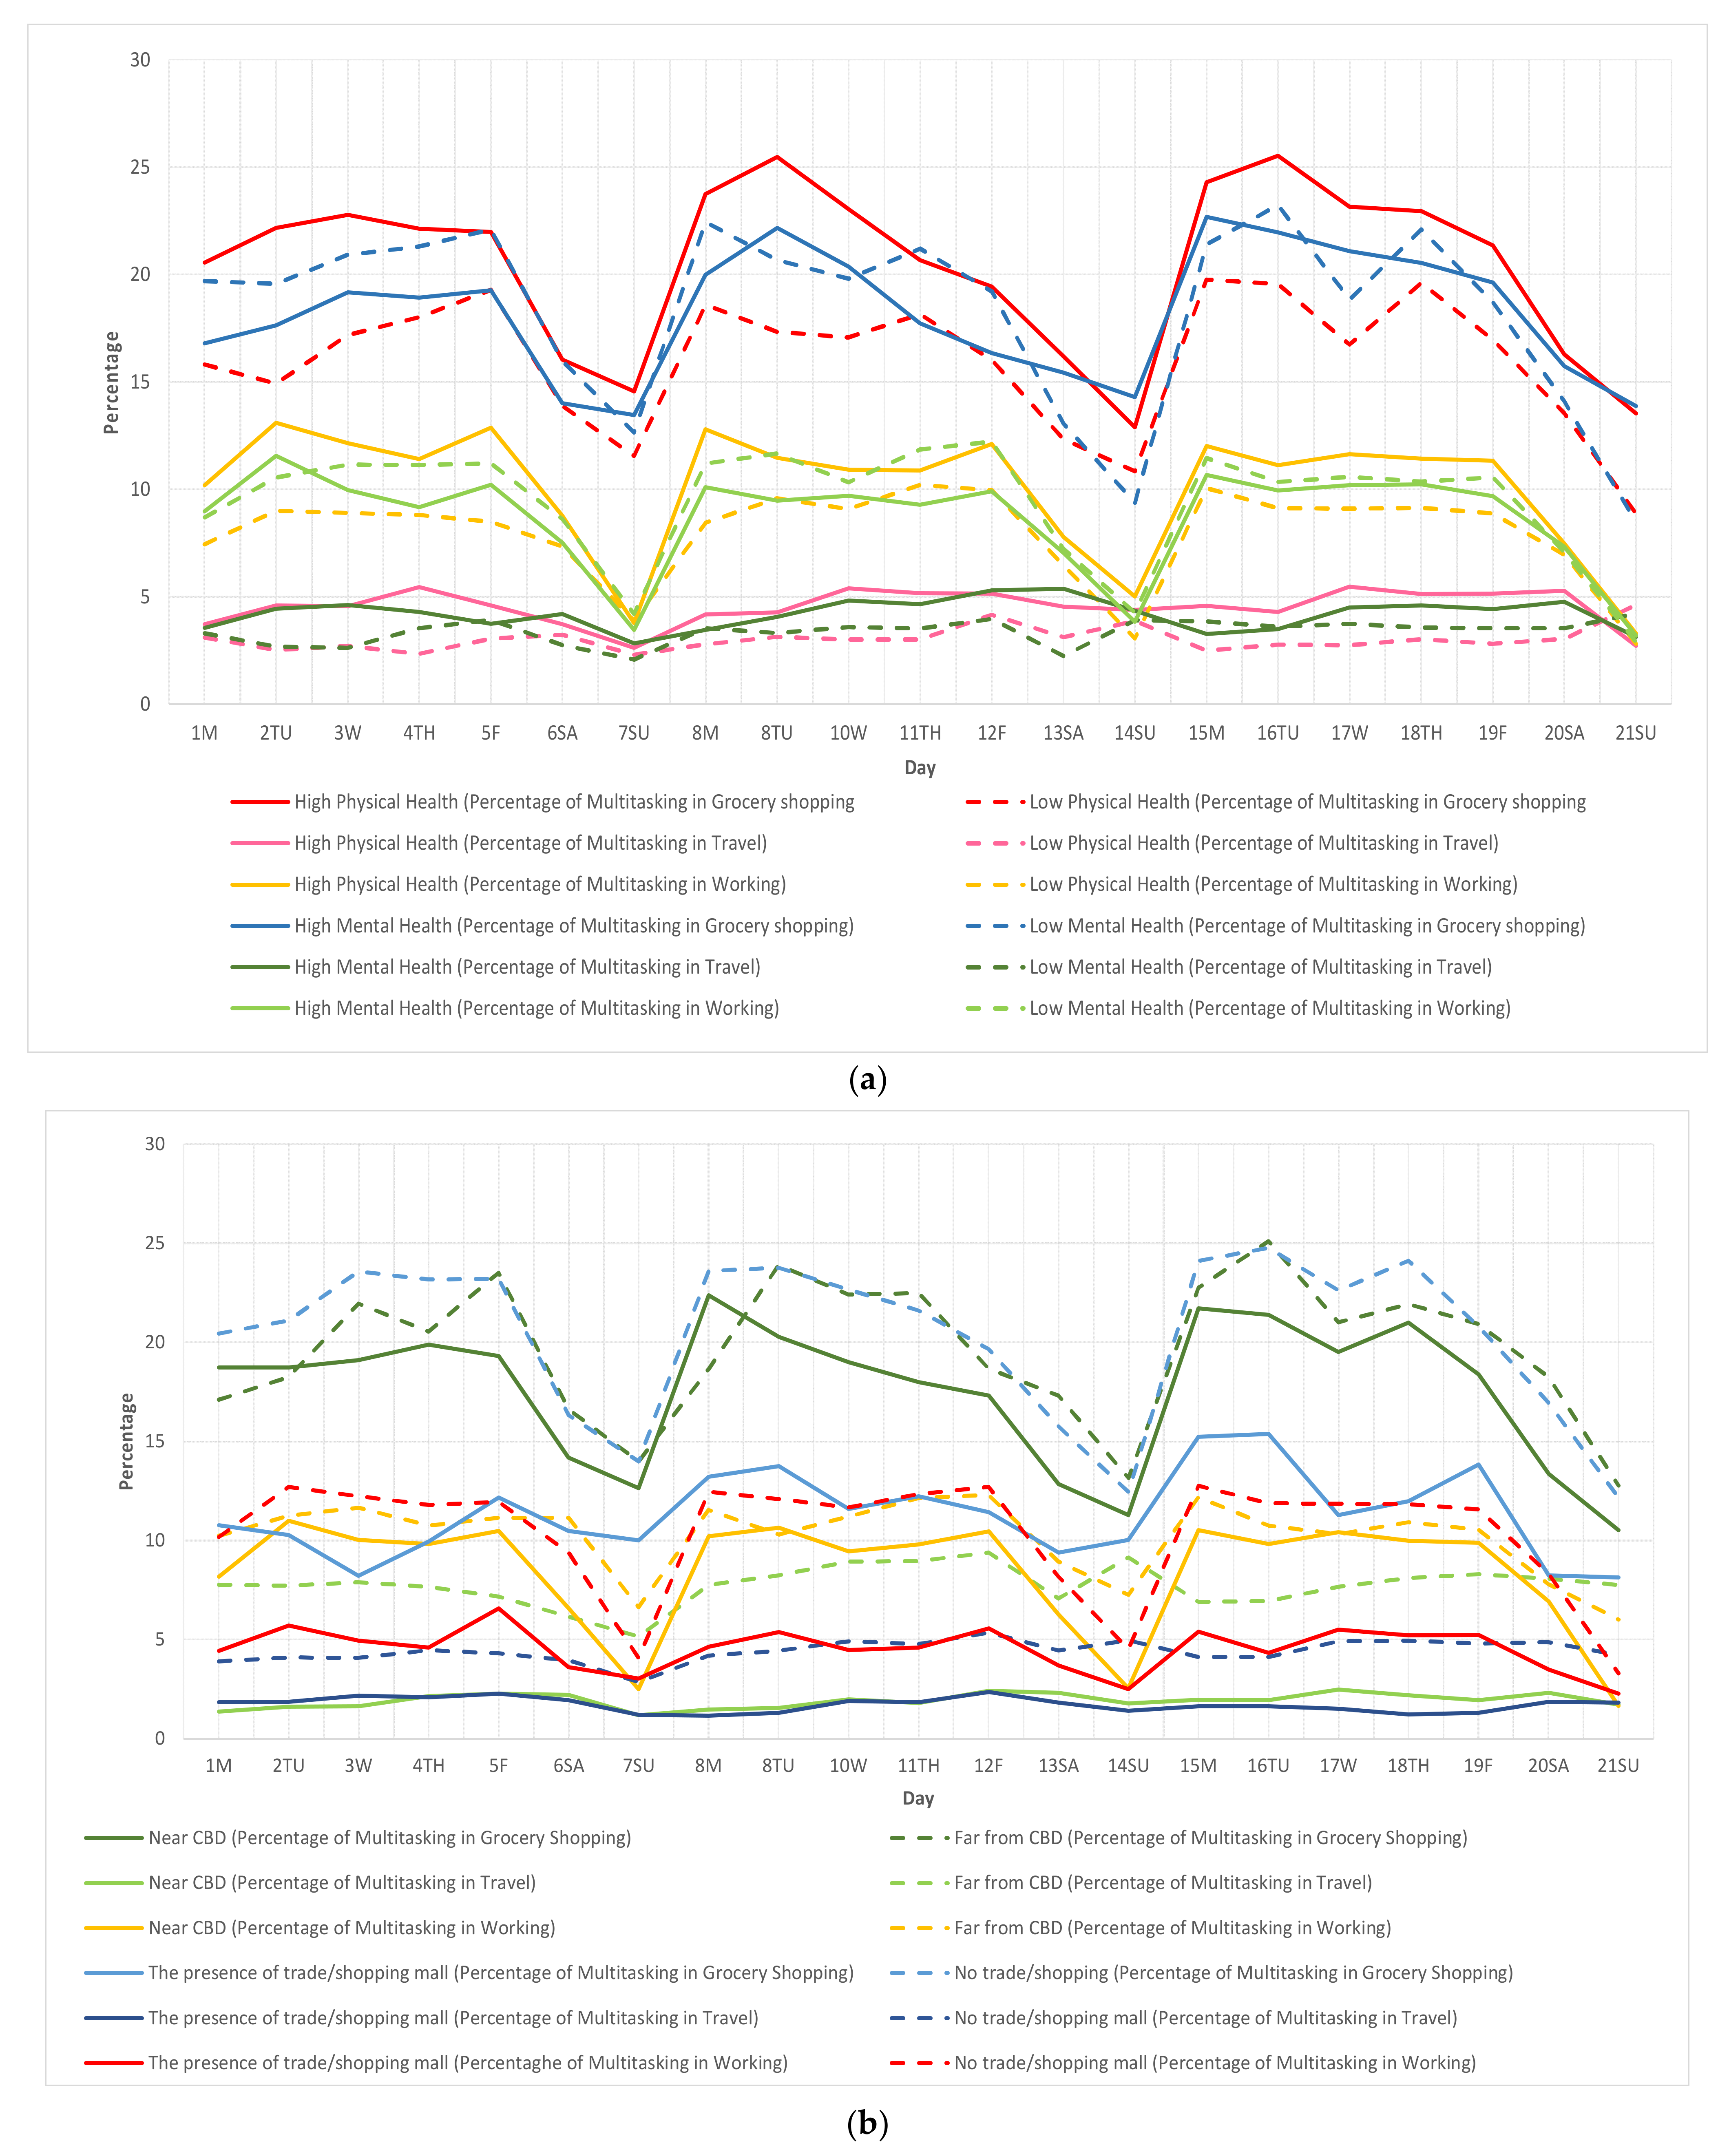
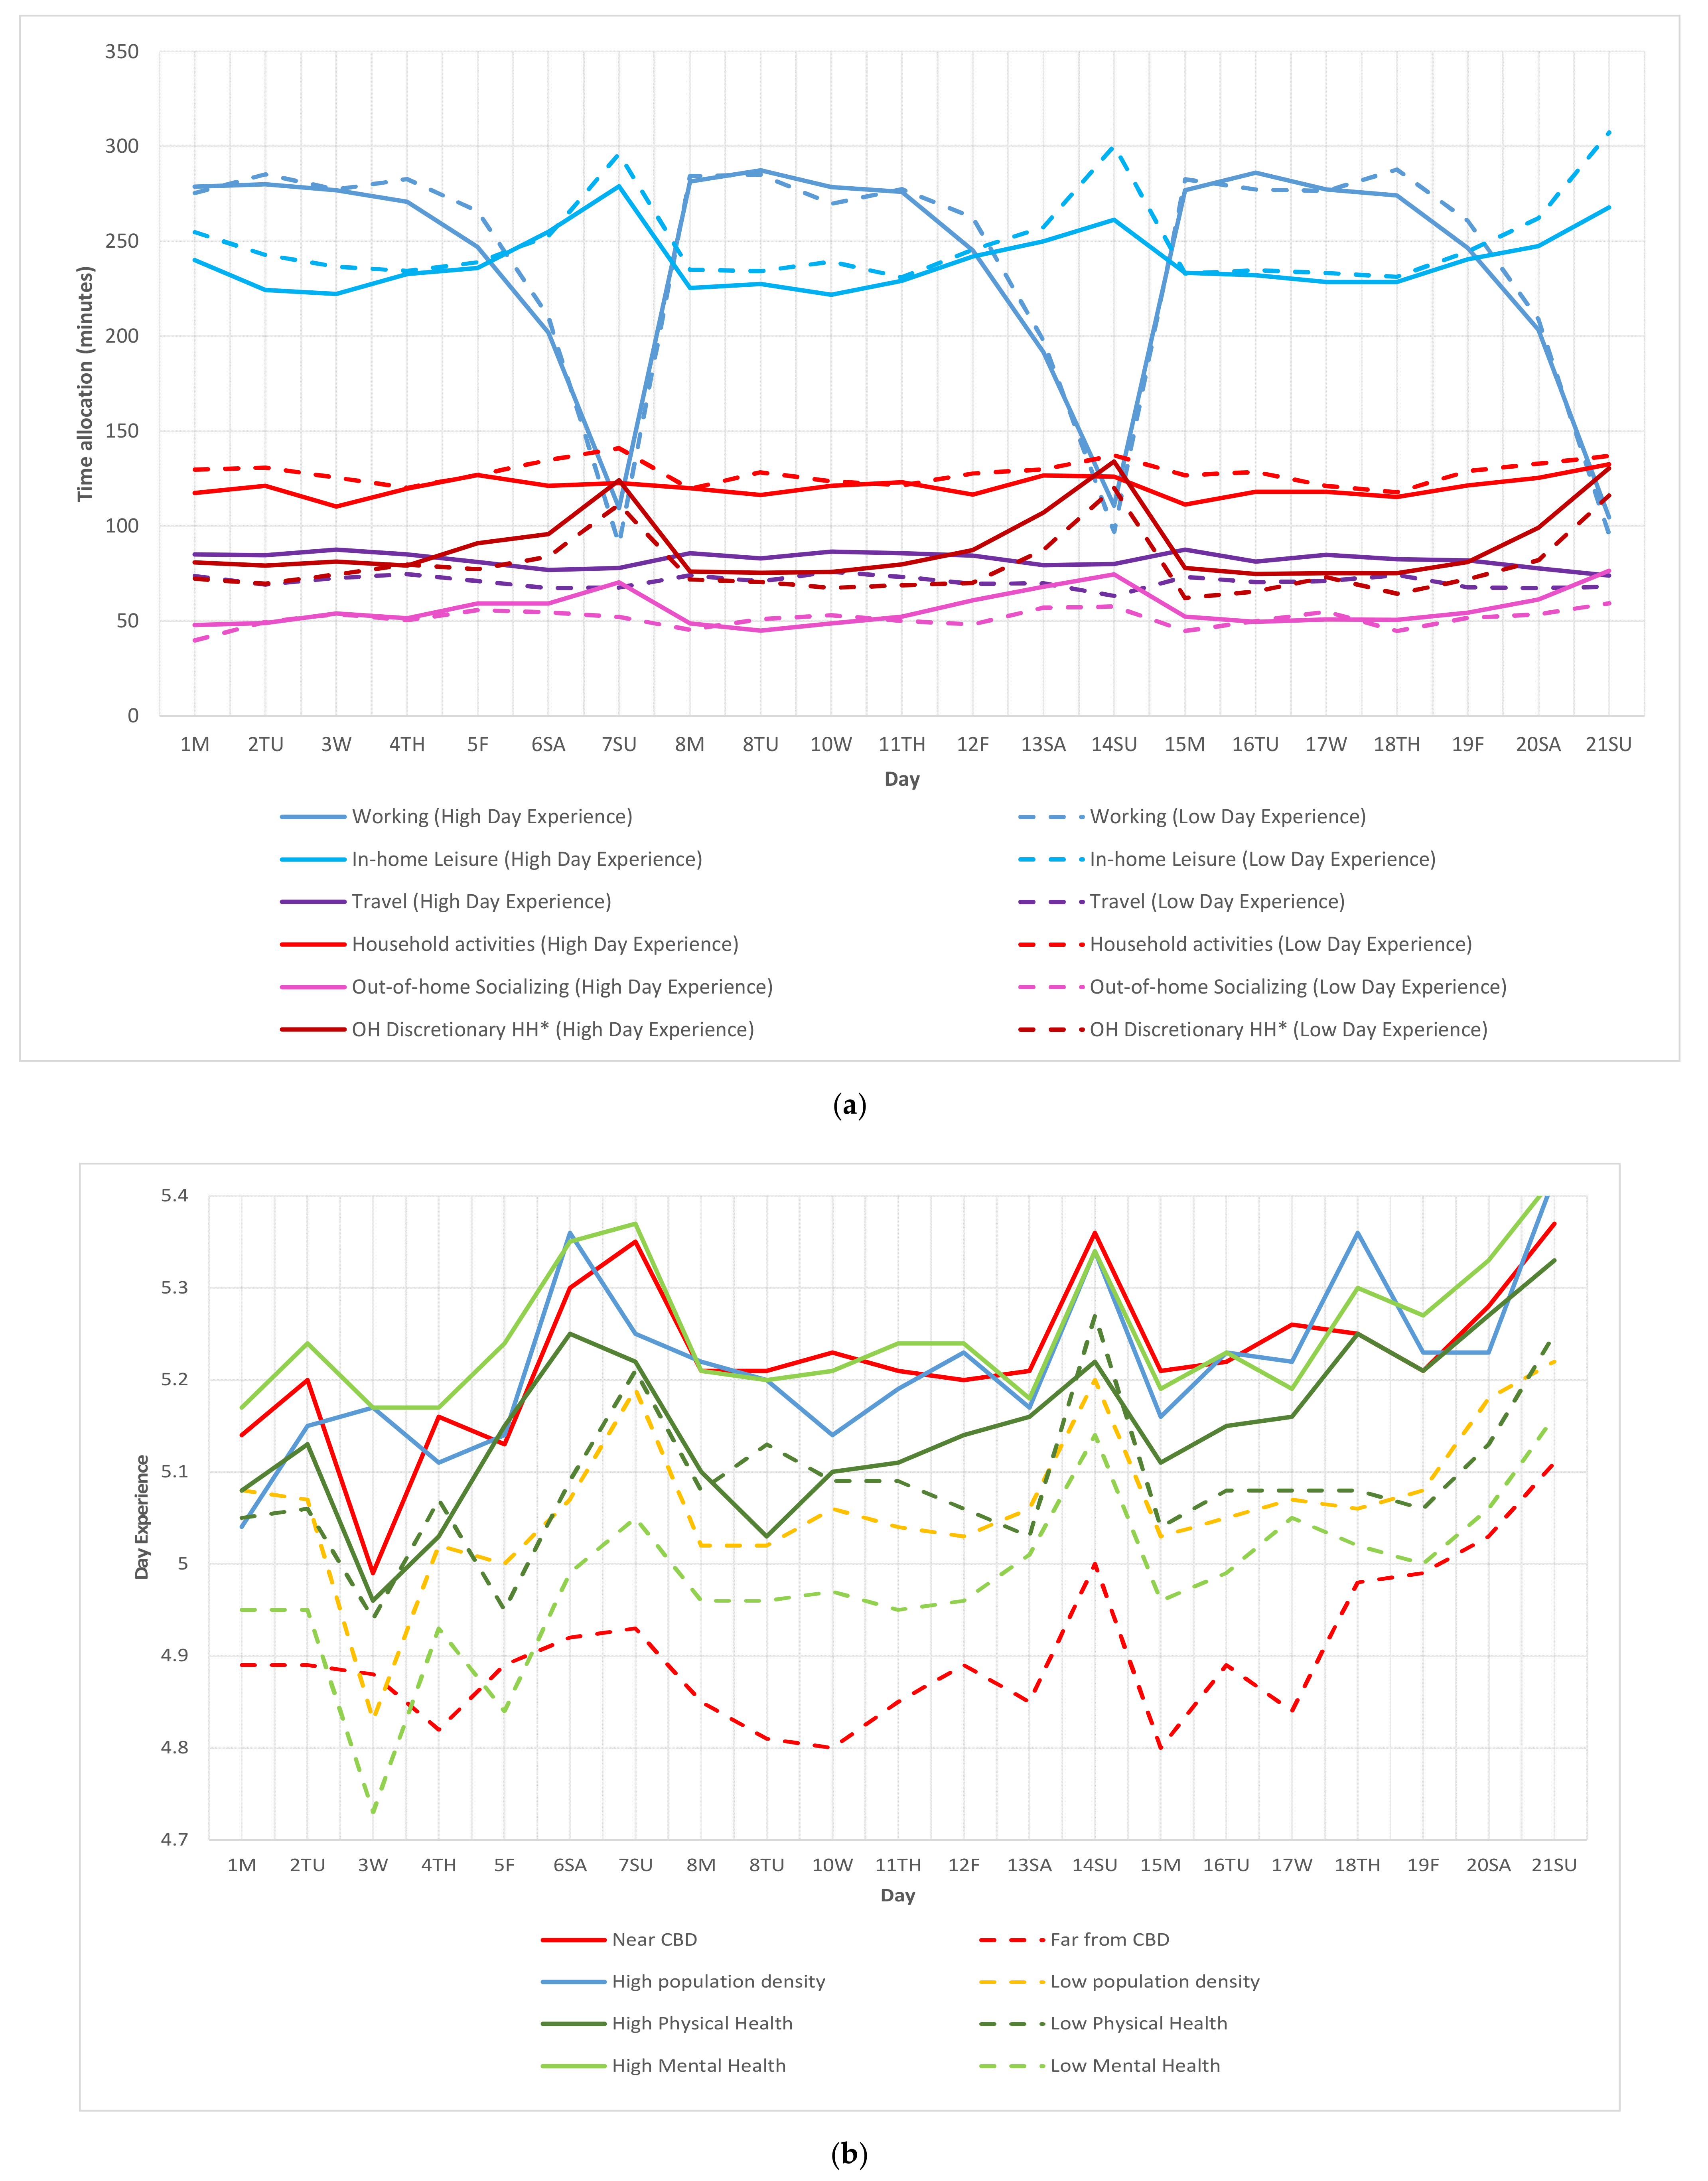
Some descriptive analysis was prepared in order to show indications that day-to-day activity-travel patterns, RLS, and health effects might correlate with multitasking and DE. For the purposes of the descriptive analysis only, DE was treated as discrete, such that high DE meant people who report DE ≥ 3, and those who report DE < 3 were defined as low DE. In the next analysis, DE and multitasking were treated as continuous or not discrete and differently from the treatment in the descriptive analysis. Figure 2a,b describe the percentage of time for conducting multitasking activities for different type of individuals health conditions and RLS areas, respectively, whereas Figure 3a,b present the effects of different activity type, health, and RLS on DE.
Figure 2a,b show that, as expected, multitasking participation is likely to be higher on weekdays and lower on weekends, whereas Figure 3b indicates that DE is likely to be higher on weekends than weekdays. This supports the hypotheses that multitasking is more likely to be undertaken due to time-space constraints and when people tend to have lower DE. The daily fluctuations might also show that, on average, people tend to do less multitasking during grocery shopping on Wednesday to Friday but tend to do more during grocery shopping on Monday and Tuesday. With regards to multitasking during working hours, the fluctuations during weekdays tend not to be seen as in the multitasking during grocery shopping. No patterns can be reported for the fluctuations of DE on weekdays. In Figure 2a, those who have better physical and mental health tend to perform multitasking in various activities more often. Moreover, in Figure 2b, those who reside near the CBD and in areas with trade/shopping centre tend to undertake less multitasking during grocery shopping, working, and travel.
In Figure 3a, those who dedicate more time to out-of-home socialising and travel, and spend less time pursuing in-home leisure and household work, correspond with better DE. In addition, those who have longer other household members’ out-of-home discretionary activities tend to have better DE. In Figure 3b, those who reside near the CBD and in highly populated areas tend to report high DE. In terms of health effect, people with better mental health tend to correspond with better DE as expected. No patterns can be reported for the effects of physical health on DE.
Individuals’ and other household members’ activity-travel pattern variability may show an impact on multitasking and DE. Therefore, including the effects in a more advanced model can be relevant to providing deeper insight. Health and RLS factors also seem to show some effects on multitasking and DE. To further detangle the complexities underlying these trends, in the next sections, the relationship between these variables will be examined using a more advanced statistical model.
5. Proposed Model and Method
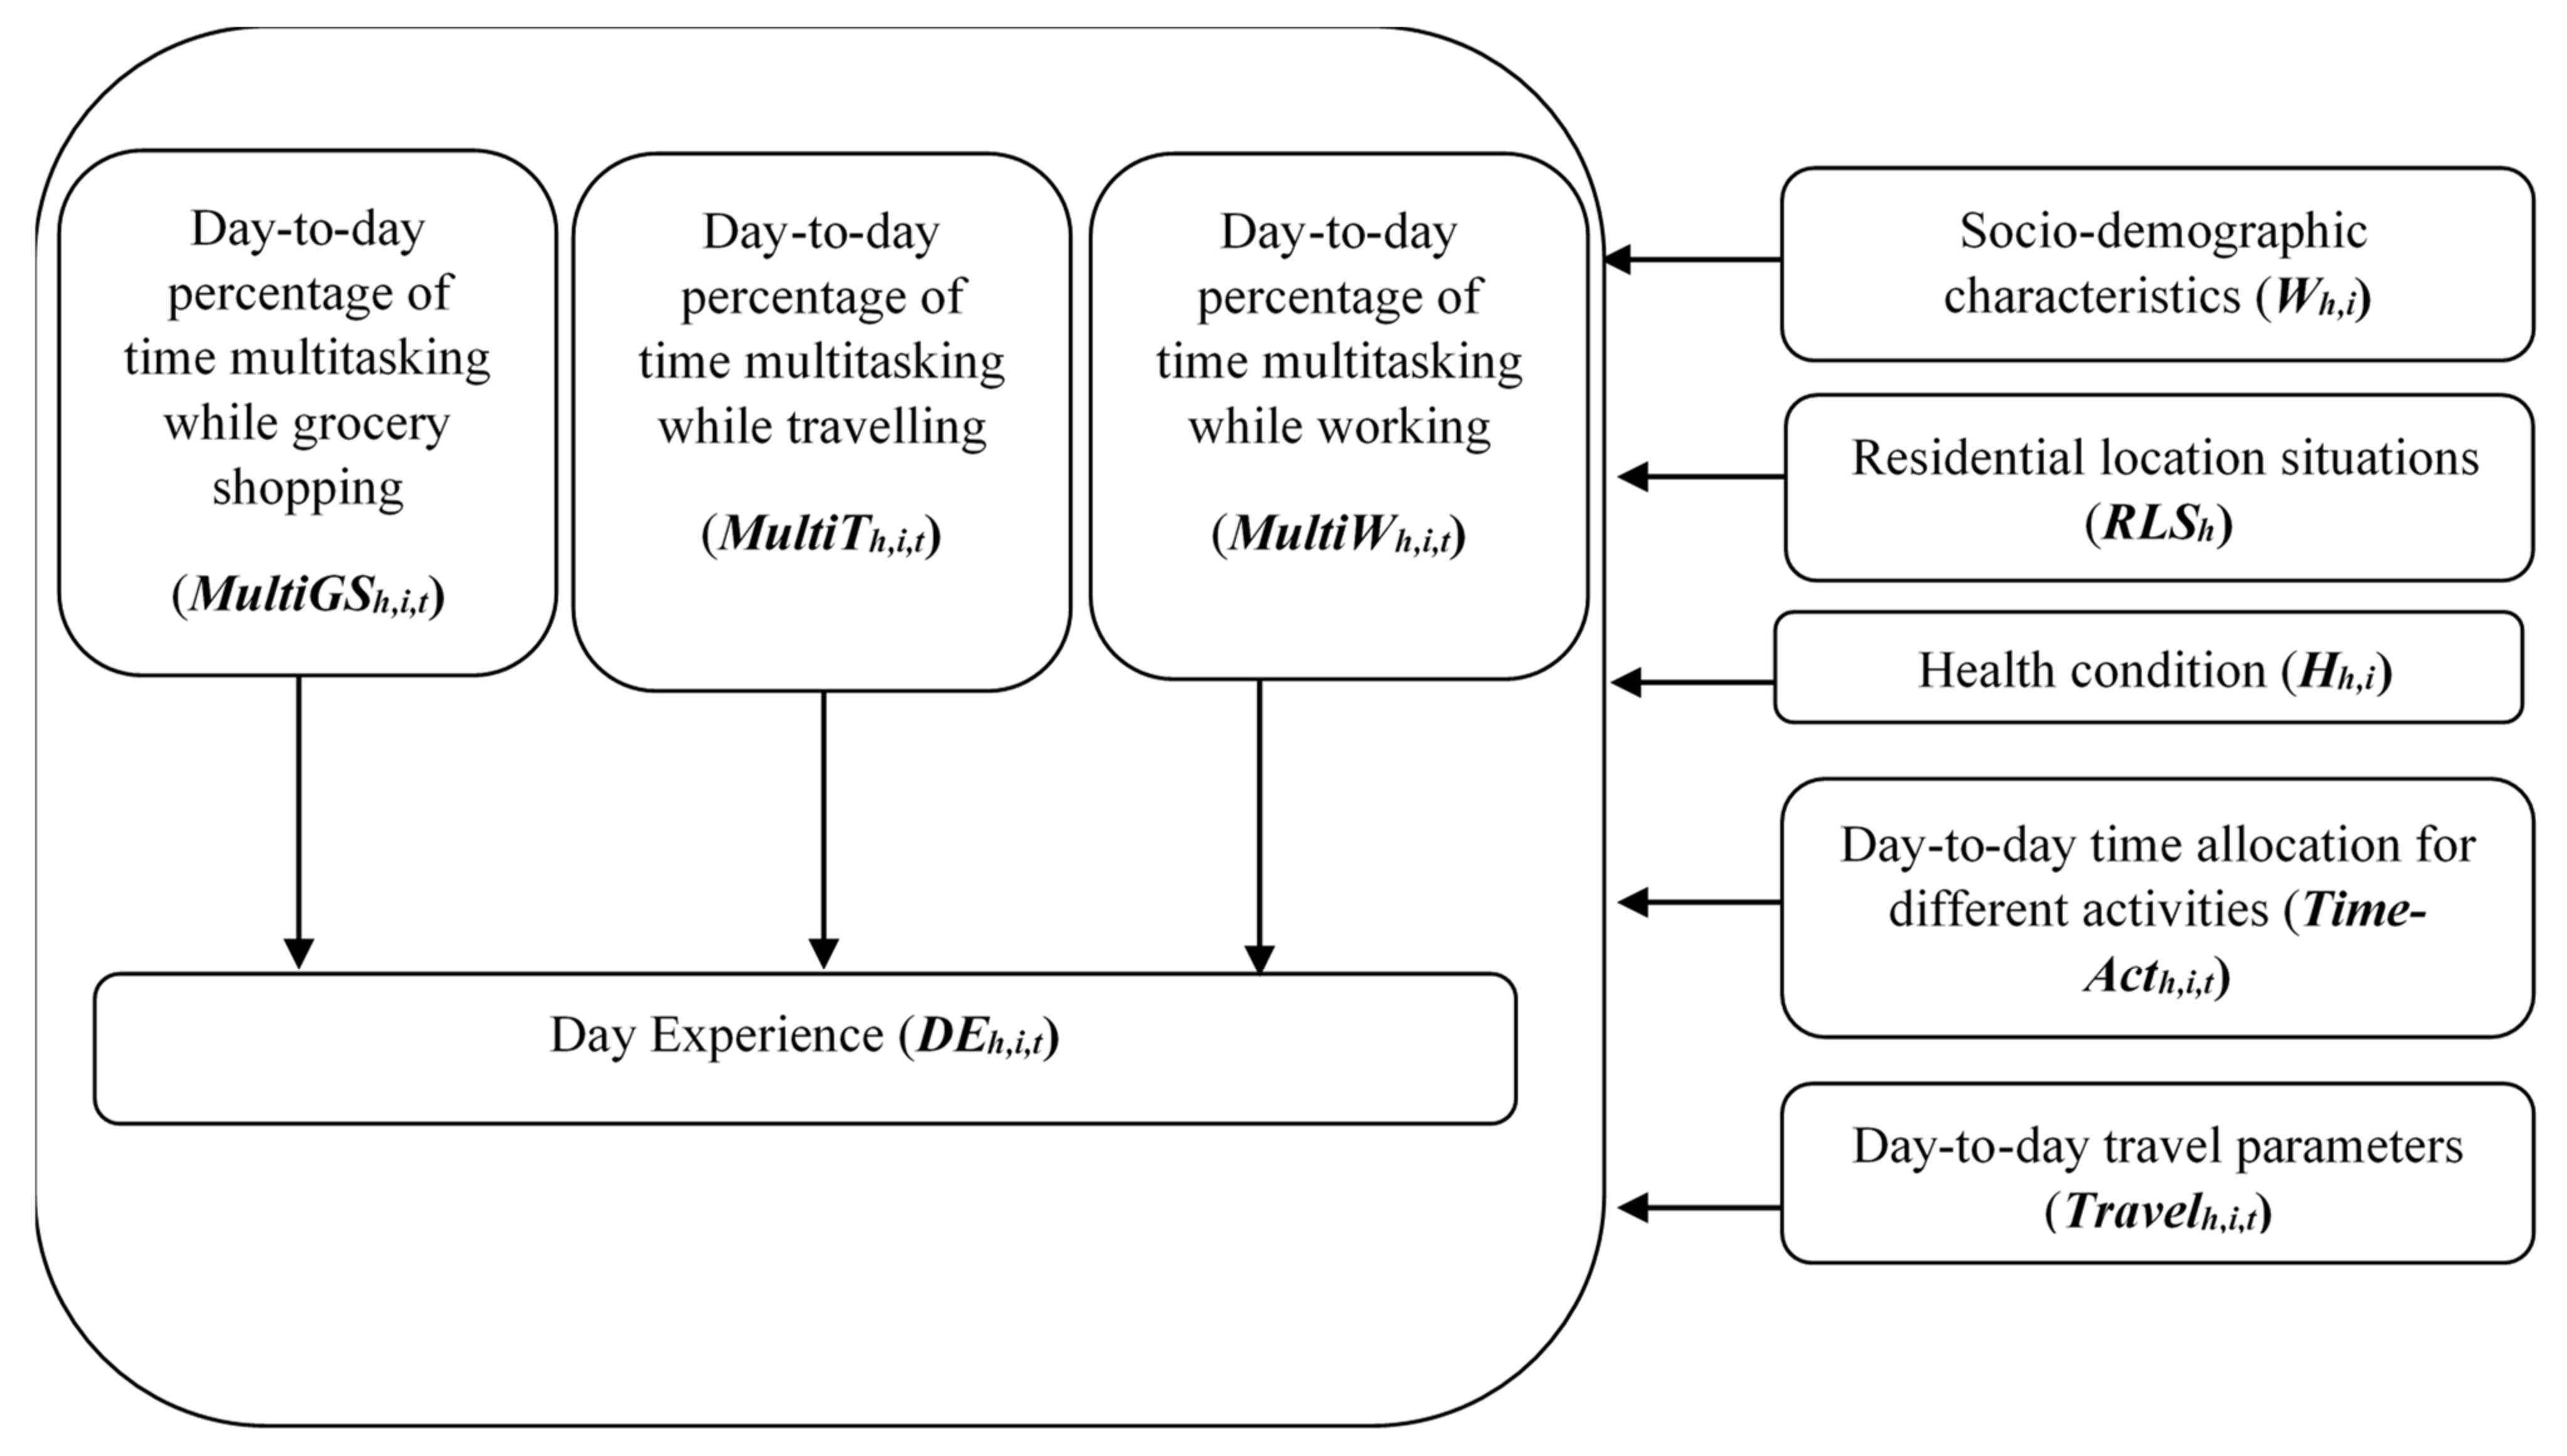
Figure 4 demonstrates the proposed model for investigating the effects of time-space prism variables on multitasking during travel and non-travel time, and its relationships with DE. RLS, health, and activity durations are used in this study to explain both multitasking and DE.
Modified SEM is a multilevel regression analysis that can tackle endogeneity using the instrumental variables (IV) method. The method is similar with the two and three-stage least square method (2SLS and 3SLS, [27]). Since the dataset is rich with nesting effects, the model extends Dharmowijoyo et al. [27]’s model that only included one nesting effects of daily activity-travel patterns. The IV is used to include endogenous variables into the model [68]. The IV in this model looks like the use of IV in 2SLS when it does not include the correlations among the error terms. In addition to the ability to include multiple endogenous variables or multiple equations, the inclusion of more than one nesting effect is the advantage of the modified SEM used in this study compared to traditional SEM such as 2SLS, 3SLS, and other SEM models such as full information maximum likelihood SEM (FIML-SEM). Since it does not include the correlations among the error terms, the modified SEM ignores the simultaneous and reciprocal effects applied in full-information SEM such as in 3SLS and FIML-SEM.
Equations (2)–(5) are written to show Figure 4 and the implementation of modified SEM in the mathematical form. Equations (2)–(5) are as follows:
MultiGSh,i,t = (α1,h,i + u1,h + u1,i) + β1 Wh,i + β2 Ri + β3 Hh,i,t + β4 Time-Acth,i,t + β5 Travelh,i,t+ ε1,h,i,t
MultiTh,i,t = (α2,h,i + u2,h + u2,i) + β6 Wh,i + β7 Ri + β8 Hh,i,t + β9 Time-Acth,i,t + β10 Travelh,i,t+ ε2,h,i,t
In Equations (2)–(5), the coefficients (βn), include activity-travel patterns made by individual i on day t which is a part of household h. The uh, ui, and εh,i,t are the household and the individual specific error terms, and the combined household, individual and time error component, respectively. Whilst the εh,i,t plays as the unexplained error term, the uh, and ui are the explained error terms by the variability of individuals’ and other household members’ activity-travel patterns, respectively. Those error terms have mean value zero and variance σu (for uh, ui) and σε (for εh,i,t).
The endogenous or estimated multitasking activities represented by , and , play as IV to include Equations (1)–(3) into Equation (4). The method is used to tackle endogeneity that might be found among different multitasking activities as also used by 2SLS and 3SLS [68], and LISREL software for creating the initial value [69]. The estimated , , and , show how the models for multitasking and DE are estimated separately and not simultaneously as also applied in another non-full information SEM (e.g., 2SLS), which is different from simultaneous SEM such as 3SLS and FIML-SEM [68]. In contrast to 3SLS and FIML-SEM, the error terms ε1,h,i,t, ε2,h,i,t, ε2,h,i,t, and ε4,h,i,t are thus assumed not to correlate with each other.
The NLME package is used to apply multilevel regression analysis with two nesting effects or three level modelling [70]. Maximum likelihood is used to estimate the regression parameters (s) using Equation (5) [70]. In Equation (6), the estimation of s also includes coefficients and D which are q-dimensional random effects and variance-covariance matrix, respectively. Since it is actually the multilevel regression analysis modified into SEM using the IV method, the goodness-of-fit of SEM as in FIML SEM using AMOS or MPLUS software is not available. The goodness-of-fit uses the goodness-of-fit used by NLME such as R2, AIC, and BIC.
6. The Results from Multivariate Analysis
Table 4 shows the results of the modified SEM. As expected, multitasking-particularly during grocery shopping and work activities and DE were correlated with activity duration, trip, RLS, and health variables. Only gender and employment status were found to be significant among the socio-demographic variables that impact on multitasking during grocery shopping and trips and on DE. As hypothesised in Figure 4, endogenous multitasking within grocery shopping, travel, and work significantly correlate with DE. The effects of day-to-day variability shown by individual specific error terms had higher magnitude than the effect of other household members’ activity-travel patterns (shown by household specific error terms) on the multitasking model. However, the effect of other people’s activity-travel patterns described a higher magnitude in the DE model. This may indicate that shared or joint activities might better explain subjective well-being variables as expected, as in accordance with time use and well-being studies from developed countries which use different measurements of subjective well-being [2,17].
Female workers from large households were correlated with a higher percentage of multitasking activities while grocery shopping than their counterparts. This is in-line with findings from developed countries [2,11,71]. Female non-workers were found to correlate with more multitasking during travel than their working counterparts. While working, both female and male workers associate with less multitasking than their non-working counterparts. In the BMA dataset, non-workers can have part-time jobs while still needing to perform in- and out-of-home maintenance. Workers and students were associated with higher DE compared to non-workers.
Those who reside near the city centre, high populated areas, shopping centres, and farther from various public amenities chose not to engage in multitasking during grocery shopping. Moreover, those who reside near the city centre with more residential areas and further away from shopping centre negatively correlated with multitasking whilst travelling. On the other hand, residing in areas farther from city centre, but near public amenities led people to multitask during travels and grocery shopping. As shown by Table 4, some people who reside in suburban areas and some districts in Greater BMA corresponded with a longer travel time to the city centre but a shorter one to grocery stores or shopping centres. Those who reside in those areas were likely to undertake more multitasking during grocery shopping and travels.
Better physical health positively correlated with multitasking during grocery shopping and travels, whereas better mental health was associated with a negative effect on multitasking during grocery shopping. As also shown in the descriptive analysis, mental health showed a positive effect on DE.
With regard to activity durations, different types of activities showed different impacts on multitasking during non-travel activity. However, only socialising was found to significantly correlate with multitasking during travel. Longer working and studying commitments did not only positively correlate with multitasking during grocery shopping, but also during work. More out-of-home commitments had negative correlations on multitasking during work. Different results from multitasking during work, more out-of-home commitments showed a positive correlation with multitasking during grocery shopping, but in-home activity commitment showed the opposite impact. This behaviour is also indicated in developed countries [2].
Dependency on private vehicles increased the probability of multitasking during grocery shopping, whereas, taking public transport more often positively correlated with multitasking during travels, which is in line with previous findings from developed countries (e.g., [4,5,7]).
In the DE model, as expected, more opportunities for out-of-home discretionary activities positively associated with DE, whereas in-home activity commitments reduced the probability of improving DE. Taking public transport and non-motorised modes of travel was associated with a lower DE value. In developed country studies, taking public transport is indicated by taking a longer time to reach destinations which may correlate with low travel and life satisfactions [20]. This indication might also play in the case of Indonesia when using a different measurement of subjective well-being. No significant effects on DE were found for private vehicle use.
7. Discussions and Conclusions
This study confirms that residential location situations (RLS), one’s physical health, and activity durations significantly correlate with one’s multitasking participations and one’s self-reported daily satisfactions and cognitive well-being (DE). The analysis results show that the effects of RLS and physical health are relatively stronger than activity durations and trip characteristics. In particular:
- As hypothesised, multitasking during travel is shaped by whether people arrange their trips within one or more trip chains and whether or not they drive. However, multitasking during non-travel is shaped by out-of-home activities and trip configurations.
- With regard to multitasking during non-travel, time poverty due to commitments of performing mandatory activities (e.g., working and studying) leads people to multitask more often, particularly during grocery shopping and working, in keeping with results from developed countries [7,13]. However, as hypothesised, time-space prism theory reveals how the out-of-home activity time budget seems to make people choose during which primary activities they will multitask. Those who have more out-of-home activity commitments seem to opt to multitask during grocery shopping, but not during work. In terms of interdependency between trips and multitasking, those who have more trips within one trip chain seem to try to optimise their time due to travel time budget by not performing multitasking during grocery shopping and travelling, but while working. On the other hand, the consequences of having longer travel time while having more trip chains (as argued by [33,34]) are compensated for, by not multitasking during working hours, but during grocery shopping and travelling.
- Not all multitasking has a positive correlation on DE. Performing multitasking within less enjoyable activities (e.g., working and travelling, see [29]) shows positive correlations on DE. However, negative DE is shown when people multitask during activities which have a higher enjoyability rate as grocery shopping [29].
- As supported by Table 4, those who reside in central areas and in fringe areas do less multitasking during travel and non-travel than individuals who live in between. Perceiving oneself to have better accessibility (measured via perceived travel time) to services and amenities (particularly city centre) is associated with a higher self-reported DE.
Having better physical health may correspond with the ability to engage in high levels of activity as also found by [33], thus being positively correlated with higher multitasking participation. On the other hand, having a lower level of mental health, which may correspond with more physical limitations, chronic disease, insecurity due to financial burdens, a lack of social security, and less social support [72,73], correlates with low DE.
8. Recommendations and Limitations
These findings highlight the limitation of monocentric cities, which are very common in developing countries. The benefits of polycentric city design, which allows the city to have multiple sub-centre locations, enable residents to work, live, and play in the same neighbourhood [41,74,75]. Polycentric city design reduces the needs for longer journeys and provides individuals with more time to engage in more out-of-home discretionary activities, less multitasking during grocery shopping, and to have higher satisfaction engagements, and subsequently, higher DE. In order to improve DE, the polycentric city design could also be supported by dedicated public transport services to sub-urban and greater areas to reduce individuals’ perceived travel time to city centre.
With regard to the effects of mental health on DE, health security, pension programmes, and reducing income disparity can be suggested as policies to help people’s mental health (as indicated by [72,73]), in turn leading to better DE.
Due to the disadvantages of the model, the reciprocal effects of DE on and among multitasking activities have not yet been investigated. In relation to further study, it is hypothesised that those who have multitasked during an activity will limit their multitasking participations during other activities. Although it has impacts on better well-being, multitasking participations cannot be unlimited. Moreover, this study only applies to the built environment in residential locations which shows the effects of medium-term variables on short-term variables of activity-travel behaviour as argued by [42]. However, in the future, the effects of built environment in non-home locations can be also included.
Author Contributions
D.B.E.D.: Conceptualisation, data curation, formal analysis, investigation, methodology, writing—original draft, writing—review and editing; Y.O.S.: conceptualisation, methodology, writing—original draft, writing—review and editing; T.B.J.: writing—original draft, writing—review and editing. All authors have read and agreed to the published version of the manuscript.
Funding
This study was funded by The Ministry of Research, Technology, and Higher Education, the Republic of Indonesia for the year 2017–2019 WCR Scheme 013/SP2H/RDPKR-JAMAK/LL4/2021 and III/LPPM/2021-07/127-PE), UTP-Universitas Katolik Parahyangan International Research project of 0153AB-M39, and the Austrian FFG/BMK Endowed Professor DAVeMoS project.
Data Availability Statement
Data sharing not applicable.
Acknowledgments
Authors thank the Editor and three anonymous reviewers. Authors also thank Ari K. M. Tarigan for discussions on an earlier version of this paper.
Conflicts of Interest
No conflict of interest.
References
- Kenyon, S.; Lyons, G. Introducing multitasking to the study of travel and ICT. Transp. Res. Part A 2007, 41, 161–175. [Google Scholar]
- Offer, S.; Schneider, B. Revisiting the gender gap in time-use patterns: Multitasking and well-being among mothers and fathers in dual-earner families. Am. Sociol. Rev. 2011, 76, 809–833. [Google Scholar] [CrossRef]
- Zhang, J.; Timmermans, H. Scobit-based panel analysis of multitasking behaviour of public transport users. Transp. Res. Rec. 2010, 2157, 46–53. [Google Scholar] [CrossRef]
- Ettema, D.; Friman, M.; Gärling, T.; Olsson, L.E.; Fujii, S. How in-vehicle activities affect work commuters’ satisfaction with public transport. J. Transport. Geogr. 2012, 24, 215–222. [Google Scholar] [CrossRef]
- Rasouli, S.; Timmermans, H. Judgments of travel experiences, activity envelopes, trip features and multi-tasking: A panel effects regression model specification. Transp. Res. Part A 2014, 63, 67–75. [Google Scholar] [CrossRef]
- Susilo, Y.O.; Cats, O. Exploring Key Determinants of Travel Satisfaction for Multi-Modal Trips by Different Travellers’ Groups. Transp. Res. Part A 2014, 67, 366–380. [Google Scholar]
- Malokin, A.; Circella, G.; Mokhtarian, P.L. How do activities conducted while commuting influence mode choice? Using revealed preference models to inform public transportation advantage and autonomous vehicle scenario. Transp. Res. Part A 2019, 124, 82–114. [Google Scholar] [CrossRef]
- Varghese, V.; Jana, A. Impact of ICT on multitasking during travel and the value of travel time savings: Empirical evidences from Mumbai, India. Travel Behav. Soc. 2018, 12, 11–22. [Google Scholar] [CrossRef]
- Fauzi, N.F.; Dharmowijoyo, D.B.E. Activity-travel participation, multitasking in travel and daily well-being. In Proceedings of the 2nd Conference for Civil Engineering Research Networks (CONCERNS), Bandung, Indonesia, 27–29 October 2018. [Google Scholar] [CrossRef] [Green Version]
- Tang, J.; Zhen, F.; Cao, J.; Mokhtarian, P.L. How do passengers use travel time? Transportation 2019, 45, 451–477. [Google Scholar] [CrossRef]
- Sullivan, O.; Gershuny, J. Domestic outsourcing and multitasking: How much do they really contribute? Soc. Sci. Res. 2013, 42, 1311–1324. [Google Scholar] [CrossRef]
- Shaw, F.A.; Malokin, A.; Mokhtarian, P.L.; Circella, G. It’s not all fun and games: An investigation of the reported benefits and disadvantages of conducting activities while commuting. Travel Behav. Soc. 2019, 17, 8–25. [Google Scholar] [CrossRef]
- Ohmori, N.; Harata, N. How different are activities while commuting by train? Tijdschr. Voor Econ. En Soc. Geogr. 2008, 99, 547–561. [Google Scholar] [CrossRef]
- Susilo, Y.O.; Liu, C. Examining the relationship between individual’s time-use and activity participations with their health indicators. Eur. Transp. Res. Rev. 2017, 9, 26. [Google Scholar] [CrossRef] [Green Version]
- Susilo, Y.O.; Liu, C. Exploring the patterns of time use allocations and immobility behaviours in the Bandung Metropolitan Area, Indonesia. In (Im)Mobilities in the City—Creating Knowledge for Planning Cities in the Global South and Postcolonial Cities; Tanu, P.U., Karen, L., Eds.; Taylor and Francis: London, UK, 2017. [Google Scholar]
- Hägerstrand, T. What about people in regional sciences? Reg. Sci. Assoc. 1970, 24, 6–21. [Google Scholar] [CrossRef]
- Schwanen, T.; Wang, D. Well-being, context and everyday activities in space and time. Ann. Assoc. Am. Geogr. 2014, 104, 833–851. [Google Scholar] [CrossRef]
- Ellegård, K. Time Geography in the Global Context: An Anthology; Kajsa, E., Ed.; Routledge: Oxford, UK, 2019; pp. 1–18. [Google Scholar]
- Ettema, D.; Gärling, T.; Olsson, L.E.; Friman, M. Out-of-home activities, daily travel and subjective well-being. Urban Geogr. 2010, 32, 871–883. [Google Scholar] [CrossRef]
- Friman, M.; Gärling, T.; Ettema, D.; Olsson, L.E. How does travel affect emotional well-being and life satisfaction? Transp. Res. Part. A 2017, 106, 170–180. [Google Scholar] [CrossRef]
- De Vos, J. Analysing the effect of trip satisfaction on satisfaction with leisure activity at the destination of the trip, in relation with life satisfaction. Transportation 2019, 46, 623–645. [Google Scholar] [CrossRef]
- Abenoza, R.F.; Susilo, Y.O.; Ettema, D. Do accessibility, vulnerability, opportunity, and travel characteristics have uniform impacts on the traveler’s experience? Transp. Res. Part A 2018, 114, 38–51. [Google Scholar] [CrossRef]
- Abenoza, R.F.; Cats, O.; Susilo, Y.O. Determinants of traveler satisfaction: Evidence for non-linear and asymmetric effects. Transp. Res. Part F 2019, 66, 339–356. [Google Scholar] [CrossRef] [Green Version]
- Abenoza, R.F.; Cats, O.; Susilo, Y.O. How does travel satisfaction sum up? An exploratory analysis in decomposing the door-to-door experience for multimodal trips. Transportation 2019, 46, 1615–1642. [Google Scholar] [CrossRef] [Green Version]
- Bostic, T.J.; Ptacek, J.T. Personality factors and the short-term variability in subjective well-being. J. Happiness Stud. 2001, 2, 355–373. [Google Scholar] [CrossRef]
- Gadermann, A.M.; Zumbo, B.D. Investigating the intra-individual variability and trajectories of subjective well-being. Soc. Indic. Res. 2007, 81, 1–33. [Google Scholar] [CrossRef]
- Dharmowijoyo, D.B.E.; Susilo, Y.O.; Karlstöm, A. On complexity and variability of individuals’ discretionary activities. Transportation 2018, 54, 177–204. [Google Scholar] [CrossRef] [Green Version]
- Verma, A.; Verma, M.; Sarangi, P.; Yadav, V.; Manoj, M. Activity participation, episode duration and stop-making behaviour of pilgrims in a religious event: An exploratory analysis. J. Choice Model. 2021, 38, 100267. [Google Scholar] [CrossRef]
- Kahneman, D.; Krueger, A.B.; Schkade, D.A.; Schwarz, N.; Stone, A. A survey method for characterizing day life experience: The day reconstruction method. Science 2004, 306, 1776–1780. [Google Scholar] [CrossRef]
- Circella, G.; Mokhtarian, P.L.; Poff, L.K. A conceptual typology of multitasking behaviour and polichronicity preferences. Int. J. Time Use Res. 2012, 9, 59–107. [Google Scholar] [CrossRef]
- Keseru, I.; Macharis, C. Travel-based multitasking: Review the empirical evidence. Transp. Rev. 2018, 38, 162–183. [Google Scholar] [CrossRef]
- Statista 2020 Internet Usage in Indonesia. Available online: https://www.statista.com/topics/2431/internet-usage-in-indonesia/ (accessed on 1 February 2021).
- Susilo, Y.O.; Avineri, A. The impacts of household structure to the day-to-day variability of individual and household stochastic travel time budget. J. Adv. Transp. 2014, 48, 454–470. [Google Scholar] [CrossRef] [Green Version]
- Dharmowijoyo, D.B.E.; Susilo, Y.O.; Karlström, A. The Day-to-day Variability in Travellers’ Activity-Travel Patterns in the Jakarta Metropolitan Area. Transportation 2016, 43, 601–621. [Google Scholar] [CrossRef]
- Panik, R.T.; Morris, E.A.; Voulgaris, C.T. Does walking and bicycling more mean exercising less? Evidence from the U.S. and the Netherlands. J. Transport. Health 2019, 15, 100590. [Google Scholar] [CrossRef]
- Oishi, S.; Diener, E.F.; Lucas, R.E.; Suh, E.M. Cross-cultural variations in predictors of life satisfaction: Perspectives from needs and values. Personal. Soc. Psychol. Bull. 1999, 25, 980–990. [Google Scholar] [CrossRef]
- Nordbakke, S.; Schwanen, T. Transport, unmet activity needs and well-being in later life: Exploring the links. Transportation 2015, 42, 1129–1151. [Google Scholar] [CrossRef]
- Mouratidis, K. Built environment and social well-being. Cities 2018, 74, 7–20. [Google Scholar] [CrossRef]
- Van den Berg, P.; Sharmeen, F.; Weijs-Perrée, M. On the subjective quality of social interactions: Influences of neighbourhood walkability, social cohesion and mobility choices. Transp. Res. Part A 2017, 106, 309–319. [Google Scholar] [CrossRef]
- Moore, T.H.M.; Kesten, J.M.; Lopez-Lopez, J.A.; Ijaz, S.; McAlenan, A.; Richards AGray, S.; Savovic, J.; Audrey, S. The effect of changes to built environment on the mental health and well-being adults. Health Place 2018, 53, 237–257. [Google Scholar] [CrossRef]
- Ewing, R.; Cervero, R. Travel and the built environment: A meta-analysis. J. Am. Plan. Assoc. 2010, 76, 265–294. [Google Scholar] [CrossRef]
- Van Acker, V. Defining, measuring, and using the lifestyle concept in modal choice research. Transp. Res. Rec. J. Transp. Res. Board 2015, 2495, 74–82. [Google Scholar] [CrossRef]
- De Vos, J.; Cheng, L.; Kamruzzaman, M.; Witlox, F. The indirect effect of the built environment on travel mode choice: A focus of recent movers. J. Transport. Geogr. 2021, 91, 102983. [Google Scholar] [CrossRef]
- Diener, E.; Chan, M.Y. Happy people live longer. Health Well-Being 2011, 3, 1–43. [Google Scholar]
- Standage, M.; Gillison, F.B.; Ntoumanis, N.; Treasure, D.C. Predicting students’ physical activity and health-related well-being: A prospective cross-domain investigation of motivation across school physical education and exercise settings. J. Sport Exerc. Psychol. 2012, 34, 37–60. [Google Scholar] [CrossRef] [Green Version]
- Mishra, G.D.; Ball, K.; Dobson, A.J.; Byles, J.E. Do socioeconomic gradients in women’s health widen over time and with age? Soc. Sci. Med. 2004, 58, 1585–1595. [Google Scholar] [CrossRef]
- Ahmad Termida, N.; Susilo, Y.O.; Franklin, J.P. Observing dynamic behavioural responses due to the extension of a tram line by using panel survey. Transp. Res. Part A 2016, 86, 78–95. [Google Scholar] [CrossRef]
- Prelipcean, A.C.; Gidófalvi, G.; Susilo, Y.O. Longest Common Sub-Sequences: Identifying the Stability of Individuals’ Travel Patterns. 2018. Available online: https://pdfs.semanticscholar.org/1ea9/778a6191aafc43d65eda0c0a32acd6558390.pdf?_ga=2.249100359.1315196374.1592541428-540487133.1592541428 (accessed on 1 February 2021).
- Timmermans, H.J.P.; Zhang, J. Modeling household activity travel behavior: Example of state of the art modeling approaches and research agenda. Transp. Res. Part B 2009, 43, 187–190. [Google Scholar] [CrossRef]
- Liu, C.; Susilo, Y.O.; Dharmowijoyo, D.B.E. Investigating intra-household interactions between individuals’ time and space constraints. J. Transp. Geogr. 2018, 73, 108–119. [Google Scholar] [CrossRef]
- Badan Pusat Statistik 2020 Indonesia Dalam Angka. Available online: https://www.bps.go.id/publication/2020/04/29/e9011b3155d45d70823c141f/statistik-indonesia-2020.html (accessed on 1 February 2021).
- Bandung Transport Agency. Bandung Urban Mobility Project; Bandung Transport Agency: Bandung, Indonesia, 2013. [Google Scholar]
- Dirgahayani, P.; Sutanto, H. The effect of transport demand management policy on the intention to use public transport. Case Study Transp. Policy 2020, 8, 1062–1072. [Google Scholar] [CrossRef]
- Susilo, Y.O. Paratransit in developing countries. In Encyclopedia of Transportation: Social Science and Policy; Garrett, M., Ed.; Sage Publications: Los Angeles, CA, USA, 2014. [Google Scholar]
- Susilo, Y.O.; Joewono, T.B. Indonesia. In The Urban Transport Crisis in Emerging Economies; Stead, D., Pojani, D., Eds.; The Urban Book Series; Springer: Basel, Switzerland, 2017; pp. 107–126. [Google Scholar]
- Presidential Decree Number 45/2018 for Spatial Planning of Bandung Metropolitan Area. Available online: https://gistaru.atrbpn.go.id/rtronline/ (accessed on 1 February 2021).
- Dharmowijoyo, D.B.E. The Complexity and Variability of Individuals’ Activity-Travel Patterns in Indonesia; KTH Royal Institute of Technology: Stockholm, Sweden, 2016. [Google Scholar]
- Skirbekk, V. Age and individual productivity: A literature survey. In Vienna Yearbook of Population Research Vol. 2; Austrian Academy of Sciences Press: Vienna, Austria, 2004; pp. 133–153. [Google Scholar]
- Meloni, I.; Guala, L.; Loddo, A. Time allocation to discretionary in-home, out-of-home and to trips. Transportation 2004, 31, 69–96. [Google Scholar] [CrossRef]
- Charron, S.; Koechlin, E. Divided representation of concurrent goals in the human frontal lobes. Science 2010, 328, 360–363. [Google Scholar] [CrossRef] [PubMed]
- Kenyon, S. What do we mean by multitasking? Exploring the need for methodological clarification in time-use research. Int. J. Time Use Res. 2010, 7, 609–619. [Google Scholar]
- Bappeda Kota Bandung. Land Use and Regional Masterplan; Bappeda Kota Bandung: Bandung, Indonesia, 2011. [Google Scholar]
- Tarigan, A.K.; Sagala, S.; Samsura, D.A.A.; Fisabilillah DFSimarmata, H.A.; Nababan, M. Bandung City, Indonesia. Cities 2016, 50, 100–110. [Google Scholar] [CrossRef]
- Suzukamo, Y.; Fukuhara, S.; Green, J.; Kosinski, M.; Gandek, B.; Ware, J.E. Validation testing of three-component model of short form-36 scores. J. Clin. Epidemiol. 2011, 64, 301–308. [Google Scholar] [CrossRef]
- Van Wee, B.; Ettema, D. Travel behavior and health: A conceptual model and research agenda. J. Transp. Health 2016, 3, 240–248. [Google Scholar] [CrossRef] [Green Version]
- Keller, S.D.; Ware, J.E.; Bentler, P.M.; Aaronson, N.K.; Alonso, J.; Apolone, G.; Bjorner, J.B.; Brazier, J.; Bullinger, M.; Kaasa, S.; et al. Use of structural equation modeling to test the construct validity of the SF-36 health survey in ten countries: Results from the IQOLA project. J. Clin. Epidemiol. 1998, 51, 1179–1188. [Google Scholar] [CrossRef]
- Hair, J.F.; Black, W.C.; Babin, B.J.; Anderson, R.E. Multivariate Data Analysis; Pearson: Essex, England, 2014. [Google Scholar]
- Myung, I.J. Tutorial on maximum likelihood estimation. J. Math. Psychol. 2003, 47, 90–100. [Google Scholar] [CrossRef]
- Joreskog, K.G.; Sorbom, D. LISREL 8, Users’ Reference Guide; Scientific International: Chicago, IL, USA, 1996. [Google Scholar]
- Pinheiro, J.; Bates, D.; DebRoy, S.; Sarkar, D.; R Core Team. Nlme: Linear and Nonlinear Mixed Effects Models. R Package Version 3.1–131. 2017. Available online: https://CRAN.R-project.org/package=nlme (accessed on 1 February 2021).
- Susilo, Y.O.; Liu, C.; Börjesson. The changes of activity-travel participation across gender, lifecycle, and generations in Sweden over 30 years. Transportation 2019, 46, 793–818. [Google Scholar] [CrossRef] [Green Version]
- Irish Aid. Income Security: Why It Matters for Older People Everywhere. 2016. Available online: https://www.ageaction.ie/sites/default/files/attachments/age_action_income_security_booklet_jan_2016.pdf (accessed on 1 February 2021).
- Dharmowijoyo, D.B.E.; Susilo, Y.O.; Syabri, I. Time use and spatial influence on transport-related social inclusion, and mental and social health. Travel Behav. Soc. 2020, 21, 24–36. [Google Scholar] [CrossRef]
- Buliung, R.; Kanaroglou, P. Urban form and household activity-travel behaviour. Growth Chang. 2006, 37, 172–199. [Google Scholar] [CrossRef]
- Susilo, Y.O.; Maat, K. The influence of built environment to the trends in commuting journeys in the Netherlands. Transportation 2007, 34, 589–609. [Google Scholar] [CrossRef]
Figure 1.
BMA ([56]).
Figure 1.
BMA ([56]).

Figure 2.
Percentage of daily multitasking time breakdown into different health conditions and RLS. (a) Percentage of daily multitasking time for different health conditions. (b) Percentage of daily multitasking time for different geographical areas.
Figure 2.
Percentage of daily multitasking time breakdown into different health conditions and RLS. (a) Percentage of daily multitasking time for different health conditions. (b) Percentage of daily multitasking time for different geographical areas.

Figure 3.
The effect of different type of activities, activity duration, health, and RLS on DE. *OH Discretionary HH means time allocation for other household members’ out-of-home discretionary activities. (a) Day experience for different type of activities and activity duration patterns. (b) Day experience for different health conditions and geographical areas.

Figure 4.
Proposed model structure.


Table 1.
Profile of the study sample of 584 adults.
| Variables | Percentage or Mean (Standard Deviation) |
|---|---|
| Socio-demographic characteristics at individual level: | |
| Females | 48.00% |
| Workers and students | 50.50% and 11.30% 1 |
| Percentage of young adults (≤22 years old) | 15.2% |
| Percentage of individuals at age 23−45 years old | 54.9% |
| Percentage of individuals at age 46−55 years old | 17.9% |
| Percentage of senior citizens (>55 years old) | 12.0% |
| Percentage of low income (<IDR 3 million/month) and medium income households (IDR 3−6 million/month) | 75.40% and 15.40% 1 |
| Household characteristics: | |
| Number of household members | 4.67 (1.60) |
| Number of dependent children per household | 0.89 (0.95) |
| Access to private vehicles | 90.20% 1 |
| Residence within BMA area | 86.10% 1 |
| Daily travel parameters: | |
| Daily number of engaged trips | 2.51 (1.83) |
| Daily number of engaged trip chains | 1.14 (0.79) |
| Percentage of daily travel time with private motorised | 47.79% (47.95%) |
| Percentage of daily travel time with public transport | 9.59% (27.82) |
| Percentage of daily travel time with non-motorised | 25.32% (40.78%) |
| Daily time allocation to travel (min) | 76.59 (67.84%) |
| Daily time use allocation to different activities per day (minutes): | |
| Daily time allocation to at-home mandatory activities | 672.29 (161.52) |
| Daily time allocation to at-home maintenance | 124.30 (156.85) |
| Daily time allocation to at-home leisure | 244.55 (170.81) |
| Daily time allocation to out-of-home mandatory | 239.41 (226.523) |
| Daily time allocation to out-of-home grocery shopping | 15.35 (33.89) |
| Daily time allocation to out-of-home social−recreational | 53.83 (87.54) |
| Daily time allocation to out-of-home sport | 9.35 (34.56) |
| Daily percentage of time engaging with multitasking activities within a certain activity | |
| Daily percentage of multitasking time during grocery shopping (MultiGS) | 18.25% (34.85%) |
| Daily percentage of multitasking time during travel (MultiT) | 3.79% (17.41%) |
| Daily percentage of multitasking time during work (MultiW) | 9.02% (22.28%) |
| Built environment variables2: | |
| Population density (/km2) | 9332 |
| The percentage of industrial area within the respondents’ residence location (km2/km2 × 100%) | 2.44% (5.23%) |
| The percentage of shopping centre area within the respondents’ residence location (km2/km2 × 100%) | 0.47% (1.49%) |
| The percentage of agriculture area within the respondents’ residence location (km2/km2 × 100%) | 7.36% (12.79%) |
| The percentage of settlement area within the respondents’ residence location (km2/km2 × 100%) | 48.35% (22.50%) |
| Perceived accessibility variables | |
| Perceived number of public transport lanes passing respondents’ residence | 2.52 (1.13) |
| Perceived time allocation to reach city centre from respondents’ residence (min) | 31.21 (20.85) |
| Perceived time allocation to reach government office from respondents’ residence (min) | 17.15 (19.19) |
| Perceived time allocation to reach shopping centre from respondents’ residence (min) | 15.83 (10.55) |
| Perceived time allocation to reach grocery store from respondents’ residence (min) | 8.34 (4.46) |
| Perceived time allocation to reach bus stops from respondents’ residence (min) | 14.50 (15.41) |
| Perceived time allocation to reach stations from respondents’ residence (min) | 31.47 (23.61) |
| Perceived time allocation to reach parks from respondents’ residence (min) | 18.38 (14.24) |
| Subjective well-being variables | |
| Daily experience | 5.12 (1.17) |
| Health variables | |
| The self-report physical health index | −0.09 (0.94) |
| The self-report social health index | −0.12 (0.96) |
| The self-report mental health index | −0.03 (0.89) |
Note: Trip chain is defined as a home-to-home trip. 1 The remaining 38.20% are students, of whom 9.20% come from high-income households, 9.8% have no access to private vehicles, and 13.90% reside in the greater area of BMA. 2 The percentage of a type of land use was calculated based on the size of built area in km2 of the corresponding land use within a particular individuals’ residential location zone divided by total area in km2 of the individuals’ residential location zone multiplied by 100%. This measure is computed only in the horizontal plane; it excludes the area computed in a vertical plane.
Table 2.
Loading factors of each observed variable and factor scores of health variables.
| Observed Variables | Factor Loadings | Latent Variables (Mean, Standard Deviation, Maximum, and Minimum Value of Factor Scores) |
|---|---|---|
| Physical functioning (PF) | 0.5 | Physical health/PH (−0.09, 0.94, 2.13, −4.04) |
| Limitations of role functioning because of physical health (RP) | 0.493 | |
| General health (GH) | 0.418 | |
| Bodily pain (BP) | 0.401 | |
| Limitations of role functioning because of physical health (RP) | 0.436 | Social health/SH (−0.12, 0.96, 1.49, −4.36) |
| Social functioning (SF) | 0.326 | |
| Limitations of role functioning because of emotional problems (RE) | 0.422 | |
| General health (GH) | 0.296 | Mental health/MH (−0.03, 0.89, 1.97, −3.46) |
| Bodily pain (BP) | 0.254 | |
| Social functioning (SF) | 0.263 | |
| Vitality (VT) | 0.413 | |
| Mental health (MH) | 0.432 |
Table 3.
Model estimation result (with standardised coefficients).
| Variables | Multitasking during Grocery Shopping | Multitasking during Travel | Multitasking during Working | Self-Reported Day Experience | ||||
|---|---|---|---|---|---|---|---|---|
| Coefficients | T-Statistics | Coefficients | T-Statistics | Coefficients | T-Statistics | Coefficients | T-Statistics | |
| Intercept | 11.246 | 0.965 | 0.414 | 0.070 | −7.053 | −0.882 | 6.120 | 11.972 |
| Males (D) | −0.147 | −2.350 | −0.220 | −1.923 | ||||
| Workers (D) | 0.145 | 1.969 | −0.378 | −3.659 | 0.124 | 3.367 | ||
| Students (D) | −0.288 | −2.247 | 0.102 | 2.519 | ||||
| People at aged <22 (D) | ||||||||
| People at aged 23–45 (D) | −0.283 | −1.764 | ||||||
| People at aged 45–55 (D) | ||||||||
| People with low income (D) | ||||||||
| People with middle income (D) | ||||||||
| Number of household members | 0.163 | 1.676 | ||||||
| Number of dependent child/children within household | ||||||||
| Access to private motorised vehicles (D) | −0.223 | −1.720 | ||||||
| Not residents of Bandung city area (D) | −0.149 | −1.655 | −0.242 | −2.023 | 0.135 | 2.403 | ||
| Daily number of engaged trips | −0.359 | −6.889 | −0.155 | −2.382 | 0.178 | 3.121 | −0.070 | −2.202 |
| Daily number of engaged trip chains | 0.175 | 3.739 | 0.105 | 1.801 | −0.160 | −3.129 | 0.045 | 1.942 |
| Daily time allocation to travel (min) | 0.118 | 4.364 | 0.268 | 7.840 | 0.076 | 2.440 | ||
| Percentage of daily travel time with private motorised | 0.315 | 8.589 | 0.132 | 2.816 | ||||
| Percentage of daily travel time with public transport | 0.111 | 4.052 | 0.458 | 13.458 | −0.112 | −4.349 | ||
| Percentage of daily travel time with non-motorised | 0.165 | 5.706 | 0.231 | 6.485 | −0.051 | −3.253 | ||
| Daily time allocation to at-home mandatory activities (min) | ||||||||
| Daily time allocation to at-home maintenance (min) | −0.101 | −2.669 | 0.097 | 2.475 | −0.038 | −1.988 | ||
| Daily time allocation to at-home leisure per day (min) | ||||||||
| Daily time allocation to out-of-home mandatory (min) | 0.452 | 10.974 | 0.956 | 21.685 | −0.088 | −1.995 | ||
| Daily time allocation to out-of-home social-recreational (min) | 0.056 | 2.543 | 0.135 | 5.136 | −0.043 | −1.813 | ||
| Daily time allocation to grocery shopping (min) | 0.150 | 7.889 | −0.063 | −3.047 | 0.048 | 3.240 | ||
| Daily time allocation to other out-of-home maintenance (min) | 0.206 | 9.899 | ||||||
| Daily time allocation to out-of-home sport (min) | 0.019 | 2.549 | ||||||
| Daily percentage of multitasking time during travel | 0.039 | 1.782 | 0.179 | 7.393 | ||||
| Daily percentage of multitasking time during in-home mandatory | 0.071 | 2.479 | 0.111 | 3.515 | 0.036 | 2.047 | ||
| Daily percentage of multitasking time during in-home discretionary | 0.121 | 4.714 | −0.048 | −1.674 | ||||
| Daily percentage of multitasking time during working and studying | 0.215 | 9.166 | 0.218 | 7.394 | ||||
| Daily percentage of multitasking time during grocery shopping | 0.048 | 1.858 | 0.212 | 9.328 | ||||
| Endogenous variable of daily percentage of multitasking time during grocery shopping | −0.138 | −1.739 | ||||||
| Endogenous variable of daily percentage of multitasking time during travel ) | 0.231 | 3.262 | ||||||
| Endogenous variable of daily percentage of multitasking time during working and studying activities ) | 0.077 | 2.206 | ||||||
| Population density/km2 within the respondents’ residential location | −0.295 | −2.323 | ||||||
| The percentage of settlement area within the respondents’ residence location | −0.431 | −2.379 | −0.189 | −2.161 | ||||
| The percentage of trade/shopping centre area within the respondents’ residence location | −0.279 | −3.215 | −0.234 | −2.019 | ||||
| The percentage of industrial area within the respondents’ residence location | ||||||||
| The percentage of agriculture area within the respondents’ residence location | −0.320 | −4.693 | ||||||
| Perceived time allocation to reach city centre (min) | 0.182 | 1.614 | 0.336 | 2.221 | −0.282 | −4.095 | ||
| Perceived time allocation to reach shopping centre (min) | −0.183 | −1.942 | −0.246 | −1.961 | −0.200 | −1.603 | ||
| Perceived time allocation to reach grocery store (min) | −0.219 | −2.189 | ||||||
| Perceived time allocation to reach park (min) | 0.437 | 3.064 | ||||||
| Endogenous variables of better self-report physical health | 0.219 | 0.028 | 0.373 | 2.304 | ||||
| Endogenous variables of better self-report social health | ||||||||
| Endogenous variables of better self-report mental health | −0.140 | −1.651 | 0.081 | 1.860 | ||||
| Mean of the dependent variables | 18.230 | 3.790 | 9.021 | 4.910 | ||||
| SD | 34.849 | 17.412 | 22.285 | 0.833 | ||||
| Household specific error term | 11.907 | 4.144 | 7.650 | 0.680 | ||||
| Individual specific error term | 17.932 | 11.561 | 13.557 | 0.538 | ||||
| White noise | 22.110 | 10.188 | 12.353 | 0.718 | ||||
| AIC | −106,391.4 | −88,697.49 | −93,187.09 | −27,012.70 | ||||
| BIC | −106,744.5 | −89,050.68 | −93,540.27 | −27,365.89 | ||||
| Log likelihood | −53,147.68 | −44,300.75 | −46,545.54 | −13,458.35 | ||||
The references of dummy variables are females, non-workers, senior citizen, people with high income, no access to private vehicles, and residents of Bandung city. Notes: positive coefficients indicate greater percentage of multitasking during travel and non-travel. Only statistically significant coefficients are shown in the table (p < 0.1). The non-shown coefficients are constrained to be 0.
Table 4.
Relationship of residing in a particular area with perceived accessibility, and trip parameters.
Table 4.
Relationship of residing in a particular area with perceived accessibility, and trip parameters.
| Area | Perceived Travel Time to CBD (min) | Perceived Travel Time to Grocery Store (min) | Perceived Travel Time to Park (min) | Perceived Travel Time to Shopping Centre (min) | Number of Trips | Number of Trip Chains | Travel Time (min) |
|---|---|---|---|---|---|---|---|
| Low population density | 36.92 | 9.77 | 19.09 | 17.48 | 2.33 | 1.09 | 78.02 |
| High population density | 20.84 | 5.73 | 16.89 | 12.83 | 2.83 | 1.24 | 73.99 |
| Low percentage of trade/shopping centre | 34.90 | 8.98 | 20.59 | 16.56 | 2.55 | 1.16 | 78.65 |
| High percentage of trade/shopping centre | 18.98 | 6.19 | 10.74 | 13.41 | 2.35 | 1.09 | 69.75 |
| Shorter perceived travel time to city centre | 13.19 | 7.20 | 11.50 | 12.85 | 2.65 | 1.21 | 73.50 |
| Longer perceived travel time to city centre | 45.27 | 9.22 | 23.62 | 18.16 | 2.39 | 1.09 | 79.00 |
| Suburban areas | 29.24 | 7.69 | 15.61 | 15.98 | 2.58 | 1.17 | 75.72 |
| Areas in Greater BMA which are closer to city centre | 24.71 | 7.91 | 26.92 | 16.66 | 2.18 | 0.97 | 85.78 |
| Areas in Greater BMA which are farther to city centre | 46.50 | 12.08 | 23.54 | 17.60 | 2.35 | 1.09 | 75.71 |
Publisher’s Note: MDPI stays neutral with regard to jurisdictional claims in published maps and institutional affiliations. |
© 2021 by the authors. Licensee MDPI, Basel, Switzerland. This article is an open access article distributed under the terms and conditions of the Creative Commons Attribution (CC BY) license (https://creativecommons.org/licenses/by/4.0/).
Share and Cite
MDPI and ACS Style
Endrayana Dharmowijoyo, D.B.; Susilo, Y.O.; Joewono, T.B. Residential Locations and Health Effects on Multitasking Behaviours and Day Experiences. Sustainability 2021, 13, 11347. https://doi.org/10.3390/su132011347
AMA Style
Endrayana Dharmowijoyo DB, Susilo YO, Joewono TB. Residential Locations and Health Effects on Multitasking Behaviours and Day Experiences. Sustainability. 2021; 13(20):11347. https://doi.org/10.3390/su132011347
Chicago/Turabian StyleEndrayana Dharmowijoyo, Dimas Bayu, Yusak Octavius Susilo, and Tri Basuki Joewono. 2021. "Residential Locations and Health Effects on Multitasking Behaviours and Day Experiences" Sustainability 13, no. 20: 11347. https://doi.org/10.3390/su132011347
Note that from the first issue of 2016, this journal uses article numbers instead of page numbers. See further details here.