Article

Integration of a Solar Parabolic Dish Collector with a Small-Scale Multi-Stage Flash Desalination Unit: Experimental Evaluation, Exergy and Economic Analyses

1
Biosystems Engineering Department, Faculty of Agriculture, Tarbiat Modares University (TMU), Tehran 14155-331, Iran
2
Energy System Engineering Department, Mechanical Engineering Faculty, K.N. Toosi University of Technology, Tehran 19967-15433, Iran
*
Author to whom correspondence should be addressed.
Sustainability 2021, 13(20), 11295; https://doi.org/10.3390/su132011295
Submission received: 12 August 2021 / Revised: 28 September 2021 / Accepted: 6 October 2021 / Published: 13 October 2021

Abstract

:
In this study, a small-scale two-stage multi-stage flash (MSF) desalination unit equipped with a vacuum pump and a solar parabolic collector (PDC) with a conical cavity receiver were integrated. To eliminate the need for heat exchangers, a water circulation circuit was designed in a way that the saline feedwater could directly flow through the receiver of the PDC. The system’s performance was examined during six days in July 2020, from 10:00 a.m. to 3:00 p.m., under two distinct scenarios of the MSF desalination operation under the vacuum (−10 kPa) and atmospheric pressure by considering three saline feedwater water flow rates of 0.7, 1 and 1.3 L/min. Furthermore, the performance of the solar PDC-MSF desalination plant was evaluated by conducting energy and exergy analyses. The results indicated that the intensity of solar radiation, which directly affects the top brine temperature (TBT), and the values of the saline feedwater flow rate have the most impact on productivity. The maximum productivity of 3.22 L per 5 h in a day was obtained when the temperature and saline feedwater flow rate were 94.25 °C (at the maximum solar radiation of 1015.3 W/m2) and 0.7 L/min, respectively, and the MSF was under vacuum pressure. Additionally, it was found that increasing the feedwater flow rate from 0.7 to 1.3 L/min reduces distillate production by 76.4% while applying the vacuum improves the productivity by about 34% at feedwater flow rate of 0.7 L/min. The exergy efficiency of the MSF unit was obtained as 0.07% with the highest share of exergy destruction in stages. The quality parameters of the produced distillate including pH, TDS, EC and DO were measured, ensuring they lie within the standard range for drinking water. Moreover, the cost of freshwater produced by the MSF plant varied from 37 US$/m3 to 1.5 US$/m3 when the treatment capacity increased to 8000 L/day.

1. Introduction

Water is the primary source of life for almost all the living things on Earth. Recently, with the industrialization of countries and the rapid growth of the human population, the demand for freshwater has been raised. It is said that the consumption rate of industrial and household water is rising at twice the rate of the population growth [1]. The United Nations has estimated that by 2025, about 1800 million people worldwide will suffer from water shortages [2]. The severe limitation of drinking water resources has caused international societies to seek alternative resources to supply their water needs. One of the best ways to solve the water shortage is to use other sources such as saltwater of seas [3]. Today, in countries and regions facing water scarcity, desalination of saline waters, such as ocean waters and brackish waters of lakes and other sources is underway [4]. There are two main methods of desalination; thermal separation and membrane separation. Multi-stage flash (MSF), multi-effect distillation (MED), vapor compression (VC) and humidification-dehumidification (HD) are the primary thermal desalination processes [5]. On the other side, reverse osmosis (RO) and electro-dialysis (ED) are among the most mature membrane-based desalination processes [6].
A majority of the world’s water desalination is being carried out in the Gulf region of the Middle East. Thermal desalination takes up to 50% of the world’s desalination capacity. Almost all desalination plants in the Gulf region use conventional fossil fuels because of the region’s rich natural gas and oil resources [7]. Among different desalination methods, the MSF accounts for 64% of the total desalination capacity around the world [8]. However, thermal desalination of saltwater is a process that requires high amounts of energy. According to the literature, it is estimated that about 10 million tons of oil are consumed annually to desalinate one million cubic meters of water per day [9]. The environmental consequences of burning fossil fuels and their increasing prices have raised concerns about using them in international societies. Even though conventional energy-based systems are more economical than systems that use renewable energy, with a declining trend in prices, some of the renewable-based technologies are expected to economically compete with fossil fuels shortly [10]. Solar energy is the most abundant renewable energy source to date [11]. Solar energy as the most abundant source of renewable energy can be used to power desalination processes either directly or indirectly. In the former method, solar energy is directly used to evaporate the salt water and produce freshwater through distillation. Solar stills are simple desalination units with low operation and maintenance costs but their main drawback is low productivity which makes them more suitable for use in remote areas for small-scale production [8]. In indirect use, solar energy can be converted to electricity through solar photovoltaic (PV) panels or can be harnessed by solar thermal collectors to provide the required heat for the thermal desalination processes [12]. Iran as a country located on the dry belt of the earth, where nearly 70% of its area is located in arid and semi-arid regions, has also faced a water crisis in recent years [5]. Consecutive droughts, simultaneous over-withdrawal of water from the country’s water resources and dams’ uncontrolled construction have intensified the water shortage in the country. Considering the appropriate solar radiation and access to saline water resources in the north and south of Iran, the use of solar thermal desalination systems seems to be reasonable [13].
Over time, extensive literature has developed on using solar energy in desalination systems. In a review study, Sharon and Reddy [14] compared different types of solar desalination systems and listed each method’s pros and cons. They suggested that solar MSF systems have a performance of about 0.009–10 m3/day and a recovery percentage of about 0.6 to 6. M and Yadav [15] examined various solar-thermal desalination technologies. They asserted that MSF and MED desalination systems are highly efficient in terms of costs. They also noted that saline water could be evaporated even at temperatures below 40 °C up to 39 stages, increasing desalinated water production. Cioccolanti and Renzi [16] investigated the integration of a thermal desalination unit with a small-scale solar collector. In the study, the concentrator was made of 25 hexagonal mirrors with a total area of 9.5 m2. The system was evaluated in three separate places in the Mediterranean region. The maximum amount of desalinated water was obtained about 75 L/day. The results showed that one of the most critical factors in the system’s efficiency is direct sunlight. Malik et al. [17] investigated the exergy and economy and performed a multi-criteria optimization for a solar still desalination system (SSDS) including phase change material (PCM). To find the optimum states of the system, they considered four main decision variables: PCM mass, inlet brine flow rate, gap space and insulation width. The results showed that increasing the brine feed water will decrease distilled water production rate while it does not affect the total annual cost. The optimum value of PCM mass was calculated as 1 kg. Mirmanto et al. [18] tried to enhance distilled water production of a continuous-feed solar distiller by using various fin designs. They investigated the effect of three different absorber designs of a flat absorber, an absorber with 10 fins, and an absorber with 15 fins. Their distiller was able to distill water at the rate of 1.185 L/day, 1.264 L/day and 1.404 L/day in cases of using the distiller without fins, with 10 fins and with 15 fins, respectively. The results revealed that, compared to the case with a flat plate absorber, the production increases up to 18.5% when the absorber with 15 fins was used, and in the case of the absorber with 10 fins, the production rate was raised by 7%.
Much research has been carried out focusing on solar flashing desalination systems with different types of solar collectors. Mabrouk and Fath [19] evaluated a solar-driven, high-performance MSF desalination unit with a novel deaeration and brine mix configuration. The desalination unit was made of 28 flashing chambers equipped with a glass window for monitoring the flashing process. Four parabolic modules were coupled in series to make a reflector with a total area of 22.4 m2 to be used as the steam generator for the MSF unit’s brine heater. They tested the developed plant at top brine temperature (TBT) of 100 °C; the gain output ratio (GOR) was calculated as 15, which was higher than conventional MSF plants under the same operating conditions. The capacity of the plant was also measured as 1 m3/day. Kabeel and El-Said [20] fabricated a desalination plant consisting of a single stage flashing unit and a solar flat-plate collector (FPC) with a total area of 7.075 m2 as a heat source to investigate different operating modes and the weather’s effect on the plant’s productivity. They concluded that adding nanoparticles in the working fluid flowing inside the collector will increase its thermal efficiency. The developed system was able to produce 7.7 L/m2/day freshwater. An economic analysis of the system revealed that the price of the produced freshwater is about 11.68 US$/m3. Alsehli et al. [1] proposed a novel design for a solar-powered MSF desalination system. Their design consisted of an array of parabolic trough collectors (PTCs) and two thermal storage tanks for supplying brine to the MSF unit. In contrast with other desalination systems, they managed to flow the feed brine directly through solar collectors to eliminate the need for heat exchangers and medium fluid. Simulations of the design revealed that their system could produce 2230 m3/day freshwater with a solar collector area of 42,522 m2 at the price of 2.72$/m3. Garg et al. [21] developed a mathematical model for a MSF desalination system with brine recirculation (BR). The MSF unit was coupled to a nanofluid-based direct absorption solar collector with the help of a counter-flow heat exchanger. Moreover, they investigated the variations in GOR and TBT caused by parameters such as the collector’s height and length, nanoparticle volume fraction and incident flux on the collector. The study showed that high values of TBT give a higher amount of distillate and GOR, varying in the range of 11–14. Compared to a PTC-based desalination system with similar conditions, the proposed model has almost 11% higher GOR. Al-Othman et al. [8] simulated an innovative solar MSF plant using Aspen HYSIS. They used PTCs and a solar pond as the heat source for the MSF unit to meet a small community’s water demand. The simulation results showed that with the feedwater flow rate of 40,000 m3/day, the plant can produce 1880 m3/day of freshwater. They also found that a solar field with a surface area of 3160 m2 can provide 76% of the MSF’s unit required energy, while the remaining is supplied by a 4-m deep solar pond with a total area of 0.53 km2.
A parabolic dish concentrator (PDC) has the highest thermal efficiency due to its higher concentration ratios compared to other solar collectors [22]. In this regard, a group of researchers has focused on using PDCs as the primary heat source in desalination processes. Gorjian et al. [23] designed, built and evaluated a point-focus parabolic solar still (PPSS). The system’s productivity was tested on seven sunny, partly cloudy and dusty days. The results showed that the most critical factors that affect the system’s productivity are sunlight and the receiver’s temperature. Their system produced 5.12 kg/day of water with an average irradiance of 626.8 W/m2 and receiver temperature of 150.7 °C. The results of the performance evaluation showed that water production efficiency is increased by 13% with preheating. The average daily yield was 34.69%, and the maximum production was reported to be 1.5 kg/h. Prado et al. [24] built, characterized and analyzed a solar dish concentrator and evaluate its performance when integrated with a desalination system. The proposed system consisted of a mirrored satellite dish as a concentrator and a glass flask, a copper tube and a silicone tube as a desalination system. They carried out several experiments with semi-continuous addition of saline water with salinities varying from 0 to 4%. The findings revealed that increasing the salt concentration in the feedwater reduces productivity. The system produced 4.95 kg/m2 day (0%) to 4.11 kg/m2 day (4%), which was enough for two adults’ daily usage. Srithar et al. [25] experimentally evaluated a stand-alone triple-basin solar desalination unit. The system consisted of a PDC with a diameter of 1.25 m, a PV panel and a triple-basin glass solar still. The results revealed that using a parabolic concentrator will increase the lower basin water temperature up to 85 °C. The maximum production of the system was measured to be 16.94 kg/m2 per day. Using nanofluids can improve the overall performance of desalination systems. In this way, Rafiei et al. [26] studied a solar desalination system with a focal point concentrator as the heat source. They investigated the different nanofluids’ effects on the system’s performance and evaluated the solar desalination system from the aspects of energy and exergy. The results showed that by increasing the concentration of all used nanofluids, the system’s thermal efficiency increases. In addition, the exergy gain and energy efficiency of the solar system were decreased with increasing nanofluid concentration. They suggested that the Cu/oil nanofluid with a high concentration is the best option to produce the highest amount of freshwater.
Many researchers have been working to improve desalination plants’ productivity either by changing the operating states or assessing the systems thermodynamically. In this way, Hanshik et al. [27] conducted a study on an existing MSF desalination system to evaluate its specific energy consumption. Their research showed that by increasing the TBT value from 110 °C to 120 °C, the system’s efficiency increases about 15.8%, and specific energy consumption decreases by about 6.4. Darawsheh et al. [28] evaluated a solar-powered two-stage desalination system. The solar collector used in this system was a FPC with an area of 3.46 m2. This study showed that by reducing the air pressure by 20% inside the flashing chambers, the distillation to evaporation ratio increases by about 53%, and the specific energy consumption (SEC) is decreased by about 35%. They also found that the best distillation-to-evaporation ratio is 0.42 with a feedwater flow rate of 0.5 L/min. Al-Weshahi et al. [29] performed a detailed exergy analysis on a MSF desalination plant with a capacity of 3800 m3/h. It was indicated that the overall exergy efficiency of the MSF is about 5.8% which is lower than expected. The highest exergy destruction occurred in the heat recovery stages, which was about 55%. They concluded that by taking excessive heat from the distillate product in stages, the exergy efficiency could be improved up to 14%.
A review of previous literature reveals that many studies have been carried out on solar MSF desalination systems with different types of solar collectors. Compared to other solar collectors, the PDCs are the most efficient collectors due to their continuous tracking system. Compared to the collectors with the fixed surface, the continuous sun-tracking systems in PDCs will help to increase the collected solar energy by 46.46% [30]. In addition, minimum thermal losses of PDCs make them the most thermally efficient collectors among the other types [
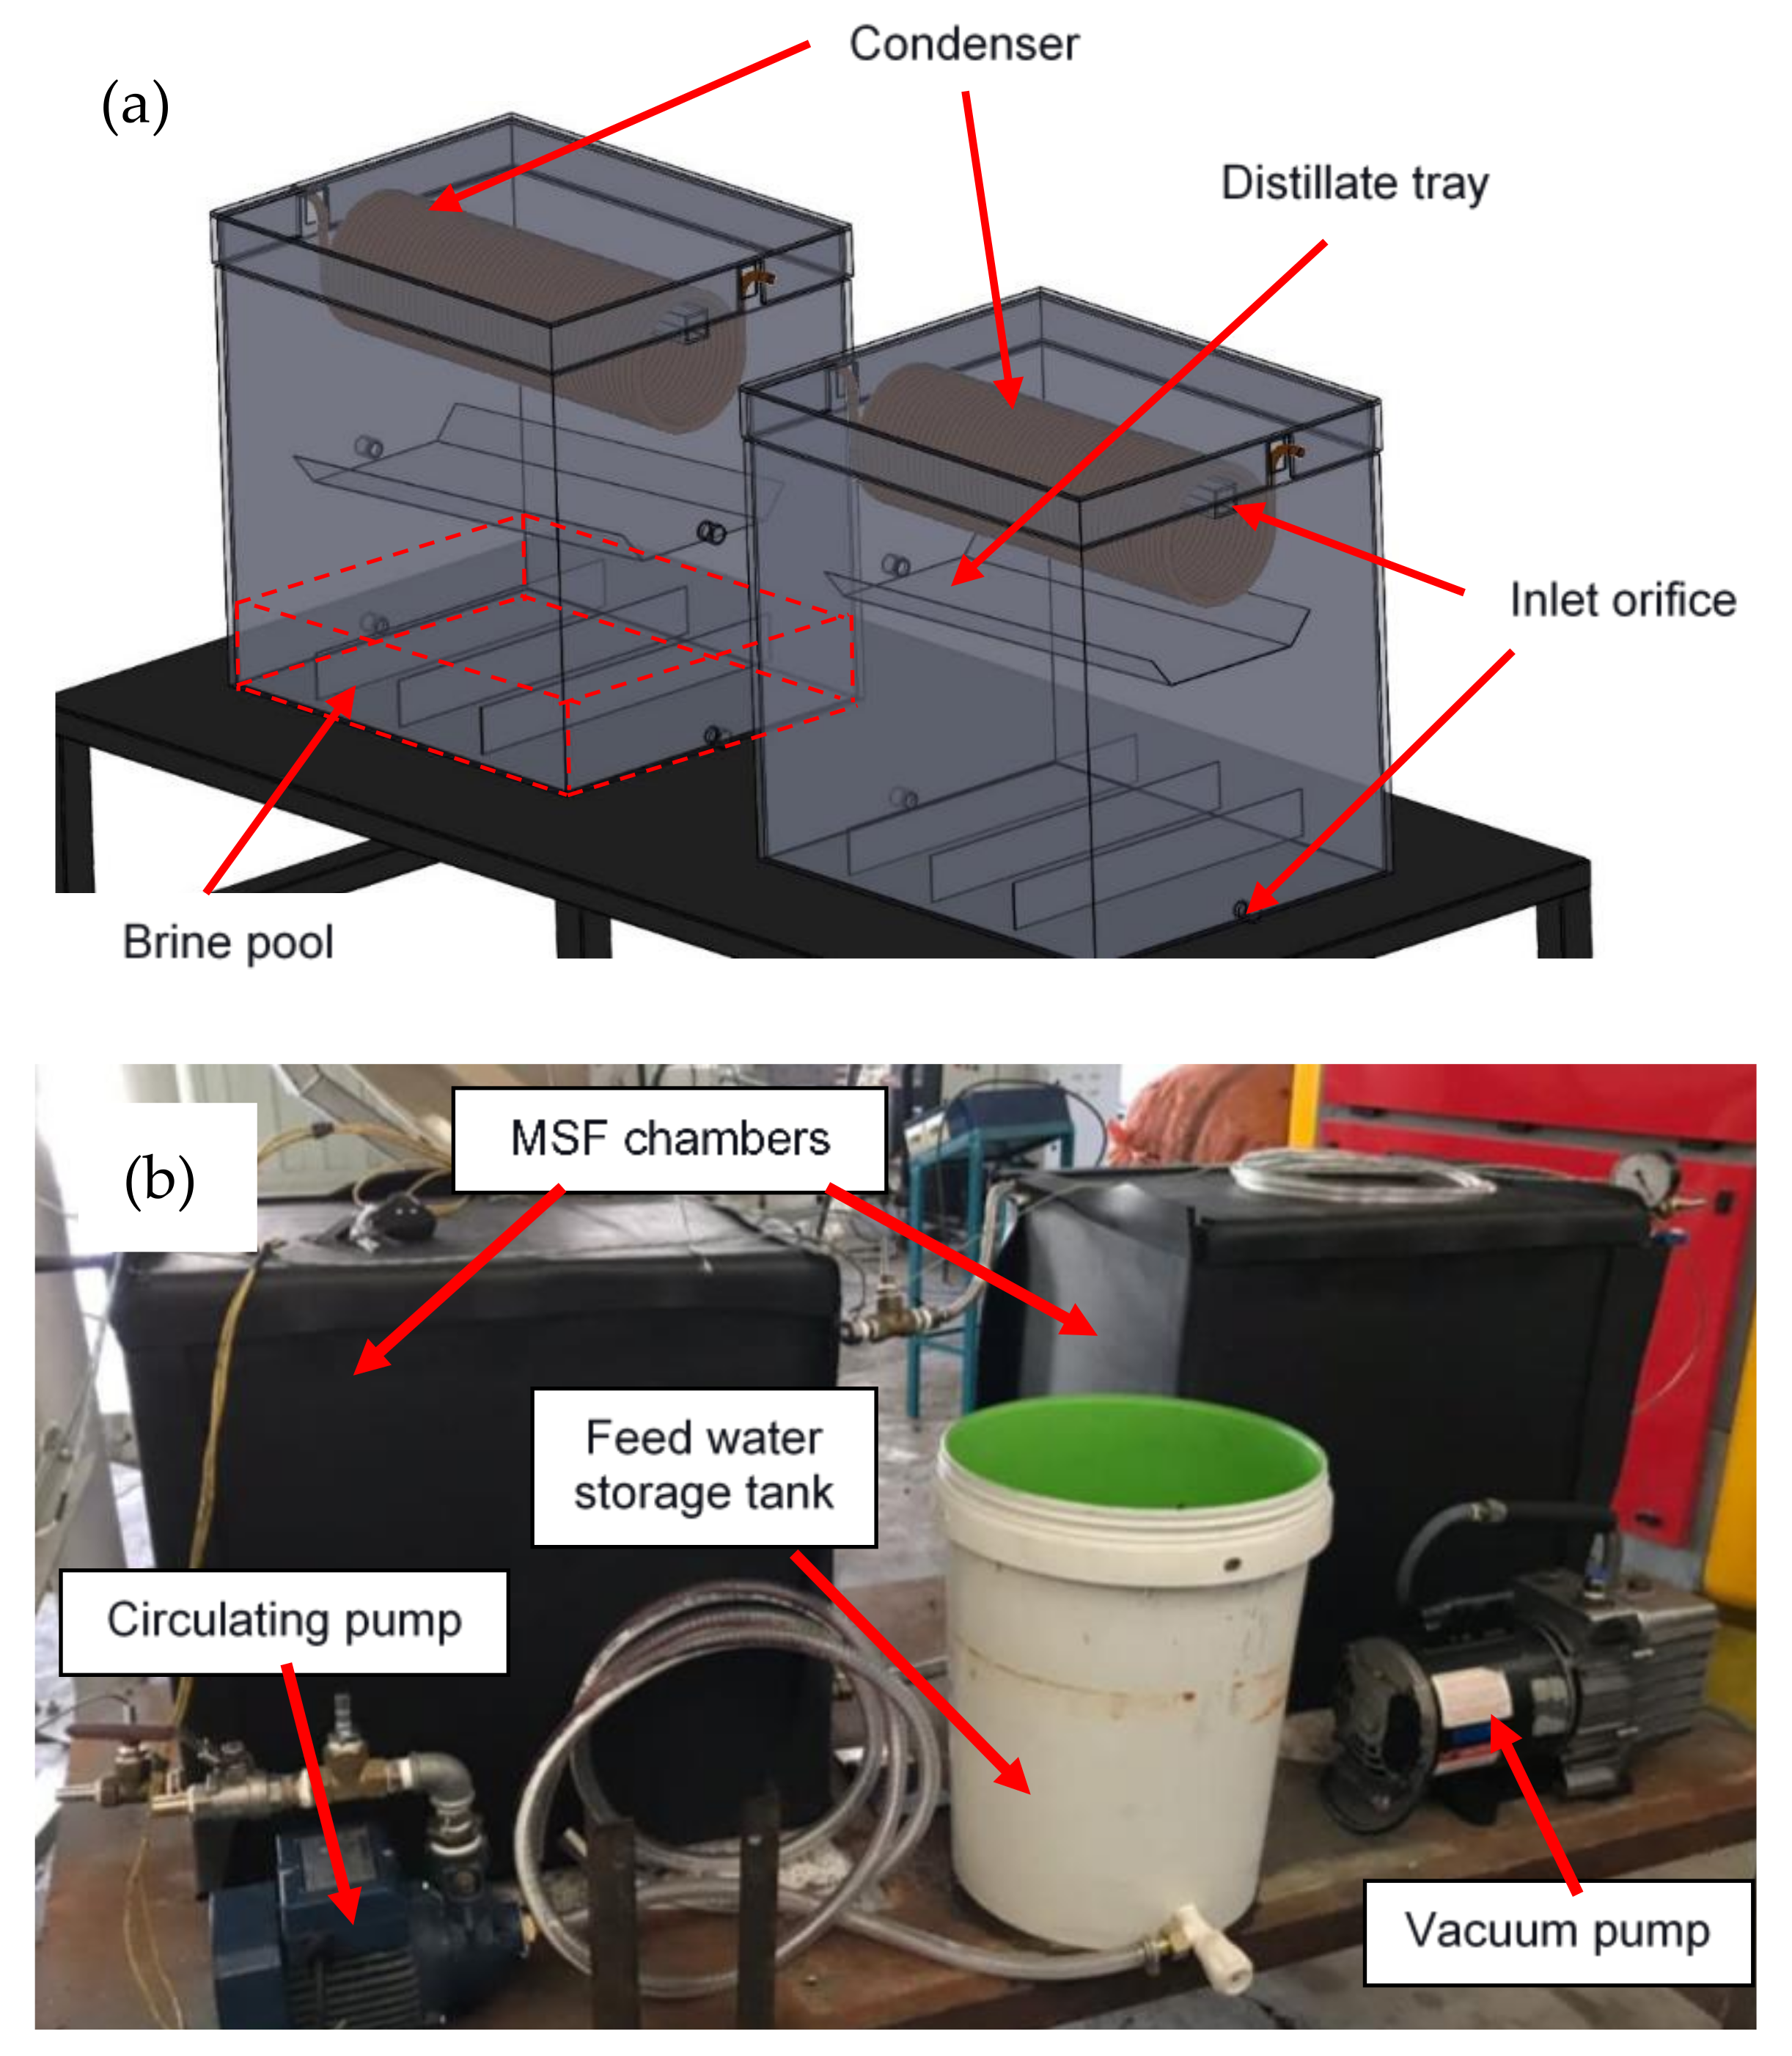
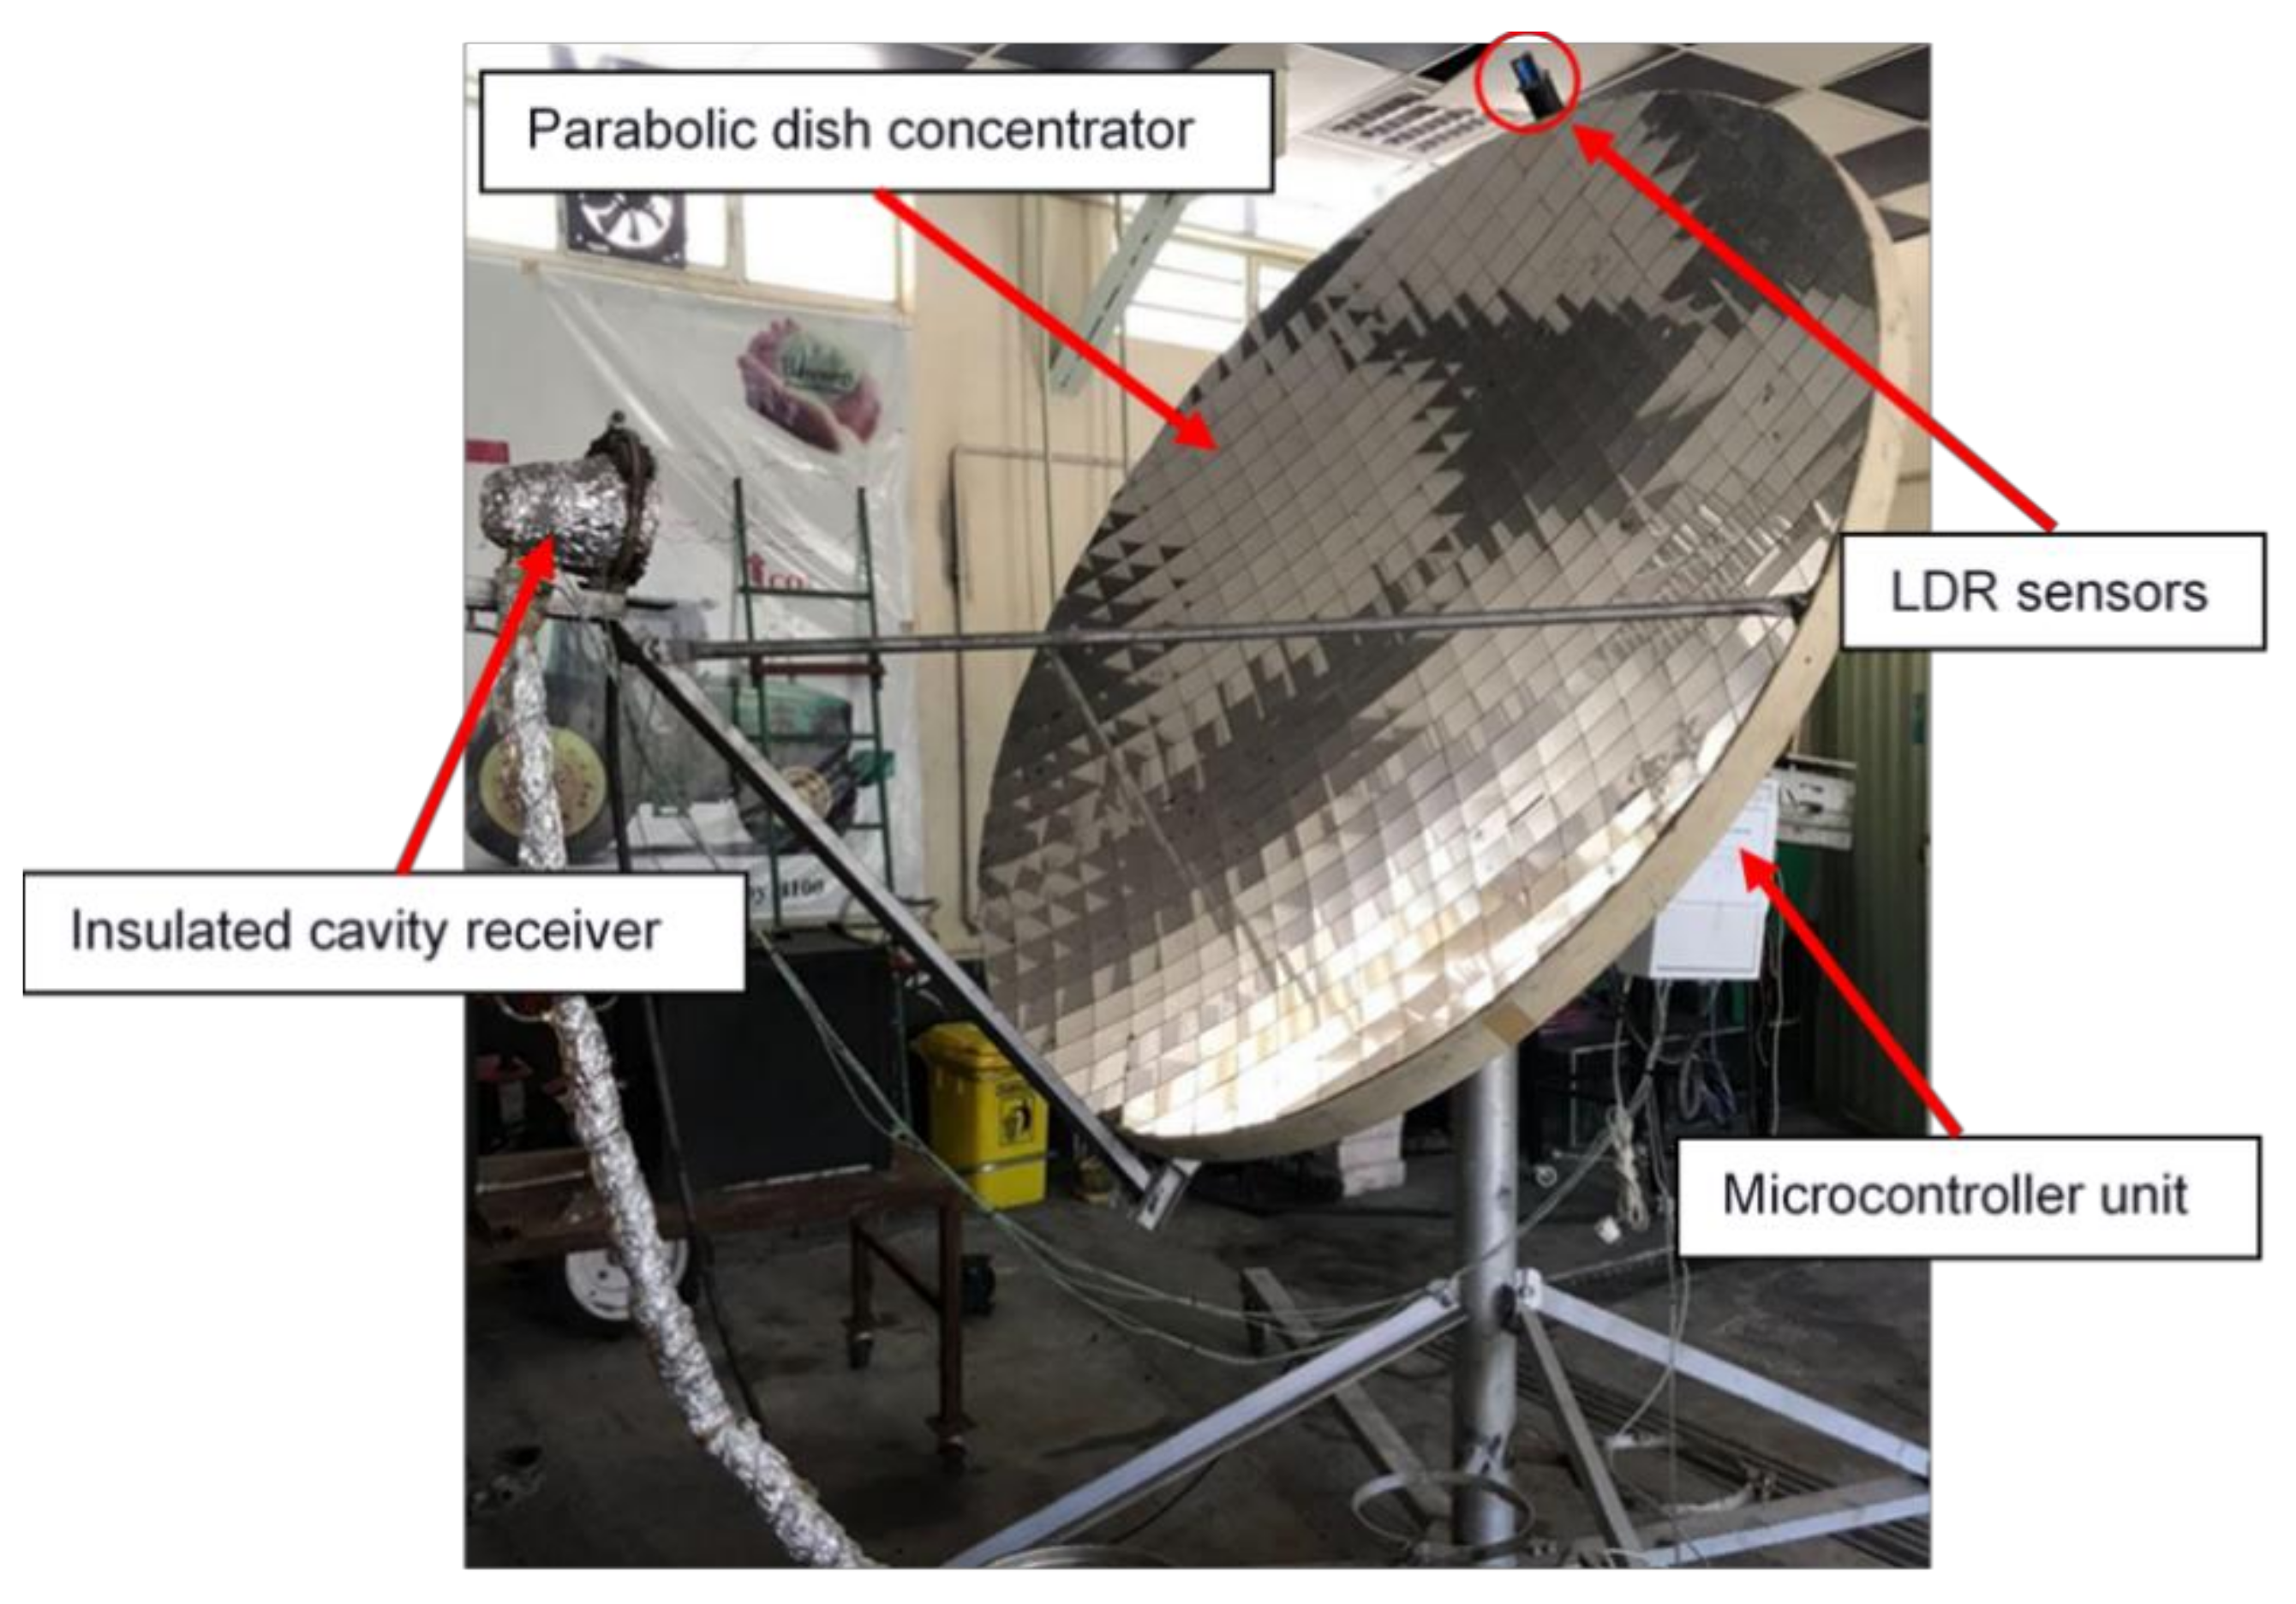
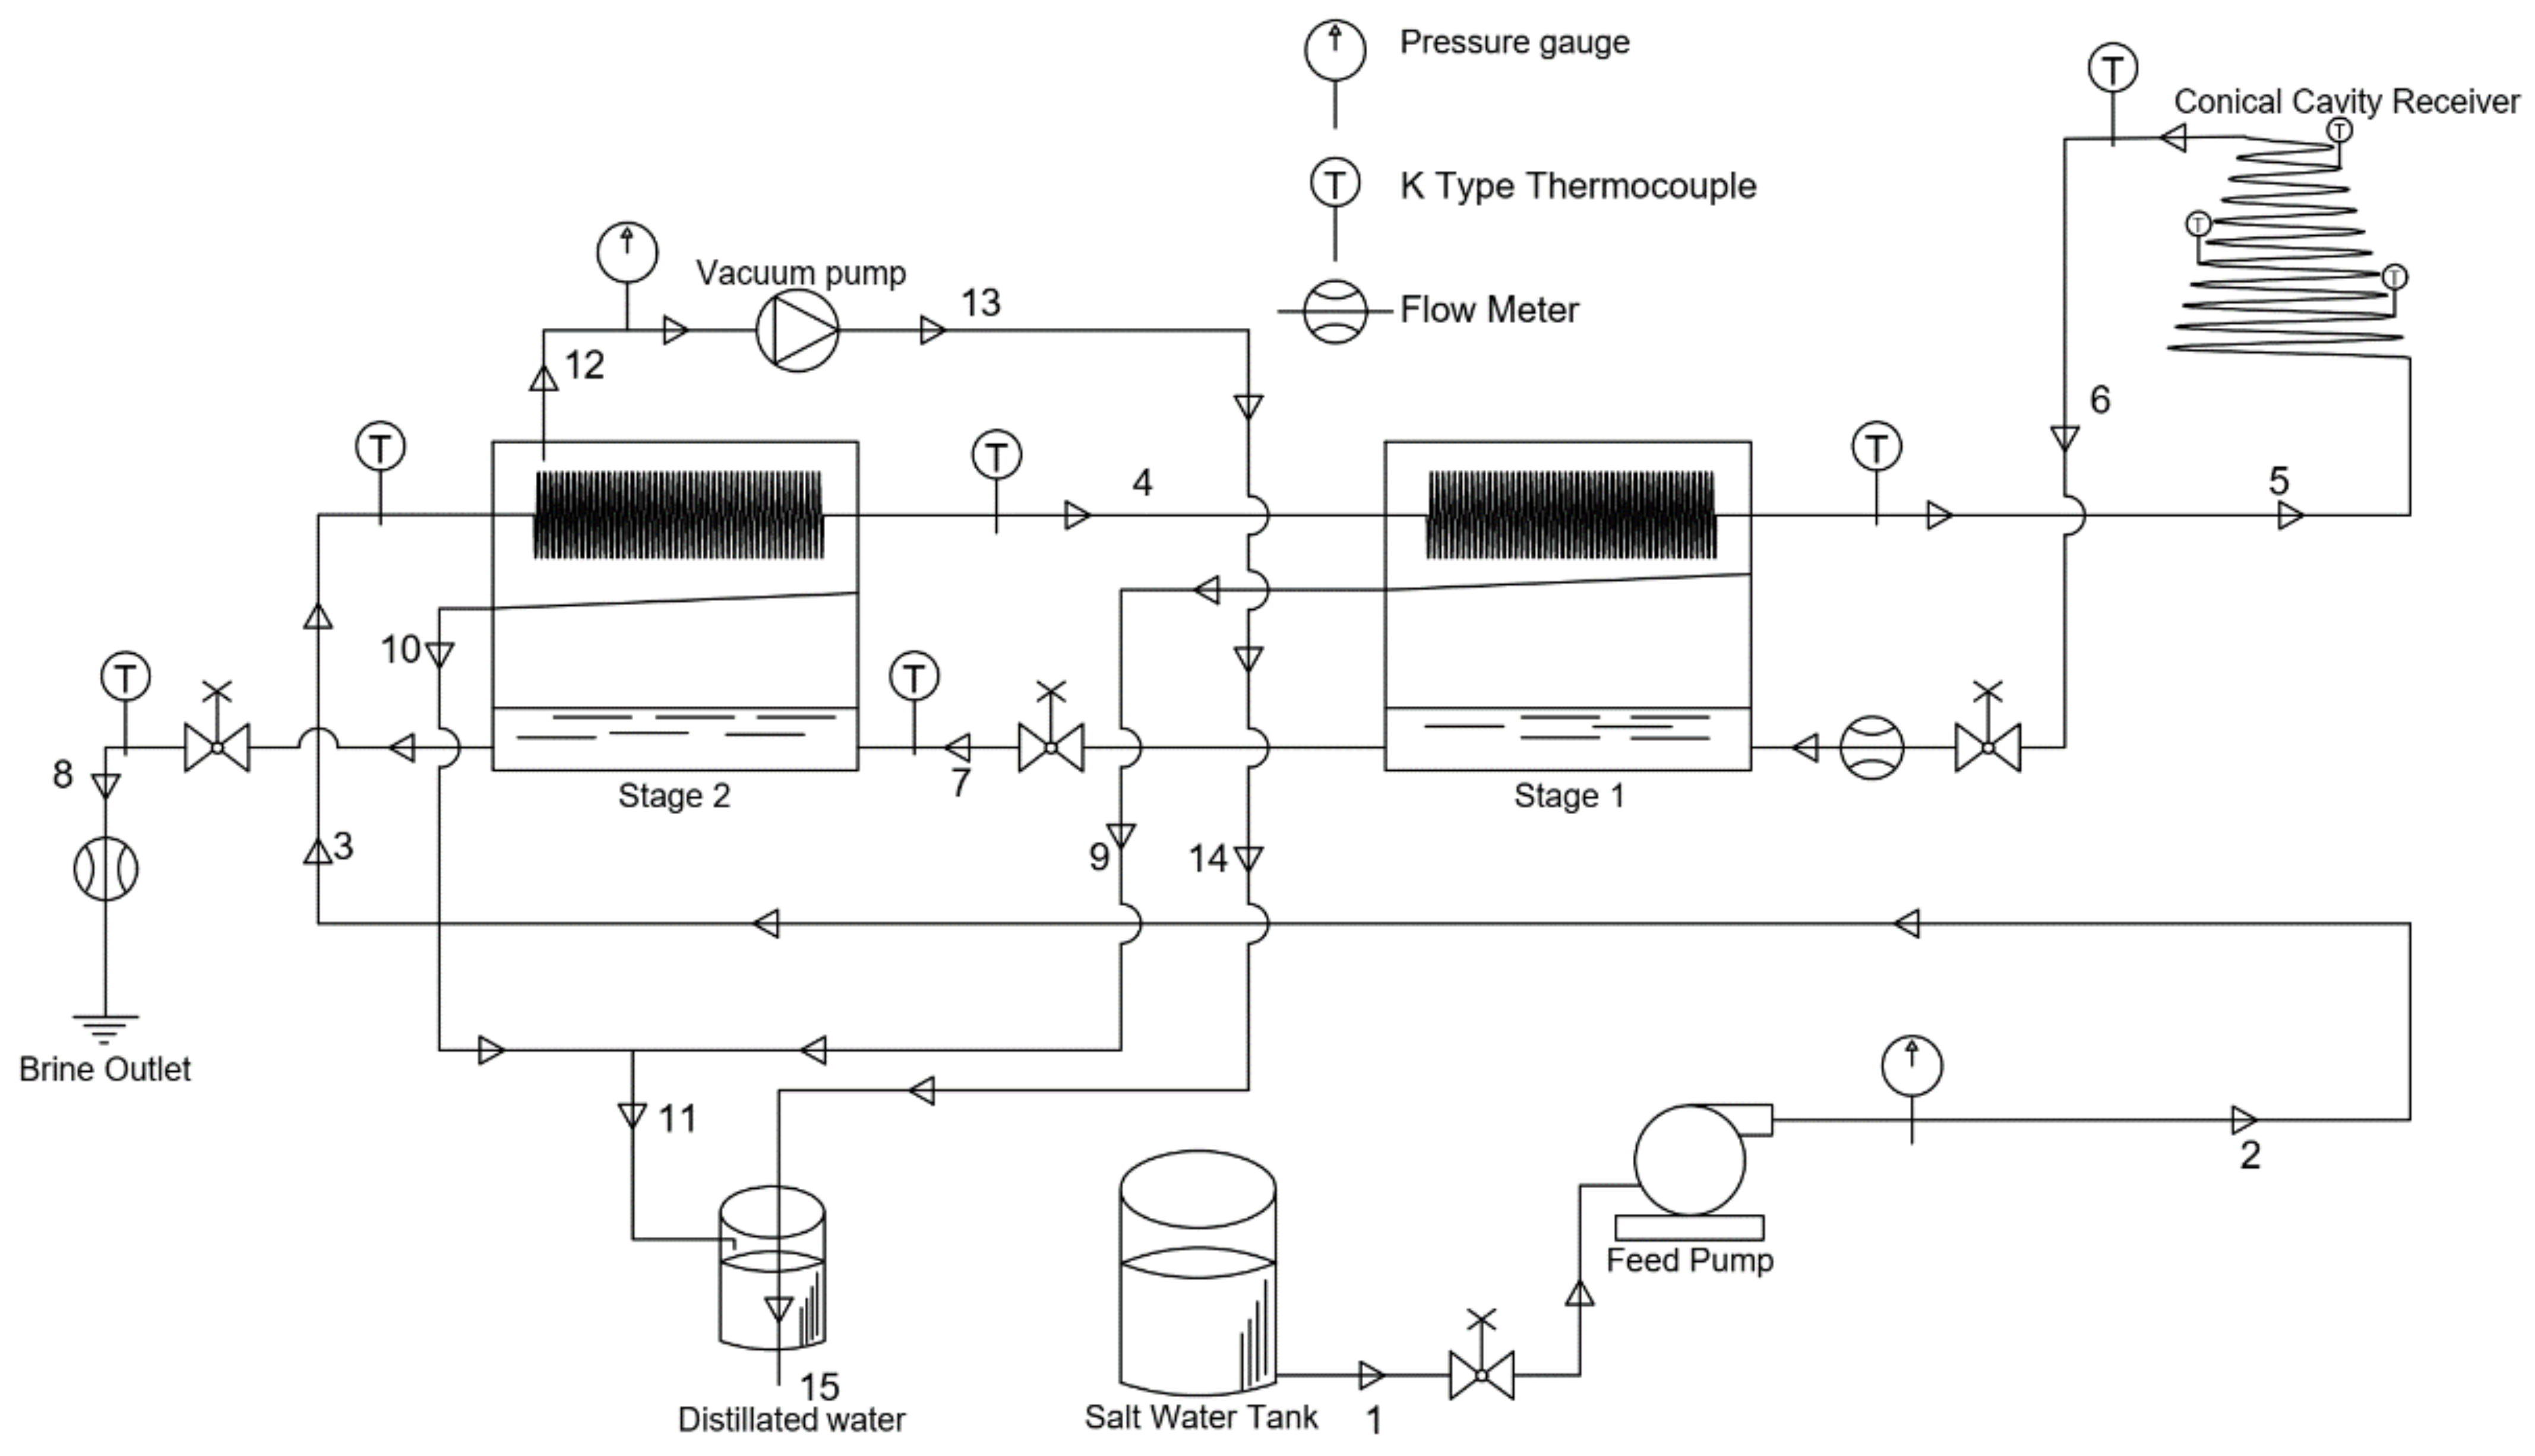
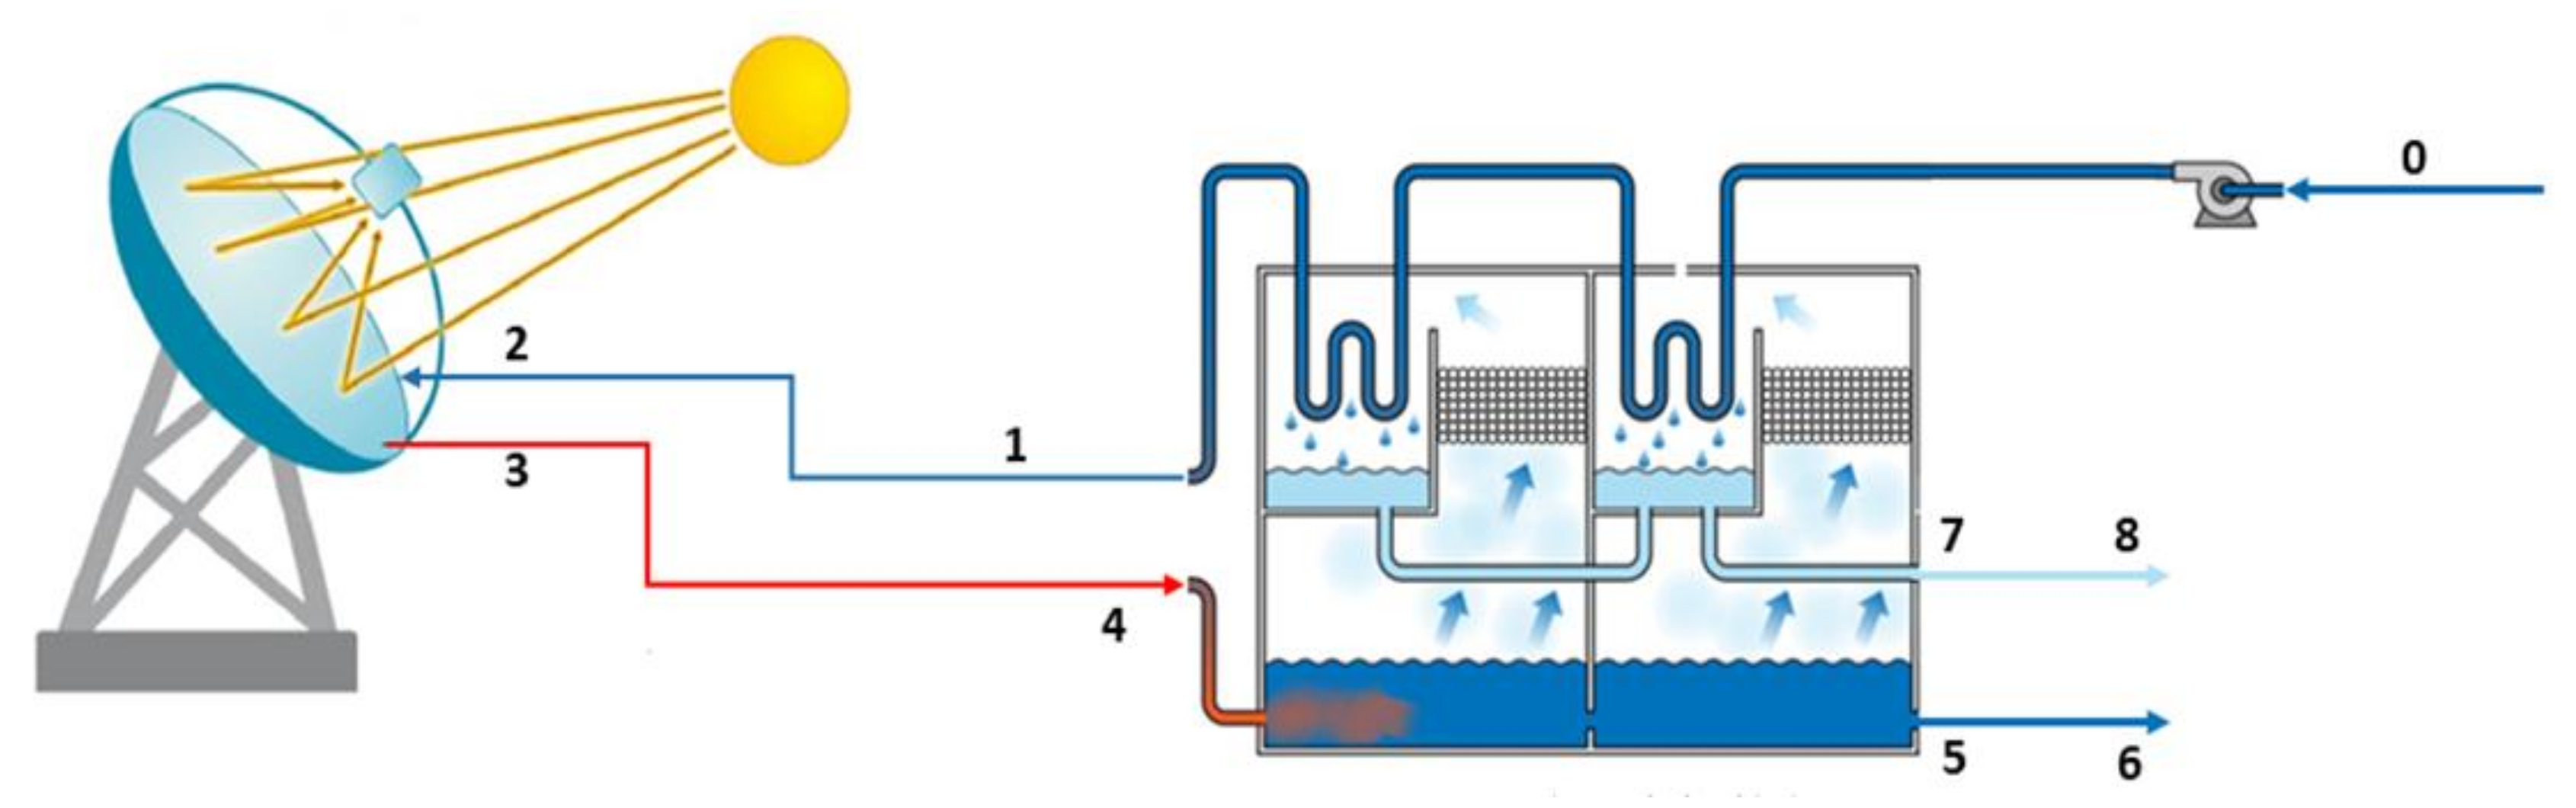
23]. It is worth mentioning that the processes such as MSF desalination require a large amount of thermal energy. Therefore, using high-efficient collectors such as PDCs as the primary heat source for desalination processes in MSF systems can be promising and should be considered thoughtfully. Yet, very limited experimental studies on thermal-powered MSF desalination systems which use PDCs as a heat source are available. So, the objective of this study is to investigate the feasibility of using a PDC as the primary heat source of a small-scale MSF desalination plant. For this purpose, a small-scale MSF desalination unit was fabricated and was integrated with a solar PDC. The performance of the developed solar PDC-MSF desalination plant was experimentally evaluated during six days of experiments. The system was assessed with three different feedwater flow rates. To investigate the effect of vacuum on the system’s productivity, half of the evaluations were conducted while the flashing chambers were undergoing vacuum pressure. Furthermore, the whole system was evaluated from the perspective of exergy. To calculate the unit cost of the produced freshwater, an economic analysis was also conducted.

2. Materials and Methods

2.1. MSF Desalination Unit

A two-stage MSF desalination unit was developed in this study. Each stage consists of inlet and outlet orifices, brine pool, distillate trays and spiral copper pipes (as a condenser). The MSF chambers are made of 4 mm-thick galvanized steel, each flashing stage with 50 cm in length, 40 cm in width and 50 cm in height. To eliminate the use of additional distillate pumps, distillate trays were placed in chambers with a 10° inclination. A copper tube with a diameter of 10 mm was coiled similar to a cylinder and used as a condenser at the top part of each flashing chamber. The condenser cylinder’s diameter was 17 cm and its length was considered 45 cm according to the size of stages as shown in Figure 1a. After fabricating and assembling, each chamber was sealed by applying silicone adhesive to the opening of the chambers. Moreover, to minimize energy losses, chambers were insulated using 6 mm-thick elastomeric foam. Figure 1b illustrates the photo of the developed small-scale MSF desalination unit with two stages representing the main components of the system.

2.2. Solar Parabolic Dish Collector (PDC)

A point-focus parabolic solar dish equipped with a two-axis sun tracker system comprising of LDR photoresistor positioned at the top of the concentrator and connected to a microcontroller was used as the thermal energy source of the system (Figure 2). In this type of concentrator, the sun rays are reflected on the receiver’s aperture area positioned at the focal point of the parabolic dish, increasing the fluid’s temperature inside a conical cavity receiver. The cavity receiver was made of copper tubes and coated with a particular matte black color which could tolerate heat up to 700 °C to absorb the highest amount of solar energy. The outer surface of the receiver was covered with a stone wool insulation layer and an ultra-white glass cover was placed on the aperture of the receiver to prevent heat losses as shown in Figure 3. Additionally, Table 1 represents the parameters of the solar PDC and its receiver.

2.3. Solar PDC-MSF Desalination Unit and Its Working Principle

The schematic representation of the solar PDC-MSF desalination unit developed in this study is shown in Figure 4. As shown in this figure, the main parts of the system are a two-stage small-scale MSF desalination unit and a point-focus parabolic solar concentrator as the thermal energy source (only the cavity receiver has shown in this figure). In this system, the feeding saltwater kept in the storage tank at 30 °C enters the second chamber of the MSF plant’s condenser, and then it leaves the first chamber while it is preheated by the condensation of vapor. In the next step, the preheated saline water flows through the solar PDC where the TBT reaches the highest temperature value of about 90 °C after leaving the cavity receiver. At this stage, the hot saline water, with the help of gravity enters the first chamber’s brine pool where evaporation takes place. The vapor flashes in each chamber and condenses on the condenser tubes. Due to the temperature difference between the saline feedwater flowing in the condenser tubes and vapor in flashing chambers, the vapor is condensed and collected by distillate trays as the product. Finally, the brine is discharged from the brine pool of the second chamber.

2.4. Instrumentation and Experimental Procedure

The experimental tests were conducted in the Renewable Energy Research Institute (RERI) of Tarbiat Modares University, Tehran, Iran. The evaluations were conducted during six sunny days in July 2020, from 10:00 am to 3:00 pm (5 h each day). Experimental tests were conducted with three different flow rates, ranging from 0.7 L/min to 1.3 L/min to examine the effect of the saline feedwater flow rate on the productivity of the system. The feeding saltwater with a salt concentration of 40 g/kg was desalinated during the experiments and different operational and environmental parameters were recorded in 5-min intervals. Six thermocouples (type K) were used to measure the temperature of different parts of the system. The locations of the installation of thermocouples are shown in Figure 4. All thermocouples were connected to an Arduino UNO microcontroller through MAX6675 modules to transfer the measured data and store them. A multifunction water quality meter (Lutron, WA-2017 SD-Taiwan) was used to measure the produced freshwater quality. To measure the solar radiation, the TES 1333R solar power meter was used. The wind speed and air temperature of the location were measured using Lutron AM-4221 anemometer. The error of the independent parameters such as solar radiation, ambient temperature, measured temperatures, wind velocity and characteristics of product water was considered based on the accuracy of the measuring apparatus. The accuracy values of the used instruments are shown in Table 2. However, error calculation of the dependent parameters such as energy and exergy efficiencies is based on expanded uncertainty which can be expressed as [9]:
σ y = ( f x 1 . σ x 1 ) 2 + ( f x 2 . σ x 2 ) 2 + + ( f x n . σ x n ) 2                 ; y = f ( x 1 , x 2 , x n )
where the x i = ( i = 1 , 2 , , n ) parameters are independent variables of the function ( f ), and the f x i are partial derivatives of the function ( f ) concerning x i and   σ x i are the absolute error of x i .
The saltwater circulation through the system (as shown in Figure 1) was carried out using a 0.5 hp water pump. A Platinum DV-42N vacuum pump was used to control the amount of vacuum pressure inside flashing chambers. Half of the tests were performed with a vacuum in the second chamber to investigate the effect of pressure drop on the MSF plant’s productivity. The values for operational parameters during the experiments are presented in Table 3.

3. Theoretical Background

3.1. Solar PDC Heat Transfer Equations

There are several factors involved in the solar PDC’s heat loss to the environment. In general, there are three different kinds of heat loss in the system: (i) conductive heat loss, Q ˙ l , c o n d , (ii) convective heat loss, Q ˙ l , c o n v and (iii) radiative heat loss, Q ˙ l , r a d . The conductive heat loss of the receiver is negligible compared to the other types of heat losses because of using insulation around the receiver. The heat loss, Q ˙ l , can be calculated as [23]:
Q ˙ l = Q ˙ l , c o n d + Q ˙ l , c o n v + Q ˙ l , r a d
where,
Q ˙ l , c o n v = h c A a ( T r T a i r )
and,
Q ˙ l , r a d = h r A a ( T r T s k y )
The h r is radiative heat transfer coefficient which can be calculated by:
h r = ε σ ( T r + T s k y ) ( T r 2 + T s k y 2 )
where,
T s k y = 0.0552 T a i r 1.5
Thus, the useful heat delivered by the receiver is calculated by subtracting heat loss, Q ˙ l from the heat absorbed by the saltwater in the receiver, Q ˙ a :
Q ˙ u = Q ˙ a Q ˙ l
and,
η 0 = Q a I b A a
Then, rewriting the useful energy in mathematical form gives:
Q ˙ u = η 0 I b A a p U t A a ( T r T a i r )
which,
U t = h c + h r
The η 0 in the above equation is representing the optical efficiency which, depends on several factors and can be estimated by [23]:
η 0 = λ ρ τ α γ c o s ( θ )

3.2. Exergy Analysis of Solar PDC-MSF Desalination Unit

The first step to making improvements in the performance of a thermal process is energy analysis. Since energy analysis is only based on thermodynamics’ first law, it does not consider the quality of energy. On the other hand, exergy represents thermodynamic potential, since it is based on the second law of thermodynamic, taking into account both quality and quantity of energy [31]. Exergy is the potential of a system to deliver the highest amount of work in a specific environment and condition. Exergetic analysis can help to find the locations in the system with the highest amount of entropy generation, i.e., exergy destruction. Implementing exergy analysis can help to find responsible components for energy losses and improving them. An exergy analysis regarding the following assumptions was performed on the solar PDC and the MSF unit [28,32]:
  • The process is performed under a steady-state condition;
  • The kinetic and potential energies are regarded insignificant;
  • Exergy destruction of the circulating pump was not taken into account;
  • The temperature and pressure of the dead state are 30 °C and 101.325 kPa, respectively.
The general exergy balance equation in a system is equal to [31]:
  E x i n E x o u t E x d e s t = Δ E x
Considering heat transfer to the system, Q ˙ , to be positive and work carried out on the system, W ˙ , negative, the general exergy balance can be represented as [31]:
( 1 T a T ) Q ˙ W ˙ + m ˙ i n Ψ i n m ˙ o u t Ψ o u t E x d e s t ˙ = Δ E x ˙
Ψ is the exergy of flow which is:
Ψ = h h 0 T 0 ( s s 0 )   ( kJ / kg )
where the h 0 and s 0 are specific enthalpy and specific entropy at dead state, respectively. The exergy flow rate can be found by multiplying specific exergy by the mass flow rate of the fluid, m ˙ :
E x ˙ = m ˙ Ψ

3.2.1. Exergy Analysis of Solar PDC

The total exergy input to the solar PDC can be calculated as [33]:
E x s u n = A I b [ 1 + 1 3 ( T a T s ) 4 4 3 ( T a T s ) ]
It should be noted that in the above equation, T s is solar radiation temperature, which was considered to be 6000 K, A is the surface area of the solar PDC and T a   is the environment’s temperature. When the solar radiation hits the parabolic concentrator, it transforms into heat. However, only a portion of this heat can be absorbed by the fluid in the absorber. The exergy transfer from the sun to the flowing fluid in the concentrator can be calculated as [31]:
E x i n = E x c , o E x c , i
The E x c , o and E x c , i are the exergy flow rates of the outlet and inlet stream of the concentrator. The flow rate of the fluid is constant, therefore:
E x i n = m ˙ c , i [ h c , o h c , i T 0 ( s c , o s c , i ) ]
From Equations (16) and (18), the exergy efficiency of the concentration can be expressed by:
η I I , c = E x i n E x s u n × 100
In a solar concentrator, the energy efficiency is calculated by the ratio of the useful gained energy to the solar radiation incident on the concentrator:
η I , c = Q ˙ u A a I b

3.2.2. Exergy Analysis of MSF Desalination Unit

Figure 5 shows the working principle and flowing fluid streams throughout the MSF desalination plant. Saline water enters the MSF unit at 30 °C, 101.325 kPa and with a salinity of 4%.
Keeping in mind that the flow rate is constant, gained exergy by water is equal to [31]:
E x i n = m ˙ 3 [ h 3 h 2 T 0 ( s 3 s 2 ) ]
The minimum required work to separate salt from the saline water is equal to the difference between outgoing and incoming exergies [31]:
W m i n = E x 8 + E x 6 E x 0
Then, the exergy destruction rate in the whole MSF unit can be calculated as:
E x d e s = E x i n W m i n
Based on Equations (21) and (23), the exergy efficiency can be calculated as [31]:
η I I , M = 1 E x d e s E x i n
As previously stated, exergy analysis will assist in identifying the components with the highest rate of exergy destruction. To find the exergy destruction of each part of the unit, the following equation was used [31]:
E x d e s t r o y e d ( % ) = E x d e s ,   c E x i n
In the above equation, the E x d e s , c is representing the amount of exergy destruction in particular components.

4. Results and Discussion

A solar MSF desalination unit integrated with a PDC with a conical cavity receiver was developed, and its performance was experimentally evaluated. The system was evaluated in the Renewable Energy Research Institute (RERI) of Tarbiat Modares University, Tehran, Iran.

4.1. Effect of Environmental Parameters on the Performance of PDC-MSF Unit

The salinity of the feedwater was set at 40 g/kg. The temperature of the feedwater in the saltwater tank was measured before and during experiments and it was ranging between 29.5 °C to 31.25 °C. To simplify the evaluations, the feedwater’s temperature was considered 30 °C. The experiments were carried out for six days under different operating conditions. The effect of three feedwater flow rates and vacuum inside the MSF stages were studied. The environmental parameters, such as solar radiation, wind speed, ambient temperature and temperatures of different parts of the system, were recorded at 5-min intervals. Due to the difficulty of maintaining the vacuum pressure in the whole system, only the second chamber was vacuumed. Controlling the negative pressure was carried out manually with the help of a valve and monitoring a pressure gauge installed on the second stage. The brine intake and discharge of the second stage were controlled with valves. Figure 6 shows the PDC’s inlet and outlet flow temperature, solar radiation on the first day of the evaluation. As mentioned in Table 3, the feedwater flow rate and operating pressure on the first day were set to be 0.7 L/min under the atmospheric pressure, respectively. The system was designed so that the feed water flows through the condensers of the MSF unit to gain latent heat of evaporated brine in each stage; this will preheat the feedwater and improves the thermal efficiency of the whole system. However, as illustrated in Figure 6, the inlet water’s temperature at 10:00 am is 30 °C because not much vapor was created in the MSF stages at the start of the process, which means zero production rate at that time; the PDC’s outlet temperature or TBT at this time reaches up to 63 °C. The rise in the temperature of the PDC’s inlet flow in the following hours indicates that with time, more vapor has been created in the MSF stages, and inlet water was preheated, implying that the production rate has been increased.
Until midday, with rising solar radiation, the TBT value rises gradually until it reached the maximum value of 94.2 °C at 12:15 pm. The maximum solar radiation was recorded as 1015.3 W/m2, which was the highest radiation value measured throughout evaluations. However, at around 13:00, the weather became partly cloudy, which caused a significant decrease in measured solar radiation and TBT value. The PDC’s inlet and outlet temperatures, as well as the environmental parameters recorded on day 11 July 2020, are shown in Figure 7. As shown in Figure 7, the recorded TBT values range from 54.75 °C at the start of evaluation to the maximum level of 79 °C at noon. Compared to the first day of evaluation, the TBT values are relatively lower. However, according to Figure 7, the average solar radiation was almost as high as the first day, and the maximum amount of solar radiation was recorded as 1008 W/m2 at 12:15 pm. The lower TBT values are because of changing one of the operation parameters of the MSF unit. On the third day of evaluation, the feedwater flow rate was set to be 1.3 L/min, which was almost twice as fast as the first day; in this way, the water leaves the PDC faster, resulting in lower TBT raise.
On day 14 July 2020, the maximum solar radiation was recorded as 1007.4 W/m2 at 12:15 pm, as shown in Figure 8. On this day, the feedwater flow rate was the same as the first day; however, the operating pressure of the second stage of the MSF unit was reduced by −10 kPa. The TBT values are relatively high since the feedwater flow rate was at its lowest value (0.7 L/min). TBT value at the start of the experiment was recorded as about 62.25 °C, while it reached 93.75 °C at noon, corresponding to the high amount of solar radiation. On this day, the wind speed had no particular pattern, and it reached its maximum value of 12.1 km/h around noon. It should be noted that, in every day of evaluation, as solar radiation was increased with time until midday and then decreased gradually, the air temperature was almost constant after the midday, and wind velocity had no particular pattern. According to the measured environmental data, solar insolation was found to be the most influential factor in increasing the TBT value.
The trends of recorded temperatures of PDC’s inlet and outlet corresponding to the feedwater flow rates in Figure 6 and Figure 7, were similar to the results reported by Morad et al. [34]. They had an experimental study on a solar-powered desalination system using a condenser integrated with a flat plate solar collector. They investigated the effect of three different feedwater flow rates of 0.4, 0.6 and 0.8 L/h on the performance of their system. The recorded temperatures reached their maximum values under conditions of 0.4 L/h.
Figure 9 shows the variation of measured environmental data such as solar radiation, ambient temperature and TBT during evaluations. On day 9 July 2020, the maximum value of the air temperature near PDC was measured as 31.4 °C. The highest amount of the measured ambient temperature for the following days was measured as 31.7 °C and 31.8 °C, respectively. It should be noted that, in every day of evaluation, as solar radiation was increased with time until midday and then decreased gradually, the air temperature was almost constant after the midday, and wind velocity had no particular pattern. According to the measured environmental data, solar insolation was found to be the most influential factor in increasing the TBT value.
Figure 10 shows the values of measured TBT corresponding to the solar radiation in each evaluation day until midday. TBT values are affected by the incident solar insolation. As mentioned before, the saline water’s temperature rises when it goes through the solar PDC’s receiver. The linear relation between TBT rises and available solar radiation indicates solar radiation’s impact on the process of solar desalination. The solar radiation ranged from 960 W/m2 to 1015 W/m2, causing TBT to be changed from 55 °C to 95 °C. Moreover, as described in Equation (21), one of the critical factors affecting the amount of the gained heat by the flowing water inside the chambers of the MSF unit is the feedwater flow rate. As shown in Figure 10, the brine temperature raise on days with similar feedwater flowrate are matching. The mean difference between brine temperature rise values between different experimental days was in the range of 6.7 °C (between flow rates of 0.7 and 1 L/min) and 8.5 °C (between flow rates of 1 and 1.3 L/min). Even though environmental conditions significantly affect a solar desalination system, parameters such as ambient temperature and wind speed did not significantly affect the system. Gorjian et al. [23] reported similar results for the effect of the environmental parameters on the productivity of their system. TBT value is one of the key design factors for an MSF desalination system. Based on a study by Hanshik et al. [27] increasing the TBT will result in more freshwater production. Therefore, the TBT value must be constant during the desalination process to control the production. Throughout experiments, it was observed that the TBT values were fluctuating, corresponding to the solar radiation. In this way, a thermal storage system (TES) is needed to control the TBT values and continues production during nighttime.

4.2. Daily Freshwater Production

Figure 11 illustrates the daily productivity and relative operating vacuum pressure during six days of experiments. A 10 kPa vacuum pressure was made in the MSF unit for half of the experiments to increase productivity. Three different flow rates (0.7, 1 and 1.3 L/min) were chosen to perform the experimental tests. Experiments were performed for 5 h each day to take advantage of receiving the highest amount of solar radiation.
It is evident that by increasing the flow rate of the saline water, the production of the system significantly decreases. With increasing the flow rate, the flowing water leaves the PDC’s receiver faster so that it has less time to absorb the heat and leads to a relatively lower TBT and lower productivity as a consequence. By increasing the feedwater flow rate from 0.7 to 1.3 L/min, the production rate was reduced about 76.5%. It was found that with the flow rate of 0.7 L/min (the lowest flow rate), the distillate production is about 2.4 L/day, which is the highest amount among other settings. As mentioned before, the effect of the vacuum pressure on the desalination process was also investigated. As expected, reducing the pressure inside of the second chamber of the MSF plant has slightly improved the production. It was observed that the vacuum pressure of 10 kPa would improve the productivity of the plant by about 34%, where the feedwater flow rate was set to be 0.7 L/min, and 82.98% at feedwater flowrate of 1 L/min. The highest production was recorded on the fourth day of evaluation, which was about 3.22 L/day. Similar results were reported by Darawsheh et al. [28] where they enhanced the distillation ratio of their proposed system by 29.4% only by reducing the pressure inside a vacuum flash chamber by 10 kPa.

4.3. Quality Parameters of the Produced Distillate

The quality parameters of the produced distilled water samples collected during experiments were measured. As mentioned before, the initial value of total dissolved solids (TDS) was set to be 40 g/kg, and the temperature of the water before entering the parabolic dish was set to be 30 °C to simulate the conditions of the water of Persian Gulf. Table 4 represents the quality parameters of distillate samples. As shown in this table, all samples’ TDS values of produced distillate samples are below 500 ppm, which satisfies the World Health Organization (WHO) standard for drinking water. It should be noted that the relatively high value of TDS on the first day of evaluation shows the presence of some dirt and pollutions in the desalination unit chambers due to previous adjustments and repairs on the MSF unit, which were removed gradually after several evaluations.

5. Energy and Exergy Analysis of Solar PDC-MSF Desalination Unit

5.1. Parabolic Dish Concentrator (PDC)

The average values of daily energy and exergy efficiency of the PDC during experiments are presented in Figure 12. As shown in this figure, the collector’s energy efficiency ranges between 46–62%. On the other hand, the exergy efficiency is much lower than energy efficiency and ranges between 0.7–1.3%. These results indicate that the solar PDC is not efficient enough from the view of exergy, and there is much room to improve its efficiency. According to Equations (17)–(19), one critical factor is the feedwater flow rate. Optimizing the circulating fluid’s flow rate and operating parameters such as temperature contributes to increasing the exergy efficiency.

5.2. MSF Desalination Unit

Table 5 represents the properties and exergy rates of different streams throughout the MSF desalination unit. The exergy of the inlet saline water is zero because it has been assumed to be at a dead state. The rejected brine has a negative exergy value because its salinity rises during the desalination process and needs work to reduce its salinity [35].
The exergy efficiency of separating salt from saline water was calculated using Equations (21)–(24). The MSF unit’s total exergy efficiency was calculated as about 0.07% which is considerably low compared to the results of a compact solar-powered distillation unit reported by Banat and Jwaied [31]. A low level of exergy efficiency indicates that there are plenty of opportunities to improve the unit’s thermodynamic efficiency. One solution to this issue is to identify the system components that have the greatest amount of exergy destruction. By using Equation (25), the exergy destruction was calculated for each component individually. Based on calculations, the stages of the MSF unit were in charge of about 99.92% of exergy destruction while only about 0.042% of input exergy was destroyed by the brine blowdown and the product discharge. Increasing the number of flashing units can be a possible way to improve the MSF unit’s performance. However, it should be noted that increasing the flashing stages may lead to higher manufacturing and production costs [31].

6. Economic Analysis of the System

The cost of the produced freshwater by desalination is a function of variable parameters. The rising price of fossil fuels led engineers toward using other sustainable energy sources such as solar energy, wind, etc. However, these kinds of energy sources may have higher initial costs. A cost analysis based on the total cost of ownership (TC) for the developed desalination plant is presented in this section. The direct cost ( D C ) including costs of the used materials, components and building was calculated. Table 6 shows the cost associated with the developed desalination plant.
Indirect capital costs ( I D C ) including construction, insurance and legal fees were taken as a percentage of the direct capital costs [1]:
I D C = 0.25 × D C
The annual repayment amount was calculated by multiplying the total capital cost by the amortization factor α. The amortization factor spreads total capital costs over the plant’s lifespan using an interest rate of i and the plant’s lifetime of n years [1]:
α = i × ( 1 + i ) n ( 1 + i ) n 1
Since the plant is sung solar energy, only the circulating water pump and the vacuum pump’s electrical costs were taken into account as the operating costs ( O C ). Assuming the desalination plant works 10 h in a day and considering Iran’s electricity tariff of 0.02 US$/kWh, the annual cost of electrical energy consumption for the plant is calculated as 79.92 US$/year. The maintenance cost ( M C ) for each component is calculated as a percentage of its direct capital costs [1]:
M C = 0.02 × D C M S F
The total annual cost for the plant is equal to:
T C = ( D C + I D C ) × α + O C + M C
Then, the average price of produced water per kg ( C p r o d ) is:
C p r o d = T C P d × 365 × f
Table 7 shows the assumptions made for calculating the C p r o d of the desalination plant.
Assuming 25 year life for the plant, the cost of produced fresh water was estimated to be at about 37$/m3 which is relatively high. However, scaling up the plant can reduce the specific cost of produced water dramatically. The Rule of Six-Tenths is used to scale up the plant and assess the costs. Equation (31) represents the rule of six tenths:
C B = C A ( S B S A ) p
where, C B is the approximate cost of equipment having size S B , C A is the known cost of equipment having size S A . The S A and S B can be kW, Hp, m2 or everything else. So, the size factor ( S B S A ) is a dimensionless term. In the above equation, p is called the size factor’s exponent, which can vary from 0.3 to 1 with an average value of 0.6.
For scaling up, the production of 8000 L/day was taken into account to provide drinking water for a small community in a remote area. Table 8. shows the estimated cost of produced distillate by the MSF plant in both cases of 8 L/day and 8000 L/day production capacity.
As mentioned before, the developed system operates for only 10 h a day (ignoring nighttime because of the lack of a thermal storage system). Adding a thermal storage system will increase the system’s working hours and increase its productivity. However, it should be noted that adding such a system to the plant may increase the energy cost, and that should be considered in further studies. Finally, the performance of the developed solar PDC-MSF desalination unit in the present study was compared with the previous systems developed by different researchers, and results are presented in Table 9.

7. Conclusions

A small-scale two-stage solar PDC-MSF desalination unit was developed in this study and its performance was experimentally evaluated. The effect of three different saline feedwater flow rates and negative pressure created in one of the stages of the MSF unit was investigated. Next, the thermodynamic performance of the whole system was evaluated. It was found that the most important factors that affect the system’s productivity are received solar radiation and its effect on the TBT values and values of circulating saline feedwater flow rate. Due to TBT fluctuations during experiments and the difficulty of its controlling, the use of a TES is suggested for better control of the system even on cloudy days or at night. Some other results are summarized below:
  • The highest solar radiation was measured as 1015.3 W/m2 on the first day of evaluation. On this particular day, the maximum wind speed, ambient temperature and TBT values were recorded as 9.2 km/h, 31.4 °C and 94.25 °C, respectively.
  • The maximum amount of distilled water was recorded as 3.22 L during 5 h in a day with the feedwater flow rate of 0.7 L/min and applying a 10 kPa vacuum pressure on the second stage of the MSF desalination unit.
  • The highest TBT value was obtained as 94.25 °C on the first day of evaluation (feedwater flow rate of 0.7 L/min). The lowest TBT value was also 79 °C that was recorded on the third day of evaluation (feedwater flow rate of 1.3 L/min).
  • Changing the inlet feedwater flow rate from 0.7 to 1.3 L/min caused a 76.4% reduction in water production. It was observed that the vacuum pressure of 10 kPa would improve the productivity of the plant by about 34% at feedwater flow rate of 0.7 L/min and 82.98% at feedwater flow rate of 1 L/min.
  • The highest amounts of energy and exergy for the solar PDC were calculated as 62.15% and 1.29%, respectively.
  • The stages of the MSF unit with a portion of 99.92% allocated the most input exergy destruction which was about 264.8 W.
  • The quality parameters of the distillate collected during experiments, such as TDS, EC, pH and DO were measured. The results showed that the measured parameters are in the range reported by the WHO for drinking water.
  • The cost of distillate water produced by the system varies from 37 US$/m3 for the 8 L/day production capacity to 1.5 US$/m3 when the production capacity was increased to 8000 L/day. The scale-up made a 95.94% reduction in distillate production costs.

Author Contributions

A.B., formal analysis, investigation, data curation, writing—original draft; S.G., conceptualization, methodology, resources, supervision, project administration, funding acquisition, writing—review & editing, M.A., visualization, writing—review & editing. All authors have read and agreed to the published version of the manuscript.

Funding

This research was funded by Tarbiat Modares University (TMU), grant number IG/39705.

Institutional Review Board Statement

Not applicable.

Informed Consent Statement

Not applicable.

Conflicts of Interest

The authors declare no conflict of interest.

Nomenclature

A Solar collector area, m2
A a Surface area of the receiver, m2
C Specific heat capacity, kJ/kg K
C A Known cost of equipment (US$)
C B Approximate cost of equipment (US$)
C p r o d Product cost, US$
D C Direct capital costs, US$
E x Rate of exergy flow, kW
f Plant availability, %
h Specific enthalpy, kJ/kg
h 0 Specific enthalpy at dead state, kJ/kg
h c Convective heat transfer coefficient, W/m2 K
h r Radiative heat transfer coefficient, W/m2 K
i Annual interest rate, %
I b Solar radiation, W/m2
I D C Indirect capital costs, US$
m ˙ Mass flow rate, kg/s
M C Maintenance costs, US$
n Lifespan of the plant, year
O C Operating costs, US$
P d Daily production rate, kg/day
p Size factor’s exponent
Q Rate of heat supplied to the system, kW
Q ˙ a Radiant solar energy falling on the receiver, W
Q ˙ l Heat losses from the receiver to the environment, W
Q ˙ l , c o n d Conductive heat loss rate from receiver, W
Q ˙ l , c o n v Convective heat loss rate from receiver, W
Q ˙ l , r a d Radiative heat loss rate from receiver, W
Q ˙ u Useful energy collected, W
S B S A Ratio known as the size factor
s Specific entropy, kJ/kg K
s 0 Specific entropy at dead state, kJ/kg K
T Temperature, K
T 0 Temperature at dead state, K
T a Ambient temperature, K
T a i r Air temperature, K
T r Receiver wall temperature, K
T s Solar radiation temperature, K
T s k y Sky temperature, K
U t Overall heat loss coefficient, W/m2 K
W Work per unit mass, kJ/kg
W ˙ Work done per unit time, kW
Greek symbols
α Amortization factor
γ Intercept factor of receiver
ε Receiver surface emittance
η I , c Energy efficiency of the solar collector, %
η I I , c Exergy efficiency of the solar collector, %
η I I , M Exergy efficiency of the MSF unit, %
θ Angle of incidence
λ Un-shading factor
ρ Dish reflectance
σ Stefan-Boltzmann constant, 5.67 × 10 8 W/m2 K4
τ α Transmittance-absorptance product
Ψ Flow exergy, kJ/kg

References

  1. Alsehli, M.; Choi, J.-K.; Aljuhan, M. A novel design for a solar powered multistage flash desalination. Sol. Energy 2017, 153, 348–359. [Google Scholar] [CrossRef]
  2. Gorjian, S.; Singh, R.; Shukla, A.; Mazhar, A.R. On-farm applications of solar PV systems. In Photovoltaic Solar Energy Conversion; Gorjian, S., Shukla, A., Eds.; Elsevier: London, UK, 2020; pp. 147–190. [Google Scholar]
  3. Gorjian, S.; Ghobadian, B.; Ebadi, H.; Ketabchi, F.; Khanmohammadi, S. Applications of solar PV systems in desalination technologies. In Photovoltaic Solar Energy Conversion; Elsevier: London, UK, 2020; pp. 237–274. [Google Scholar]
  4. Sharon, H.; Reddy, K.S.; Gorjian, S. Parametric investigation and year round performance of a novel passive multi-chamber vertical solar diffusion still: Energy, exergy and enviro-economic aspects. Sol. Energy 2020, 211, 831–846. [Google Scholar] [CrossRef]
  5. Gorjian, S.; Ghobadian, B. Solar desalination: A sustainable solution to water crisis in Iran. Renew. Sustain. Energy Rev. 2015, 48, 571–584. [Google Scholar] [CrossRef]
  6. Alhazmy, M.M. Economic and thermal feasibility of multi stage flash desalination plant with brine–feed mixing and cooling. Energy 2014, 76, 1029–1035. [Google Scholar] [CrossRef]
  7. Shatat, M.; Worall, M.; Riffat, S. Opportunities for solar water desalination worldwide: Review. Sustain. Cities Soc. 2013, 9, 67–80. [Google Scholar] [CrossRef]
  8. Al-Othman, A.; Tawalbeh, M.; Assad, M.E.H.; Alkayyali, T.; Eisa, A. Novel multi-stage flash (MSF) desalination plant driven by parabolic trough collectors and a solar pond: A simulation study in UAE. Desalination 2018, 443, 237–244. [Google Scholar] [CrossRef]
  9. Ketabchi, F.; Gorjian, S.; Sabzehparvar, S.; Shadram, Z.; Ghoreishi, M.S.; Rahimzadeh, H. Experimental performance evaluation of a modified solar still integrated with a cooling system and external flat-plate reflectors. Sol. Energy 2019, 187, 137–146. [Google Scholar] [CrossRef]
  10. Calise, F.; d’Accadia, M.D.; Piacentino, A. Exergetic and exergoeconomic analysis of a renewable polygeneration system and viability study for small isolated communities. Energy 2015, 92, 290–307. [Google Scholar] [CrossRef]
  11. Eterafi, S.; Gorjian, S.; Amidpour, M. Thermodynamic design and parametric performance assessment of a novel cogeneration solar organic Rankine cycle system with stable output. Energy Convers. Manag. 2021, 243, 114333. [Google Scholar] [CrossRef]
  12. Zhang, Y.; Sivakumar, M.; Yang, S.; Enever, K.; Ramezanianpour, M. Application of solar energy in water treatment processes: A review. Desalination 2018, 428, 116–145. [Google Scholar] [CrossRef] [Green Version]
  13. Mollahosseini, A.; Abdelrasoul, A.; Sheibany, S.; Amini, M.; Salestan, S.K. Renewable energy-driven desalination opportunities—A case study. J. Environ. Manag. 2019, 239, 187–197. [Google Scholar] [CrossRef] [PubMed]
  14. Sharon, H.; Reddy, K.S. A review of solar energy driven desalination technologies. Renew. Sustain. Energy Rev. 2015, 41, 1080–1118. [Google Scholar] [CrossRef]
  15. M, C.; Yadav, A. Water desalination system using solar heat: A review. Renew. Sustain. Energy Rev. 2017, 67, 1308–1330. [Google Scholar] [CrossRef]
  16. Cioccolanti, L.; Renzi, M. Coupling a small-scale concentrated solar power plant with a single effect thermal desalination system: Analysis of the performance. Appl. Therm. Eng. 2018, 143, 1046–1056. [Google Scholar] [CrossRef]
  17. Malik, M.Z.; Musharavati, F.; Khanmohammadi, S.; Khanmohammadi, S.; Nguyen, D.D. Solar still desalination system equipped with paraffin as phase change material: Exergoeconomic analysis and multi-objective optimization. Environ. Sci. Pollut. Res. 2021, 28, 220–234. [Google Scholar] [CrossRef] [PubMed]
  18. Mirmanto; Sayoga, I.M.A.; Wijayanta, A.T.; Sasmito, A.P.; Aziz, M. Enhancement of Continuous-Feed Low-Cost Solar Distiller: Effects of Various Fin Designs. Energies 2021, 14, 4844. [Google Scholar] [CrossRef]
  19. Mabrouk, A.N.A.; Fath, H.E.S. Experimental study of high-performance hybrid NF-MSF desalination pilot test unit driven by renewable energy. Desalin. Water Treat. 2013, 51, 6895–6904. [Google Scholar] [CrossRef]
  20. Kabeel, A.E.; El-Said, E.M.S. Applicability of flashing desalination technique for small scale needs using a novel integrated system coupled with nanofluid-based solar collector. Desalination 2014, 333, 10–22. [Google Scholar] [CrossRef]
  21. Garg, K.; Khullar, V.; Das, S.K.; Tyagi, H. Performance evaluation of a brine-recirculation multistage flash desalination system coupled with nanofluid-based direct absorption solar collector. Renew. Energy 2018, 122, 140–151. [Google Scholar] [CrossRef]
  22. Loni, R.; Askari Asli-ardeh, E.; Ghobadian, B.; Kasaeian, A.B.; Gorjian, S. Thermodynamic analysis of a solar dish receiver using different nanofluids. Energy 2017, 133, 749–760. [Google Scholar] [CrossRef]
  23. Gorjian, S.; Ghobadian, B.; Tavakkoli Hashjin, T.; Banakar, A. Experimental performance evaluation of a stand-alone point-focus parabolic solar still. Desalination 2014, 352, 1–17. [Google Scholar] [CrossRef]
  24. Prado, G.O.; Vieira, L.G.M.; Damasceno, J.J.R. Solar dish concentrator for desalting water. Sol. Energy 2016, 136, 659–667. [Google Scholar] [CrossRef]
  25. Srithar, K.; Rajaseenivasan, T.; Karthik, N.; Periyannan, M.; Gowtham, M. Stand alone triple basin solar desalination system with cover cooling and parabolic dish concentrator. Renew. Energy 2016, 90, 157–165. [Google Scholar] [CrossRef]
  26. Rafiei, A.; Loni, R.; Mahadzir, S.B.; Najafi, G.; Pavlovic, S.; Bellos, E. Solar desalination system with a focal point concentrator using different nanofluids. Appl. Therm. Eng. 2020, 174, 115058. [Google Scholar] [CrossRef]
  27. Hanshik, C.; Jeong, H.; Jeong, K.-W.; Choi, S.-H. Improved productivity of the MSF (multi-stage flashing) desalination plant by increasing the TBT (top brine temperature). Energy 2016, 107, 683–692. [Google Scholar] [CrossRef]
  28. Darawsheh, I.; Islam, M.D.; Banat, F. Experimental characterization of a solar powered MSF desalination process performance. Therm. Sci. Eng. Prog. 2019, 10, 154–162. [Google Scholar] [CrossRef]
  29. Abdul-Wahab, S.A.; Reddy, K.V.; Al-Weshahi, M.A.; Al-Hatmi, S.; Tajeldin, Y.M. Development of a steady-state mathematical model for multistage flash (MSF) desalination plant. Int. J. Energy Res. 2012, 36, 710–723. [Google Scholar] [CrossRef]
  30. Natarajan, S.K.; Thampi, V.; Shaw, R.; Kumar, V.S.; Nandu, R.S.; Jayan, V.; Rajagopalan, N.; Kandasamy, R.K. Experimental analysis of a two-axis tracking system for solar parabolic dish collector. Int. J. Energy Res. 2019, 43, 1012–1018. [Google Scholar] [CrossRef]
  31. Banat, F.; Jwaied, N. Exergy analysis of desalination by solar-powered membrane distillation units. Desalination 2008, 230, 27–40. [Google Scholar] [CrossRef]
  32. Hosseini, A.; Banakar, A.; Gorjian, S. Development and performance evaluation of an active solar distillation system integrated with a vacuum-type heat exchanger. Desalination 2018, 435, 45–59. [Google Scholar] [CrossRef]
  33. Gholamalizadeh, E.; Chung, J.D. Exergy analysis of a pilot parabolic solar dish-Stirling system. Entropy 2017, 19, 509. [Google Scholar] [CrossRef] [Green Version]
  34. Morad, M.M.; El-Maghawry, H.A.M.; Wasfy, K.I. A developed solar-powered desalination system for enhancing fresh water productivity. Sol. Energy 2017, 146, 20–29. [Google Scholar] [CrossRef]
  35. Al Ghamdi, A.; Mustafa, I. Exergy analysis of a MSF desalination plant in Yanbu, Saudi Arabia. Desalination 2016, 399, 148–158. [Google Scholar] [CrossRef]
  36. Kabeel, A.E.; Khairat Dawood, M.M.; Ramzy, K.; Nabil, T.; Elnaghi, B.; elkassar, A. Enhancement of single solar still integrated with solar dishes: An experimental approach. Energy Convers. Manag. 2019, 196, 165–174. [Google Scholar] [CrossRef]
  37. Bahrami, M.; Madadi Avargani, V.; Bonyadi, M. Comprehensive experimental and theoretical study of a novel still coupled to a solar dish concentrator. Appl. Therm. Eng. 2019, 151, 77–89. [Google Scholar] [CrossRef]
  38. Gorjian, S.; Ghobadian, B.; Jamshidian, F.J.; Sharon, H.; Saadi, S. Performance evaluation and economics of a locally-made stand-alone hybrid photovoltaic-thermal brackish water reverse osmosis unit. Clean. Eng. Technol. 2021, 2, 100078. [Google Scholar] [CrossRef]
Figure 1. (a) Schematic view of the small-scale MSF desalination unit with two stages, (b) The MSF experimental setup containing main components.
Sustainability 13 11295 g001
Figure 2. Photo of the fabricated solar PDC which was used as a heat source in this study.
Sustainability 13 11295 g002
Figure 3. Schematic view and photo of the conical cavity receiver employed in the PDC.
Sustainability 13 11295 g003
Figure 4. Schematic representation of the developed solar PDC-MSF desalination unit in this study.
Sustainability 13 11295 g004
Figure 5. Stream flows throughout the MSF desalination unit (0: Feedwater, 1–2: Preheated feedwater, 3–4: Hot water at TBT, 5–6: Discharged brine, 7–8: Produced distillate water).
Sustainability 13 11295 g005
Figure 6. Measured temperatures of the flowing water at the inlet and outlet of the PDC (day: 9 July 2020).
Sustainability 13 11295 g006
Figure 7. Measured temperatures flowing water at the inlet and outlet of the PDC (day: 11 July 2020).
Sustainability 13 11295 g007
Figure 8. Measured temperatures of flowing water at the inlet and outlet of the PDC (day: 14 July 2020).
Sustainability 13 11295 g008
Figure 9. TBT variation with environmental data for days of 9th, 12th and 14th of July 2020.
Sustainability 13 11295 g009
Figure 10. Variations of TBT with solar radiation measured during experiments.
Sustainability 13 11295 g010
Figure 11. Daily distillate production of the system and corresponding vacuum pressures during evaluations.
Sustainability 13 11295 g011
Figure 12. Average daily energy and exergy efficiency for the PDC.
Sustainability 13 11295 g012
Table 1. Characteristics of the employed PDC and its conical cavity receiver.
Conical Cavity ReceiverParabolic Dish Concentrator
ParameterValueParameterValue
Receiver diameter140 mmDish diameter1.8 m
Cavity length140 mmFocal point1.35 m
Outer diameter of the tube10 mmHeight0.15 m
Inner diameter of the tube8 mmCurve angle36.87°
Tube typeCopperReflector area2.61 m2
Table 2. Accuracies and ranges of the measuring instruments.
InstrumentResolutionAccuracyRange
K-type thermocouple0.25 °C±1.5 °C0–1000 °C
Solar power meter0.1 W/m2±0.11 W/m20–2000 W/m2
Anemometer0.1 m/s±0.2 m/s0.9–35 m/s
MAX6675 thermocouple module0.25 °C8 LSBs0 to 1024 °C
Water quality meter
EC meter0.1 mS±2% full scale0–200 mS
TDS meter0.1 ppm±2% full scale0–200,000 ppm
DO meter0.1 mg/L±0.4 mg/L0–20 mg/L
pH meter0.01 pH±0.02 pH0–14 pH
Table 3. Values of the operational parameters during experiments.
Test ParametersRuns
No. 1No. 2No. 3No. 4No. 5No. 6
Date (The year 2020)9 July11 July12 July14 July17 July20 July
Feedwater flow rate (L/min)0.711.30.711.3
Vacuum pressure (kPa)000101010
Table 4. Quality parameters of the produced distillate during six days of evaluation.
DateTDS (ppm)EC (µs)pHDO (mg/L)
9 July92137.36.93
11 July3349.46.23.4
12 July140.86.42.7
14 July110.66.62.5
17 July100.66.83.5
20 July100.56.53.1
Table 5. Properties and exergy flow rates of streams throughout the MSF desalination unit.
StreamTemperature (K)Salinity (ppm)Mass Flow Rate (kg/min)Specific Enthalpy, h, (kJ/kg)Specific Entropy, s, (kJ/kg K)Specific Exergy, Ψ (kJ/kg)Exergy Flow Rate
(Ex-kW)
030340,0000.7118.257450.4179400
131540,0000.71660.5653.1610.0369
231540,0000.71660.5653.1610.0369
3366.7540,0000.7373.9541.17625.890.30205
4366.7540,0000.7373.9541.17625.890.30205
532341,0000.7198.289440.682−0.0178−0.0002077
630341,0000.7118.254630.41801−0.02404−0.0002804
7323110.01073198.544420.6732.9660.005304
8303110.01073118.464720.409622.7290.000488
Table 6. The total cost of the MSF desalination plant.
ComponentUnitQuantityTotal Cost (US$)
AbsorberUnit131.16
ConcentratorUnit127.32
Chassis of systemUnit115.43
DC motor and gearUnit19.64
Sun tracking systemUnit112.5
MSF chamberUnit231.84
Condenser tubem2568.65
Insulationm22.612.71
Fittings and valvesUnit1427.61
Welding and installation fee--16.84
Total direct cost (DC) 253.7
Table 7. Assumptions for economic analysis.
ParameterUnit
Plant availability95%
Interest rate5% and 10%
Plant daily production8 L/day
Electrical cost0.02 US$/kWh
Table 8. Price of produced water and reduction percentage for different treatment capacity.
Treatment Capacity (L/day)Price of Produced Water (US$/m3)Reduction Percentage (%)
837-
80001.595.94
Table 9. The review of different solar desalination plants.
Proposed Desalination SystemExperiment’s DurationProductivityWater Cost
(US$/m3)
Refs.
Compact single effect thermal desalination plant + Hexagonal non-imaging heliostat7:00–17:0075 L/day-Cioccolanti and Renzi [16]
Flash desalination unit + Nano-fluid-based solar collector6:00–16:007.7 L/day11.68Kabeel and El-Said. [20]
Triple basin glass solar still + Parabolic dish concentrator + PV panel9:00–17:0016.94 L/day147.5Srithar et al. [25]
Single solar still + Two identical PDC with conical tanks + four PV modules (1000 W output)6:00–22:0013.63 L/day-Kabeel et al. [36]
A solar still mounted at the focal point of a PDC with a diameter of 3 m8:30–17:3050 L/day-Bahrami et al. [37]
Solar distillation system + Solar parabolic trough concentrator + Vacuum-type heat exchanger with falling film technique10:00–2:301.5 L/day-Hosseini et al. [32]
Stand-alone hybrid photovoltaic-thermal RO10:00–13:0041.4 L/day13Gorjian et al. [38]
Solar still + Cooling system + Flat-plate reflector8:00–17:004.42 kg/m2-Ketabchi et al. [9]
Two-stage flashing unit with vacuum + PDC10:00–15:003.22 L/day38Present study
Publisher’s Note: MDPI stays neutral with regard to jurisdictional claims in published maps and institutional affiliations.

