
A New Design Concept of an Ecological Corridor for Frogs to Improve Ecological Conservation


1
Department of Civil Engineering, Feng Chia University, No. 100, Wenhwa Rd., Seatwen, Taichung 40724, Taiwan
2
Department of Intelligent Production Engineering, National Taichung University of Science and Technology, No. 129, Sec. 3, Sanmin Rd, North Dist., Taichung 40401, Taiwan
*
Author to whom correspondence should be addressed.
Sustainability 2021, 13(20), 11175; https://doi.org/10.3390/su132011175
Submission received: 19 August 2021
/
Revised: 28 September 2021
/
Accepted: 4 October 2021
/
Published: 10 October 2021
Abstract
:Ecological corridors are an essential element in conserving the biodiversity and proper functioning of ecosystems. Without their connectivity, a very large number of species would not have access to all of the habitats needed for their life cycles. Although the concept of an ecological corridor has been discussed for many years, few studies on ecological corridors for frogs have been conducted. Frogs are often considered to be a keystone species. They are a good indicator of habitat health, and they are often the first to be harmed by pollution or ecosystem deterioration. However, there have been reports of frogs crossing ecological corridors and being attacked or consumed by natural enemies. It is vital to create ecological corridors for frogs that allow them to migrate quickly and safely. The purpose of this study was to propose a new ecological corridor design concept for frogs to address the limitations mentioned above. In this paper, grey system theory was employed to offer the necessary information for the frog ladder’s design. In addition, the frog’s high jump capacity and its defense mechanisms against natural enemies were used to determine the rest space and shelter.
1. Introduction
As populations grow, many indigenous environments are becoming human-dominated. Many of the environmental effects of human activities are visible, resulting in dramatic shifts in species composition, abundance, and variety in many ecosystems [1,2,3,4,5]. These years, great concern has been focused on the global decline of many amphibian populations [6,7,8,9,10]. Amphibian extinction is widely recognized as a result of habitat damage, and several species are currently experiencing population decrease, shrinkage, or even extinction [11,12].
Because amphibians contribute to the trophic dynamics of both terrestrial and aquatic habitats, their loss is likely to have a considerable impact on other creatures. Researchers in various nations are trying to figure out what is causing amphibian loss and how to manage and restore their habitats [13,14,15].
In Taiwanese ecosystems, amphibians have traditionally played an important role [16,17,18,19]. Because amphibians dwell both in water and on land, the condition of the bank that connects the two is critical to their survival. Threats to amphibian habitats have increased in recent years, such as the use of concrete as a building material on lakeshores. The amphibians’ habitats have been altered as a result of these threats. However, little research has been done in Taiwan on the influence of these structures on amphibian decline.
According to the literature reviewed in this article, conservation studies on frogs have focused on frog climbing capacity, bank substrate, amphibian climbing stairs, and environmental variables. Scholars hope to advise engineers on frog-friendly slope engineering design, bank substrate materials, and ecological corridors that are suitable for frogs based on the frog’s behavioral abilities.
Chang et al. [20] selected eight amphibian species and surveyed their climbing capacity to improve lake and riverbank design. The researchers tested their ability to climb at five different angles of the slope and found a link between amphibian reptile ability and the bank substrate, which included Japanese silver grass (Miscanthus floridulus) mixed with moss, cobblestone, wood (Philippine mahogany), clay, and concrete, under high humidity and different temperatures to simulate changes throughout the year. Chuang and Chang [21] compared the morphological characteristics of two Ranidae species, Rana latouchtii and Rana adenopleura, using grey system theory. One of the goals of the above study was to determine whether grey system theory can be used to improve understanding of the relation between R. latouchtii and R. adenopleura. The findings of the experiments suggest that grey system theory can be used to accurately approximate frog physical properties. This means that the application of grey system theory can be extended from geotechnical engineering to frog protection. In other words, grey system theory could possibly help engineers to build a habitat that considers the needs of geotechnical engineering, slope failure, and habitat conservation.
In order to provide the necessary information for amphibians to cross the risk profile, Chang et al. [22] designed an amphibian staircase to study the behavior patterns of two types of amphibians on different bedrock types and slopes, thus helping to balance ecosystems. The results show that the maximal climbing angle of the frog is useful information for the design of amphibian climbing stairs.
To investigate the link between amphibian behavioral capacity and environmental variables, Hou et al. [18] selected an endemic species, Chirixalus idiootocus, as an indicator. They discovered that substrates and climatic conditions were important factors in the activities of C. idiootocus, and they suggested that more comprehensive studies and experiments involving various species be carried out to learn more about how local climate, lake shore, and river bank conditions affect amphibian activities. This will result in better riparian bank management, which is especially important given how many urban rivers have been altered.
The concept of ecological corridors has been discussed and investigated by many researchers [23,24,25]. Chang et al. [22] investigated two species of amphibians to provide information for the design concept of an amphibian corridor. The results showed that an amphibian corridor should be designed as a side slope and have three functions: (1) interrupting high mountain rapids to lessen direct impacts on amphibians while also improving climbing abilities; (2) increasing the climbing capabilities of local amphibians, for which the suitable slope angle should be examined; and (3) acting as retaining walls while also increasing dissolved oxygen levels in the water by allowing water to splash on the stone surfaces.
The concepts of eco-passages for amphibians have been mentioned in the literature; however, there has been very little research to discuss the inclusion of hiding spaces for when natural enemies attack, or rest spaces for when traveling is too demanding [26]. The purpose of this study was to offer a new ecological corridor design concept for frogs that would address the limitations mentioned above. Many research investigations and ecological documents show that when frogs are on the move, they are occasionally attacked by natural enemies. Frogs will utilize their innate and exceptional high and long jumping talents to try to flee or hide behind rocks, piles, or caves at this time. This study was motivated by this fact; as a result, we launched a new design concept of a frog ladder that combines corridor migration with fast movement, escape, and rest spaces.
2. Materials and Methods
2.1. Sampling and Grouping
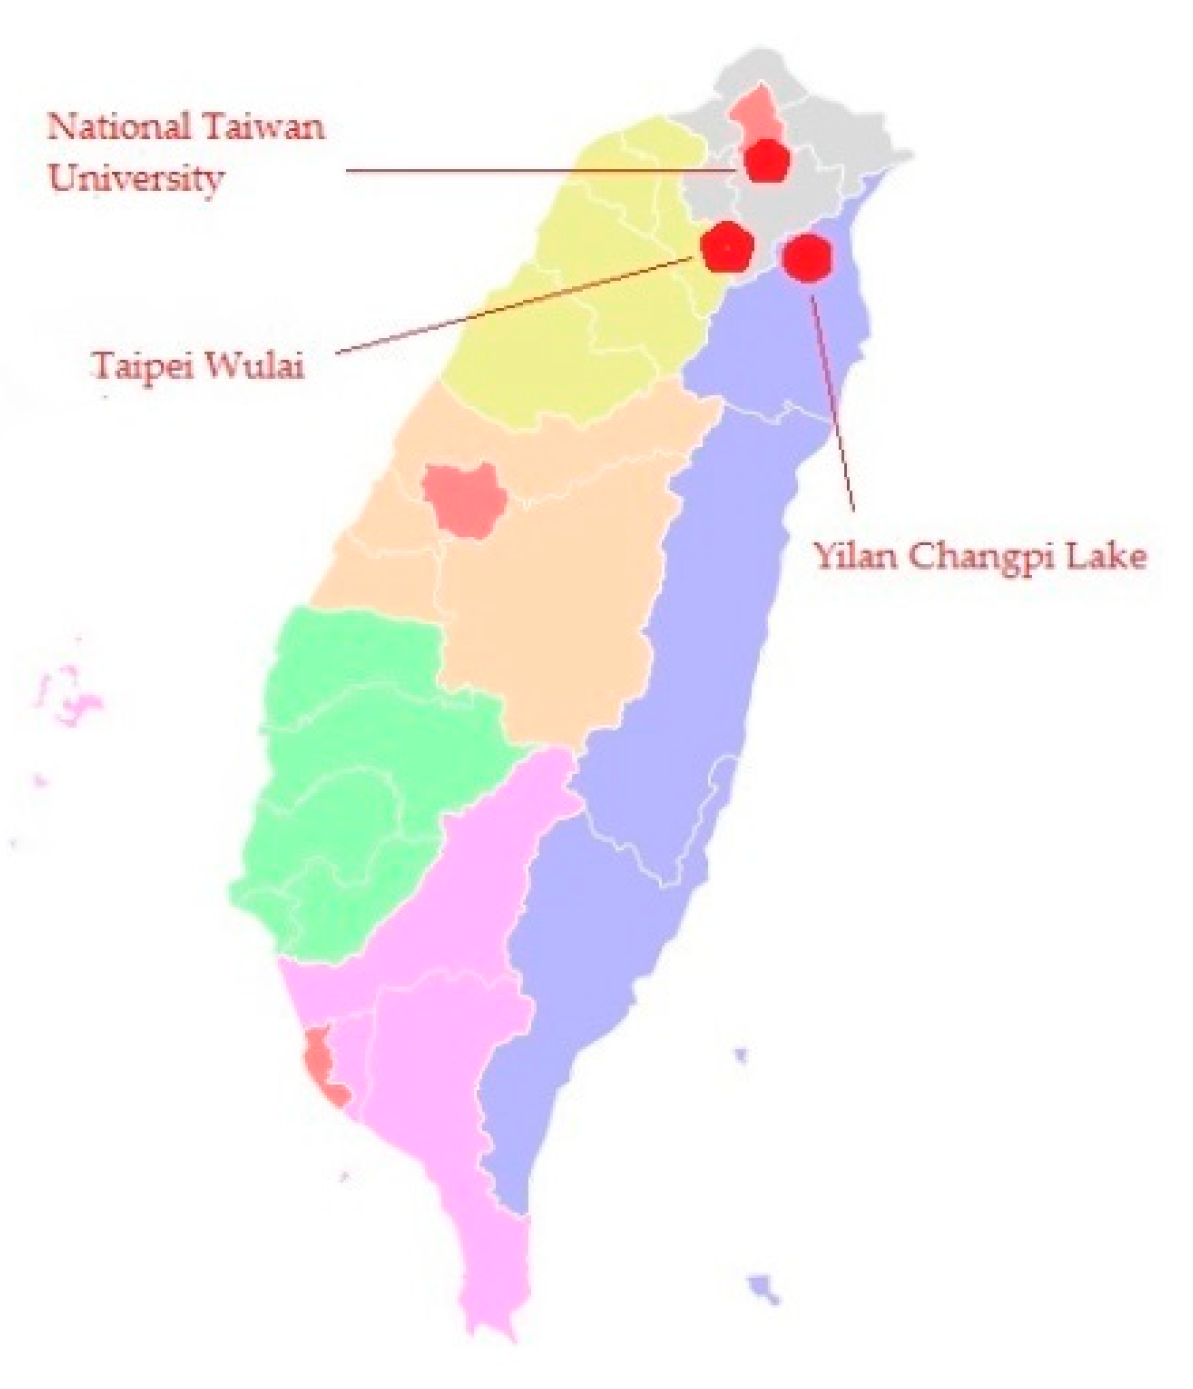
Two Ranidae species, K. idiootocus and B. japonic, were investigated at National Taiwan University (north of Taiwan) as described in this article in order to provide information for the construction of a frog ladder. K. idiootocus was discovered in Yilan Changpi Lake, at latitude 24.646930 N and longitude 121.613123 E. B. japonica was caught in the Taipei Wulai mountain area at latitude 24.862293 N and longitude 121.550802 E. (Figure 1). To keep the description concise and easy to comprehend, this article focuses on two species that are easily found in low- and medium-altitude small ditches and streams in Taiwan. Engineers or researchers can still design a frog ladder for more species using the techniques proposed in this study.
Four climatic environments were simulated: high temperature and high humidity; high temperature and low humidity; low temperature and high humidity; and low temperature and low humidity. The four environmental variables were reviewed in order to assess frog climbing abilities in various climates. From the test results, the two species of frogs have lower climbing capacity in low-temperature and low-humidity settings. As a result, the climbing capacity of frogs in low-temperature and low-humidity environments was researched in order to offer data for frog ladder construction. Using Taiwan’s climate data, winter low-temperature and low-humidity conditions were simulated; the specific simulated conditions were a temperature of 16 °C and 0% humidity.
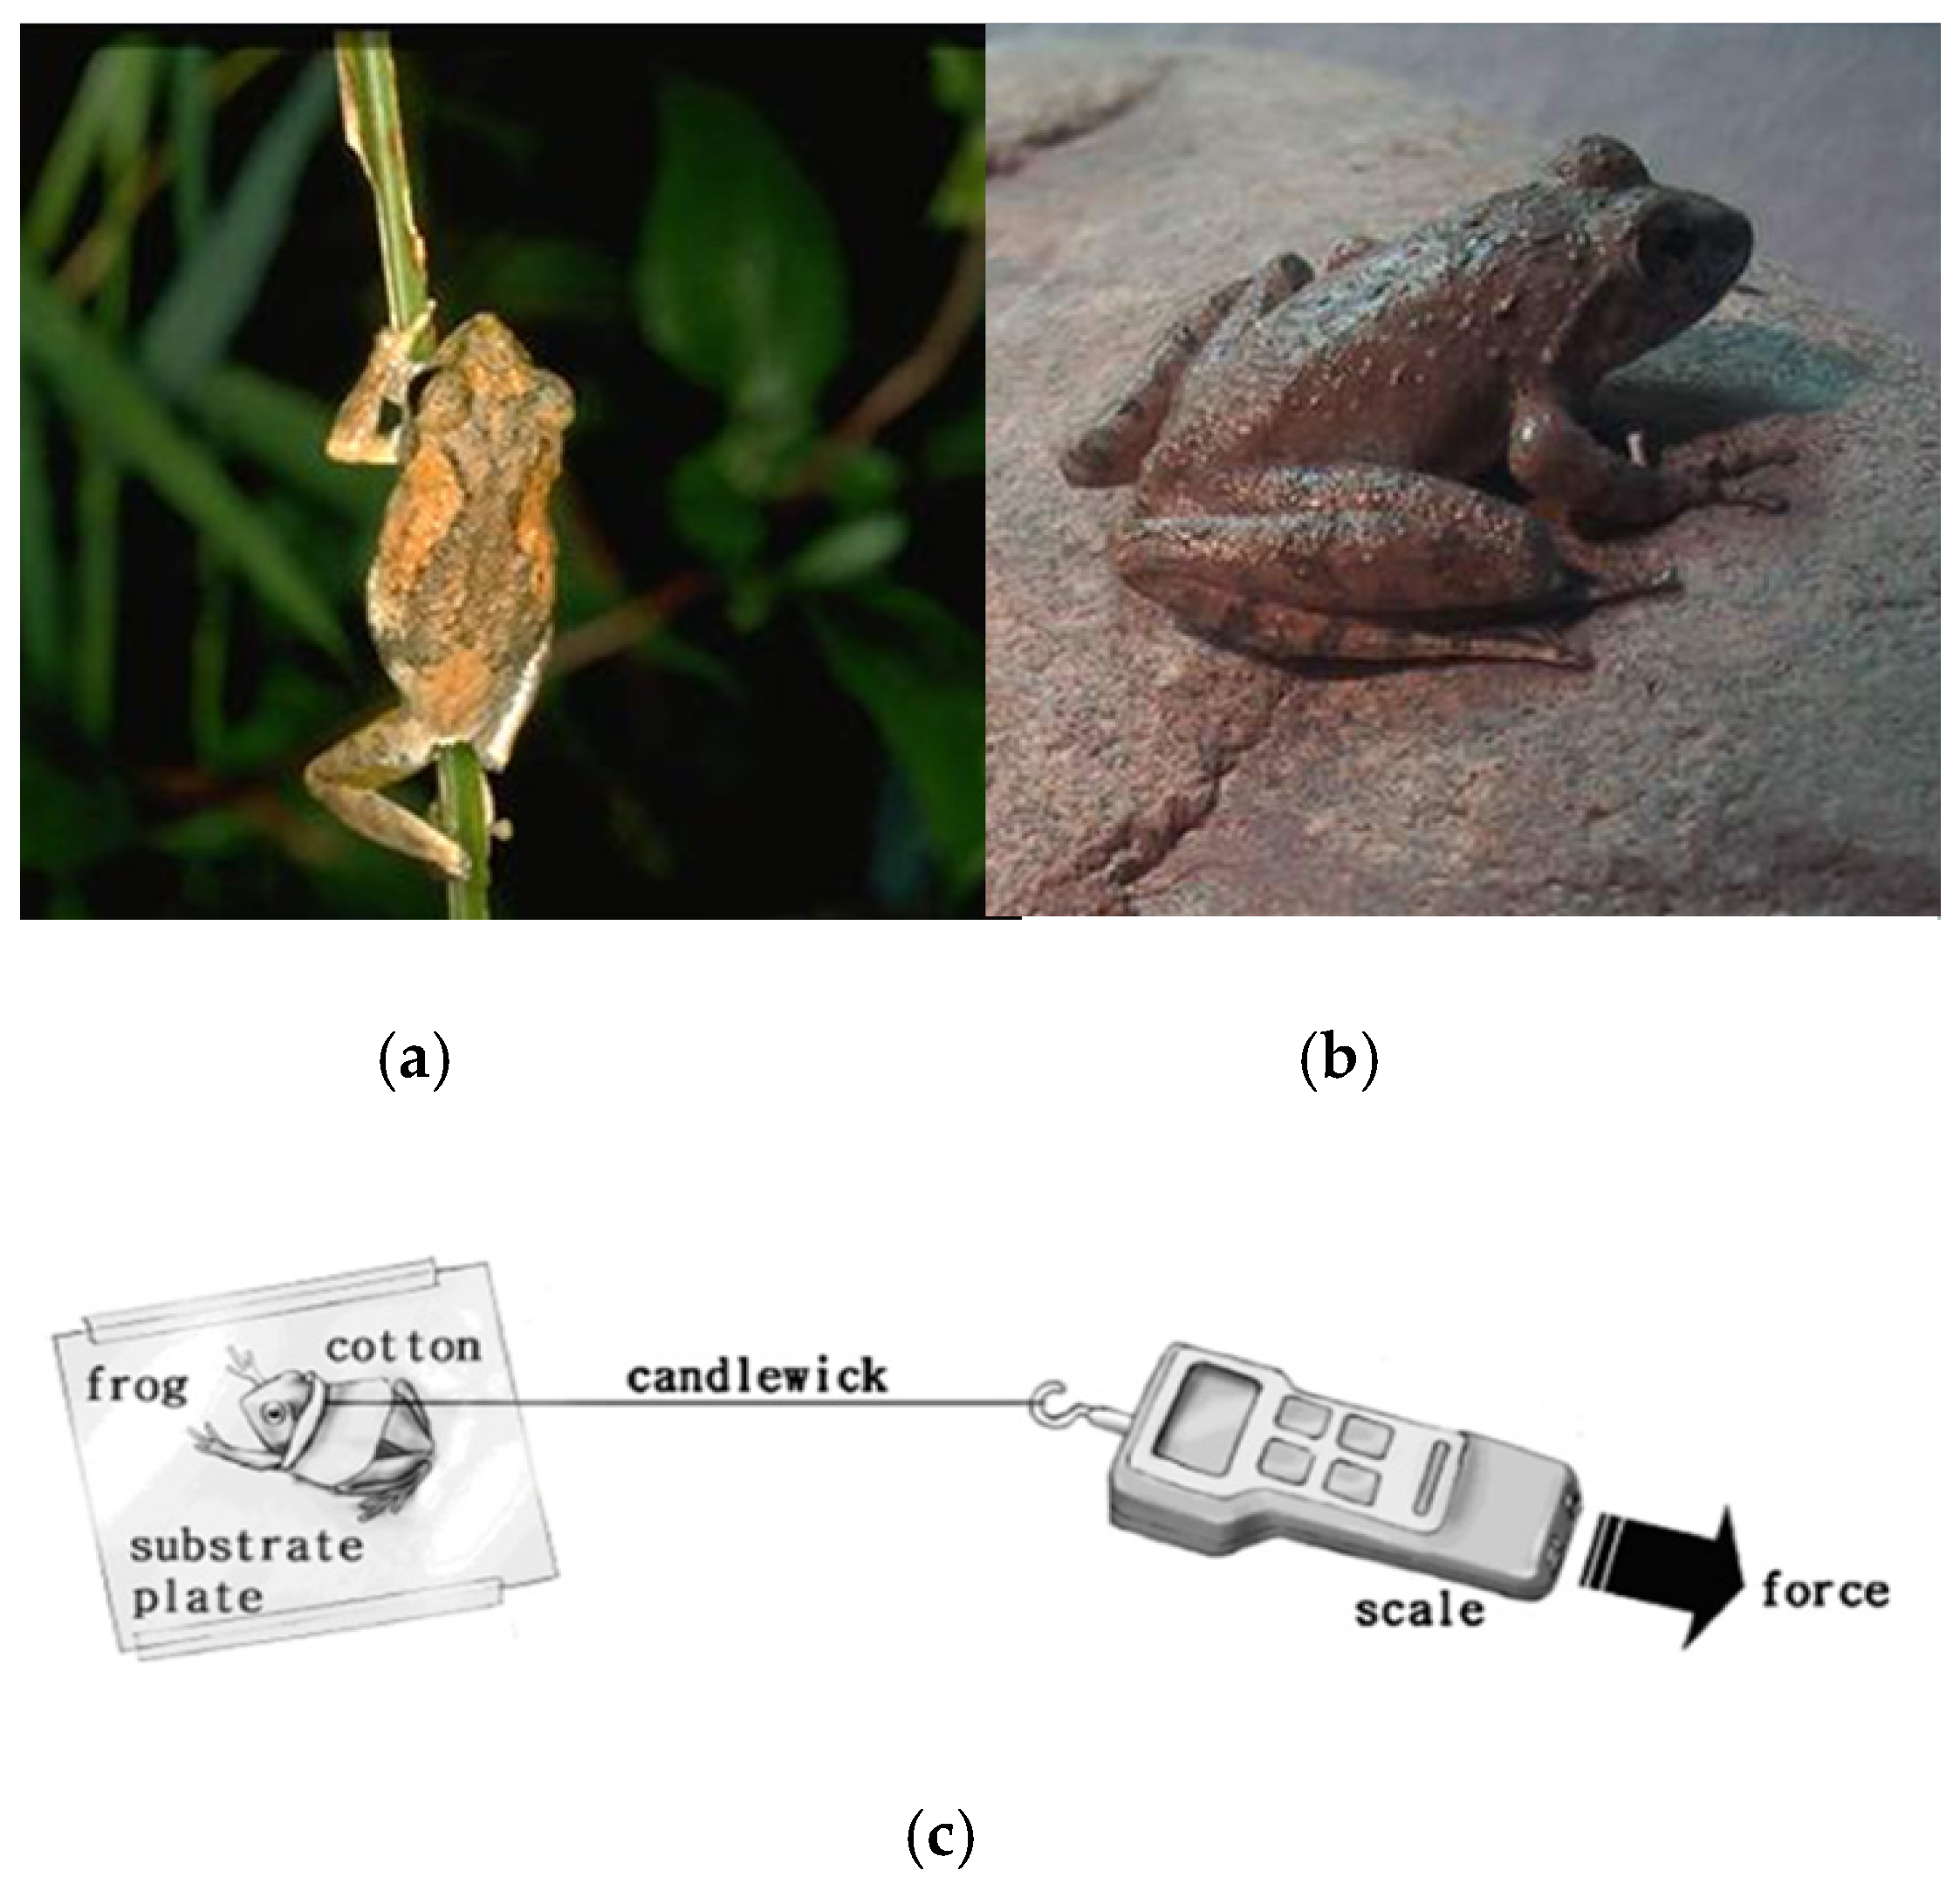
K. idiootocus (Figure 2a) is an endemic species widely distributed in lowlands and mountains below 2000 m above sea level. Its breeding season is from February to September. Males call on grasses or bushes near ditches, rice fields, marshes, and pools with extensive vegetation. Eggs are laid on the ground in a depression. Newly hatching tadpoles are flooded to water by rain. The clutch size is about 100–300 eggs [27]. B. japonica (Figure 2b) is a common species distributed widely from lowlands to forests below 1500 m above sea level. Its breeding season is from February to September but can extend to year-round in some places. They usually breed in slowly flowing water, including ditches and small streams. Eggs are deposited in small clumps on the bottom of the water or attached to vegetation [28].
Patch and on-site sampling procedures proposed in [16] were used to estimate sample counts and measurement durations. The quantitative requirements regarding biological samples for field experiments were calculated using the Amphibians Resource Survey Handbook [16,29].
Thirty male and nine female individuals of K. idiootocus and the same number of B. japonic were gathered in WuLai Distribution. The 78 specimens that were gathered were coded and kept in the tank. Long-term laboratory observations may alter the behavioral capacity of these creatures [16,29]; hence, follow-up laboratory experiments were undertaken within 14 days following capture. All living things were returned to their original location once the experiment was completed.
2.2. Experiments
Before grouping, the body height, weight, high jump ability, and long jump ability were measured and recorded (as indicated in Table 1). The body weights and straight body lengths of the samples were measured using an electronic scale and a Vernier caliper, respectively. Paper tubes with diameters varying from 5 to 18 cm, spun from 1 mm thick cardboard, with heights varying from 3 to 60 cm, were used to measure jumping heights. Each paper tube was 2 cm taller than the last. Five leaps were assessed at 1 min intervals using grass as a trigger, and the average was calculated. In order to determine the leaping length, the specimen was fixed in place on a 200 × 200 cm flat board, and the average distance of five long jumps was measured [17].
A simple equipment setup was used to measure the amphibians’ climbing capabilities ([30]; Figure 2c and Table 1). Clay, grass, cobblestone, and wood were chosen as the substrates, and bank slopes of 15, 30, 45, 60, and 75° were chosen [20]. Each organism was wrapped in damp fabric and secured with a cotton string to an electronic spring scale. The climbing ability was measured by gradually pulling up the scale at one-minute intervals. The average value of the five transitions was determined in N. Throughout all of the trials, the amphibian skin stayed wet.
2.3. Methodology
In this article’s frog ladder design, the first step was to collect frogs, then to test the various behavioral characteristics of the frogs; following that, we used grey theory to determine the stair dimensions of the frog ladder and to determine the appropriate substrates from the frog’s climbing ability. In addition, the frog’s high jump capacity and its defense mechanisms against natural enemies were used to determine the rest space and shelter.
For the statistical analysis, the Independent Samples t-test was adopted in this study. The purpose of the above test was to determine whether there is a significant difference between the variables (the physical character and behavioral variables) of B. japonic and K. idiootocus. The research hypothesis is as follows: There are significant statistical differences between the physical character variables (weight and length) and the behavioral ability variables (high jump, long jump, and climbing abilities) of B. japonic and K. idiootocus.
3. Grey System Theory and Statistical Analysis
3.1. Grey System Theory
Deng proposed grey system theory as an interdisciplinary scientific field in the early 1980s [31]. Because of its ability to handle elements of the system with unknown characteristics, the theory has gained a lot of traction since then. A grey model, in particular, uses few data to estimate the behavior of an unknown system [32]. Grey system theory has rapidly evolved over the last two decades, attracting the attention of many academics. It has been employed in a variety of systems, including social, economic, financial, scientific and technological, agricultural, industrial, transportation, mechanical, meteorological, ecological, hydrological, geological, medical, and military [33]. This new theory has spread in the following ways: Some universities in Australia, China, Japan, Taiwan, and the United States began offering grey system theory courses in the early 1990s. In 1996, the Chinese Grey System Association (CGSA) was founded [33]. Every year, the CGSA hosts a conference on grey system theory and applications. In 1989, an academic journal called The Journal of Grey System was launched in England to disseminate study findings. Furthermore, more than 300 academic journals around the world accept and publish publications about the grey system [33].
Grey-relational analysis [32] is mostly used to perform a relational analysis of a system model’s uncertainty and information incompleteness. It can generate discrete sequences to deal with uncertainty, multivariable inputs, and discrete data correlation analysis [33]. As a result, grey-relational analysis is a method for determining whether or not uncertain discrete sequences are consistent with their objects. All sequences in a given grey relational analysis group should fulfil the criteria of being dimensionless, scalable, and polarizable [32].
3.2. Statistical Analysis
The Independent Samples t-test was adopted in this study. The Independent Samples t-test compares the means of two independent groups (in our case, male B. japonica and male K. idiootocus) in order to determine whether there is statistical evidence that the associated population means are significantly different.
4. Results and Discussion
4.1. Experimental Results
The experimental results of this study (Table 1) revealed that male and female frogs have quite varied physical characteristics and climbing abilities. Male K. idiootocus (Table 1) frogs have an average weight of 1.35 g, whereas female frogs have an average weight of 2.89 g. The average male weight is thus 46.75% of the average female weight. Furthermore, it was discovered that female frogs’ jumping and climbing abilities (slope = 15, grass) are superior to those of male frogs. B. japonic (Table 1) has physical traits that are comparable to those of K. idiootocus. Because of the evident differences between male and female frogs, for the numerical analysis, we solely used data from male frogs.
Table 1 also shows a comparison of physical traits between K. idiootocus and B. japonic for both male and female frogs. It can be seen that both male and female K. idiootocus had poorer body weight performance than B. japonicus (with ratios of 73.42% and 79.61%, respectively). The lengths of both male and female K. idiootocus, however, were greater than those of B. japonicus (with ratios of 113.77% and 123.03%, respectively). Furthermore, the climbing abilities of both male and female K. idiootocus were superior to those of B. japonicus (with ratios of 657.89% and 345.79%, respectively).
The above experimental results (Table 1) showed that the body weight and length of the two species are quite close, but the other physical characteristics are very different. Generally speaking, the climbing ability of K. idiootocus is much better than that of B. japonica. However, the jumping ability of K. idiootocus is relatively weaker than that of B. japonica. This observation provided useful material to support the general concept that K. idiootocus is quite good at climbing, but relatively weak at jumping. Perhaps this is the reason why K. idiootocus is very often found climbing railings or trees (Figure 2a). Besides this, the experimental results also showed that female frogs have stronger jumping and climbing abilities than male frogs in both species. Therefore, only the results for the male frogs were considered in the design of the frog ladder.
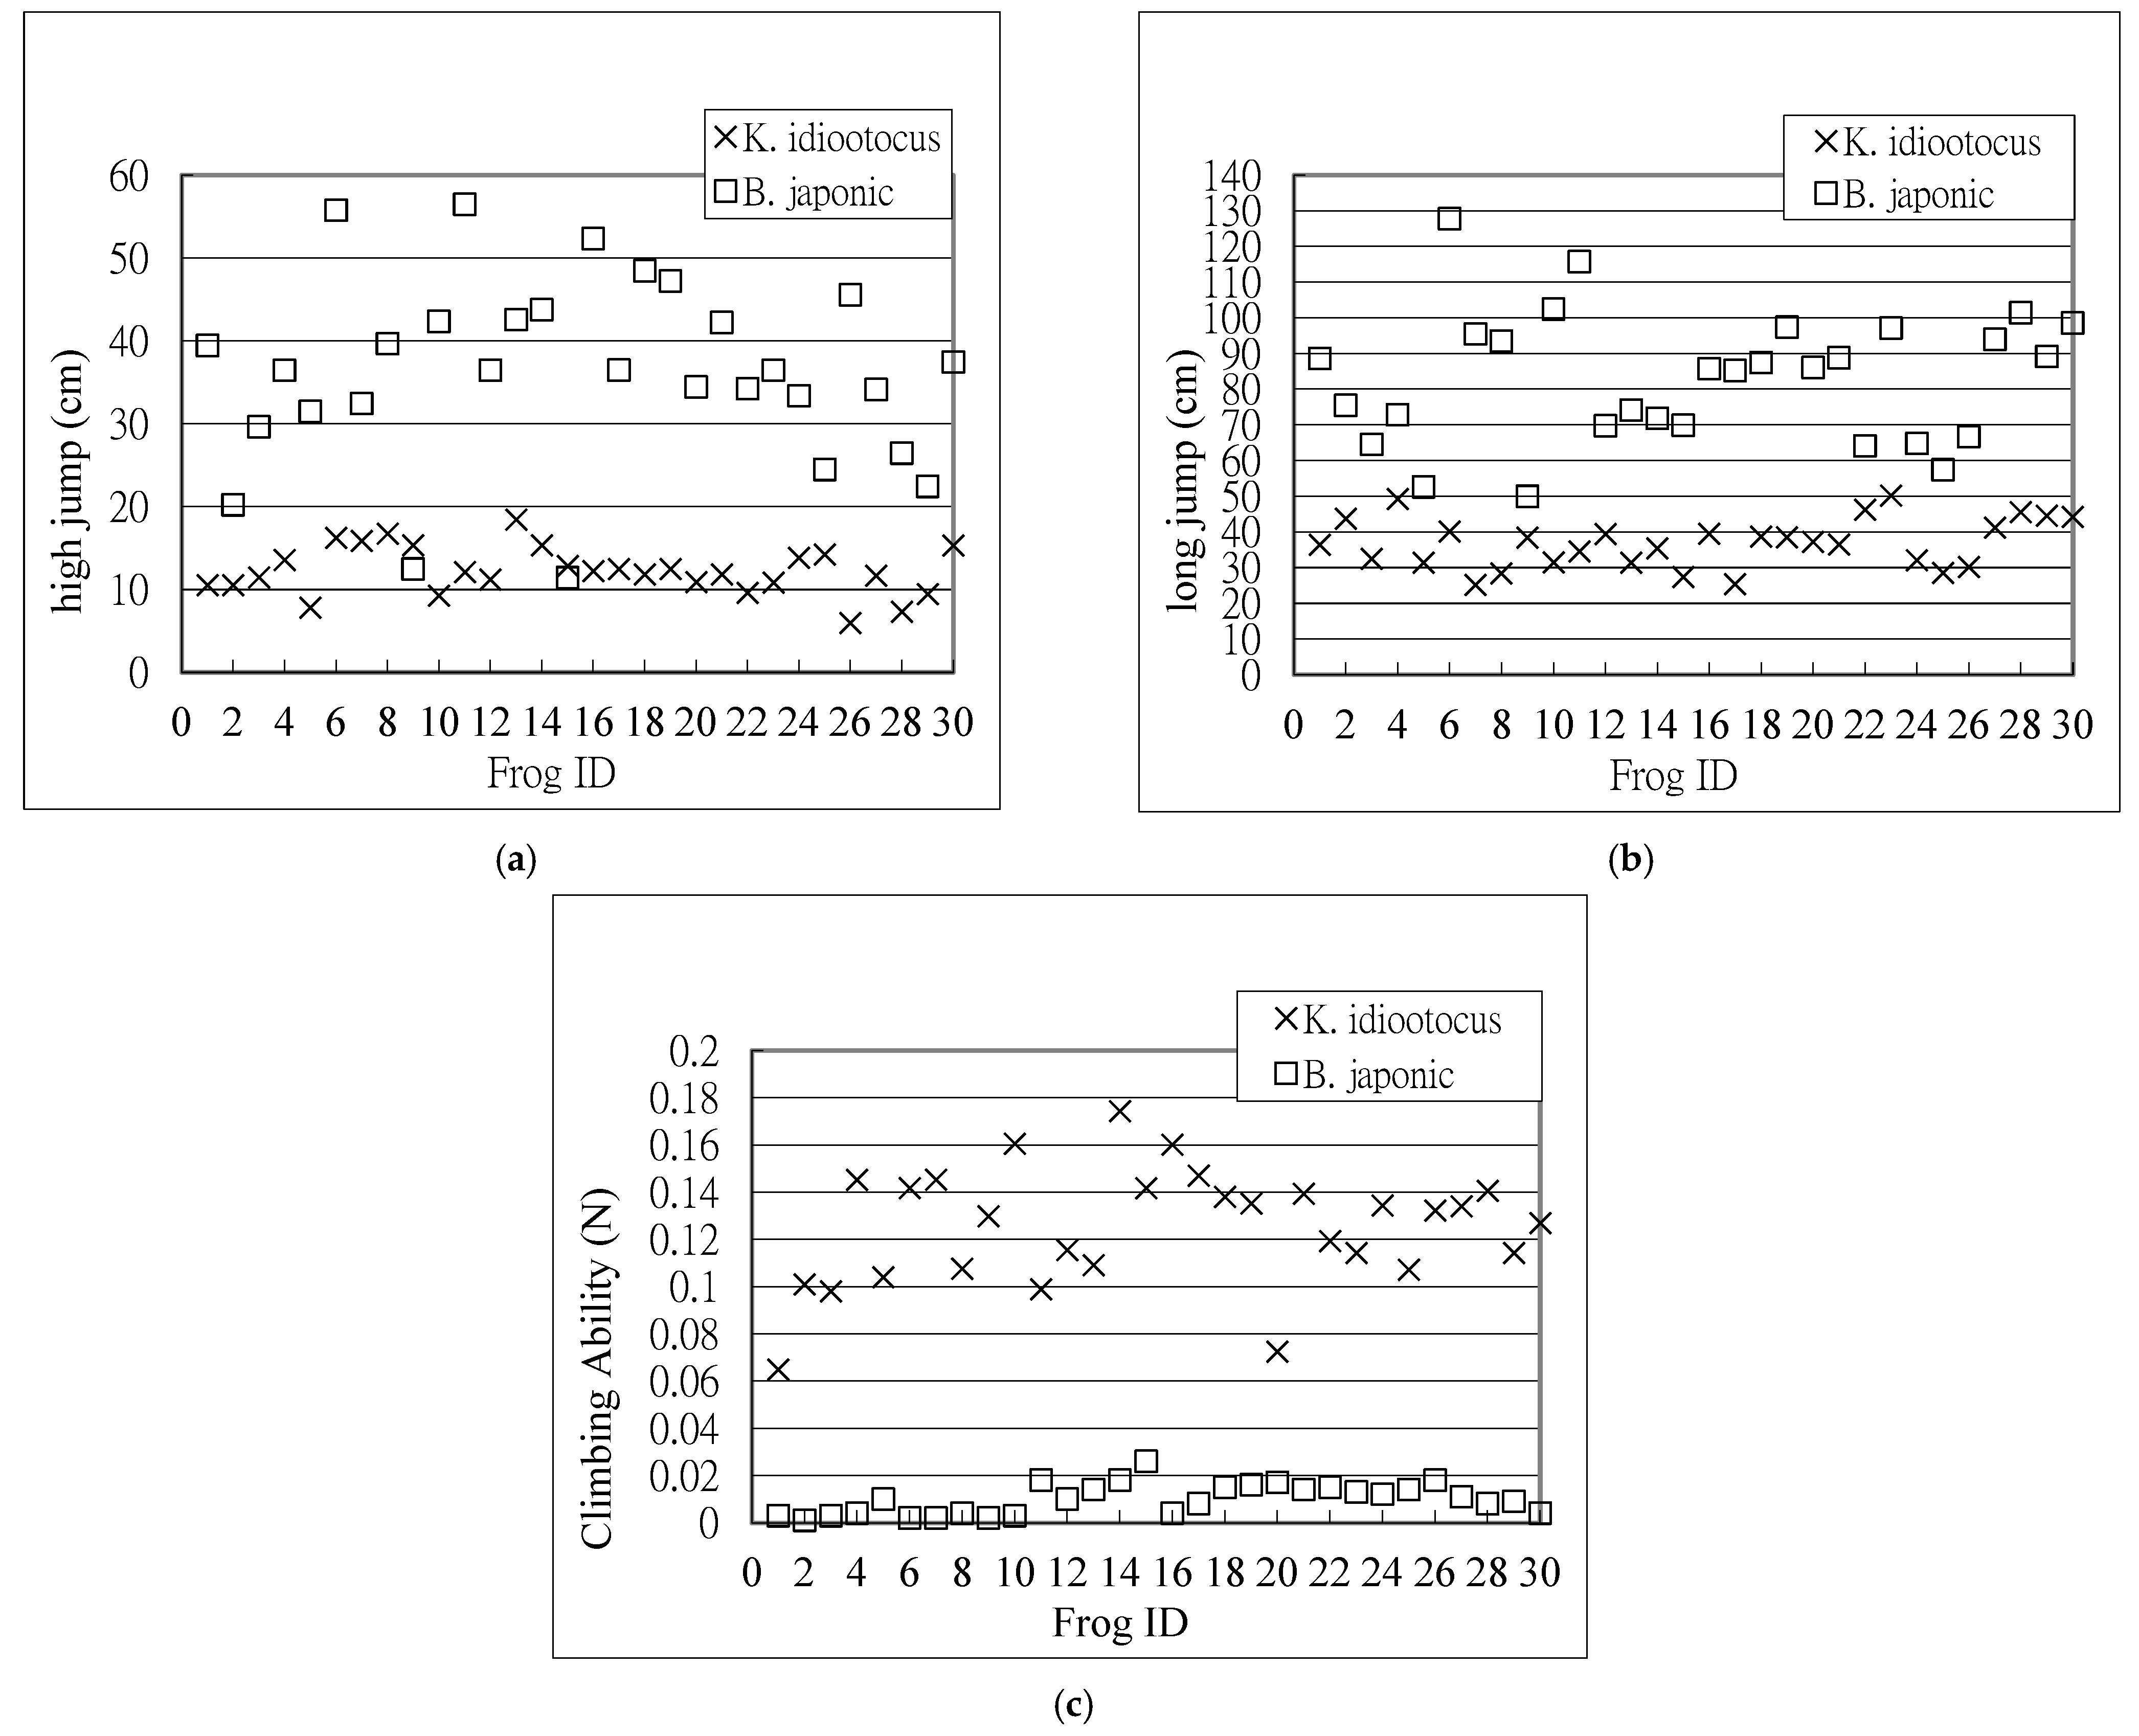
In order to further investigate the physical characteristics of each frog, the capacity (high jump, long jump, and climbing ability) for each male frog was plotted (Figure 3a–c). Again, the climbing ability of K. idiootocus is much better than that of B. japonica. However, the jumping ability of K. idiootocus is relatively weaker than that of B. japonica.
4.2. Climbing Ability of Frogs
The average climbing ability of the two male frog species is compared in Table 2. For the four substrates, it can be seen that the climbing abilities of most of the K. idiootocus were better than those of B. japonica. It can be seen that the maximum ratio for the climbing ability of K. idiootocus to that of B. japonica occurred on grass substrate, and the value was 12.78. The minimum ratio for the climbing ability of K. idiootocus to that of B. japonica occurred on clay substrate, and the value was 2.44.
4.3. Grey-Relational Analysis
Human facilities, such as human stairs, are typically subject to stringent testing and regulations. In Taiwan, each human stair step should be 15 cm high and 28 cm wide, according to regulations. By analogy, even if frogs are unable to communicate with humans, the ladders frogs pass through should be designed according to their behavioral ability. To provide the necessary information to design the stair dimensions for the frog ladder, grey system theory was used. Frogs’ capacity to escape and move is determined by their high jump, long jump, and climbing ability. As a result, frogs’ capacity can provide the necessary information for the frog ladder’s size.
For grey-relational analysis, the high jump, long jump, and climbing abilities of K. idiootocus and B. japonic obtained from experiments (Table 1) were chosen. Because female frogs have stronger behavioral abilities (high jump, long jump, and climbing ability) than male frogs, we solely used male frogs as the sample for grey-relational analysis. As can be seen, the aforementioned original data met the criteria for comparability (i.e., non-dimensionality, scaling, and polarization); as a result, the grey-relational generation process was not required. Furthermore, given that the localized grey-relational degree was accepted, the following step was to compute the reference sequence. The reference sequence was derived from the maximum value of the frogs’ behavioral abilities for both K. idiootocus and B. japonicus in this study (see Table 1). The first value of the reference sequence, for example, was 56.47 (Table 3), which represents the maximum high jump value among all the male frogs.
Table 3 shows the original grey-relational analysis results for K. idiootocus and B. japonic. In Table 4, Table 5 and Table 6, the results of grey-relational analysis are shown. As can be seen in Table 4, the minimum grey-relation grade for K. idiootocus was 0.6146 for frog No. 17, and the maximum grey-relation grade was 0.6650 for frog No. 4. This implies that frog No. 4′s physical attributes are quite close to the maximum value of the two frogs’ capacity. Furthermore, the minimum value of grey-relation grade for B. japonic was 0.6013 for frog No. 9, and the maximum value of grey-relation grade was 0.9948 for frog No. 6 (see Table 4).
The grey-relational ranks for both K. idiootocus and B. japonic are shown in Table 5. Rank 1 is frog No. 4 (X4), Rank 2 is frog No. 23 (X23), and Rank 30 is frog No. 17 (X17) for K. idiootocus. Rank 1 for B. japonic is frog No. 6 (Y6), Rank 2 is frog No. 11 (Y11), and Rank 30 is frog No. 9 (Y9).
Grey-relational analysis was utilized to generate the grey-relational grades and ranks for all 60 male frogs in order to provide useful information for the frog ladder. Table 6 presents the grey-relational ranking for all 60 male frogs. The symbols “Z1” to “Z30” in Table 6 represent K. idiootocus frogs Nos. 1~30 (i.e., X1~X30 in Table 5), while the symbols “Z31” to “Z60” represent B. japonic frogs Nos. 1~30 (i.e., Y1~Y30). Table 6 shows that Rank 1 is Y6, Rank 2 is Y11, and Rank 60 is Y9.
4.4. Results of Statistical Analysis
The results of the Independent Samples t-test available in SPSS Statistics are shown in Table 7. It shows that the group means were statistically significantly different, because the p-value in the “Sig. (2-tailed)” row is less than 0.001 (p = 0.000). This implies that the weight, length, high jump, long jump, and climbing abilities (slope = 15, grass) of K. idiootocus and B. japonic showed significant differences under the t-test.
The results in Table 7 show that the B. japonic (M = 1.839, SD = 0.318) frogs were heavier than K. idiootocus (M = 1.351, SD = 0.143) frogs. There was a statistically significant difference between B. japonic and K. idiootocus frogs (Student’s t-test, t = 7.669, p = 0.000, p < 0.001).
Secondly, the K. idiootocus (M = 2.958, SD = 0.105) frogs were longer than B. japonic (M = 2.603, SD = 0.234). There was a statistically significant difference between B. japonic and K. idiootocus frogs (Student’s t-test, t = −7.576, df = 58, p = 0.000, p < 0.001).
Thirdly, the B. japonic (M = 36.216, SD = 11.082) frogs were better in the height jump than K. idiootocus (M = 12.250, SD = 2.897). There was a statistically significant difference between B. japonic and K. idiootocus frogs (Student’s t-test, t = 11.460, df = 58, p = 0.000, p < 0.001).
Moreover, the B. japonic (M = 82.977, SD = 18.245) frogs were better in the long jump than K. idiootocus (M = 36.819, SD = 6.914). There was a statistically significant difference between B. japonic and K. idiootocus frogs (Student’s t-test, t = 12.957, df = 58, p = 0.000, p < 0.001).
Lastly, the K. idiootocus (M = 0.125, SD = 0.025) frogs were better in climbing ability (slope = 15, grass) than B. japonic (M = 0.019, SD = 0.013). There was a statistically significant difference between B. japonic and K. idiootocus frogs (Student’s t-test, t = −20.640, df = 58, p = 0.000, p < 0.001).
4.5. Design of the Frog Ladder and Discussion
Figure 4 shows the frog ladder proposed in this study. The purpose of this study was to develop a frog ladder that combines corridor migration with fast movement, escape, and rest. The following issues were considered to be significant in the design of the frog ladder: the behavioral ability of the frog, the material of the ladder, and the inclusion of rest spaces and shelter.
- Behavioral ability of the frogs: Jumping and climbing abilities are important abilities used by frogs to forage and escape.
- Material of the ladder: It is expected that the climbing abilities of frogs will be different for various materials of the ladder.
- Providing rest space and shelter: This study proposes a new design concept of a frog ecological corridor that takes rest spaces and shelter into consideration.
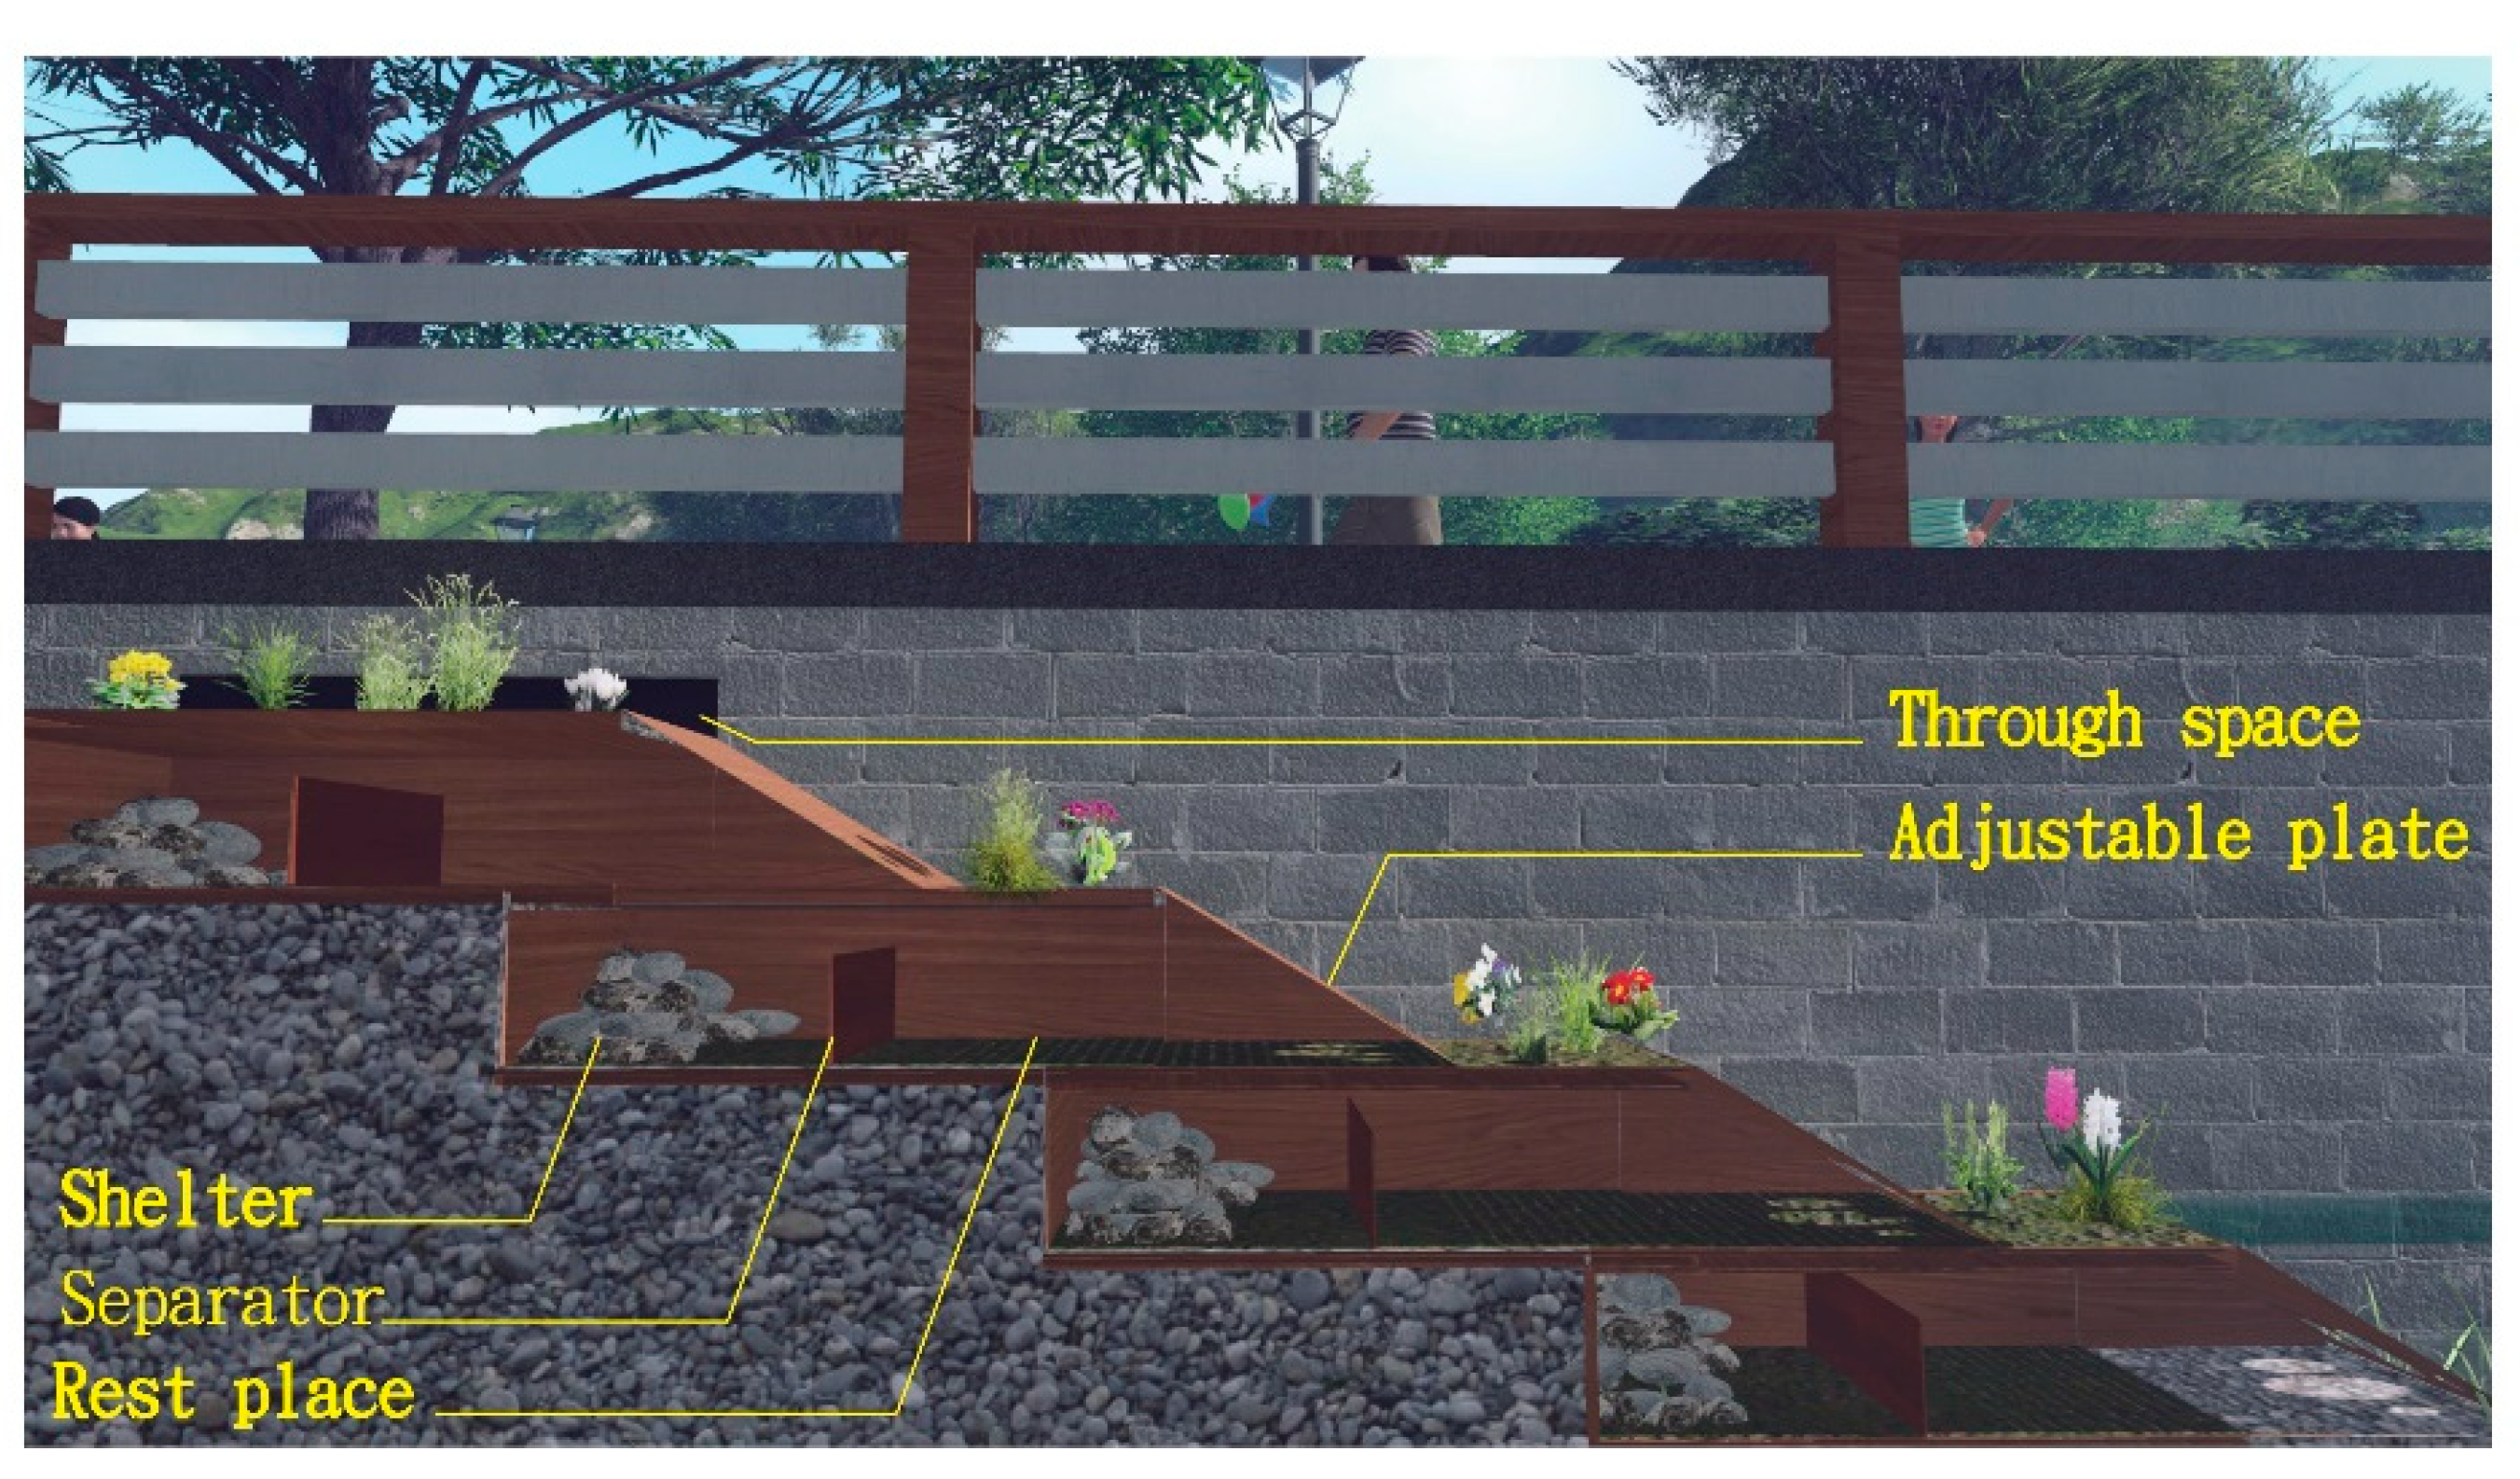
- Defense mechanisms against natural enemies of frogs: The purpose of these defense mechanisms is to prevent natural enemies (i.e., lizards, skunks, otters, etc.) from preying on the frogs. Various-sized entrance holes, a barrier wall (separator, see Figure 4), and shelter were some of the defense mechanisms (see Figure 4 and Figure 5). The various-sized entrance holes were designed to allow various-sized frogs to enter while blocking most natural enemies. As soon as the frog jumps into the entrance hole, it may simply jump beyond the barrier wall (i.e., separator, Figure 4) and hide in the shelter. Because most of the enemies have triangular heads, their mouth may be able to enter the small hole, but they will be unable to get any farther due to the limited size of the entrance hole and the blockage of the barrier wall. However, if the natural enemy at that moment is a snake, this defense mechanism could possibly impede or stop the snake’s movement because snakes move utilizing the sine function waveform. This will give the frog a little more time to escape. However, the reality of the above frog ladder will be significantly more intricate than the assumptions made here. Thus, modifying the above tentative design will necessitate a large number of trials to test this idea to improve the new concept of a frog ladder.
- Through space: The purpose of the “through space” is to help frogs to cross the road using the through space (or culvert), avoiding injury by cars.
This study will provide engineers and scholars new concepts and useful references in the design of ecological corridors.
4.6. Discussion on Designing the Frog Ladder
The following issues should be discussed in the design of a frog ladder.
- Behavioral ability of the frogs: The experimental results showed that the climbing ability of K. idiootocus is much better than that of B. japonica. However, the jumping ability of K. idiootocus is relatively weaker than that of B. japonica. Therefore, when the above two frog species appear at the designed area, the jumping ability of K. idiootocus should be considered in the design of the frog ladder. In addition, the climbing ability of B. japonica should be considered in the frog ladder design.
- Stair dimension design of the frog ladder: To allow a frog to run as swiftly as possible, the stair dimensions of the frog ladder should be as large as feasible. This will maximize the frog’s chances of escaping successfully. In this study, we assumed that the stair dimension design of the frog ladder is suggested by the top 80%, 90%, or 100% grey-relational ranking of the 60 male frogs, i.e., the top 80%, 90%, or 100% higher overall capacity of the 60 frogs. According to results of grey-relation rank (Table 6), Rank 48 (total = 60, top 80%) is frog No. 1 (X1), Rank 54 (total = 60, top 90%) is frog No. 10 (X10), and Rank 60 (total = 60, top 100%) is frog No. 17 (X17) for K. idiootocus. For K. idiootocus, the high jump and long jump of frog No. 1 (X1) were 10.54 cm and 36.47 cm, respectively. Furthermore, the high jump and the long jump of frog No. 10 (X10) were 9.26 cm and 31.48 cm, respectively, while those for No. 17 (X17) were 12.47 cm and 25.42 cm, respectively. According to the results of the grey-relation rank (Table 6), B. japonica has a higher overall capacity than K. idiootocus. As a result, the frog ladder’s stair dimension design should be dominated by K. idiootocus’ behavioral abilities. Moreover, grey-relational analysis plays a great role in suggesting the height and width for each step of the ladder. For example, if we choose the information provided by the top 80% grey-relational ranking of the frog species to design the size of the frog ladder, each step’s height and width should be 10.54 cm and 36.47 cm, respectively.
- Material of the ladder: As shown in Table 2, the climbing abilities of male B. japonica were generally worse on grass substrate (0.009) and better on cobblestone (0.024). Therefore, it is suggested that a cobblestone substrate could be adopted in the frog ladder design.
- Rest space and shelter: As shown in Figure 4, a separator should be installed between the rest space and the shelter. The rest space can provide the frog a hidden space for temporary rest. The shelter can provide the frog a space for refuge, and when encountering natural enemies, the narrow entrance and separator can play a role in blocking or retarding them. In considering the function of the separator (Figure 4), a higher separator would be better to provide more safe shelter for frogs to escape from predators. As shown in Table 1, the lowest value of the high jump of male and female K. idiootocus and B. japonica was 5.98 cm. As a result, the height of the separator might be set at the above value (i.e., 5.98 cm) to allow all of the frogs to safely jump over (Figure 4).
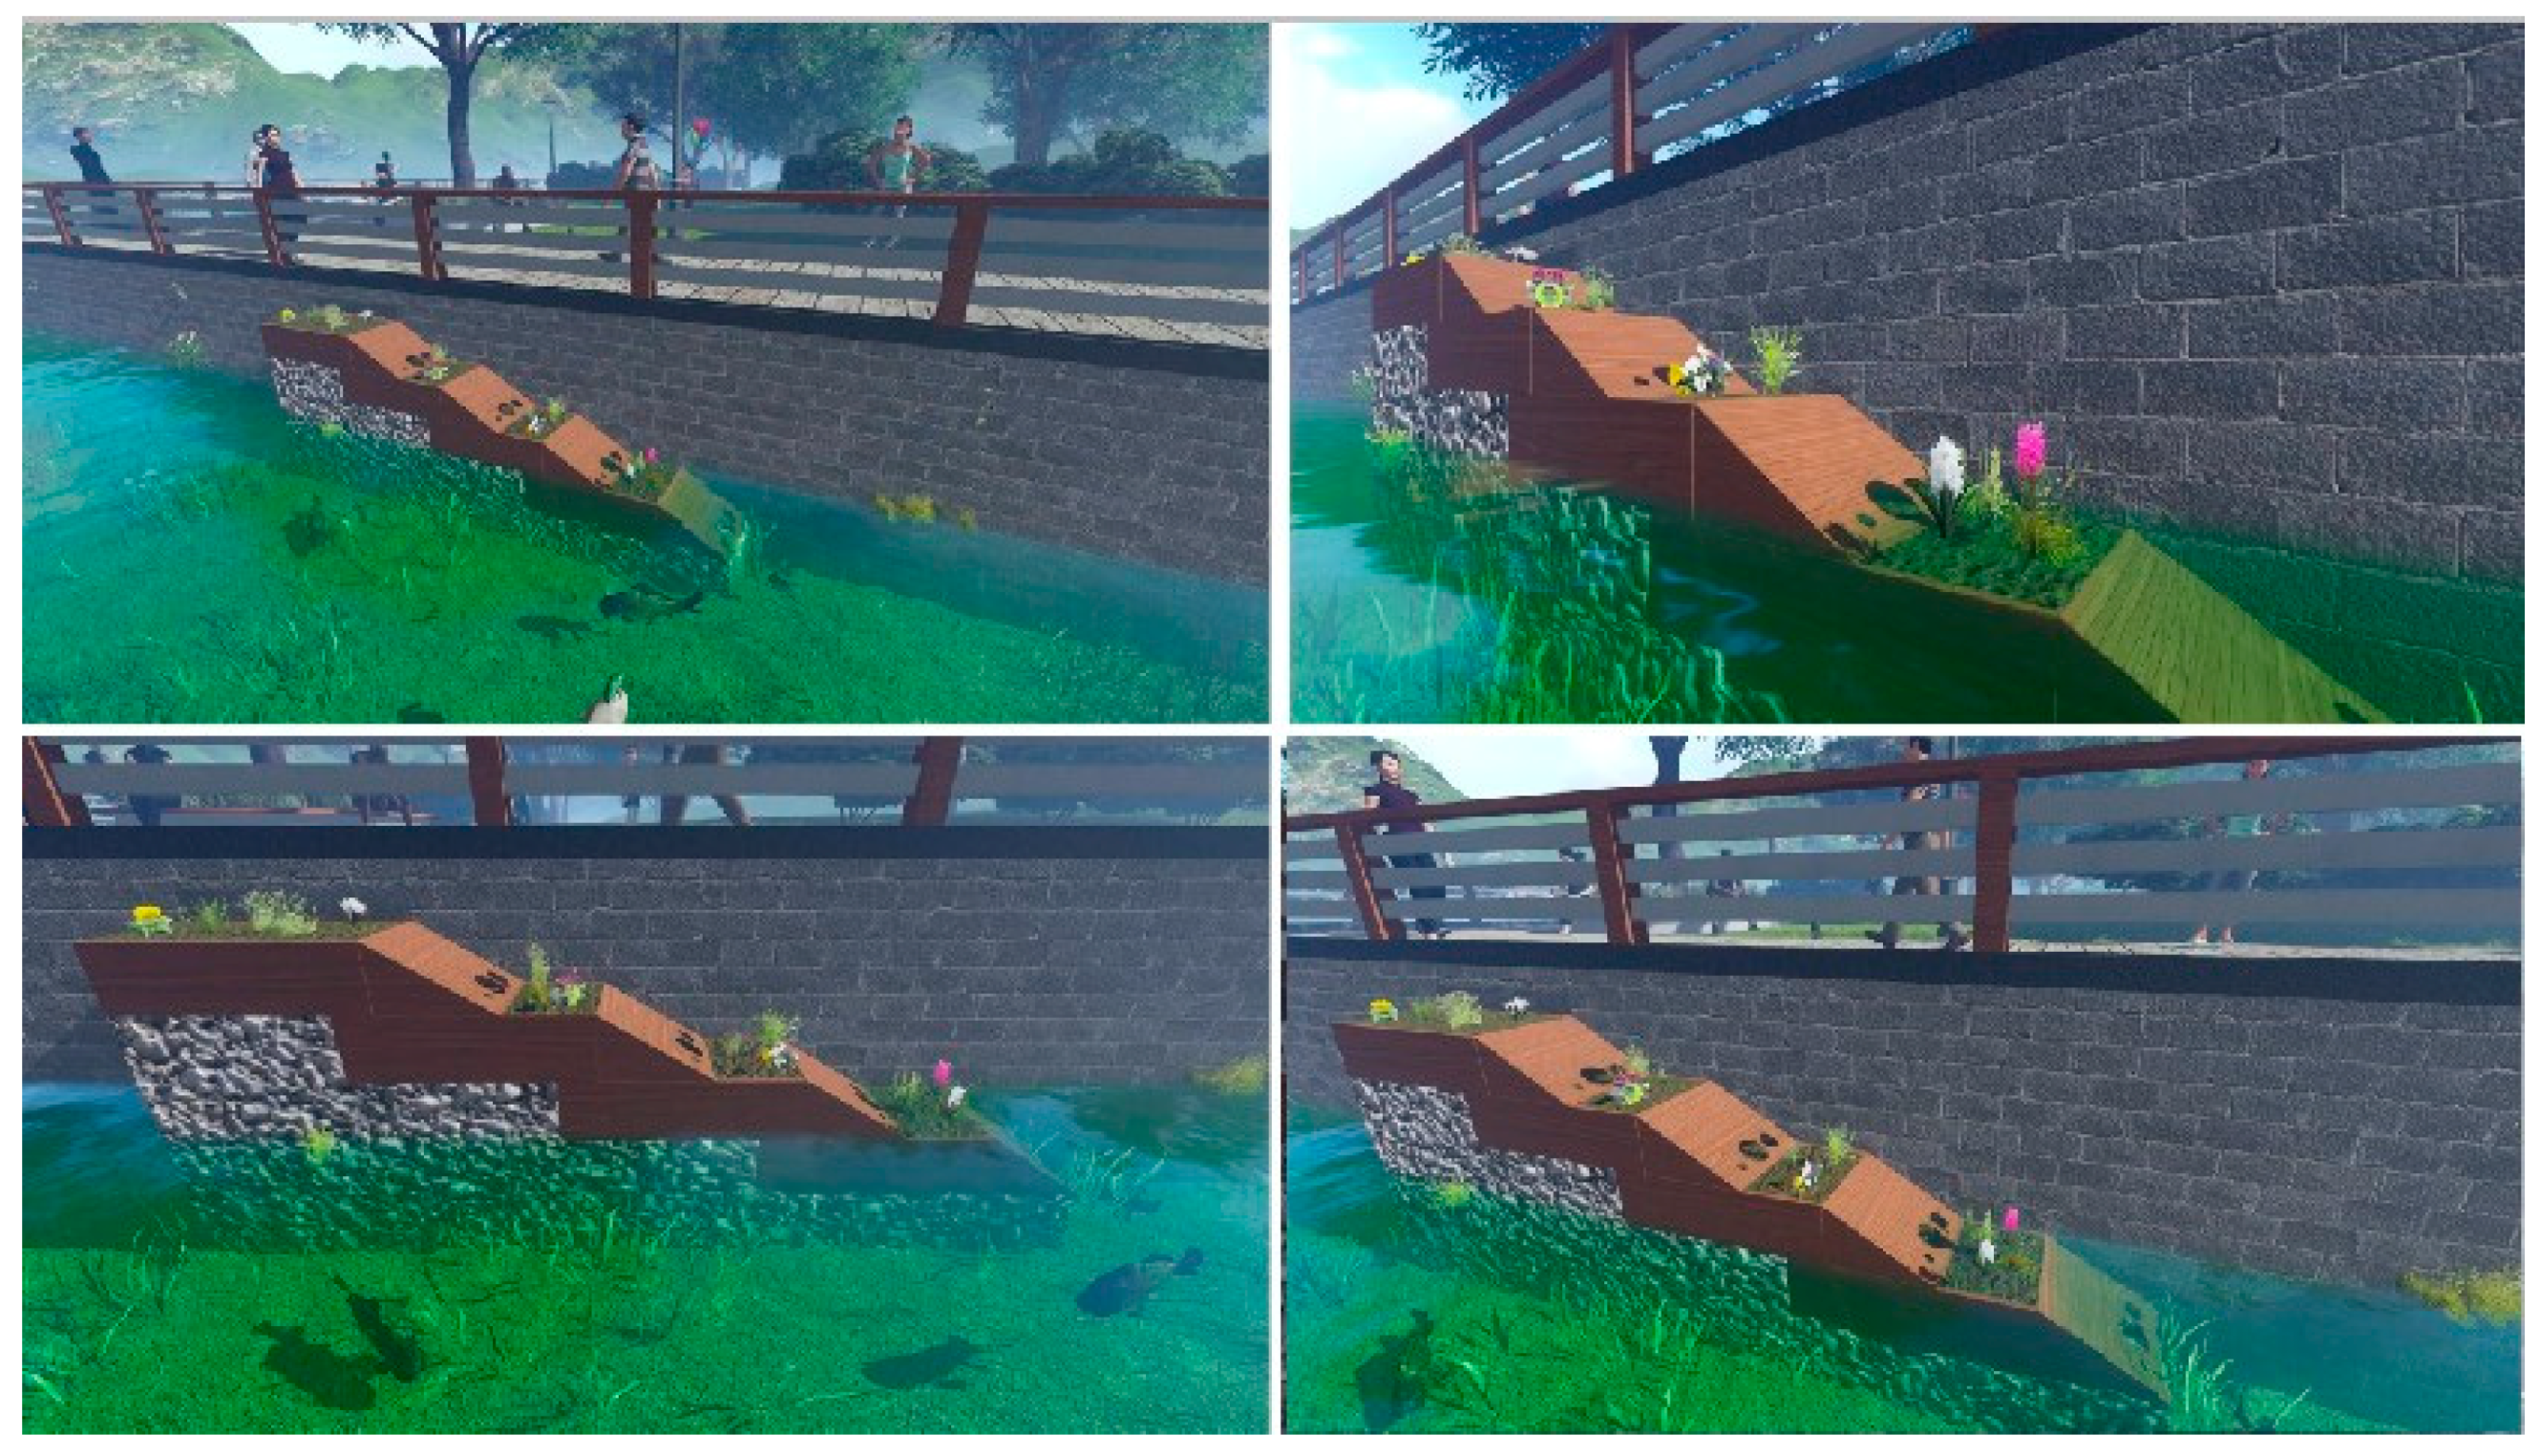
Figure 5 shows perspectives of the frog ladder proposed in this study. This new design concept can not only provide crossing function, rest places, and shelter for frogs, but also increase the beauty of the artificial environment.
5. Conclusions
Ecological corridors are an essential element in conserving the biodiversity and proper functioning of ecosystems. Without their connectivity, a very large number of species would not have access to all of the habitats needed for their life cycles.
In general, ecological corridors provide animal crossing functions, but their safety, protection function against natural enemies, and inclusion of hiding places, as well as the behavioral capacities of amphibian creatures to move and escape, have not been considered thus far. The purpose of this study was to propose a new ecological corridor design concept for frogs to address the limitations mentioned above.
In this paper, two Ranidae Species, K. idiootocus and B. japonic, gathered in Northern Taiwan, were chosen as an example in order to provide necessary information for the design of the frog ladder. Grey system theory was employed to offer the necessary information. The experimental results showed that K. idiootocus was quite good at climbing, but relatively weak at jumping. From the results of the grey-relation analysis, B. japonica has a higher overall capacity than K. idiootocus. As a result, the frog ladder’s design is dominated by the behavioral abilities of K. idiootocus. Moreover, grey-relational analysis played a great role in suggesting the height and width for each step of the frog ladder.
A frog ladder was proposed in this article based on the frogs’ behavioral abilities and habits, and considering the dangers encountered in the natural environment, which will aid the frog in moving, escaping, and avoiding natural enemies. The concept of the ecological corridor’s protection function or hiding areas proposed in this study can also be employed for other creatures. This paper offers a fresh perspective on the creation of ecological corridors. Engineers and ecological researchers can benefit from the concept and findings of this study since they will increase their communication and comprehension.
Author Contributions
T.-F.C. is responsible for the main body of text drafting, data collection, and analysis. Y.-H.C. contributed in some sections in the first draft and some of the data collection. All authors have read and agreed to the published version of the manuscript.
Funding
This research received no external funding.
Institutional Review Board Statement
Not applicable.
Informed Consent Statement
Not applicable.
Data Availability Statement
Not applicable.
Acknowledgments
The authors thank the reviewers who gave us professional suggestions.
Conflicts of Interest
The authors declare no conflict of interest.
References
- Kim, K.C.; Byrne, L.B. Biodiversity loss and the taxonomic bottleneck: Emerging biodiversity science. Ecol. Res. 2006, 21, 794–810. [Google Scholar] [CrossRef] [Green Version]
- Stenseth, N.C.; Mysterud, A.; Ottersen, G.; Hurrel, J.W.; Chan, K.S.; Lima, M. Ecological effects of climate fluctuations. Science 2002, 297, 1292–1296. [Google Scholar] [CrossRef] [PubMed] [Green Version]
- Dirzo, R.; Raven, P.H. Global state of biodiversity and loss. Annu. Rev. Environ. Resour. 2003, 28, 137–167. [Google Scholar] [CrossRef] [Green Version]
- Turner, W.R.; Nakamura, T.; Dinetti, M. Global urbanization and the separation of humans from nature. Bioscience 2004, 54, 585–590. [Google Scholar] [CrossRef] [Green Version]
- Biesmeijer, J.C.; Roberts, S.P.M.; Reemer, M.; Ohlemiller, R.; Edwards, M.; Peeters, T.; Schaffer, A.D.; Potts, S.G.; Keenkers, R.; Thomas, C.D.; et al. Parallel declines in pollinators and insect-pollinated plants in Britain and the Netherlands. Science 2006, 313, 351–354. [Google Scholar] [CrossRef] [PubMed]
- Barinaga, M. Where have all the froggies gone? Science 1990, 247, 1033–1034. [Google Scholar] [CrossRef]
- Blaustein, A.R.; Wake, D.B.; Sousa, W.P. Amphibian declines: Judging stability, persistence, and susceptibility of populations to local and global extinctions. Conserv. Biol. 1994, 8, 60–71. [Google Scholar] [CrossRef]
- Wake, D.B. Declining amphibian populations. Science 1991, 253, 860. [Google Scholar] [CrossRef]
- Fujioka, M.; Lane, S.J. The impact of changing irrigation practices in rice fields on frog populations of the Kanto Plain, central Japan. Ecol. Res. 1997, 12, 101–108. [Google Scholar] [CrossRef]
- Pechmann, J.H.K.; Scott, D.E.; Semtitsch, R.D.; Caldwell, J.P.; Vitt, L.J.; Gibbsons, J.W. Declining amphibian populations: The problem of separating human impacts from natural fluctuations. Science 1991, 253, 892–895. [Google Scholar] [CrossRef] [Green Version]
- Philips, K. Where have all the frogs and toads gone? BioScience 1990, 40, 422–424. [Google Scholar] [CrossRef]
- Laurance, W.F. Catastrophic declines of Australian rainforest frogs: Is unusual weather responsible? Biol. Conserv. 1996, 77, 203–212. [Google Scholar] [CrossRef]
- Hamer, A.J.; Lane, S.J.; Mahony, M.J. Management of freshwaterwetlands for the endangered green and golden bell frog (Litoria aurea): Roles of habitat determinants and space. Biol. Conserv. 2002, 106, 413–424. [Google Scholar] [CrossRef]
- Gillespie, G.R. Impacts of sediment loads, tadpole density, and food type on the growth and development of tadpoles of the spotted tree frog. Biol. Conserv. 2002, 106, 141–150. [Google Scholar] [CrossRef]
- Lue, K.Y. A Handbook of Amphibian Animal Resources; Council of Agriculture, Executive Yuan, R.O.C: Taipei, Taiwan, 1996; pp. 31–33. (In Chinese) [Google Scholar]
- Chen, W.S. 31 Frogs in Taiwan; Wild Bird Society of Taipei: Taipei, Taiwan, 2003; pp. 62–63. (In Chinese) [Google Scholar]
- Hou, W.S.; Chang, Y.H.; Wang, H.W. Climatic effects and impacts of lakeshore bank designs on the activity of Chirixalus idiootocus in Yilan, Taiwan. Ecol. Eng. 2008, 32, 52–59. [Google Scholar] [CrossRef]
- Hou, W.S.; Chang, Y.H.; Chuang, T.F.; Chen, C.H. Effect of Ecological Engineering Design on Biological Motility and Habitat Environment of Hynobius arisanensis at High Altitude Areas in Taiwan. Ecol. Eng. 2010, 36, 791–798. [Google Scholar] [CrossRef]
- Chang, Y.H.; Wang, H.W.; Hou, W.S. Effects of construction materials and design of lake and stream banks on climbing ability of frogs and salamanders. Ecol. Eng. 2011, 37, 1726–1733. [Google Scholar] [CrossRef]
- Chuang, T.F.; Chang, Y.S. Comparison of Physical Characteristics between Rana latouchtii and Rana adenopleura Using Grey System Theory and Artificial Neural Network. Ecol. Eng. 2014, 68, 223–232. [Google Scholar] [CrossRef]
- Chang, Y.H.; Wu, B.Y.; Chuang, T.F.; Lu, H.L. The design method for concrete waterfront amphibian ladder along streams. Ecol. Eng. 2017, 106, 66–74. [Google Scholar] [CrossRef]
- Aars, J.; Ims, R.A. The Effect of Habitat Corridors on Rates of Transfer and Interbreeding between Vole Demes. Ecology 1999, 80, 1648–1655. [Google Scholar] [CrossRef]
- Beier, P.; Loe, S. In My Experience: A Checklist for Evaluating Impacts to Wildlife Movement Corridors. Wildl. Soc. Bull. 1992, 20, 434–440. [Google Scholar]
- Beier, P.; Noss, R.F. Do Habitat Corridors Provide Connectivity? Conserv. Biol. 1998, 12, 1241–1252. [Google Scholar] [CrossRef]
- Matos, C.; Petrovan, S.; Ward, A.I.; Wheeler, P. Facilitating permeability of landscapes impacted by roads for protected amphibians: Patterns of movement for the great crested newt. PeerJ 2017, 5, e2922. [Google Scholar] [CrossRef] [PubMed]
- Yang, Y.R. A Field Guide to the Frogs and Toads of Taiwan; Nature and Ecology Photographer’s Society: Taipei, Tiwan, 1998. [Google Scholar]
- Yang, Y.R. The Frog School. 2013. Available online: http://www.froghome.tw/ (accessed on 16 March 2013).
- Yu, W.C. Biometrics with Experiment Designs; Nung-Ying Books: Taipei, Taiwan, 1976; pp. 234–262. [Google Scholar]
- Green, D.M. Adhesion and toe-pads of tree frogs. Copeia 1981, 4, 790–796. [Google Scholar] [CrossRef]
- Deng, J.L. Control problems of Grey System. Syst. Control Lett. 1982, 5, 288–294. [Google Scholar]
- Deng, J.L. Introduction to Grey System. J. Grey Syst. 1989, 1, 1–24. [Google Scholar]
- Kayacan, E.; Ulutas, B.; Kaynak, O. Grey system theory-based models in time series prediction. Expert Syst. Appl. 2010, 37, 1784–1789. [Google Scholar] [CrossRef]
- Liu, S.F.; Lin, Y. An Introduction to Grey Systems; Emerald Group Publishing Limited: Bingley, UK, 1998. [Google Scholar]
Figure 1.
Study area (Taiwan).

Figure 2.
Appearances of the frogs and the apparatus for measuring the climbing ability; (a) Kurixalus idiootocus; (b) Buergeria japonica; (c) Apparatus for measuring the climbing ability. Source: [19,27].

Figure 3.
Comparison of K. idiootocus and B. japonica; (a) Comparison of high jumps; (b) Comparison of long jumps; (c) Comparison of climbing ability.
Figure 3.
Comparison of K. idiootocus and B. japonica; (a) Comparison of high jumps; (b) Comparison of long jumps; (c) Comparison of climbing ability.

Figure 4.
Frog ladder proposed in this study.

Figure 5.
Perspectives of the frog ladder.


Table 1.
Physical characteristics of Kurixalus idiootocus and Buergeria japonica.
| Physical Statistics | Species | Weight(g) | Length (cm) | High Jump (cm) | Long Jump (cm) | Climbing Ability (N) |
|---|---|---|---|---|---|---|
| Range of males | K. idiootocus | 1.04–1.57 | 2.81–3.16 | 5.98–18.45 | 25.23–50.23 | 0.065–0.174 |
| B. japonica | 1.34–2.57 | 2.24–2.97 | 11.45–56.47 | 49.99–127.85 | 0.001-0.048 | |
| Mean of males | K. idiootocus | 1.35 | 2.96 | 12.25 | 36.82 | 0.125 |
| B. japonica | 1.84 | 2.60 | 36.22 | 82.98 | 0.019 | |
| Range of females | K. idiootocus | 2.53–3.61 | 3.97–4.14 | 11.24–17.84 | 34.75–57.28 | 0.237–0.608 |
| B. japonica | 3.14–3.88 | 2.97–3.54 | 23.54–55.52 | 65.25–101.45 | 0.057–0.173 | |
| Mean of females | K. idiootocus | 2.89 | 4.06 | 13.90 | 42.23 | 0.370 |
| B. japonica | 3.63 | 3.30 | 47.05 | 84.78 | 0.107 | |
| Ratio (male/female) | K. idiootocus | 46.75% | 72.86% | 88.13% | 87.19% | 33.78% |
| B. japonica | 50.69% | 78.79% | 76.98% | 97.87% | 17.76% | |
| Ratio (K. idiootocus/B. japonica) | male | 73.42% | 113.77% | 33.82% | 44.37% | 657.89% |
| female | 79.61% | 123.03% | 29.54% | 51.64% | 345.79% |
Table 2.
A comparison of the climbing abilities of males of the two frog species.
| Species | Sex | Clay | Grass | Cobblestone | Wood | Average |
|---|---|---|---|---|---|---|
| K. idiootocus | Male (M1) | 0.044 | 0.115 | 0.064 | 0.072 | 0.074 |
| B. japonica | Male (M2) | 0.018 | 0.009 | 0.024 | 0.023 | 0.02 |
| Ratios | Ratio = M1/M2 | 2.44 | 12.78 | 2.67 | 3.13 | 3.70 |
Table 3.
Original data for grey-relational analysis for Kurixalus idiootocus (Frog A) and Buergeria japonica (Frog B).
Table 3.
Original data for grey-relational analysis for Kurixalus idiootocus (Frog A) and Buergeria japonica (Frog B).
| Item and Sequence | k = 1 High Jump (cm) | k = 2 Long Jump (cm) | k = 3 Climbing Ability | |
|---|---|---|---|---|
| Reference X0 | K. idiootocus | 56.47 | 127.85 | 0.120 |
| B. japonica | 56.47 | 127.85 | 0.120 | |
| Comparison X1 | K. idiootocus | 10.54 | 36.47 | 0.055 |
| B. japonica | 39.45 | 88.62 | 0.003 | |
| Comparison X2 | K. idiootocus | 10.54 | 43.78 | 0.0814 |
| B. japonica | 20.22 | 75.48 | 0.001 | |
| Comparison X3 | K. idiootocus | 11.47 | 32.48 | 0.074 |
| B. japonica | 29.65 | 64.55 | 0.003 | |
| Comparison X4 | K. idiootocus | 13.55 | 49.25 | 0.092 |
| B. japonica | 36.45 | 72.89 | 0.004 | |
| X5–X29 (were neglected) | K. idiootocus | . | . | . |
| B. japonica | . | . | . | |
| Comparison X30 | K. idiootocus | 15.33 | 44.25 | 0.087 |
| B. japonica | 37.45 | 98.57 | 0.004 | |
Note: The values of X5–X29 were neglected to make the Table concise.
Table 4.
Grey-relation grades of frog behavior for K. idiootocus and B. japonica.
| ID | 01 | 02 | 03 | 04 | 05 | 06 | 07 | 08 | 09 | 10 |
|---|---|---|---|---|---|---|---|---|---|---|
| Grg of K. idiootocus | 0.6348 | 0.6498 | 0.6276 | 0.6650 | 0.6221 | 0.6482 | 0.617 | 0.6241 | 0.6437 | 0.6236 |
| Grg of B. japonica | 0.7592 | 0.6792 | 0.6623 | 0.6975 | 0.6300 | 0.9948 | 0.7699 | 0.7790 | 0.6013 | 0.8228 |
| ID | 11 | 12 | 13 | 14 | 15 | 16 | 17 | 18 | 19 | 20 |
| Grg of K. idiootocus | 0.6325 | 0.6416 | 0.6317 | 0.6374 | 0.6188 | 0.6428 | 0.6146 | 0.6408 | 0.641 | 0.6367 |
| Grg of B. japonica | 0.9178 | 0.6871 | 0.7084 | 0.7014 | 0.6476 | 0.7613 | 0.7414 | 0.766 | 0.8093 | 0.7408 |
| ID | 21 | 22 | 23 | 24 | 25 | 26 | 27 | 28 | 29 | 30 |
| Grg of K. idiootocus | 0.6362 | 0.6539 | 0.6638 | 0.6291 | 0.6222 | 0.6180 | 0.6458 | 0.6497 | 0.6502 | 0.6561 |
| Grg of B. japonica | 0.7646 | 0.6664 | 0.7863 | 0.6677 | 0.6356 | 0.6845 | 0.7689 | 0.7713 | 0.7238 | 0.7943 |
Table 5.
Grey-relation rank (Grr) of frog behavior for K. idiootocus and B. japonica.
| Grr | Species | 01 | 02 | 03 | 04 | 05 | 06 | 07 | 08 | 09 | 10 |
|---|---|---|---|---|---|---|---|---|---|---|---|
| ID of sequence | K. idiootocus | X4 | X23 | X30 | X22 | X29 | X2 | X28 | X6 | X27 | X9 |
| B. japonica | Y6 | Y11 | Y10 | Y19 | Y30 | Y23 | Y8 | Y28 | Y7 | Y27 | |
| Grr | kind | 11 | 12 | 13 | 14 | 15 | 16 | 17 | 18 | 19 | 20 |
| ID of sequence | K. idiootocus | X16 | X12 | X19 | X18 | X14 | X20 | X21 | X1 | X11 | X13 |
| B. japonica | Y18 | Y21 | Y16 | Y1 | Y17 | Y20 | Y29 | Y13 | Y14 | Y4 | |
| Grr | kind | 21 | 22 | 23 | 24 | 25 | 26 | 27 | 28 | 29 | 30 |
| ID of sequence | K. idiootocus | X24 | X3 | X8 | X10 | X25 | X5 | X15 | X26 | X7 | X17 |
| B. japonica | Y12 | Y26 | Y2 | Y24 | Y22 | Y3 | Y15 | Y25 | Y5 | Y9 |
Table 6.
Grey-relation rank (Grr) of frog behavior for K. idiootocus and B. japonic.
| Grr | 01 | 02 | 03 | 04 | 05 | 06 | 07 | 08 | 09 | 10 |
|---|---|---|---|---|---|---|---|---|---|---|
| ID of sequence | Z36 | Z41 | Z40 | Z49 | Z60 | Z53 | Z38 | Z58 | Z37 | Z57 |
| Y6 | Y11 | Y10 | Y19 | Y30 | Y23 | Y8 | Y28 | Y7 | Y27 | |
| Grr | 11 | 12 | 13 | 14 | 15 | 16 | 17 | 18 | 19 | 20 |
| ID of sequence | Z48 | Z51 | Z46 | Z31 | Z47 | Z50 | Z59 | Z43 | Z44 | Z34 |
| Y18 | Y21 | Y16 | Y1 | Y17 | Y20 | Y29 | Y13 | Y14 | Y4 | |
| Grr | 21 | 22 | 23 | 24 | 25 | 26 | 27 | 28 | 29 | 30 |
| ID of sequence | Z42 | Z56 | Z32 | Z54 | Z52 | Z33 | Z45 | Z55 | Z35 | Z39 |
| Y12 | Y26 | Y2 | Y24 | Y22 | Y3 | Y15 | Y25 | Y5 | Y9 | |
| Grr | 31 | 32 | 33 | 34 | 35 | 36 | 37 | 38 | 39 | 40 |
| ID of sequence | Z4 | Z23 | Z30 | Z22 | Z29 | Z2 | Z28 | Z6 | Z27 | Z9 |
| X4 | X23 | X30 | X22 | X29 | X2 | X28 | X6 | X27 | X9 | |
| Grr | 41 | 42 | 43 | 44 | 45 | 46 | 47 | 48 | 49 | 50 |
| ID of sequence | Z16 | Z12 | Z19 | Z18 | Z14 | Z20 | Z21 | Z1 | Z11 | Z13 |
| X16 | X12 | X19 | X18 | X14 | X20 | X21 | X1 | X11 | X13 | |
| Grr | 51 | 52 | 53 | 54 | 55 | 56 | 57 | 58 | 59 | 60 |
| ID of sequence | Z24 | Z3 | Z8 | Z10 | Z25 | Z5 | Z15 | Z26 | Z7 | Z17 |
| X24 | X3 | X8 | X10 | X25 | X5 | X15 | X26 | X7 | X17 |
Table 7.
Results of Independent Samples t-tests on males of the two frog species.
| Variable | Group | Number | Mean (M) | Standard Deviation (SD) | t | p-Value Sig. (2-Tailed) | 95% Confidence Interval of Difference | |
|---|---|---|---|---|---|---|---|---|
| Lower | Upper | |||||||
| Weight (g) | B. japonic | 30 | 1.839 | 0.318 | 7.669 *** | 0.000 | 0.361 | 0.615 |
| K. idiootocus | 30 | 1.351 | 0.143 | |||||
| Length (cm) | B. japonic | 30 | 2.603 | 0.234 | −7.576 *** | 0.000 | −0.449 | −0.261 |
| K. idiootocus | 30 | 2.958 | 0.105 | |||||
| Height jump (cm) | B. japonic | 30 | 36.216 | 11.082 | 11.460 *** | 0.000 | 19.78 | 19.780 |
| K. idiootocus | 30 | 12.250 | 2.897 | |||||
| Long jump (cm) | B. japonic | 30 | 82.977 | 18.245 | 12.957 *** | 0.000 | 39.027 | 53.289 |
| K. idiootocus | 30 | 36.819 | 6.914 | |||||
| Climbing ability N | B. japonic | 30 | 0.019 | 0.013 | −20.640 *** | 0.000 | −0.116 | −0.096 |
| K. idiootocus | 30 | 0.125 | 0.025 | |||||
N = 60; *** p < 0.001 (Sig. 2-tailed); df = 58
Publisher’s Note: MDPI stays neutral with regard to jurisdictional claims in published maps and institutional affiliations. |
© 2021 by the authors. Licensee MDPI, Basel, Switzerland. This article is an open access article distributed under the terms and conditions of the Creative Commons Attribution (CC BY) license (https://creativecommons.org/licenses/by/4.0/).
Share and Cite
MDPI and ACS Style
Chuang, T.-F.; Chang, Y.-H. A New Design Concept of an Ecological Corridor for Frogs to Improve Ecological Conservation. Sustainability 2021, 13, 11175. https://doi.org/10.3390/su132011175
AMA Style
Chuang T-F, Chang Y-H. A New Design Concept of an Ecological Corridor for Frogs to Improve Ecological Conservation. Sustainability. 2021; 13(20):11175. https://doi.org/10.3390/su132011175
Chicago/Turabian StyleChuang, Tsai-Fu, and Yuan-Hsiou Chang. 2021. "A New Design Concept of an Ecological Corridor for Frogs to Improve Ecological Conservation" Sustainability 13, no. 20: 11175. https://doi.org/10.3390/su132011175
Note that from the first issue of 2016, this journal uses article numbers instead of page numbers. See further details here.