
An Integrative Review of Socio-Technical Factors Influencing Travel Decision-Making and Urban Transport Performance


1
Department of Transport Technology and Economics (KUKG), Faculty of Transportation Engineering and Vehicle Engineering (KJK), Budapest University of Technology and Economics (BME), 1111 Budapest, Hungary
2
Transport Engineering Group, Department of Civil, Chemical, Environmental Engineering, University of Bologna, 40123 Bologna, Italy
*
Author to whom correspondence should be addressed.
Sustainability 2021, 13(18), 10158; https://doi.org/10.3390/su131810158
Submission received: 2 August 2021
/
Revised: 7 September 2021
/
Accepted: 8 September 2021
/
Published: 10 September 2021
Abstract
:Socio-technical systems have a very complex structure presenting multidimensional co-evolutionary dynamics between people and technical factors. Each urban area has a different sociocultural structure, where the built environment and user choices vary. Understanding how urban transportation is shaped by socio-technical factors as well as how these factors affect transportation users and system performance is important to support sustainable transportation planning. This paper aims to provide a holistic view of socio-technical factors shaping urban transportation for the use of transport planners and decision-makers. The current review focuses on understanding which alternative transport modes can be sustainable under specific socio-technical conditions and how to attract travelers toward these sustainable modes. Moreover, under which socio-technical conditions an urban transport system can minimize its socio-economic costs and environmental impacts are investigated. Furthermore, the interrelations among system dynamics, their influence on transport users as well as on system externalities are identified and integrated as a system model perspective for a holistic view.
1. Introduction
Recently, the socio-economic transformation of cities has been booming with an increasing urban sprawl, which has led to the growth of land consumption. On the other hand, the expansion of sustainable transport modes has not taken place at the same rate; whereas the growth of private car ownership has peaked [1]. This situation has developed along with an increase in social inequity, socio-economic costs, and harmful environmental impacts. The concept of sustainable mobility can be defined as satisfying the current transport needs without sacrificing the ability of future generations to meet their transport needs, where social, environmental, and economic accessibility are sustained [2]. Sustainable mobility requires environmental (e.g., air pollution and greenhouse gas, GHG, emissions), social (e.g., accessibility and equity), and economic (e.g., costs) considerations, which affect the process of decision-making. The degree of sustainable mobility depends on how much the three dimensions of sustainability are met. Urban areas consist of the same socio-technical components, where the sociocultural identity shapes the characteristics of the urban system [3]. Socio-technical systems have a very complex structure presenting multidimensional co-evolutionary dynamics between people and technical factors. As a result of multidimensional dynamics (i.e., culture, educational level, income level, nature of demography, technology, policy, land use, and infrastructure) in socio-technical systems, user choices and urban system characteristics are differentiated geographically [4].
In a multidimensional examination, a series of indicators and their interactions should be identified by using logic architectures [1]. The following questions need to be addressed to form the management logic for urban transportation: How does an urban mobility system work in various built environments? How do mobility system dynamics interrelate? In order to identify how socio-technical factors affect user choices and system externalities, an integrative review is necessary. Holistic socio-technical analysis for urban mobility has not been traced in the literature yet, and mono-perspectives by themselves cannot offer a holistic view on the topic. Examining the similarities and differences of urban areas helps to understand which alternative sustainable transport systems can be successful and under which socio-technical conditions this success can be achieved.
The European Commission (EC) published an Urban Mobility Package in 2013, where Sustainable Urban Mobility Plans (SUMPs) are the main focus. The concept of SUMPs aims to create alternatives to car use and car ownership. SUMPSs provide a shift toward cleaner and more sustainable transport modes through focusing on people rather than directly on technical factors while interacting with urban functions and their surroundings [5]. The current study follows up a human-centric approach dwelling on how to increase the attractiveness of non-motorized modes and public transport along with the co-evaluation of the system dynamics between people and technical factors. Understanding user choices as well as under which socio-technical conditions an urban transport system can minimize its socio-economic costs and environmental impacts is a vital step of sustainable transportation planning [4]. In this study, an integrative review is presented to highlight how cities are shaped by socio-technical factors and how these factors affect transport users and system externalities.
2. Socio-Technical Factors Shaping Urban Mobility System
In this section, a systematic literature review is presented based on the analytical framework shown in Figure 1. Similar analytical framework approaches were used previously (see [6]). The current systematic review focuses on socio-technical factors shaping the urban mobility system. A synthesis of urban mobility and built environment has been attempted before (see [7]), but the present review uses a different approach and includes a broader range of elements with providing a more connective point of view. This is the first systematic review seeking to cover every driver of the transportation system, which sets apart this study from other reviews. Abductive reasoning is applied here. This approach is not deterministic but utilitarian. The abductive approach is not based on certain inferences but rather on logical inferences toward presenting the pieces of the puzzle from what is known, then merging them to construct a holistic outcome [8]. Practice theory is used as a background to construct the theoretical structure of the review topic. Practice theory works on the integration of sets of elements [9], while a socio-technical system includes sets of elements; therefore, this background suits this study well. Practice theory is highly diversified and is interpreted by many scientists [9]. In the current review, the three-element model of practice theory focusing on understanding the overall outcome of different configurations composed by these elements in a qualitative way is considered. Thus, this method provides a way of understanding the whole picture while identifying interactions from the obtained quantitative results by using logic architectures. The qualitative way of this study lies in the interpretive approach. The three-element model consists of meanings, materials, and competencies [10]. These elements can be interpreted in the urban transportation system as the equivalent of sociocultural identity, built environment, and externalities, respectively. Additionally, the center of all these elements is human.
In this study, 113 papers were utilized and the integrated transport literature is used as the documentation to draw a holistic view. The methodology of systematic review is applied as explained in Van Wee and Banister’s work [11]. The analytical process of the literature investigation is shown in Figure 2. The literature databases: Web of Science, Scopus, and Google Scholar, are searched. In the databases, the investigated socio-technical parameters (i.e., the sub-headlines presented under the identities of sociocultural structure and built environment subsections) in connection with various synonyms of “transport” word (mobility, transportation, etc.) are searched to find relevant literature. Afterward, the abstract reading process is applied to filter whether the results are relevant to the investigated topic. All cited scientific articles in this review have been cited before. Excluding books and grey literature, the mean and median citation numbers of the collected scientific articles in this study are 230.2 and 75.5, respectively. A small number of grey literature (e.g., some technical reports by EU Commission and IEA), which accounts for around 18% of the collected literature, are considered, as well. Primarily transport literature published between 2005 and 2020 is used, while a small number of earlier pioneering works with a high number of citations are considered, too.
2.1. The Identities of the Sociocultural Structure
This section focuses on how user choices are connected with the sociocultural structure, which affects system externalities indirectly.
2.1.1. Culture
Culture is a common characteristic of a society [12], which can be defined more specifically as a way of life that is bonded to “habit” in the field of travel behavior [13]. Culture is hard to quantify, but two major theories of social scientists attempting to identify cross-cultural variation are worth mentioning: Geert Hofstede [14] and Ronald Inglehart [15]. Hofstede’s work is mentioned in travel behavior analysis since this cultural consideration is more related to human psychology and multidimensional concepts [16]. Hofstede is known for defining six cultural dimensions (i.e., power distance, uncertainty avoidance [UNC—degree of built-in worry], individualism versus collectivism [IND/COL —interdependence degree], masculinity versus femininity [MAS/FEM—competitiveness level], long-term orientation, and indulgence versus self-restraint), which reflects on society’s needs to organize itself. Each cultural circumstance leads to different choice evaluations because value judgments are not the same everywhere [17]. There are two pieces of strong evidence in the literature that demonstrate the role of cultural circumstances in urban travel patterns. Research conducted by Syam [18] examines the role of culture in travel mode choice by applying Hofstede’s cultural dimensions (HCD) for different migrant groups in Auckland. The results indicate that national culture is a significant reason why public transportation is thought of differently by various national groups within a community. A recent worldwide analysis investigates the role of HCD on urban mobility patterns in 87 cities across 41 countries [16]. The results reveal that cultural circumstances are influential factors in urban mobility planning. High correlation values show that countries with more individualism build a more individualistic transport environment, which results in more driving. Such countries as the US, Australia, Canada, Italy, New Zealand, and the UK have the highest individualism. On the other hand, collective nations tend to use public transportation more. Such countries as South Korea, Hong Kong, China, Thailand, Peru, Colombia, and Brazil demonstrate the highest collectivism. Furthermore, the results show that in the case of nations with high scores in three cultural dimensions (i.e., collectivism, uncertainty avoidance, and masculinity), a greater use of public transportation is ensured. On the other hand, some countries with high individualism show a tendency to adapt to biking. Notable examples are Denmark and the Netherlands, where car and public transportation modal shares are low in comparison with other countries. Although the scores of individualism are high, Denmark and the Netherlands have the greatest bike use among all countries. Cycling can be called an environmentally friendly individual transport mode, which may explain why this mode is adopted in these countries.
2.1.2. Educational Level
Culture might be seen as an inherited characteristic, but the educational level can be called an acquired characteristic of societies. Education and learning are decisive factors in shaping society and the built environment in a dynamic collective way [19]. In a report of the United Nations, educating citizens is presented as one of the hopeful paths leading to sustainable development (see [20]). The report shows that learning about climate change and sustainable consumption can influence personal choices. By using a large cross-national database, an analysis is conducted to investigate how people’s attitudes and educational levels are connected [21]. The obtained results indicate that educational level is well-correlated with the level of environmental concern, even when other socio-demographic characteristics are controlled for. Note that a correlation between income and educational level is not a consistent finding in the literature [4]. Based on a travel survey conducted in the Netherlands, a study investigates how some characteristics of society affect travel mode choice [22]. The results confirm that highly educated commuters show the highest tendency to travel by public transportation instead of traveling by car. Car-sharing is one of the key strategies aiming at reducing car usage. A study investigates how the membership of car-sharing programs and socio-demographic factors are connected in Quebec City [23]. The obtained results demonstrate that car-sharing is widely used by certain user groups, such as people with higher educational levels. Similar findings are observed in another study, where a survey conducted in the US is analyzed. Based on the results, it can be concluded that the highly educated participants have a higher tendency to use car-sharing services [24]. A cross-sectional study is conducted in the urban areas of the United States to investigate socio-environmental factors and individual attitudes regarding how people use bikes [25]. The results show that a higher educational level is positively correlated with regular-oriented cycling. Recent work investigates the influence of higher educational level, income level and land-use factors on urban travel mode choices for 45 urban areas across 29 countries with considering income level and land-use factors [4]. The results show that an increase in the educational level has the highest influence on dropping car usage compared to other factors.
2.1.3. Income Level
The income level is an important element in manipulating personal choices. A discrete choice modeling approach is applied for 112 medium-sized cities in Europe [26]. The results demonstrate that car mode share increases with car ownership and with an increase in GDP per capita. Similar results are presented in a comparative analysis of travel behavior in the US [27] and in a meta-analysis conducted in the UK [28]. In both cases, a negative relationship is shown between public transport usage and income level. However, this negative relationship is not found in the case of 112 medium-sized cities in Europe [26]. Furthermore, income level provides the basis for the infrastructure constructions and technological developments affecting transport performance indirectly. A study investigates the effect of the socio-economic situation on transport infrastructure types for 151 cities worldwide [29]. The results show that GDP per capita is highly correlated with infrastructure accessibility for road and railway, while it is moderately correlated with cycle infrastructure accessibility.
2.1.4. Nature of Demography
The nature of demography is a complex structure referring to such factors as the distribution of gender, age, household composition, marital status, and other variables in societies [4]. Some major determinants, for example, spending time with a life partner, taking care of household members, different value orientations of men and women, willingness to have a more comfortable life while aging, make differences in travel mode priorities [4]. In a number of studies, the obtained results indicate that women use the car less frequently than men [30], and married people tend to use cars more often than single people [31]. Furthermore, traveling with young children encourages traveling by car [32]. Car usage increases with aging [33], while trip frequency and travel distance lessen [34]. Focusing on the aspects of gender in urban mobility, a recent study, which combines commercial and open datasets based on mobile phones, demonstrates that women travel to unique locations less frequently than men, and women’s travel time among unique locations is less equally distributed than men in the city of Santiago, Chile [35]. This gender gap is wider with lower-income administrative divisions. These results reflect gender inequality in transportation and call for further research on inclusiveness in urban transport to help the work of policymakers and urban planners.
2.2. Built Environment
This section focuses on how user choices are related to built infrastructures and how built infrastructures are connected with system externalities.
2.2.1. Infrastructure Types and Network Design
Private Vehicle
A strong relationship between the growth of vehicle ownership and road infrastructure expansion is observed in 35 cities across 50 countries [36]. A positive correlation between car usage and highway expansions between 1982 and 2009 is demonstrated in the United States, too [37]. An empirical study indicates that highway expansions in the city centers of US metropolises cause an average 18% decrease in inhabitants in the city centers [38]. At the same time, a negative correlation between highway expansion and public transport ridership is shown for the Montreal region, Canada [39]. All these important findings demonstrate the linkage between urban sprawl, road expansion, car usage, and transit ridership.
Furthermore, the perspective of trip dimension is an important parameter for car usage, as well. A study focusing on the tour-based modeling approach analyzes how to trip duration and trip purpose affect mode choice in Seattle, US [40]. The results of the study indicate that a 10% increase in car travel time for commuting triggers a 3.1% increase in public transport demand while raising car travel time by 10% for non-work trips increases the public transport demand by 2.3%.
In terms of the release of transport-related CO2 emissions, the US is the leading country in the world [41]. The emissions of the US equal approximately 25% of the global transport-related CO2 emissions. Overall, the external costs (excluding congestion) of road transport in the EU, including Norway and Switzerland, are calculated to be more than EUR 500 billion, i.e., 4% of the total GDP in 2008 [42]. A recent work [4] investigates the transport-related CO2 emissions of urban areas with the directly observable open-source data of 57 cities across 33 countries to assess environmental impacts. A linear model for transport-related CO2 emissions of urban areas is calibrated, where CO2 emissions increase with the rise of road infrastructure per capita.
A review study analyzes and classifies 137 papers from the literature covering car-sharing systems in the last 15 years [43]. The study demonstrates that car-sharing extends with an increase in population density, and multimodal transport networks as well as sharing systems result in a drop in car ownership.
Public Transportation
Urban rail transit has many advantages compared to road-based urban mobility. These advantages include a relevant value of passenger capacity with higher speed travel, guaranteed travel time, and lower transport-related emissions [44]. A study shows interesting modal shift outcomes in connection with the construction of light rail transit (LRT) infrastructure: 17–37% of former car drivers shift their travel mode toward LRT in Nantes, 21% switch to Blue Line LRT in San Diego, and 22% choose Super-tram LRT instead of a car in Sheffield [45]. A study demonstrates differences in long-term car ownership in six Asian megacities located in China, Japan, and Thailand [46]. The research presents that cities with low railway intensity have a sharp rise in car ownership, while cities with high railway intensity have a relatively slow rise. The rail–bus infrastructure replacement results in a significant increase in transit ridership from 95% to 350% in the major corridors of Los Angeles [47].
Bus Rapid Transit (BRT) is a sustainable alternative to road-based urban transportation, where bus infrastructure is segregated, which comes up with high social acceptance. BRT expansion results in a 125% increase in public transport ridership in Dublin [48], while BRT infrastructure build-up results in a 40% modal shift from car to O-Bahn BRT in Adelaide [49].
A positive impact of rail network expansion is shown in the increasing population density near urban rail stations, thereby strengthening the compactness of cities [50]. However, an important point is to understand how public transit affects the congestion level and travel time. Light rail corridors succeed in lowering the level of traffic on highways in Denver [51], and the average travel time reduction by 21% results in an increased ridership (i.e., 15–20%) of the Los Angeles metro system [52]. Metrobus in Istanbul with a thorough implementation of BRT elements, including an almost fully segregated infrastructure, ensures a 65% reduction in travel time [53].
Urban rail transit and BRT systems have significant economic and environmental contributions to cities. From 1980 to 2005, the net financial returns of urban rail transit in Hong Kong equal approximately USD 2.33 billion [54]. Carrigan et al. [55] demonstrate the economic benefits of travel time-saving in the case of BRT system investments; examples include USD 1830 million for Bogota, USD 6369 million for Istanbul, USD 331 million for Johannesburg, and USD 142 million for Mexico City. From 1990 to 2011, European railways showed a 14% of reduction in CO2 emissions per passenger-kilometers [56]. Based on an eight-year database of 43 cities, an analysis shows that particle matter drops by 4% in the city center following investments in the subways system [57]. The benefits provided by carbon emission reductions in the case of BRT investments are estimated to be USD 239 million for Bogota, USD 152 million for Istanbul, USD 18 million for Johannesburg, and USD 10 million for Mexico City [55].
Chester and Horvath [58] conduct a life cycle energy analysis and environmental inventory of passenger transportation in the US. The obtained results show that public transportation is more energy-efficient compared to a car, although the efficiency of public transportation depends on the passenger load factor. Regarding load factor, within all modes, the conventional bus system is the least efficient during off-peak times.
Non-Motorized Mobility
Significant modal shifts from car to cycling are observed in Denmark, the Netherlands, and other EU regions as a result of investments in cycling infrastructure [59]. A research paper focusing on cycling infrastructure demonstrates a positive correlation between bicycle infrastructure expansion and bicycle usage in 43 US urban areas [60]. Estimations for US cities demonstrate that completing the sidewalk network reduces car travel by 5% and increases non-motorized travel by 16% [61]. A review study on bike-sharing systems shows that such services reduce the kilometers traveled by car up to 20% [62].
The systematic classification of the benefits of cycling is reported in [63]. The results show that the overall economic benefits of cycling in the EU were EUR 513 billion in 2016. The promotion of bike–train–bike journeys results in a higher percentage of passengers combining cycling and public transport in Denmark [64]. A rise in the modal share of walking and cycling modes increases the GDP of German cities by 1.11% [65].
A complete life cycle assessment (LCA) is conducted to compare transportation modes including walking, cycling, and e-cycling [66]. The results show that the life cycle energy usage of the modes is 102 KJ/PMT (kilojoules/passenger miles traveled) for walking, 319 KJ/PMT for biking, and 356 KJ/PMT for e-biking. Besides, biking and walking are the most energy-efficient and environmentally friendly modes. Furthermore, electric bicycles emit 90% fewer pollutants per passenger mile traveled compared to a bus operating off-peak.
Infrastructure Design
In the recent past, urban morphologists made great strides in comprehending the structure and dynamics of urban transportation networks through network topology analyses by applying graph theory [69]. The configuration of networks helps to assess transportation performance [70], to identify the travel behavior of inhabitants [71], and to understand precisely how urban areas are organized [72]. Complex network analysis is a highly effective evaluation tool to correct, improve, and upgrade urban transport networks [73].
Network circuity is a crucial way of measuring the effectiveness of transportation networks [69]. The average circuity of a network (i.e., network directness) is the ratio of the shortest distance averaged to the Euclidean distance averaged over all origin-destination pairs of a network [74]. The circuity of public transport networks is studied for 36 metropolitans in the US [71]. The results reveal that public transit circuity exponentially declines as travel time increases. Public transport networks are more circuitous than road networks, which means that the transit network route is much longer than the line of sight. This is supposed to be one of the reasons behind the preference for cars over public transport.
Networks can be well-connected but still poor in regard to directness. Hence, connectivity and directness should be examined unitedly [75]. A positive correlation is demonstrated between road congestion and the average network circuity, and a negative correlation is shown between the average network circuity and the average network disconnectivity for 48 cities in the US [70]. By comparing the hierarchy, connectivity, and directness (i.e., circuity) of road networks, another research compares the road transportation performance of the 50 largest metropolitan areas in the US [76]. The results show that a 1% increase in the average network connectivity reduces the commuting time by 0.1%, and a 1% increase in the average network disconnectivity reduces the car mode share by 0.061%. A recent thesis examines the relationship between the average daily extra travel time (ADETT) and transport network parameters for 86 cities across over 32 countries [74]. The results demonstrated that an increase in the average road connectivity, meanwhile a decrease in the average road circuity eases road congestion, most likely because the road traffic is distributed more homogeneously over the network. Furthermore, the same situation for sustainable network systems (i.e., railways and cycleways) alleviates road congestion, too. Car users can be convinced with well-connected alternative networks with short and direct routes to shift toward alternative modes, which decreases road traffic volumes.
2.2.2. Land-Use
This section focuses on how land use is connected with other socio-technical factors and system externalities as well as how the user choices are related to land use. Many studies demonstrate that cities with a higher population density tend to use public transport or active modes to a greater extent (for example New York Metropolitan Region —see [77]). Furthermore, a private vehicle is less preferred in denser zones (for example in the metropolitan area of Milan—see [78]). Moreover, the residents of mixed-use designed cities with a high population density tend to drive considerably less than others (for example in US cities—see [79,80]). Major cities in China with a higher population density increase the accessibility of public transport services and shorten travel distance and trip duration compared to other cities [81].
A study investigates the relationship between population density, infrastructure accessibility (i.e., infrastructure per capita—IA), and traffic congestion for 151 cities across 51 countries [29]. The calibrated models indicate that high road accessibility leads to lower congestion levels, in particular for the cities with a low population density, while in general, cities with a high population density have lower congestion levels if the accessibility of rail infrastructure is high. Once comparing both situations, it can be seen that an increase in the accessibility of rail infrastructure reduces road congestion four times more than an increase in road infrastructure accessibility. Note that the changes in demography influence land use and the cycle of transport feedback, as demonstrated by Wegener’s scheme [82]. High population growth causes land expansion; thus, this situation changes transport demand–supply balance and influences travel decision-making.
Figure 3 demonstrates a multi-variant graph of 151 worldwide cities created with the dataset provided in [29] to understand the multi-relationship between the factors deeper. The dataset includes all types of infrastructure accessibility (i.e., represented by m per 10 inhabitants), the average daily extra travel time (ADETT), the population density, and the GDP per capita. The graph represents the exponential relationship between the ADETT and road infrastructure accessibility, where the bubble size is proportional to the population density. The scaling of other types of infrastructure accessibility is summarized in Table 1. The filled bubble’s color shows Railway IA (red = RIA > 1100, orange = 223 < RIA < 1100, green = RIA < 223, non-color = RIA ≈ 0), the bubble’s border color demonstrates Cycleway IA (red = CIA > 1500, orange = 200 < CIA < 1500, green = 10 < CIA < 200, blue = CIA < 10), and the color of the starred city labels represents BRT IA (red = BIA > 150, green = BIA < 150, non-mark = BIA = 0). In the ADETT interval of 14–34 min, a cluster of cities can be seen below the exponential trendline with common characteristics: a medium level GDP per capita, high urban railway and bike infrastructure accessibility, but relatively low road infrastructure accessibility. Within the same range of travel delays, there is a cluster of cities above the trendline, as well. These cities feature generally a higher GDP per capita, a high road infrastructure accessibility, and a low level of railway infrastructure accessibility or the total absence of urban railways. All of the cities above the trendline are denoted by low population densities, too. In this ADETT interval, most cities under the trendline are European cities, while most cities above the trendline are US cities. In the ADETT interval of 34–44 min, cities have generally an average GDP per capita, a lower road infrastructure accessibility, and lower accessibility of cycleway infrastructure. In this ADETT interval, cities are in various regions of the world. The highest congestion delays with over 44 min of ADETT is shown in cities with a low network infrastructure accessibility, a low GDP per capita, and a low cycleway infrastructure accessibility (i.e., none of these cities is among the 25% of the cities with the highest cycleway accessibility). Most of the highly congested cities are located in Asia. It is surprising to see that cities with a high BRT infrastructure accessibility are more frequent in the cluster of 14–34 min ADETT interval and under the exponential trendline where there is the cluster with the highest multimodal infrastructure accessibility. Generally, cities with a high BRT infrastructure accessibility are in South America. It is observed that Amsterdam has one of the lowest road infrastructure accessibility levels among cities, but it has the highest multimodal infrastructure accessibility as well as railways, cycleways, and BRT lines, which appears to reduce congestion levels.
Brownstone and Golob [83] present a joint model of vehicle usage, residential density, and fuel consumption. The researchers’ main findings indicate that a decrease in the population density by 386 housing units per one square kilometer results in an increase in kilometers driven per year by 1931 and 246 more liters of gasoline used per household. A recent study [84] focuses on transport energy consumption for 57 cities worldwide to understand how it relates not only to population density but to transport infrastructure, too. The study presents several calibrated models to define this triangular relationship, in which a hyperbolic function shows the best fit between population density and transport energy consumption, which demonstrates the rapid increase in energy consumption. Furthermore, the results estimate that the accessibility of road infrastructure drops with one over the square root of the population density. Moreover, the results identify road infrastructure expansion as causing urban sprawl and high car share, which are the main reasons for the high transport energy usage.
2.2.3. Natural Environment
This section focuses on the natural environment, which is an indispensable factor affecting users’ choices and system externalities. The geomorphological features of many cities including mountains, valleys, and water bodies could make the implementation of conventional urban transport modes challenging [85]. Ropeways, which are built on an aerial rope, or suspended rail tracks comparable to a capacity of medium-sized trams, are the primary alternatives considered in hilly cities [86]. A study provides an overview of urban ropeway systems including the reasons for building these systems, their characteristics, benefits, and limitations to be fully recognized as transport mode [85]. The results demonstrate that ropeway systems are more effective than conventional transport modes for hilly cities. Furthermore, the study shows that ropeway ridership is higher than expected. On the one hand, there are the advantages of low operating costs and reduced environmental impact; on the other hand, disadvantages include the forced shutdowns by high winds, storms, and privacy issues related to lines passing over private property.
The geomorphology of cities can trigger another challenge in the usage of non-motorized modes. The hilliness of cities is an important parameter in the case of choosing the bike mode; a 10% increase in the hilliness results in the reduction in biking commuters by 8.93% [87]. Besides, walkability depends on the comfort and ease of footways with around 8% hilliness as a limit [88].
Other transport modes to mention in the case of cities surrounded by water bodies are ferries or waterbuses. Existing waterborne public transport systems are assessed in a study worldwide [89]. The results show that the benefits of shifting transport modes to waterways are lower travel times, higher passenger numbers, and reduced environmental impacts.
Obviously, climate conditions and weather vary over the cities affecting travel behavior and urban transport performance. A review study assesses findings from all over the world based on the relationship between weather conditions and travel behavior [90]. The review demonstrates that cycling is the most elastic to weather changes, where up to 80% of the fluctuation of daily biking can be explained by weather changes. It is found that bike usage increases with a rise in temperature up to 25 °C. Furthermore, snowing is the major factor, which negatively impacts bike usage, while precipitation and wind speed drops biking to a moderate level of usage. The review shows that users tend to shift from non-motorized modes to the car and public transport during rainy days, while car usage peaks under low-temperature conditions.
A number of studies assess the impacts of weather conditions on urban transportation considering traffic speed, travel time, accidents, and infrastructure damage. The impact of weather events on macroscopic travel times in the Greater London area (UK) is investigated to integrate weather-related data into traffic operations [91]. The results show that the total travel time increases by up to 6% during heavy rain, while heavy snow causes an up-to-15% rise in travel time due to the deterioration of road network performance. A review study states that the number of road accidents increases up to 75% during heavy rain and the number of related injuries by up to 45% in mid-sized Canadian cities [92]. The rate of increase for both cases is higher during heavy snowfall. A case study in Newcastle, UK, demonstrates that the implementation of both green roof infrastructure and floodwalls strategies reduces transport-related damages and enhances the travel time improvements during flooding up to 22% [93].
2.2.4. Technology
This section focuses on technological improvements, which play a key role in socio-technical transformations. The energy conversion rates of passenger car types are compared [94]. The results show that electric vehicles (EVs) have a 60% higher energy conversion rate than that of internal combustion engines (ICEs) and 50% higher than that of hydrogen cars. In addition, hybrid cars (HEVs) are 35% more fuel-efficient compared to ICE vehicles [95]. A complete LCA of different passenger cars is conducted by Nordelöf et al. [96]. The obtained results indicate that battery electric vehicles (BEV) have the lowest lifetime GHG emissions, followed by HEVs.
There are significant improvements in the size and capacity of electric batteries, and recent improvements in EVs help to drop carbon emissions. A study shows that the electrification of bus systems delivers 37% of fuel-saving in New York City [97]. Another study shows that a shift from diesel to electricity for Bogota TransMilenio BRT buses reduces CO2-eq emissions by 86% and PM2.5 emissions by 88% [98]. Furthermore, relatively lower noise and vibration can be enhanced by operating e-buses [99]. Many studies on the electrification of transport systems are conducted in Europe [100]. The project entitled: “ELIPTIC—Electrification of public transport in cities” is completed in the EU Horizon 2020 program [101]. The project strengthens the role of electrification for public transit systems to provide higher air quality in Barcelona, Bremen, Brussels, Eberswalde, Gdynia, Lanciano, Leipzig, London, Oberhausen, Szeged, and Warsaw.
Due to environmental concerns, electrification has been trending up in recent years. According to the International Energy Agency [102], the BEV and PHEV (i.e., Plug-in Hybrid Electric Vehicle) sales shares of many countries and the shift to e-vehicles and e-car registration grew within 2010–2016. Comparing 2016 to 2012 in the IEA report, the sales scores show that China doubled the number of BEV and in the US there is an around 50% increase in the number of BEV.
In particular, Information and Communications Technology (ICT) is a key element in intelligent transportation systems, and its diffusion is pivotal to improve their performance. Global smartphone ownership has a median of 72% across the developed countries, and internet usage had a median of 87% in 2018 [103]. This information renders intelligent transportation system applications an important tool to help in optimizing urban mobility systems. ICT increasingly improves urban transport systems by enabling the efficient and effective use of travel information and vehicle use as well as developing network management [4]. In the UK, due to the lack of synchronization, 23% of the travel time is lost during transfer from one to another transportation mode in the case of multimodal trips [104]. The contribution of ICT services to urban mobility is shown in several studies. The function of some services and their benefits are reviewed [4]; results are summarized in Table 2. The findings of this study highlight the benefits of ICT applications, such as travel time saving, travel cost-saving, road congestion alleviation, and modal shift depending on the service type.
Furthermore, ICT has brought along a new concept to transport service called Mobility-as-a-Service (MaaS) aiming at a shift away from personally-owned modes of mobility. A recent paper reviews 57 MaaS-focused studies for a comprehensive understanding of the concept [105]. The paper highlights the MaaS concept as a system, which fulfills the mobility requirements (i.e, travel plan, payment, access) of users in a single application. Furthermore, the review presents some examples of the benefits of the MaaS applications. For example, in the case of Ubigo, the application users state the benefits as delaying the purchase of a car, shifting toward public transport, shifting toward bicycle, and shifting toward walking accounting for 36%, 35%, 17%, and 17% of the total, respectively.
2.2.5. Policies
A number of policies aiming at stressing such points as the reduction in carbon emissions and congestion can contribute to a modal shift toward sustainable modes of transport (i.e., public transport). For example, London’s congestion charge is an exceptional case of such a strategy [106]. Congestion charging resulted in an 11% overall reduction in vehicle kilometers in London between 2002 and 2012. There was a 28% decline in car crashes, and the net revenues were calculated to be EUR 123 million in 2007 [107]. A congestion charging policy applied in Stockholm reduces approximately 20% of the traffic volume and GHG emissions [108].
Bus priority policies bring important benefits to cities. For example, there is a 52% reduction in the average public transport waiting times at the traffic lights in Toulouse, an increase in the frequency of service from 10 min to 7.5 min, and an up-to 4% punctuality of the system in Malmö [107]. The city of Copenhagen implements mixed-use regulations regarding public transport connections, station proximity, and parking management policies [109]. As a result of the successful implementation of a combination of policies, transfer times within modes are quite low, public transport accessibility is high, and GHG emission is reduced by a significant level.
Some policies aim to reduce the growth of vehicle fuel consumption by limiting vehicle usage or vehicle ownership. The limitation of vehicle ownership in Shanghai and the limitation of vehicle usage in Beijing result in some differences in the number of passengers per vehicle, GDP per capita, and vehicle type structure [110]. As a result of policy analysis, the study shows that the fuel consumption in Shanghai is reduced by 59.4% and in Beijing by 5.7%, which demonstrates that the limitation of vehicle ownership is more viable in terms of reducing fuel consumption.
3. Holistic View
Based on the background constructed concerning practice theory, it is highlighted above how the sociocultural identity and built environment including their association are connected to user choices and, in turn, to the externalities of a socio-technical system. The performance of an urban transportation system and the preference of any transportation mode are derived from how the environment is built, and how the sociocultural identity is composed. As stated in the EC mobility targets [5], focusing first on people rather than on the technical aspects is an approach of the current paper, too. Therefore, this integrative review deeply investigates travel mode choice under different sociocultural and built environmental conditions to understand how to provide a shift toward cleaner and more sustainable transport modes.
The modal shift is a crucial element since a prominent increase in public transport and non-motorized modes significantly reduces transport-related energy consumption, travel time, and traffic congestion. As a result, air pollution levels, emissions, and transport costs can be lightened. The present review investigates two major built environment factors: the infrastructure and the land use, as well as the natural environment, technology, and recent policies. These factors are examined to understand how to create an accessible system that provides social equity and how to minimize the socio-economic and environmental impact of urban mobility systems. The internal relationship between these factors and their relations with other factors are investigated by questioning how these relationships influence the modal shift, the congestion level, the travel times, the transport-related energy consumption, the travel costs, and the environmental impacts.
Some of the parameters and their connections can be more significant on the user choices and the sustainability of the system than others. The degree of these associations can be identified with a system dynamics model, and this model can be simulated to withdraw an optimal solution. The coefficients of this model primarily depend on geographical location as each location has unique urban morphology and different value judgment. Furthermore, the urban transportation system is directed by national and local governors; thus, they grab a big slice of the history in the evolution of the urban transport system. Therefore, the most important variant of the system is governance. Transport governance is studied, and how governmental differences can affect user choice, urban environment, and system externalities is stated in several studies (see for governmental perspectives on climate change mitigation in transportation—[9,111]; for the historical evolution of cycling governance and the governance’s influence on cycling usage—[112]; for multi-level governance efforts to enhance the decarbonized transportation—[10]). Nevertheless, there is an important question to ask: who governs? As Dahl [113] says “the question has been asked, I imagine, wherever popular government has developed and intelligent citizens have reached the stage of critical self-consciousness concerning their society.”. Every adult can vote in democratic countries; however, knowledge level, wealth level, social position in the societies are not equally distributed [113]. Therefore, there is a bidirectional relationship between the governance and the society, in which the composition of sociocultural identity can be the reflection of how society would like to be governed.
In order to draw a holistic view, an innovative model perspective for urban mobility system dynamics, which can be utilized by transport scientists and transport planners, is presented. This model perspective is constructed based on the practice theory to provide a holistic view, in which the transport system is identified on the basis of a series of indicators and the interaction among them. The model perspective is shown in Figure 4. The glossary for the abbreviations used in Figure 4 is shared in Table 3. The arrows in Figure 4 demonstrate how any system dynamics affect each other with interpretative and guiding signs: plus and minus. The outermost bubble presents the governance. By the outermost bubble, the outgoing arrows demonstrate that governors have an influence upon whole system dynamics, in which the urban environment is built by the local governments, and the society is controlled by the rules established by national and local governments. Therefore, national and local governments are primarily responsible for system externalities.
The left bubble demonstrates the sociocultural identity of a community in which the sociocultural composition is shown with the internal boxes. The collective factors in the presented left bubble determine how society will be governed. Sociocultural composition is vital when planning how to enhance the modal shift toward more sustainable modes. The sociocultural identity of a community preforms the user choices. The outgoing arrows from these internal boxes show how these factors influence user-mode preferences and the built environment as well as how indirectly the system externalities such as transport-related costs, air pollution, and CO2 emissions are affected. These dynamics highlight that social variation in the urban areas shapes the travel mode choices along with such factors as culture, the nature of demography, educational level, and income level. Therefore, to draft any urban mobility planning, understanding the sociocultural identity of a community has paramount importance. Looking through cities’ demographical composition and cultural values, the socio-economic conditions of cities and the acceptance levels of alternative systems can be detected. The socio-economically disadvantaged people are a major part of the societies, where geomorphological and climate conditions are varied. Increasing the accessibility by alternative modes of transport supports social equity. Following all, a transportation system must serve diverse demands including culture, different genders, vulnerable users, and ethnic factors.
The right bubble presents the built environment, in which the technical factors are presented with internal boxes. The outgoing arrows show how the built environment induces the travel mode choice toward such factors as land use, infrastructure accessibility, infrastructure design, technology, policies, and natural environment, which directly affect the system externalities, such as transport-related costs, air pollution, and GHG level. These arrows show that any change of transport infrastructure catalyzes the land area growth; therefore, these factors should be considered together in urban transport planning. Land use and transport infrastructure are the two major physical characteristics that compose the urban form. Moreover, land use is influenced by demographical factors like population growth as shown with an arrow. A high increase in an urban population in the long term can cause urban sprawl, and in turn, this situation can bring challenges to meet the growing demand for transport infrastructure. Furthermore, the arrow associations demonstrate that cities getting sprawled and with low alternative network accessibility result in very high car usage, which in turn, causes significant socio-economic and environmental costs.
Infrastructure investments are crucial for shifting toward public and active transport. Thus, the literature review demonstrates that if these infrastructure investments are made, they will be used by travelers as reflected by the arrows of Figure 4. However, to keep the interest of public transportation at high levels, focusing on alternative mobility systems based on separated tracks such as rail transit and BRT systems is vital. The functionality of conventional bus systems is reduced as a result of rising traffic congestion caused by the increasing population in many cities. Cities with well-planned and suitable alternative mobility systems can trigger the modal shift of car users, which alleviates road congestion, travel costs, and environmental impacts. In literature, the high social acceptability of rail–transit systems coming with a faster modal shift from private vehicles is observed, especially in dense cities. Therefore, the densification of urban areas increases the functionality of alternative systems and in turn, results in a modal shift, which is demonstrated by the arrows in Figure 4. Additionally, as shown by the arrows, to further encourage the modal shift from car use, alternative networks should be designed with highly connected paths and less circuity providing high-speed access to the final destination thus allowing a reduction in the traffic volume.
Some dynamics presented with the outgoing arrows from technology and local policies act as infrastructure optimization tools and reduce the negative externalities of the urban transportation system. Based on the literature, the electrification of mobility systems appears to be the best choice in terms of energy efficiency and environmental impacts compared to other currently available technologies. Furthermore, the technological improvements in the field of ICT increase the functionality of multimodality with improving multimodal network management and assist in shifting toward sustainable modes by providing the effective use of travel information, integrated ticketing option, and reliable planning tool. Policies, such as pricing and proximity regulations, significantly help to reduce car usage while increasing the efficiency of sustainable transport modes.
Furthermore, the natural environment can constrain the user choices, and weather conditions can shape the user choices temporarily. As shown with the arrows, extreme weather conditions and some geomorphological factors, such as hilliness, can limit non-motorized mode preference, especially for biking. In addition, the natural environment like water bodies and high altitude settlements can lead the users to a change toward unconventional modes such as waterbus or ropeway.
4. Conclusions
This review study focuses on socio-technical factors shaping the urban transportation system. This study is the first systematic review that covers every driver of the transportation system. Practice theory is applied in this study as a background to construct the theoretical structure of the review topic. The approach of the review is human-centric and abductive. Firstly, the built environment and sociocultural structure including their association are synthesized by concerning the user choices, and the influence of these synthesizes on the system externalities is identified. Thereafter, an innovative system model perspective is presented as integration of interrelations among the system dynamics as well as their influence on transport users and system externalities. This is the first holistic model perspective for the urban transportation system. As a result, two vital steps of sustainable transportation planning are delivered with this review study, which are the understanding of user choices to increase the attractiveness of sustainable transportation modes along with the co-evaluation of the built environment and sociocultural identity, and the understanding of under which socio-technical conditions an urban transport system can minimize its socio-economic costs and environmental impacts. In a nutshell, the review pinned down the key factors promoting transport sustainability. Therefore, the current paper provides important observations for practitioners to review their transportation policies toward sustainable development, and a useful documentation for scholars. As the review topic is very broad, the present article did not elaborate on the governance of urban transportation more in-depth. Future work aims to concern the governance of socio-technical transition towards a post-car city. Understanding the governance of that type of radical mobility transitions and integrating the possible pathways of these transitions would contribute to change the ideology of transport planners and policymakers in the direction of car-free cities.
Author Contributions
Conceptualization, A.E.D.; methodology, A.E.D.; software, A.E.D.; formal literature analysis, A.E.D.; literature investigation, A.E.D., F.R.; writing—original draft preparation, A.E.D.; writing—review and editing, A.E.D., F.R., D.E.-K.; visualization, A.E.D. All authors have read and agreed to the published version of the manuscript.
Funding
This research received no external funding.
Institutional Review Board Statement
Not applicable.
Informed Consent Statement
Not applicable.
Data Availability Statement
Not applicable.
Conflicts of Interest
The authors declare no conflict of interest.
References
- EU Commission. Sustainable Urban Mobility: Policy Context. 2017. Available online: https://ec.europa.eu/transport/sites/transport/files/2017-sustainable-urban-mobility-policy-context.pdf (accessed on 15 August 2019).
- Awasthi, A.; Chauhan, S.S.; Goyal, S.K. A multi-criteria decision making approach for location planning for urban distribution centers under uncertainty. Math. Comput. Model. 2011, 53, 98–109. [Google Scholar] [CrossRef]
- Priester, R.; Miramontes, M.; Wulfhorst, G. A Generic Code of Urban Mobility: How can Cities Drive Future Sustainable Development? Transp. Res. Procedia 2014, 4, 90–102. [Google Scholar] [CrossRef]
- Dingil, A.E. Socio-Technical Factors Fostering Sustainability in Urban Transportation: A Worldwide Analysis. Ph.D. Thesis, KTU Publishing House, Kaunas, Lithuania, 2020. ISBN 978-609-02-1666-8. Available online: http://amsdottorato.unibo.it/9491/ (accessed on 20 June 2020).
- EU Commission. Sustainable Urban Mobility: European Policy, Practice and Solutions. 2017. Available online: https://ec.europa.eu/transport/sites/transport/files/2017-sustainable-urban-mobility-european-policy-practice-and-solutions.pdf (accessed on 15 August 2019).
- Roztocki, N.; Weistroffer, H.Z. Information and Communication Technology in Transition Economies: An Assessment of Research Trends. Inf. Technol. Dev. 2015, 21, 330–364. [Google Scholar] [CrossRef]
- Ewing, R.; Cervero, R. Travel and the Built Environment: A Synthesis. Transp. Res. Record 2001, 1780, 87–114. [Google Scholar] [CrossRef] [Green Version]
- Bryman, A.; Bell, E. Business Research Methods, 4th ed.; Oxford University Press: Oxford, UK, 2015; p. 27. [Google Scholar]
- Schwanen, T.; Banister, D.; Anable, J. Scientific research about climate change mitigation in transport: A critical review. Transp. Res. Part A Policy Pract. 2011, 45, 993–1006. [Google Scholar] [CrossRef] [Green Version]
- Hampton, S. Policy implementation as practice? Using social practice theory to examine multi-level governance efforts to decarbonise transport in the United Kingdom. Energy Res. Soc. Sci. 2018, 38, 41–52. [Google Scholar] [CrossRef]
- Van Wee, B.; Banister, D. How to Write a Literature Review Paper? Transp. Rev. 2016, 36, 278–288. [Google Scholar] [CrossRef] [Green Version]
- Van der Borg, J.; Russo, A.P. The Impacts of Culture on the Economic Development of Cities. European Institute for Comparative Urban Research (EURICUR), Report, Erasmus University Rotterdam. 2005. Available online: https://platform.europeanmoocs.eu/users/2957/impatto-della-cultura.pdf (accessed on 10 February 2020).
- Aldred, R.; Jungnickel, K. Why culture matters for transport policy: The case of cycling in the UK. J. Transp. Geogr. 2014, 34, 78–87. [Google Scholar] [CrossRef] [Green Version]
- Hofstede, G. Culture’s Consequences: International Differences in Work-Related Values; Sage: Beverly Hills, CA, USA, 1980. [Google Scholar]
- Inglehart, R. Modernization and Postmodernization: Cultural, Economic, and Political Change in 43 Societies; Princeton University Press: Princeton, NJ, USA, 1997. [Google Scholar]
- Dingil, A.E.; Rupi, F.; Schweizer, J.; Stasiskiene, Z.; Aalipour, K. The Role of Culture in Urban Travel Patterns: Quantitative Analyses of Urban Areas Based on Hofstede’s Culture Dimensions. Soc. Sci. 2019, 8, 227. [Google Scholar] [CrossRef] [Green Version]
- Ashmore, D.P.; Christie, N.; Tyler, N.A. Symbolic transport choice across national cultures: Theoretical considerations for research design. Transp. Plann. Technol. 2017, 40, 875–900. [Google Scholar] [CrossRef]
- Syam, A. Cultural Values: A New Approach to Explain People’s Travel Behaviour and Attitudes toward Transport Mode. Doctoral Dissertation, University of Auckland, Auckland, New Zealand, 2014. Available online: https://researchspace.auckland.ac.nz/handle/2292/23559 (accessed on 15 August 2019).
- André, I.; Carmo, A.; Abreu, A.; Estevens, A.; Malheiros, J. Learning for and from the City: The Role of Education in Urban Social Cohesion. Belge.–Belg. J. Geogr. 2012, 13. [Google Scholar] [CrossRef] [Green Version]
- Buckler, C.; Creech, H. Shaping the Future We Want: UN Decade of Education for Sustainable Development (2005–2014), Final Report; UNESCO: Paris, France, 2014; Available online: https://sustainabledevelopment.un.org/index.php?page=view&type=400&nr=1682&menu=35 (accessed on 15 August 2019).
- Clery, E.; Rebecca, R. Education and Attitudes towards the Environment. Paper Commissioned for the EFA Global Monitoring Report 2013/4. 2013. Available online: https://unesdoc.unesco.org/ark:/48223/pf0000225928 (accessed on 15 August 2019).
- Limtanakool, N.; Dijst, M.; Schwanen, T. The influence of socioeconomic characteristics, land use and travel time considerations on mode choice for medium-and longer-distance trips. J. Transp. Geogr. 2006, 14, 327–341. [Google Scholar] [CrossRef]
- Coll, M.H.; Vandersmissen, M.H.; Thériault, M. Modeling Spatio-Temporal Diffusion of Carsharing Membership in Québec City. J. Transp. Geogr. 2014, 38, 22–37. [Google Scholar] [CrossRef]
- Dias, F.F.; Lavieri, P.S.; Garikapati, V.M.; Astroza, S.; Pendyala, R.M.; Bhat, C.R. A Behavioral Choice Model of the Use of Car-Sharing and Ride-Sourcing Services. Transportation 2017, 44, 1307–1323. [Google Scholar] [CrossRef]
- Handy, S.L.; Xing, Y.; Buehler, T.J. Factors associated with bicycle ownership and use: A study of six small U.S. cities. Transportation 2010, 37, 967–985. [Google Scholar] [CrossRef]
- Santos, G.; Maoh, H.; Potoglou, D.; von Brunn, T. Factors influencing modal split of commuting journeys in medium-size European cities. J. Transp. Geogr. 2013, 30, 127–137. [Google Scholar] [CrossRef]
- Pucher, J.; Renne, J. Rural mobility and mode choice: Evidence from the 2001 National Household Travel Survey. Transportation 2005, 32, 165–186. [Google Scholar] [CrossRef]
- Paulley, N.; Balcombe, R.; Mackett, R.; Titheridge, H.; Preston, J.M.; Wardman, M.R.; Shires, J.D.; White, P. The demand for public transport: The effects of fares, quality of service, income and car ownership. Transp. Policy 2006, 13, 295–306. [Google Scholar] [CrossRef] [Green Version]
- Dingil, A.E.; Schweizer, J.; Rupi, F.; Stasiskiene, Z. Transport indicator analysis and comparison of 151 urban areas, based on open source data. Eur. Transp. Res. Rev. 2018, 10, 58. [Google Scholar] [CrossRef] [Green Version]
- Vance, C.; Iovanna, R. Gender and the automobile: Analysis of nonwork service trips. Transp. Res. Record 2007, 2013, 54–61. [Google Scholar] [CrossRef] [Green Version]
- Rubin, O.; Mulder, C.H.; Bertolini, L. The determinants of mode choice for family visits—Evidence from Dutch panel data. J. Transp. Geogr. 2014, 38, 137–147. [Google Scholar] [CrossRef] [Green Version]
- McCarthy, L.; Delbosc, A.; Currie, G.; Molloy, A. Factors influencing travel mode choice among families with young children (aged 0–4): A review of the literature. Transp. Rev. 2017, 37, 767–781. [Google Scholar] [CrossRef]
- Ashalatha, R.; Manju, V.S.; Zacharia, A.B. Mode Choice Behavior of Commuters in Thiruvananthapuram City. J. Transp. Eng. 2013, 139, 494–502. [Google Scholar] [CrossRef]
- Böcker, L.; van Amen, P.; Helbich, M. Elderly travel frequencies and transport mode choices in greater Rotterdam, the Netherlands. Transportation 2016, 44, 831–852. [Google Scholar] [CrossRef] [Green Version]
- Gauvin, L.; Tizzoni, M.; Piaggesi, S.; Young, A.; Adler, N.; Verhulst, S.; Ferres, L.; Cattuto, C. Gender gaps in urban mobility. Humanit. Soc. Sci. Commun. 2020, 7, 11. [Google Scholar] [CrossRef]
- Ingram, G.; Liu, Z. Determinants of motorization and road provision. In Essays in Transportation Economics and Policy; Brookings Institution Press: Washington, DC, USA, 1999; pp. 325–356. Available online: https://papers.ssrn.com/sol3/papers.cfm?abstract_id=569257 (accessed on 25 September 2019).
- Melo, P.S.; Graham, D.J.; Canavan, S. Effects of road investments on economic output and induced travel demand evidence for urbanized areas in the United States. Transp. Res. Rec. 2012, 2297, 163–171. [Google Scholar] [CrossRef]
- Baum-Snow, N. Did Highways Cause Suburbanization? Q. J. Econ. 2007, 122, 775–805. [Google Scholar] [CrossRef] [Green Version]
- Chakour, V.; Eluru, N. Examining the influence of urban form and land use on bus ridership in Montreal. Procedia-Soc. Behav. Sci. 2013, 104, 875–884. [Google Scholar] [CrossRef] [Green Version]
- Frank, L.; Bradley, M.; Kavage, S.; Chapman, J.; Lawton, T.K. Urban form, travel time, and cost relationships with tour complexity and mode choice. Transportation 2008, 35, 37–54. [Google Scholar] [CrossRef]
- International Energy Agency (IEA). CO2 Emissions from Fuel Combustion, Highlights; IEA: Paris, France, 2011; p. 66. Available online: https://www.iea.org/reports/co2-emissions-from-fuel-combustion-overview (accessed on 15 August 2019).
- Van Essen, H.; Schroten, A.; Otten, M.; Sutter, D.; Schreyer, C.; Zandonella, R.; Maibach, M.; Doll, C. External Costs of Transport in Europe, Update Study for 2008, Report for CE Delft, Commissioned by International Union of Railways (UIC). 2011. Available online: https://www.cedelft.eu/publicatie/external_costs_of_transport_in_europe/1258 (accessed on 15 August 2019).
- Ferrero, F.; Perboli, G.; Rosano, M.; Vesco, A. Car-sharing services: An annotated review. Sustain. Cities Soc. 2018, 37, 501–518. [Google Scholar] [CrossRef]
- Yang, Y.; Zhang, P.; Ni, S. Assessment of the Impacts of Urban Rail Transit on Metropolitan Regions Using System Dynamics Model. Transp. Res. Procedia 2014, 4, 521–534. [Google Scholar] [CrossRef] [Green Version]
- Lee, S.S.; Senior, M.L. Do light rail services discourage car ownership and use? Evidence from Census data for four English cities. J. Transp. Geogr. 2013, 29, 11–23. [Google Scholar] [CrossRef]
- Ito, K.; Nakamura, K.; Kato, H.; Hayashi, Y. Influence of urban railway development timing on long-term car ownership growth in Asian developing mega-cities. J. East. Asia Soc. Transp. Stud. 2013, 10, 1076–1085. [Google Scholar] [CrossRef]
- Berg, N. Boosting Ridership by Replacing Buses with Rail. CityLab Report. 2012. Available online: https://www.citylab.com/transportation/2012/09/boosting-ridership-replacing-buses-rail/3222/ (accessed on 7 October 2019).
- Heddebaut, O.; Finn, B.; Rabuel, S.; Rambaud, F. The European bus with a high level of service (BHLS): Concept and practice. Built Environ. 2010, 36, 307–316. [Google Scholar] [CrossRef] [Green Version]
- Currie, G.; Sarvi, M. New model for secondary benefits of transit priority. Transp. Res. Record J. Transp. Res. Board 2012, 2276, 63–71. [Google Scholar] [CrossRef]
- Levinson, D. Density and dispersion: The co-development of land use and rail in London. J. Econ. Geogr. 2008, 8, 55–77. [Google Scholar] [CrossRef] [Green Version]
- Bhattacharjee, S.; Goetz, A.R. Impact of light rail on traffic congestion in Denver. J. Transp. Geogr. 2012, 22, 262–270. [Google Scholar] [CrossRef]
- Levinson, H.; Zimmerman, S.; Clinger, J.; Rutherford, G. Bus rapid transit: An overview. J. Public Transp. 2002, 5, 1–30. [Google Scholar] [CrossRef]
- Yazici, M.; Levinson, H.; Ilicali, M.; Camkesen, N.; Kamga, C. A bus rapid transit line case study: Istanbul’s metrobus system. J. Public Transp. 2013, 16, 153–177. [Google Scholar] [CrossRef] [Green Version]
- Cervero, R.; Murakami, J. Rail and Property Development in Hong Kong: Experiences and Extensions. Urban Stud. 2009, 46, 2019–2043. [Google Scholar] [CrossRef]
- Carrigan, A.; King, R.; Velasquez, J.M.; Raifman, M.; Duduta, N. Social, Environmental and Economic Impacts of BRT Systems: Bus Rapid Transit Case Studies from around the World; EMBARQ and World Resources Institute: Washington, DC, USA, 2014. Available online: http://www.wrirosscities.org/research/publication/social-environmental-and-economic-impacts-bus-rapid-transit (accessed on 25 September 2019).
- International Energy Agency (IEA); International Union of Railway (UIC). IEA-UIC Energy and CO2 Railway Handbook. 2014. Available online: https://uic.org/IMG/pdf/2014_uic-iea_railway_handbook_web_low.pdf (accessed on 15 August 2019).
- Bongardt, D.; Creutzig, F.; Huging, H.; Sakamoto, K.; Bakker, S.; Gota, S.; Bohler-Baedeker, S. Low-Carbon Land Transport: Policy Handbook; Routledge, Taylor & Francis Group: London, UK, 2013; Available online: http://resolver.tudelft.nl/uuid:d8dd9dac-c3dc-4b31-b71f-23d7dfe35d70 (accessed on 25 September 2019).
- Chester, M.; Horvath, A. Environmental Life-Cycle Assessment of Passenger Transportation: A Detailed Methodology for Energy Greenhouse Gas and Criteria Pollutant Inventories of Automobiles Buses Light Rail Heavy Rail and Air. UC Berkeley: Center for Future Urban Transport: A Volvo Center of Excellence. 2008. Available online: https://escholarship.org/uc/item/5670921q (accessed on 15 August 2019).
- Pucher, J.; Buehler, R. Making cycling irresistible: Lessons from the Netherlands, Denmark, and Germany. Transp. Rev. 2008, 28, 495–528. [Google Scholar] [CrossRef]
- Dill, J.; Carr, T. Bicycle commuting and facilities in major U.S. cities: If you build them, commuters will use them. Transp. Res. Rec. 2003, 1828, 116–123. [Google Scholar] [CrossRef]
- Guo, J.Y.; Gandavarapu, S. An economic evaluation of health-promotive built environment changes. Prev. Med. 2010, 50, S44–S49. [Google Scholar] [CrossRef]
- Fishman, E. Bikeshare: A Review of Recent Literature. Transp. Rev. A Transnatl. Transdiscipl. J. 2015, 36, 92–113. [Google Scholar] [CrossRef]
- Neun, M.; Haubold, H. The EU Cycling Economy–Arguments for an Integrated EU Cycling Policy. European Cyclists’ Federation, Brussels. 2016. Available online: https://ecf.com/sites/ecf.com/files/FINAL%20THE%20EU%20CYCLING%20ECONOMY_low%20res.pdf (accessed on 15 August 2019).
- Schipperijn, J. A Northern European perspective on creating more activity friendly cities. J. Prev. Med. 2017, 103, S3–S4. [Google Scholar] [CrossRef]
- Doll, C.; Hartwig, J. Clean, Safe and Healthy Mobility Through Non-Technical Measures-Linking Individual and Public Decision Levels. In Proceedings of the International Scientific Conference on Mobility and Transport, Munich, Germany, 19–20 March 2012; p. 249. Available online: https://www.bgu.tum.de/fileadmin/w00blj/sv/PDF/Veranstaltungen/mobil.TUM_2012/Transportation_Demand_Management_mobil_TUM2012_Book__2_.pdf (accessed on 25 September 2019).
- Dave, S. Life Cycle Assessment of Transportation Options for Commuters. Massachusetts Institute of Technology (MIT), Boston. 2010. Available online: http://seeds4green.org/sites/default/files/Pietzo_LCAwhitepaper_0.pdf (accessed on 25 September 2019).
- Pucher, J.; Dill, J.; Handy, S. Infrastructure, programs, and policies to increase bicycling: An international review. J. Prev. Med. 2010, 50, 106–125. [Google Scholar] [CrossRef]
- Buehler, R.; Götschi, T.; Winters, M. Moving Toward Active Transportation: How Policies Can Encourage Walking and Bicycling. Act. Living Res. 2016. [Google Scholar] [CrossRef]
- Boeing, G. The Morphology and Circuity of Walkable and Drivable Street Networks. In The Mathematics of Urban Morphology; D’Acci, L., Ed.; Modeling and Simulation in Science, Engineering and Technology; Springer: Berlin/Heidelberg, Germany, 2018; pp. 271–287. [Google Scholar] [CrossRef] [Green Version]
- Parthasarathi, P. Network structure and metropolitan mobility. J. Transp. Land Use 2014, 7, 153–170. [Google Scholar] [CrossRef]
- Huang, J.; Levinson, D.M. Circuity in urban transit networks. J. Transp. Geogr. 2015, 48, 145–153. [Google Scholar] [CrossRef] [Green Version]
- Crucitti, P.; Latora, V.; Porta, S. Centrality in Networks of Urban Streets. Chaos 2006, 16, 015113. [Google Scholar] [CrossRef]
- Tsiotas, D.; Polyzos, S. The topology of urban road networks and its role to urban mobility. Transp. Res. Procedia 2017, 24, 482–490. [Google Scholar] [CrossRef]
- Dingil, A.E.; Rupi, F.; Stasiskiene, Z. A macroscopic analysis of transport networks: The influence of network design on urban transportation performance. Int. J. Transp. Dev. Integr. 2019, 3, 331–343. [Google Scholar] [CrossRef] [Green Version]
- Derrible, S.; Kennedy, C. Characterizing metro networks: State, form, and structure. Transportation 2010, 37, 275–297. [Google Scholar] [CrossRef]
- Levinson, D. Network Structure and City Size. PLoS ONE 2012, 7, e29721. [Google Scholar] [CrossRef]
- Chen, C.; Gong, H.; Paaswell, R. Role of the built environment on mode choice decisions: Additional evidence on the impact of density. Transportation 2008, 35, 285–299. [Google Scholar] [CrossRef]
- Camagni, R.; Gibelli, M.C.; Rigamonti, P. Urban mobility and urban form: The social and environmental costs of different patterns of urban expansion. Ecol. Econ. 2002, 40, 199–216. [Google Scholar] [CrossRef]
- Crane, R. The influence of urban form on travel: An interpretive review. J. Plan. Lit. 2000, 15, 3–23. [Google Scholar] [CrossRef]
- Zhang, L.; Hong, J.H.; Nasri, A.; Shen, Q. How built environment affects travel behavior: A comparative analysis of the connections between land use and vehicle miles traveled in US cities. J. Transp. Land Use 2012, 5, 40–52. [Google Scholar] [CrossRef] [Green Version]
- Zhao, J.; Xiao, L.; Tang, L.; Shi, L.; Su, X.; Wang, H.; Song, Y.; Shao, G. Effects of spatial form on urban commute for major cities in China. Int. J. Sustain. Dev. World Ecol. 2014, 21, 361–368. [Google Scholar] [CrossRef]
- Wegener, M. Overview of Land Use Transport Models. Handbook of Transport Geography and Spatial Systems; Hensher, D.A., Button, K.J., Haynes, K.E., Stopher, P.R., Eds.; Emerald Group Publishing Limited: Bingley, UK, 2004; Volume 5, pp. 127–146. [Google Scholar] [CrossRef] [Green Version]
- Brownstone, D.; Golob, T.F. The impact of residential density on vehicle usage and energy consumption. J. Urban Econ. 2009, 65, 91–98. [Google Scholar] [CrossRef] [Green Version]
- Dingil, A.E.; Schweizer, J.; Rupi, F.; Stasiskiene, Z. Updated models of passenger transport related energy consumption of urban areas. Sustainability 2019, 11, 4060. [Google Scholar] [CrossRef] [Green Version]
- Alshalalfah, B.; Shalaby, A.; Dale, S. Experiences with aerial ropeway transportation systems in the urban environment. J. Urban Plan. Dev. 2014, 140, 04013001. [Google Scholar] [CrossRef]
- Pojani, D.; Stead, D. Sustainable Urban Transport in the Developing World: Beyond Megacities. Sustainability 2015, 7, 7784–7805. [Google Scholar] [CrossRef] [Green Version]
- Parkin, J.; Wardman, M.; Page, M. Estimation of the determinants of bicycle mode share for the journey to work using census data. Transportation 2008, 35, 93–109. [Google Scholar] [CrossRef] [Green Version]
- Appolloni, L.; Corazza, M.V.; D’Alessandro, D. The Pleasure of Walking: An Innovative Methodology to Assess Appropriate Walkable Performance in Urban Areas to Support Transport Planning. Sustainability 2019, 11, 3467. [Google Scholar] [CrossRef] [Green Version]
- Beyer, A. Inland Waterways, Transport Corridors and Urban Waterfronts; International Transport Forum Discussion Paper No. 2018-21; OECD Publishing: Paris, France, 2018. [Google Scholar] [CrossRef]
- Liu, C.; Susilo, Y.O.; Karlström, A. Weather variability and travel behaviour–what we know and what we do not know. Transp. Rev. 2017, 37, 715–741. [Google Scholar] [CrossRef]
- Tsapakis, I.; Cheng, T.; Bolbol, A. Impact of weather conditions on macroscopic urban travel times. J. Transp. Geogr. 2013, 28, 204–211. [Google Scholar] [CrossRef] [Green Version]
- Koetse, M.J.; Rietveld, P. The impact of climate change and weather on transport: An overview of empirical findings. Transp. Res. Part D 2009, 14, 205–221. [Google Scholar] [CrossRef]
- Pregnolato, M.; Ford, A.; Robson, C.; Glenis, V.; Barr, S.; Dawson, R. Assessing urban strategies for reducing the impacts of extreme weather on infrastructure networks. R. Soc. Open Sci. 2016, 3, 160023. [Google Scholar] [CrossRef] [PubMed] [Green Version]
- Transport Environment. Energy Efficiency of Different Technologies. 2017. Available online: https://www.transportenvironment.org/sites/te/files/publications/2017_11_Briefing_electrofuels_final.pdf (accessed on 7 October 2019).
- International Energy Agency (IEA). Energy Technology Perspectives; IEA: Paris, France, 2012; p. 690. Available online: https://www.iea.org/reports/energy-technology-perspectives-2012 (accessed on 25 September 2019).
- Nordelöf, A.; Messagie, M.; Tillman, A.-M.; Ljunggren Söderman, M.; van Mierlo, J. Environmental impacts of hybrid, plug-in hybrid, and battery electric vehicles-What can we learn from life cycle assessment? Int. J. Life Cycle Assess. 2004, 19, 1866–1890. [Google Scholar] [CrossRef] [Green Version]
- Chandler, K.; Eberts, E.; Eudy, L. New York City Transit Hybrid and CNG Transit Buses: Interim Evaluation Results; Technical Report; National Renewable Energy Lab: Washington, DC, USA, 2006; p. 64. Available online: https://www.nrel.gov/docs/fy06osti/38843.pdf (accessed on 25 September 2019).
- Cuellar, Y.; Buitrago-Tello, R.; Belalcazar-Ceron, L.-C. Life cycle emissions from a bus rapid transit system and comparison with other modes of passenger transportation. CT F-Cienc. Tecnol. Futuro 2016, 6, 123–134. [Google Scholar] [CrossRef] [Green Version]
- Mahmoud, M.; Garnett, R.; Ferguson, M.; Kanaroglou, P. Electric buses: A review of alternative powertrains. Renew. Sustain. Energy Rev. 2016, 62, 673–684. [Google Scholar] [CrossRef]
- EU Commission. Electrification of the Transport System: Studies and Reports; Directorate General for Research and Innovation 2017 Smart, Green and Integrated Transport; EU Commission: Brussels, Belgium, 2017; Available online: https://ec.europa.eu/newsroom/horizon2020/document.cfm?doc_id=46368 (accessed on 25 September 2019).
- EU Commission. Electrification of Public Transport in Cities. 2020. Available online: https://trimis.ec.europa.eu/project/electrification-public-transport-cities (accessed on 7 February 2021).
- International Energy Agency (IEA). Global EV Outlook 2017: Two Million and Counting; IEA: Paris, France, 2017; p. 12. Available online: https://webstore.iea.org/global-ev-outlook-2017 (accessed on 25 September 2019).
- Poushter, J.; Bishop, C.; Chwe, H. Social Media Use Continues to Rise in Developing Countries but Plateaus across Developed Ones Digital divides remain, both within and across countries. PEW Res. Cent. 2018, 22, 2–19. Available online: https://assets.pewresearch.org/wp-content/uploads/sites/2/2018/06/15135408/Pew-Research-Center_Global-Tech-Social-Media-Use_2018.06.19.pdf (accessed on 15 August 2019).
- Gallotti, R.; Barthelemy, M. Anatomy and efficiency of urban multimodal mobility. Sci. Rep. 2014, 4, 6911. [Google Scholar] [CrossRef] [PubMed] [Green Version]
- Arias-Molinares, D.; García-Palomares, J.C. The Ws of MaaS: Understanding mobility as a service from a literature review. IATSS Res. 2020, 44, 253–263. [Google Scholar] [CrossRef]
- Santos, G.; Behrendt, H.; Teytelboym, A. Part II: Policy instruments for sustainable road transport. Res. Transp. Econ. 2010, 28, 46–91. [Google Scholar] [CrossRef]
- CIVITAS. Intelligent Transport Systems and Traffic Management in Urban Areas. EC-Policy Notes-4. 2015. Available online: https://civitas.eu/content/civitas-policy-note-intelligent-transport-systems-and-traffic-management-urban-areas-0 (accessed on 25 September 2019).
- Eliasson, J. The Stockholm Congestion Charges: An Overview; CTS Working Paper 2014:7; Centre for Transport Studies: Stockholm, Sweden, 2014; p. 42. Available online: https://www.transportportal.se/swopec/cts2014-7.pdf (accessed on 25 September 2019).
- Copenhagen Municipality. City of Copenhagen Municipal Plan 2015: The Coherent City. 2015. Available online: https://kp15.kk.dk/artikel/municipal-plan-2015 (accessed on 15 August 2019).
- Hao, H.; Wang, H.; Ouyang, M. Comparison of policies on vehicle ownership and use between Beijing and Shanghai and their impacts on fuel consumption by passenger vehicles. Energy Policy 2011, 39, 1016–1021. [Google Scholar] [CrossRef]
- Marsden, G.; Rye, T. The governance of transport and climate change. J. Transp. Geogr. 2010, 18, 669–678. [Google Scholar] [CrossRef] [Green Version]
- Aldred, R. Governing transport from welfare state to hollow state: The case of cycling in the UK. Transp. Policy 2012, 23, 95–102. [Google Scholar] [CrossRef]
- Dahl, R. Who Governs? Democracy and Power in the American City, 2nd ed.; Yale University Press: London, UK, 2005. [Google Scholar]
Figure 1.
The analytical framework of the literature review.

Figure 2.
The analytical process of the literature investigation.

Figure 3.
The multi-variant diagram of worldwide cities.

Figure 4.
The model perspective for urban mobility system dynamics.


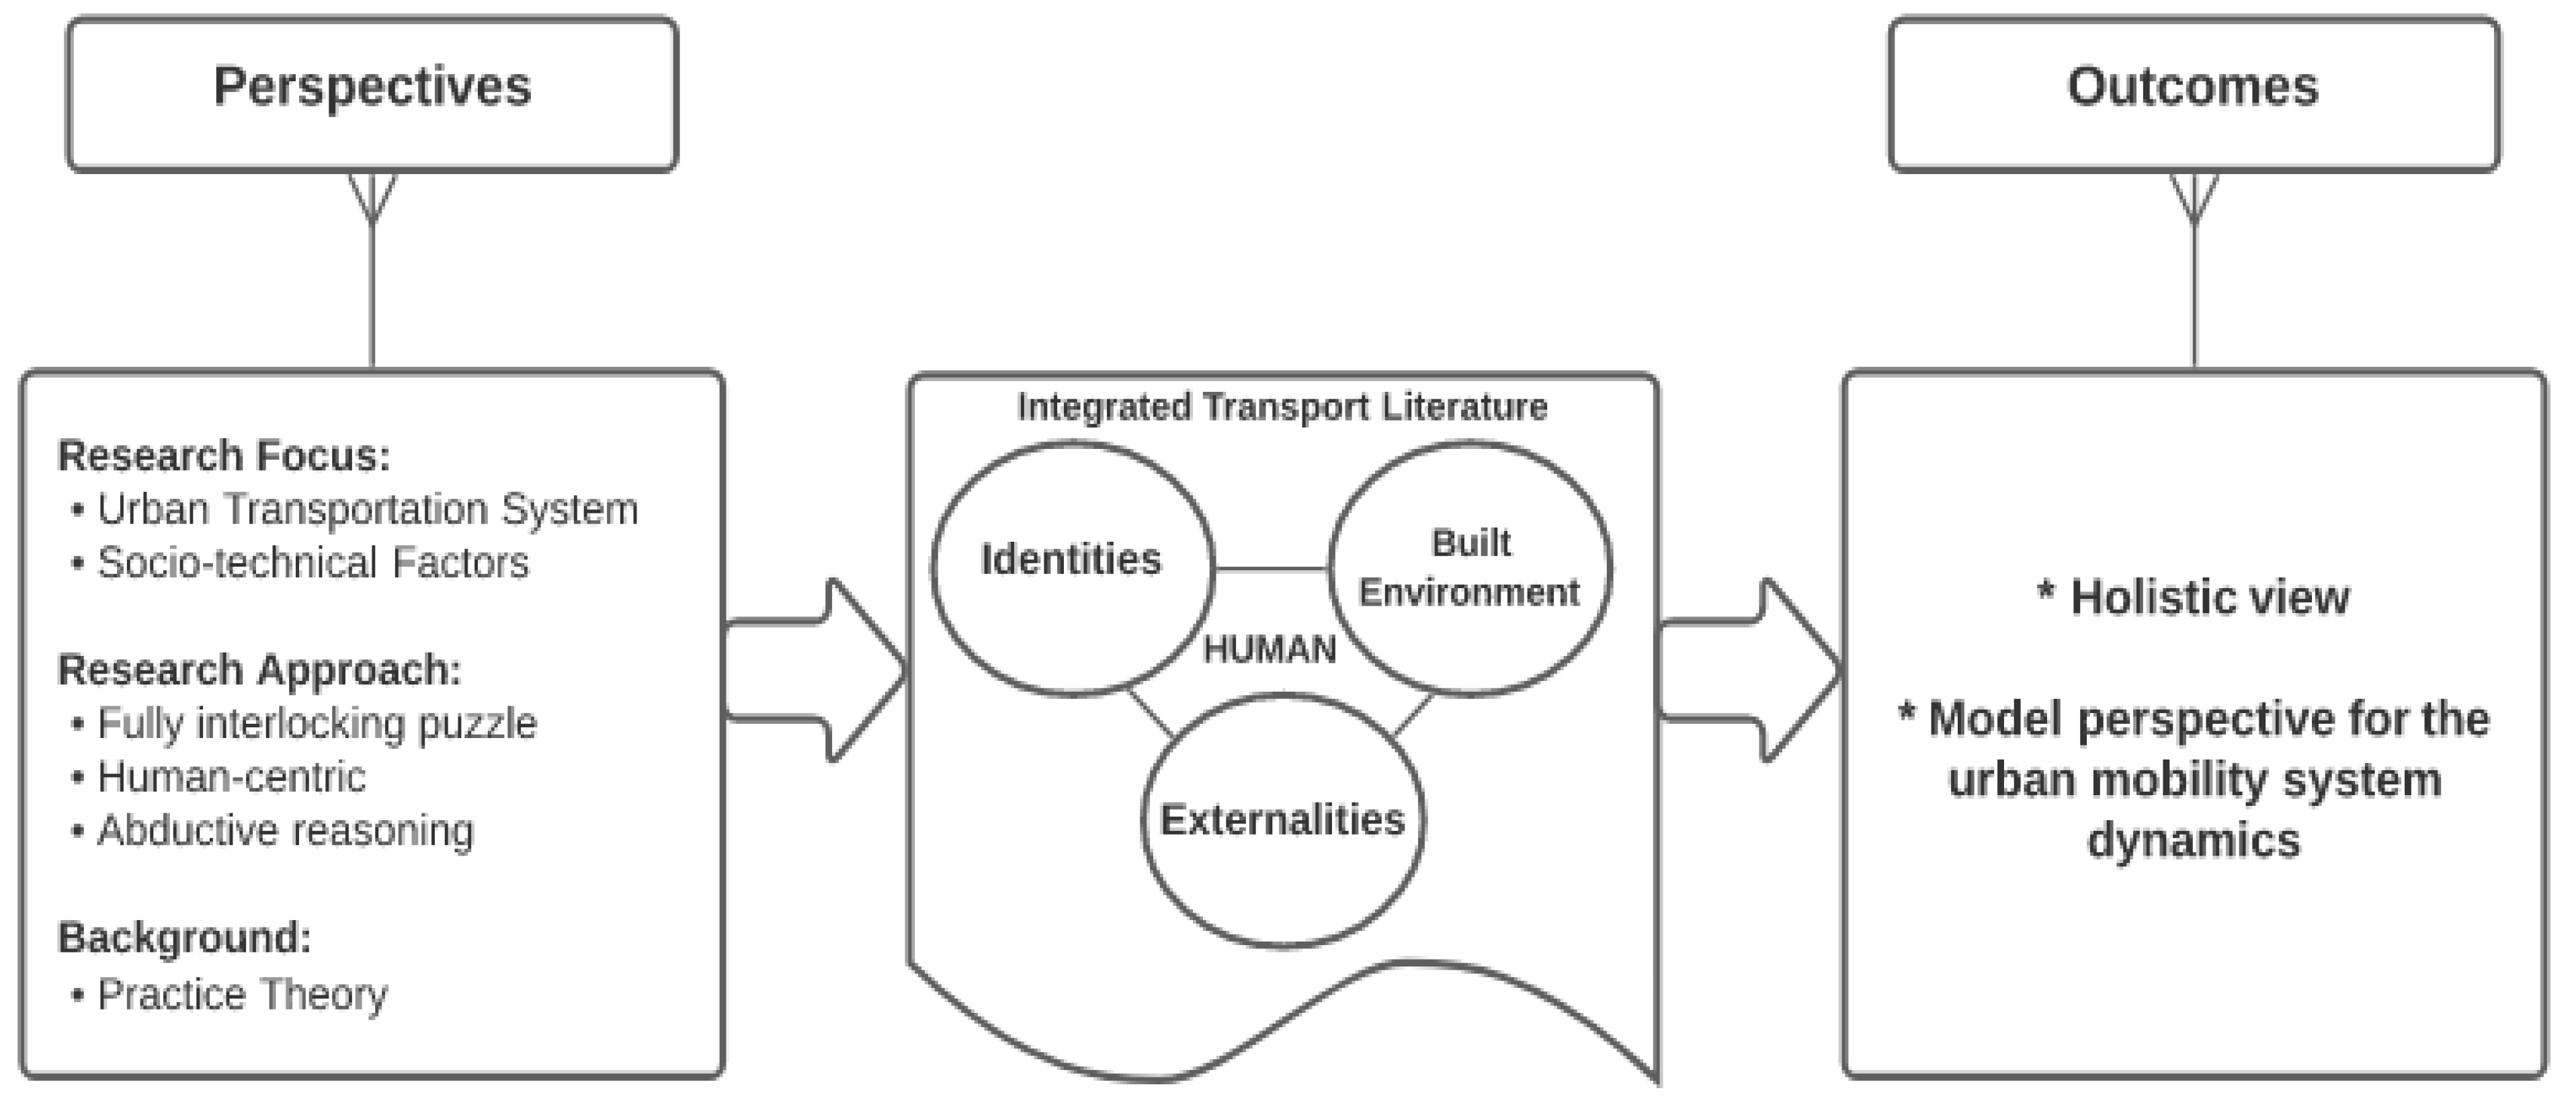
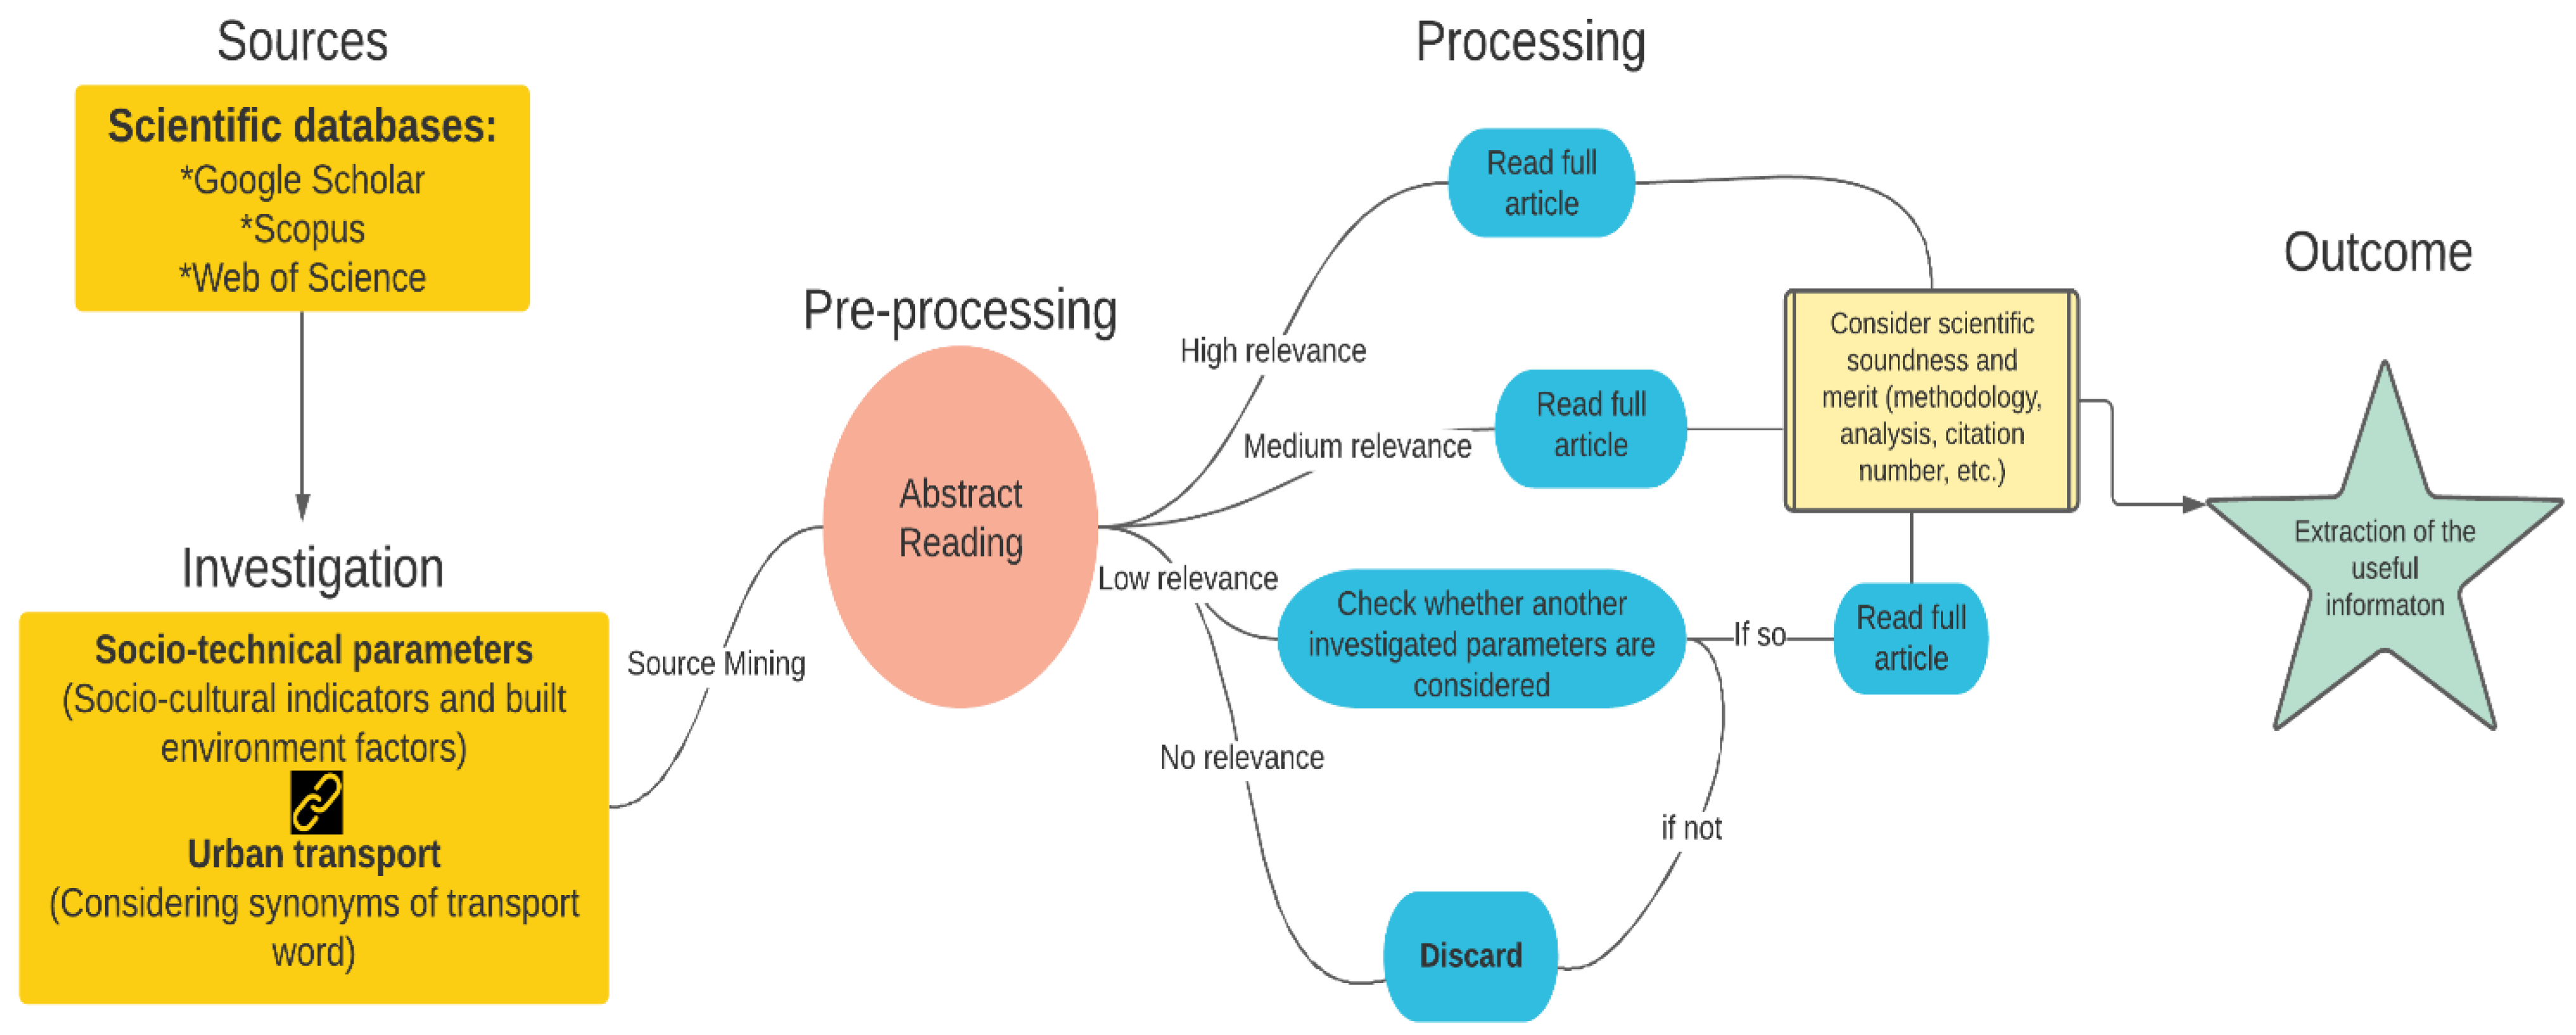
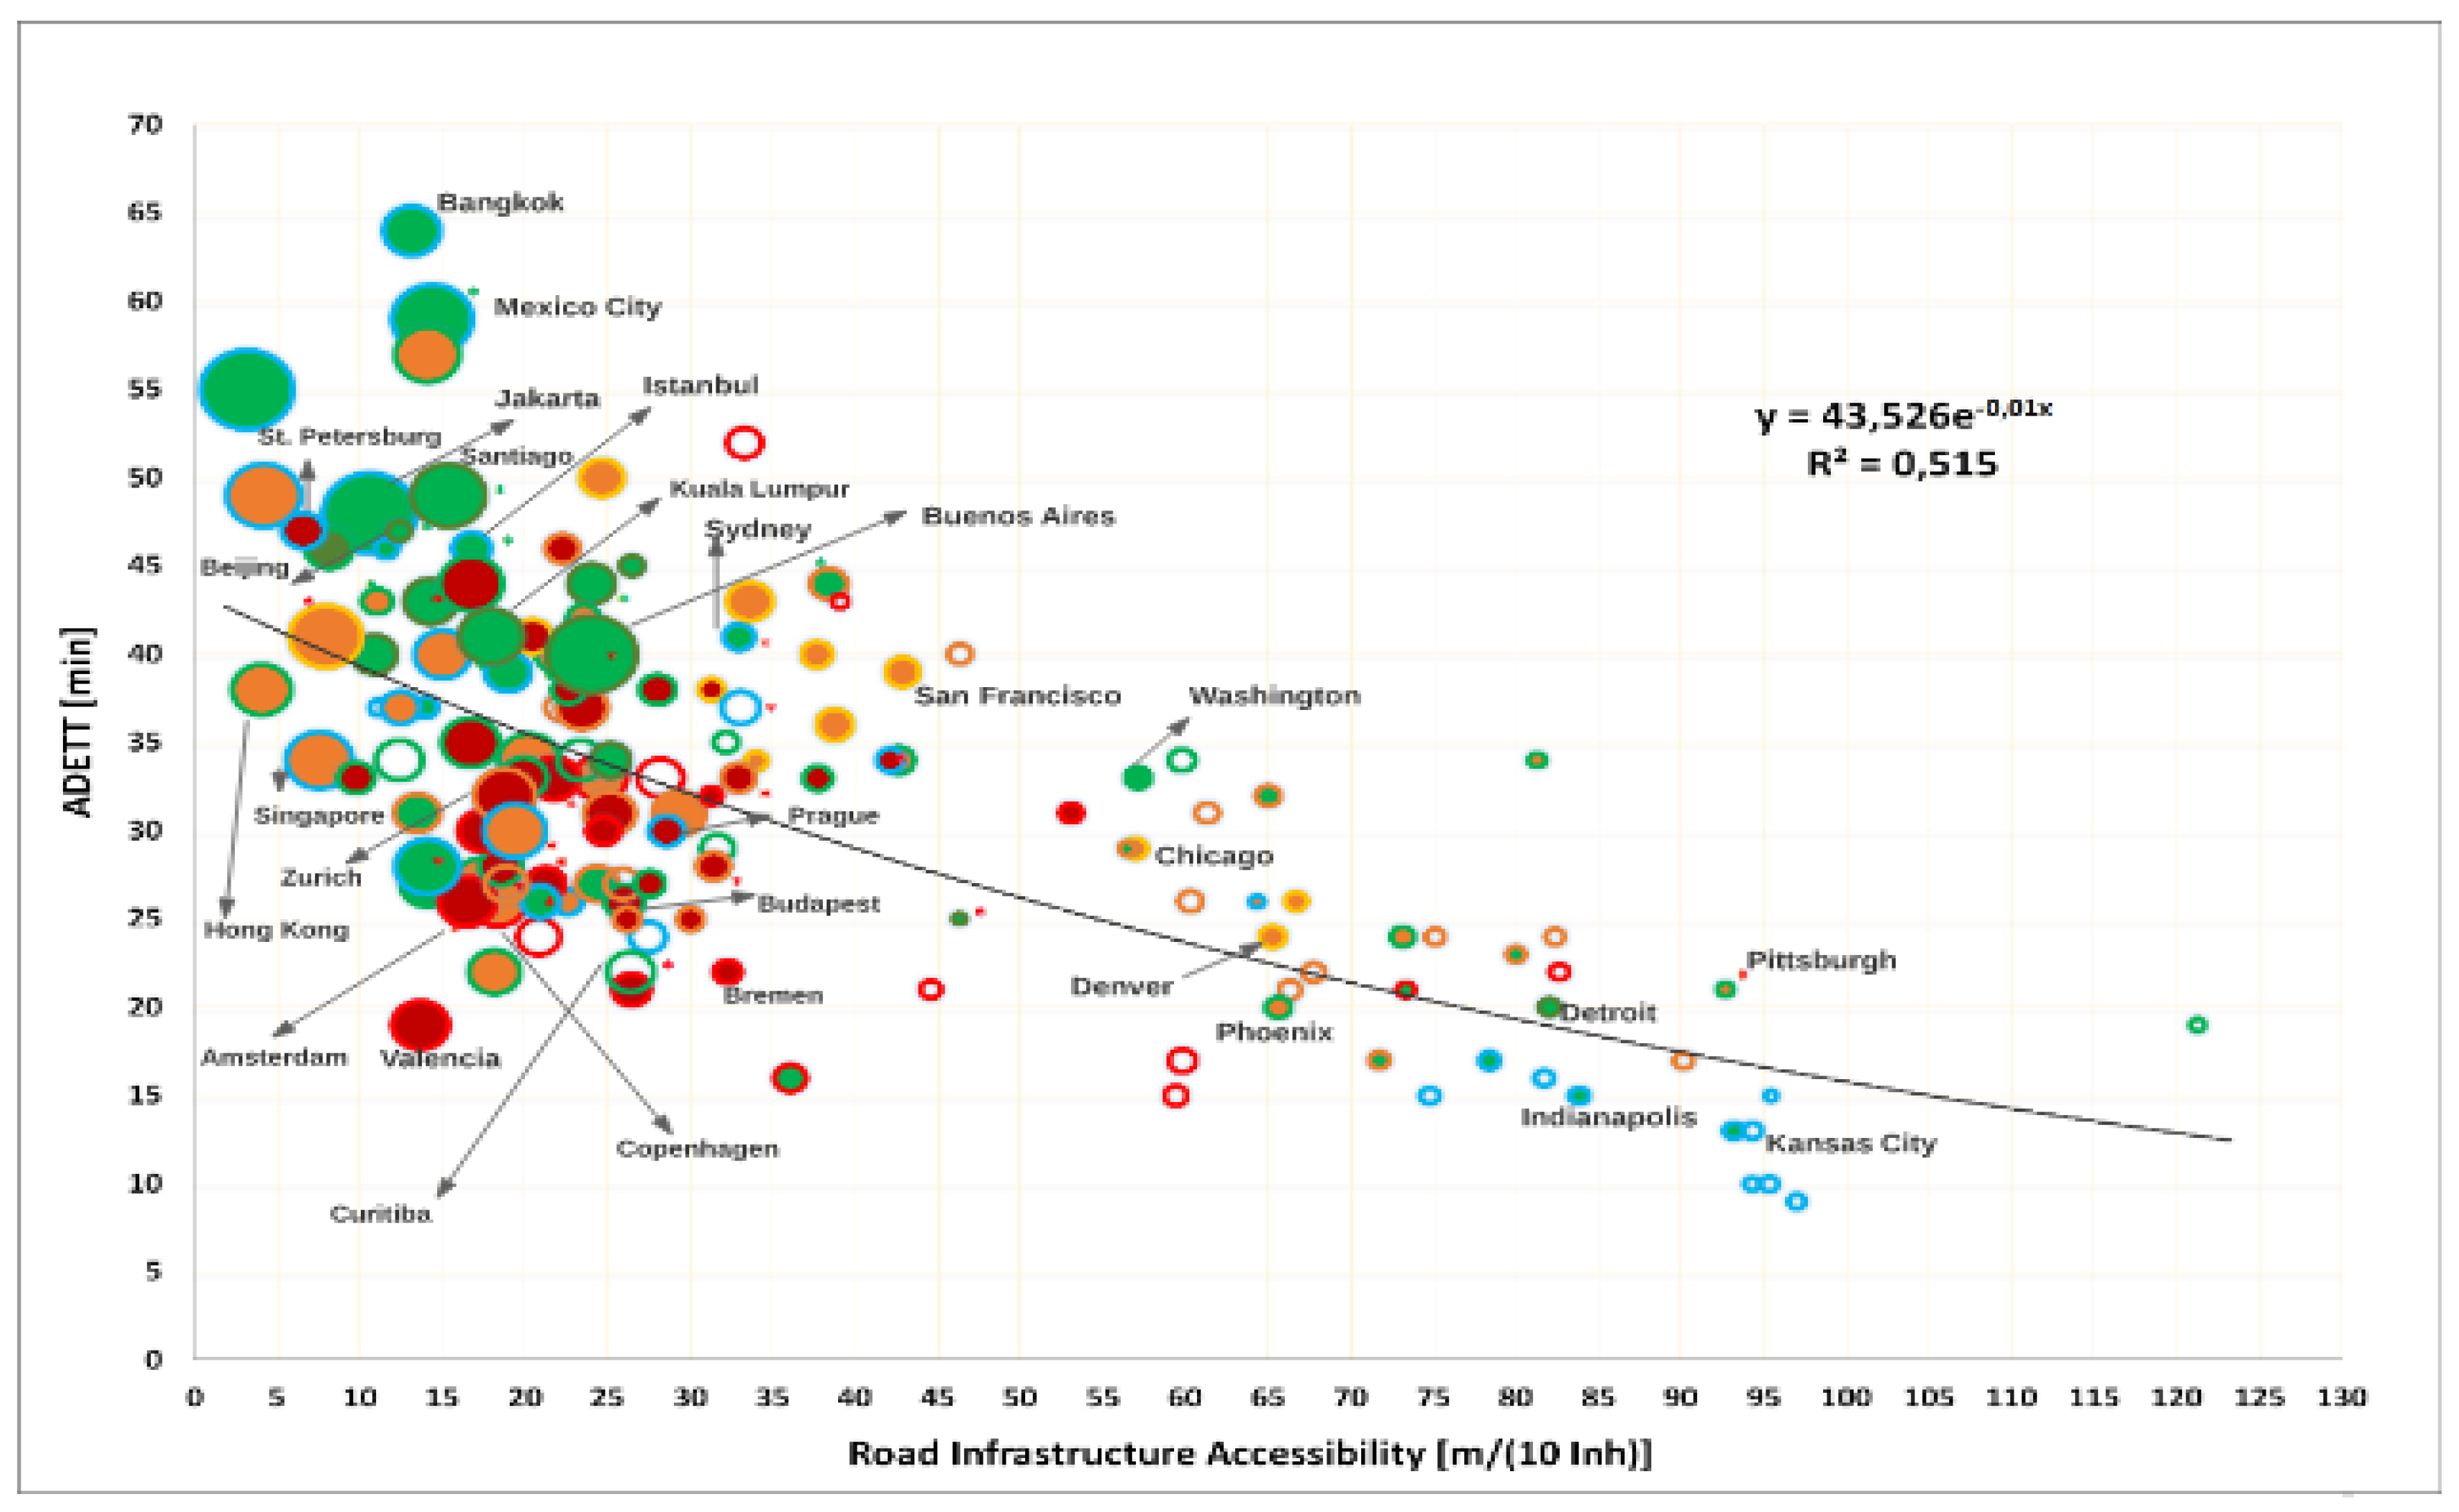
Table 1.
Scaling of the Figure 2.
Table 1.
Scaling of the Figure 2.
| RIA [km Railway Per 10 inh]: | CIA [m Cycleway Per 10,000 inh]: | BIA [m BRT Per 10,000 inh]: |
|---|---|---|
| Bubble Fill Color | Bubble Border Color | Starred Marker (*) |
| red = RIA > 1100 orange = 223 < RIA < 1100 green = RIA < 223 non-color = absence of urban rail | red = CIA > 1500 orange = 200 < CIA < 1500 green = 10 < CIA < 200 blue = CIA < 10 | red = BIA > 150 green = BIA < 150 |
Table 2.
The functions and benefits of ICT in transport services.
| Application | Function | Benefits |
|---|---|---|
| Zipcar/London | Car-sharing service | Reduced car travel costs and miles by 42% per year. |
| Lyft/USA | Ride-share service | Saves over GBP 50 million in vehicle operating costs, such as fossil energy, insurance, and maintenance. |
| Sfpark/SanFrancisco | Parking service | Reduced congestion, 30% drop in GHG emissions. |
| Suica smartcard/Tokyo | Multimodal smart ticketing | Integrated payment across modes, time-saving. |
| SignalGuru Cambridge and Singapore | Green Light OptimalSpeed Advisory | 20.3% saving on fuel consumption. |
| Moovit, Citymapper TI system in Monza/IT | Real-time journey planner | Modal-shift to PT and time savings 4.1% modal shift to PT. |
| Velib and Bicing in Paris | Bike-sharing | Reduced demand on single-mode for last-mile connections. |
| TSC—in Aalborg (Denmark) Across EU | Adaptive traffic signal control system | Travel time decreased by 8.5% per trip (for peak times), and fuel consumption decreased by 2.5%. 5–20% improvement in the travel mean speed. |
Table 3.
Glossary for Figure 4.
Table 3.
Glossary for Figure 4.
| SC = Sociocultural |
| EDU = Educational Level, HEL = Higher Educational Level |
| ND = Nature of Demography, M = Male, F = Female, PG = Population Growth, A = Aging, H = Number of people in household, PG = Population Growth |
| INC = Income Level, CO = Car Ownership |
| CUL = Culture, IND = Individualism, COL = Collectivism, MAS = Masculinity, FEM = Femininity, UNC = Uncertainty |
| ENV = Environment |
| LU = Land Use, PD = Population Density, UF = Urban Form |
| OPT = System Optimizers, P = Policies, T = Technology |
| INF = Infrastructure, IA = Infrastructure Accessibility, ID = Infrastructure Design, R = Road, S = Separated Track Infrastructure, B = Bikeways, W = Sideways, SM = Sustainable Modes’ Infrastructure |
| GM = Geomorphology, HL = Hilliness, WT = Water bodies, SS = Seismicity, WR = Weather, RN = Rain, SN = Snow, WD = Wind |
| NM = Non-motorized Modes, CY = Cycling, WA = Walking, PV = Private Vehicle, PT = Public Transportation, RL = Rail Transit, BRT = Bus Rapid Transit, BS = Bus, SM = Shared Mobility, C = Car, SC = Scooter, UN = Unconventional Modes, WBS = Waterbus, RP = Ropeway |
| CON = Congestion, EC = Energy Consumption, SE = Socio-economic, AP = Air Pollution |
Publisher’s Note: MDPI stays neutral with regard to jurisdictional claims in published maps and institutional affiliations. |
© 2021 by the authors. Licensee MDPI, Basel, Switzerland. This article is an open access article distributed under the terms and conditions of the Creative Commons Attribution (CC BY) license (https://creativecommons.org/licenses/by/4.0/).
Share and Cite
MDPI and ACS Style
Dingil, A.E.; Rupi, F.; Esztergár-Kiss, D. An Integrative Review of Socio-Technical Factors Influencing Travel Decision-Making and Urban Transport Performance. Sustainability 2021, 13, 10158. https://doi.org/10.3390/su131810158
AMA Style
Dingil AE, Rupi F, Esztergár-Kiss D. An Integrative Review of Socio-Technical Factors Influencing Travel Decision-Making and Urban Transport Performance. Sustainability. 2021; 13(18):10158. https://doi.org/10.3390/su131810158
Chicago/Turabian StyleDingil, Ali Enes, Federico Rupi, and Domokos Esztergár-Kiss. 2021. "An Integrative Review of Socio-Technical Factors Influencing Travel Decision-Making and Urban Transport Performance" Sustainability 13, no. 18: 10158. https://doi.org/10.3390/su131810158
Note that from the first issue of 2016, this journal uses article numbers instead of page numbers. See further details here.