Article

Sea Level Rise Mitigation by Global Sea Water Desalination Using Renewable-Energy-Powered Plants

1
School of Natural Resources Engineering and Management, German Jordanian University, Amman, P.O. Box 35247, Amman 11180, Jordan
2
Mechanical and Mechatronics Engineering Department, Faculty of Engineering and Information Technology, An-Najah National University, P.O. Box 7, Nablus 00970, Palestine
3
The Institute of Materials Science of Mulhouse (IS2M), University of Haute Alsace, University of Strasbourg, CNRS, UMR 7361, F-68100 Mulhouse, France
*
Authors to whom correspondence should be addressed.
Sustainability 2021, 13(17), 9552; https://doi.org/10.3390/su13179552
Submission received: 6 June 2021 / Revised: 16 August 2021 / Accepted: 23 August 2021 / Published: 25 August 2021
(This article belongs to the Special Issue Waste Strategies Development in the Framework of Circular Economy)

Abstract

:
This work suggests a solution for preventing/eliminating the predicted Sea Level Rise (SLR) by seawater desalination and storage through a large number of desalination plants distributed worldwide; it also comprises that the desalinated seawater can resolve the global water scarcity by complete coverage for global water demand. Sea level rise can be prevented by desalinating the additional water accumulated into oceans annually for human consumption, while the excess amount of water can be stored in dams and lakes. It is predicted that SLR can be prevented by desalination plants. The chosen desalination plants for the study were Multi-Effect Desalination (MED) and Reverse Osmosis (RO) plants that are powered by renewable energy using wind and solar technologies. It is observed that the two main goals of the study are fulfilled when preventing an SLR between 1.0 m and 1.3 m by 2100 through seawater desalination, as the amount of desalinated water within that range can cover the global water demand while being economically viable.

1. Introduction

Climate change, sea rise, energy demand and clean water supply crisis: these are the main concerns for most of the scientific community and humanity in recent years.

1.1. Climate Change and Sea Rise

Climate change is the variation in the weather conditions in a certain region over a long period of time. The Earth’s climate has always been changing, even before human existence, but in the last 150 years, the Earth’s temperature has been rising more rapidly than the norm. Some regions around the globe are warming faster than others, but on average, the average global air temperature near the surface has increased by two degrees in the past 100 years; in fact, the last 6 years have been the warmest years in centuries [1].
In the nineteenth century, many scientists brought up the concern of human effects on nature, starting from 1838, when the French physicist Claude Pouillet proposed that the accumulation of water vapor and carbon dioxide in the atmosphere might trap infrared radiation and therefore warm the globe [2]. In 1863, John Tyndall was the first to measure the effects of different gases on the absorption and transmission of solar radiation in the atmosphere and concluded that water vapor and carbon dioxide are the least transparent among all other commonly emitted gases and are responsible for the majority of the heat trapped in the Earth’s atmosphere [3]. Marsden Manson, in 1893, suggested that the Earth’s heat balance has been completely dependent on the trapped heat by atmospheric gases [4]. In 1896, Svante Arrhenius was able to directly link the concentration of carbon dioxide to Earth’s temperature in what was named later “the greenhouse theory”, and he concluded that if the concentration was doubled, then the temperature of Earth would have been 6 °C higher than its original value [5]. The greenhouse effect is a natural process that warms the earth’s surface. When the sun’s energy is emitted into the earth’s atmosphere, part of the energy is reflected back into space, while the rest is absorbed and reradiated by the greenhouse gases. The absorbed energy causes the atmosphere and the surface of the Earth to warm up and help maintain the earth’s temperature at around 33 degrees Celsius [6]; this process allows life to exist on earth. Greenhouse gases include water vapor, carbon dioxide, methane, nitrous oxide, ozone and some artificial chemicals. For the following 40 years, the subject was not seriously discussed by scientists until 1938, when Guy Stewart Callendar highlighted the subject again by proving that the concentration of carbon dioxide and the global temperature are proportionally increasing [7], and thereafter the scientific world focused substantially on studying the climate change and global warming.
It was not before 1979, when the issue of climate change had caught the attention of governmental powers in the first-world climate conference that was held in Geneva, where the issue of climate change was first addressed as a crucial subject that must be dealt with more systematically. The conference urged governments worldwide to “foresee and prevent potential man-made changes in climate that might be adverse to the well-being of humanity” [8].
The Intergovernmental Panel on Climate Change (IPCC) was established in 1988 by the World Meteorological Organization (WMO) and the United Nations Environmental Programme (UNEP) to be the concerned party on the matter of climate change. IPCC published two important assessments reports in 1990 and in 1992, in which they discussed the severity of climate change and forecasted its impacts on different fields [9], and since that time, the IPCC has been publishing annual reports that study and assess in detail all the changes that are present due to climate change and their impacts on the planet. One of the impacts that were considered from the beginning was the rise in the seawater level due to global warming. The constant rise of temperature has led to a significant rise in seawater levels. This can be credited to the constant defrosting of Antarctica and Greenland’s ice.
This was proven by the National Aeronautics and Space Administration (NASA) by recording the changes to the perennial ice cover of the Arctic sea ice. The sea ice cover reaches its minimum extent at the end of every summer, leaving what is called the perennial ice cover. According to NASA, the area of the perennial ice has been decreasing steadily between 1979 and 2020. There is an obvious change to the ice cover of the arctic, and the ice cover has receded closer to Greenland. The satellite images showed a significant impact of climate change on the ice cover between 1979 and 2020. This decrease has caused the sea level to rise. NASA has also created a model to predict the impact of 1 m–6 m rise in the sea levels to Southeast Asia, Southeast United States, Northern Europe and the Amazon Delta, and the model shows that if the sea level kept constantly rising, these areas would become flooded and inhabitable [10].
The air temperature and the Global Mean Surface Temperature (GMST) have been increasing dramatically in the last 50 years, and according to the IPCC in their Climate Change Synthesis Report (SYR) for the fifth Assessment Report (AR5) of 2014, this increase is 95% due to human activity [11,12]. The impacts of the increase in temperature due to the increment of Greenhouse Gases (GHG’s) emissions had been widely discussed in too many aspects, and two of the most critical impacts are the rise in sea level and the growing water scarcity around the world. The sea level rise can be attributed to more than one factor: the two main reasons for the sea level rise are thermal expansion of the ocean and the melting of the land-based ice, such as glaciers and ice sheets. Different measurements include global sea level trends and relative sea-level trends predict that by 2100, Sea Level Rise can be between 0.4 m and 2.5 m [13,14,15].
The sea surface is not changing globally at the same rate due to many local factors such as subsidence, upstream flood control, erosion, regional ocean currents, variations in land height and whether the land is still rebounding from the compressive weight of Ice Age glaciers. Sea level rise at specific locations may be more or less than the global average. Many major cities are currently at risk of being flooded. By 2050, approximately 150 million people will be affected by the increasing sea level rise [16]. Gerald A. Meehl et al. refer to two global climate-coupled models which indicate that even if ambient greenhouse gas emissions were stabilized in 2000, we are now committed to more global warming of around another half-degree and an additional 320 percent increase in sea level caused by thermal expansion by the end of the twenty-first century.
There is a commitment to potential temperature changes at some given point in time, even though concentrations are stabilized, which would be higher than those we have already experienced [17]. The main concentration is on the Antarctic and Greenland ice sheets; they both have enough water to increase the global sea levels by 58 m and 7 m, respectively. Satellites have been recording the sea level rise since the 1990s and have recorded that Antarctica and Green Land have increased sea levels by 17.8 mm. Thomas Slater et al. have reviewed a model that was conducted Antarctic and Greenland mass change to IPCC (AR5) Sea Level Rise (SLR) projections during a 10-year overlap. The AR5 was able to forecast the contribution of the ice sheet to the sea level rise in response to global warming. Global mean SLR estimates range from 280 to 980 mm by 2100, driven by the century-scale rise in temperature forced by representative concentration pathways (RCPs) [18].
IPCC forecasts climate change impacts according to different scenarios called the Representative Concentration Pathways (RCPs), in which the concentration of GHG emissions in terms of CO2 equivalent differs along the twenty-first century, where each pathway has the following mean GHG emissions: (RCP 2.6~490 ppm CO2 eq), (RCP 4.5~650 ppm CO2 eq), (RCP 6.0~850 ppm CO2 eq) and (RCP 8.5~1370 CO2 eq) [19].
In a study completed by a group of researchers with the World Bank in 2007 in 84 countries (e.g., Egypt, Vietnam, the Bahamas, China) and different regions (e.g., East Asia, Middle East/North Africa). It was approximated that under 1 m SLR, 56 million people will be directly affected and displaced out of their areas, and the number can reach as high as 89 million people at 2 m SLR and significantly higher for 5 m SLR, with an affected population of 245 million people in the studied regions. For instance, the study carried by the World Bank shows that around 10% of Egypt’s population will be directly affected by 1 m SLR, when an SLR of 5 m will affect 20% of the population. The impacts of SLR are not exclusive to population displacement but also include geographic shrinkage, wetlands, GDP and agriculture. The World Bank has ranked the 84 studied countries from least affected to most affected and estimated that the top five affected countries will be Vietnam, Egypt, Suriname, the Bahamas and Mauritania [20].
In a study completed by Mathew E. Hauer et al., they mentioned that the projected world’s coastal population is around 1 billion people by 2100. Therefore, as a result of SLR, 4.5% of the global gross domestic product will be projected to resolve the irreversible consequences of climate change. The impacts of SLR, as mentioned earlier, will not be only in the form of population relocation but will drastically impact various sectors such as agriculture by seawater intrusion into groundwater and agricultural soil, which will lead to severe damage in the agricultural behavior of the impacted coastal regions [21].

1.2. Water Scarcity

Water covers around 70% of the planet, and some may think that it is more than enough to cover the water needs of the Earth’s population, but on the contrary, from all the Earth’s water, only 3% is drinkable water and consumable, as two-thirds of freshwater is frozen in glaciers or is unavailable for use [22]. There are approximately 1.1 billion people that do not have access to freshwater sources, while 2.4 billion people cannot access sanitized water, and around 2.7 billion people face water scarcity for at least 1 month each year [23]. As a result, many people are forced to consume stagnant water or be completely prohibited from water. This can have major health issues on these people who will become more exposed to diseases such as cholera, typhoid fever and other water-borne illnesses. Water is not only a medium by which diseases may be transferred but also is a key factor in disease prevention and control, as according to Desmond Ofosu Anim et al., water has a critical part in the prevention and control of COVID-19 spread in Africa due to the importance of water in individual’s hygiene and sanitization. Unfortunately, around 300 million people in the Sub-Saharan region suffer from water scarcity, which puts them in a very dangerous situation and makes them more vulnerable to COVID-19 [24]. Two million people, mostly children, die each year from diarrheal diseases alone. Poor sanitation, widely accepted as a major contributor to water-borne diseases, causes more than 1200 deaths per day among children under the age of five, more than AIDS, measles and tuberculosis combined. In 2016, inadequate hygiene and sanitation caused more than half a million deaths from diarrhea [25].
Mesfin M. Mekonnen et al. [26] mentioned in research that there are four billion people around the world that suffer from severe water scarcity. There are many factors that have caused this crisis to happen, such as the increasing population, improving living standards, changing patterns of consumption and expansion of irrigated agriculture, which are the main drivers of rising global demand for water. For at least 4–6 months per year, the number of people who face extreme water shortage is 1.8–2.9 billion. All year round, half a billion people face extreme water shortage, while 180 million of them live in India, 73 million in Pakistan, 27 million in Egypt, 20 million in Mexico, 20 million in Saudi Arabia and 18 million in Yemen. Water scarcity affects all individuals in the country in the latter two countries, which places these countries in an extremely vulnerable position. Libya and Somalia (80–90 percent of the population), and Pakistan, Morocco, Niger and Jordan are other countries in which a very large fraction of the population faces extreme water shortage year-round (50–55 percent of the population) [26].
The Middle East/North Africa (MENA) region is one of the most water-stressed regions in the world, with only 7% of the world’s population and only 1.5% access to renewable freshwater supply. According to George Joffé, the MENA region has approximately 623.8 billion cubic meters of renewable water supplies each year; this averages 1274 cubic meters per capita per annum, while there is a global supply of renewable water supplies of around 43,764 billion cubic meters. These data show the amount of water stress the MENA region undergoes each year. He goes on further to state that each country in the MENA has different per capita per annum figures; in the Arab countries, it ranges from Egypt’s 794 cubic meters per capita to Kuwait’s as little as 7 cubic meters per capita. Conventionally, the World Bank considers a minimum of 1700 cubic meters per capita per annum appropriate. As a result, many nations rely on groundwater supplies and underground aquifers. Hence, they severely overuse their recharge capacity and inflict irreversible harm to them [27]. According to Alberto Boretti et al., the current global water demand is around 4.6 trillion m3 /year, and they predict that the demand will probably grow to become (5.5–6.0) trillion m3/year by 2050 [28]. These estimates meet with many other estimates completed worldwide; for example, Mohamad Hejazi et al. predict that by 2050, the global water demand will be around 6.2 trillion m3/year, and by 2095 it may go as high as 12.7 trillion m3/year [29].
In 2015, the United Nations Development Programme (UNDP) had set 17 Sustainable Development Goals (SDGs), which are as stated by the UNDP: “a blueprint to achieve a better and more sustainable future for all”. Hence, according to the UNDP, the SDGs must be fulfilled by 2030 in order for the world to shift towards sustainability. Almost all 17 goals overlap with the proposed suggestion in this work. For instance, in the second SDG, the UNDP has discussed the subject of food insecurity and how it can be tackled, especially by sustainable agriculture in which water plays a huge role. According to the Organization for Economic Co-operation and Development [30], agriculture contributes to 70% of the total water consumption in most countries of the world and 40% of the total water consumption in the OECD countries, which are only 38 countries worldwide. Hence, it is crucial to find better sustainable solutions for water production to cover the world demand. According to A. Zorpas et al. [31], water scarcity is one of the most major issues that impacts the agricultural sector in Cyprus, Greece, Sicily, Spain, Morocco and Tunisia, which leads to high economic losses that cannot be resolved without changing the agricultural patterns under the current and futuristic conditions of water supply in these countries.

1.3. Energy Crisis

The world is undergoing an energy crisis because of the elevating demand for energy due to several reasons. The increase in the energy demand is mainly related to the global population, which has been fiercely accelerating in the last two centuries and is expected to reach 11.2 billion by the end of the twenty-first century according to the United Nations (UN) [32], while 1.1 billion humans still lack access to electricity nowadays [33]. Additionally, another reason for the energy crisis is the huge rate of consumption for non-renewable resources such as fossil fuels that are not only depleting but also suffocating the planet by being responsible for having a big share of the emitted GHGs into the atmosphere. Unfortunately, human reliance on fossil fuels cannot be easily avoided; on the other hand, new technologies are being developed day by day in order to rely more on renewable resources [34].
The main two problems with sources of energy are as follows. First of all, according to an article written by the Millennium Alliance For Humanity and The Biosphere, an initiative created by Stanford University, they expect that the traditional fossil fuels that we use to supply our energy to run out in the current century. They expect oil to deplete by 2052, gas to deplete by 2060 and coal to deplete by 2090. Oil supplies around 40% of the world’s energy, and 96% of it is being used for transportation, while the global oil demand is growing at a fast rate; the global oil demand grew by 1.8% in 2018. Gas totaled 23% of the total energy demand but grew at a 4.6% rate in 2018; gas had the second-highest share of total electricity generation at 23%, or 6091 Terawatt-hour (TWh). Global coal demand made up 0.7% in 2018. Coal’s share of total electricity generation totaled 10,116 TWh, up to 2.6% from 2017, as it commanded 38% of total generation around the world [35].
An alternative for traditional fossil fuels is to substitute them with natural renewable energy sources. Renewable energy is energy from sources that are naturally replenishing but flow-limited; renewable resources are virtually inexhaustible in duration but limited in the amount of energy that is available per unit of time. The major types of renewable energy are: 1—Biomass; 2—Hydropower; 3—Geothermal; 4—Wind; 5—Solar. There is currently a race between the world’s largest countries to be able to utilize renewable energy sources. The consumption of biofuels, geothermal, solar and wind energy in the United States (US) in 2019 was nearly three times greater than in 2000. In 2019, renewable energy provided about 3.37 quadrillion watts to 11.4% of total US power consumption [36]. In 2020, the United Kingdom (UK) hit a new amazing renewable energy milestone. On Wednesday 10 June, the country celebrated 2 months of running purely on renewable energy for the first time ever [37]. Wind farms in the UK have an installed capacity of 17.3 Gigawatts (GWs) and account for approximately 40% of the total electricity generation, while coal and gas plants made up less than a fifth of electricity generated [38]. In 2019, 21% of Australia’s total electricity generation was from renewable energy sources, including wind (7%), solar (7%) and hydro (5%). The share of renewables in total electricity generation in 2019 was the highest since levels recorded in the early 1970s [39].
Tomas Kåberger has predicted that electricity from fuel has little potential of becoming any cheaper, as any technology that is related to fuel-based thermal power has little potential of learning, hence its learning curve has reached its peak. On the contrary, fuel prices are expected to rise due to the increase in demand for fossil fuels under the scarcity of these resources. He has also suggested that electricity from renewable energy sources is less likely to face any cost-driving factors due to its constant decline in prices and the fact that it does not rely on a certain amount of supply to operate. He went on to compare renewable electricity to oil, fossil fuels, natural gas and coal. He concluded that oil is now clearly outcompeted by price, and fossil gas is being challenged. Coal is still cheaper per unit of energy, but renewable energy can be outpaced by technological advantages or carbon pollution pricing schemes. The substitution of coal would also intensify with continued declines in the cost of renewable energy or increased carbon dioxide prices [40].
One of the most reliable and widely used sources of renewable energy is solar energy, which can be harvested by photovoltaic (PV) systems. Photovoltaic technology has witnessed an increase in the number of photovoltaic systems being installed and a decrease in the costs of installation. Global cumulative solar photovoltaic capacity has grown continuously since 2000. Between 2000 and 2019, figures increased by 632.4 GW. In 2019, global cumulative solar PV capacity amounted to 633.7 GW, with 116.9 GW of new PV capacity installed in that same year [41].
One major advantage of photovoltaic systems is that they come in a vast variety of sizes and complexities, from small-scale household systems to solar parks that can generate adequate amounts of energy to power large facilities or a populated residential area. For example, Dubai is one of the most promising cities that are showing initiative in installing solar energy. The Dubai Electricity and Water Authority (DEWA) announced the Sheikh Mohammed bin Rashid Al Maktoum solar park in 2012. By 2020, the strategy aims to provide 7% of Dubai’s energy from clean energy sources, 25% by 2030 and 75% by 2050. DEWA manages the Solar Park, which is the world’s largest single-plot renewable energy project with a planned production capacity of 5000 Megawatts (MWs) upon completion in 2030. The first phase of the solar park was implemented in 2013, and the installation of 13 MW of photovoltaic energy generation began. At the time, it was one of the largest PV projects in the MENA region. The second phase was implemented in 2017, and 200 MW of PV panels were installed. The project is currently the largest single-site solar park in the world, based on the IPP model. The third phase was split into three stages to install a capacity of 800 MW: the first stage was implemented in 2018, and capacities of 200 MW of PV panels were installed; the second and third stages are split into 300 MW each and will be completed by 2019 and 2020. The fourth phase of the solar park will involve 700 MW of Concentrated Solar Power (CSP) and 250 MW of PV panels and will be split into stages and commissioned in Q4 of 2020. The fifth phase will involve the installation of 900 MW of PV panels and will be split into stages and commissioned in Q2 of 2021. The rest of the 5000 MW will be split into future phases until 2030. Once completed, it will be the largest solar-powered plant in the world [42].
Another well-developed renewable energy technology is wind harvesting technology, which is the fastest-growing energy source that uses wind turbines to generate electricity. Wind energy conversion devices are both cost-effective and environmentally friendly. In 2019, the global installed capacity of wind energy was 650 GW. In 2019 alone, 60 GW of wind energy was installed. The world’s top five markets in new installations in 2019 are China, the US, UK, India and Spain. The Asian Pacific continues to take the lead in global wind power development, accounting for 50.7 percent of global new installations last year, followed by Europe (25.5 percent), North America (16.1 percent), Latin America (6.1 percent) and Africa and the Middle East (1.6 percent) [43].
Hydropower is the most used renewable energy source worldwide and still increasing annually. In 2020, hydropower contributed to 17% of the total world’s energy generation and 52% of the total renewable energy generated [44,45]. In 2019, the total global hydropower capacity reached 1308 GW with an electricity generation of 4306 TWh, breaking an outstanding record by contributing the most amount of energy ever generated by a renewable resource throughout history [46]. Many enhancements and additions are being implemented in the hydropower field every year, while China is the biggest role player in this repetitive modification process. It is expected that in 2025, the amount of electricity generated from hydropower will increase to become 4650 TWh, with China alone expected to increase its hydropower capacity by 107 TWh [47].

1.4. Desalination for Fresh Water Supply

Desalination is a process in which freshwater can be obtained by the removal of salt and minerals from seawater. It has been proposed in the twentieth century as a hypothetical solution for water scarcity, and nowadays, it contributes to around 1% of the global freshwater supply [48].
In the sixth SDG [49], the UNDP had precisely studied the situation for clean water and sanitation, and one of the major points that they discussed is that “by 2030, there must be an expansion in international cooperation and capacity-building support to developing countries in water- and sanitation-related activities and programmes, including water harvesting, desalination, water efficiency, wastewater treatment, recycling and reuse technologies”. Therefore, the proposed idea of global water desalination agrees with the goals set by the UNDP [49].
Desalination is not a newly discovered technology since it has been used for thousands of years by different civilizations around the world. It was historically recorded that Greeks used to boil seawater to evaporate the freshwater from seawater while they were traveling at sea, as well as the Romans, who had a more advanced way of filtering the water from seawater by using clay-molded filters. Today, there are many advancements to desalination technologies, but they generally use the same concepts of distillation and filtration [50]. Desalination today can be summarized into three main categories in terms of the scientific phenomena used to fulfill the process. The three categories are evaporation and condensation, filtration and crystallization. Each category has different technologies beneath it, with the most used technology worldwide being Reverse Osmosis (RO), which has a share of 68.7% of the total global installed desalination capacity; behind it is the Multi-Stage Flash (MSF) technology with a 17.6% share and thirdly, Multi-Effect Distillation (MED), with a share of 6.9%, while the remaining 6.8% share is distributed between 13 other technologies. MSF and MED are categorized as evaporation and condensation technologies, while RO is based on filtration [51].
In a study conducted by Joyner Eke et al. regarding the latest state of desalination plants around the world, they state that there are about 16,876 desalination plants in operation, 270 plants under construction and 3825 offline plants worldwide. There are 14,360 operating RO plants, which means that 85.1% of the current operational plants are accounted for by RO. Additionally, 247 plants out of the 270 plants under construction are RO plants. In 2020, the global installed desalination capacity was 97.2 million m3/day of freshwater production from desalination plants, distributed as follows: Middle East (39%), Asia (others) (21%), Americas (18%), Europe (11%), Africa (8%) and Oceania (3%) [52].
Desalination has its environmental drawbacks and adverse impacts, which were studied by many scientists. In a study by Khaled Elsaid et al., which studied the major influences that adversely affect the environment, they mentioned that desalination plants had established many critical environmental issues that can be classified into the following main groups: the disposal of higher salinity and/or temperature brine in bodies of water, the energy requirements and related emissions of GHGs, the withdrawal of feedwater and the intake, outflow and construction of plants. In terms of their existence and extent, the severity of these aforementioned environmental effects and impacts depends on desalination technology, the form of feedwater, the scale of the facility, the source of energy and the local climate [53].
The drawbacks of desalination plants can be resolved in too many ways and different approaches. For instance, the high salinity brine can be used in industries rather than disposing it back into the ocean; also, the GHG’s emissions can be significantly reduced by the reliance on renewable energy sources for covering the power requirements. As mentioned earlier, the large energy requirements to operate desalination plants are considered to be a major concern that surrounds the whole process due to the energy crisis and elevated GHG emissions. For instance, the large energy requirements can be reduced by increasing the overall efficiency of the desalination plant. As mentioned earlier, the large energy requirements to operate desalination plants are considered to be a major concern that surrounds the whole process due to the energy crisis and elevated GHG emissions. For instance, the large energy requirements can be reduced by increasing the overall efficiency of the desalination plant. In a study about low-energy seawater RO desalination plants conducted by Kiho Park et al. [54], they state that reverse osmosis is the most energy-efficient method to desalinate seawater. Additionally, they go on to compare the different desalination technologies available in terms of their energy consumption. There has been a noticeable decrease in the Specific Energy Consumption (SEC) of seawater RO processes with the advancements of technologies. Scientists have been able to reduce the energy consumption for seawater RO from 20 kWh/m3 in 1970 to only 2.5 kWh/m3 in 2010 by developing energy recovery devices, better energy-efficient pumps, high-performance membranes and membrane module designs. The areas of improvement as mentioned by Kiho Park et al. [54] are summarized in three main points, which are: minimizing the irreversibility in the high-pressure pumps, decreasing the osmotic pressure of seawater and recovering osmotic energy to reduce specific energy consumption. For instance, Kiho Park et al. [54] recommend using a two-stage reverse osmosis configuration to minimize the irreversibility in high-pressure pumps. The two-stage reverse osmosis configuration can reduce the specific energy consumption by approximately 0.34 Kilowatt-hour per cubic meter (kWh/m3) with moderate circulation pressure loss. Other modifications and suggestions such as decreasing the osmotic pressure of seawater and using RO pressure-retarded osmosis (PRO) and RO Reverse Electrodialysis (RED) to fix the osmotic energy recovery were thoroughly discussed. Finally, the authors predict that an overall decrease of (0.69–0.79 kWh/m3) in the SEC amount can be obtained if all their suggestions were applied [54].
Another approach that can be considered to reduce GHG emissions and to avoid the negative impacts of the energy crisis is the use of renewable energy integrated systems to desalinate saline water. At the present time, only 1% of the total desalination plants around the world are powered by renewable energy systems [55], with the following distribution: 43% using photovoltaic (PV) systems, 27% using solar thermal energy by Concentrated Solar Power CSP systems, 20% using wind energy and 10% powered by hybrid systems [56,57]. The use of storage systems is a necessity in order for the desalination process to be continuous, especially when using PV, CSP and wind systems. Additionally, the determination of the renewable energy source must be based on utilizing all geographical, economic and environmental factors. RO and MED desalination plants are the most flexible and efficient among all other types of desalination plants. Hence, many researchers have directed their attention to making the most out of both technologies, and many attempts (both experimental and theoretical) were carried to integrate RO and MED desalination plants with different renewable energy systems [58].
Many countries around the world have frequently been investing in renewable-energy-powered desalination plants. For example, in 2017, Saudi Arabia commissioned the largest RO-PV desalination plant in the world with a capacity of 60,000 m3/day and an initial investment of 130 million USD [59]. On the other hand, Sydney’s RO desalination plant in Australia started in 2008 to operate 100% on renewable energy that is fed from Capital Hill Wind Farm, which provides the plant with 38 Megawatts (MW) when operating at a full production rate of 250,000 m3/day that can be expanded to 500,000 m3/day, with a total project cost of 1.59 billion USD and a production cost of 1.14/ m3 USD [60].
On the contrary, other renewable energy technologies depending on thermal energy, such as geothermal and CSP systems, are being studied to be integrated with MED and other thermal desalination plants technologies. In a study completed by Jochen Bundschuh et al. [61], they have shown that if a low-cost geothermal energy source is available, then geothermal energy will be superior to solar energy for operating MED desalination plants, as it allows for scaling up the capacity of the plant to more than 1000 m3/day, which is an advantage that solar-powered MED desalination plants do not possess; also, geothermal heat sources are more stable in terms of the energy output they can provide [61]. Veera Gnaneswar Gude [62] supports the previous suggestion, and he had completed a study comparing geothermal heat sources with other heat sources and showed that geothermal based desalination plants must be put into consideration as they show a very promising advancement, especially in areas that are suffering from water scarcity and elevated temperatures [62].
Although RO is the most frequently used desalination technology worldwide, it is not the most suitable option everywhere around the globe. As mentioned by El-Dessouky and Ettouney [63], the harsh conditions in the MENA region, especially in the Gulf area, are more suitable for MED desalination plants rather than RO desalination plants [63]. The previous finding rises the importance of finding more suitable arrangements and technologies for seawater desalination in such regions. To date, many researchers have studied the integration of CSP plants with MED desalination plants. Among others, Mustafa Jaradat et al. have studied the potential of combining a CSP plant with a Low-Temperature Multi-Effect Desalination (LT-MED) plant in the MENA region, specifically in the city of Aqaba in Jordan. The CSP system running by itself was found to have a potential power generation of 58.37 Megawatt-electric (MWel) to be distributed to the local grid in June, but in the case of operating the LT-MED system, it could provide 49.5 MWel excess power with a freshwater production rate of 170 m3/h, and when increasing the desalination stages to 10 stages, the system showed a significant increase in its production potential, reaching 498 m3/h [64].
The determination of what renewable energy source to be used and the desalination technology it is supposed to be combined with is not as simple as it may seem, since renewable energy sources vary from a region to another, limiting the chance of having a universal design for a desalination plant that is powered by a specific energy source, but as mentioned in many studies; RO technology is the most mature technology among other technologies in terms of the number of studies that have been completed regarding desalination technologies, as other technologies require further investigation. To date, RO technology can be dealt with as the most efficient and suitable desalination technology to be used worldwide, disregarding some exceptions [65].
In this research, a hypothetical solution was examined for preventing the predicted Sea Level Rise (SLR) by seawater desalination through a large number of desalination plants powered by renewable energy sources distributed worldwide; it also will study the feasibility of the desalinated seawater to resolve the global water scarcity by complete coverage for global water demand.

1.5. The Water Cycle and Water Storage

The water cycle is defined as a circular cycle that describes the continuous movement of water within the Earth and the atmosphere through evaporation, condensation and precipitation [66]. The mass of water within the water cycle is conserved within the Earth’s system and is only allowed to be transferred from a phase to another and from a reservoir to another within the system. Hence, in order to prevent the rise in water level through desalination, the desalinated water must be maintained in a storage system that prevents water from returning to the cycle and ending up in the oceans. Storing water in dams is the most viable and available method of water storage worldwide, either in conventional water dams or in hydroelectric water dams that utilize hydropower to generate electricity. Although hydroelectric dams are the perfect choice for such a situation by possessing the ability to resolve water scarcity, energy crisis and to prevent SLR, they are too expensive and require very specific geographical conditions to function properly, which will prohibit many countries from being able to implement the solution suggested in this work. Therefore, the focus will be on conventional water dams to be built worldwide for water storage and supply.

2. Methodology

In this section, a hypothetical case of preventing the SLR by removing water from oceans, seas and bays by desalination plants. The study period will be between 2025 and 2100. As mentioned earlier, the predicted SLR by 2100 varies from a source to another, with a minimum predicted value of 0.28 m in the case of RCP 2.6 by the IPCC and a maximum of 2.5 m by the National Oceanic and Atmospheric Administration (NOAA) [12,15]. The amount of water in oceans must be known before estimating the amount of saline water that must be removed from oceans in order to prevent the SLR predicted by 2100, and according to NASA, the United States Geological Survey and the National Geophysical Data Center, water occupies a Total Surface Area (TSA) of around 361,900,000 km2 with an average error in this value of 0.1% [67,68,69]. One approach to finding the amount of water that must be removed from oceans to prevent the cumulative SLR can be computed by multiplying the total area of oceans by the amount of predicted SLR. The Volume of SLR (VSLR) (m3) is given by the following equation.
VSLR   ( m 3 ) = SLR   ( m ) ×   TSA   ( m 2 )
By assuming that the SLR predicted by 2100 will happen gradually on a continuous daily manner, one can obtain the amount of water increase per day by dividing the volume of SLR in each scenario by the number of days in the period between 2025 and 2100. Each year has 365.25 days; therefore, 75 years will be equivalent to 27,393 days. The equation below gives the amount of SLR (m3) to be removed per day.
VSLR   ( m 3 / day ) = VSLR   ( m 3 ) 27 , 393.75   ( days )
Keeping in mind the Earth’s water cycle, and by assuming that all of the water that will cover the population demand (VD) will end up in oceans once again, as well as considering evaporative losses that will lead to a portion of the water leaving the dams through evaporation and also be precipitated elsewhere, the volume of total daily water removal from oceans (VTot) can be obtained after obtaining the amount of water required to be supplied to dams (VS) from the following equations.
V D   ( m 3 / day ) = Average   Annual   Water   Demand   ( 2025 2100 )   ( m 3 ) 365.25   ( days )
V S   ( m 3 / day ) = VSLR   ( m 3 / day ) +   V D   ( m 3 / day )  
V Tot   ( m 3 / day ) = V S   ( m 3 / day )   ( 1 +   Evaporative   Losses % )
The desalination projects that will be put into consideration are MED and RO desalination plants powered by renewable energy sources. The projects in the literature provide adequate information for the capacity versus capital investment; therefore, the plants will be similar to the ones that already exist or have been studied. The projects will have the following costs and daily production capacities: MED-CSP 40,000 m3/day with a cost of 54.3 million USD [70], RO-PV 40,000 m3/day with a cost 47.16 million USD [71] and RO-Wind 40,000 m3/day with a cost of 60.92 million USD [72]. The plants will be evenly distributed worldwide based on the utilized renewable energy, as 50% of plants will be powered by solar energy and 50% will be powered by wind energy as follows: 25% MED-CSP, 25% RO-PV and 50% RO-Wind. The amount of water to be removed by each desalination technology is found by the following equations.
V   MED / CSP   ( m 3 / day ) = 0.25 × VSLR   ( m 3 / day )
V   RO / PV   ( m 3 / day ) = 0.25 × VSLR   ( m 3 / day )
V   RO / Wind   ( m 3 / day ) = 0.5 × VSLR   ( m 3 / day )
The number of the required plants for each technology can be found using the following equations:
No .   of   MED / CSP = V   MED / CSP   ( m 3 / day ) 40 , 000   ( m 3 / day )
No .   of   RO / PV = V   RO / PV   ( m 3 / day ) 40 , 000   ( m 3 / day )
No .   of   RO / Wind = V   RO / Wind   ( m 3 / day ) 40 , 000   ( m 3 / day )
The Capital Investment (CI) for each project and the Total Capital Investment (TCI) will be given by:
CI   MED / CSP   ( million   USD ) = No .   of   MED / CSP × 54.3
CI   RO / PV   ( million   USD ) = No .   of   RO / PV × 47.16
CI   RO / Wind   ( million   USD ) = No .   of   RO / Wind × 60.92
TCI   =   CI   MED / CSP + CI   RO / PV +   CI   RO / Wind
The average production costs for desalination plants are mentioned in [59,73,74], and the values for each cubic meter of produced water are (2.4–2.8) USD/m3 for MED-CSP, (1.5–3.4) USD/m3 for RO-PV and (2.0–5.2) USD/m3 for RO-Wind. The average value from each range will be taken for simplification; therefore, the cost per each cubic meter produced by each technology will be: 2.6 USD/m3 for MED-CSP, 2.45 USD/m3 for RO-PV and 3.6 USD/m3 for RO-Wind, and these values are assumed to remain unchanged until 2025. The Total Annual Water Production Cost (TAPC_T) for 2025 for all plants can be found by adding the Total Annual Production Cost (TAPC) for each plant for 2025.
TAPC   MED / CSP   ( USD ) = ( V   MED / CSP ( m 3 day ) × 2.6 ) × 365.25
TAPC   RO / PV   ( USD ) = ( V   RO / PV ( m 3 day ) × 2.45 ) × 365.25
TAPC   RO / Wind   ( USD ) = ( V   RO / Wind ( m 3 day ) × 3.6 ) × 365.25
TAPC_T = TAPC MED/CSP + TAPC RO/PV + TAPC RO/Wind

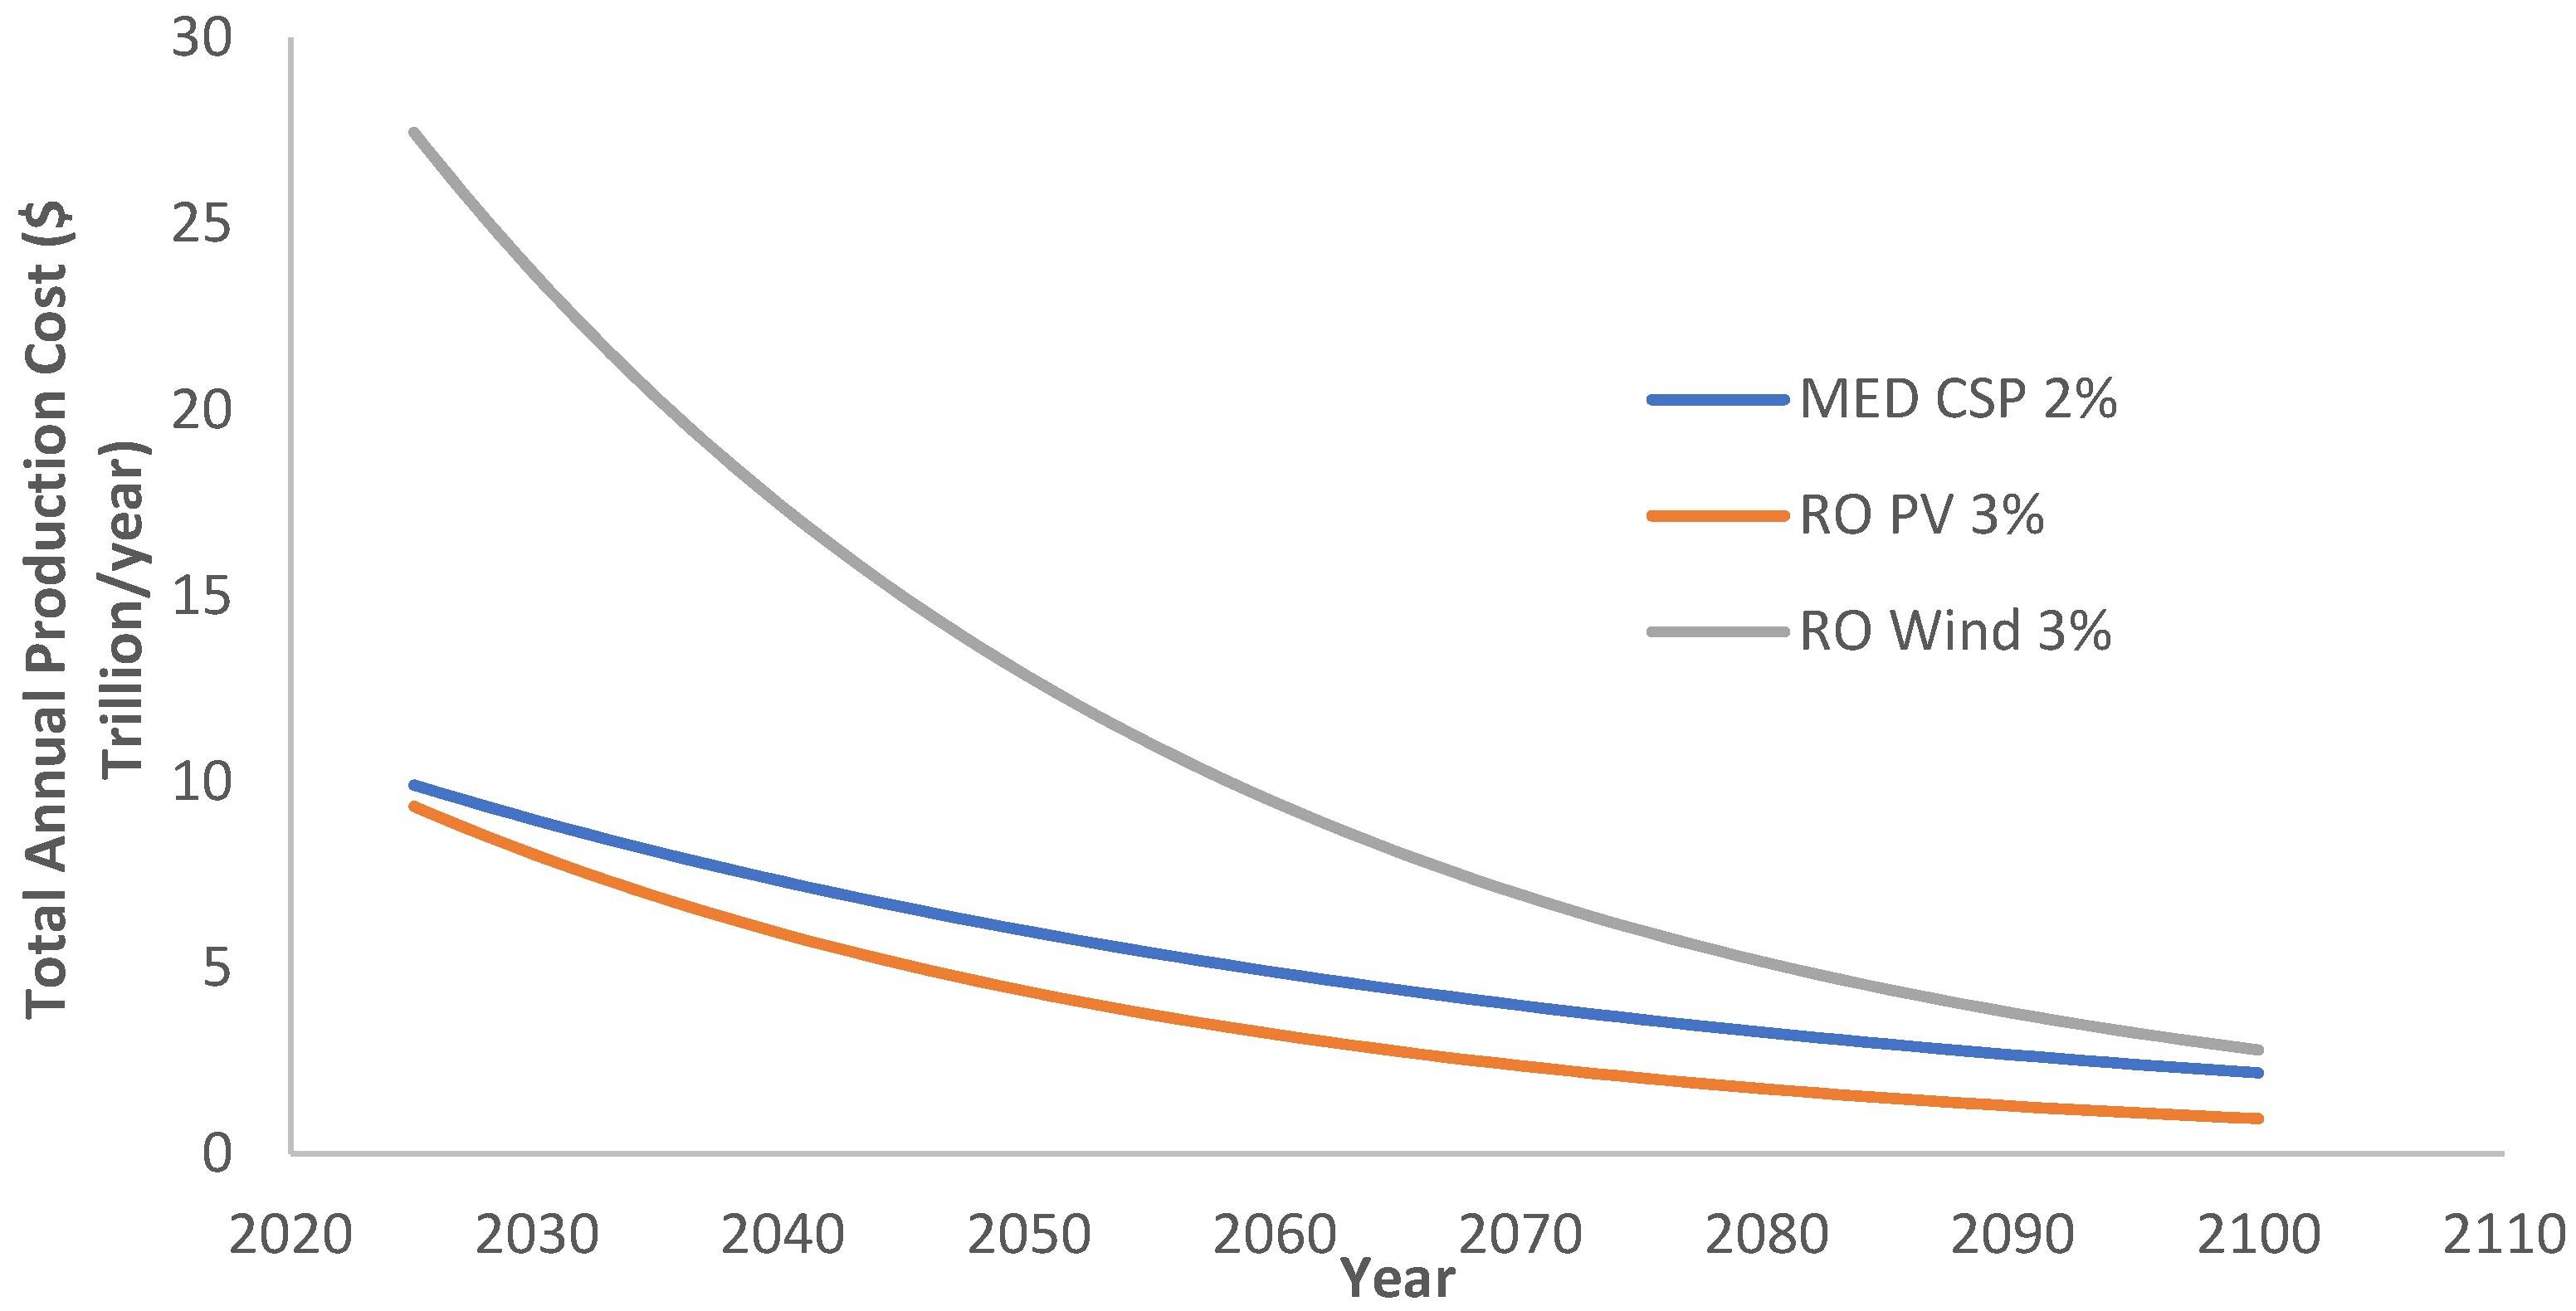
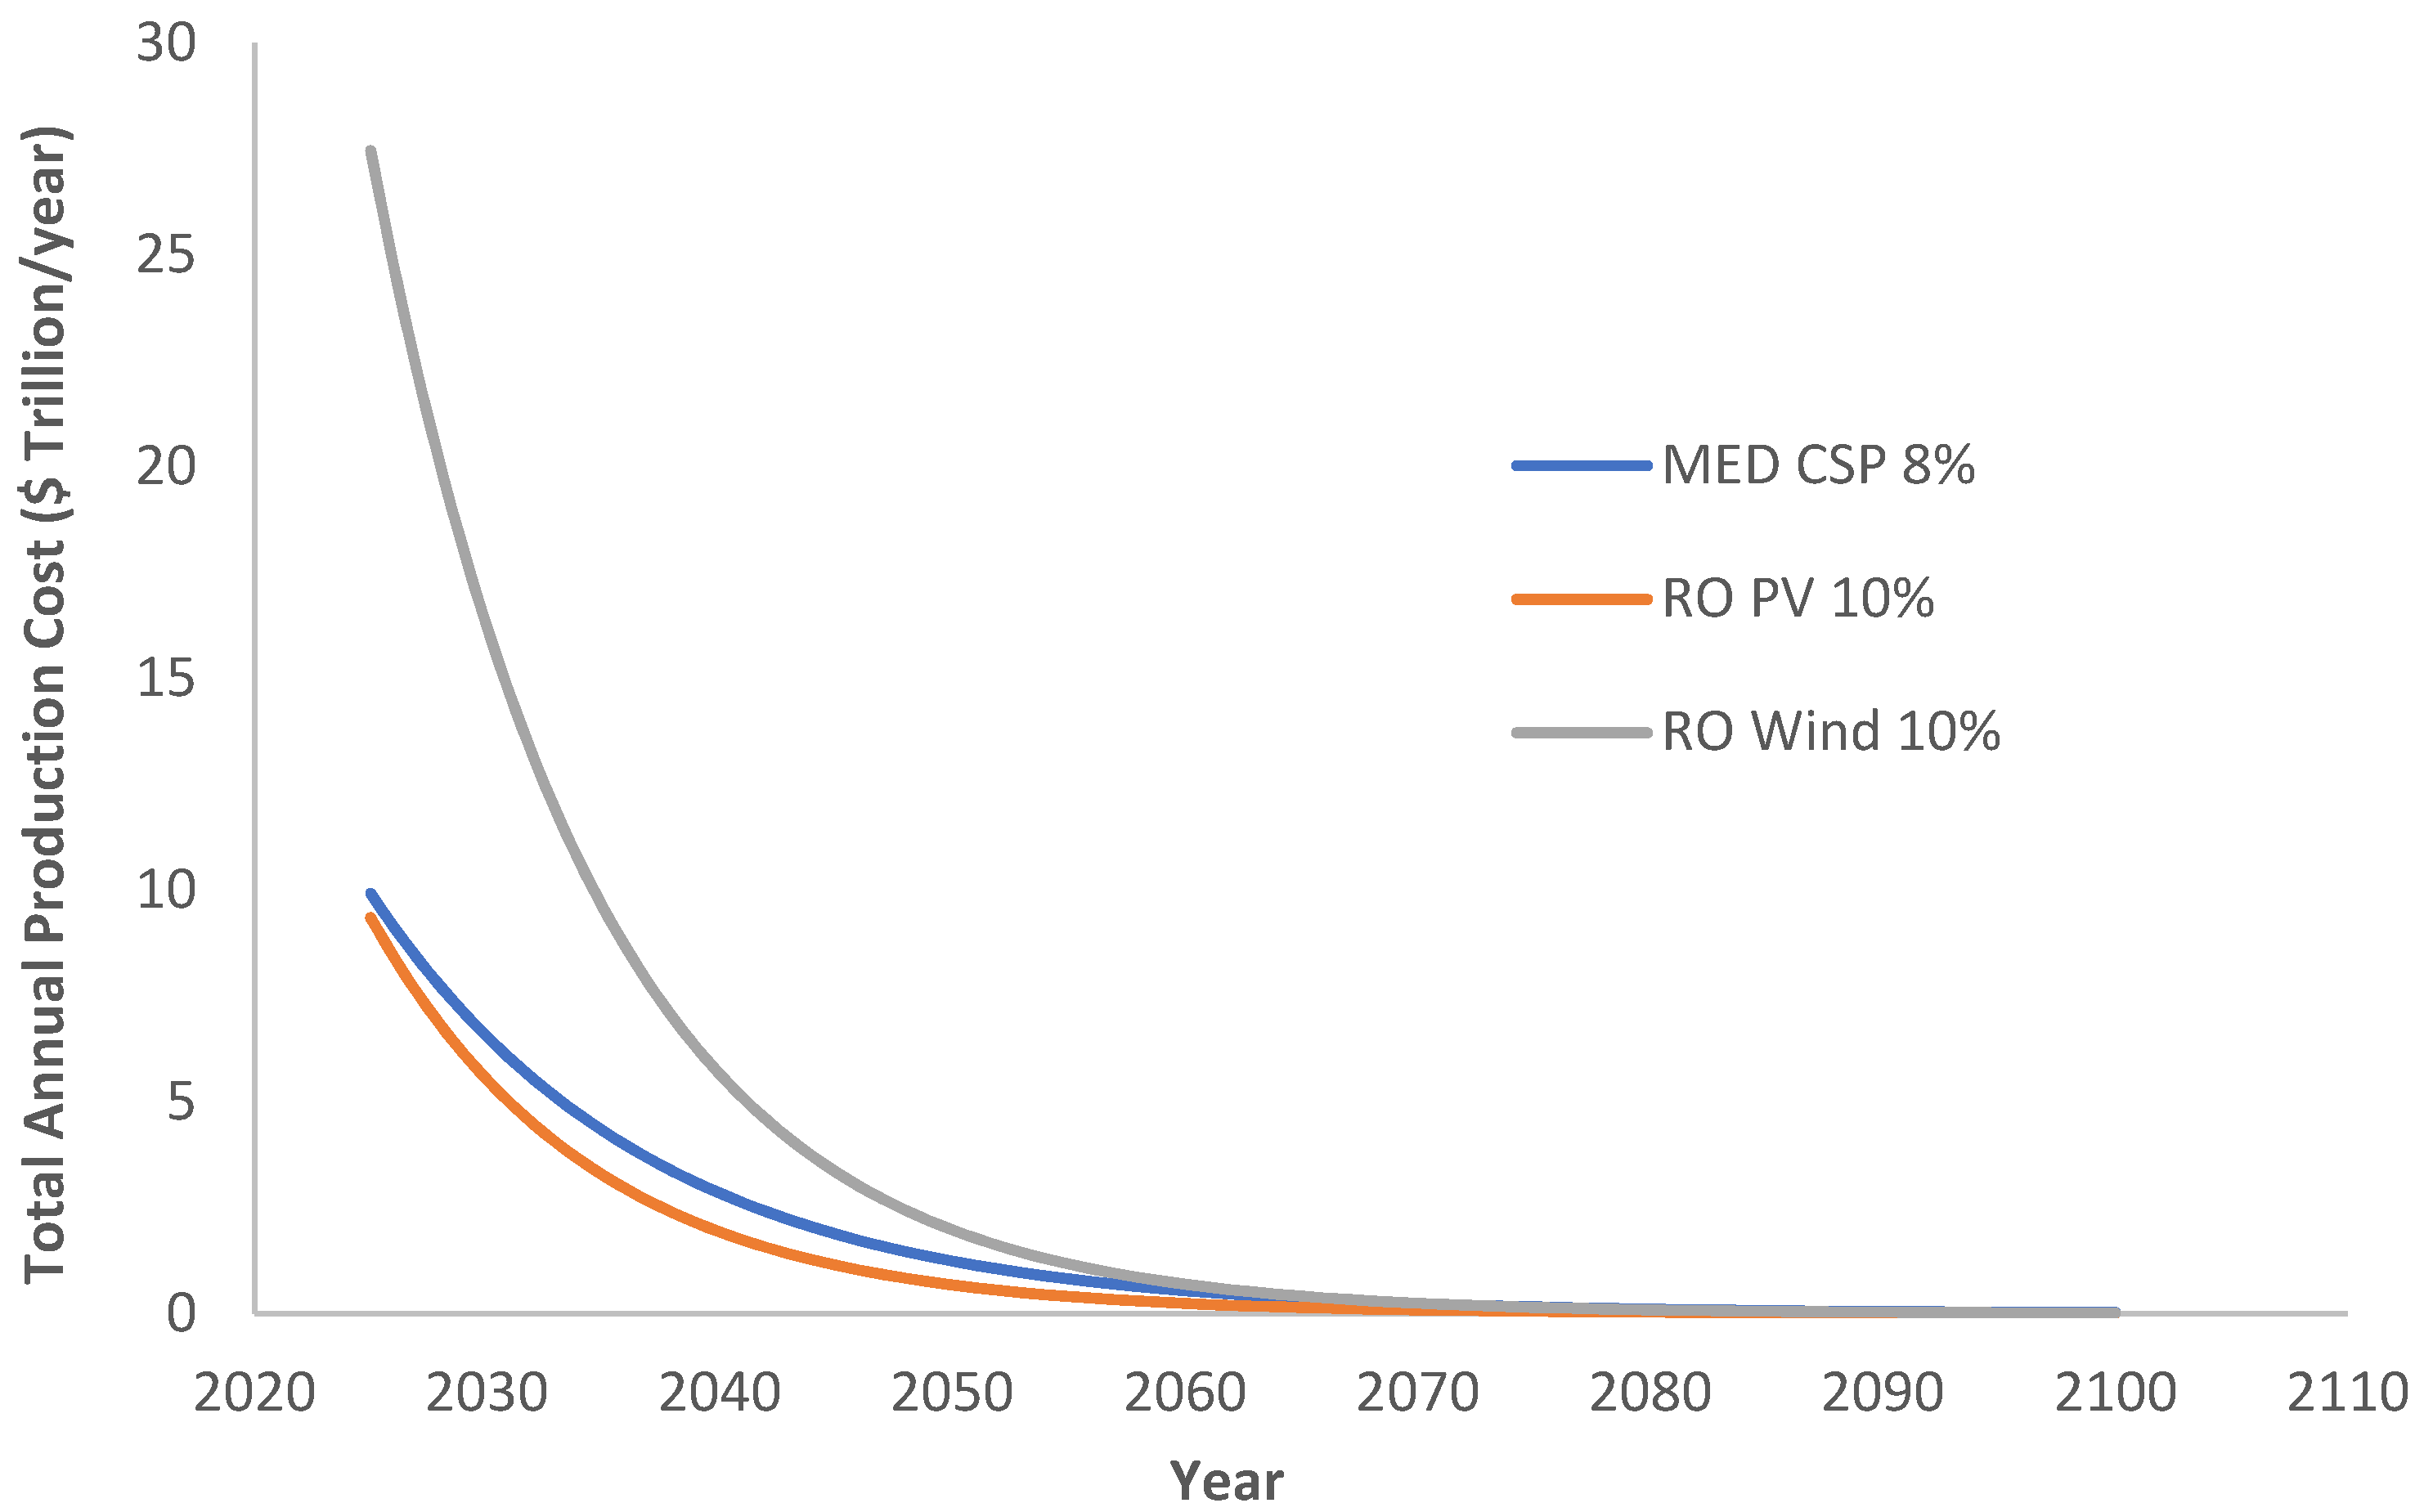
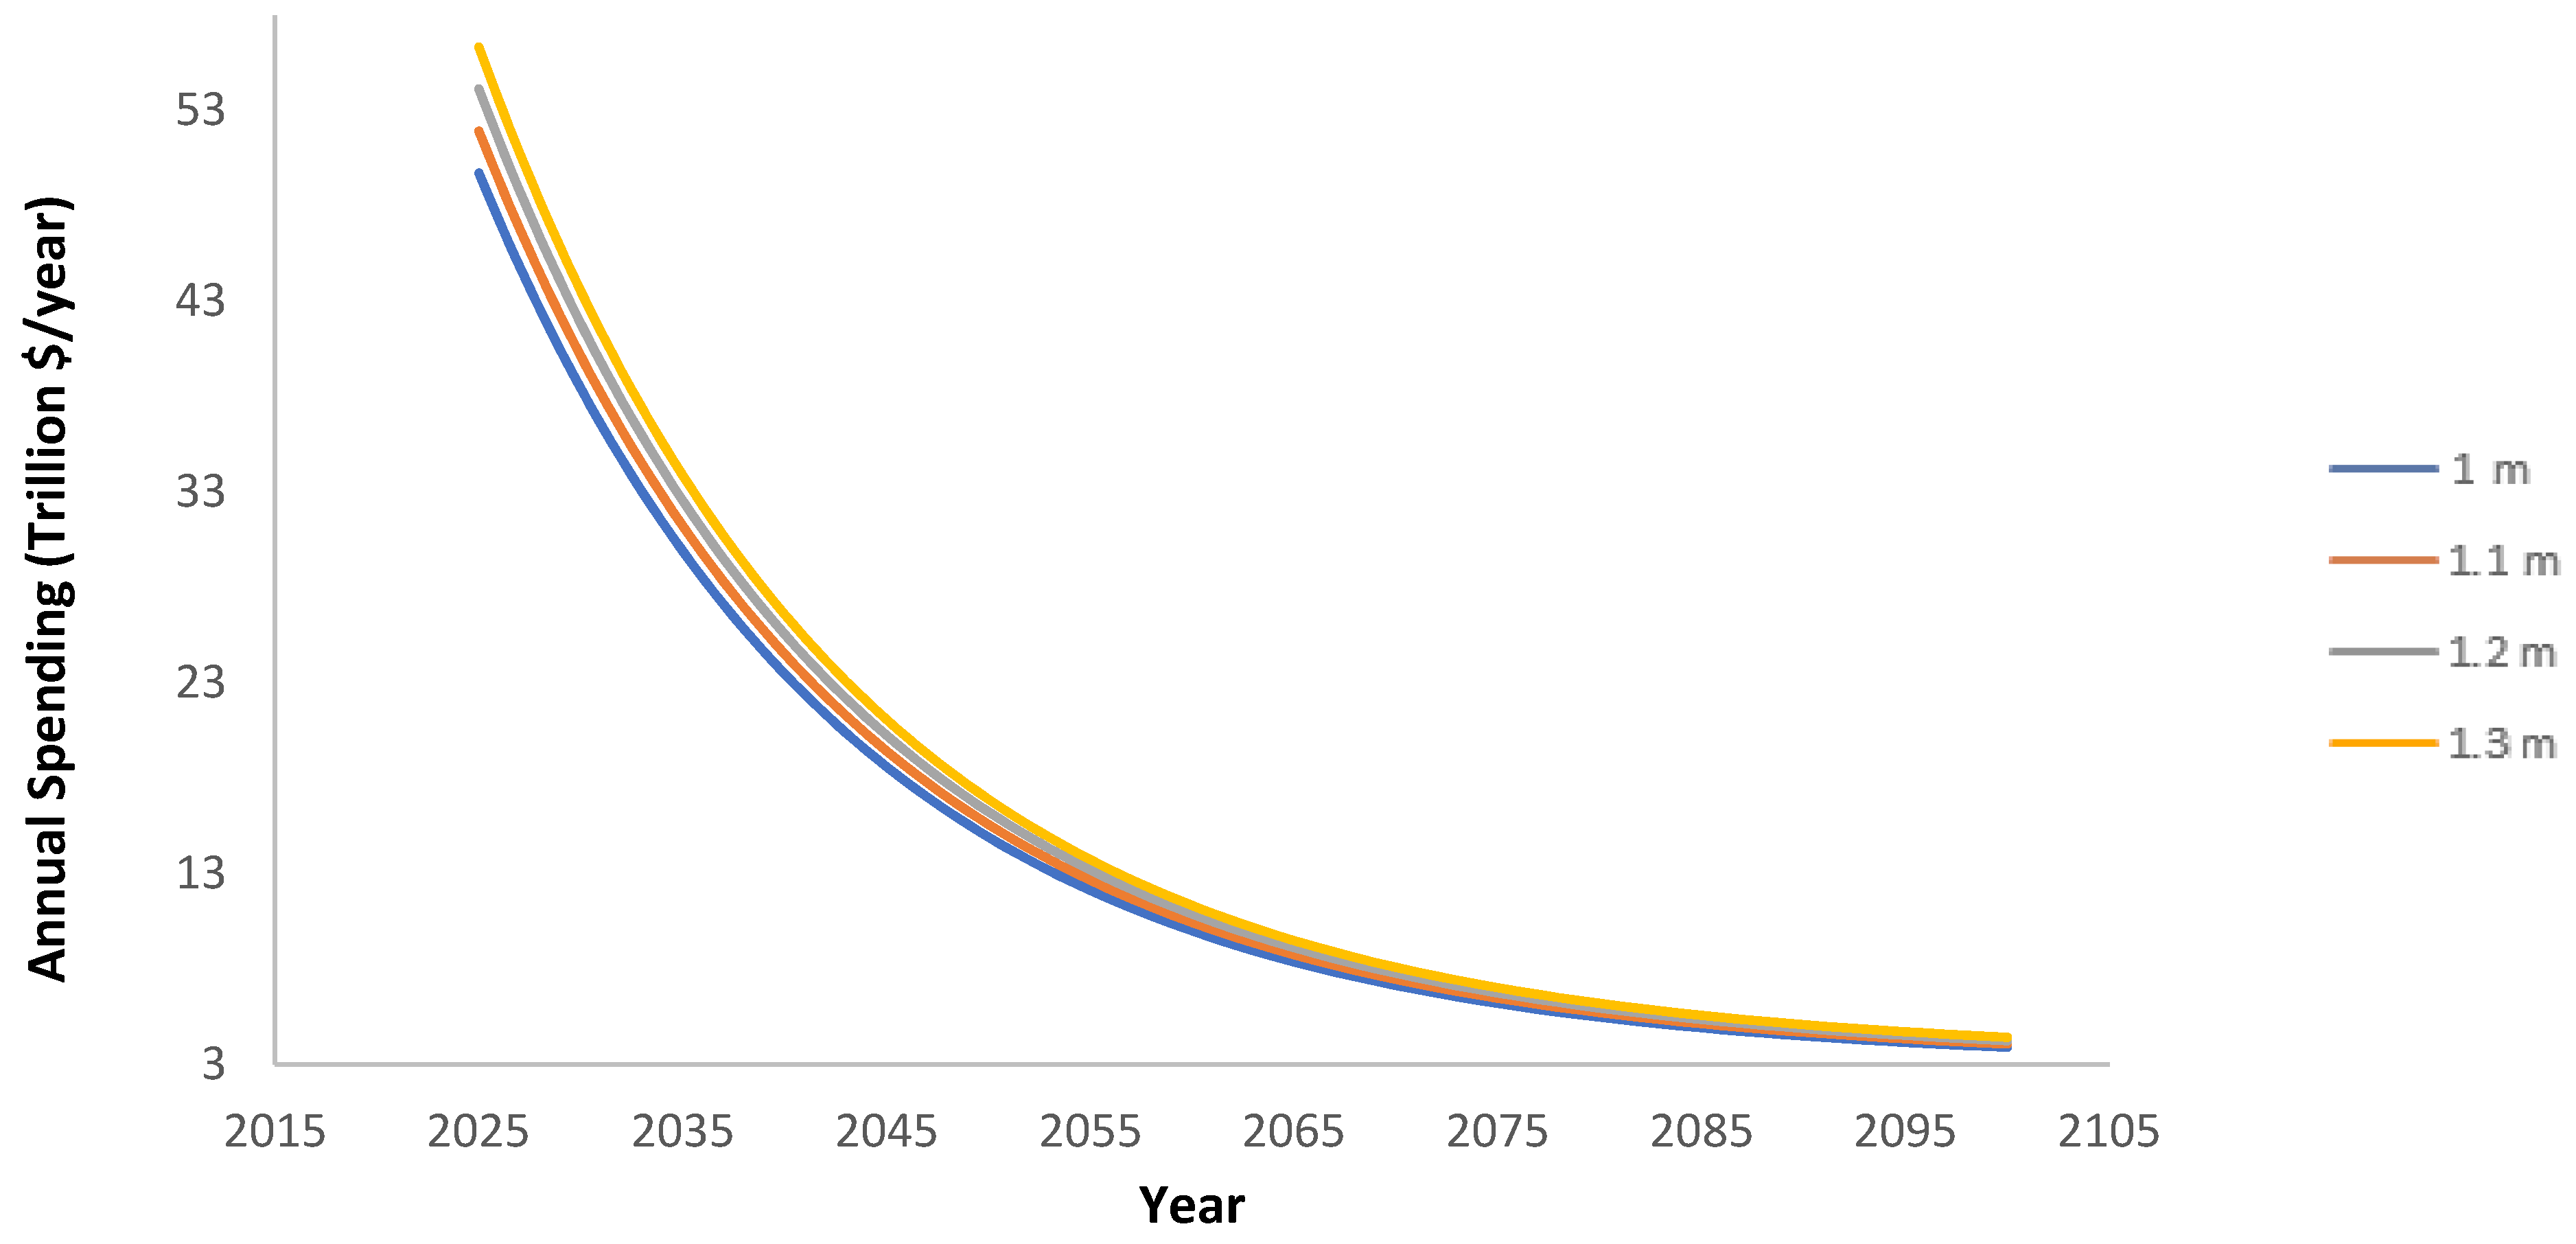
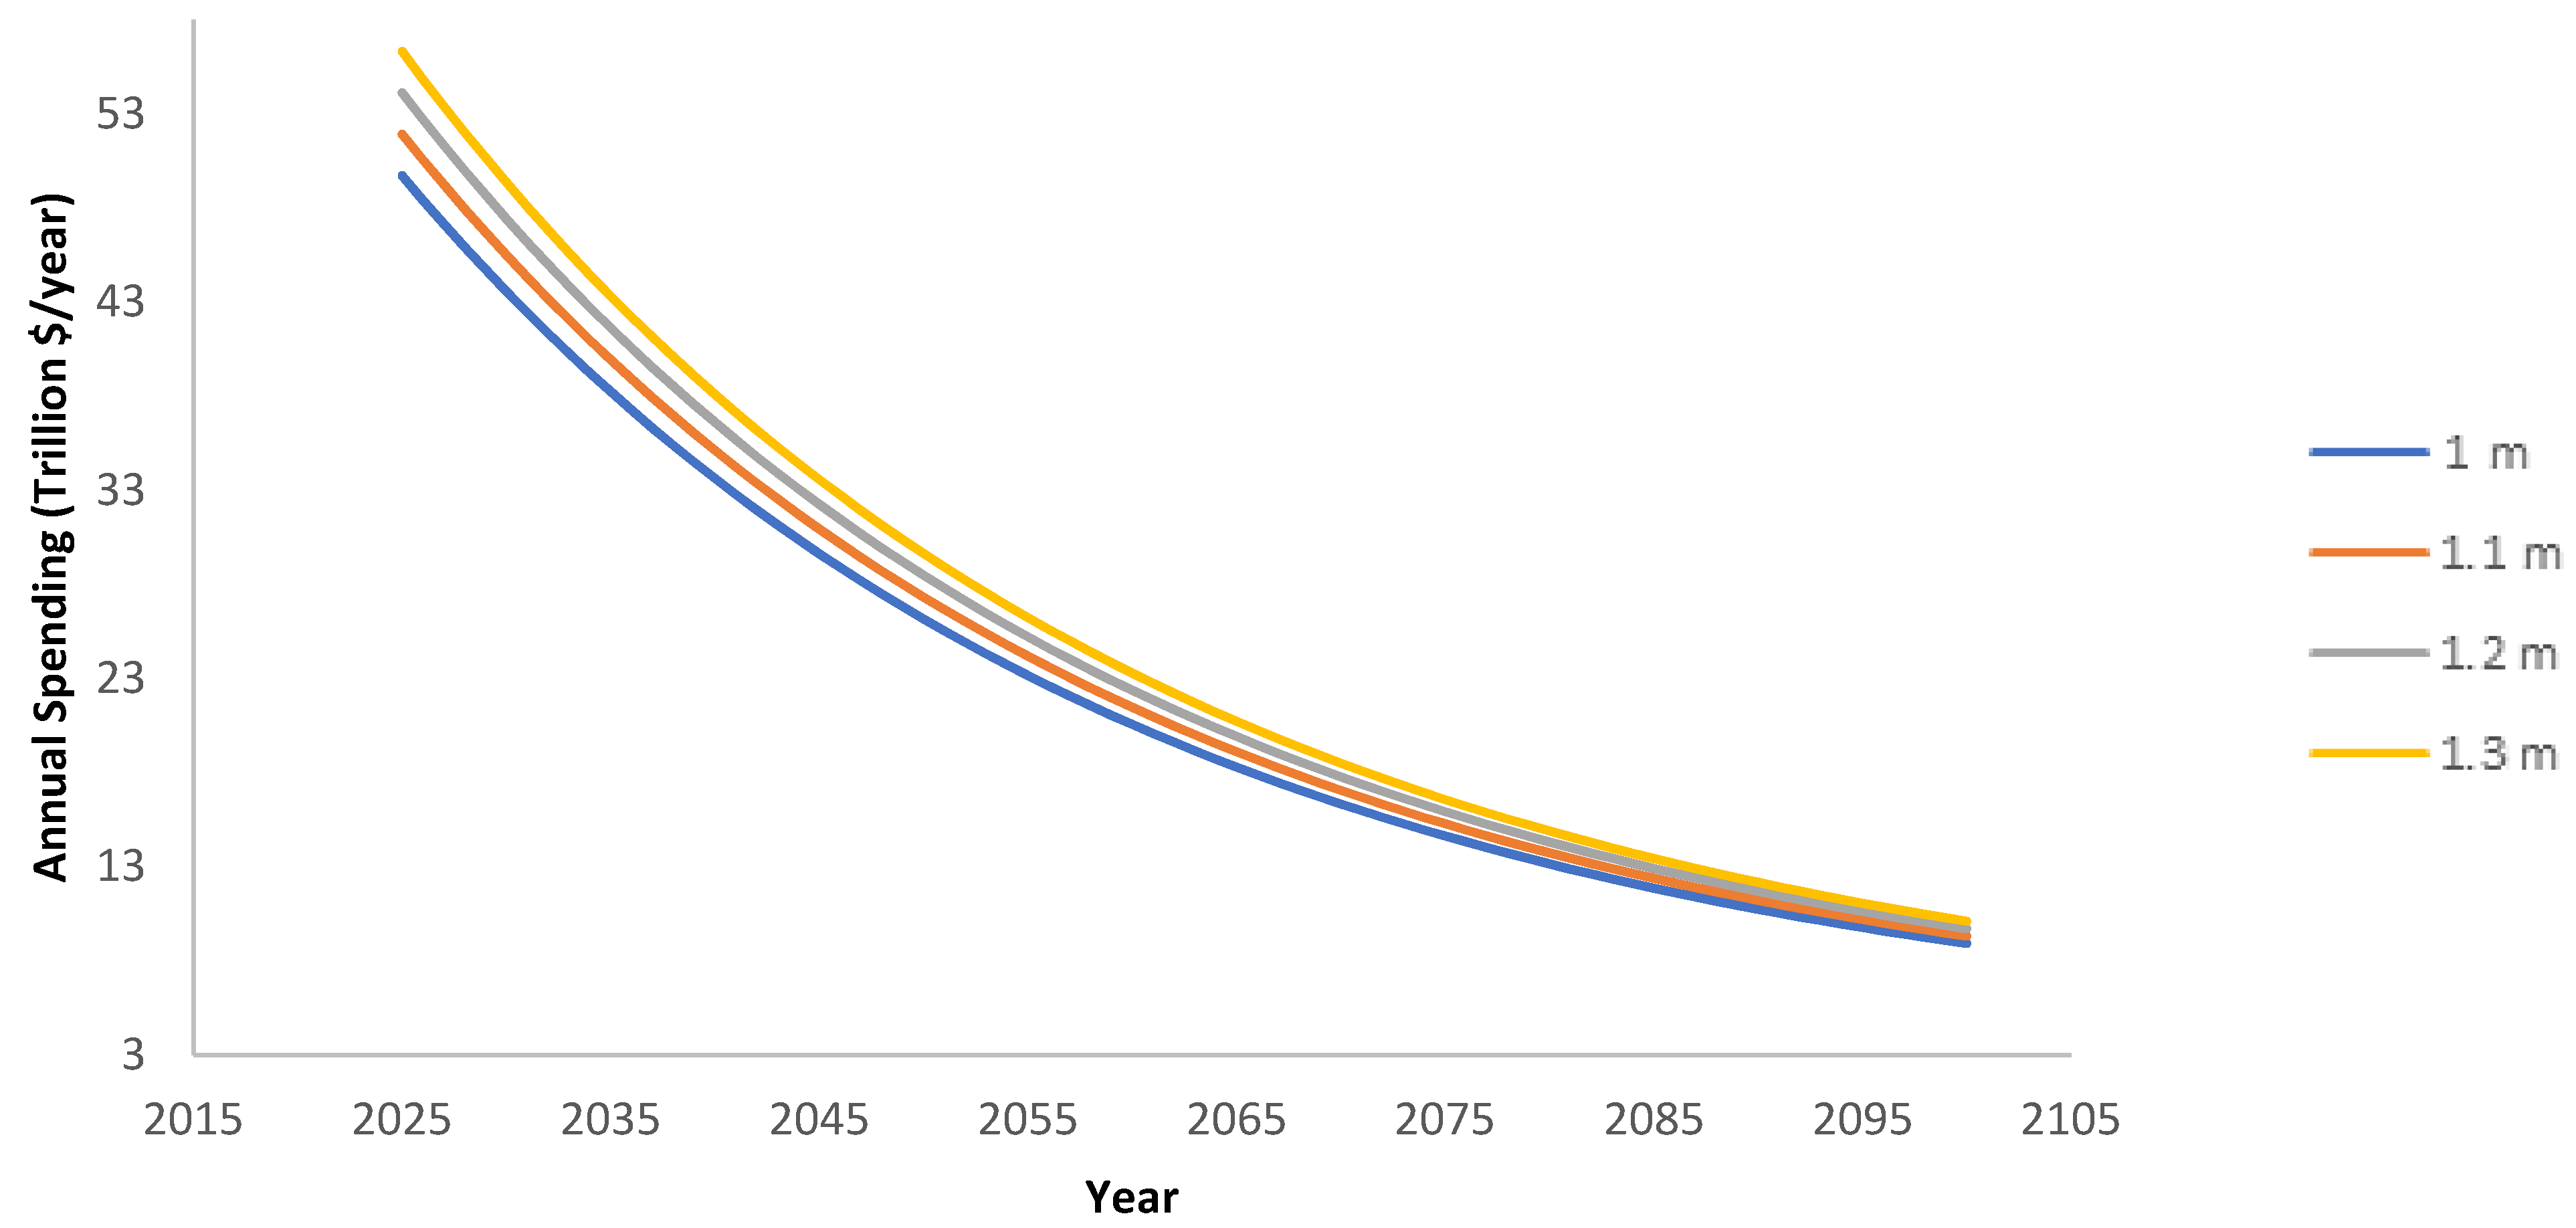
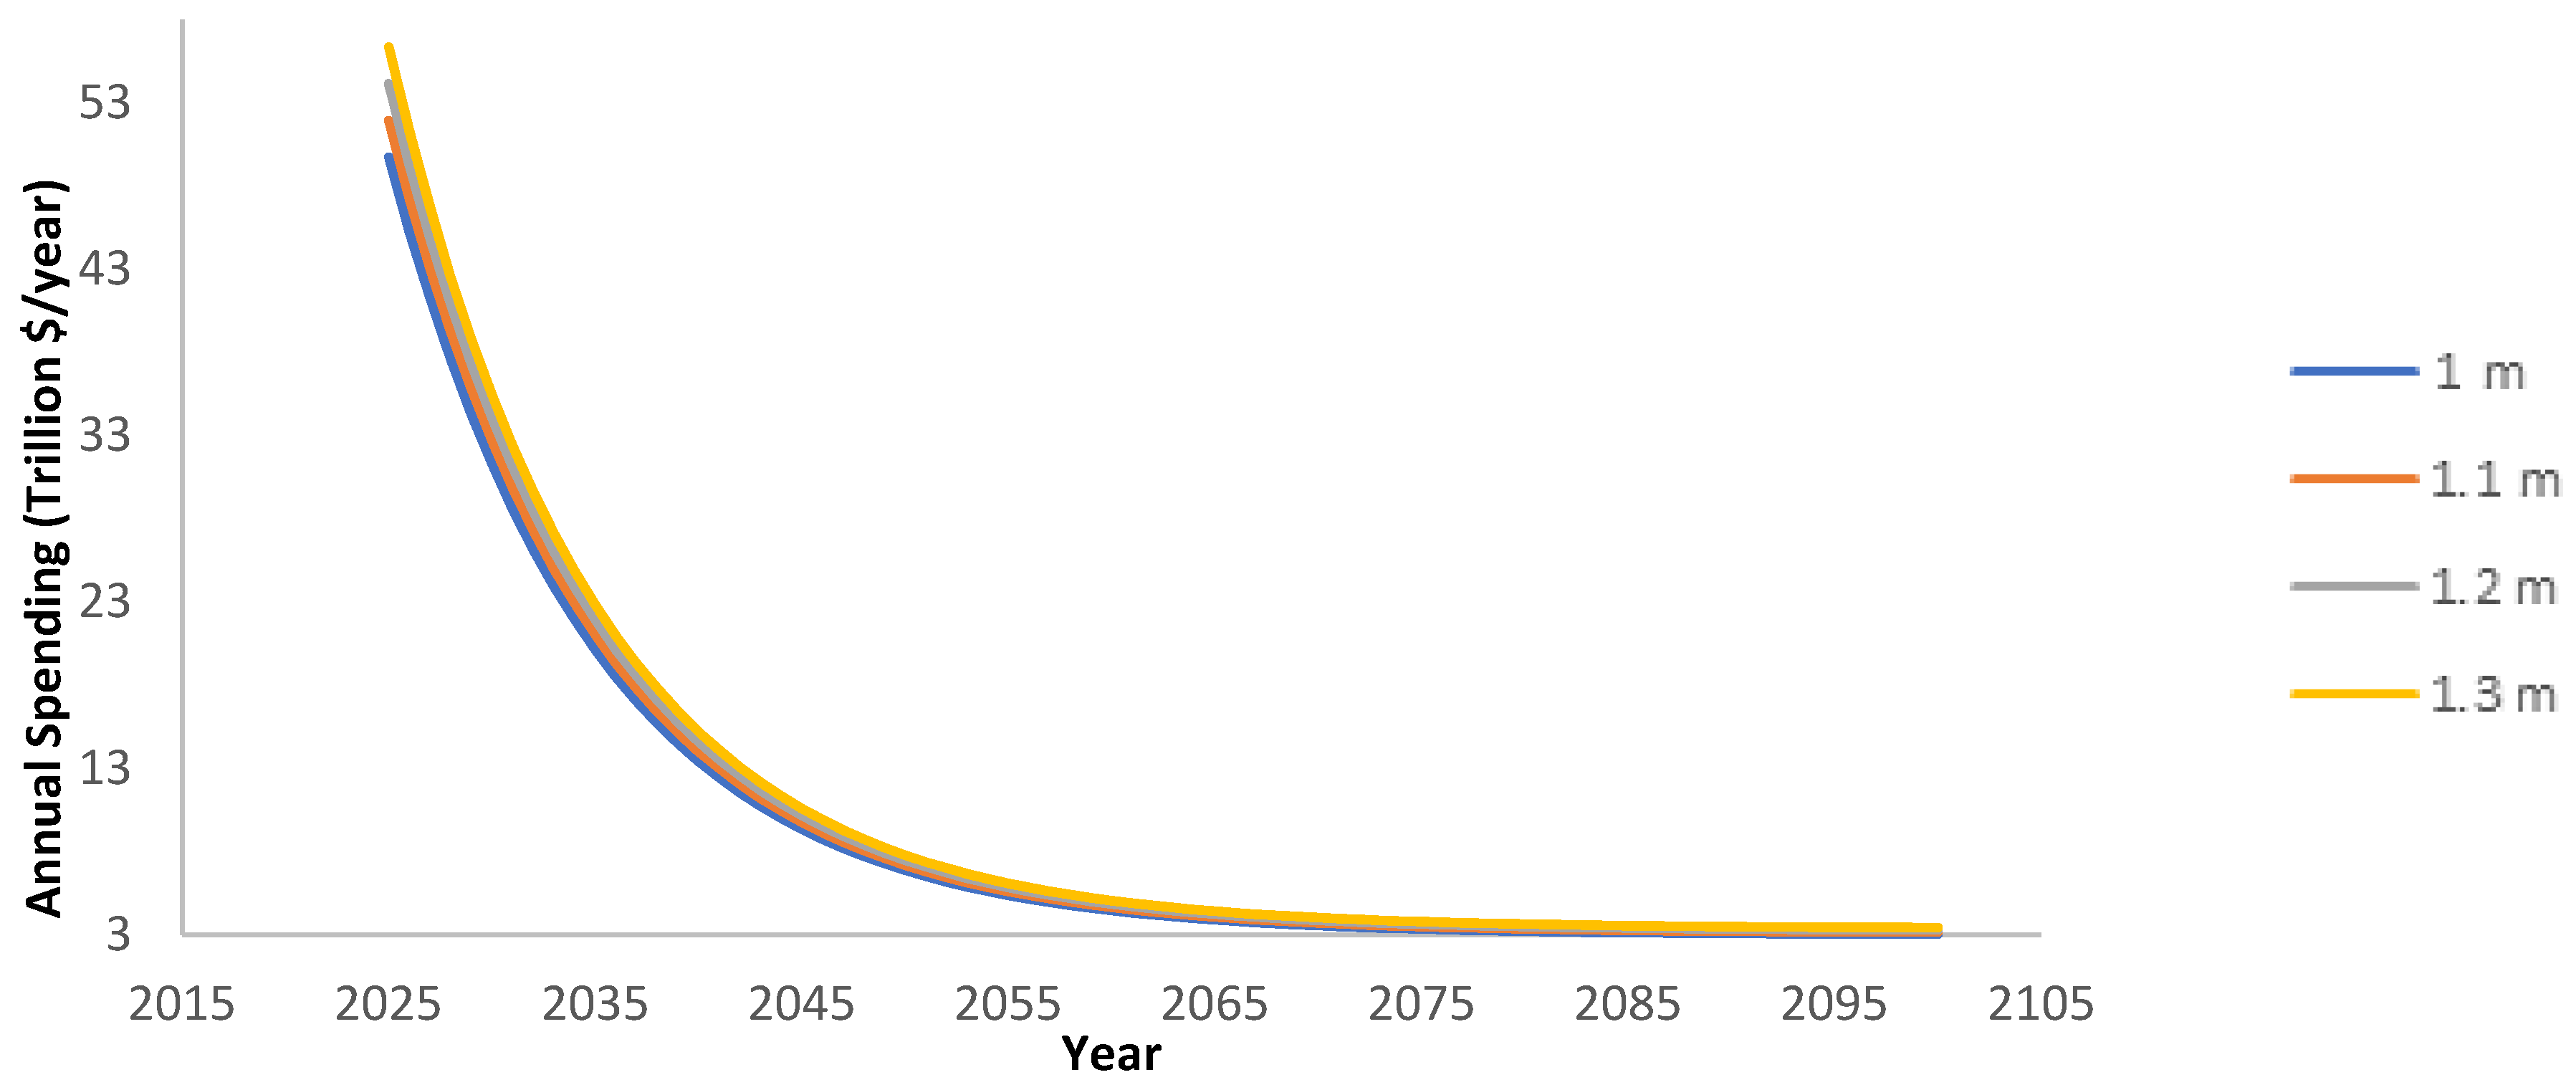
3. Results and Discussion

The predicted change in oceans, seas and bays volume (VSLR) corresponding to an SLR between (0.1–2.5 m) was calculated by applying Equation (1), and the results show that the volume of oceans, seas and bays will increase by 36.19 trillion m3. The daily increase in oceans volume was calculated by assuming that the increase will take place on a daily manner; therefore, the VSLR will be evenly distributed on 27,393.75 days (75 years), and Figure 1 shows the findings that resulted from applying Equation (2).
For instance, Figure 1 shows that if global precautions were directed towards preventing an SLR between 1.0 m and 1.3 m, the result would be an annual freshwater production between 4.825 trillion m3/year and 6.273 trillion m3/year, corresponding to complete coverage for the annual global water demands by 2050, thus eliminating the impacts of water scarcity on millions of humans, and solving two critical issues by a single solution.
The historical annual global water demand values between 1901 and 2014 were obtained from the International Geosphere-Biosphere Programme (IGBP) [75]. The data showed significant linearity with R2 = 0.9322. Hence, a linear regression was implemented to forecast the future values for the annual global water demand between 2014 and 2100, and the values for (2015–2021) were found to be somewhat accurate to the later observed values. Therefore, the linearity assumption was chosen for implementation in this work. Figure 2 shows the annual global water demand forecasted to 2100.
The average global annual water demand in the period (2025–2100) was obtained and was found to be 6.075 trillion m3/year. The required amount of water storage in dams (VS) is obtained by adding the daily global water demand to the daily water removal to prevent SLR by applying Equation (4). Thereafter, the total water to be desalinated daily worldwide (VTot) is obtained from Equation (5) after considering the evaporative losses that will occur in dams. The percentage of evaporative losses varies from an area to another and depends on variables regarding each specific dam. Hence, for simplification, the evaporative losses were fixed to be at a maximum percentage of 40% by means of evaporation control methods in case of losses >40% [76]. Figure 3 shows the results.
As mentioned in the previous section, the chosen capacity for MED-CSP, RO-PV and RO-Wind is 40,000 m3/day, and the percentage for each technology is 25% for MED-CSP, 25% for PV-RO and 50% for RO-Wind. Thereafter, by applying Equations (6A)–(6C) and (7A)–(7C), the number of each desalination project utilizing each technology was calculated. Figure 4 shows the required number of projects (25% MED-CSP, 25% RO-PV and 50% RO-Wind) with a capacity of 40,000 m3/day for each project to prevent SLR under different scenarios in the period (2025–2100).
For instance, the required number of desalination projects under a minimum SLR of 1 m by 2100 is approximately 1,044,492 (261,123 MED-CSP plants, 261,123 RO-PV plants and 522,246 RO-Wind plants), with each project having a capacity of 40,000 m3/day. On the other hand, for a SLR of 1.3 m, the required number of projects having the same capacity will be 1,183,208 plants distributed as the following: 295,802 MED-CSP plants, 295,802 RO-PV plants and 591,604 RO-Wind plants. The number of the required projects to prevent SLR depends on the latest available capacities of each project type; therefore, all mentioned values will very likely change with the change of projects capacities and technologies advancement.
The capital investment required to establish the desalination projects worldwide was found by applying Equations (8A)–(8C), while the total capital investment for all projects under a specific SLR was calculated using Equation (9). Figure 5 summarizes the capital investment values.
The values shown in Figure 5 are approximate due to the fact that the cost of desalination plants depends on several economic uncertainties, such as the price set by each manufacturer and the country. It was found that the capital investment for an SLR of 1 m is 58.31 trillion USD, with each technology contributing to the following values: 14.179 trillion USD for MED-CSP plants, 12.315 trillion USD for RO-PV plants and 31.815 trillion USD for RO-Wind plants. On the contrary, for a maximum predicted SLR of 1.3 m, the total capital investment will be 66.053 trillion USD, 16.062 trillion USD for MED-CSP plants, 13.95 trillion USD for RO-PV plants and 36.041 trillion USD for RO-Wind plants. By assuming that all participating countries will take loans to cover the capital investments with an interest rate of (i = 5%) to be compounded annually for n years of 75 (2025–2100), the annual payments to prevent SLR between 1 m and 1.3 m (AW_1 m, 1.1 m, 1.2 m, 1.3 m) within the previously mentioned period can be calculated using engineering economy equations [75], and they are:
For i = 5% and n = 75:
  • AW_1 m = 2.993 trillion USD where Investment = 58.31 trillion USD;
  • AW_1.1 m = 3.125 trillion USD where Investment = 58.31 trillion USD;
  • AW_1.2 m = 3.257 trillion USD where Investment = 58.31 trillion USD;
  • AW_1.3 m = 3.39 trillion USD where Investment = 66.053 trillion USD;
By applying Equations (10A)–(10C) and (11) for the average cost for each cubic meter of water production by each technology in 2025 being the following: 2.6 USD/m3 for MED-CSP [75], 2.45 USD/ m3 for RO-PV [77] and 3.6 USD/m3 for RO-Wind [59], and by considering three different scenarios for the annual reduction percentages in water production costs to be: Operation As Usual (OAU), where annual reduction costs for RO and MED technologies are (5.8%/annum) and (3.9%/annum), respectively [78]; Lower Than Usual (LTU), where annual reduction costs for RO and MED technologies are (3%/annum) and (2%/annum), respectively and Higher Than Usual (HTU), where annual reduction costs for RO and MED technologies are (10%/annum) and (8%/annum), respectively. The following values shown in Figure 6, Figure 7 and Figure 8 represent the scenarios for an SLR of 1 m.
From the previous figure, it can be clearly observed how the learning curve for desalination technologies is expected to significantly decrease the production costs of water by all technologies and under all scenarios. The values for daily production costs are averaged from the literature, in which ranges for production costs are mentioned, and these ranges, especially for RO-Wind and RO-PV technologies, have a significant gap between minimum and maximum production costs values for each technology; hence, the findings in Figure 6, Figure 7 and Figure 8 can be modified if the production costs settled around a more stationary value worldwide.
The annual constant payments (AWs) mentioned earlier were added to the total annual production costs for all plants in the case of an SLR ranging between 1 m and 1.3 m under OAU, LTU and HTU conditions. Figure 9, Figure 10 and Figure 11 represent the findings. The annual production cost for all technologies added to the annual payments to prevent SLR between 1.0 m and 1.3 m under different development scenarios and averaged over 75 years in the period (2025–2100) summarized in Table 1.
Researchers believe that if SLR impacts were ignored and not mitigated, the world’s global Gross Domestic Production (GDP) would be subjected to losses that can go up to 9.3% in the case of an SLR of 1.23 m by 2100 [79]. Particularly, an SLR of 1.23 m is considered to be the maximum predicted value according to the IPCC; it also lays within the previously mentioned range (1.0–1.3 m) of the necessary amount of water to cover the global water demand; therefore, it would be more convenient to focus on preventing an SLR close to these values in order to resolve both issues without the need of excessive, unnecessary spending. After many efforts from scientists to have a better and more practical understanding of different variables that may arise or be affected by climate change, a group of climate scientists, economists and other specialists from different fields were able to introduce the idea of Shared Socioeconomic Pathways (SSPs), which enabled the world to make more logical predictions regarding economy, social life and other aspects that will probably be affected by climate change. SSPs are divided into five categories ranging from SSP1, which represents a perfect sustainability scenario along the twenty-first century, down to SSP5, which represents a scenario where the reliance on fossil fuel remains the same, and little or no actions are taken worldwide [80]. According to R. Dellink et al., global GDP will be relatively influenced by climate change depending on the SSP that will govern the world in the twenty-first century, and in their forecasting for GDP in the twenty-first under different SSPs, they came up with the following findings shown in Figure 12 [81].
The findings suggest that with an SLR between 1 m and 1.3 m and different development scenarios, the total annual cost of water production along with the annual payments averaged over 75 years would be less than the losses linked with SLR under all SPSSs. The results may seem at first sight as if they contradict the need for investment in global desalination projects, especially in the first half of the century, where desalination technologies are expected to be relatively expensive in terms of their water production costs. The proposal should be viewed as a solution for two major catastrophes: SLR and water scarcity. Additionally, the solution involves too many environmental and humane advantages that may be hard to be represented numerically.

4. Conclusions

The suggestion proved its potential in both economic and social aspects by showing a high chance of complete coverage to the global water demand as well as showing promising expectations regarding the prevention of SLR and its adverse impacts. The large investment costs required to implement the idea will probably be less than the previously mentioned values, and the annual production costs will very likely drop down as time goes by due to the learning curve of desalination technologies, as many of desalination technologies are still in research and development stages and the ones that are already functioning will eventually experience modifications to increase their efficiency and to improve their functionality by other means, which will hopefully decrease the costs of production and installation. Additionally, the evaporative losses of 40% can be significantly decreased with the use of evaporation reduction methods, which will correspond to a decrease in production and initial costs. The study showed that an SLR between 1.0 m and 1.3 m would be more favorable to consider among other values for SLR since within this range lays the maximum predicted SLR by the IPCC, which is 1.23 m; also, it is the suitable range to resolve the issue of water scarcity. Considering SLR values that are larger than 1.3 m may be an overestimation that might lead to unnecessary spending. The suggestion also completely eliminates the water scarcity issue worldwide, which also strengthens the cause of investing in desalination plants.
More storage basins will be required to contain the unused desalinated water. The excess water can be used in two major ways; one of them is to ensure that the excess amount of water does not go back into oceans, while the other way is to use water in operations in which water takes a significant time before it goes back into oceans. As an example, to prevent water from going back into oceans, it can be used in closed cycle operations where water acts as a refrigerant or a working fluid. On the other hand, water can be used in processes such as hydrogen production via electrolysis, where water is broken down into gaseous elements that will take a lot of time to go back into oceans, which will give the world more time to act regarding the SLR. Indeed, the implementation of such a huge scale project is not as easy as it seems, since it requires global interest and cooperation to make it possible, and legislations and global attention towards the severity of climate change that is now a dream but can one day be a reality.
Further investigations are needed to the techno-economic study for the feasibility of preventing SLR by global seawater desalination and the detailed global distribution for seawater desalination plants to prevent SLR. Additionally, environmental impacts of brine production from SLR prevention by seawater desalination need more investigation.

Author Contributions

Conceptualization, M.H., A.A. and R.A. (Rashed Altarawneh); methodology, M.H., A.A. and M.J. (Mustafa Jaradat); software, M.A.-O.; validation, Q.A., M.J. (Mejdi Jeguirim), A.A. and T.T.; formal analysis, M.H., A.A. and R.A. (Rashed Altarawneh); investigation, M.H., A.A. and M.J. (Mejdi Jeguirim); resources, M.J. (Mejdi Jeguirim); data curation, M.H., A.A. and O.K.; writing—original draft preparation, M.H. and A.A.; writing—review and editing, A.A., R.A. (Ramez Abdallah); P.D. and A.J.; supervision, M.J. (Mejdi Jeguirim); M.H., A.A., R.A. (Ramez Abdallah) and A.J. All authors have read and agreed to the published version of the manuscript.

Funding

This research received no external funding.

Institutional Review Board Statement

Not applicable.

Informed Consent Statement

Not applicable.

Data Availability Statement

This study did not report any data.

Acknowledgments

The authors would like to acknowledge the German Jordanian University, An Najah National and University and the Institute of Materials Science of Mulhouse (IS2M), the University of Haute Alsace, University of Strasbourg–France, for facilitating this research.

Conflicts of Interest

The authors declare no conflict of interest.

References

  1. National Centers for Environmental Information (NCEI). Assessing the Global Climate in 2019. News. Available online: https://www.ncei.noaa.gov/news/global-climate-201912 (accessed on 4 January 2021).
  2. Mudge, F.B. The development of the ‘greenhouse’theory of global climate change from Victorian times. Weather 1997, 52, 13–17. [Google Scholar] [CrossRef]
  3. Tyndall, J., XXVII. On radiation through the earth’s atmosphere. Lond. Edinb. Dublin Philos. Mag. J. Sci. 1863, 25, 200–206. [Google Scholar] [CrossRef]
  4. Manson, M. Geological and Solar Climates: Their Causes and Variations: A Thesis; G. Spaulding & Company, Printers: San Francisco, CA, USA, 1893. [Google Scholar]
  5. Arrhenius, S., XXXI. On the influence of carbonic acid in the air upon the temperature of the ground. Lond. Edinb. Dublin Philos. Mag. J. Sci. 1896, 41, 237–276. [Google Scholar] [CrossRef] [Green Version]
  6. Department of Agriculture, Water and the Environment. Greenhouse Effect. Available online: https://www.environment.gov.au/climate-change/climate-science-data/climate-science/greenhouse-effect (accessed on 4 January 2021).
  7. Callendar, G.S. The artificial production of carbon dioxide and its influence on temperature. Q. J. R. Meteorol. Soc. 1938, 64, 223–240. [Google Scholar] [CrossRef]
  8. World Meteorological Organization. Secretariat. In Proceedings of the World Climate Conference—A Conference of Experts on Climate and Mankind, Geneva, Switzerland, 12–23 February 1979. [Google Scholar]
  9. Climate Change: The IPCC 1990 and 1992 Assessments. 1992. Available online: https://www.ipcc.ch/report/climate-change-the-ipcc-1990-and-1992-assessments/ (accessed on 10 May 2021).
  10. Climate Time Machine. Available online: https://climate.nasa.gov/interactives/climate-time-machine (accessed on 4 January 2021).
  11. IPCC. Summary for Policymakers. In Climate Change and Land: An IPCC Special Report on Climate Change, Desertification, Land Degradation, Sustainable Land Management, Food Security, and Greenhouse Gas Fluxes in Terrestrial Ecosystems; Shukla, P.R., Skea, J., Buendia, E.C., Masson-Delmotte, V., Pörtner, H.-O., Roberts, D.C., Zhai, P., Slade, R., Connors, S., van Diemen, R., et al., Eds.; IPCC: Geneva, Switzerland, 2019. [Google Scholar]
  12. IPCC. Climate Change 2014: Synthesis Report. Contribution of Working Groups I, II and III to the Fifth Assessment Report of the Intergovernmental Panel on Climate Change; Core Writing Team, Pachauri, R.K., Meyer, L.A., Eds.; IPCC: Geneva, Switzerland, 2014; 151 p. [Google Scholar]
  13. Stocker, T. (Ed.) Climate Change 2013: The Physical Science Basis: Working Group I Contribution to the Fifth Assessment Report of the Intergovernmental Panel on Climate Change; Cambridge University Press: New York, NY, USA, 2014. [Google Scholar]
  14. Jevrejeva, S.; Moore, J.C.; Grinsted, A. Sea level projections to AD2500 with a new generation of climate change scenarios. Glob. Planet. Chang. 2012, 80, 14–20. [Google Scholar] [CrossRef]
  15. Sweet, W.W.V.; Kopp, R.; Weaver, C.P.; Obeysekera, J.T.B.; Horton, R.M.; Thieler, E.R.; Zervas, C.E. Global and Regional Sea Level Rise Scenarios for the United States; Technical Report for NOAA: Washington, DC, USA, 2017. [Google Scholar]
  16. Lu, D.; Flavelle, C. Rising seas will erase more cities by 2050, new research shows. The New York Times, 29 October 2019. [Google Scholar]
  17. Meehl, G.A.; Washington, W.M.; Collins, W.D.; Arblaster, J.M.; Hu, A.; Buja, L.E.; Strand, W.G.; Teng, H. How much more global warming and sea level rise? Science 2005, 307, 1769–1772. [Google Scholar] [CrossRef] [Green Version]
  18. Slater, T.; Hogg, A.E.; Mottram, R. Ice-sheet losses track high-end sea-level rise projections. Nat. Clim. Chang. 2020, 10, 879–881. [Google Scholar] [CrossRef]
  19. Van Vuuren, D.P.; Edmonds, J.; Kainuma, M.; Riahi, K.; Thomson, A.; Hibbard, K.; Hurtt, G.C.; Kram, T.; Krey, V.; Lamarque, J.F.; et al. The representative concentration pathways: An overview. Clim. Chang. 2011, 109, 5–31. [Google Scholar] [CrossRef]
  20. Dasgupta, S.; Laplante, B.; Meisner, C.; Wheeler, D.; Yan, J. The impact of sea level rise on developing countries: A comparative analysis. Clim. Chang. 2009, 93, 379–388. [Google Scholar] [CrossRef]
  21. Hauer, M.E.; Fussell, E.; Mueller, V.; Burkett, M.; Call, M.; Abel, K.; McLeman, R.; Wrathall, D. Sea-level rise and human migration. Nat. Rev. Earth Environ. 2020, 1, 28–39. [Google Scholar] [CrossRef]
  22. National Geographic Society. Earth’s Freshwater. Available online: https://www.nationalgeographic.org/media/earths-fresh-water/ (accessed on 4 January 2021).
  23. UN-Water. Scarcity. Available online: https://www.unwater.org/water-facts/scarcity/ (accessed on 4 January 2021).
  24. Anim, D.O.; Ofori-Asenso, R. Water scarcity and COVID-19 in sub-Saharan Africa. J. Infect. 2020, 81, e108–e109. [Google Scholar] [CrossRef]
  25. Drinking-Water. Available online: https://www.who.int/news-room/fact-sheets/detail/drinking-water (accessed on 4 January 2021).
  26. Mekonnen, M.M.; Hoekstra, A.Y. Sustainability: Four billion people facing severe water scarcity. Sci. Adv. 2016, 2, e1500323. [Google Scholar] [CrossRef] [PubMed] [Green Version]
  27. Joffé, G. The impending water crisis in the MENA region. Int. Spect. 2016, 51, 55–66. [Google Scholar] [CrossRef]
  28. Boretti, A.; Rosa, L. Reassessing the projections of the world water development report. NPJ Clean Water 2019, 2, 15. [Google Scholar] [CrossRef]
  29. Hejazi, M.; Edmonds, J.; Clarke, L.; Kyle, P.; Davies, E.; Chaturvedi, V.; Wise, M.; Patel, P.; Eom, J.; Calvin, K.; et al. Long-term global water projections using six socioeconomic scenarios in an integrated assessment modeling framework. Technol. Forecast. Soc. Chang. 2014, 81, 205–226. [Google Scholar] [CrossRef]
  30. OECD. Water and Agriculture. Available online: https://www.oecd.org/agriculture/topics/water-and-agriculture/ (accessed on 12 May 2021).
  31. Economidou, Y.; Doula, M.K.; Zorpas, A.A. Mitigation of the effects of climate change in the agricultural sector of Cyprus, through optimization of benefit. Water Supply 2021. [Google Scholar] [CrossRef]
  32. Roser, M. Future Population Growth. 2013. Available online: https://ourworldindata.org/future-population-growth (accessed on 23 August 2021).
  33. World Economic Forum. 1.1 Billion People Still Lack Electricity. This Could Be the Solution. Available online: https://www.weforum.org/agenda/2018/06/1-billion-people-lack-electricity-solution-mini-grid-iea/ (accessed on 4 January 2021).
  34. Coyle, E.D.; Simmons, R.A. Understanding the Global Energy Crisis; Purdue University Press: West Lafayette, IN, USA, 2014. [Google Scholar]
  35. MAHB. When Fossil Fuels Run Out, What Then? Available online: https://mahb.stanford.edu/library-item/fossil-fuels-run/ (accessed on 4 January 2021).
  36. U.S. Energy Information Administration (EIA). Renewable Energy Explained. Available online: https://www.eia.gov/energyexplained/renewable-sources/ (accessed on 5 January 2021).
  37. EDF. Renewable Energy. Types, Forms & Sources. Available online: https://www.edfenergy.com/for-home/energywise/renewable-energy-sources (accessed on 5 January 2021).
  38. The Guardian. Windfarms in Great Britain Break Record for Clean Power Generation. Wind Power. Available online: https://www.theguardian.com/environment/2020/dec/19/windfarms-in-great-britain-break-record-for-clear-power-generation (accessed on 5 January 2021).
  39. Energy.Gov.Au. Renewables. Available online: https://www.energy.gov.au/data/renewables (accessed on 5 January 2021).
  40. Kåberger, T. Progress of renewable electricity replacing fossil fuels. Glob. Energy Interconnect. 2018, 1, 48–52. [Google Scholar]
  41. Statista. Global Cumulative Installed Solar PV Capacity. 2019. Available online: https://www.statista.com/statistics/280220/global-cumulative-installed-solar-pv-capacity/ (accessed on 19 January 2021).
  42. Masdar, Mohammed bin Rashid Al Maktoum Solar Park Phase 3—Dubai-UAE, Shuaa Energy 2. pp. 1–3. 2019. Available online: https://www.dewa.gov.ae/en/about-us/strategic-initiatives/mbr-solar-park (accessed on 20 February 2021).
  43. Lee, J.; Zhao, F. GWEC Global Wind Report 2019, Wind Energy Technology; 78 p. 2020. Available online: https://gwec.net/wp-content/uploads/2020/08/Annual-Wind-Report_2019_digital_final_2r.pdf (accessed on 20 February 2021).
  44. IEA—International Energy Agency. 2021. Available online: https://www.iea.org/ (accessed on 20 February 2021).
  45. National Hydropower Association. 2021. Available online: https://www.hydro.org/waterpower/why-hydro/available/ (accessed on 20 February 2021).
  46. Prehoda, E.; Pearce, J.M.; Schelly, C. Policies to overcome barriers for renewable energy distributed generation: A Case study of utility structure and regulatory regimes in Michigan. Energies 2019, 12, 674. [Google Scholar] [CrossRef] [Green Version]
  47. IEA—International Energy Agency. Renewables 2020 Analysis and Forecast to 2025. 2020. Available online: https://iea.blob.core.windows.net/assets/1a24f1fe-c971-4c25-964a-57d0f31eb97b/Renewables_2020-PDF.pdf (accessed on 20 February 2021).
  48. Voutchkov, N.; Susnjara, I.; Mbia, B.; Cross, K. Desalination—Past, Present and Future. International Water Association. 2016. Available online: https://iwa-network.org/desalination-past-present-future/ (accessed on 21 February 2021).
  49. UN-Water. Sustainable Development Goal 6 Synthesis Report on Water and Sanitation; United Nations: New York, NY, USA, 2018. [Google Scholar]
  50. Desalination History. Available online: https://www.water.vic.gov.au/water-grid-and-markets/desalination/desalination-background/desalination-history (accessed on 5 January 2021).
  51. Curto, D.; Franzitta, V.; Guercio, A. A review of the water desalination technologies. Appl. Sci. 2021, 11, 670. [Google Scholar] [CrossRef]
  52. Eke, J.; Yusuf, A.; Giwa, A.; Sodiq, A. The global status of desalination: An assessment of current desalination technologies, plants and capacity. Desalination 2020, 495, 114633. [Google Scholar] [CrossRef]
  53. Elsaid, K.; Kamil, M.; Sayed, E.T.; Abdelkareem, M.A.; Wilberforce, T.; Olabi, A. Environmental impact of desalination technologies: A review. Sci. Total Environ. 2020, 748, 141528. [Google Scholar] [CrossRef] [PubMed]
  54. Park, K.; Kim, J.; Yang, D.R.; Hong, S. Towards a low-energy seawater reverse osmosis desalination plant: A review and theoretical analysis for future directions. J. Membr. Sci. 2020, 595, 117607. [Google Scholar] [CrossRef]
  55. Ellabban, O.; Abu-Rub, H.; Blaabjerg, F. Renewable energy resources: Current status, future prospects and their enabling technology. Renew. Sustain. Energy Rev. 2014, 39, 748–764. [Google Scholar] [CrossRef]
  56. Shatat, M.; Worall, M.; Riffat, S. Opportunities for solar water desalination worldwide. Sustain. Cities Soc. 2013, 9, 67–80. [Google Scholar] [CrossRef]
  57. Eltawil, M.A.; Zhengming, Z.; Yuan, L. Renewable energy powered desalination systems: Technologies and economics-state of the art. In Proceedings of the Twelfth International Water Technology Conference (IWTC12), Alexandria, Egypt, 1 January 2008; pp. 1–38. [Google Scholar]
  58. Elsaid, K.; Sayed, E.T.; Yousef, B.A.; Rabaia, M.K.H.; Abdelkareem, M.A.; Olabi, A.G. Recent progress on the utilization of waste heat for desalination: A review. Energy Convers. Manag. 2020, 221, 113105. [Google Scholar] [CrossRef]
  59. Shahzad, M.W.; Burhan, M.; Ang, L.; Ng, K.C. Energy-water-environment nexus underpinning future desalination sustainability. Desalination 2017, 413, 52–64. [Google Scholar] [CrossRef]
  60. El Saliby, I.; Okour, Y.; Shon, H.K.; Kandasamy, J.; Kim, I.S. Desalination plants in Australia, review and facts. Desalination 2009, 247, 1–14. [Google Scholar] [CrossRef]
  61. Bundschuh, J.; Ghaffour, N.; Mahmoudi, H.; Goosen, M.; Mushtaq, S.; Hoinkis, J. Low-cost low-enthalpy geothermal heat for freshwater production: Innovative applications using thermal desalination processes. Renew. Sustain. Energy Rev. 2015, 43, 196–206. [Google Scholar] [CrossRef]
  62. Gude, V.G. Geothermal source for water desalination—Challenges and opportunities. In Renewable Energy Powered Desalination Handbook; Butterworth-Heinemann: Oxford, UK, 2018; pp. 141–176. [Google Scholar]
  63. El-Dessouky, H.T.; Ettouney, H.M. Fundamentals of Salt Water Desalination; Elsevier: Amsterdam, The Netherlands, 2002. [Google Scholar]
  64. Al-Addous, M.; Jaradat, M.; Bdour, M.; Dalala, Z.; Wellmann, J. Combined concentrated solar power plant with low-temperature multi-effect distillation. Energy Explor. Exploit. 2020, 38, 1831–1853. [Google Scholar] [CrossRef]
  65. Ahmadi, E.; McLellan, B.; Mohammadi-Ivatloo, B.; Tezuka, T. The role of renewable energy resources in sustainability of water desalination as a potential fresh-water source: An updated review. Sustainability 2020, 12, 5233. [Google Scholar] [CrossRef]
  66. NOAA. Water Cycle. National Oceanic and Atmospheric Administration. 2021. Available online: https://www.noaa.gov/education/resource-collections/freshwater/water-cycle (accessed on 11 April 2021).
  67. Graham, S.; Parkinson, C.; Chahine, M. The Water Cycle. NASA Earth Observatory. 2010. Available online: https://earthobservatory.nasa.gov/features/Water (accessed on 20 February 2021).
  68. USGS. How Much Water Is There on Earth? Available online: https://www.usgs.gov/special-topic/water-science-school/science/how-much-water-there-earth?qt-science_center_objects=0#qt-science_center_objects (accessed on 25 February 2021).
  69. NOAA. Volumes of the World’s Oceans from ETOPO1. Available online: https://web.archive.org/web/20150311032757/http://ngdc.noaa.gov/mgg/global/etopo1_ocean_volumes.html (accessed on 25 February 2021).
  70. Palenzuela, P.; Alarcón-Padilla, D.C.; Zaragoza, G.; Blanco, J. Comparison between CSP+ MED and CSP+ RO in Mediterranean area and MENA region: Techno-economic analysis. Energy Procedia 2015, 69, 1938–1947. [Google Scholar] [CrossRef] [Green Version]
  71. Kaya, A.; Tok, M.E.; Koc, M. A levelized cost analysis for solar-energy-powered sea water desalination in the Emirate of Abu Dhabi. Sustainability 2019, 11, 1691. [Google Scholar] [CrossRef] [Green Version]
  72. Azinheira, G.; Segurado, R.; Costa, M. Is renewable energy-powered desalination a viable solution for water stressed regions? A case study in Algarve, Portugal. Energies 2019, 12, 4651. [Google Scholar] [CrossRef] [Green Version]
  73. Sullivan, W.G.; Wicks, E.M.; Luxhoj, J.T. Engineering Economy; Prentice Hall: Upper Saddle River, NJ, USA, 2003; Volume 12. [Google Scholar]
  74. Manju, S.; Sagar, N. Renewable energy integrated desalination: A sustainable solution to overcome future fresh-water scarcity in India. Renew. Sustain. Energy Rev. 2017, 73, 594–609. [Google Scholar] [CrossRef]
  75. IGBP—International Geosphere-Biosphere Programme. 2014. Available online: http://www.igbp.net/ (accessed on 12 April 2021).
  76. Youssef, Y.W.; Khodzinskaya, A. A review of evaporation reduction methods from water surfaces. In E3S Web of Conferences, Proceedings of the XXII International Scientific Conference “Construction the Formation of Living Environment” (FORM-2019), Tashkent, Uzbekistan, 18–21 April 2019; EDP Sciences: Les Ulis, France, 2019; Volume 97, p. 05044. [Google Scholar]
  77. Guduru, S.; Bajaj, P.; Gonsalves, O.N. India’s low temperature thermal desalination technology: Water diplomacy with Small Island Developing States in the Indo-Pacific Region. Marit. Aff. J. Natl. Marit. Found. India 2020, 16, 30–45. [Google Scholar] [CrossRef]
  78. Ahmadi, E.; McLellan, B.; Ogata, S.; Mohammadi-Ivatloo, B.; Tezuka, T. An integrated planning framework for sustainable water and energy supply. Sustainability 2020, 12, 4295. [Google Scholar] [CrossRef]
  79. Hinkel, J.; Lincke, D.; Vafeidis, A.T.; Perrette, M.; Nicholls, R.J.; Tol, R.S.; Marzeion, B.; Fettweis, X.; Ionescu, C.; Levermann, A. Coastal flood damage and adaptation costs under 21st century sea-level rise. Proc. Natl. Acad. Sci. USA 2014, 111, 3292–3297. [Google Scholar] [CrossRef] [PubMed] [Green Version]
  80. O’Neill, B.C.; Kriegler, E.; Riahi, K.; Ebi, K.L.; Hallegatte, S.; Carter, T.R.; Mathur, R.; van Vuuren, D.P. A new scenario framework for climate change research: The concept of shared socioeconomic pathways. Clim. Chang. 2014, 122, 387–400. [Google Scholar] [CrossRef] [Green Version]
  81. Dellink, R.; Chateau, J.; Lanzi, E.; Magné, B. Long-term economic growth projections in the Shared Socioeconomic Pathways. Glob. Environ. Chang. 2017, 42, 200–214. [Google Scholar] [CrossRef]
Figure 1. The daily volume of SLR under different scenarios for SLR in the period (2025–2100).
Sustainability 13 09552 g001
Figure 2. The global annual water demand in the period (1901–2100).
Sustainability 13 09552 g002
Figure 3. The global daily desalinated water in the period (2025–2100).
Sustainability 13 09552 g003
Figure 4. The total number of required projects.
Sustainability 13 09552 g004
Figure 5. The capital investment for each technology (MED-CSP, RO-PV and RO-Wind) and the total capital investment for all projects to prevent SLR under different scenarios in the period (2025–2100).
Sustainability 13 09552 g005
Figure 6. (OAU) The annual production cost for each technology (MED-CSP, RO-PV and RO-Wind) at annual cost reduction rates of 3.9% and 5.8% to prevent SLR of 1 m in the period (2025–2100).
Sustainability 13 09552 g006
Figure 7. (LTU) The annual production cost for each technology (MED-CSP, RO-PV and RO-Wind) at annual cost reduction rates of 2% and 3% to prevent SLR of 1 m in the period (2025–2100).
Sustainability 13 09552 g007
Figure 8. (HTU) The annual production cost for each technology (MED-CSP, RO-PV and RO-Wind) at annual cost reduction rates of 8% and 10% to prevent SLR of 1 m in the period (2025–2100).
Sustainability 13 09552 g008
Figure 9. (OAU) The annual production cost for all technologies added to the annual payments to prevent SLR between 1 m and 1.3 m in the period (2025–2100).
Sustainability 13 09552 g009
Figure 10. (LTU) The annual production cost for all technologies added to the annual payments to prevent SLR between 1 m and 1.3 m in the period (2025–2100).
Sustainability 13 09552 g010
Figure 11. (HTU) The annual production cost for all technologies added to the annual payments to prevent SLR between 1 m and 1.3 m in the period (2025–2100).
Sustainability 13 09552 g011
Figure 12. GDP predictions for the year 2100 under different scenarios of SSPs and the losses due to SLR.
Sustainability 13 09552 g012
Table 1. The annual production cost for all technologies over 75 years in the period (2025–2100).
Trillions USD/Annum
SLROAULTUHTU
1.0 m14.6322.979.59
1.1 m15.2823.9810.01
1.2 m15.932510.43
1.3 m16.5826.0210.86
Publisher’s Note: MDPI stays neutral with regard to jurisdictional claims in published maps and institutional affiliations.

