Article

Experimental and Informational Modeling Study on Flexural Strength of Eco-Friendly Concrete Incorporating Coal Waste

1
Faculty of Civil Engineering, Babol Noshirvani University of Technology, Babol 47148-71167, Iran
2
Centre for Infrastructure Engineering, Western Sydney University, Penrith, NSW 2751, Australia
3
Department of Civil and Environmental Engineering, Western University, London, ON N6G 5L1, Canada
4
Faculty of Civil Engineering, Amirkabir University of Technology, Tehran 47148-71167, Iran
5
School of Civil and Environmental Engineering, University of Technology Sydney, Sydney, NSW 2007, Australia
*
Author to whom correspondence should be addressed.
Sustainability 2021, 13(13), 7506; https://doi.org/10.3390/su13137506
Submission received: 4 June 2021 / Revised: 1 July 2021 / Accepted: 2 July 2021 / Published: 5 July 2021
(This article belongs to the Section Sustainable Materials)

Abstract

:
Construction activities have been a primary cause for depleting natural resources and are associated with stern environmental impact. Developing concrete mixture designs that meet project specifications is time-consuming, costly, and requires many trial batches and destructive tests that lead to material wastage. Computational intelligence can offer an eco-friendly alternative with superior accuracy and performance. In this study, coal waste was used as a recycled additive in concrete. The flexural strength of a large number of mixture designs was evaluated to create an experimental database. A hybrid artificial neural network (ANN) coupled with response surface methodology (RSM) was trained and employed to predict the flexural strength of coal waste-treated concrete. In this process, four influential parameters including the cement content, water-to-cement ratio, volume of gravel, and coal waste replacement level were specified as independent input variables. The results show that concrete incorporating 3% recycled coal waste could be a competitive and eco-efficient alternative in construction activities while attaining a superior flexural strength of 6.7 MPa. The RSM-modified ANN achieved superior predictive accuracy with an RMSE of 0.875. Based on the experimental results and model predictions, estimating the flexural strength of concrete incorporating waste coal using the RSM-modified ANN model yielded superior accuracy and can be used in engineering practice to save the effort, cost, and material wastage associated with trial batches and destructive laboratory testing while producing mixtures with enhanced flexural strength.

1. Introduction

Coal is considered one of the prevalent sources of energy production worldwide. However, its exploitation and extraction have caused massive waste materials [1]. Such irresolvable and non-biodegradable waste materials have been used in many different ways yet have never reached an executive phase for diverse reasons [2]. With continuing improvements of the industry practice, coal extraction from mines has experienced substantial growth in several locations, resulting in the production of colossal amounts of coal waste. To date, more than two million tons of coal waste material are vacated around factories, and this amount is rising rapidly due to the ascending trend of exploitation and exploration. Coal waste materials are often piled in mountainous and sylvan areas, exposed to snow and rainfall, and endangering the surrounding environment and ecosystems. Accordingly, many researchers and engineers have been exploring effective and cost-competitive solutions to this ongoing issue [3]. Recent investigations suggest that industrial byproducts can improve the durability of concrete and have a low influence on the material properties up to a certain percentage [4,5].
The effects of using recycled tires on the properties of concrete and asphalt have been explored in previous studies [6,7]. For instance, Aiello and Leuzzi [8] investigated the effects of using recycled tires in fresh and hardened concrete and showed that using tire rubber partial replacement for natural fine aggregates in concrete at volume percentages of 25, 50, and 75%, the flexural strength degraded by 4.49, 5.81, and 7.3%. They also found that adding 75% by volume of crumb rubber—replacing natural fines in concrete—increased energy absorption. Abousnina et al. [5] investigated the application of oil-contaminated sand (OCS) in concrete. The mechanical characteristics, strength development, hydration, and microstructure of cement mortar containing oil-contaminated sand were evaluated. Ferdous et al. [9] proposed three new railway sleeper concepts for a mainline track and investigated their behaviors experimentally and numerically. The structural behavior of the railway sleepers was evaluated experimentally under five-point static bending and was verified via beams on elastic foundation analysis. Moreover, an in-depth investigation of the in-track behavior of sleepers was conducted using finite element simulation. Rahmani et al. [10] evaluated the behavior of concrete containing Polyethylene Therephthalate (PET) 5, 10, and 15% by volume of sand replacement at a water-to-cement (w/c) ratio of 0.42 and 0.54. Their results indicated that adding 5% PET at a w/c ratio of 0.42 and 0.54 increased the concrete flexural strength by 6.71 and 8.02%, respectively. However, the flexural strength of concrete specimens decreased with increasing PET content, marking 14.7 and 6.25% of flexural strength reduction for concrete containing 15% PET at the examined w/c ratios, respectively. Several other byproducts have been beneficiated in concrete, including mine tailings [11], glass sludge [12,13] coal bottom ash, [14] waste latex paint, [15] waste marble, [16] sugarcane bagasse ash, etc.
Concrete is the most widely used construction material on earth. If considered by country, the cement industry will rank as the third-largest global emitter of carbon dioxide [17,18,19]. Considering the sheer volume of concrete production, it offers a conducive medium for the beneficiation of large amounts of industrial and mining byproducts. Hence, there need for research to explore the effects of recycling industrial and minim byproducts on concrete performance. A key mechanical characteristic of concrete is its flexural strength. While its magnitude depends on the concrete mixture design, its accurate prediction is hampered with several challenges. Thus, determining the flexural strength of concrete has generally been carried out through time-consuming and costly destructive testing. Predictive models for estimating flexural strength have long been of interest to researchers owing to potential time, labor, and cost savings. Accordingly, several researchers have proposed various models for predicting concrete behavior using different mathematical techniques, such as linear and non-linear regression methods [20,21,22].
More recently, data-driven computational intelligence methods, such as machine learning and deep learning have attracted great interest in predicting the engineering properties of cement-based materials. For instance, such techniques have recently been used for mixture optimization [23] and predicting the carbonation depth in recycled concrete aggregate [24], shear strength of reinforced concrete shear walls [25], compressive strength of phase change materials integrated cementitious composites [26], shear strength and failure mode of SFRC beams [27], ultra-high-performance concrete compressive [28], and structural response of RC slabs exposed to blast loading [29]. Dedicated literature reviews on the use of machine learning in predicting the properties of concrete are readily accessible in the open literature [30,31].
The goal of the present study is to develop a suitable and economical solution for beneficiating coal waste in the concrete manufacturing process. Thus, the feasibility of developing a type of concrete incorporating coal waste and having suitable flexural strength was explored. If using coal waste as an additive material in concrete is successful, not only would it mitigate the disposal problem of this waste, but it would also reduce the need for virgin concrete raw materials, thus saving natural resources. Furthermore, to alleviate the need for laborious, costly, and time-consuming trial batches to develop concrete with adequate flexural strength, a hybrid artificial neural network (ANN) coupled with response surface methodology (RSM) was trained and employed to accurately predict the flexural strength of coal waste treated concrete. In addition, the use of coal waste in concrete yields environmental benefits so that the stockpiling of this harmful by-product can be mitigated. Moreover, partial substitution of cement with coal waste can reduce carbon dioxide emissions from cement production and yield economic advantage through reducing the cost of concrete production.
Given that the influential input parameters on flexural strength of such concrete are not available in the existing literature, this study carried out an extensive experimental study and deployed the response surface methodology and variance analysis, for the first time, to extract the important parameters affecting the flexural strength in order to enhance the modeling accuracy. Such a sustainable alternative to conventional destructive testing is presented to predict the flexural strength of concrete. Determining the most suitable model by comparing the traditional neural network and the response surface methodology (RSM)-modified artificial neural network is another novel aspect of this paper. Finally, a model for predicting the flexural strength is proposed using non-linear regression analysis.
Wastes from coal mine extraction have become a paramount challenge in recent years. For each ton of hard coal produced by mining extraction, 400 kg of waste material is generated. The resulting piles of coal refuse typically have momentous negative environmental implications, including the leaching of iron, manganese, and aluminum residues into waterways, along with the possible generation of acid mine drainage. With the ongoing greater international efforts to achieve the United Nations sustainability goals, novel solutions are needed for the management of such colossal volumes of coal waste. The existing practice to manage coal waste includes complex reprocessing for instance using fluidized beds. The present study pioneers a sustainable and simple solution consisting of using coal waste in the form of a powder in concrete mixtures. Considering the sheer volume of concrete produced worldwide, this practice could alleviate the problems of coal waste disposal. It is noteworthy that there is a dearth of research in this area in the open literature. In particular, informational modeling has not been applied to this topic previously.

2. Materials and Methods

2.1. Materials

In the present study, gravel having a maximum particle size of 12.5 mm was used. Its specific gravity (g/cm3), unit weight (g/cm3), moisture content (%), and saturated surface dry moisture content (%) are 2.52, 1.59, 0.14, and 0.4, respectively. The corresponding characteristics for the used fine aggregate are 2.76, 1.73, 0.3, and 0.3, respectively. The fineness modulus (FM) of the sand is 2.89 and its sand equivalent (SE) value is 84%. The dry specific weight of sand was 1.59 g/cm3. The particle size gradation of the aggregates is depicted in Figure 1 and meets the ASTM C33 [32] standard requirements. Type II Portland cement obtained from the Golestan Peyvand Cement Company based in north Iran was used in this study. Table 1 provides the chemical, physical, and mechanical characteristics of this cement. Coal waste materials were collected from a coal preparation company located in the Anjir Tangeh area in the north of Iran. The used coal waste was produced during the coal washing process at a local company producing coal concentrate as a fuel for different industries. A sieve mesh size of 0.075 mm (sieve 200) was used to sift materials, and then the resulting material was used as a concrete additive. The chemical composition of this coal waste is given in Table 2.

2.2. Concrete Mixtures and Experimental Procedures

To develop effective mixture designs for concrete incorporating untreated coal waste, response surface methodology was adopted in this study, and four variables including the w/c ratio (0.40, 0.45, 0.49, 0.55, and 0.60), cement content, gravel volume, and coal waste percentage (3.00, 5.25, 7.50, and 9.75%) were considered as independent input variables. The variation ranges of these variables were determined according to the previous studies, and thus, 30 mixture designs of concrete were prepared as shown in Table 3 yielding a total of 90 tests conducted to evaluate the flexural strength of specimens. To prepare the concrete specimens, the gravel and sand were first mixed in the mixer for one minute. The cement and coal waste were then added and mixed for another one minute. Afterward, water was gradually added to the mixture over 30 s, and the mixture was stirred for an additional two minutes. Then, the fresh concrete was poured into prismatic molds. A vibrating table was used for the consolidation and removal of any entrapped air bubbles. The prismatic specimens were demolded after 24 h and placed inside a water tank for curing over a period of 28 days based on the ASTM C192 [33] standard procedure. To determine the flexural strength of specimens cured for 28 days according to the ASTM C293 [34], three prismatic beams with a dimension of 500 × 100 × 100 mm were tested for each mixture design using a universal testing machine. In this experiment, the loading was applied to the beams at midspan with a rate of 0.5 mm/min. Three experiments were conducted for each mixture design and the average value was reported in Table 3 to ensure the reproducibility and accuracy of test results.

3. Modeling Approach

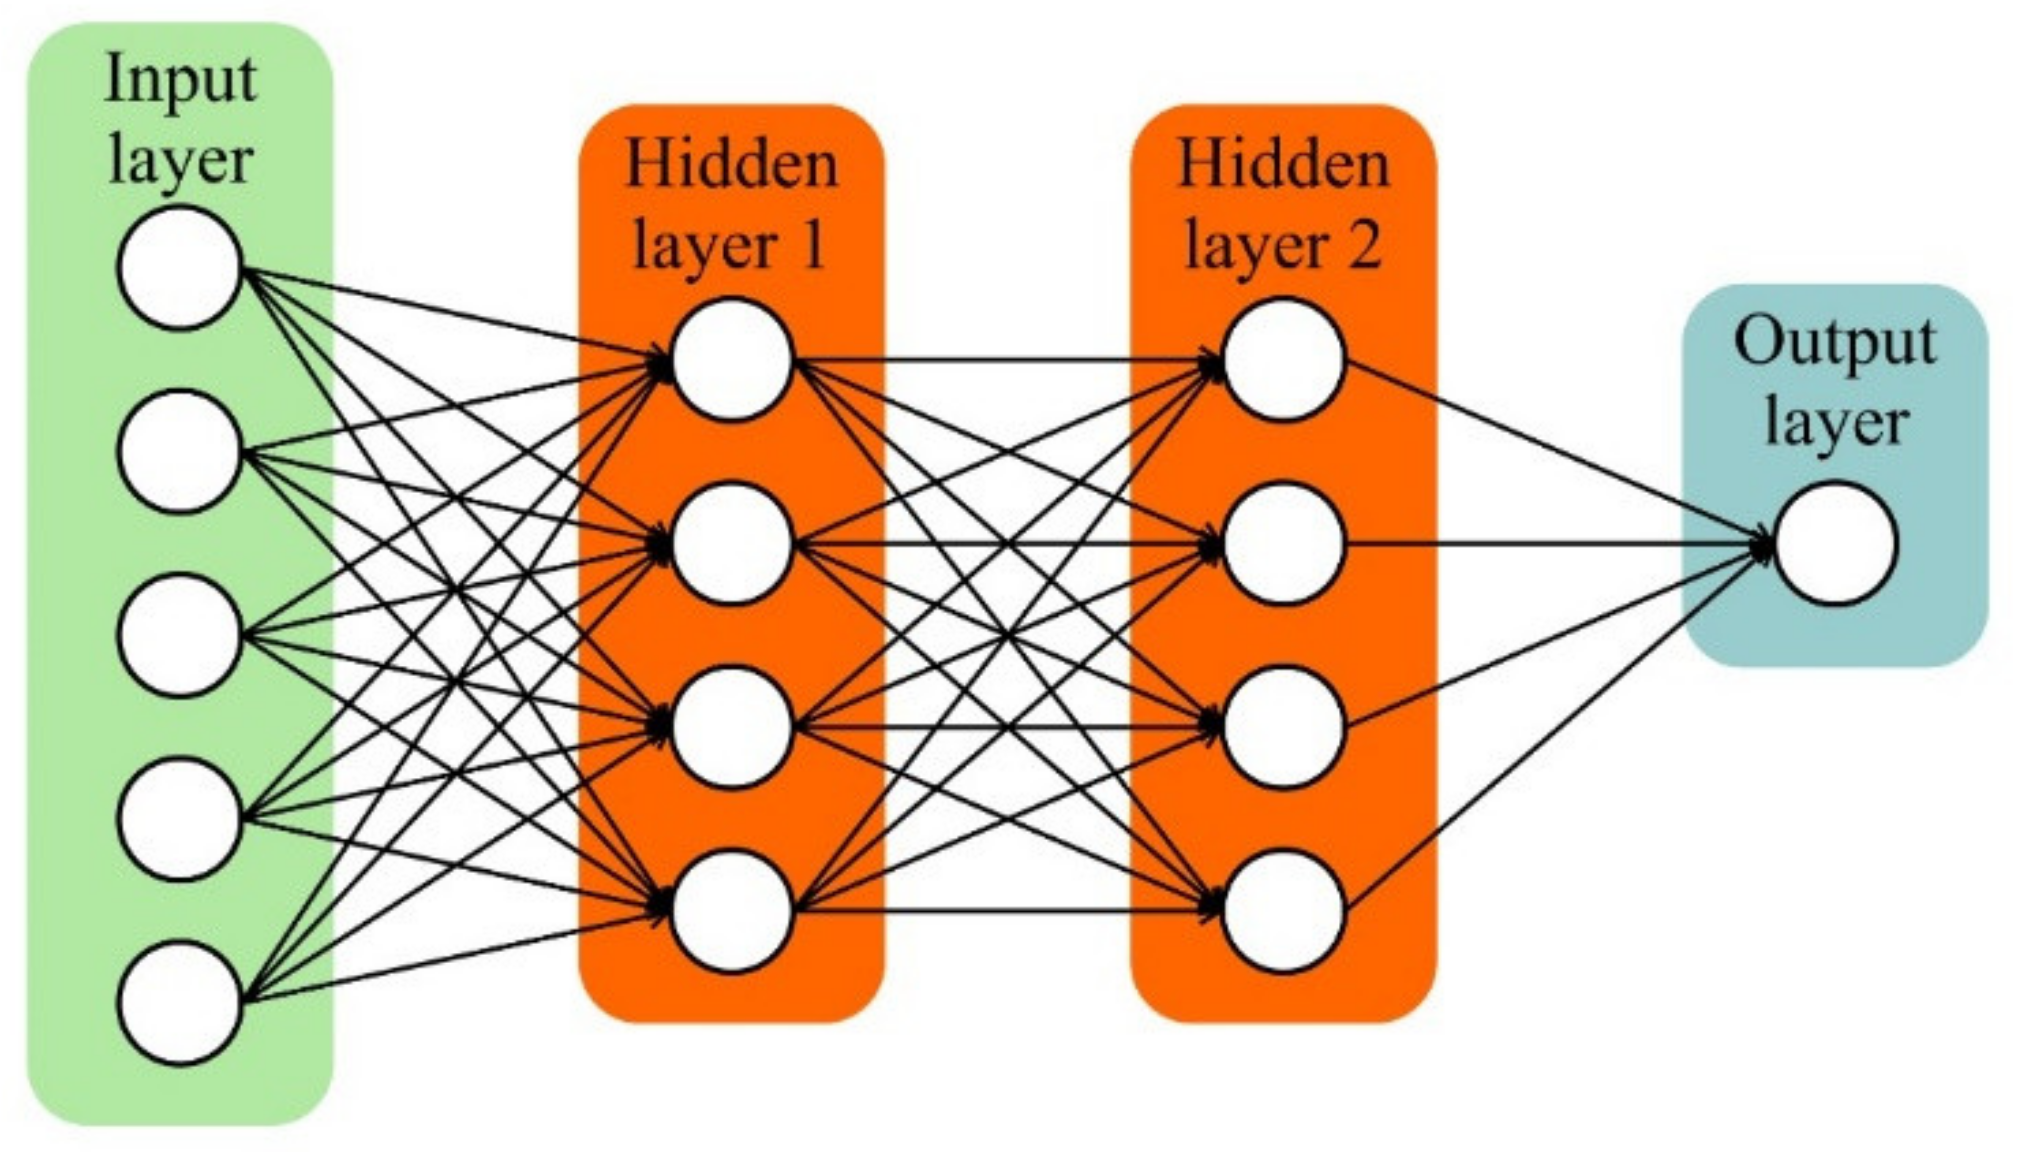
Inspired by the process of the biological brain, artificial neural networks (ANN) offer a powerful strategy to process information. The inputs in ANN are past observations that affect the goal function, while the output results in the prediction of the future outcome by considering the weight of each variable and a certain amount accumulated in each neuron. One of the most critical performance functions is the “tangent hyperbolic”. Neurons are the main constituent of the ANN. Generally, ANN models consist of three parts: inner (input) layer, hidden layer(s), and outer layer, as depicted in Figure 2. Each layer is responsible for receiving data, processing it, and producing an output unit. Each neuron in the inner layer is connected to the neurons in the hidden layer(s). It is noted that there are no connections between the neurons inside each layer. The number of neurons in each layer depends on several factors. For instance, the number of neurons in the inner and outer layers depends on the input and output parameters considered in the modeling process. Conversely, the number of neurons in the hidden layer(s) is determined using different methods based on the problem complexity, and this often consists of a trial and error process [35]. Using real data, the output of the ANN primarily tends to be the same as the laid goal output, and thus, the ANN learns [36]. The network is moderated by comparing its output with the goal output until the difference is minimum. Since there is no proven method to determine the number of layers and neurons, choosing the number of layers and neurons in a way that makes the network output meaningful and makes its difference with the output goal is minimum is the most challenging step in predicting a model by ANN method [35]. In this paper, more than 300 networks were assessed by changing the neurons of each layer to achieve the most suitable network. Given that each assessment was performed four times, a total of 1200 different experiments were conducted to attain the optimum network.
The Feed Forward network used in this research consists of an input layer, one or several hidden layers, and an output layer. Weight is also considered relative to each connection. This algorithm is one of the most widely used for training ANNs, where the gradient descent slope decrease method is used so that errors are directed from the output layer to the input layer, and the weights are distributed in an order that the errors become minimum. Consequently, the training process consists of gradual weight correction to minimize the error functions. This action continues until one of the stopping criteria is not satisfied [35,
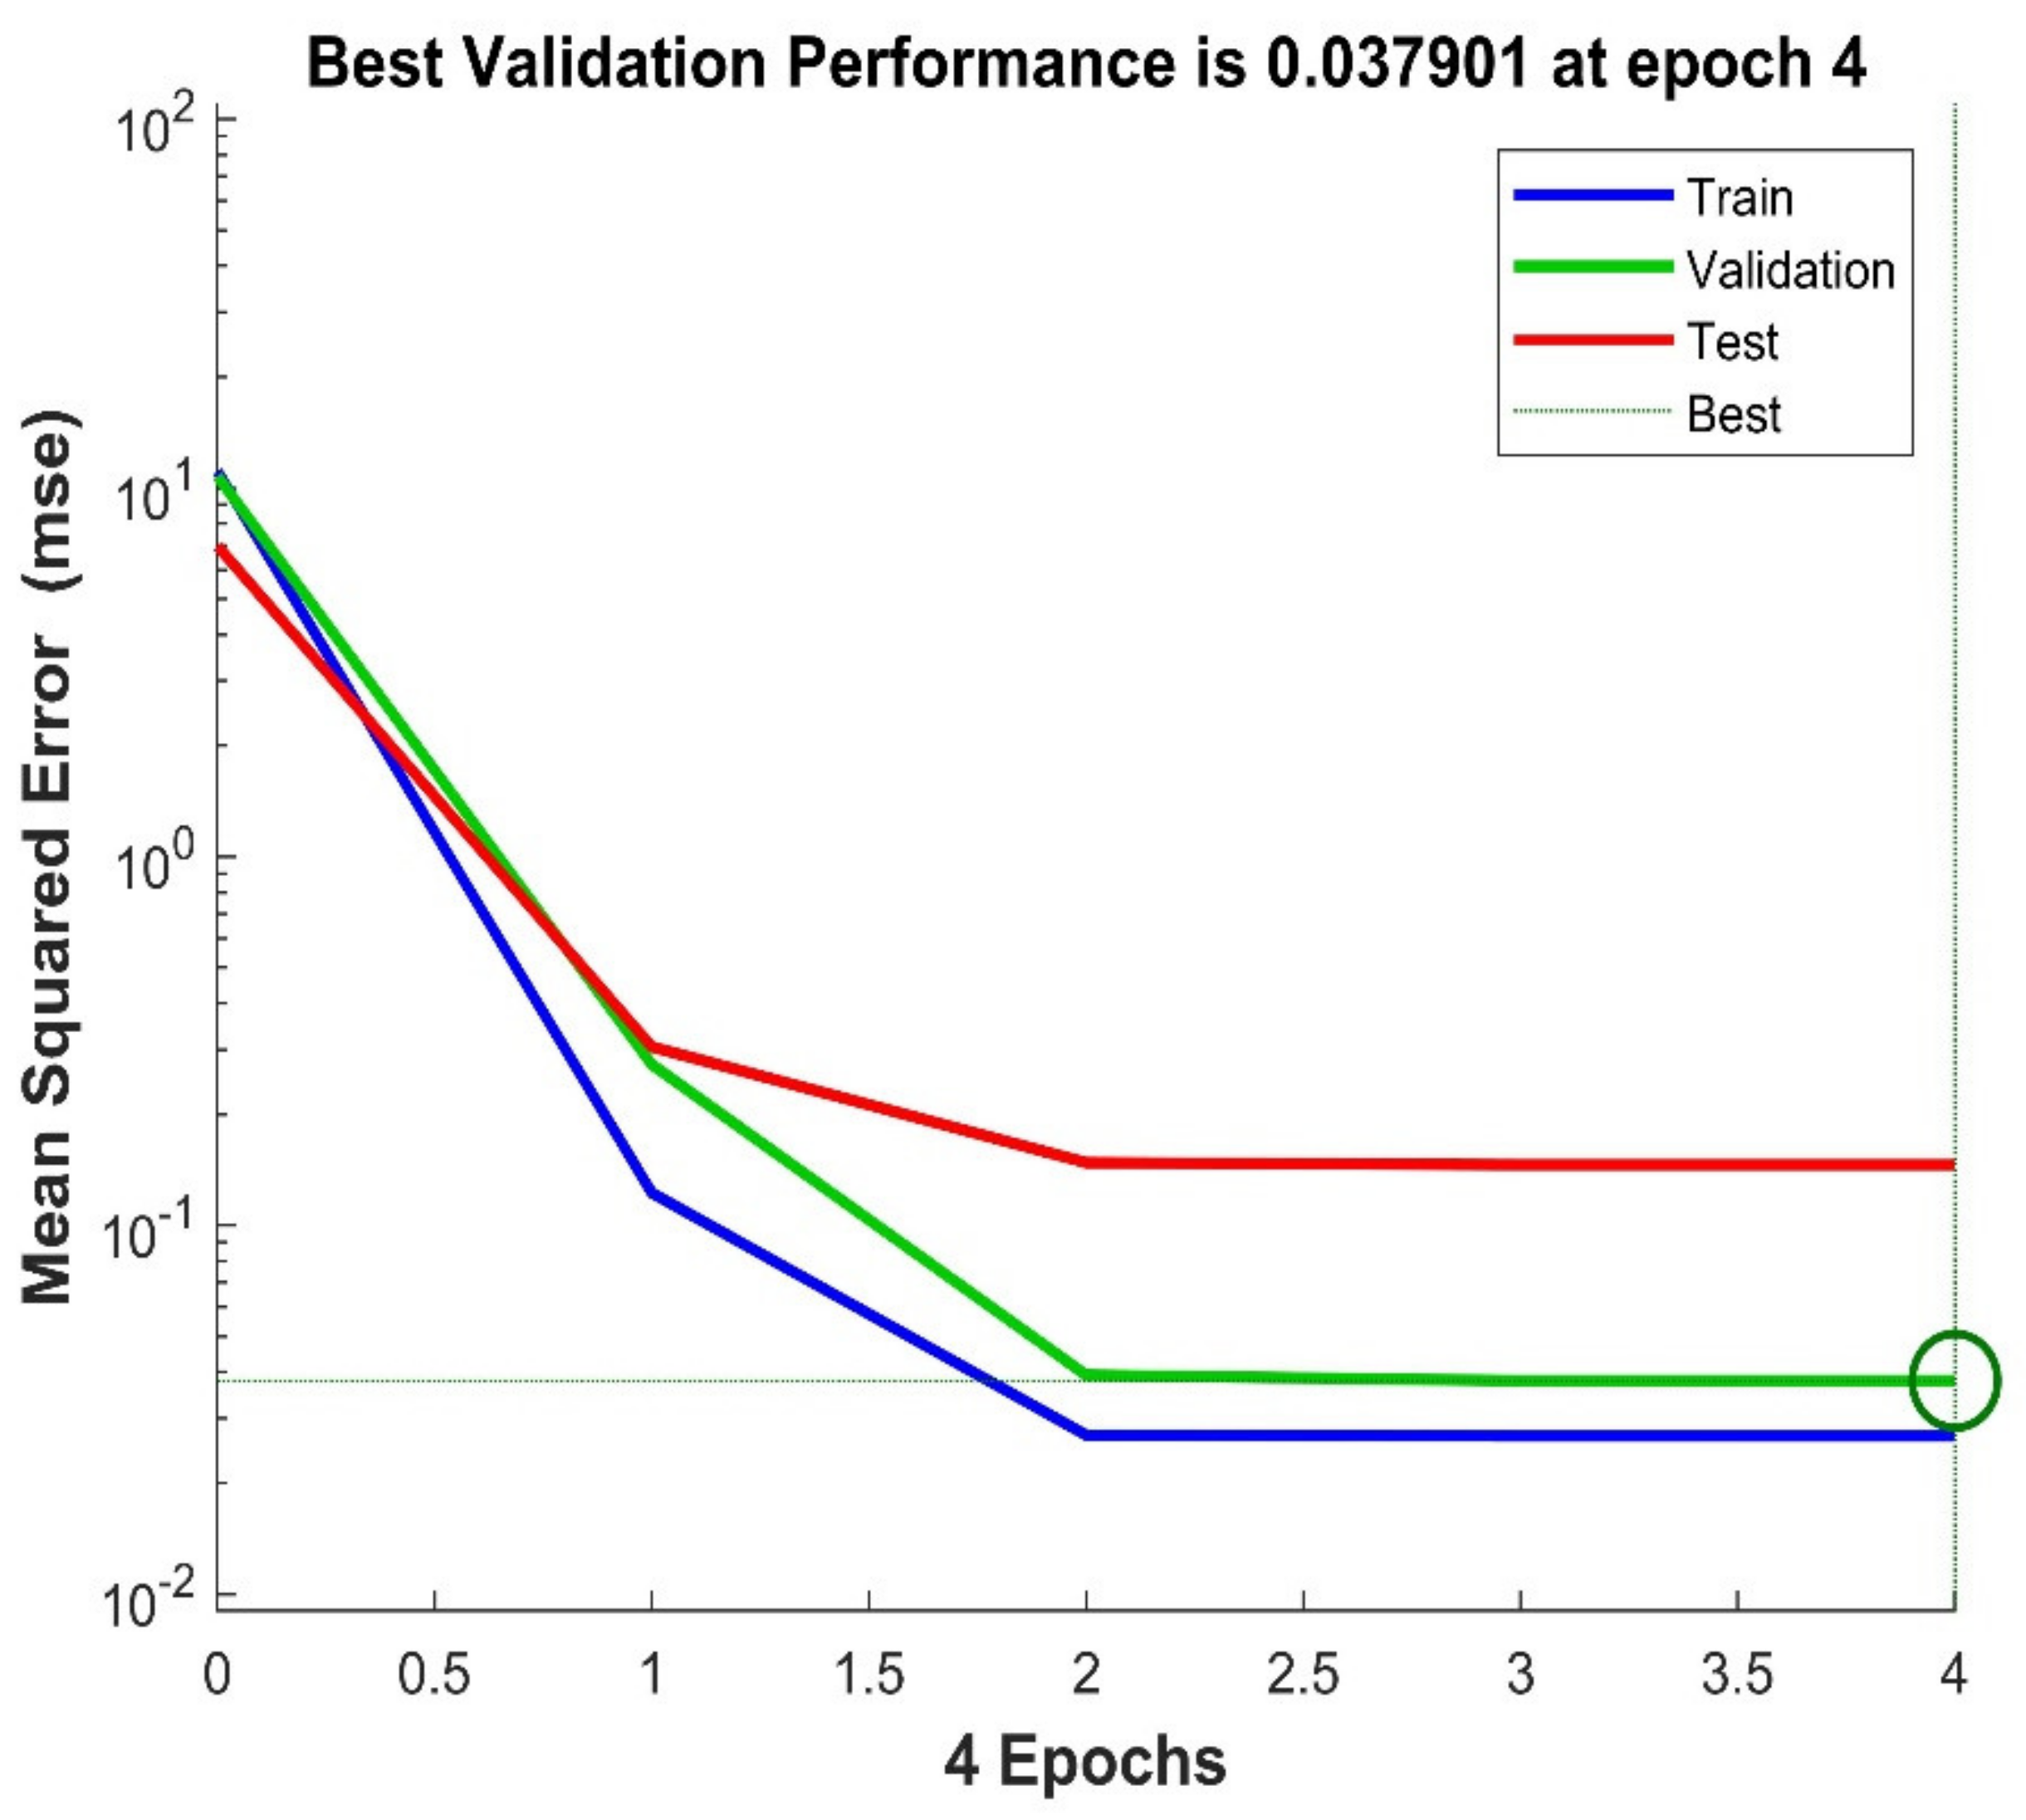
36]. Modeling errors can be calculated by considering the differences between the network output and the actual data through different criteria in the performance evaluation. The criteria used in this research include the Root Mean Square, Random Error (R2), Mean Squared Error (MSE), Mean Absolute Error (MAE), and Root Mean Square Error (RMSE), as presented in Table 4. In this Table, yt signifies the experimental data, y0 is the value estimated by the ANN after learning, and n is the entire count of data at each step. MAE, RMSE, and MSE are in the range of [0,+ ] , with values closer to zero (R2 closer to 1) imply better model fitness and closer output data to the goal output.
To attain optimal use of coal waste and mixture design, the RSM method was used in this study. In this method, the Central Composite Design (CCD) solution was deployed, in which the number of experiments is decreased dramatically, leading to saving time, material, and cost. It is noted that this method can not only assess the effects of independent parameters, but also their interactions, predict the outcome using variable inputs, determine the optimum values and their location of occurrence, and present multi-replied optimization for the experimental outputs [37,38]. In the RSM model, variables and their changing ranges should be first determined. Subsequently, they are categorized, and their front and end are introduced as two levels coded with +1 and −1. The third level that stands between these two levels is called the zero level or the central level. Two other levels with the ranges of (−∞) and (+∞) are added and placed before the −1 and after +1 levels [39,40].
In this study, the dependent variables in the normal ANN modeling included the w/c ratio, cement content, volume of gravel, and coal waste percentage. In contrast, the number of dependent variables was increased to 19 in the RSM-modified ANN modeling to increase model accuracy. The additional independent variables comprised the second-grade effects and mutual effects. As mentioned earlier, the most challenging part of teaching the ANN is to determine the number of layers and neurons in each layer. In this study, 70% of the data were randomly provided to the neural network as input data for training purposes, 15% of the data were used for model validation, and 15% were used for model testing. This ratio was determined by trial and error to achieve accuracy and avoid network overfitting.
The number of hidden layers must be set such that (i) the amount of discrepancy between the network output and the actual data is minimized, and (ii) an excessive increase in the number of layers does not cause over-fitting. Since there is no limitation in determining layers and neurons, more than 200 networks were assessed in this paper to look for the optimal maximum number of layers and neurons using different repetitions by changing the numbers of layers and neurons. Thereby, a total of 1000 different networks were evaluated by considering a five times repetition for each network. As a result, the optimum network for the normal neural network was chosen to have two hidden layers, in which ten and eight neurons were presented in the first and second layers, respectively. Likewise, the optimum network for the RSM-modified ANN was selected to have three hidden layers with eight neurons in the first layer, eight neurons in the second layer, and six neurons in the third layer.

4. Results and Discussion

4.1. Effect of Independent Parameters

After conducting flexural tests, as shown in Figure 3, the obtained flexural strength results were submitted to the Design Expert software [41]. Using the response surface method, the variation trend of the flexural strength was determined based on the assumed independent variables presented below. As per the results presented in Table 3, the least flexural strength (4.08 MPa) corresponds to mixture R12, in which the highest replacement level of coal waste (36.56 kg/m3) was used. The maximum flexural strength (6.675 MPa) was attained by mixture R7 made with 3% (10.20 kg/m3) of coal waste. The result of a previous study by Karimaei et al. [3] also showed that by increasing the percentage of replacing natural aggregates with coal waste, the flexural strength of concrete decreased. Using 5% and 25% of untreated coal waste, the flexural strength decreased by 1% and 10%, respectively. On the other hand, when 10% and 25% of sand were replaced with untreated coal waste, the flexural strength increased by 6% and decreased by 7%, respectively. Therefore, a lower dosage of coal waste can both serve sustainability and improve the flexural strength of concrete. The deduction in flexural strength of concrete incorporating a higher dosage of coal waste can be ascribed to the poor bond between coal waste and cement paste resulting in a weaker interfacial transition zone. Consequently, the flexural tensile stress induces cracks in concrete specimens and causes flexural failure. The observed failure mode was typical of plain concrete beams, displaying a brittle, sudden failure right after the appearance of the first flexural crack. No significant difference in fracture surfaces was observed between specimens made with or without waste coal.
According to Table 3, by increasing the w/c ratio, the flexural strength of concrete specimens decreased as expected. Additionally, increasing the gravel and sand content at constant w/c ratio, coal waste percentage, and cement content, decreased the flexural strength, such as for mixtures R6 and R7. The reason for this reduction in flexural strength is related to the lower amount of cement per unit volume, which decreases the bond between different particles. It should be noted that at a low w/c ratio, increasing the coal waste dosage caused an increase in the flexural strength.
Figure 4 shows variations of flexural strength versus the coal waste percentage. The flexural strength of specimens first slightly increased with an increasing percentage of coal waste, and then decreased. This is likely because at low dosage the coal waste played a microfiller effect, reducing porosity. However, beyond 6%, cement dilution prevailed, and the flexural strength decreased as a consequence. It is also noted that the maximum rate of flexural strength was about 10% of the initial strength. For a w/c ratio of 0.5, gravel volume of 784 kg/m3, and cement content of 375 kg/m3, the flexural strength of specimens ranged between 5.7 and 6.2 MPa by increasing the coal waste content from 3 to 7.5%. Using non-linear regression analysis, the relationship for flexural strength versus coal waste (CW) percentage is expressed for all concrete samples via Equation (1) with a high coefficient of determination (R2 = 0.93).
f c t = ( 4.15 × e ( 0.025 C W ) ) + 0.65
Figure 5a depicts the simultaneous effects of the w/c ratio and coal waste content on the flexural strength of concrete specimens. It is implied that when the w/c ratio was lower, the increasing rate of flexural strength was intensified by increasing the coal waste percentage. Comparatively, when the cement content and coal waste percentage were at the maximum level, the flexural strength reached its minimum value.
Using non-linear regression analysis, the relationship between flexural strength and coal waste dosage for different groups of concrete specimens was expressed as per Equation (2) with a high coefficient of determination (R2 = 0.94).
f c t = ( 3 + 50 ( w c ) 9.7 + 5.2 C W 0.21 ) 0.71
Figure 5b shows the concurrent effect of cement content and the percentage of coal waste on flexural strength. It is noted that the flexural strength in concrete with maximum cement content is decreased by increasing coal waste content. However, when cement content is minimum, the flexural strength increases at first and then declines as the coal waste percentage increased. Based on the results, in w/c ratio of 0.5 and gravel volume of 784 kg/m3, the flexural strength ranges from 5.7 to 6.25 MPa when concrete mix design with a 3% coal waste percent and 340 kg/m3 cement content changes to mix with a coal waste amount of 7.5% and cement content of 412 kg/m3.
Using non-linear regression analysis, the relationship between flexural strength, coal waste percentage (CW), and the amount of cement (C) are expressed for all concrete samples as Equation (3) with a high coefficient of determination (R2 = 0.94).
f c t = 18.4 + 0.72 C W 0.079 C 0.079 C W 2 + 0.00011 C 2
The effect of the coal waste dosage and gravel ratio on the flexural strength of concrete specimens is illustrated in Figure 6. By increasing the coal waste dosage, the variation of flexural strength for the minimum gravel volume was higher relative to the maximum gravel volume. It can also be insinuated that concrete specimens with maximum gravel volume at higher coal waste dosage had significantly lower flexural strength than specimens with minimum gravel volume. The reason for this can be attributed to the lack of cement paste as a controlling factor in the concrete flexural strength. For w/c ratio of 0.5 and gravel volume of 375 kg/m3, the flexural strength ranged between 5.5 and 6.2 MPa for the concrete mixture design with a coal waste percent of 3% and gravel volume of 640 kg/m3 and the mixture with coal waste amount of 7.5% and gravel volume of 960 kg/m3, respectively.
Using non-linear regression analysis of experimental results, the relationship for the flexural strength in terms of coal waste dosage (CW) and gravel volume (GV) for all concrete specimens is expressed as per Equation (4) with an appropriate coefficient of determination (R2 = 0.93).
f c t = ( 2.3 + 50 ( G V ) 9.7 + 5.1 C W 0.22 ) 0.73
In addition, an inclusive and accurate relationship is proposed, using non-linear regression analysis, for the flexural strength based on the parameters required in this study for different groups of concrete specimens in the form of Equation (5) with a coefficient of determination (R2 = 0.93).
f c t = ( 0.5 + C × ( w c ) 14.1 + C × G V 14.7 + 3.5 × e ( C W 0.045 ) ) 0.73
The number of existing studies on concrete mixtures incorporating coal waste is very limited. However, some studies have been conducted to investigate the effects of various other waste materials on concrete properties. For instance, Ergun [42] described the procedures and results of a laboratory investigation on the mechanical properties of concrete specimens containing diatomite and waste marble powder (WMP) as a partial replacement for cement. Ganjian et al. [43] investigated the performance of concrete mixtures incorporating 5%, 7.5%, and 10% of discarded tire rubber as aggregate and cement replacement. Figure 7 portrays the results obtained from Equation (5) when compared with the experimental results of this study and those of other studies in the literature [43]. It can be observed that the proposed equation was relatively consistent with both the results of other studies and the present study. The black line in Figure 7 presents the condition when the flexural strength from the experimental and theoretical studies perfectly match each other with no error. The errors from Equation (5) are mostly in the boundary of ±20%, which proves the accuracy of the proposed model.

4.2. Predicting Flexural Strength Using ANN

To mitigate the limitations of destructive tests deployed in the previous sections, an ANN model is deployed to predict the flexural strength of the eco-efficient concrete made with coal waste. Four parameters were adopted in the normal ANN model as independent variables. A noticeable point is that data were chosen randomly in the modeling process, and the rising or falling rate of variables was not considered. The mean squared error is a criterion that determines the optimization of a network. In this study, the optimum normal ANN model attained MSE equal to 1.029, and the calculated RMSE for this model was 1.014. Due to the low value of this criterion in this model, it can be implied that the modeling was adequate. According to attributes such as low error and minor expenses associated with non-destructive methods such as neural networks for predicting the flexural strength, the need for an analytical comprehension of this modeling is essential. The first step of the analysis is the learning and evaluation procedure of the model. In Figure 8, the learning procedure of the normal ANN is presented in the three steps of training, validation, and testing. The neural network process stops when the number of validation errors exceeds the allowed number, which was six continuous errors. The training error in the normal neural network first decreased as the validation error decreased, before the optimum point, then increased and finally decreased with a very slight slope. Generally, such a point, shown in Figure 8 by a green circle, is known as the best validation performance where the MSE amount for this model was 0.0087.
Data regression diagrams for the normal neural network are depicted in Figure 9. In these diagrams, the function in the dotted line is the target function, which is the best method of locating the determined function by the neural network. If it occurs, R will be equal to one, and if not, it will be less than one. The function sketched beside the vertical diagram is the fitted function by the neural network on the available data points. This diagram is plotted for all the three divided groups that contain training, validation, and test data, and the regression of each is determined individually. According to the results, all diagrams had regressions of more than 0.96.
An optimum model is achieved when the associated error reaches its minimum compared to the actual amount. To compare and evaluate the validity of a network, errors between the actual and neural network-predicted amounts must be compared. The comparison between the normal neural network’s output and the actual values is illustrated in Figure 10.
Furthermore, all the dependent variables in this study should be multiplied by an optimized coefficient based on the trained model. The contribution of each neuron through a specific constant value known as “bias” is listed in Table 5 along with all the other coefficients. The final neural network model of this study was obtained by substituting the coefficients in Table 5 with the proposed function of the model Equation (6) in which k is the input variable, Z is the number of neurons in the hidden layer, and Wj,i(n) is the weight value.

4.3. Predicting Flexural Strength Using RSM-Modified Neural Network

To enhance the model accuracy using RSM in this paper, the influential parameters on the flexural strength of concrete and their effects on the normal neural network were considered as independent variables of the neural network. Hence, fifteen effective variables were extracted via RSM, and four normal independent variables, as the RSM-modified neural network variables, and submitted to the network. Similar to the normal neural network modeling, data selection was made randomly to have an exogenous effect on the results of the network modeling.
Table 6 portrays the distribution of data based on their variance analysis. The model used for concrete flexural strength is of the cubic type, in which the non-effective terms were omitted to make the effects visible and tangible. The flexural strength model had 18 degrees of freedom, and the p-value was less than 5%, indicating that the model was meaningful. The p-value shows the amount of lack differences emanating from the initial hypothesis. All factors in the RSM-recommended cubic model were considered as input variables for the neural network, in addition to the four main parameters in the RSM-modified neural network.
y ^ = J = 1 Z W j , i n + 1 1 e 2 J = 1 k W j , i n X j + b i n 1 +   e 2 J = 1 k W j , i n X j +   b i n   +   b i n + 1  
As explained previously, MSE is a parameter that determines the optimization of the network. In this model, MSE was 0.765, and RMSE was equal to 0.875. The training procedure of the RMS-modified neural network model is presented in Figure 11. The training error in this model initially decreased with a high changing rate, after which the rate declined. In addition, the validation error had a sharply increasing rate, contrary to the end of the procedure with a very low decreasing rate. It should be noted that MSE for this model was 0.0465 at the best validation performance point. Figure 12 depicts the regression diagrams of the training data submitted to the RSM-modified neural network. It can be observed that the regression values of all diagrams in this model were more than 0.97. As the error between the actual and predicted values is negligible, the network modeling attained superior accuracy. Actual and predicted result rates are presented in Figure 13. In addition, the bias and weight values of the RSM-modified neural network model are presented in Table 7.

4.4. Determining Most Suitable Network for Predicting Flexural Strength

Two types of models were developed in this study. At first, a normal neural network modeling was carried out according to the four determined independent variables. Then, to increase the model accuracy and consider parameters whose effects were not seen in the normal neural network, the RSM was used, leading to an increase in the number of independent variables from 4 to 19. Therefore, the accuracy of the model was accordingly enhanced, producing less error between the actual experimentally measured data and the model predicted values. Nonetheless, only four parameters were considered in the normal neural network, while other parameters were disregarded. This increased the error margin of the normal neural network when compared to the RSM-modified neural network. Generally, the ANN hybrid model coupled with RSM attained superior accuracy, which should allow the user to avert the laborious, time-consuming, and costly trial batches and the associated destructive tests that produce further material wastage. The experimental results in this study coupled with the trained ANN-RSM model allow for the designing of sustainable concrete mixtures incorporating proportions of waste coal while maintaining superior mechanical strength. Such coupling of sustainability-based mixture design and computational intelligence modeling based on data analytics opens the door for new venues in future research for reducing the environmental footprint of construction. Eventually, construction can become eco-efficient and generative by design, allowing to beneficiate large volumes of industrial and mining byproducts and alleviate the landfilling of colossal volumes of such byproducts.

5. Conclusions

In this study, an extensive experimental study was carried out to explore the effects of adding waste coal to concrete. An experimental database was developed to capture the effects of the mixture design parameters and waste coal addition on the flexural strength of concrete. The database was used to train a hybrid arterial neural network coupled with response surface methodology to predict the flexural strength of concrete mixture incorporating coal waste. Based on the experimental and computational intelligence modeling work conducted, the following conclusions can be drawn:
  • Experimental results demonstrate that coal waste powder can be used as an additive in concrete to mitigate the problem of landfilling this waste. Adequate control of the mixture design and dosage of coal waste allows beneficiating this byproduct in concrete while enhancing the flexural strength. Thus, using waste coal powder as a partial replacement for cement allows for reducing the cost of concrete production and carbon dioxide emission from cement production, while mitigating the environmental effects associated with waste coal disposal. A dosage of 3% coal waste was found to be optimal in enhancing the mechanical properties of waste coal-modified concrete.
  • The response surface methodology (RSM) has proven to be an effective tool for mixture design optimization, allowing not only to quantify the effect of the coal waste parameter, but also the interactions of this parameter with other mixture design parameters. The RSM-modified artificial neural network (ANN) achieved less error compared to the traditional ANN, improving model accuracy and enhancing the reliability of predictions. Improving the accuracy of the model led to less output error of the neural network. The RMSE for the normal neural network and the RSM-modified neural networks was equal to 1.014 and 0.875, respectively.
  • Errors typically arise when some effective parameters are disregarded in the modeling procedure. Accordingly, the RSM helped significantly in identifying the effective variables whose effects are not visible in the modeling. This approach, which increases the number of independent variables, increased the modeling accuracy and decreased the error between the actual data and the corresponding model-predicted ones.
  • It is recommended that the effects of waste coal powder addition on the rheological and durability properties of concrete be explored in future work. One of the attractive features is to study the effects of ultrafine ground coal waste and explore whether it can play a more effective microfiller effect and better enhance the properties of concrete than the coarser powder investigated in this study.

Author Contributions

Conceptualization, F.D.; methodology, F.D. and F.Q.; software, F.D. and M.K.; validation, F.D.; formal analysis, F.D. and F.Q.; investigation, F.D., H.S. and F.Q.; resources, F.D. and F.Q.; data curation, F.D. and M.K.; writing—original draft preparation, F.D.; writing—review and editing, M.L.N., M.R. and H.R.; visualization, M.L.N., M.R., H.R. and F.D.; supervision, M.L.N.; project administration, F.Q.; funding acquisition, M.L.N. All authors have read and agreed to the published version of the manuscript.

Funding

This research received no external funding.

Institutional Review Board Statement

Not applicable.

Informed Consent Statement

Not applicable.

Data Availability Statement

All data is included in the manuscript.

Conflicts of Interest

The authors declare that they have no conflict of interests relevant to the work reported in this paper. The research was not funded by any specific project grant or the financial support of any entity.

References

  1. Karimaei, M.; Dabbaghi, F.; Dehestani, M.; Rashidi, M. Estimating Compressive Strength of Concrete Containing Untreated Coal Waste Aggregates Using Ultrasonic Pulse Velocity. Materials 2021, 14, 647. [Google Scholar] [CrossRef]
  2. Rashidi, M.; Joshaghani, A.; Ghodrat, M. Towards Eco-Flowable Concrete Production. Sustainability 2020, 12, 1208. [Google Scholar] [CrossRef] [Green Version]
  3. Karimaei, M.; Dabbaghi, F.; Sadeghi-Nik, A.; Dehestani, M. Mechanical performance of green concrete produced with untreated coal waste aggregates. Constr. Build. Mater. 2020, 233, 117264. [Google Scholar] [CrossRef]
  4. Khotbehsara, M.M.; Manalo, A.; Aravinthan, T.; Ferdous, W.; Benmokrane, B.; Nguyen, K.T. Synergistic effects of hygrothermal conditions and solar ultraviolet radiation on the properties of structural particulate-filled epoxy polymer coatings. Constr. Build. Mater. 2021, 277, 122336. [Google Scholar] [CrossRef]
  5. Abousnina, R.; Manalo, A.; Ferdous, W.; Lokuge, W.; Benabed, B.; Al-Jabri, K.S. Characteristics, strength development and microstructure of cement mortar containing oil-contaminated sand. Constr. Build. Mater. 2020, 252, 119155. [Google Scholar] [CrossRef]
  6. Hooton, R.; Nehdi, M.; Khan, A. Cementitious Composites Containing Recycled Tire Rubber: An Overview of Engineering Properties and Potential Applications. Cem. Concr. Aggregates 2001, 23, 3. [Google Scholar] [CrossRef] [Green Version]
  7. Alfayez, S.; Suleiman, A.; Nehdi, M. Recycling Tire Rubber in Asphalt Pavements: State of the Art. Sustainability 2020, 12, 9076. [Google Scholar] [CrossRef]
  8. Aiello, M.; Leuzzi, F. Waste tyre rubberized concrete: Properties at fresh and hardened state. Waste Manag. 2010, 30, 1696–1704. [Google Scholar] [CrossRef]
  9. Ferdous, W.; Manalo, A.; AlAjarmeh, O.; Mohammed, A.A.; Salih, C.; Yu, P.; Khotbehsara, M.M.; Schubel, P. Static behaviour of glass fibre reinforced novel composite sleepers for mainline railway track. Eng. Struct. 2021, 229, 111627. [Google Scholar] [CrossRef]
  10. Rahmani, E.; Dehestani, M.; Beygi, M.H.A.; Allahyari, H.; Nikbin, I.M. On the mechanical properties of concrete containing waste PET particles. Constr. Build. Mater. 2013, 47, 1302–1308. [Google Scholar] [CrossRef]
  11. Tariq, A.; Nehdi, M. Developing durable paste backfill from sulphidic tailings. Proc. Inst. Civ. Eng. Waste Resour. Manag. 2007, 160, 155–166. [Google Scholar] [CrossRef]
  12. Kazmi, S.M.S.; Abbas, S.; Nehdi, M.L.; Saleem, M.A.; Munir, M.J. Feasibility of Using Waste Glass Sludge in Production of Ecofriendly Clay Bricks. J. Mater. Civ. Eng. 2017, 29, 04017056. [Google Scholar] [CrossRef]
  13. Abbas, S.; Arshad, U.; Abbass, W.; Nehdi, M.; Ahmed, A. Recycling Untreated Coal Bottom Ash with Added Value for Mitigating Alkali–Silica Reaction in Concrete: A Sustainable Approach. Sustainability 2020, 12, 10631. [Google Scholar] [CrossRef]
  14. Mohammed, A.; Nehdi, M.; Adawi, A. Recycling waste latex paint in concrete with added value. ACI Mater. J. 2008, 105, 367–374. [Google Scholar]
  15. Abbas, S.; Ahmed, A.; Nehdi, M.L.; Saeed, D.; Abbass, W.; Amin, F. Eco-Friendly Mitigation of Alkali-Silica Reaction in Concrete Using Waste-Marble Powder. J. Mater. Civ. Eng. 2020, 32, 04020270. [Google Scholar] [CrossRef]
  16. Andreão, P.V.; Suleiman, A.R.; Cordeiro, G.C.; Nehdi, M.L. Beneficiation of Sugarcane Bagasse Ash: Pozzolanic Activity and Leaching Behavior. Waste Biomass Valorization 2019, 11, 1–10. [Google Scholar] [CrossRef]
  17. Nehdi, M.L.; Yassine, A. Mitigating Portland Cement CO2 Emissions Using Alkali-Activated Materials: System Dynamics Model. Materials 2020, 13, 4685. [Google Scholar] [CrossRef]
  18. Dabbaghi, F.; Nasrollahpour, S.; Dehestani, M.; Yousefpour, H. Optimization of Concrete Mixtures Containing Lightweight Expanded Clay Aggregates Based on Mechanical, Economical, Fire-Resistance, and Environmental Considerations. ASCE J. Mater. Civ. Eng. 2021. [Google Scholar] [CrossRef]
  19. Dabbaghi, F.; Dehestani, M.; Yousefpour, H.; Rasekh, H.; Navaratnam, S. Residual compressive stress–strain relationship of lightweight aggregate concrete after exposure to elevated temperatures. Constr. Build. Mater. 2021, 298, 123890. [Google Scholar] [CrossRef]
  20. Zain, M.; Abd, S.M.; Hamid, R.; Jamil, M. Potential for Utilising Concrete Mix Properties to Predict Strength at Different Ages. J. Appl. Sci. 2010, 10, 2831–2838. [Google Scholar] [CrossRef]
  21. DeRousseau, M.; Kasprzyk, J.; Srubar, W. Computational design optimization of concrete mixtures: A review. Cem. Concr. Res. 2018, 109, 42–53. [Google Scholar] [CrossRef]
  22. Tsivilis, S.; Parissakis, G. A mathematical model for the prediction of cement strength. Cem. Concr. Res. 1995, 25, 9–14. [Google Scholar] [CrossRef]
  23. Nunez, I.; Marani, A.; Nehdi, M.L. Mixture Optimization of Recycled Aggregate Concrete Using Hybrid Machine Learning Model. Materials 2020, 13, 4331. [Google Scholar] [CrossRef]
  24. Nunez, I.; Nehdi, M.L. Machine learning prediction of carbonation depth in recycled aggregate concrete incorporating SCMs. Constr. Build. Mater. 2021, 287, 123027. [Google Scholar] [CrossRef]
  25. Keshtegar, B.; Nehdi, M.L.; Kolahchi, R.; Trung, N.-T.; Bagheri, M. Novel hybrid machine leaning model for predicting shear strength of reinforced concrete shear walls. Eng. Comput. 2021, 12, 1–12. [Google Scholar] [CrossRef]
  26. Marani, A.; Nehdi, M.L. Machine learning prediction of compressive strength for phase change materials integrated cementitious composites. Constr. Build. Mater. 2020, 265, 120286. [Google Scholar] [CrossRef]
  27. Ben Chaabene, W.; Nehdi, M.L. Novel soft computing hybrid model for predicting shear strength and failure mode of SFRC beams with superior accuracy. Compos. Part C Open Access 2020, 3, 100070. [Google Scholar] [CrossRef]
  28. Marani, A.; Jamali, A.; Nehdi, M.L. Predicting Ultra-High-Performance Concrete Compressive Strength Using Tabular Generative Adversarial Networks. Materials 2020, 13, 4757. [Google Scholar] [CrossRef]
  29. Almustafa, M.; Nehdi, M. Machine learning model for predicting structural response of RC slabs exposed to blast loading. Eng. Struct. 2020, 221, 111109. [Google Scholar] [CrossRef]
  30. Flah, M.; Nunez, I.; Ben Chaabene, W.; Nehdi, M.L. Machine Learning Algorithms in Civil Structural Health Monitoring: A Systematic Review. Arch. Comput. Methods Eng. 2021, 28, 2621–2643. [Google Scholar] [CrossRef]
  31. Ben Chaabene, W.; Flah, M.; Nehdi, M.L. Machine learning prediction of mechanical properties of concrete: Critical review. Constr. Build. Mater. 2020, 260, 119889. [Google Scholar] [CrossRef]
  32. ASTM C33/C33M-18, Standard Specification for Concrete Aggregates, Developed by Subcommittee: C09.20; ASTM International: West Conshohocken, PA, USA, 2018; Available online: www.astm.org (accessed on 15 April 2018).
  33. ASTM C192/C192M-19, Standard Practice for Making and Curing Concrete Test Specimens in the Laboratory; ASTM International: West Conshohocken, PA, USA, 2018; Available online: www.astm.org (accessed on 10 August 2000).
  34. ASTM C293/C293M-16, Standard Test Method for Flexural Strength of Concrete (Using Simple Beam with Center-Point Loading); ASTM International: West Conshohocken, PA, USA, 2018; Available online: www.astm.org (accessed on 15 April 2016).
  35. El-Chabib, H.; Nehdi, M. Neural network modelling of properties of cement-based materials demystified. Adv. Cem. Res. 2005, 17, 91–102. [Google Scholar] [CrossRef]
  36. Mukherjee, A.; Biswas, S.N. Artificial neural networks in prediction of mechanical behavior of concrete at high temperature. Nucl. Eng. Des. 1997, 178, 1–11. [Google Scholar] [CrossRef]
  37. Moghadam, M.T.; Qaderi, F. Modeling of petroleum wastewater treatment by Fe/Zn nanoparticles using the response surface methodology and enhancing the efficiency by scavenger. Results Phys. 2019, 15, 102566. [Google Scholar] [CrossRef]
  38. Qaderi, F.; Sayahzadeh, A.H.; Azizpour, F.; Vosughi, P. Efficiency modeling of serial stabilization ponds in treatment of phenolic wastewater by response surface methodology. Int. J. Environ. Sci. Technol. 2019, 16, 4193–4202. [Google Scholar] [CrossRef]
  39. Shi, L.; Wei, D.; Ngo, H.H.; Guo, W.; Du, B.; Wei, Q. Application of anaerobic granular sludge for competitive biosorption of methylene blue and Pb(II): Fluorescence and response surface methodology. Bioresour. Technol. 2015, 194, 297–304. [Google Scholar] [CrossRef]
  40. Yang, S.-S.; Guo, W.-Q.; Zhou, X.-J.; Meng, Z.-H.; Liu, B.; Ren, N.-Q. Optimization of operating parameters for sludge process reduction under alternating aerobic/oxygen-limited conditions by response surface methodology. Bioresour. Technol. 2011, 102, 9843–9851. [Google Scholar] [CrossRef]
  41. Design Expert Software; Version 13; Stat-Ease, Inc.: Minneapolis, MN, USA, 2016.
  42. Ergün, A. Effects of the usage of diatomite and waste marble powder as partial replacement of cement on the mechanical properties of concrete. Constr. Build. Mater. 2011, 25, 806–812. [Google Scholar] [CrossRef]
  43. Ganjian, E.; Khorami, M.; Maghsoudi, A.A. Scrap-tyre-rubber replacement for aggregate and filler in concrete. Constr. Build. Mater. 2009, 23, 1828–1836. [Google Scholar] [CrossRef]
Figure 1. Particle size distribution of aggregates: (a) coarse aggregate, and (b) fine aggregate.
Sustainability 13 07506 g001aSustainability 13 07506 g001b
Figure 2. Illustration of a simple form of Artificial Neural Network (ANN).
Sustainability 13 07506 g002
Figure 3. Universal testing machine.
Sustainability 13 07506 g003
Figure 4. Variation of flexural strength relative to the coal waste in dosage (at w/c ratio of 0.5, gravel volume of 784 kg/m3, and cement volume of 375 kg/m3).
Sustainability 13 07506 g004
Figure 5. Concurrent effect of (a) w/c ratio and coal waste percent, and (b) cement content and coal waste percent on flexural strength.
Sustainability 13 07506 g005
Figure 6. Concurrent effects of gravel volume (kg/m3) and coal waste dosage on flexural strength.
Sustainability 13 07506 g006
Figure 7. Comparison of experimental results of the present study and literature with the proposed equation on flexural strength.
Sustainability 13 07506 g007
Figure 8. Diagram of neural network learning in the three steps of training, validation, and testing.
Sustainability 13 07506 g008
Figure 9. Regression diagrams of the available data in the normal neural network for learning and the equation for the associated fitted line.
Sustainability 13 07506 g009
Figure 10. Comparison between the actual and neural network predicted values.
Sustainability 13 07506 g010
Figure 11. Diagram of RSM-modified neural network learning in three steps of training, validation, and testing.
Sustainability 13 07506 g011
Figure 12. Regression diagram of the training data submitted to the RSM-modified neural network along with their fitting line equation.
Sustainability 13 07506 g012
Figure 13. Comparing the actual measures and predicted values of the RSM-modified neural network.
Sustainability 13 07506 g013
Table 1. Properties of cement.
Chemical Properties (%)Physical PropertiesCompressive Strength (MPa)
SiO221.9Specific gravity3.153 days18.14
Al2O34.86Specific surface (m2/gr)0.3057 days28.93
Fe2O33.3Initial setting time (min)14028 days37.17
CaO63.32Final setting time (min)190
MgO1.15
SO32.1
Loss on ignition (L.O.I)2.4
Table 2. Chemical specifications of coal waste.
ItemsSiO2AL2O3Fe2O3MgOCaOP2O5–P2O3Na2OK2OMnOTiO2L.O.I
Untreated Coal waste37.813.142.850.730.760.270.282.020.021.1740.96
Table 3. Concrete mixing plan.
MixW/CCoal Waste (%)Cement (kg/m3)Water (kg/m3)Gravel (kg/m3)Sand (kg/m3)Coal Waste (kg/m3)Flexural Strength (MPa)
R10.405.25375150784744.819.696.260
R20.453.00412185.4720684.012.365.140
R30.457.5340153.0720684.025.506.360
R40.457.5412185.4880836.030.904.325
R50.457.5340153.0880836.025.504.915
R60.453.00340153.0880836.010.205.090
R70.453.00340153.0720684.010.206.675
R80.457.50412185.4720684.030.906.655
R90.453.00412185.4880836.012.365.560
R100.495.25375183.75640608.019.695.430
R110.495.25375183.75784744.819.695.875
R120.499.75375183.75784744.836.564.080
R130.495.25375183.75784744.819.696.605
R140.497.50375183.75784744.828.105.620
R150.495.25375183.75784744.819.696.350
R160.495.25445218.05784744.823.366.620
R170.495.25375183.75960912.019.695.540
R180.495.25375183.75784744.819.695.395
R190.495.25375183.75784744.819.696.395
R200.495.25305149.45784744.816.016.025
R210.495.25375183.75784744.819.696.640
R220.557.50412226.6880836.030.906.160
R230.557.50340187.0880836.025.505.940
R240.553.00412226.6880836.012.365.500
R250.557.50340187.0720684.025.505.420
R260.553.00340187.0720684.010.205.770
R270.553.00412226.6720684.012.365.980
R280.553.00340187.0880836.010.205.750
R290.557.50412226.6720684.030.906.440
R300.605.25375225.0784744.819.694.145
Table 4. Statistical metrics used as criteria for model performance evaluation.
Criteria for the Used ModelsEquation
Root Mean Square: Random Error (R2) R 2 = 1 y o y t 2   y t 2
Mean Squared Error (MSE) R M S E = y O y t 2   n
Mean Absolute Error (MAE) M A E = y o y t   n
Root Mean Square Error (RMSE) M S E = y O y t 2   n
Table 5. The coefficient matrix for each of the variables and bias values for each neuron.
Independent Variables
W/CCementGravelCoal WasteBIAS
Layer 1N 1-11.4255−1.60360.653671.0762−2.5832
N 1-20.759821.1982−1.3435−1.2943−2.1712
N 1-3−0.950691.62731.3359−0.455261.8651
N 1-42.5719−0.187240.77472−1.5824−1.1693
N 1-50.161510.17840.202−3.04−0.74634
N 1-6−1.2883−0.000351.1771.932−0.17828
N 1-7−1.5654−0.90021.19442.314−1.277
N 1-80.59842.3704−0.91183−0.516061.5529
N 1-91.39180.56141−0.100281.27352.8188
N 1-100.801320.95138−0.28147−2.17242.4328
Layer 1
N1-1N1-2N1-3N1-4N1-5N1-6N 1-7N 1-8N 1-9N1-10BIAS
Layer 2N 2-1−0.160.58−0.180.980.83−0.90−0.410.43−0.14−0.381.84
N 2-2−0.310.660.0031.29−0.910.220.06−0.340.150.881.28
N 2-30.54−0.300.14−0.050.790.22−0.71−0.87−0.48−0.70−0.83
N 2-40.32−0.030.06−1.250.75−0.20−1.75−0.970.090.71−0.22
N 2-5−0.77−0.241.11−0.43−0.251.320.69−0.620.210.07−0.23
N 2-6−0.07−0.77−0.42−0.37−0.84−0.400.620.460.390.94−0.70
N 2-7−0.30−0.95−0.025−0.15−0.330.610.96−0.100.10−0.69−1.06
N 2-80.39−0.210.42−0.57−0.480.67−0.940.22−0.85−0.101.77
Layer 2
N 2-1N 2-2N 2-3N 2-4N 2-5N 2-6N 2-7N 2-8BIAS
Output−0.2280.85987−0.323091.14690.47257−0.027428−0.063393−0.44329−1.0208
Table 6. ANOVA for Response Surface Reduced Cubic Model (Aliased).
ResponseFlexural Strength
Analysis of Variance Table [Partial Sum of Squares—Type III]
SourceSum of Squares* dfMean SquareF Valuep-Value
Prob > F
Model12.74180.712.70.0479
A-W/C1.8511.857.080.0222
B-Cement Content0.04710.0470.180.6792
C-Gravel volume0.04610.0460.180.6832
D-Coal waste0.3110.311.180.3008
AC1.3511.355.150.0444
AD0.08310.0830.320.5854
BC6.97 × 10−316.97 × 10−30.0270.8734
BD0.2710.271.020.3335
CD0.2210.220.850.3755
A20.8910.893.410.0917
B29.62 × 10−619.62 × 10−63.68 × 10−50.9953
C21.51 × 10−311.51 × 10−35.77E × 10−30.9408
D22.3912.399.130.0116
ACD0.7110.712.710.1278
BCD0.6610.662.520.1405
AC22.1512.158.220.0153
B2C0.7910.7930.111
A300
D31.0311.033.950.0724
Residual2.88110.26
Lack of Fit1.7160.281.220.4246
Pure Error1.1750.23
Cor. Total15.6229
* df = Degree of freedom.
Table 7. Coefficient matrix for each of the variables and bias values for each neuron in the RSM-modified network.
Independent Variables
W/C (A)Cement (B)Gravel (C)Coal Waste (D)ACADBCBDCDA2B2C2D2ACDBCDAC2B2CA3D3BIAS
Layer 1N 1-10.12−0.250.07−0.05−0.32−0.240.13−0.350.470.48−0.070.350.49−0.25−0.560.33−0.51−0.410.5−1.57
N 1-20.040.19−0.950.1−0.61−0.62−0.49−0.530.320.420.22−0.50.510.07−0.74−0.17−0.39−0.230.070.62
N 1-3−0.310.060.180.460.040.110.25−0.120.1−0.3−0.040.40.36−0.540.710.71−0.68−0.23−0.350.36
N 1-4−0.36−0.330.370.350.21−0.20.050.41−0.050.22−0.290.590.160.65−0.48−0.26−0.350.03−0.470.22
N 1-50.20.470.19−0.39−0.75−0.03−0.350.360.19−0.04−0.540.080.6−0.28−0.03−0.31−0.22−0.610.650.39
N 1-60.090.290.140.30.750.50.090.14−0.310.7−0.520.09−0.140.10.02−0.18−0.480.740.39−0.71
N 1-7−0.460.08−0.58−0.06−0.220.370.5−0.58−0.46−0.45−0.5−0.31−0.4−0.3−0.430.170.310.16−0.03−1.06
N 1-80.470.240.17−0.52−0.24−0.470.03−0.580.360.05−0.360.210.090.17−0.08−0.56−0.05−0.52−0.581.52
Layer 1
N1-1N1-2N1-3N1-4N1-5N1-6N 1-7N 1-8BIAS
Layer 2N 2-1−0.370−0.8770.970580.027−0.545−0.414−0.9260.3231.83
N 2-2−0.067−0.6440.248061.29−0.204−0.3511.005−0.1791.259
N 2-3−1.0510.277−0.883410.34−0.8680.4070.2070.8410.726
N 2-40.087−0.1890.972070.412−0.092−1.137−1.143−0.584−0.156
N 2-5−0.495−0.733−0.333140.2170.638−0.9690.1071.086−0.321
N 2-6−0.04951.325−0.78808−0.1830.28−1.0670.41−0.578−0.903
N 2-70.1250.5680.832990.733−0.215−0.720−0.7420.7961.31
N 2-8−0.7990.08−0.70271−0.2230.7110.7590.909−0.488−1.823
Layer 2
N 2-1N 2-2N 2-3N 2-4N 2-5N 2-6N 2-7N 2-8BIAS
Layer 3N 3-11.168−0.67221.1144−0.4385−0.5610−0.70260.2466−0.5264−1.4806
N 3-2−0.0168−0.8588−0.2154−0.27130.74240.676−0.91240.613−1.0882
N 3-3−0.02590.75620.121−0.53390.33141.03920.4327−0.8359−0.5162
N 3-41.0796−0.0166−0.9398−0.63190.532−0.6619−0.16770.54090.3183
N 3-50.78940.148−0.24050.63151.2459−0.3098−0.35630.71131.2089
N 3-6−0.47370.0196−0.91850.79850.1770.9209−0.4222−0.5776−1.7361
Layer 3
N 3-1N 3-2N 3-3N 3-4N 3-5N 3-6BIAS
output 0.6294−0.197910.49824−1.02180.735630.50878−0.49803
Publisher’s Note: MDPI stays neutral with regard to jurisdictional claims in published maps and institutional affiliations.

