Audiovisual Bimodal and Interactive Effects for Soundscape Design of the Indoor Environments: A Systematic Review


Department of Architecture, School of Design and Environment, National University of Singapore, 4 Architecture Drive, Singapore 117566, Singapore
*
Author to whom correspondence should be addressed.
Sustainability 2021, 13(1), 339; https://doi.org/10.3390/su13010339
Submission received: 15 November 2020
/
Revised: 25 December 2020
/
Accepted: 29 December 2020
/
Published: 1 January 2021
(This article belongs to the Special Issue Soundscape: A Multidisciplinary Approach for Environmental Sustainability)
Abstract
:A growing number of soundscape studies involving audiovisual factors have been conducted; however, their bimodal and interactive effects on indoor soundscape evaluations have not yet been thoroughly reviewed. The overarching goal of this systematic review was to develop the framework for designing sustainable indoor soundscapes by focusing on audiovisual factors and relations. A search for individual studies was conducted through three databases and search engines: Scopus, Web of Science, and PubMed. Based on the qualitative reviews of the selected thirty papers, a framework of indoor soundscape evaluation concerning visual and audiovisual indicators was proposed. Overall, the greenery factor was the most important visual variable, followed by the water features and moderating noise annoyance perceived by occupants in given indoor environments. The presence of visual information and sound-source visibility would moderate perceived noise annoyance and influence other audio-related perceptions. Furthermore, sound sources would impact multiple perceptual responses (audio, visual, cognitive, and emotional perceptions) related to the overall soundscape experiences when certain visual factors are interactively involved. The proposed framework highlights the potential use of the bimodality and interactivity of the audiovisual factors for designing indoor sound environments in more effective ways.
1. Introduction
In environmental acoustics research, the term “soundscape” is defined as the acoustic environment as perceived or experienced and/or understood by a person or people in context [1]. Soundscape approaches help us create a healthy and comfortable sound environment for human beings to live in by promoting the sound experience’s quality rather than reducing unwanted sound stimuli, as considered sound as a resource rather than a waste [2,3]. As soundscapes involve human perceptual constructs and experiences into physical acoustic phenomena under various environmental settings, their target environments are almost everywhere people experience/perceive sounds.
Although the original concept of the soundscape approach was derived from outdoor environmental research [2], its application has been recently expanded to indoor built spaces (i.e., indoor soundscapes) [4]. There are several categories of indoor spaces that have been suggested for indoor soundscape evaluations, such as industrial/commercial buildings, music venues, and transportation space [5]. Among those indoors, non-industrial building spaces, including working spaces (e.g., office spaces, classrooms) and homes (e.g., residential buildings, apartments), should be chiefly considered because people spend more time in those spaces as they live in modern cities [6]. Therefore, it is crucial to focus on these types of indoor spaces and seek potential factors that would influence their soundscapes and environmental assessments.
The utilization of factors related to the audio environment is frequently seen for improving soundscape perceptions. Torresin et al. stated that a large part of the indoor-soundscape literature showed a general effort of minimizing noise annoyance by reducing noise exposure (i.e., in noise levels) [7]. When altering the noise exposure degree, the responses from the same domains (e.g., audio-related perceptions) are clearly expected to be changed or predicted; however, the use of such a unimodal effect of noise exposure may not be a feasible solution because noise exposure reduction may not necessarily reflect the better soundscape perceptions [2].
As a variety of multisensory environmental factors and their variations are comprehensively influence soundscape experience in built environments [8] (pp. 17–41), their potential impacts on human perceptions should not be neglected and, in particular, a variety of non-acoustical factors are proposed for affecting soundscape perceptions [7]. By reviewing a large body of indoor soundscape studies, we found that various categories of non-acoustical factors influencing the acoustic perception in indoor residential buildings are proposed: urban context (e.g., presence of green space, sea views at home), house-related (e.g., room location), person-related (e.g., age, gender, noise sensitivity), socio-economic (e.g., education level, income), and so on [7]. Although listing those potential factors would enrich the existing framework of soundscape designs, the evidence of their effects is still ambiguous; therefore, it is still insufficient to fully utilize the non-acoustical factors to provide better soundscapes for future sustainable designs and human well-being.
Among the potential factors unrelated to the audio environments, one of the most prominent non-auditory factors is visual or visual-related features for two reasons. First, there is supportive evidence that visual stimuli from our sight influence the auditory system, including at the perceptual level. As human beings, the auditory and visual systems are two sensory modalities with distinct cortical representations; however, these sensory signals are often associated with the same objects and events and binding these two stimuli together is done naturally and effortlessly [9]. By reviewing recent studies involving audiovisual interactions, Bulkin et al. highlighted the perceptual advantages of combining information from these two modalities as the visual and auditory systems’ roles overlap [10]. It was also stated that predominantly unimodal brain regions play a role in multisensory processing [10]. Thus, it is evident to propose the visual factor as the most promising feature that potentially influences audio-related perceptions. Second, there has been a growing interest in audiovisual combined effects or interactions, suggesting a critical role of visual factors in altering the soundscape perceptions [11].
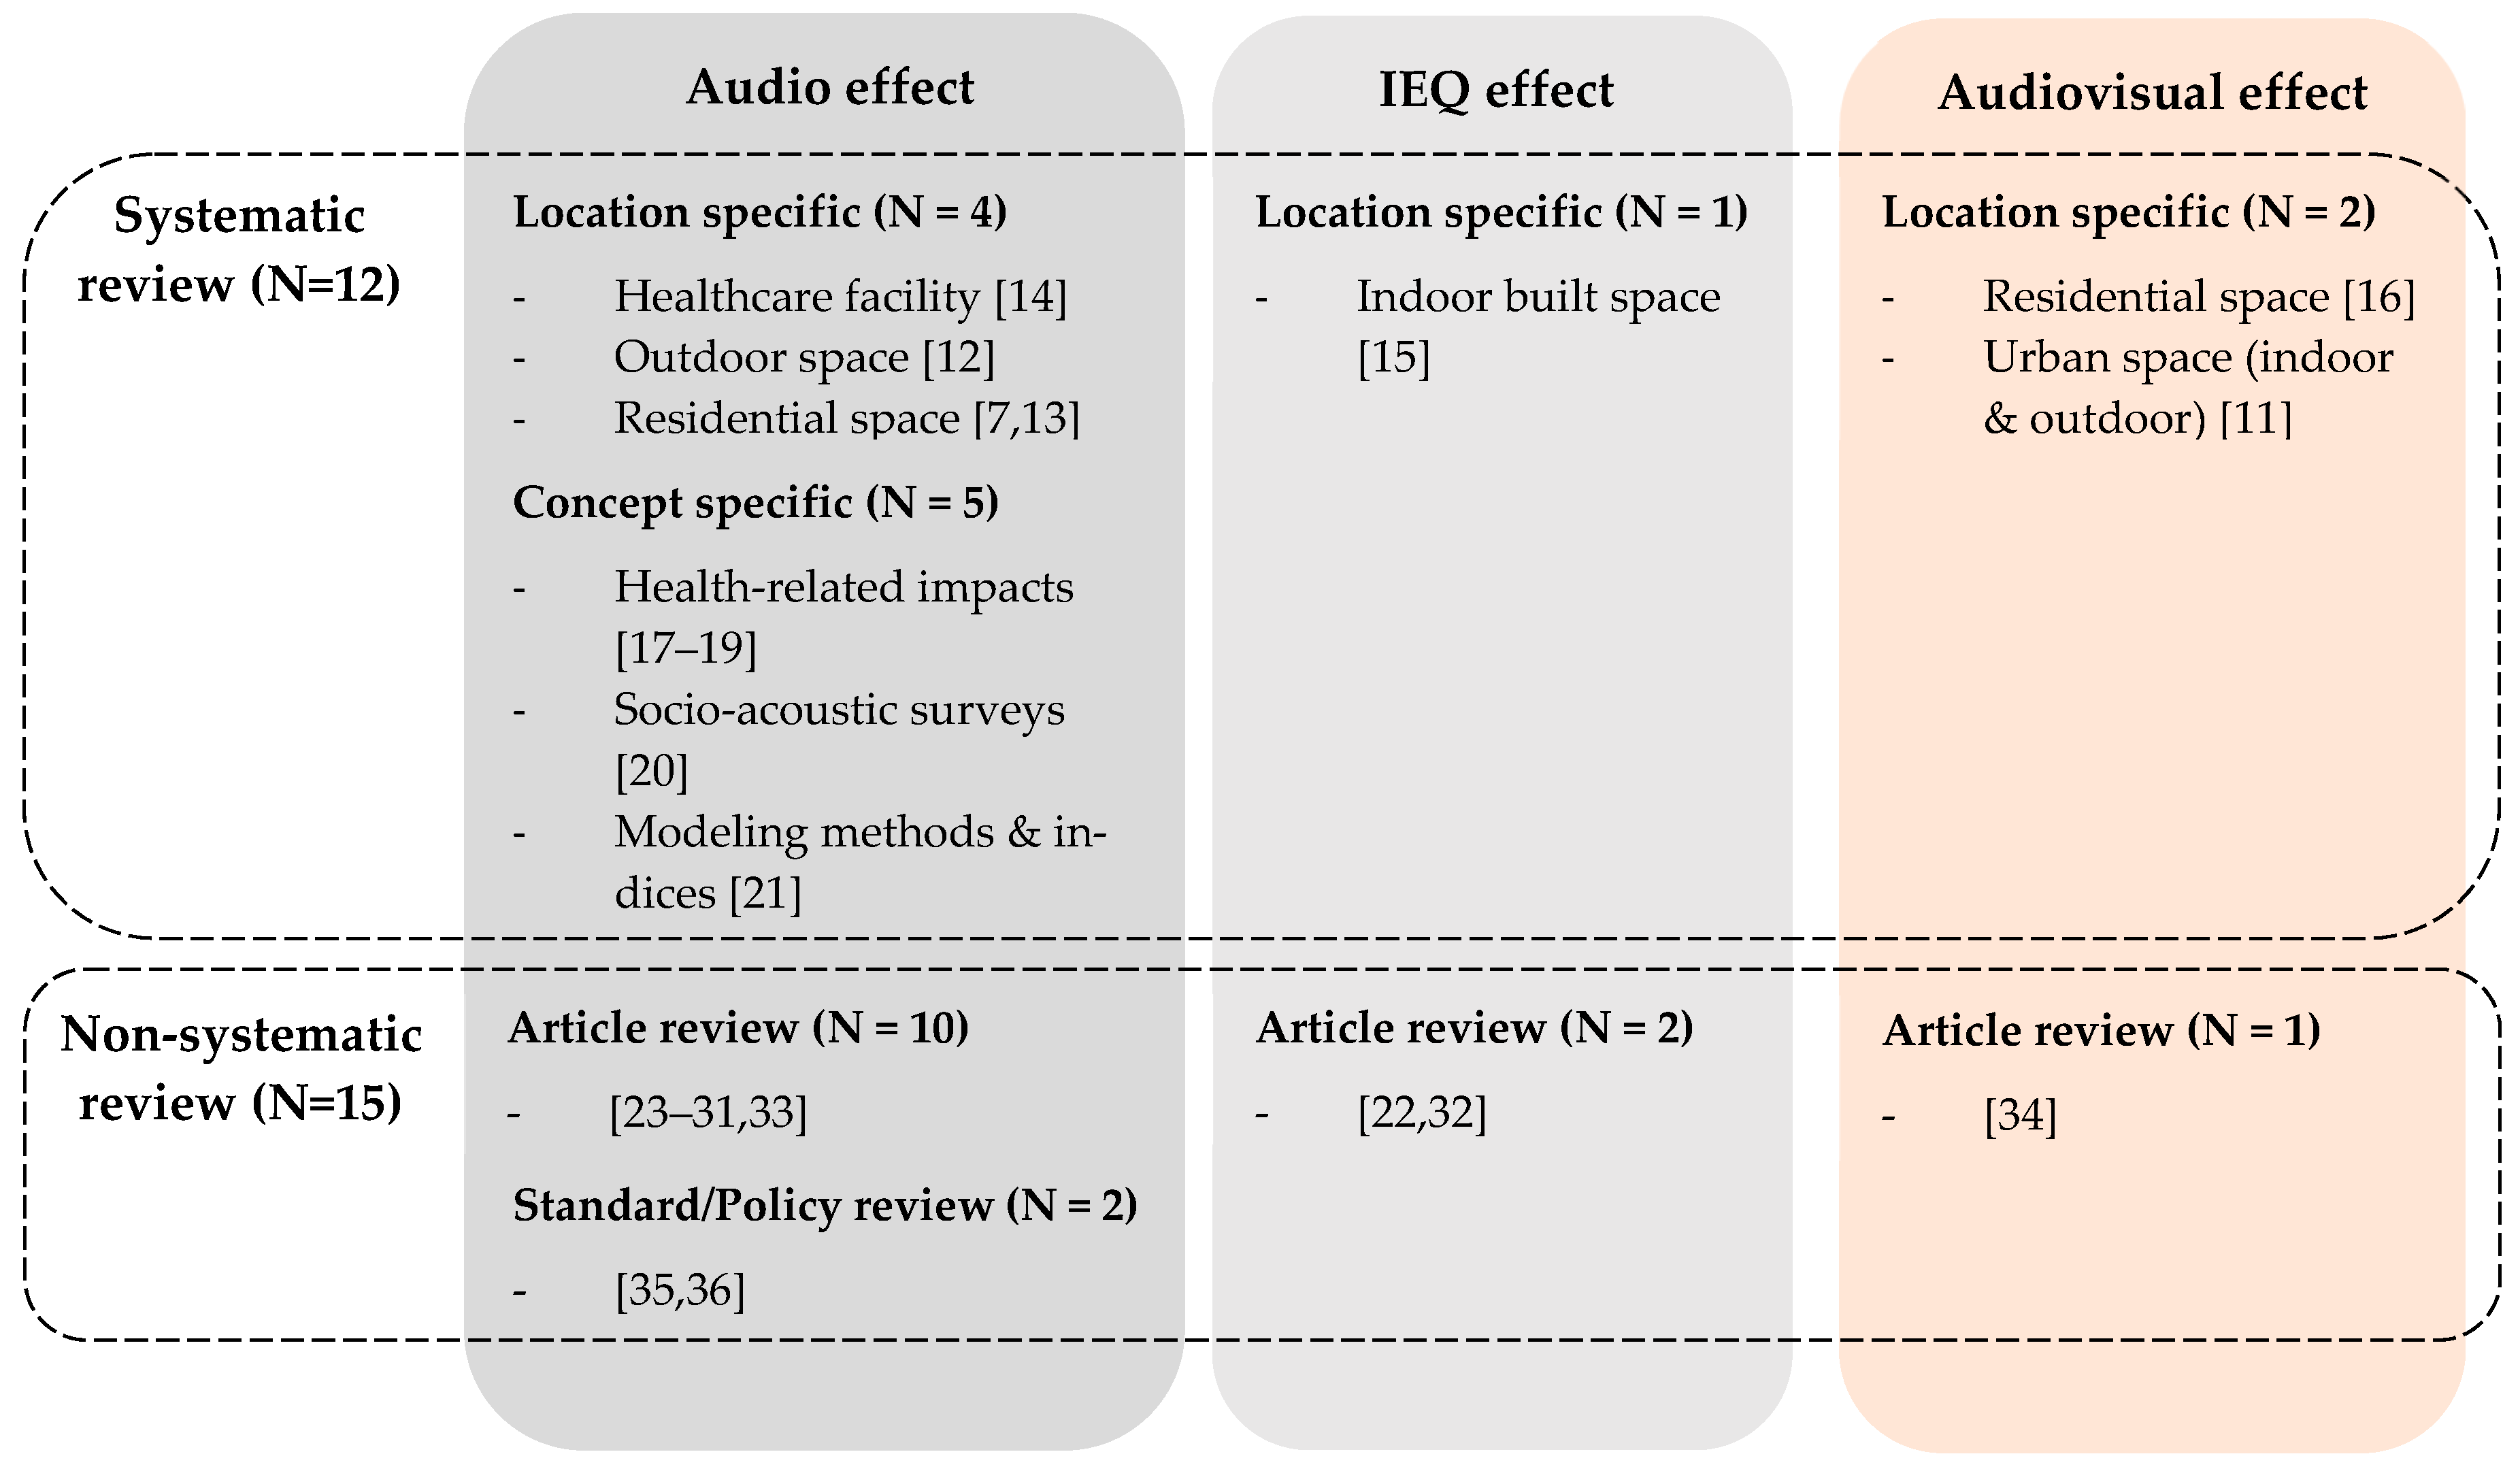
Initial prescreening of the literature review articles published on the topic of soundscapes, was conducted to highlight the research interests in audiovisual effects on soundscape perceptions. By exploring 27 recent review articles in soundscape literature, 12 systematic reviews (i.e., articles clearly stating that they used systematical procedures for data extraction or following certain systematic procedures for data investigations in their methodology parts) were identified and further divided into two categories: location-specific [7,11,12,13,14,15,16] and concept-specific [17,18,19,20,21]. Of the seven articles focusing on specific locations (e.g., outdoors, indoor spaces, residential spaces), two reviews intensively explored the existing studies examining the audiovisual effects. One review focused on the greenery effects on annoyance perceptions in indoor residential settings, considering greenery as visual measures [16]; however, no other soundscape perceptions or visual elements were examined. Another examined the audiovisual interactions in the urban built space, but they used only one search engine (Scopus) and did not exclusively examine the indoor effects as the review was broader in content [11]. Of the remaining ten systematic reviews, none of them involved visual measures, sought bimodal or interactive effects of audio and visual factors, or specified these effects on soundscape evaluations. Of the 27 review works, the remaining fifteen articles were non-systematic (because they did not follow the systematical reviewing process) [22,23,24,25,26,27,28,29,30,31,32,33,34,35,36], but one of these non-systematic review papers by van Renterghem [34] focused on the effect of visual factors on acoustical perceptions. The positive impacts of visible vegetation for mitigating negative environmental noise perception, mostly focusing on noise annoyance. Some of the non-systematic review articles partially discussed the bimodal and interactive effects of audiovisual factors. Especially, Torresin et al. [22] distinguished the crossed (bimodal effect in the present study) and interactive effect of four IEQ (Indoor Environmental Quality) factors (i.e., acoustical, thermal, visual, and indoor air quality) and mentioned a few research papers examining the audiovisual interactions on human perception for indoor built environments; however, insufficient evidence was identified. The rationale for mapping the identified existing reviews is illustrated in Figure 1.
Although several audiovisual factors have been suggested in previous literature surveys, none of the articles reviewed above deliberately explored the existing literature involving audiovisual bimodal and interactive effects on indoor soundscape assessments. Thus, updated research and review of individual studies should be conducted. Besides, there is a lack of framework showing bimodal and interactive effects of audiovisual factors on indoor soundscape evaluations, whereas their unimodal influences are commonly acknowledged, and most of the studies were conducted for the outdoor environments. Moreover, to formulate the framework of sustainable soundscape development, the utilization of the most prominent visual factors is crucial. Therefore, the clarification of the impact of visual and visual-related features on soundscape perceptions is essential.
The objective of this paper was to develop the framework for designing sustainable indoor soundscape by systematically reviewing the existing research papers involving audiovisual bimodal and interactive effects on soundscape evaluations, assessing their research methods and procedures, and identifying potential indicators influencing soundscape perceptual responses in the indoor environments. Achieving this objective will present concise assessment schemes of the indoor soundscape methodologies concerning audiovisual factors and provide evidence-based suggestions of the indicators that potentially influence the indoor soundscapes. Following two questions are being addressed in the present study: (1) what kind of evidence is there for the connection between audio, visual, and audiovisual combined factors and perceptual dimensions that are affected the most, and (2) which audio and visual factors would most contribute to the bimodal and interactive impacts on perceptual dimensions related to soundscapes.
As multiple environmental factors are inherently involved in soundscape experiences, their effects should be precisely defined and distinguishable from one another. To clarify this aspect, statistical interpretations and definitions of the terminologies (i.e., unimodal, bimodal, and interactive effects) are briefly introduced [37] (pp. 129–158). Suppose the presence of a linear effect of a factor on a single response criterion; one could examine the main effects of X (independent variable) on Y (the dependent variable). Suppose that Y is an audio-domain variable (e.g., noise annoyance) and X is a visual-domain variable (e.g., presence of greenery); the model is designed to predict the bimodal effect because it involves two different domains (i.e., audio and visual domains). Potential impacts of visual factors on audio-domain perceptions, or vice versa, are included in the present study. In contrast, when X is an audio-domain variable (i.e., noise level) predicting the same domain-variable of Y, the model would estimate the unimodal effect, which is not followed into our research interest. Any additive effects (i.e., the additive or joint effect of a set of multiple independent variables) are not considered in this study because the independent variables are treated as a single unit, so their contributions are added together, which obfuscates the unique effects of the target variables. Furthermore, suppose that X is an audiovisual interaction term (i.e., multiplication of audio and visual-domain independent variables), the model is designed to predict the audiovisual interactive (combined) effect, which is also included in the present study. If the audiovisual interactions are certified, Y will not be limited within audio or visual domains and can include various human perceptions such as psychological/emotional, physiological, behavioral, cognitive, and social responses (e.g., overall satisfaction, cognitive task performance, and so on). Moderators and mediators are excluded in this study as those variables are not commonly used, and bimodality and interactivity are more relevant in the soundscape literature.
2. Materials and Methods
2.1. Searching Individual Studies
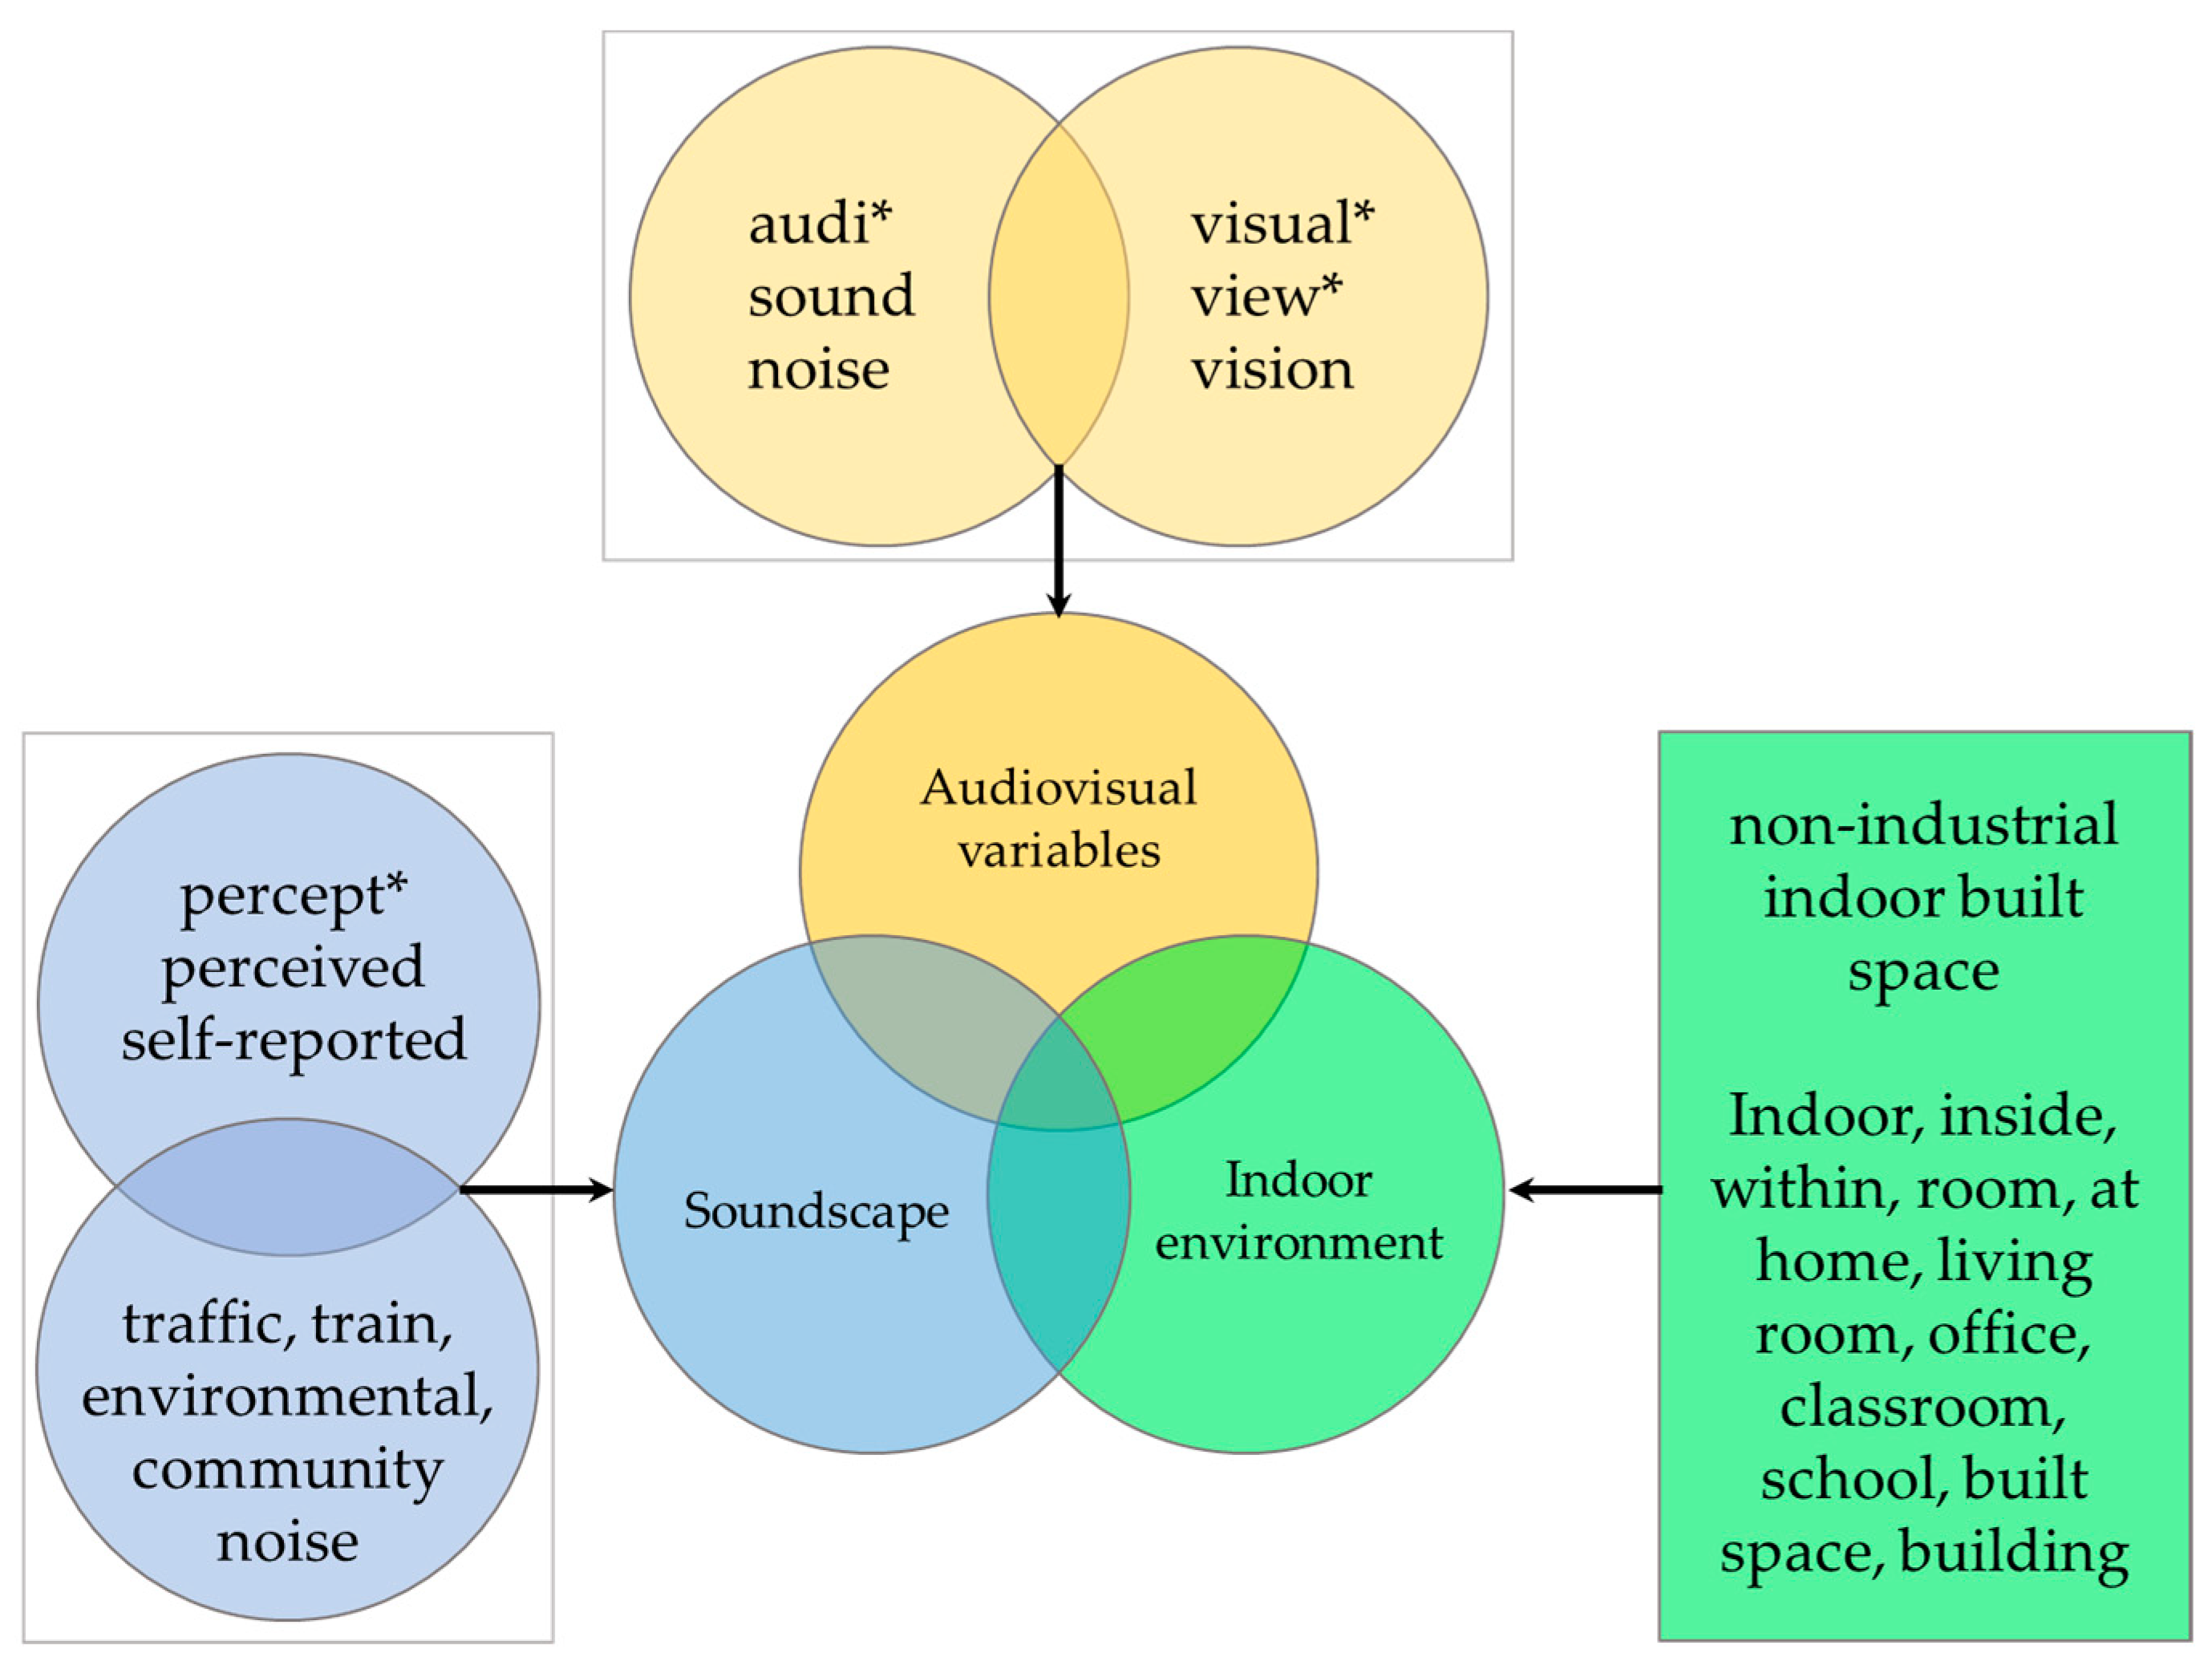
Given the exploratory nature of this study, no predefined protocol has been registered for this review. Nonetheless, the methodology for the basic process and data extraction forms were filed prior to the investigation. The PRISMA guidelines (Preferred Reporting Items for Systematic Reviews and Meta-Analyses) were employed as a basis for reporting systematic reviews in this study [38]. A search for individual studies was conducted through three journal databases and search engines: Scopus, Web of Science, and PubMed. The search keywords included audiovisual, soundscape, and indoor terms (see in Figure 2) and were used with appropriate Boolean operators, exploring through title, abstract, and keywords of publications (the exact wildcards are provided in Table A1). The scientific papers published in English were included, while those are non-English-language articles were discarded. There is no restriction of publication year for the database search. The search included gray literature such as conference proceedings. The literature search was conducted in May 2020.
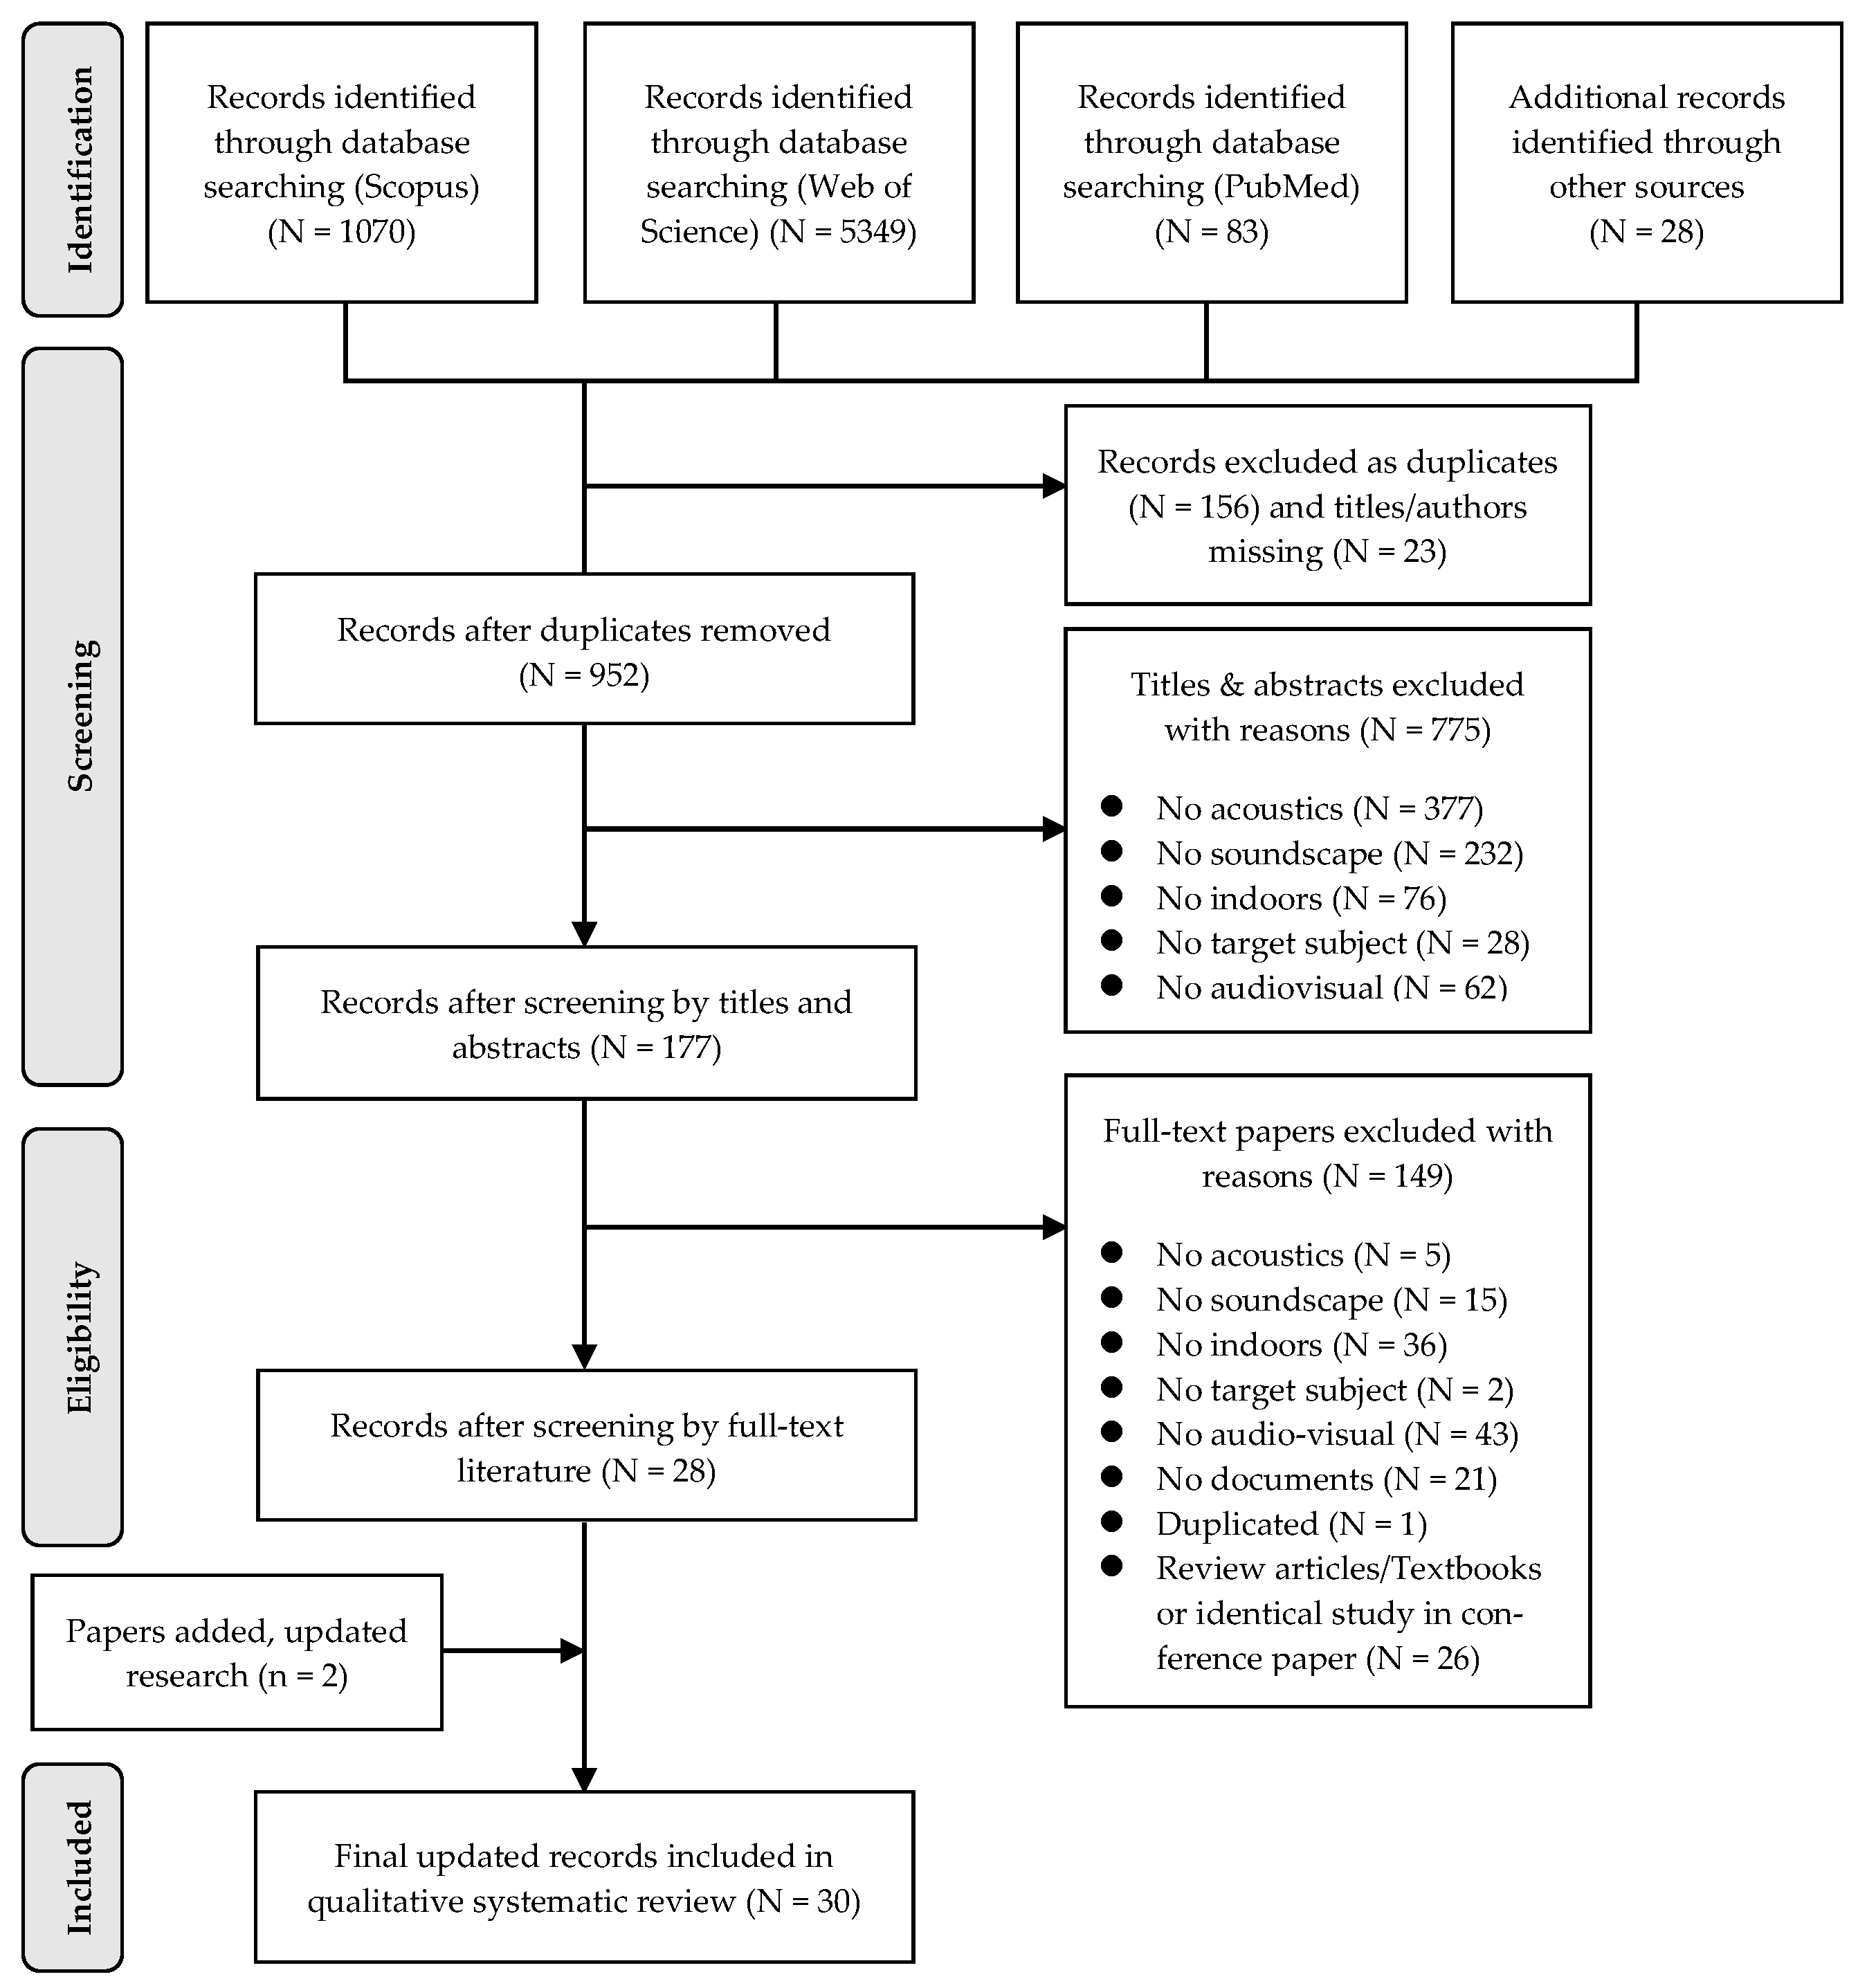
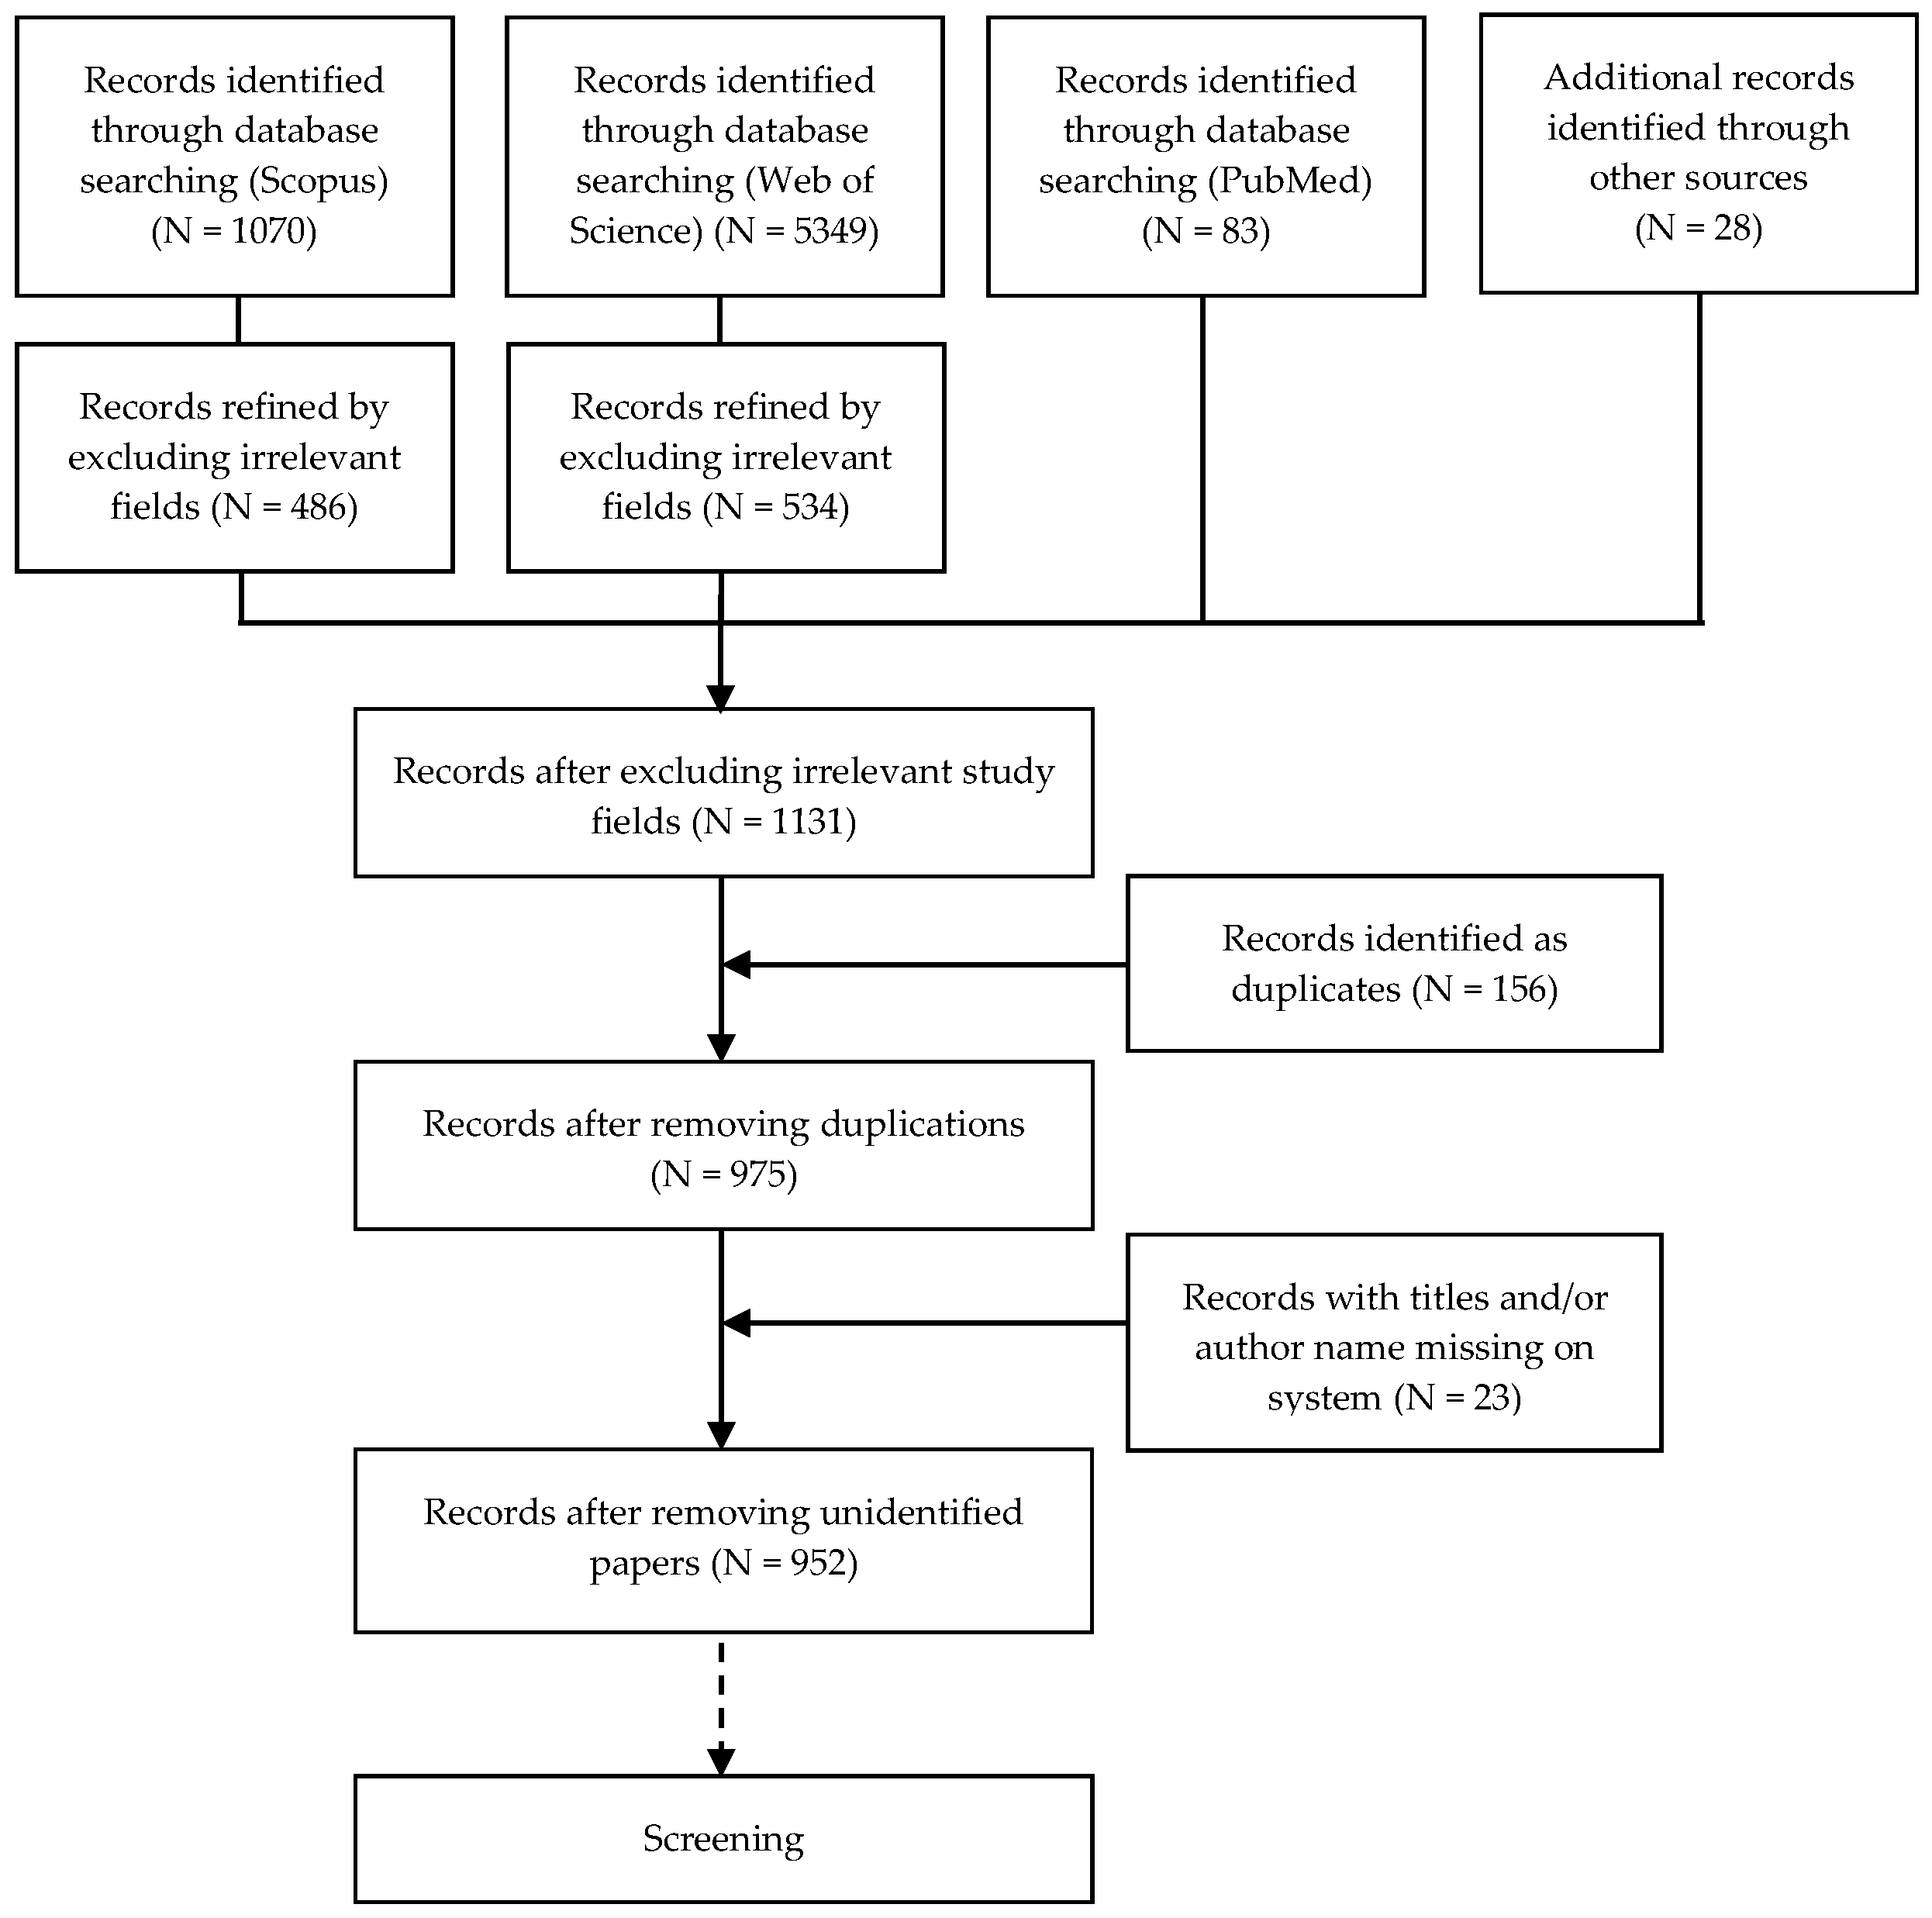
Through the initial search using the three databases, the number of publications was identified, ranging from 1 January 1976 to 1 May 2020: 1070 (Scopus), 5349 (Web of Science), and 83 (PubMed). After excluding certainly irrelevant subjects (e.g., molecular biology, mathematics, economics, dentistry), a total of 486 (Scopus), 534 (Web of Science), and PubMed (n = 83) studies were refined from their initial results. Additional 28 papers that had been previously collected by the authors through other sources were included. To sum up, the number records 1131 publications from the three databases and the additional papers. All duplications and those with uncompleted citations were manually removed, which creates the list of 952 unique publications that should go through an initial screening process. Most of these papers were identified through the main data-based search.
2.2. Inclusion and Exclusion Criteria
Pre-determined inclusion and exclusion criteria were applied to this review to ensure that the papers should be related to this study’s research interest. Firstly, the titles and abstracts of all the 952 publications were manually screened by two independent reviewers, including the authors, and 775 studies have been opted-out not being eligible for the present study because the contents of those papers are either:
- Non-acoustics papers (e.g., robotic, biology, economic);
- Non-soundscape research (e.g., speech communication, engineering acoustics);
- Non-indoors (e.g., outdoor environments such as parks, streets, city squares);
- Non-adult subject or subjects with hearing or visual impairment (e.g., children, blind people);
- No audiovisual measures examined (i.e., using either audio or visual measure only).
Then, the remaining 177 papers went through a full-text article assessment for eligibility. In this detailed screening, articles were carefully checked whether they addressed all the three concepts of this review study as followed:
- Audiovisual impacts: Articles should contain both audio and visual factors;
- Soundscape: Articles should involve soundscape concepts—human sound perceptions;
- Indoor: The assessment tools (e.g., questionnaire, reproduction of environmental scenarios) or research site are designed for the non-industrial indoor spaces.
Reference lists of previous reviews and primary studies were manually searched. Conference papers were excluded if the same research results were published as journal articles by the same authors, otherwise considered along with the peer-review journal paper. Review studies and textbooks were excluded. If more than one paper reported analyses based on the same dataset and substantially identical results, the one with higher quality was included. Additional searches were conducted in July 2020 to seek any additional publications while finalizing this review; two additional reports were included by applying the same inclusion and exclusion criteria. The final number of articles for eligibility in this qualitative review study was 30. The process of this systematic review is illustrated as a PRISMA flow diagram—shown in Figure 3.
During the review of the included studies, the following characteristics were recorded for each of the individual studies—research tools and instruments (e.g., questionnaire), sample size (i.e., number of participants/subjects), response variable (e.g., noise annoyance), factor influencing the response variable (e.g., sound level), and con-founding variables adjusted for in the models examining the effect of the factor on the response variable (e.g., socio-demographical variables), type of statistics (e.g., regression analysis), the main finding of the study, and type of the effect examined (i.e., bimodal or interactive effects). The effect types were determined based on their definitions provided in the introduction section.
3. Results
The included studies are primarily divided by their study designs: interventional (i.e., experimental) or observational studies highlighting differences in their research methods and procedures. The former study involves one or more intervention exposure(s) researchers assigned to participants (e.g., laboratory experiments), whereas the latter one does not involve such exposure (e.g., field/in-situ studies) [39]. Among 30 publications, there are 14 observational [40,41,42,43,44,45,46,47,48,49,50,51,52,53] and 16 interventional studies [54,55,56,57,58,59,60,61,62,63,64,65,66,67,68,69]. All the observational studies were cross-sectional designed and conducted field surveys in residential areas. The studies were published from 2007 to 2020, which well-covers the latest soundscape studies. The 16 interventional studies were all laboratory-based experimental studies focusing on specific indoor environments (i.e., workplace: n = 7; residential space: n = 7; classroom: n = 2).
3.1. Research Approaches and Characteristics in the Soundscape Research
3.1.1. Observational Studies
Characteristics of audiovisual bimodal and interactive assessments employed in the 14 individual observational studies are summarized in Table 1. The variables examined, including response variables (i.e., dependent variables, descriptors), factor influencing (i.e., independent variable, indicator), and con-founding variables adjusted for in the statistical models tested, are summarized in addition to their research/statistical approaches and main findings. If more than one target models were examined, significant results or those answering the research questions were considered.
Most of the studies utilized either street-survey questionnaires or mailed the questionnaire sheets to their subjects (i.e., residents). The number of the subjects were largely varied, ranging from 32 to the maximum of 5592. Those studies conducting via street or mail surveys generally had large sample sizes. Almost all the observational studies subjects were residents (i.e., the occupants of the target residential areas). The studies recruited students from the institutes where their studies were conducted [41,52]. However, these participants also had to be residents in their target residential spaces; therefore, these recruited subjects would more likely be resident-status subjects. Most of the observational studies considered the sound levels of the residential areas either by conducting in-situ sound measurements [40,43,44,49,50,53], or predicting the levels by some pre-calculated noise prediction models [41,51] (e.g., Calculation of Road Traffic Noise: CRTN [45,46,47,48]).
Although several audiovisual response variables were examined within the studies, such as quietness [49] and audio pleasantness [52], almost all the observational studies found noise-annoyance responses were statistically significantly influenced by some visual factors in residential areas. Such audiovisual effects are categorized as bimodal, and no interactive effects were identified. Namely, these studies provide potential insight into visual factor-noise annoyance relationships among the residential indoor environments. Most of the annoyance scales were 5-point verbal or 11-point numerical scales (numeric 0–10 scales with verbal endpoints) taken from the internationally standardized scales, either ISO (International Organization for Standardization) standard or ICBEN (International Commission on Biological Effects of Noise). In addition to the annoyance scales, Gidlöf-Gunnarsson and Öhrström also found bimodal audiovisual effects on occupant’s awareness of noise issues in their neighborhood by using binary scales (i.e., “yes/no” responses) [43].
There exists a variety of significant indicators that showed their impacts on residents’ perceived noise annoyance. Most of the predictors are greenery-related variables in terms of either objective measures (Normalized Difference Vegetation Index: NDVI, tree cover density, green land use) [50,51], subjective measures (perceived availability of green space, perceived amount of greenery) [43,53], or both objective and subjective measures [41,42,47]. Most of the greenery-noise annoyance associations in these studies found positive effects of greenery factors on noise annoyance reduction (i.e., more greenery presence residents have, less noise annoyance they perceive). One study did not find such an effect, which contradicts all the other studies [49]. Furthermore, the recent national-scaled study conducted in Switzerland examined the annoyance reduction to different transportation noise sources [51]. The residential greenery reduced road traffic and railway noise annoyance, whereas it increased aircraft noise annoyance. Although the positive greenery effect on reducing the traffic noise annoyance was found to be in line with the other observational studies, it revealed that, strictly speaking, the annoyance responses could be noise-source specific.
In addition to greenery elements, Leung et al. and Li et al. considered water views a potential visual indicator that alters noise annoyance responses [45,46,48]. In their larger-scaled study, they asked residents to rate the views of the specific visual elements presented in the residents’ sites, including greenery, waterbody (e.g., sea, urban river), building, traffic road, and noise barrier. They found that views of the sea, urban river, or greenery could lower noise annoyance while views of noise barrier could increase the annoyance. Nevertheless, views of the sea or urban river had a weaker noise moderation capability than views of greenery [46]. Furthermore, Leung et al. specifically indicated that such moderation impacts of the water views depended on the type of water features (sea views, river views, or both sea and river views) [45].
Other human perceptions such as psychological responses including sleep quality [40,49], overall satisfaction [43,48], neighborhood satisfaction and appreciation (whether residents would recommend their friends or relatives to come to live in their neighborhood) [53], and other conceptual recognition, including self-reporting concentration issue [40], were also examined within their studies. However, these responses would be fallen within neither audio nor visual domains. Perceived disturbance due to road traffic noise was examined and found to be significantly influenced by the environmental quality of courtyards (that have been defined based on visual aesthetic elements, and thus was a visual factor) [44]; however, such disturbances were given when considering outdoor activities; therefore, they were excluded. Other audio responses were found to be either non-significant or un-stated as results.
In Table 1, most of the observational studies used socio-demographic variables (e.g., age, educational level, noise sensitivity) to adjust for their statistical models examined as some demographical influences are theoretically expected. Common socio-demographical variables adjusted for in these studies include participants’ age, gender, residential status (e.g., length of stay, housing ownership), and social status (e.g., economic status, ethnicity). The adjustment with the socio-demographical variables was routinely performed when the studies utilized statistical techniques of regression analysis. Although this adjustment depends on the study, the results of their analyses remained substantially similar.
Considering that this review is about indoor soundscapes, it is crucial in what contexts the audiovisual indicators and descriptors have been measured and collected. Almost all the observational studies asked the participants to evaluate their perceptions when they were at home (as suggested by ISO or ICBEN noise annoyance scales), did not specify any target room (e.g., living room, bedroom, or kitchen room) [40,41,42,43,44,45,46,47,48,49,50,51,52]. Some of the studies asked participants to evaluate their noise annoyance when they were at home and outside in their neighbors [41,43], although only the former condition was used in this review. No specific observation conditions were instructed (e.g., whether they perceived the environments through doors or windows). Most of the visual factors (e.g., greenery, water, road views) were considered as outdoor environments perceived from indoors (greenery views from their home [45,46,47,48]; window facing green space [40]). Some visual factors were entirely outdoor environmental contexts (e.g., neighborhood greenspace or their surroundings [41,42,50]; greenery accessibility nearby their home [43]; courtyard quality existed outdoors [44]), which may not capture the same information as the visual elements perceived from indoors (e.g., window/street views). One of the studies used multiple residential greenness measures (e.g., visible vegetation from home and outside greenery accessibility) to collect diverse contexts of the greenery factors [51]. Only one study instructed the participants to assess their annoyance and visible vegetation at a specific location (i.e., living room and throughout their living room windows) [53]. The authors confirmed that participants’ dwellings had living room windows facing the ring road. Therefore, they ensured that the examined noise annoyance and vegetation views were perceived in living room spaces. One study conducted the noise measurements in the participants’ living rooms, but annoyance or greenery measures were not regarding any specific location at home [50]. Other studies collected information about types of bedroom windows and living room windows; however, it was not utilized within analyses [44].
As illustrated, the visual factors the most studies examined were outdoor environments; while their contents are diverse. Some measures are perceived viewing from participants’ homes; whereas other measures are quantified variables based on outdoor contexts such as neighborhood greenspace or their surroundings. Only one study asked annoyance perceptions at a specific location (i.e., living room), and the other studies did not specify any evaluation point at home, which could be because housing/dwelling spaces differ significantly in individuals’ units so that participants were supposed to answer their perceptions regarding their “general living” functions or expectations at their home. Although the diversity in the visual factors context is confirmed, there are no substantial differences in their findings.
To summarize, the 14 observational studies included in this review all focused on bimodal audiovisual effects in the residential indoor environments, utilizing survey questionnaires among the relatively large number of subjects. Almost all the studies found the positive effects of greenery-related variables on annoyance responses due to noise (mostly traffic noise) as significant bimodal associations. Some studies, furthermore, suggested water views as a potential indicator for soundscape assessments. There are other soundscapes and environmental descriptors the studies examined; however, these response variables were found to be non-significant or within neither audio nor visual domains.
3.1.2. Interventional Studies
Descriptions of the assessments of bimodal and interactive effects of audiovisual factors for each of the 16 interventional studies are outlined in Table 2, as followed similarly to Table 1 for the observational studies. These laboratory experiments were crossover studies where each study subject was assigned into or “crossed over” multiple treatment phases introduced by researchers [39] and carried out under certain experimental conditions. Such conditions were manipulated for reproducing the target indoor environments by utilizing immersive VR (Virtual Reality) simulations, constructing physical models (e.g., experimental rooms, test chamber), or using digital audio and visual-playback systems. Similar to the observational studies, most of these interventional studies relied on survey questionnaires using collecting occupants’ subjective perceptions and psychological responses. In addition to the subjective psychological measures, some of the studies used a series of cognitive tests to evaluate participants’ task performances while they were exposed to the test environments. Measures of such a cognitive task-performance include scores of assigned tasks accounting for performance accuracy [55,64,66] and response/reaction time [60,65]. Furthermore, one examined real-time physiological indicators, including systolic pressure, diastolic pressure, and heart rate [66]. The number of samples ranged from 10 to 215, and most of the participants were recruited subjects or students from universities/institutions where the studies were conducted.
In Table 2, the noise annoyance variable was found as the most promising descriptor that was remarkably influenced by audiovisual or visual predictors [56,57,58,62,63,68]. The variable was measured on either 7-point verbal or 11-point numerical scales. As expected from the observational studies results, significant impacts of greenery views on annoyance responses due to noise were found; however, the direction of such significant impacts on the annoyance variable was opposite from the positive path. There is a contradictory result of the greenery effects on noise annoyance reduction reported in the laboratory studies. Chau et al. found that mountain greenery close-by view could enhance noise annoyance [56]. Their recent study confirmed the same result, although such an annoyance enhancement may not be significant with a tree clump view [58]. Also, Sun et al. reported that green elements’ visibility increased noise annoyance for people with good auditory acuity but being easily distracted by incongruent visual stimuli (i.e., vision-dominated persons) [68]. For those with non-visual dominancy, there was nearly no effect of visibility of greenery on noise annoyance responses. Without this interaction term with greenery visibility, these visions dominated participants were remarkably less annoyed than the other participants. These results are contrary to the observational studies where the greenery was a positive distraction moderating noise annoyance response. In contrast, under the same experimental setting, the positive effects of sea view on noise annoyance moderation were found [56,58], and this finding is in line with the observational settings. Although the negative effects of greenery on annoyance reduction are stated above, the positive impact of using greenish color on reducing perceived loudness was highlighted. Cudina et al. examined how perceived loudness responses differed by showing different color images used as hanging panels applied in the lecture classrooms [59]. They found that the pastel color combinations with prevailing green, blue, and grey color, having long reaction time, are more appropriate for soothing subjective loudness.
In contrast to the observational studies, various dependent variables were found as the descriptors significantly influenced by audio and/or visual factors beyond the classic “noise annoyance” variable in the interventional studies. Such descriptors include loudness due to traffic noise [55,59,62], visual pleasantness [55,67], cognitive task performance [60,64,65], restorativeness [58,64], and sensory disturbance [62,65]. For instance, the inclusion of the water features’ visual stimuli improved the perception of the (irrelevant) speech-masking effect; therefore, it improved the perception of the sound environment, compared to their corresponding water sounds alone [54]. The water feature is not only for the visual domain (e.g., sea/river viewing) but also for the audio domain too (e.g., the sound of ocean waves, flowing water). The potential benefit of the water audio feature to improve other psychological responses were highlighted. Ma and Shu found that water restoration was significantly better than air-conditioner noise regardless of visual scene type [66]. Yang et al. revealed the types of sound did affect relaxation such that the highest mean relaxation was found for ambient sound type, followed by music/water, and then babble/fan [69].
The impacts of audio and visual factors on cognitive task-performance were examined. Liebl et al. found that participants reported their performance better when background speech of low intelligibility was combined with static lighting; although, their error rates in the performance tests did not significantly change [65]. Similarly, Evered et al. found that the auditory stimulation did not improve the visual-task performance of cell interpretations [60]. In contrast, Jo et al. found an interactive audiovisual trend on work performance, such that the lower the background noise, the greater effect of partition installation on work performance, whereas the larger the background noise, the smaller the partition effect would be [64]. However, this result was descriptive only (i.e., no inferential statistical analysis was conducted). A set of physiological indicators were examined in Ma and Shu [66]; however, none of the audiovisual effects (types of the sound source and visual image) on the physiological responses (i.e., blood pressure, heart rate) were significant. According to significant audiovisual interactive factors, the majority of these interactions were products of the following: the presence of greenery, types of sound stimuli, sound pressure levels, visibility of a particular source, and types of visual elements (including color type, lighting type).
In Table 2, some interventional studies adjusted for socio-demographical variables (mainly personal or demographic characteristics such as age or gender) in their statistical analyses. This adjustment was less common than the observational studies because a sample collection in the interventional studies has already balanced the distributions of the participants’ demographical and social background.
All the interventional studies specified their experimental situations in great detail as they can be greatly diverse. The studies investigating residential indoors selected living rooms at home as their experimental settings and asked the participants to relax as if they had time at home [55,56,57,58,62,63,68]. This choice would be because a living room could be the most representative residential space at home. The studies focusing on office spaces generally instructed participants to imagine that they were working or resting after their work in the simulated environments [54,61] or actually instructed them to perform pre-designated tasks (e.g., calculation tasks) [66,67]. Visual stimuli were controlled and observed under specified conditions, such as perceived through windows of a given space (i.e., images or videos were projected onto artificial or actual window panels to simulate the situation) [55,56,57,58,61,67,68], perceived through a view in a given space (e.g., animation were projected on the screen/display or shown in the VR) [54,62,63,64,66], or perceived by being under the set-up condition (e.g., different lighting or illuminance conditions were given in a mock-up space) [65,69]. These different conditions would partly determine whether the visual factors were either outdoor or indoor environments or interior components. Most of the examined visual factors experienced through the window panels were outside environmental scenes (sound source visibility [55]; greenery, sea, road views [56,58]; building views [57]; greenery presence [68]). Two studies used views of both indoor and outdoor environments (open plane office and urban nature environments [61]; lounge and park sceneries [67]). For those giving the visual stimuli perceived through the point of view in the given space, their visual factors were considered indoor environments (living room views [62,63]; office-space views [66]). The other visual factors (i.e., water-feature animations [54]; color pictures and hanging art paintings [59]; partition height [64]; lighting and illuminance conditions [65,69]) were considered as interior components because they can be changed indoors by the end-users.
Taken as a whole, the contexts of the experimental conditions and the visual factors vary greatly in the individual interventional studies. Thus, their findings may not be comparable between the studies. Although the interventional studies for the residential indoors utilized the similar contextual settings used in some of the observational studies [45,46,47,48,53], some of their conclusions were substantially contradictory, which may suggest that the contradictory effect of the greenery factors on noise annoyance would not be due to those contextual settings. As compared with the remark that most of the visual factors in the observational studies were outdoor environments, a contextual variety of visual components examined in these experimental studies (i.e., indoor/outdoor environments and interior components) would provide more practical and various approaches for indoor soundscape improvements.
To summarize, the 16 interventional studies included in this review examined various human perceptions such as the commonest “noise annoyance” variable, other audio and visual perceptions, psychological/physiological responses, as well as task performance responses, influenced by audio, visual, and/or audiovisual factors in the indoor environments. While the positive effects of greenery view on noise annoyance moderation were found in the observational settings, the opposite result was found in the experimental laboratory studies. However, the positive effect of water features on the reduction in the noise annoyance response was found to be in line with the observational findings. This result may imply the contradictory effect of the greenery factors on annoyance between short-time and long-term noise exposure. Also, the water feature might consistently present a positive effect on noise annoyance reduction. Moreover, other soundscapes and environmental descriptors were also examined and significantly affected by interactive audiovisual factors, which were not found in the observational studies. Such audiovisual factors were most varied with sound levels, types of the sound source and visual elements, and levels of visibility.
As a result of this systematic review, a general understanding of associations between visual indicators and audio descriptors and various attempts of improving human perceptions related to sound environments by changing (e.g., adding/removing) visual and audiovisual features were highlighted. The assessment of the existing literature’s research methods and procedures reveals potential approaches that can be referred to in future research. The identified visual indicators for soundscape assessments in this review are now utilized to develop a sustainable framework for designing the indoor soundscape.
3.2. Indicators’ Identifications for Audiovisual Effects
All the significant indicators found in both observational and interventional studies are further summarized. As noise annoyance descriptor was the most common soundscape dimension significantly influenced by the visual and audiovisual indicators (as shown in Table 1 and Table 2), those significant indicators were compiled by their categories (types of visual factors), parameters (measures of the factors), the direction of their effects (i.e., enhance, moderate, or alter noise annoyance responses) for each of the observational and interventional studies. This process highlights the evidence for the connection between auditory and visual exposure and noise annoyance indoors as well as the most important audiovisual factors for assessing the annoyance.
Those indicators predicting other human perceptions such as loudness, pleasantness, or other perceptual responses were qualitatively summarized by listing-up them according to their domains as these perceptions have not been thoroughly examined yet. Note that a single research paper may have reported multiple significant indicators as they examined multiple different prediction models for human perceptions; however, most of the variables for each category are from single studies. For more information, refer to Table 1 and Table 2.
The visual-solo and audiovisual–interactive indicators for noise annoyance responses identified in this study are shown in Table 3.
Six and three categories were identified for solo and interactive indicators, respectively (i.e., six solo-indicator categories: greenery, waterbody, other visual elements, physical property, visual information, visual dominated personality, and three interactive-indicator categories: multiple-visual, audiovisual, personal–environmental interactions). Among those indicators, the greenery factor was the most common indicator for noise annoyance response, followed by waterbody features. This finding indicates that the greenery factor is the most promising variable that would alter noise annoyance response. Within the visual-environmental elements (e.g., greenery, waterbody), subjective (self-reported or perceived measures) and objective (physical measures or indices) parameters were commonly used to predict noise annoyance responses. Subjective parameters were perception ratings based on personal judgment/feelings, influenced by subject biases. In contrast, objective parameters are based on observational measurements, unbiased by subject. Within those parameters, the amount of the greenery element (both objective and perceived amount) is the one that was the most frequently predicted noise annoyance response. Although some previous literature pointed out little agreement between perceived (subjective) and objective greenery measures [70], the positive effects of the amount of greenery elements derived from both objective and subjective parameters on noise annoyance reduction were supported in the observational studies. Therefore, this directional parameter (i.e., the parameter supported based on more informed reasoning of the past research) is suggested as the prominent variable that should be consistently considered in future studies. The investigation of the other potential parameters should be suggested for seeking their potential use in developing sustainable sound environments.
The direction of the greenery effect differed by the type of the study designs. Namely, all the observational studies found that “the more greenery, the less annoyance,” whereas the opposite direction was found in the interventional studies, as indicated by the individual studies’ reviews in the previous section. The contradiction of the greenery effects on noise annoyance response may result from the two different experimental settings: in-situ observational and laboratory-based interventional settings. Based on the review of the selected literature, the former setting is an uncontrolled environment where living subjects (i.e., residents) are exposed to target conditions for a long time (i.e., long-term sensory exposure). In contrast, the latter is a controlled setting environment where recruited subjects are exposed to target conditions for a certain period (mostly short-time impacts/reactions). Considering the nature of these two study designs or settings, the greenery effect’s direction would be potentially altered by either or both impacts—status of the environmental control and time duration of the sensory exposure. If the greenery effect on annoyance response has contradictory results between short-time and long-term noise exposure, its positive effect can be considered a long-term impact, whereas its negative effect can be considered short-term impacts. The authors could not conclude that the contradiction of the greenery effects on noise annoyance response certainly results from two different exposure periods since only two laboratory-based interventional studies show such a contradiction. Therefore, further validation studies would be required. Specifically, different impacts of short- and long-term exposures to greenery features on noise annoyance should be considered for prospective studies.
The consistent effect of water bodies and other visual elements was found in observational and interventional study designs. Namely, in contrast to the effect of the greenery factor, the positive effect of the water view, and the negative impacts of traffic road and noise barriers on noise annoyance moderation were identified. Both subjective and objective parameters were employed to measure those visual factors to predict noise annoyance responses. Although the number of studies revealing the effects of those environmental features is not sufficient, the potentials of their impacts on soundscape perceptions for the indoor environments were highlighted. Furthermore, there are a few significant interactions between multiple visual elements, and the presence of positive and negative visual factors (e.g., noise barrier waterbody) would influence noise annoyance perceptions. However, these interactive effects are somewhat ambiguous. Therefore, the appraisal of the variety of visual components and interactions beyond the greenery elements should be suggested for future research.
The effects of other visual factors, including the physical property and the use of visual information in VR experiments, were highlighted as the potential factor related to noise annoyance responses. It was noted that physical properties such as building-separation distances and physical environmental properties including accessibility, presence of naturalness (e.g., flowers in pots, garden furniture, and playground) might not be fully characterized as visual elements, but very apparent visual differences were observed by the change of these physical properties. Chung et al. found that separation distance and building spacing were inversely related to perceived oppressiveness and noise annoyance [57]. Although the order of the perceived responses due to the physical properties’ change seems yet unclear, at least, certain indirect impacts of the visual changes related to physical environmental features on noise annoyance responses are suggested. Additionally, it was found that the presence of the visual information, as well as visibility of sound sources, would moderate perceived noise annoyance as the informative recognition of the auditory or visual sources would help subjects to distract their attention away from audio stimuli (mostly annoying sounds or noises). Jeon and Jo concluded that the increase in noise-source recognition by providing the visual information was due to the increase in the dependency on visual information so that it reacts insensitively to the change of the noise sources (in this case, the road traffic noise) [62]. Thus, by providing visual information either using the head-mounted display (HMD) or increasing the noise source visibility, humans may pay more attention to the visual elements rather than the change of acoustical characteristics and depend more on visual information in indoor environments. Moreover, some interactions using visual information or greenery visibility were identified as significant factors influencing noise annoyance responses. However, again the impacts of these interaction terms are yet inconclusive. Hence, the effects of the visual factors related to physical environmental changes and the presence of visual information and their interactions with audio variables should be further examined in future studies.
Nevertheless, the framework of soundscape assessment utilizing visual and audiovisual indicators, as shown in Table 3, has been proposed for designing better indoor auditory environments. The greenery factor was found as the most promising variable that alters noise annoyance response, and the amount of the greenery element measured by objective and subjective parameters is the one that was most frequently predicted the noise annoyance response. The proposed framework also highlights that the greenery effect’s direction differs, which may be due to the different experimental settings. The effects of other visual elements such as the views of a waterbody, traffic road, noise barrier, and other visual factors including the physical property and the use of visual information would also be suggested as the potential indicators influencing noise annoyance responses. However, the amount of the previous investigations is yet insufficient, and more appraisals of the variety of visual factors and their interactions should be examined for future references.
Table 4 shows a summary of the significant indicators for human perceptions related to indoor soundscape experiences other than noise annoyance responses, including the perceptions of the auditory (e.g., loudness, noise allowance, noise disturbance), visual (e.g., lighting disturbance, visual pleasantness, relaxation), cognitive (e.g., attitude, awareness of noise issue, task performance), and emotional (e.g., tension, fatigue, restorativeness) standpoints.
In contrast to the theoretical indicators for noise annoyance responses, as shown in Table 3 above, the majority of the significant indicators altering these human perceptions are interactive audiovisual terms (e.g., the interaction between sound type and visual image), and most of them were found under the controlled laboratory settings (i.e., the interventional studies). As the contexts of the experimental settings and the indicators very differ in the individual interventional studies, from residential space to office space as well as from sound type to illuminance level of lighting, various types of response variables are suggested as potential descriptors on which the audio, visual, and audiovisual factors influenced. There is only one greenery indicator, perceived availability of greenery, for predicting awareness of noise as a neighbor’s issue [43]. Furthermore, the presence of the visual information or stimuli and the visibility of sound sources would potentially influence audio-related perceptions and noise annoyance responses highlighted in Table 3. This finding suggests that the visual information’s cognitive perception and its knowledge would still work as a tool of the attention distraction or interference altering those auditory perceptions. Moreover, rather than the type of the visual elements including greenery (e.g., mountain greenery and tree clumps views [58]) and water bodies (e.g., sea, river, and both sea and river views [45]), the type of the sound sources was identified as one of the common indicators that would interactively work with visual factors, and influence the perceptions of all the four aspects: audio, visual, cognitive, and emotional perceptions. Jajncke et al. tested the effects of the interaction between four auditive stimuli (nature sound, quiet, broadband noise, office noise) and two visual stimuli (open-plan office, urban nature environment) on perceived restorative qualities of the settings [61]. Although they found the audio and visual stimuli interacted for all the measures, the environmental sounds had more restorative qualities. However, they pointed out that some of the audiovisual combinations may be experienced as incongruent and unrealistic (e.g., the nature view with broadband noise); thus, some stimulated settings may not have the same potential to promote restoration [61]. As shown in Table 4, other bimodal and interactive effects on the human perceptions related to soundscape perceptions are revealed in this review, such as the impacts of the interaction between speech intelligibility and lighting conditions on visual and cognitive perceptions. However, the impacts of these factors are still inconclusive because of the insufficient number of studies. Thus, further investigations are required. In arranging future evaluations, these variables should be considered as potential indicators and descriptors for designing better soundscape experiences and indoor environments.
4. Discussion
This study systematically reviewed the existing research papers involving audiovisual bimodal and interactive effects on soundscape evaluations and identified potential indicators on soundscape perceptual responses in the indoor settings. A total of 30 studies were reviewed and summarized in terms of their characteristics, including study designs, methodologies, analytical models and variables, main findings, and effect types. The contextual differences, including the functions of the examined indoor spaces, the context of the target visual factors (i.e., indoor, outdoor, or interior components), and the observation condition (e.g., the point of view of the evaluations) were also discussed. Overall, most of the visual factors examined were outdoor environments, while their contexts were greatly diverse. The residential spaces’ evaluations typically reflected the function of general living spaces for residents, and a living room was commonly selected as it would be the most representative space reflecting this function. The majority of their findings were the positive effects of visual factors on noise annoyance moderation in the indoor residential spaces, expecting annoyance-free soundscapes. The studies focusing on office spaces examined the conditions where people worked or had a break in their works. Thus, the expectations of this space would be more complex. In addition to the window views of the outdoor environments, some interior components (e.g., water fountain, partitions, lightings) are suggested for improving soundscapes in the office spaces, which can be more practical as they would be adjustable by office workers (i.e., users). The findings of these studies include the positive audiovisual interactive impacts on the perceived restrictiveness, relaxation, and pleasantness, expecting fatigue-free soundscapes, and the task performance, enhancing workers’ achievements on their jobs.
The framework for designing a sustainable indoor soundscape has been proposed by the selected reviews, which further suggests the assessment schemes of the indoor soundscapes concerning audio, visual, and/or audiovisual factors for designing the sustainable sound environments. The two research questions were successfully answered as followed.
4.1. First Research Question: What Kind of Evidence Is There for the Connection between Audio, Visual, and Audiovisual Combined Factors and Perceptual Dimensions Affected the Most?
The perceptual dimension “noise annoyance” was the one that has been often researched as well as affected by audio and visual factors the most in the indoor environments. Six solo-indicator categories and three interactive-indicator categories were identified as potential factors influencing noise annoyance responses. The parameters and directions of their impacts were highlighted for each of the indicators. Overall, the positive effects of the greenery and water views on the noise annoyance moderation were found, whereas their negative effects of the traffic road and noise barrier were also noted. However, the contradictory effect of the greenery factors on noise annoyance reduction was identified as its positive impact may not be valid under controlled experimental settings. Additionally, the improvement of the physical properties and presence of sound sources’ visual information generally moderate perceived noise annoyance as those informative visual contexts would act as positive distractions that enable humans’ attention to be away from negative soundscape responses. Furthermore, the significant interactions using the combination of those indicators and/or other potential audiovisual factors influence noise annoyance responses. Nonetheless, the directions of the interactive effects are yet un-stabilized and inconclusive.
Based on the selected literature reviews, the greenery factor was found to be the most promising variable, followed by the water features, which generally moderate noise annoyance perceived by occupants in given indoor environments. The amount of those visual elements measured by objective and subjective parameters frequently predicted the noise annoyance response. As the greenery and water factors identified in this review are generally outdoor landscape components either perceived from indoors or observed in the neighborhood spaces, they should be considered and designed by urban city designers or landscape planners.
Although there are both bimodal and interactive audiovisual effects on noise annoyance in the indoor environments found in this review, the former effect was often found in the observational studies. In contrast, both bimodal and interactive effects were extensively examined in the interventional studies, as presented in Table 1 and Table 2. This consequence may be because field or in-situ studies would not have effective control on the audiovisual variables; in contrast, the laboratory experiments have much control for these interactive variables. As more bimodality of the greenery effects on noise annoyance was theoretically evidenced compared to their interactivity in this study, further investigations of the audiovisual interactive effects, utilizing valid measures of the interaction factors, would be required, preferably in some in-situ study designs.
4.2. Second Research Question: Which Audio and Visual Factors Would Most Contribute to the Bimodal and Interactive Impacts on Perceptual Dimensions Related to Soundscapes?
Although the greenery indicator was the most evidenced in its bimodal impact on the noise annoyance response, as discussed above, its interactive effects seem still minor. Regarding the interactivity of audiovisual factors, the combination of the physical properties and presence of the visual information and/or other potential audiovisual factors would moderate perceived noise annoyance and influence other audio and visual-related perceptions. The sound sources were primarily found as one of the most probable indicators that would interactively work with visual factors and influence the perceptions of all the four perceptual domains—audio, visual, cognitive, and emotional domains. Thus, researchers should bear in mind that selecting the type of sound sources (e.g., masking or background sounds) would significantly impact the multiple perceptual responses related to the overall soundscape experiences when certain visual factors are interactively involved within. Acoustic experts or consultants may consider a proper selection of the indoor sound sources or other interior components related to sounds and provide suitable recommendations to designers or end users for promoting sound environments. In contrast to the noise annoyance response that was frequently influenced by the greenery factor’s bimodality, other perceptual responses such as loudness, visual pleasantness, and restorativeness perceptions tended to be influenced by both bimodality and interactivity of the audiovisual factors. With regards to these perceptions, the bimodality of the audio or visual factors seems to be more apparent in audio and visual perceptions; whereas, the interactivity of the audiovisual factors can be seen more in perceptions of the multiple domains, including cognitive and emotional ones. Such results would provide useful insight into the practical implementations of the soundscape design. Considering the bimodality and interactivity of the audiovisual components, one can utilize auditory stimuli’ bimodality influencing visual perception and vice versa. In contrast, the audiovisual stimuli’ interactivity may be more suitable when changing the perceptions of multiple domains, including non-auditory ones. Although unimodal effects on soundscapes (e.g., the effect of acoustic stimuli on audio perceptions) have been more evident than bimodal and interactive effects, the change of the unimodality may only give limited solutions in practice. As accounting for the bimodality as well as interactivity, the number of the possible solutions would be factorial since more factors are involved. However, as pointed out by the previous study [61], some combinations of the audiovisual factors would be experienced as incongruent and unrealistic stimuli. Furthermore, the choice of the most suitable and feasible implementations, as well as management of those budgets, should be rigorously handled.
Taken as a whole, instead of reducing unfavorable auditory stimuli (e.g., noise levels), the proposed framework highlights the improvement of the occupants’ indoor soundscape experiences by adding those non-auditory, in particular, visual factors, which opens up more possibilities and versatilities of their application for designing indoor sound environments in more sustainable ways.
4.3. Limitations
Given this study’s exploratory nature, a note of caution is pertinent regarding the interpretation of the different measurements, scale formats, study focus, and other contextual information of the included studies in the review. Although the individual studies present different remarks and significant evidence resolving this study’s research questions, some of their measurements and designs of research procedures substantially differed. Therefore, the effects of the different studies’ target factors may not be fully and quantitatively comparable. However, this study’s goal was to develop the indoor soundscape framework involving audiovisual bimodal and interactive impacts by using the qualitative approach, not statistical or quantitative approaches such as meta-analysis.
The inclusion of the conference papers (i.e., grey literature) in this review may lead to some uncertainties of their studies’ quality as they were not peer-reviewed. Because of the nature of grey literature (e.g., limited descriptions of the procedures, partial completions of the studies), it may be difficult to ensure their studies’ reproducibility and validity. Although the authors were aware of those potential problems, the exclusion of the conference papers would cause the lack of some relevant works as well as the bias due to the selectivity of the publication types, which may cause non-objective answers to the research questions. Furthermore, of the four non-peer-reviewed papers included in this study [41,45,52,64], two of the papers were published with the last two years [41,64], assuming that there may be a time lag between actual research and journal publication.
5. Conclusions
In this review, we aimed to provide the framework for designing sustainable indoor soundscapes by addressing two research questions that have explored (1) existing evidence for the connection between audio, visual, and combined audiovisual factors and perceptual dimensions that are affected the most, and (2) audio and visual factors that would most contribute their bimodal and interactive impacts on the perceptual dimensions related to soundscapes. To achieve this aim, a systematic review was conducted using PRISMA guidelines. A total of 30 publications were included in this qualitative review work after the screening process.
With regards to the first research question stated above, the main conclusions of this review are:
- Indoor soundscape studies have most frequently researched noise annoyance;
- Significant audiovisual impacts on noise annoyance were found;
- The positive effects of the greenery and water views on the noise annoyance moderation were found;
- The amount of the visual elements measured by objective and subjective parameters frequently predicted the noise annoyance response;
- The contradictory effect of the greenery factors on noise annoyance reduction was confirmed in some controlled experimental setting, which may come from different noise-exposure periods;
- The informative visual contexts would act as positive distractions that generally moderate perceived noise annoyance.
With regards to the second research question, the main conclusions of this review are:
- Greenery indicator was the most evidenced in its bimodal impact whereas its interactivity with audio indicator seems yet minor;
- Type of the sound sources was the most probable indicator that would interactively work with visual factors, and influence the multiple perceptual responses;
- The bimodality of the audio or visual factors seems to be more apparent in audio and visual perceptions;
- Acoustic experts and consultants should be aware of the impact of the visual factors that would interactively enhance positive soundscape experiences.
Nevertheless, various potential indicators, including other non-greenery visual factors and their interactive terms for predicting audio, visual, cognitive, and emotional perceptions, were identified. Although those human perceptions comprehensively constitute the overall indoor soundscape experiences, they have not yet been thoroughly examined compared to the noise annoyance response; thus, the assessments of a variety of visual factors beyond greenery indicators and noise annoyance descriptors should be required.
Like sound environments are perceived or experienced by humans in context (i.e., soundscape) [1], their contexts also perceive visual factors, not just by means of their colors, shapes, or brightness levels, but also the harmonic, aesthetic, or attractive inferences of the visual elements. People may tend to believe that “the more greenery, the better”; however, the process of their perceptional responses might be complex under some controlled settings or the interactive involvement of other potential indicators; thus, unbiased considerations and assessments of the visual factors are required for the future studies.
Author Contributions
Conceptualization, all the authors; methodology and analysis, Y.H.; writing—original draft preparation, Y.H.; writing—review and editing, all the authors.; funding acquisition, S.-K.L. All authors have read and agreed to the published version of the manuscript.
Funding
This research was funded by the Ministry of Education (MOE), Singapore, under its Academic Research Fund Tier 2 (MOE2018-T2-1-105).
Acknowledgments
The authors wish to thank the anonymous reviewers for their comments and input.
Conflicts of Interest
The authors declare no conflict of interest.
Appendix A

Table A1.
Literature Review Database Search Strategy.
| In Scopus (search go through Title, Abstract, and Keywords) |
| ((TITLE-ABS-KEY(Audio-visual OR audiovisual OR ((audi* OR sound OR noise) AND (visual* OR view* OR vision)))) AND (TITLE-ABS-KEY (soundscape OR ((percept* OR perceived OR (self* AND (report* OR evaluat*)) AND (((environmental* OR community*) AND (noise* OR sound*)) OR ((traffic* OR airport* OR aircraft* OR railway* OR transportation* OR train* OR neighborhood* OR resident* OR classroom* OR school* OR hospital* OR motor* OR vehicle* OR motorcycle* OR construction* OR social*) AND noise*)))))) AND (TITLE-ABS-KEY (indoor* OR inside* OR within* OR “at home” OR “living room” OR “in house” OR “at dwelling” OR office OR classroom OR school OR hospital OR buil* OR room))) |
| In Web of Science (search go through Title, Abstract, Author Keywords, Keywords Plus®) |
| ((TS=(Audio-visual OR audiovisual OR ((audi* OR sound OR noise) AND (visual* OR view* OR vision)))) AND (TS=(soundscape OR ((percept* OR perceived OR (self* AND (report* OR evaluat*)) AND (((environmental* OR community*) AND (noise* OR sound*)) OR ((traffic* OR airport* OR aircraft* OR railway* OR transportation* OR train* OR neighborhood* OR resident* OR classroom* OR school* OR hospital* OR motor* OR vehicle* OR motorcycle* OR construction* OR social*) AND noise*)))))) AND (TS=(indoor* OR inside* OR within* OR “at home” OR “living room” OR “in house” OR “at dwelling” OR office OR classroom OR school OR hospital OR buil* OR room))) |
| In PubMed (search go through Title, Abstract, Other Abstract, Keywords) |
| (((Audio-visual[Title/Abstract] OR audiovisual[Title/Abstract] OR ((audi*[Title/Abstract] OR sound[Title/Abstract] OR noise[Title/Abstract]) AND (visual*[Title/Abstract] OR view*[Title/Abstract] OR vision[Title/Abstract])))) AND ((soundscape[Title/Abstract] OR ((percept*[Title/Abstract] OR perceived[Title/Abstract] OR (self*[Title/Abstract] AND (report*[Title/Abstract] OR evaluat*[Title/Abstract])) AND (((environmental*[Title/Abstract] OR community*[Title/Abstract]) AND (noise*[Title/Abstract] OR sound*[Title/Abstract])) OR ((traffic*[Title/Abstract] OR airport*[Title/Abstract] OR aircraft*[Title/Abstract] OR railway*[Title/Abstract] OR transportation*[Title/Abstract] OR train*[Title/Abstract] OR neighborhood*[Title/Abstract] OR resident*[Title/Abstract] OR classroom*[Title/Abstract] OR school*[Title/Abstract] OR hospital*[Title/Abstract] OR motor*[Title/Abstract] OR vehicle*[Title/Abstract] OR motorcycle*[Title/Abstract] OR construction*[Title/Abstract] OR social*[Title/Abstract]) AND noise*[Title/Abstract])))))) AND ((indoor*[Title/Abstract] OR inside*[Title/Abstract] OR within*[Title/Abstract] OR “at home”[Title/Abstract] OR “living room”[Title/Abstract] OR “in house”[Title/Abstract] OR “at dwelling”[Title/Abstract] OR office[Title/Abstract] OR classroom[Title/Abstract] OR school[Title/Abstract] OR hospital[Title/Abstract] OR buil*[Title/Abstract] OR room[Title/Abstract]))) |
Figure A1.
PRISMA flow diagram (extended).

References
- ISO. BS ISO 12913-1:2014—Acoustics—Soundscape Part. 1: Definition and Conceptual Framework; ISO: Geneva, Switzerland, 2014. [Google Scholar]
- Kang, J.; Aletta, F.; Gjestland, T.T.; Brown, L.A.; Botteldooren, D.; Schulte-Fortkamp, B.; Lercher, P.; van Kamp, I.; Genuit, K.; Fiebig, A.; et al. Ten questions on the soundscapes of the built environment. Build. Environ. 2016, 108, 284–294. [Google Scholar] [CrossRef] [Green Version]
- Brown, L.A. A review of progress in soundscapes and an approach to soundscape planning. Int. J. Acoust. Vib. 2012, 17, 73–81. [Google Scholar]
- Aletta, F.; Astolfi, A. Soundscapes of buildings and built environments. Build. Acoust. 2018, 25, 195–197. [Google Scholar] [CrossRef] [Green Version]
- Dokmeci, P.N.; Kang, J. Classification of architectural spaces from the viewpoint of acoustic comfort. In Proceedings of the 39th International Congress and Exposition on Noise Control Engineering 2010, INTER-NOISE 2010, Lisbon, Portugal, 13–16 June 2010. [Google Scholar]
- Markiewicz, D. Today’s indoor generation: Home IAQ assessments present challenges. Chilton’s Ind. Saf. Hyg. News 2018, 52, 8. [Google Scholar]
- Torresin, S.; Albatici, R.; Aletta, F.; Babich, F.; Kang, J. Assessment methods and factors determining positive indoor soundscapes in residential buildings: A systematic review. Sustainability 2019, 11, 5290. [Google Scholar] [CrossRef] [Green Version]
- Botteldooren, D.; Andringa, T.; Aspuru, I.; Brown, A.L.; Dubois, D.; Guastavino, C.; Kang, J.; Lavandier, C.; Nilsson, M.; Preis, A.; et al. From sonic environment to soundscape. In Soundscape and the Built Environment; Kang, J., Schulte-Fortkamp, B., Eds.; CRC Press: Boca Raton, FL, USA, 2016; pp. 17–41. [Google Scholar]
- Recanzone, G.H. Interactions of Auditory and Visual Stimuli in Space and Time. Hear. Res. 2009, 258, 89–99. [Google Scholar] [CrossRef] [PubMed] [Green Version]
- Bulkin, D.A.; Groh, J.M. Seeing sounds: Visual and auditory interactions in the brain. Curr. Opin. Neurol. 2006, 16, 415–419. [Google Scholar] [CrossRef]
- Li, H.; Lau, S.K. A review of audio-visual interaction on soundscape assessment in urban built environments. Appl. Acoust. 2020, 166, 107372. [Google Scholar] [CrossRef]
- Dzhambov, A.M.; Dimitrova, D.D. Urban green spaces’ effectiveness as a psychological buffer for the negative health impact of noise pollution: A systematic review. Noise Health 2014, 16, 157–165. [Google Scholar] [CrossRef]
- Vardaxis, N.G.; Bard, D.; Waye, K.P. Review of acoustic comfort evaluation in dwellings—part I: Associations of acoustic field data to subjective responses from building surveys. Build. Acoust. 2018, 25, 151–170. [Google Scholar] [CrossRef] [Green Version]
- Iyendo, T.O. Sound as a supportive design intervention for improving health care experience in the clinical ecosystem: A qualitative study. Complement. Ther. Clin. Pract. 2017, 29, 58–96. [Google Scholar] [CrossRef] [PubMed]
- Frontczak, M.; Wargocki, P. Literature survey on how different factors influence human comfort in indoor environments. Build. Environ. 2011, 46, 922–937. [Google Scholar] [CrossRef]
- Dzhambov, A.M. More residential greenspace is associated with lower noise annoyance: Results from a quantitative synthesis of the literature. In Traffic Noise: Exposure, Health Effects and Mitigation; Łucjan, C., Gérard, D., Eds.; Nova Science Publishers: New York, NY, USA, 2017; pp. 77–104. [Google Scholar]
- Aletta, F.; Oberman, T.; Kang, J. Associations between positive health-related effects and soundscapes perceptual constructs: A systematic review. Int. J. Environ. Res. Public Health 2018, 15, 2392. [Google Scholar] [CrossRef] [Green Version]
- van Kamp, I.; van den Berg, F. Health effects related to wind turbine sound, including low-frequency sound and infrasound. Acoust. Aust. 2018, 46, 31–57. [Google Scholar] [CrossRef] [Green Version]
- Erfanian, M.; Mitchell, A.J.; Kang, J.; Aletta, F. The psychophysiological implications of soundscape: A systematic review of empirical literature and a research agenda. Int. J. Environ. Res. Public Health 2019, 16, 3533. [Google Scholar] [CrossRef] [PubMed] [Green Version]
- Engel, M.S.; Fiebig, A.; Pfaffenbach, C.; Fels, J. A review of socio-acoustic surveys for soundscape studies. Curr. Pollut. Rep. 2018, 4, 220–239. [Google Scholar] [CrossRef]
- Lionello, M.; Aletta, F.; Kang, J. A systematic review of prediction models for the experience of urban soundscapes. Appl. Acoust. 2020, 170, 107479. [Google Scholar] [CrossRef]
- Torresin, S.; Pernigotto, G.; Cappelletti, F.; Gasparella, A. Combined effects of environmental factors on human perception and objective performance: A review of experimental laboratory works. Indoor Air 2018, 28, 525–538. [Google Scholar] [CrossRef]
- Aburawis, A.A.M.; Yorukoglu, P.N.D. An integrated framework on soundscape perception and spatial experience by adapting post-occupancy evaluation methodology. Build. Acoust. 2018, 25, 3–16. [Google Scholar] [CrossRef] [Green Version]
- Bild, E.; Coler, M.; Pfeffer, K.; Bertolini, L. Considering sound in planning and designing public spaces: A review of theory and applications and a proposed framework for integrating research and practice. J. Plan. Lit. 2016, 31, 419–434. [Google Scholar] [CrossRef] [Green Version]
- Brambilla, G.; Verardi, P. Soundscape in urban parks and wilderness areas: A review of studies in Italy. In Proceedings of the 38th International Congress and Exposition on Noise Control Engineering 2009, INTER-NOISE 2009, Ottawa, ON, Canada, 23–26 August 2009. [Google Scholar]
- Brown, A.L.; Kang, J.; Gjestland, T. Towards standardization in soundscape preference assessment. Appl. Acoust. 2011, 72, 387–392. [Google Scholar] [CrossRef]
- Chung, W.L.; To, W.M. Identification of a city’s soundscape using soundwalks. Tech. Acoust. 2016, 35, 500–503. [Google Scholar]
- Dokmeci, P.N.; Kang, J. Objective parameters for acoustic comfort in enclosed spaces. In Proceedings of the 20th International Congress on Acoustics 2010 Conference, ICA 2010, Sydney, Australia, 23–27 August 2010. [Google Scholar]
- Herranz-Pascual, K.; Aspuru, I.; García, I. Proposed conceptual model of environmental experience as framework to study the soundscape. In Proceedings of the 39th International Congress and Exposition on Noise Control Engineering 2010, INTER-NOISE 2010, Lisbon, Portugal, 13–16 June 2010. [Google Scholar]
- Kang, J. From understanding to designing soundscapes. Front. Archit. Civ. Eng. China 2010, 4, 403–417. [Google Scholar] [CrossRef]
- Miller, N.P. US national parks and management of park soundscapes: A review. Appl. Acoust. 2008, 69, 77–92. [Google Scholar] [CrossRef]
- Ng, C.F. Living and working in tall buildings: Satisfaction and perceived benefits and concerns of occupants. Front. Built Environ. 2017, 3, 70. [Google Scholar] [CrossRef] [Green Version]
- Pijanowski, B.C.; Farina, A.; Gage, S.H.; Dumyahn, S.L.; Krause, B.L. What is soundscape ecology? An introduction and overview of an emerging new science. Landsc. Ecol. 2011, 26, 1213–1232. [Google Scholar] [CrossRef]
- van Renterghem, T. Towards explaining the positive effect of vegetation on the perception of environmental noise. Urban. For. Urban. Green. 2019, 40, 133–144. [Google Scholar] [CrossRef]
- Ercakmak, U.B.; Dokmeci Yorukogku, P.N. The role of indoor soundscape methodology. In Proceedings of the 23rd International Congress on Acoustics 2019 Conference, ICA 2019, Aachen, Germany, 9–13 September 2019. [Google Scholar]
- Murphy, E.; King, E.A. Strategic environmental noise mapping: Methodological issues concerning the implementation of the EU Environmental Noise Directive and their policy implications. Environ. Int. 2010, 36, 290–298. [Google Scholar] [CrossRef] [Green Version]
- Judd, C.M.; McClelland, G.H.; Ryan, C.S. Data Analysis: A Model. Comparison Approach to Regression, ANOVA, and Beyond, 3rd ed.; Taylor & Francis: London, UK, 2017; pp. 129–158. [Google Scholar]
- Liberati, A.; Altman, D.G.; Tetzlaff, J.; Mulrow, C.; Gøtzsche, P.C.; Ioannidis, J.P.A.; Clarke, M.; Devereaux, P.J.; Kleijnen, J.; Moher, D. The PRISMA statement for reporting systematic reviews and meta-analyses of studies that evaluate health care interventions: Explanation and elaboration. PLoS Med. 2009, 6, e1000100. [Google Scholar] [CrossRef]
- Thiese, M.S. Observational and interventional study design types; an overview. Biochem. Med. 2014, 24, 199–210. [Google Scholar] [CrossRef]
- Bodin, T.; Björk, J.; Ardö, J.; Albin, M. Annoyance, sleep and concentration problems due to combined traffic noise and the benefit of quiet side. Int. J. Environ. Res. Public Health 2015, 12, 1612–1628. [Google Scholar] [CrossRef] [PubMed]
- Dzhambov, A.; Markevych, I.; Tilov, B.; Arabadzhiev, Z.; Stoyanov, D.; Gatseva, P.; Dimitrova, D.D. Association between objectively-measured greenspace and noise annoyance: Noise reduction and perceived greenspace as putative mediators. In Proceedings of the 11th European Congress and Exposition on Noise Control Engineering 2018, EURO-NOISE 2018, Crete, Greece, 27–31 May 2018. [Google Scholar]
- Dzhambov, A.M.; Dimitrova, D.D. Green spaces and environmental noise perception. Urban. For. Urban. Green. 2015, 14, 1000–1008. [Google Scholar] [CrossRef]
- Gidlöf-Gunnarsson, A.; Öhrström, E. Noise and well-being in urban residential environments: The potential role of perceived availability to nearby green areas. Landsc. Urban. Plann. 2007, 83, 115–126. [Google Scholar] [CrossRef]
- Gidlöf-Gunnarsson, A.; Öhrström, E. Attractive “quiet” courtyards: A potential modifier of urban residents’ responses to road traffic noise? Int. J. Environ. Res. Public Health 2010, 7, 3359–3375. [Google Scholar] [CrossRef] [Green Version]
- Leung, T.M.; Xu, J.M.; Chau, C.K.; Tang, S.K.; Pun-Cheng, L.S.C. On the study of effects of views to water space on noise annoyance perceptions at homes. In Proceedings of the 43rd International Congress and Exposition on Noise Control Engineering 2014, INTER-NOISE 2014, Melbourne, Australia, 16–19 November 2014. [Google Scholar]
- Leung, T.M.; Chau, C.K.; Tang, S.K.; Pun-Cheng, L.S.C. The effects of neighborhood views containing multiple environmental features on road traffic noise perception at dwellings. J. Acoust. Soc. Am. 2017, 141, 2399–2407. [Google Scholar] [CrossRef]
- Li, H.N.; Chau, C.K.; Tang, S.K. Can surrounding greenery reduce noise annoyance at home? Sci. Total Environ. 2010, 408, 4376–4384. [Google Scholar] [CrossRef]
- Li, H.N.; Chau, C.K.; Tse, M.S.; Tang, S.K. On the study of the effects of sea views, greenery views and personal characteristics on noise annoyance perception at homes. J. Acoust. Soc. Am. 2012, 131, 2131–2140. [Google Scholar] [CrossRef] [Green Version]
- Morihara, T.; Yano, T.; Nguyen, T.; Nguyen, H.; Nishimura, T.; Sato, T.; Hashimoto, Y. Impacts of residential and environmental factors on community responses to transportation noise in Vietnam. J. Temporal Des. Archit. Environ. 2011, 11, 57–60. [Google Scholar]
- Mueller, W.; Steinle, S.; Pärkkä, J.; Parmes, E.; Liedes, H.; Kuijpers, E.; Pronk, A.; Sarigiannis, D.; Karakitsios, S.; Chapizanis, D.; et al. Urban greenspace and the indoor environment: Pathways to health via indoor particulate matter, noise, and road noise annoyance. Environ. Res. 2020, 180, 108850. [Google Scholar] [CrossRef]
- Schäffer, B.; Brink, M.; Schlatter, F.; Vienneau, D.; Wunderli, J.M. Residential green is associated with reduced annoyance to road traffic and railway noise but increased annoyance to aircraft noise exposure. Environ. Int. 2020, 143, 105885. [Google Scholar] [CrossRef]
- Steffens, J.; Steele, D.; Guastavino, C. Music influences the perception of our acoustic and visual environment. In Proceedings of the 45th International Congress and Exposition on Noise Control Engineering 2016, INTER-NOISE 2016, Hamburg, Germany, 21–24 August 2016. [Google Scholar]
- van Renterghem, T.; Botteldooren, D. View on outdoor vegetation reduces noise annoyance for dwellers near busy roads. Landsc. Urban. Plann. 2016, 148, 203–215. [Google Scholar] [CrossRef] [Green Version]
- Abdalrahman, Z.; Galbrun, L. Audio-visual preferences, perception, and use of water features in open-plan offices. J. Acoust. Soc. Am. 2020, 147, 1661. [Google Scholar] [CrossRef] [PubMed]
- Aletta, F.; Masullo, M.; Maffei, L.; Kang, J. The effect of vision on the perception of the noise produced by a chiller in a common living environment. Noise Control. Eng. J. 2016, 64, 363–378. [Google Scholar] [CrossRef]
- Chau, C.K.; Leung, T.M.; Xu, J.M.; Tang, S.K. Modelling noise annoyance responses to combined sound sources and views of sea, road traffic, and mountain greenery. J. Acoust. Soc. Am. 2018, 144, 3503. [Google Scholar] [CrossRef]
- Chung, W.K.; Chau, C.K.; Masullo, M.; Pascale, A. Modelling perceived oppressiveness and noise annoyance responses to window views of densely packed residential high-rise environments. Build. Environ. 2019, 157, 127–138. [Google Scholar] [CrossRef]
- Chung, W.K.; Leung, T.M.; Chau, C.K.; Tang, S.K. Comparing the effects of visibility of different neighborhood greenery settings on the preference ratings and noise annoyance responses to road traffic noises. Appl. Acoust. 2020, 169, 107474. [Google Scholar] [CrossRef]
- Cudina, M.; Prezelj, J.; Puslar-Cudina, M. The impact of paintings hung on lecture room walls on the speech intelligibility and perception of background noise. Indoor Built Environ. 2016, 25, 659–673. [Google Scholar] [CrossRef]
- Evered, A.; Watt, A.; Perham, N. Are sound abatement measures necessary in the cytology reading room? A study of auditory distraction. Cytopathology 2018, 29, 84–89. [Google Scholar] [CrossRef] [Green Version]
- Jahncke, H.; Eriksson, K.; Naula, S. The effects of auditive and visual settings on perceived restoration likelihood. Noise Health 2015, 17, 1–10. [Google Scholar] [CrossRef]
- Jeon, J.Y.; Jo, H.I. Three-dimensional virtual reality-based subjective evaluation of road traffic noise heard in urban high-rise residential buildings. Build. Environ. 2019, 148, 468–477. [Google Scholar] [CrossRef]
- Jo, H.I.; Jeon, J.Y. Downstairs resident classification characteristics for upstairs walking vibration noise in an apartment building under virtual reality environment. Build. Environ. 2019, 150, 21–32. [Google Scholar] [CrossRef]
- Jo, H.I.; Kim, H.W.; Jeon, J.Y. Investigation of work performance in open-plan office with soundscape variation using virtual reality. In Proceedings of the 48th International Congress and Exposition on Noise Control Engineering 2019, INTER-NOISE 2019, Madrid, Spain, 16–19 June 2019. [Google Scholar]
- Liebl, A.; Haller, J.; Jodicke, B.; Baumgartner, H.; Schlittmeier, S.; Hellbruck, J. Combined effects of acoustic and visual distraction on cognitive performance and well-being. Appl. Ergon. 2012, 43, 424–434. [Google Scholar] [CrossRef] [PubMed]
- Ma, H.; Shu, S. An experimental study: The restorative effect of soundscape elements in a simulated open-plan office. Acta Acust. United Acust. 2018, 104, 106–115. [Google Scholar] [CrossRef]
- Sona, B.; Dietl, E.; Steidle, A. Recovery in sensory-enriched break environments: Integrating vision, sound and scent into simulated indoor and outdoor environments. Ergonomics 2019, 62, 521–536. [Google Scholar] [CrossRef] [PubMed] [Green Version]
- Sun, K.; De Coensel, B.; Echevarria Sanchez, G.M.; van Renterghem, T.; Botteldooren, D. Effect of interaction between attention focusing capability and visual factors on road traffic noise annoyance. Appl. Acoust. 2018, 134, 16–24. [Google Scholar] [CrossRef] [Green Version]
- Yang, W.; Moon, H.J. Combined effects of sound and illuminance on indoor environmental perception. Appl. Acoust. 2018, 141, 136–143. [Google Scholar] [CrossRef]
- Leslie, E.; Sugiyama, T.; Ierodiaconou, D.; Kremer, P. Perceived and objectively measured greenness of neighbourhoods: Are they measuring the same thing? Landsc. Urban. Plann. 2010, 95, 28–33. [Google Scholar] [CrossRef]
Figure 1.
A rationale of the soundscape review articles (n = 27, published from 2000 to 2020) for audio, Indoor Environmental Quality (IEQ), and audiovisual effects. The initial prescreening of the literature review papers published on the topic of soundscapes, was conducted to clearly identify the research gap which this systematic review aims to cover.

Figure 2.
A set of main keywords and the partial lists of their variations for database search used in this study. * Boolean operators (e.g., audi* = audio, auditory, audible). The exact wildcards are provided in Table A1.
Figure 2.
A set of main keywords and the partial lists of their variations for database search used in this study. * Boolean operators (e.g., audi* = audio, auditory, audible). The exact wildcards are provided in Table A1.

Figure 3.
Preferred Reporting Items for Systematic Reviews and Meta-Analyses (PRISMA) flow diagram (Reference: [38]). An extended flow diagram (before the section “Screening”) is provided in Figure A1.

Table 1.
Characteristics of observational studies of bimodal and interactive audiovisual effects on the soundscape.
Table 1.
Characteristics of observational studies of bimodal and interactive audiovisual effects on the soundscape.
| Reference | Tool | N | Response Variable | Indicator Influencing | Confounding Variables Adjusted | Data Analysis | Main Findings | Effect Type |
|---|---|---|---|---|---|---|---|---|
| [40] | Questionnaire (mail) | 2612 | Annoyance—traffic (5-pt verbal scale—ISO) | Accessibility—window facing (Binary scale for 6 items) | A, E, G, H, S | Regression analysis (logistic) | Window facing green space was associated with a reduced risk of noise annoyance. | Bimodal |
| [41] | Questionnaire (hand-in) | 720 | Annoyance—traffic (5-pt verbal scale—ICBEN) | Greenery—greenness level (NDVI) Greenery—perceived greenness (6-point scale) | A, R, S | Structural equation model | Higher surrounding green space was associated with lower noise annoyance through lower noise exposure and higher perceived greenspace. | Bimodal |
| [42] | Questionnaire (street) | 513 | Annoyance—noise (11-pt numerical scale) | Greenery—distance (numerical value in meter) Greenery—perceived greenness (10-point scale—Greenness Rating Scale, modified) | A, G, H, N, R, S | Regression analysis (mediation model) | Greater distance to the nearest green space was directly linked to higher noise annoyance, but perceived greenery variables are only indirectly associated. | Bimodal |
| [43] | Questionnaire (mail) | 500 | Annoyance—traffic (11-pt numerical scale) | Greenery—perceived availability (3-point scale) | - | ANOVAs (2-ways, follow-up of 2-way MANOVA) Chi-squared | Both availability to nearby green areas and access to a quiet side decrease long-term noise annoyance. With better access to green areas, residents perceived significantly less annoyance due to road traffic noise at home. | Bimodal |
| [44] | Questionnaire (mail) | 385 | Annoyance—traffic (5-pt verbal scale) | Environmental quality—visual aesthetic (Binary scale) | A | Regression analysis (binary logistic) | The access to high-quality quiet courtyards was associated with less general noise annoyance in both low and high noise-exposure groups | Bimodal |
| [45] | Questionnaire (street) | 1496 | Annoyance—traffic (11-pt numerical scale—ISO) | Waterbody—type (3 types: sea, river, or both) Greenery/Waterbody—perceived amount (5-point verbal scale) | A, E, G, H, N, R, S | Regression analysis (ordered logistic) | Having a sea view or both sea and river view at home exhibited annoyance moderation effect, while no moderation effect of having a river view only. | Bimodal |
| [46] | Questionnaire (street) | 2033 | Annoyance—traffic (11-pt numerical scale—ISO) | Greenery/Waterbody/Building/Traffic road/Noise barrier—perceived amount (5-point verbal scale) | A, E, H, N, R, S | Regression analysis (multivariable ordered logit model) | Views of sea, urban river, or greenery could moderate noise annoyance, while views of noise barrier (and views containing both noise barriers and urban rivers) could increase the annoyance. Views of greenery had a stronger noise moderation capability than views of sea or urban river. | Bimodal |
| [47] | Questionnaire (street) | 688 | Annoyance—traffic (5-pt verbal & 11-pt numerical scale—ISO) | Greenery—perceived amount (3-point scale) Location × Greenery—view type (7 conditions) | A, E, G, H, N, S | Regression analysis (multivariable ordered logit model) | The presence of great greenspace from homes exerted more effect of noise annoyance reduction than only a little greenery presence. This effect depends on the greenery settings (locations) | Bimodal |
| [48] | Questionnaire (street) | 861 | Annoyance—traffic (11-pt numerical scale—ISO) | Greenery/Sea—presence (Binary scale) | A, E, G, H, N, R, S | Regression analysis (ordinal logistic) | Both a greenery view and a sea view can moderate annoyance responses. Several individual’s personal characteristics are found to affect individuals’ annoyance perception. | Bimodal |
| [49] | Questionnaire (unspecified) | 2974 | Annoyance—traffic (5-pt verbal & 11-pt numerical scale—ICBEN) | Greenery—perceived (unspecified) | A, G, N, R | Regression analysis (logistic) | No effect of greenery in the residential space on noise annoyance caused by road traffic | Bimodal |
| [50] | Questionnaire (hand in) | 131 | Annoyance—traffic (11-pt numerical scale—ISO) | Greenery—greenness level (3 items: NDVI, Tree cover density, Green land use) | A, G, N, R | Regression analysis (ordinal logistic) | Lower levels of noise annoyance due to traffic road were detected with higher residential greenness and tree cover. | Bimodal |
| [51] | Questionnaire (mail) | 5592 | Annoyance—traffic, railway, aircraft (5-pt verbal & 11-pt numerical scale—ICBEN) | Greenery—greenness level, accessibility (4 items: NDVI, visible vegetation from home, publicly- available green/natural spaces within the buffer area) | A, G, R, S | Regression analysis (logistic) | Increasing residential green was associated with reduced road traffic and railway noise annoyance, but increased aircraft noise annoyance. NDVI and publicly available green spaces are strong indicators, while visible vegetation and accessibility and/or quietness of green space for road traffic noise annoyance are strong indicators for urban cities. | Bimodal |
| [52] | Questionnaire (mobile app) | 32 | Pleasantness (visual) (7-pt Likert scale) | Musical episode—presence (Binary scale) | - | ANOVA (mixed model) | Visual environment was perceived as more pleasant during musical episodes, compared to non-musical episodes. | Bimodal |
| [53] | Questionnaire (door to door) | 105 | Annoyance—noise (5-pt verbal scale—ISO) | Greenery—perceived amount (5-point scale) | - | Regression analysis (logistic) | View on vegetation could strongly reduce self-reported annoyance to an acceptable level. | Bimodal |
Note: - = no information provided; pt = point; noise = noise in general; ISO = International Organization for Standardization: ISO/TS 15666; ICBEN = International Commission on Biological Effects of Noise; NDVI = Normalized Difference Vegetation Index; ANOVA = analysis of variance; MANOVA = multivariate analysis of variance; Con-founders: A = age; E = educational level; G = gender; H = health related variables, BMI, smoking status, hearing health; N = noise sensitivity; R = residential status: length of stay, residence, time spent at home, housing ownership; S =social status: marital status, economic status, individual incomes, ethnicity, interview language.
Table 2.
Characteristics of interventional studies of bimodal and interactive audiovisual effects on the soundscape.
Table 2.
Characteristics of interventional studies of bimodal and interactive audiovisual effects on the soundscape.
| Reference | Tool | N | Response Variable | Indicator Influencing | Confounding Variables Adjusted | Data Analysis | Main Findings | Effect Type |
|---|---|---|---|---|---|---|---|---|
| [54] | Questionnaire, Realistic audiovisual animations | 31 | Perceived masking effect—water sound (5-point Likert scale) | audio-only or audiovisual 6 water type | A, G | Wil coxonsigned-rank test | Visual stimuli of the water features improved the speech-masking effect’s perception compared to their corresponding water sounds alone. | Interaction |
| [55] | Questionnaire, VR | 26 | Loudness (100-point scale, slider question) | Visibility—sound source | - | ANOVA (2-way repeated-measures) | Scenarios with the black screen were perceived to be louder than both the visible and invisible sound source scenarios | Bimodal |
| Unpleasantness—visual (100-point scale, slider question) | (3 levels) Distance factor | C | ANOVA (one-way repeated measures) | In the case of cognitive task, the distance factor with a 10-m scenario was the most visually unpleasant | ||||
| (3 sound levels) | ||||||||
| [56] | Questionnaire, Physical model | 215 | Annoyance—noise (11- point numerical scale) | Greenery/Sea/Traffic (Presence/amount) Greenery × Traffic road (Binary scale—0 or 1) Sea view × SNR (Binary scale) | - | Regression analysis (ordered logistic) | Road and mountain greenery views enhanced annoyance while sea views modestly reduced noise annoyance. | Bimodal |
| Low annoyance response was found if they were exposed to a view containing mountain greenery and road | ||||||||
| The strongest moderation effect was found when sea sound was 3 dB lower than road traffic noise in the scenario with a 60% sea view. | Interaction | |||||||
| [57] | Questionnaire, VR | 46 | Annoyance—noise (11-pt numerical scale) | Spacing (2 levels) × Separation distance (3 levels) | A, E, H, S | Regression analysis (ordinal logistic) | Less perceived noise annoyance with widening spacing, increasing separation distance, or both. | Bimodal |
| [58] | Questionnaire, Physical model | 140 | Annoyance—noise (11- point numerical scale) | Greenery/Sea/Traffic (Presence/amount) Greenery × Traffic road (Binary scale—0 or 1) Greenery—type (2 types of green features) | P | Regression analysis (ordinal logistic) | Road and mountain greenery views enhanced annoyance while sea views modestly reduced noise annoyance. Low annoyance response was found if they were exposed to a view containing mountain greenery and road Mountain greenery close-by view could enhance annoyance while tree clumps view may induce annoyance, but not significant. | Bimodal |
| [59] | Questionnaire, Projector & audio playback | 35 | Loudness (selecting one image, at which the noise was the loudest) | Color images (5 images) | - | Pearson’s Chi-squared test | Pastel color combinations with prevailing green, blue and grey colors, having long reaction time, soothed a noise whereas the blue color as “the noisiest.” | Bimodal |
| [60] | Cognitive test, Audio playback | 34 | Visual task performance (Score of cell interpretation tests) | Sound types (4 stimuli) | - | ANOVA (repeated measures) | Auditory stimulation did not improve or the performance of cell interpretation visual task. | Bimodal |
| [61] | Questionnaire, Computer & audio playback | 40 | Restorative qualities (2 dimensions: fascination, being away, 7-pt numerical scale—ART) Restoration likelihood (7-pt numerical scale) Attitude (7-pt numerical scale) | 4 sound types × 2 visual images | - | ANOVA (repeated measures) | More being-away restorative quality decreased likelihood restoration, and more positive attitude were perceived for the urban nature setting compared to an open-plan office setting. These trends were larger (or higher) with quiet condition | Interaction |
| [62] | Questionnaire, VR | 40 | Annoyance—traffic noise (7-pt verbal scale) Loudness—traffic noise (7-pt verbal scale) Disturbance—traffic noise (7-pt verbal scale) Allowance—sound (3-pt verbal scale) | Directional × Visual information | - | ANOVA (2-way) | Perceived loudness, noise annoyance, activity disturbance, and unacceptable level are significantly higher in the HRTF environment. Whereas these responses are significantly lower when using the HMD. The HRTF has a relatively greater contribution than HMD, meaning people are more sensitive to the HRTF | Bimodal |
| [63] | Questionnaire, VR | 40 | Noise Annoyance—inter-floor noise (7-pt verbal scale) | Visual information × Sound level (LAFmax) | - | ANOVA (factorial) | Annoyance caused using HMD was higher when the walking vibration noise exceeded 53 dBA. | Interaction |
| [64] | Cognitive test, VR | 10 | Task performance—accuracy (the average of the correct answers) | 3 background noise levels × 3 levels of partition height | - | Descriptive analysis | The lower the background noise, the greater effect of partition installation on work performance; whereas the larger the background noise, the smaller the partition effect would be. | Interaction |
| [65] | Cognitive test, Questionnaire, Physical model | 32 | Task performance—perceived (6 dimensions, 20-pt numerical scale—NASA-TLX) Disturbance—lighting (7-pt numerical scale) | 2 speech intelligibility × 2 levels of lighting settings | - | ANOVA | Test persons only felt to perform better, if background speech of low intelligibility was combined with static lighting Low speech intelligibility combined with static light was perceived as the least disturbed due to lighting, high speech intelligibility with static light, and the other two audiovisual conditions. Most of these perceptions significantly differed from each other | Interaction |
| [66] | Cognitive test, Questionnaire, Monitor & audio playback | 30 | Tension/Fatigue/Annoyance—emotional (7-pt Likert scales—POMS) | 2 sound sources × 2 photos | G | ANOVA Paired-samples t-test | Subjective fatigue and annoyance level were very sensitive to the audial-visual stimuli and the restorative extent. Restoration function of water was significantly better than air-conditioner noise regardless of visual scene type. This phenomenon is very apparent for the fatigue dimension. | Interaction |
| [67] | Questionnaire, Physical model | 122 | Restorative experience (2 dimensions: Fascination, Being away, 6-pt numerical scale—Perceived Restorativeness Scale) Pleasantness—visual(7-pt numerical scale) | 1 control condition + 2 natural & 2 lounge conditions | - | Correlation analysis (unspecified) | Environments simulating either a natural or a lounge environment were perceived as more pleasant in view and restorative (fascination/being away) than a standard break room. View was perceived as more pleasant and the environment as more restorative in the nature simulations than in the lounge simulations. | Interaction a |
| [68] | Questionnaire, Physical model | 75 | Annoyance (11-pt numerical scale—ICBEN) | 2 levels of sound source visibility × 2 levels of greenery presence | - | Generalized linear mixed model | Less annoyance participants perceived when the sound source was visible, while the greenery element’s visibility is non-significant. | Bimodal |
| Audiovisual aptitude (2 factors: auditory acuity & vision dominance) | Vision dominated participants are less annoyed by noise than the other participants. | |||||||
| Audiovisual aptitude (vision dominance) × Greenery (2 levels of presence) | A, E, G N | Vision dominated persons perceived more annoyance when green elements were more visible. | Interaction | |||||
| [69] | Questionnaire, Physical model | 60 | Visual relaxation (11-pt numeric scale—ISO) | 4 noise levels × 4 sound types + an ambient noise condition of 35 dBA | G | ANOVA (factorial) | Relaxation decreased with increased sound levels. Sound type affected relaxation (the highest mean relaxation was found for ambient sound type, followed by music/water, and then babble/fan). | Bimodal |
Note: VR = virtual reality; SNR = Sound-to-Noise Ratio; Projector = projector screen; Computer = computer screen; ART = Attention Restoration Theory; HRTF = head-related transfer function; HMD = head-mounted display; LAFmax = A-weighted maximum sound pressure level with Fast time weighting; NASA-TLX = NASA Task Load Index; Monitor = monitor display; POMS = Profile of Mood States; Con-founders: C = cognitive task performance; P = personal preferences for visual and audio cue. a Interaction with triple-sensory input (audiovisual and olfactory stimuli). Adding a congruent scent to an audiovisual simulation found to be more likely indirect factor since no significant direct impact of olfactory factor was found.
Table 3.
Visual indicators for noise annoyance responses in indoor environments.
| Main-Category | Sub-Category | Parameter | Observational | Interventional | ||||
|---|---|---|---|---|---|---|---|---|
| Enhance Annoyance | Moderate Annoyance | Alter Annoyance | Enhance Annoyance | Moderate Annoyance | Alter Annoyance | |||
| Solo indicator | ||||||||
| Greenery | Amount (% of views, NDVI) | [41,50,51] | [56,58] | |||||
| Type of greenery views | [47] | [58] | ||||||
| Accessibility | [40] | |||||||
| Distance to the nearest greenery | [42] | |||||||
| Perceived amount | [42,46,47,53] | |||||||
| Perceived availability | [43] | |||||||
| Perceived presence | [48] | |||||||
| Waterbody | Amount (% of views) | [56,58] | ||||||
| Type of water-bodies | [45] | |||||||
| Perceived amount | [46] | |||||||
| Perceived presence | [48] | |||||||
| Other visual elements | Traffic road | Amount (% of views) | [58] | |||||
| Noise barrier | Perceived amount | [46] | ||||||
| Physical property | Buildings | Separation distance between buildings | [57] | |||||
| Environmental quality | Quality level | [44] | ||||||
| Visual information | HMD | In use | [62] | |||||
| Sound source | Visibility | [68] | ||||||
| Visual dominated personality | Presence | [68] | ||||||
| Interactive indicator | ||||||||
| Multiple-visual interaction | Greenery × traffic road | Presence | [56,58] | |||||
| Noise barrier × water body | Presence of perception | [46] | ||||||
| Audiovisual interaction | Sea × SNR | Presence | [56] | |||||
| Visual information (HMD) × SPL | In use | [63] | ||||||
| Personal-environmental interaction | Visual dominated personality × Greenery visibility | Presence | [68] | |||||
Note: SPL = Sound Pressure Level.
Table 4.
A list of audio, visual, and audiovisual theoretical indicators for audio, visual, emotional, and cognitive responses (other than noise annoyance response).
Table 4.
A list of audio, visual, and audiovisual theoretical indicators for audio, visual, emotional, and cognitive responses (other than noise annoyance response).
| Reference | Audio Factor | Visual Factor | Domains of Human Perceptions | |||
|---|---|---|---|---|---|---|
| Audio | Visual | Cognitive | Emotional | |||
| Bimodal effect | ||||||
| [43] | Perceived greenery availability | Awareness of noise issue | ||||
| [52] | Presence of music | Pleasantness | ||||
| [55] | Sound source visibility | loudness | ||||
| Disturbance factor (sound level) | Pleasantness | |||||
| [59] | Color image | loudness | ||||
| [69] | Sound type × Noise level | Relaxation | ||||
| Interactive effects (with sound type) | ||||||
| [54] | Sound type (water sound) | Presence of visual stimuli | Perceived masking effect | |||
| [61] | Sound type | Visual image | Attitude | Restorativeness | ||
| [66] | Sound type | Photo image | Tension/fatigue/annoyance | |||
| [67] | Sound type | Window view type | Pleasantness | Restorativeness | ||
| Interactive effects (other factors) | ||||||
| [62] | Directional information | Visual information | Loudness Noise allowance Noise disturbance | |||
| [65] | Speech intelligibility | Lighting conditions | Lighting disturbance | Task performance | ||
Publisher’s Note: MDPI stays neutral with regard to jurisdictional claims in published maps and institutional affiliations. |
© 2021 by the authors. Licensee MDPI, Basel, Switzerland. This article is an open access article distributed under the terms and conditions of the Creative Commons Attribution (CC BY) license (http://creativecommons.org/licenses/by/4.0/).
Share and Cite
MDPI and ACS Style
Hasegawa, Y.; Lau, S.-K. Audiovisual Bimodal and Interactive Effects for Soundscape Design of the Indoor Environments: A Systematic Review. Sustainability 2021, 13, 339. https://doi.org/10.3390/su13010339
AMA Style
Hasegawa Y, Lau S-K. Audiovisual Bimodal and Interactive Effects for Soundscape Design of the Indoor Environments: A Systematic Review. Sustainability. 2021; 13(1):339. https://doi.org/10.3390/su13010339
Chicago/Turabian StyleHasegawa, Yoshimi, and Siu-Kit Lau. 2021. "Audiovisual Bimodal and Interactive Effects for Soundscape Design of the Indoor Environments: A Systematic Review" Sustainability 13, no. 1: 339. https://doi.org/10.3390/su13010339
Note that from the first issue of 2016, this journal uses article numbers instead of page numbers. See further details here.