Systematic Evaluation of Nutrition Indicators for Use within Food LCA Studies
by
 ,
,
Marta Bianchi
1,*, 
Anna Strid
2,
Anna Winkvist
2,3,
Anna-Karin Lindroos
2,4,
Ulf Sonesson
1 and
Elinor Hallström
1 1
Department of Food and Agriculture, RISE—Research Institutes of Sweden, SE-40229 Gothenburg, Sweden
2
Department of Internal Medicine and Clinical Nutrition, the Sahlgrenska Academy, University of Gothenburg, 405 30 Gothenburg, Sweden
3
Sustainable Health, Department of Public Health and Clinical Medicine, Umeå University, 90187 Umeå, Sweden
4
Swedish Food Agency, SE-75126 Uppsala, Sweden
*
Author to whom correspondence should be addressed.
Sustainability 2020, 12(21), 8992; https://doi.org/10.3390/su12218992
Submission received: 8 October 2020
/
Revised: 18 October 2020
/
Accepted: 27 October 2020
/
Published: 29 October 2020
(This article belongs to the Special Issue Innovation in Life Cycle Sustainability Assessment of Emerging Technologies)
Abstract
:Expressing the environmental impact of foods in relation to the nutritional quality is a promising approach in the search for methods integrating interdisciplinary sustainability perspectives. However, the lack of standardized methods regarding how to include nutrient metrics can lead to unharmonized results difficult to interpret. We evaluated nutrient density indexes by systematically assessing the role of methodological variables with the purpose of identifying the index able to rank foods with the highest coherence with the Swedish dietary guidelines. Among 45 variants of the nutrient density index NRF (Nutrient Rich Food), a Sweden-tailored NRF11.3 index, including 11 desirable nutrients and 3 undesirable nutrients, calculated per portion size or 100 kcal with the application of weighting, ranked foods most coherently with the guidelines. This index is suggested to be suitable as complementary functional unit (FU) in comparative life cycle assessment (LCA) studies across food categories. The results clarify implications of methodological choices when calculating nutrient density of foods and offer guidance to LCA researchers on which nutrition metric to use when integrating nutritional aspects in food LCA.
1. Introduction
The concept of nutrient density is a key attribute to describe the nutritional quality of foods, and a pillar concept in numerous regional and national dietary guidelines [1], among which are the Nordic Nutrition Recommendations (NNR) [2] and the Swedish dietary guidelines [3]. In the last years, nutrient density has become a dimension able to merge two areas of research, nutritional science and environmental science, offering a solution to the dilemma of how to include nutrition in the functional unit (FU) used in life cycle assessments (LCAs) of food [4,5,6].
Several FUs have been proposed as alternatives to the mass-based FU traditionally used within food LCA studies (e.g., land-based, cost-based, energy-based) [7]. Among these, nutrition quality, both expressed as the content and quality of single nutrients (e.g., protein quantity and quality) or as scores of nutrient density, is regarded as a promising approach to better represent the function of foods [8,9,10]. An increasing number of studies have in fact related the environmental impact of foods to the nutritional value expressed as nutrient density [11,12], often at a diet level, but also at a food product level [13,14]. Regardless whether the focus is on the diet in its entirety, on meals, or single foods, the choice of the method used for calculating the nutrient density and its methodological implications affect the results heavily. Although some studies have evaluated the impact of using nutrient density as a complementary FU compared to other FUs in ranking foods based on their environmental performance [5,8,15,16], little is known about the implications of methodological choices and how the method should be optimized for this use. No recommendation exists regarding which nutrient density method ranks foods more correctly, leaving it open for LCA researchers to choose among many different indexes, with the consequence of results hard to interpret and difficult to compare. In a recent review by Hallström et al. [17], 12 different nutrient density scores were identified as applicable to food products. Among these, the Nutrient Rich Food (NRF) index family is looked upon with special interest, as a robust, versatile, and validated method, suitable for incorporation in sustainability assessments. Methodological aspects of NRF calculation have previously been investigated (i.e., the number and choice of nutrients, the reference unit, and the mathematical formula for calculation), and the index NRF9.3 was shown to have the best characteristics and highest ability to predict the diet quality in the US National Health and Nutrition Examination Survey (NHANES) [9,18]. Although some work has been done to refine and validate NRF and other methods, the perspective of application in LCA has rarely been included. A first attempt has been made on seafood, where several NRF index variants were evaluated for their ability to rank seafood products alone and in combination with climate impact [14]. However, as pointed out by Hallström et al. [17], more work needs to be done in the area of development, testing, and validation of indexes for a combined use with environmental impacts in sustainability assessments. Importantly, nutrient density indexes should be optimized for their level of coherence with dietary guidelines, in order to include the public health perspective and avoid conflicting indications once integrated with environmental impacts.
The overall aims of this paper are to systematically evaluate which variant of the NRF index is most coherent with the dietary guidelines and thereby suitable for use in food LCAs and to clarify the implications of critical methodological choices. The study builds on the previous methodological work done by this research group on seafood [14], and further extends the assessment of methodological variables of NRF indexes across all food categories in a Swedish context. An evaluation process was developed to systematically assess NRF indexes for their ability to rank food products coherently with the current Swedish dietary guidelines for public health [3].
By identifying the nutrient density index variants that most closely reflect the dietary guidelines, this study makes it possible to suggest an index suited for incorporating nutrient density as a complementary FU in comparative food LCA studies.
Specifically, this study assesses the role of methodological variables by analyzing the impact of reference unit, choice and number of nutrients, and weighting and/or capping when calculating nutrient density of foods, and by ranking and comparing foods between and within specific food categories.
The outcome of this analysis constitutes a basis for future recommendations on how nutrient density indicators can be used in combination with environmental metrics by different stakeholders in the food system, to drive a global shift towards more sustainable and healthy food consumption patterns.
2. Materials and Methods
2.1. Nutrient Composition of Food Products
The 118 food products analyzed in this study were assembled into 14 food groups (e.g., cereal products) and further categorized into 53 subgroups of food products (e.g., rice, pasta, wholegrain bread, white bread) based on their nutritional and climate impact properties. Nutrient density was analyzed both at food subgroup level as well as within food groups. The complete list of analyzed products, portion sizes as well as the subdivision in groups and subgroups is presented in Table S1.
Foods analyzed were identified from a validated food frequency questionnaire broadly used in published studies in Sweden [19]. This list of products was chosen as it includes foods commonly consumed in Sweden and therefore gives a good representation of the average Swedish diet. Several products were also added from more recent food categories on the Swedish market, such as plant-based dairy alternatives and drinks, meat substitutes, and some exotic fruits. Nutrient profiles of the selected foods were derived from the Swedish Food Agency (SFA) Food Composition Database [20] (version 20171215). For products containing added sugars, the content was obtained from personal communication with the SFA, who has recently developed a method for estimating free and added sugars [21]. Nutrient composition refers to 100 g edible food product, and per prepared weight for foods that are consumed cooked. Portion sizes were retrieved from the same database or, if not available, from the US Department of Agriculture (USDA) Food Composition Databases [22]. For some products (e.g., chickpeas, lentils) portion sizes were assumed to be the same as similar foods (e.g., beans). In other cases (e.g., nuts and seeds), portion sizes were derived directly from the indication of manufacturers.
2.2. Nutrient Density Calculation of Food Products
2.2.1. Choice of Algorithm
The NRF index [18] was identified as the suitable index for nutrient density calculations in this study as it offers multiple advantages, such as flexibility in the choice of nutrients to include, possibility to adapt the calculation to the specific dietary reference intakes (DRIs) of the studied population, and opportunity to use different reference amounts for the calculation. The variant NRF9.3 was chosen and included in this study as the base index for the nutrient density calculations, according to the following equation:
where x is the number of desirable nutrients (nine for NRF9.3), y is the number of non-desirable nutrients (three for NRF9.3), nutrient i/j is the content of nutrient i or j per reference unit of the food product, DRI is the dietary reference intake of desirable nutrient i, and MRI is the maximum recommended intake of non-desirable nutrient j.
2.2.2. Assessment of the Impact of Methodological Choices on Nutrient Density
In order to assess the role of different methodological aspects, NRF scores were calculated by varying the reference unit used for calculations, the total number and choice of desirable nutrients, and by applying capping and/or weighting (see below). Three alternative reference units were evaluated, 100 g, 100 kcal, or the portion size—100 g is the amount of food considered for nutrition labeling within the EU, as well as for some nutrient profiling systems [17], 100 kcal is the unit that better reflects the nutrient-to-calorie ratio, and the portion size is the amount of food often better understood by the consumer. Regarding the choice of desirable nutrients, the base NRF9.3 index was tailored to include nutrients that are of key concern for the nutritional status of the Swedish population, vitamin D and folate [23], yielding NRF11.3, and further expanded to include most of the nutrients where a DRI is established in the NNR [2], yielding NRF21.3. Capping and weighting are two methodological choices largely applied to nutrient indexes, with the purpose of differentiating the contribution of individual nutrients to the final score. Briefly, capping is used to avoid over-crediting nutrient contents that exceed their DRIs by rounding off their nutrient content per reference unit to 100% of DRI. In this study, capping was applied to desirable nutrients only, except for fiber and omega-3 fatty acids, whose DRIs are indicated as minimum recommended amounts to be introduced in the diet. Weighting is used to give different weights to nutrients based on the intake status in the population, in this study the Swedish population. Specifically, desirable nutrients receive a higher weight in the NRF calculation when their intake in the average population is sub-optimal and a lower weight when intake exceeds DRIs (based on Amcoff et al. [23]). Non-desirable nutrients, on the contrary, receive a higher weight when the population average intake exceeds the MRI, but are capped to 100% of MRI when their intake is lower than this value. An overview of the methodological choices analyzed in this study is presented in Table 1.
2.2.3. Analysis of Nutrient Density between Food Subgroups
Nutrient density scores were calculated according to the different methodological choices for individual foods and median values were derived for the subgroups. Individual foods and subgroups were color-coded based on a summary of the Swedish food-based dietary guidelines [3]. Briefly, foods labeled “red” belong to categories whose consumption should be reduced based on public health criteria (i.e., red and processed meat, salt, sugar, alcohol, refined grains, animal fat); foods labeled “yellow” represent healthier alternatives (i.e., vegetable oils, whole grains, low-fat dairy products) that should replace unhealthier alternatives; foods labeled “green” belong to categories whose consumption should be increased (i.e., fruit and berries, vegetables and legumes, nuts and seeds, fish and seafood). Color-coding of individual foods and food subgroups is presented in Table S1, as well as a more detailed description of the method used.
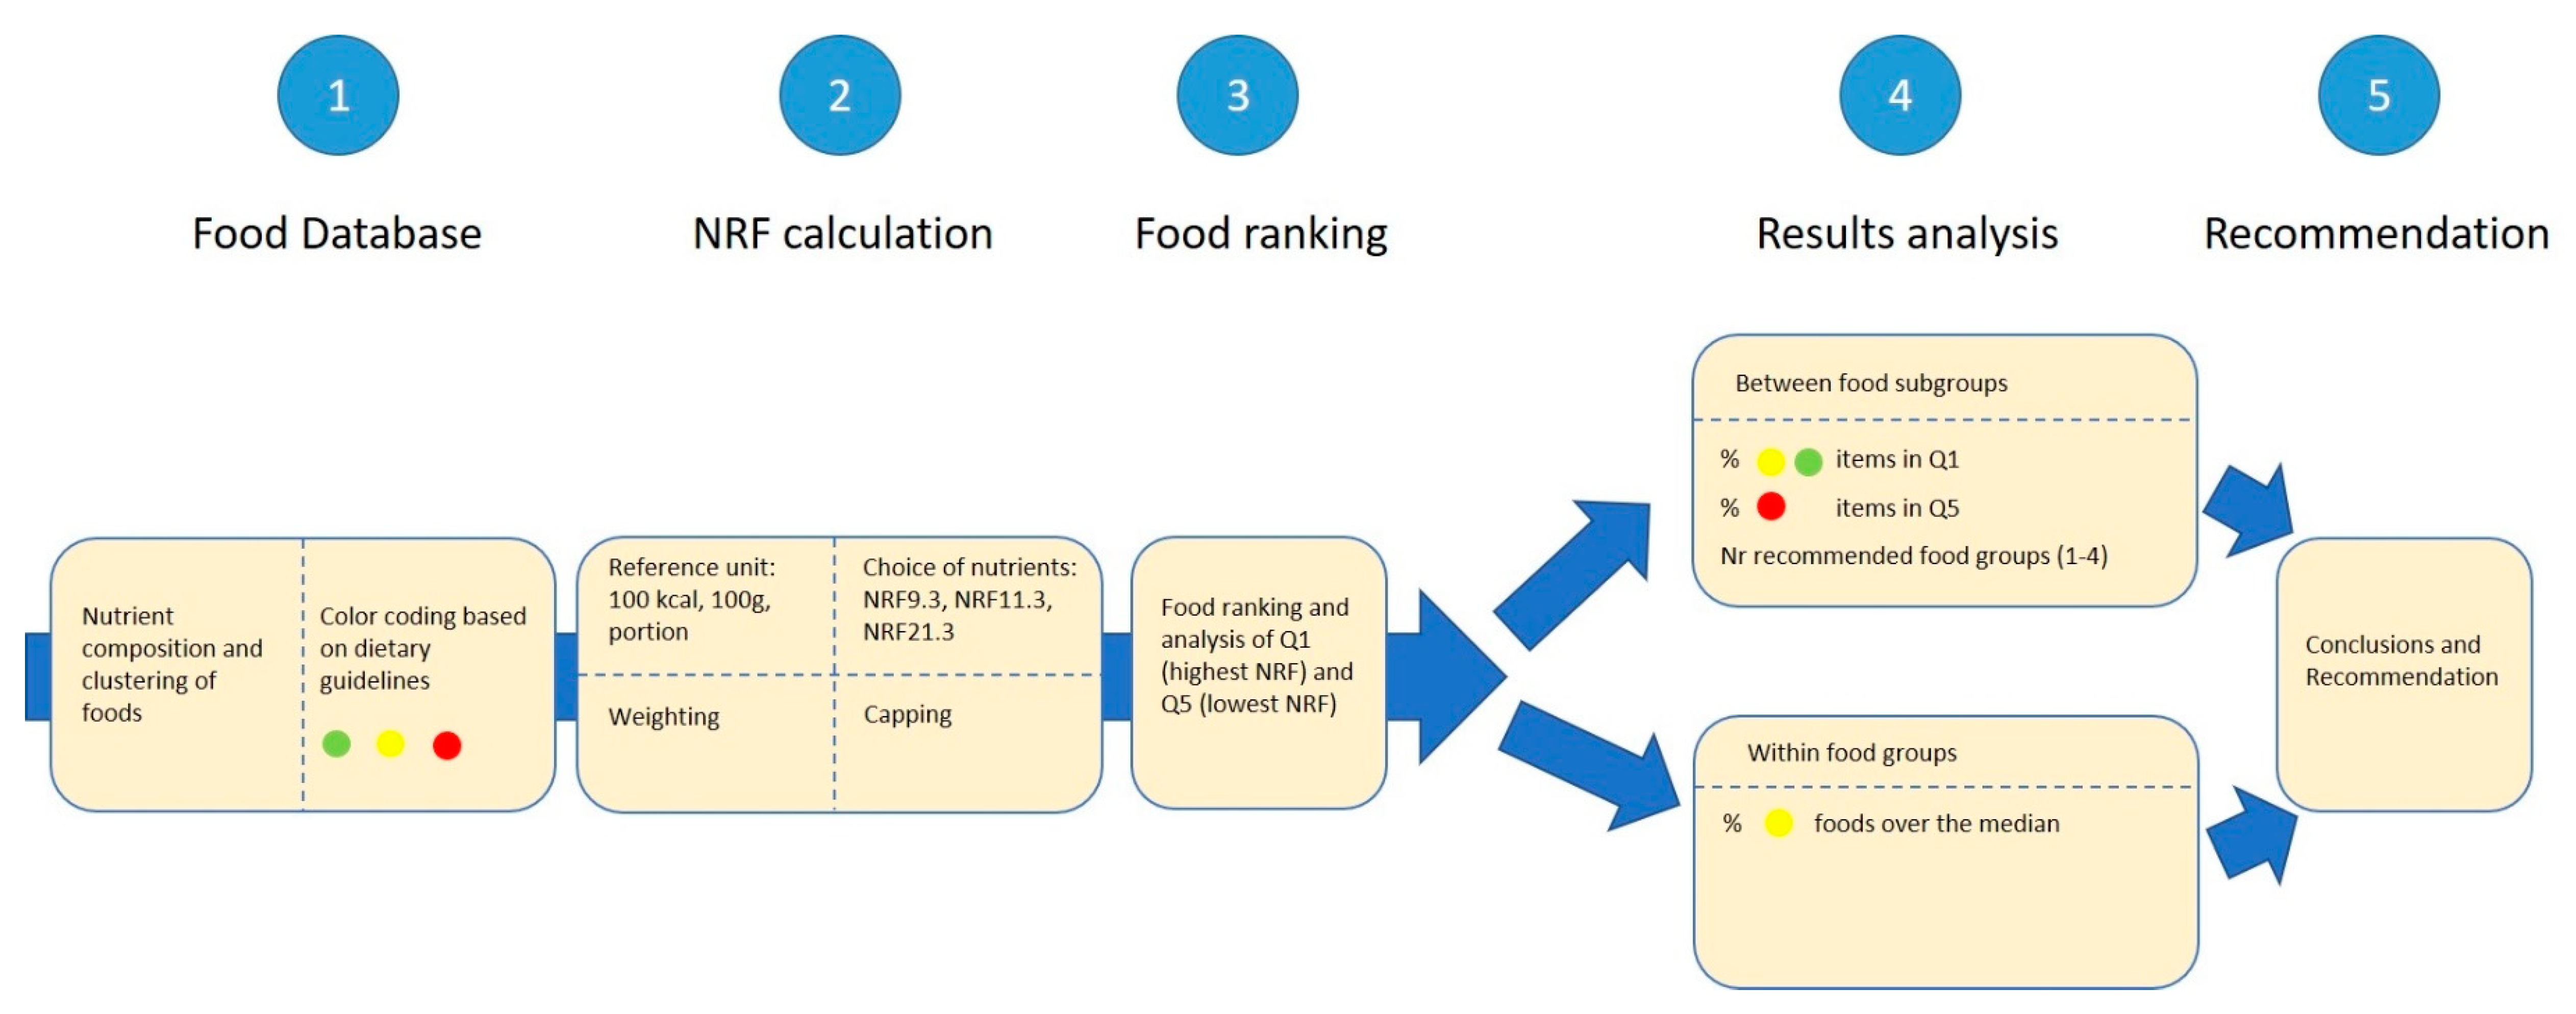
Subgroups in quintile one (Q1, highest quintile) and quintile five (Q5, lowest quintile) of nutrient density were analyzed for their level of coherence with the dietary guidelines (see Figure 1 for the five-step assessment). The percentage of green (eat more of) plus yellow (healthier alternative) food items in Q1, and the percentage of red (eat less of) food items in Q5 were used as indicators of how well the applied method and consequent food ranking represented foods which should be promoted or restricted. An additional indicator of coherence with the dietary guidelines was represented by the number of food groups whose consumption should be increased (green food groups) represented in Q1 and Q5 (out of a total of four: vegetables and legumes, fruit and berries, nuts and seeds, fish and seafood). When differences could not be appreciated among different indicator variants based on these two criteria, the number of green food items in Q1 was also considered.
2.2.4. Analysis of Nutrient Density within Food Groups
The different methods for NRF calculation were evaluated within food groups, for their ability to promote healthier alternatives in a category as those having higher nutrient density. This analysis was deemed meaningful only for food groups of ten or more food products and where some heterogeneity in the nutritional profiles existed. For this reason, the analysis was performed within three food groups: red and processed meat including egg and chicken, dairy products, and cereal products. In order to assess how different nutrient density scores performed, the median NRF value was calculated for each food group. The number of foods that represent healthier alternatives and their percentage representation over and under the median of the food group was used as an estimate of the level of coherence with the dietary guidelines (Figure 1). Healthier alternatives within these groups were represented by chicken and egg as opposite to unhealthier options like processed and red meat; low-fat dairy products as opposite to full-fat dairy products; wholegrain cereal products as opposite to refined.
3. Results
3.1. Impact of Methodological Choices on Nutrient Density between Food Subgroups
The results point to the conclusion that, out of 45 indicator variants, NRF11.3 calculated per portion size or per 100 kcal with the application of weighting are the simplest index versions that showed the best performance. These indicator variants were in fact able to rank foods from 53 different subgroups covering all food categories (Table S1) in a way that most closely reflected the dietary guidelines.
Table 2 presents the level of coherence with the Swedish food-based dietary guidelines of food subgroups, ranked by nutrient density according to the base index NRF9.3 and the derivative indexes where method variables were changed.
The food subgroups which ranked highest in nutrient density according to NRF11.3 are presented in Table 3. The table makes it possible to appreciate differences in the number of green, yellow, and red foods when different methodological choices are applied in the calculation. Foods ranking in Q1 according to all other index variants are available in the Supplementary Materials.
3.1.1. Reference Unit
Across the different methodological choices, the choice of the reference unit played the largest role, with a greater impact on the percentage of green and yellow food products in Q1. When NRF indexes were calculated per 100 kcal or portion size, foods with the highest nutrient density showed a higher coherence with the dietary guidelines than when calculated per 100 g (Table 2). Across all the NRF indexes, the use of 100 g as a reference unit generally promoted energy-dense and more animal-based foods (Table S3). Calculating NRF based on the reference unit 100 kcal contrarily promoted energy-poor and more plant-based food products, a direction closer to the current dietary advice for reduced risk for non-communicable diseases. Lastly, where NRF was calculated per portion size, the foods in Q1 generally offered the highest coherence with the dietary guidelines, including predominantly foods with low energy density, plant-based foods, but also fish and seafood (in the case of NRF11.3, Table 3), hence covering the four food groups that are recommended to be consumed in greater amounts. However, the performance of NRF calculated per portion size was influenced, more so than the other reference units, by the varying number of nutrients in the algorithm, and this resulted in the lowest number of green and yellow food subgroups in Q1 when calculated as NRF21.3 (Table 2). In conclusion, the combination of both evaluation criteria (% of green and yellow foods and the number of green food groups) suggested that both 100 kcal and portion size are suitable options for reference unit to be adopted in nutrient density calculations when comparing foods between food subgroups based on a limited number of nutrients.
3.1.2. Choice of Nutrients
The impact of the choice of nutrients was analyzed by assessing three different NRFn.3 indexes, where the number of desirable nutrients was 9 in the base method, 11 in the Sweden-tailored indicator, and 21 in the more comprehensive indicator. The analysis conducted between food subgroups indicated minimal differences between NRF9.3 and 11.3, whereas the index with the largest number of desirable nutrients (NRF21.3) showed the lowest performance, with the percentage of green and yellow foods in Q1 dropping as low as to 55% when calculated per portion size (Table 2). This indicates that almost half of the foods promoted as the most nutrient dense by this indicator are not recommended by the current dietary guidelines. NRF21.3 showed a lower performance also in Q5, where some of the green foods were categorized amongst the foods with lowest nutrient density (e.g., salad greens).
In order to appreciate differences between the use of 9 vs. 11 desirable nutrients, the two indexes were compared based on the same reference unit. When NRF9.3 and 11.3 were calculated per 100 kcal, no differences in coherence with the dietary guidelines were seen in Q1 and Q5 (Table 2). Additionally, for both indicators, three out of four green food groups were represented in Q1, with fish and seafood most often missing. A slightly higher number of individual green food subgroups could be appreciated in NRF9.3 as compared to NRF11.3 (7 vs. 6). When the comparison was made between the two indexes calculated per portion size, results followed the same pattern as per 100 kcal, but, differently from NRF9.3, NRF11.3 represented food items from all four desirable food groups. Promoting foods from a variety of food groups is considered key in ensuring a high diet quality and was hence the criteria suggesting that the choice of nutrients in the Sweden-adapted NRF11.3 index was preferable over NRF9.3.
3.1.3. Weighting, Capping, and Their Combination
When weighting was applied, the ranking of foods in Q1 showed only minimal improvements in the level of coherence with the dietary guidelines, with regard to the percentage of healthy food subgroups, the number of green food groups and the individual green food items (Table 2). This was seen both when weighting was applied alone and in combination with capping, and regardless of the order these methods were applied (i.e., first capping or weighting). Importantly, for NRF11.3 calculated per 100 kcal, the application of weighting increased the number of green food groups in Q1, covering all four groups whose consumption should be increased, but did not make any difference in the case of NRF11.3 per portion, which already ranked foods most closely to the dietary guidelines.
Interestingly, capping of nutrients in the NRF formula led to lower coherence with the dietary guidelines in foods ranking in Q1 for NRF9.3, NRF11.3 as well as for NRF21.3 (Table 2).
These results suggest that weighting, capping, and their combination may play a minor role in improving the performance of nutrient density indexes in ranking foods according to the dietary guidelines. However, when using NRF11.3 per 100 kcal, the application of weighting did result in a higher coherence with the dietary guidelines.
3.2. Impact of Methodological Choices on Nutrient Density within Food Groups
All NRF index variants were also assessed within food groups (meat, dairy, and cereal products) to evaluate if methodological choices have different implications when comparing foods with a more homogeneous nutrition profile, i.e., belonging to the same food category. Across all methodological choices, NRF9.3 per 100 kcal and per 100 g were the index variants able to rank foods in the three groups with greatest coherence with the current dietary guidelines (Table 4). However, in meat and cereal products equally good results were achieved with NRF11.3 per 100 kcal and per 100 g. Food rankings in the three groups according to all 45 variants are available in the Supplementary Materials.
3.2.1. Reference Unit
As shown in Table 4, when different reference units were applied, both 100 kcal and 100 g seemed to be valuable options, leading to the same number of healthier alternatives over the group median for NRF. On the contrary, when the portion size was used, some healthier alternatives fell under the median for NRF, a direction that contradicts the dietary guidelines. This effect was noted for NRF9.3 in dairy products and for NRF21.3 in meat and cereal products. As opposite to the results observed between food subgroups (see Section 3.1.1), the analysis in meat, dairy, and cereal products suggested that the reference unit most suited for the calculation of nutrient density within food groups may be energy- or weight-based.
3.2.2. Choice of Nutrients
The calculation of NRF9.3, 11.3, and 21.3 made it possible to answer to the question of whether a higher number of nutrients would better capture the nutritional differences among foods with similar profiles. For meat and cereal products, no effect of increasing the number of nutrients from 9 to 11 in the NRF calculation was observed when comparing the indexes based on 100 kcal or 100 g (Table 4). Only when calculating the nutrient density based on NRF21.3 per portion size did the number of healthier options over the median drop from 100% to 50% for meat and from 71% to 57% for cereal products. For dairy products, this was evident for NRF21.3 irrespective of the reference unit. In line with our observations between food subgroups, the results indicate that including a larger number of nutrients in the index did not enhance the coherence with the dietary guidelines for the assessed food groups.
3.2.3. Weighting, Capping, and Their Combination
When applied to NRF calculations, the use of capping, weighting, and their combinations did not impact the final nutrient density ranking within meat and cereal products (Table 4). On the contrary, within dairy products, weighting, capping, and their combination lowered the NRF performance in the 11.3 algorithm, where the percentage of healthier options over the median dropped from 100% to 75%. Dairy products can hence be seen as the category with a somewhat higher sensitivity to the methodological choices applied to the nutrient density calculation. Overall, it can be concluded that the application of capping and/or weighting did not lead to improvements in the performance of the nutrient density indexes as assessed within these three food groups.
4. Discussion
Expressing the environmental impact of foods in relation to the nutritional quality is a promising approach in the search for methods integrating interdisciplinary sustainability perspectives, and nutrient density indexes are increasingly used as complementary FUs in LCA studies. Switching from traditional weight-based to nutrition-related FUs can greatly affect the ranking of food products in comparative studies of environmental performance, leading to a higher influence of nutritional attributes such as the energy or the nutrient content of foods [5,24]. However, the lack of standardized methods to calculate nutritional quality has led to unharmonized results difficult to compare [17]. In this study, we conducted a systematic assessment of the more relevant methodological variables for the calculation of nutrient density. Based on this, we provide an indication of the index best suited to be included in food LCA.
Nutrient density indexes analyzed in this study were shown to be useful both for comparing foods between and within food groups, which makes the method well suited for integration with LCA studies. However, when systematically assessing the impact of methodological variables, clearer indications were derived from the analysis of nutrient density between food groups.
Our results showed that the majority of the assessed index variants ranked foods coherently with the Swedish dietary guidelines, mostly promoting healthy foods among those with the highest nutrient density and unhealthy foods among those with the lowest nutrient density. This confirms that nutrient density is indeed an indicator of food quality that can be used to guide consumers’ choices and product development towards healthier options. However, the index NRF11.3, a Sweden-tailored version of NRF, when calculated per portion size and per 100 kcal with the application of weighting, was identified as ranking foods across food groups with the highest coherence with the dietary guidelines.
An important characteristic of NRF11.3 is its ability to capture a variety of nutrient dense foods, which is an important aspect to promote in healthy diets. Food products in Q1, in fact, represent all four groups emphasized by the Swedish dietary guidelines: fruits and berries, vegetables and legumes, nuts and seeds, and fish and seafood. Additionally, Strid et al. [25] recently demonstrated that, among 15 different NRF variants, NRF11.3 with capping best predicted total mortality in a Swedish population study, when used as a descriptor of diet quality. These results suggest that the index moreover is suitable to predict diet-related health effects and confirms that the choice of nutrients to be incorporated should be responsive to the specific population needs. The suggested method can therefore be seen as a suitable nutrient density index to be applied in environmental studies in a Swedish context. The index NRF11.3 combines the method strengths already embedded in the original NRF method, with a formula and evaluation processes tailored to the nutrition landscape of Sweden (Table 5). Although the NRF variants were evaluated with reference to the Swedish dietary guidelines, the principles of this analysis can be applied more broadly, both in the Nordic context and internationally, as strong similarities exist among most dietary guidelines.
Among the different method variables evaluated in this study, the choice of reference unit for NRF calculations had the largest impact on food ranking. Our results indicate that both portion size and 100 kcal can be good options of reference units in assessments comparing foods between food groups, similar to what previous studies have indicated [27]. The two approaches promoted either foods with low energy density (vegetables and fruits) or energy-dense healthy foods such as nuts and seeds. When NRF11.3 was expressed per portion, even some animal-protein options consumed in relatively large amounts showed high nutrient density (e.g., salmon, venison, poultry). These results follow the pattern identified in previous studies, where expressing the nutrient density per 100 kcal was inversely correlated with energy density, and therefore favored foods with a high-water content. Indexes based on the portion size benefited foods that were consumed in larger amounts and could better reflect the large variation of portion sizes across food groups [27]. On the contrary, the choice of 100 g as the base for calculation can produce a very different ranking favoring high energy-dense foods, such as vegetable oils and margarines. Whilst the expression of nutrient density per portion size can be more intuitively understandable for consumers, the lack of approved portion sizes in the EU and internationally makes it a difficult application even from an LCA perspective. If in the future internationally valid and harmonized portion sizes will be available, the results of this study indicate that this reference unit should be considered as a preferred choice in nutrient density indexes.
The application of weighting and capping had a smaller impact on the food ranking than the choice of refence unit. Although conceptually both are valuable methods to correct the role of individual nutrients to the final nutrient density index, our results suggest only a minor improvement deriving from weighting, and a negative impact from capping. Among the foods included in this study, capping was only relevant for use in a minority of products where the nutrient content per 100 g exceeded 100% DRI. Several nutrients were capped, but most commonly capping was required for vitamin E in nuts, seeds, enriched products, and oils, and for vitamin B12 in fish and seafood (data not shown). The use of capping may be more relevant for assessments within specific food groups, e.g., in seafood, where the high content of vitamin B12 has been shown to largely influence nutrient density scores without capping [28]. Although marginal, when weighting was applied to NRF11.3 per 100 kcal, the level of coherence with the dietary guidelines improved to the same level as NRF11.3 calculated per portion. Weighting offers the possibility to adapt the method to the specific population studied. Within the Swedish population, a healthier diet would mean increased intake of certain nutrients (e.g., vitamin D, folate, iron, selenium, and fiber) and reduced intake of others (e.g., sodium and saturated fat) [23]. Since food and nutrient intake differs between different populations and parts of the world, so will the effect of weighting on nutrient density calculations.
Our results point to the fact that including a higher number of nutrients in the nutrient density calculation does not necessarily lead to a higher coherence with the dietary guidelines in the resulting ranking of foods. This was already observed in the development of the original NRF method, where introducing more nutrients in the calculation weakened the correlation to the energy density [29] and to the HEI index [18]. Our results show, in fact, that foods ranked according to the most comprehensive NRF21.3 index variants had the lowest level of coherence with the dietary guidelines, whilst foods ranked with NRF11.3 had the highest coherence with the guidelines. The index NRF 11.3 includes two additional nutrients as compared to the base form, vitamin D and folate, of public health relevance for the Swedish adult population [23]. These nutrients have also previously been suggested to be included when assessing dietary quality within the Nordic context [30]. However, it could be argued that from the perspective of comparing foods within the same category, or in studies looking at differences between few ingredients, a score based on a large number of nutrients could be the best option. This approach has, for example, been used in the assessment of the nutritional and environmental performance of seafood [14] and flours [31]. In fact, seafoods were completely missing in Q1 when using NRF9.3, lacking the ability to capture nutrients of large importance for this food group, such as vitamin D, selenium, and omega-3 fatty acids. This observation indicates tailored nutrient indexes, where the choice of nutrients reflects the nutrient quality of a targeted food group, as an interesting possibility for future method development. In this study, however, NRF variants analyzed within meat, dairy, and cereal products categories did not point to any benefit of introducing more micronutrients in the assessment of nutrient density. The indexes based on 9 or 11 desirable nutrients better described the nutrient density of foods within these categories than NRF21.3. When analyzed within these three food groups, our results further indicated that 100 g was equally appropriate as a reference unit as was 100 kcal, leaving portion size as a less favorable option for nutrient density calculations of foods within the same category. These indications are somewhat divergent from what was observed when comparing foods across groups and should be regarded with caution. The differences were in fact only minimal among the NRF variants and derived from the observation of only three groups, where the choice of the food products included played a large role. Therefore, no conclusive indications can be drawn on which NRF method works better in the analysis of nutrient density within these groups. Overall, our results indicate that the preferred methodological choices may vary depending on purpose of the study and whether the focus is assessments between or within specific food groups.
The process of evaluating nutrient density indexes at a food product level against food-based dietary guidelines is a novelty of this study. Our results indicate that this process worked better in comparing foods with more divergent nutrient profiles, whilst further refinement and tailoring is required for the analysis of products within specific categories. Based on this, our analysis suggests the use of the index NRF11.3 (per portion size and per 100 kcal with weighting) as a suitable complementary FU in LCA studies comparing foods across categories. The systematic assessment of the most relevant methodological choices and the large base of products analyzed, including enriched, cooked, and prepared foods, and a variety of fresh, frozen, and canned products, are strengths of the method development conducted in this study. Furthermore, the result that NRF11.3 best predicted mortality in a population in northern Sweden [25] further supports and motivates the applicability of the index as a suitable nutrition indicator in environmental studies.
Limitations in this study are largely dependent on the attributes of nutrient density scores in general. The indexes were calculated based on composition data from open-access databases and therefore largely influenced by data availability and quality. Additionally, nutrient density, per se, captures the content of a selection of nutrients as the only descriptor of products’ nutritional quality. Other important aspects that contribute to the health effect of consuming a food product, i.e., the bioavailability and interaction among nutrients, other food matrix effects, the role of a food in the diet context, are not captured with this method. Importantly, nutrient density indexes cannot distinguish between foods that are naturally rich in nutrients or enriched. Although originally developed with primary focus to unenriched foods [32], nutrient density indexes are today largely applied to both unenriched and enriched products. However, how to handle enrichment requires special attention when applying NRF as a complementary FU in environmental studies in order to avoid erroneous conclusions of the relative environmental impact of foods. Although optimal in reflecting the current dietary guidelines, the NRF11.3 index promoted in this study has not solved some of the inherent method limitations, and more research on how to include these aspects should be carried out in the future.
5. Conclusions
The need to harmonize how nutrition quality is included as a component of food LCA has led to the method development conducted in this study. Here, a nutrient density index able to rank food products with the highest level of coherence with the dietary guidelines was identified through a novel evaluation process and a systematic assessment of numerous method variables. The results demonstrate implications of methodological choices when calculating the nutrient density of food. A Sweden-tailored version of NRF, including 11 desirable nutrients and three undesirable nutrients, calculated per portion size or 100 kcal with the application of weighting, was suggested as a suitable index to be included as complementary FU in comparative LCA studies across food categories. The index highlighted offers guidance to LCA researchers regarding which nutrition indicator should be included as a complementary FU. However, the involvement of both environmental and nutrition scientists is advisable when conducting a food LCA study for a full discussion and understanding of the implications deriving from adopting a nutrition indicator as compared to a traditional weight-based FU.
Supplementary Materials
The following are available online at https://www.mdpi.com/2071-1050/12/21/8992/s1, Table S1: List of analyzed food products from the Swedish market, partition in subgroups and groups, and portion sizes; Table S2: Nutrients included in the nutritional assessment and reference values; Table S3a: Food subgroups ranking in the highest quintile (quintile one, Q1) for nutrient density calculated as NRF9.3 and according to different method choices; Table S3b: Food subgroups ranking in the highest quintile (quintile one, Q1) for nutrient density calculated as NRF11.3 and according to different method choices; Table S3c: Food subgroups ranking in the highest quintile (quintile one, Q1) for nutrient density calculated as NRF21.3 and according to different method choices; Table S4a: Ranking of foods in the meat category over and under the median for nutrient density; Table S4b: Ranking of foods in the dairy category over and under the median for nutrient density; Table S4c: Ranking of foods in the cereal products category over and under the median for nutrient density.
Author Contributions
Conceptualization, E.H., U.S., A.W.; Methodology M.B.; Validation, A.S.; Formal analysis, A.S., M.B.; Writing—original draft preparation, M.B.; Writing—review and editing, A.S., E.H., A.W., U.S., A.-K.L.; Visualization, M.B., A.S.; Supervision, U.S.; Project administration, M.B.; Funding acquisition, U.S., E.H. All authors have read and agreed to the published version of the manuscript.
Funding
This research was funded by Stiftelsen Lantbruksforskning, grant no R-18-26-133.
Acknowledgments
Data on the added sugar content were provided by the Swedish National Food Agency. Arla Foods, Fazer, Kronägg, IKEA and Orkla Foods contributed to identifying useful food products to be included in this analysis.
Conflicts of Interest
The authors declare no conflict of interest. The food companies participating in the project had no role in the design of the study, analysis or interpretation of data.
References
- World Health Organization. Nutrient Profiling: Report of a WHO/IASO Technical Meeting, London, UK, 4–6 October 2010. Available online: https://www.who.int/nutrition/publications/profiling/WHO_IASO_report2010/en/ (accessed on 11 May 2020).
- Nordic Council of Ministers. Nordic Nutrition Recommendations 2012. 2014. Available online: https://www.norden.org/en/publication/nordic-nutrition-recommendations-2012 (accessed on 2 April 2019).
- Swedish Food Agency. Hitta Ditt sätt att äta Grönare, Lagom Mycket och Röra på Dig (Find Your Way—To Eat Greener, Adequate and to Do Physical Activity). 2017. (In Swedish). Available online: https://www.livsmedelsverket.se/globalassets/publikationsdatabas/broschyrer/kostraed_webb.pdf (accessed on 10 June 2019).
- Nemecek, T.T.; Jungbluth, N.N.; I Canals, L.M.M.; Schenck, R. Environmental impacts of food consumption and nutrition: Where are we and what is next? Int. J. Life Cycle Assess. 2016, 21, 607–620. [Google Scholar] [CrossRef] [Green Version]
- Drewnowski, A.A.; Rehm, C.D.D.; Martin, A.A.; Verger, E.O.O.; Voinnesson, M.M.; Imbert, P. Energy and nutrient density of foods in relation to their carbon footprint. Am. J. Clin. Nutr. 2015, 101, 184–191. [Google Scholar] [CrossRef]
- Van Kernebeek, H.R.J.J.; Oosting, S.J.J.; Feskens, E.J.M.M.; Gerber, P.J.; De Boer, I.J.M. The effect of nutritional quality on comparing the environmental impact of human diets. J. Clean. Prod. 2014, 73, 88–99. [Google Scholar] [CrossRef]
- Notarnicola, B.; Slala, S.; Anton, A.; McLaren, S.; Saoter, E.; Sonesson, U. The role of life cycle assessment in supporting sustainable agi-food systems: A review of the challenges. J. Clean. Prod. 2017, 140, 399–409. [Google Scholar] [CrossRef]
- Doran-Browne, N.A.; Eckard, R.J.; Behrendt, R.; Kingwell, R.S. Nutrient density as a metric for comparing greenhouse gas emissions from food production. Clim. Chang. 2015, 129, 73–87. [Google Scholar] [CrossRef]
- Drewnowski, A. Defining nutrient density: Development and validation of the nutrient rich foods index. J. Am. Coll. Nutr. 2009, 28, 421S–426S. [Google Scholar] [CrossRef]
- Sonesson, U.; Davis, J.; Flysjö, A.; Gustavsson, J.; Witthöft, C. Protein quality as functional unit–a methodological framework for inclusion in life cycle assessment of food. J. Clean. Prod. 2017, 140, 470–478. [Google Scholar] [CrossRef]
- Scherer, L.; Behrens, P.; Tukker, A. Opportunity for a dietary win-win-win in nutrition, environment, and animal welfare. One Earth 2019, 1, 349–360. [Google Scholar] [CrossRef] [Green Version]
- González-García, S.; Esteve-Llorens, X.; Moreira, M.T.; Feijbo, G. Carbon footprint and nutritional quality of different human dietary choices. Sci. Total. Environ. 2018, 644, 77–94. [Google Scholar] [CrossRef]
- McAuliffe, G.A.; Takahashi, T.; Lee, M.R.F. Applications of nutritional functional units in commodity-level life cycle assessment (LCA) of agri-food systems. Int. J. Life Cycle Assess. 2020, 25, 208–221. [Google Scholar] [CrossRef] [PubMed] [Green Version]
- Hallström, E.; Bergman, K.; Mifflin, K.; Parker, R.; Tyedmers, P.; Troell, M.; Ziegler, F. Combined climate and nutritional performance of seafoods. J. Clean. Prod. 2019, 230, 402–411. [Google Scholar] [CrossRef]
- Sonesson, U.; Davis, J.; Hallström, E.; Woodhouse, A. Dietary-dependent nutrient quality indexes as complementary functional unit in LCA: A feasible option? J. Clean. Prod. 2019, 211, 620–627. [Google Scholar] [CrossRef]
- Saarinen, M.; Fogelholm, M.; Tahvonen, R.; Kurppa, S. Taking nutrition into account within the life cycle assessment of food products. J. Clean. Prod. 2017, 149, 828–844. [Google Scholar] [CrossRef]
- Hallström, E.; Davis, J.; Woodhouse, A.; Sonesson, U. Using dietary quality scores to assess sustainability of food products and human diets: A systematic review. Ecol. Indic. 2018, 93, 219–230. [Google Scholar] [CrossRef]
- Fulgoni, V.L.; Keast, D.R.; Drewnowski, A. Development and validation of the nutrient-rich foods index: A tool to measure nutritional quality of foods. J. Nutr. 2009, 139, 1549–1554. [Google Scholar] [CrossRef] [Green Version]
- Norberg, M.; Wall, S.; Boman, K.; Weinhall, L. The Vasterbotten Intervention Programme: Background, design and implications. Glob. Health Action. 2010, 3. [Google Scholar] [CrossRef]
- Swedish Food Agency. Livsmedelsdatabasen (Food Composition Database), Version 20171215. Available online: https://www.livsmedelsverket.se/livsmedelsdatabasen (accessed on 8 April 2019).
- Wanselius, J.; Axelsson, C.; Moraeus, L.; Berg, C.; Mattison, I.; Larsson, C. Procedure to estimate added and free sugars in food items from the Swedish food composition database used in the national dietary survey Riskmaten adolescents 2016–2017. Nutrients 2019, 11, 1342. [Google Scholar] [CrossRef] [Green Version]
- The United States Department of Agriculture (USDA). FoodData Central. Available online: https://ndb.nal.usda.gov/ndb/search/list?home=true (accessed on 22 April 2019).
- Amcoff, E.; Edberg, A.; Enghardt Barbieri, H.; Karin Lindroos, A.K.; Nälsén, C.; Pearson, M.; Warensjö Lemming, E. Livsmedels-och Näringsintag Bland Vuxna i Sverige. Riksmaten-Vuxna 2010–2011. (The Food and Nutrient Intake among Adults in Sweden. Riksmaten-Adults 2010–2011); Swedish Food Agency: Uppsala, Sweden, 2017; (In Swedish). Available online: http://www.slv.se/upload/dokument/rapporter/mat_naring/2012/riksmaten_2010_2011.pdf (accessed on 13 May 2019).
- Masset, G.; Vieux, F.; Darmon, N. Which functional unit to identify sustainable foods? Public Health Nutr 2015, 18, 2488–2497. [Google Scholar] [CrossRef]
- Strid, A.; Johansson, I.; Bianchi, M.; Sonesson, U.; Hallström, E.; Lindhal, B.; Winkvist, A. Diets benefiting health and climate relate to longevity in northern Sweden. Am. J. Clin. Nutr. (under review).
- Strid, A.; Hallström, E.; Sonesson, U.; Sjons, J.; Winkvist, A.; Bianchi, M. Evaluation of sustainability indicators for foods benefiting climate and health. J. Nutr. (in preparation).
- Drewnowski, A.; Maillot, M.; Darmon, N. Should nutrient profiles be based on 100 g, 100 kcal or serving size? Eur. J. Clin. Nutr. 2009, 63, 898–904. [Google Scholar] [CrossRef] [Green Version]
- Bianchi, M.A.; Hallström, E.; Parker, R.W.R.; Mifflin, K.; Tyedmers, P.; Ziegler, F. Climate costs and nutritional benefits of seafood: A global perspective. Nat. Food. (under review).
- Drewnowski, A.; Maillot, M.; Darmon, N. Testing nutrient profile models in relation to energy density and energy cost. Eur. J. Clin. Nutr. 2009, 63, 674–683. [Google Scholar] [CrossRef] [PubMed] [Green Version]
- Röös, E.; Karlsson Potter, H.; Witthöf, C.M.; Sundberg, C. Evaluating the sustainability of diets–combining environmental and nutritional aspects. Env. Sci. Policy. 2015, 47, 157–166. [Google Scholar] [CrossRef]
- Chaudhary, A.; Marinangeli, C.; Tremorin, D.; Mathys, A. Nutritional combined greenhouse gas life cycle analysis for incorporating Canadian yellow pea into cereal-based food products. Nutrients 2018, 10, 490. [Google Scholar] [CrossRef] [PubMed] [Green Version]
- Drewnowski, A.; Fulgoni, V.L. Nutrient profiling of foods: Creating a nutrient-rich food index. Nutr. Rev. 2008, 66, 23–29. [Google Scholar] [CrossRef]
Figure 1.
Five-step assessment of nutrient density in 118 food products according to different methodological choices.
Figure 1.
Five-step assessment of nutrient density in 118 food products according to different methodological choices.


Table 1.
Summary of the methodological choices applied to the Nutrient Rich Food (NRF) index.
| Choice of Reference Unit | Choice of Nutrients | Choice of Adjusting Individual Nutrients Contribution | |||||
|---|---|---|---|---|---|---|---|
| Reference Amount | Rationale for Including | Index | Desirable Nutrients | Non-Desirable Nutrients | Rationale for Including | Method | Rationale for Including |
| 100 kcal | It gives benefit to low energy dense foods which are promoted by dietary guidelines | NRF9.3 | Protein, fiber, vitamins A, C, E, Ca, Fe, Mg, K | Saturated fat, added sugar, Na | It has been largely used in the literature and validated against HEI 1 in the US NHANES study | Capping: when (100 xNutrient i/RDI) exceeds 100, the value is set to 100. Only desirable nutrients are capped, with the exception of omega-3 and fiber. Capping value for protein is set at 20% E. | It allows to avoid crediting overconsumption of nutrients |
| 100 g | It is consistent with EU food labeling | NRF11.3 | Protein, fiber, vitamins A, C, E, D, folate, Ca, Fe, Mg, K | Saturated fat, added sugar, Na | It includes vitamin D and folate, nutrients of key concern for the Swedish population 2 | Weighting: obtained multiplying Nutrient i and Nutrient j for weighting factors derived from: desirable nutrients: (DRI of nutrient)/(mean intake of nutrient in the studied population 2); non-desirable nutrients: (mean intake of nutrient in the studied population 2)/(MRI of nutrient) | It allows adjusting the contribution of nutrients based on the nutrition status of the studied population |
| Portion size | It is easier to understand for the consumer | NRF21.3 | Protein, fiber, omega-3, vitamins A, C, E, D, thiamin, riboflavin, niacin, B6, B12, folate, Ca, Fe, Mg, K, I, P, Se, Zn | Saturated fat, added sugar, Na | It includes most nutrients from the Nordic Nutrition Recommendations 3,4 | Combined capping and weighting | It combines the advantages of both methods |
Table 2.
Level of coherence with the dietary guidelines in highest (Q1) and lowest (Q5) quintiles of nutrient density when 53 food subgroups are ranked according to 45 Nutrient Rich Food index (NRF) variants.
Table 2.
Level of coherence with the dietary guidelines in highest (Q1) and lowest (Q5) quintiles of nutrient density when 53 food subgroups are ranked according to 45 Nutrient Rich Food index (NRF) variants.
| % Coherence 3 | Nr Green Food Groups 4 | Nr Green Food Items 5 | ||||||
|---|---|---|---|---|---|---|---|---|
| Index 1 | Reference Unit | Q1 2 | Q5 2 | Q1 2 | Q5 2 | Q1 2 | Q5 2 | Missing Green Groups 6 |
| NRF9.3 | 100 kcal | 81.8 | 100 | 3 | 0 | 6 | 0 | F & SF |
| NRF9.3 | 100 g | 81.8 | 100 | 3 | 0 | 4 | 0 | F & SF |
| NRF9.3 | portion | 81.8 | 100 | 3 | 0 | 7 | 0 | F & SF |
| NRF9.3 W | 100 kcal | 81.8 | 100 | 3 | 0 | 7 | 0 | F & SF |
| NRF9.3 W | 100 g | 81.8 | 100 | 3 | 0 | 4 | 0 | F & SF |
| NRF9.3 W | portion | 81.8 | 100 | 3 | 0 | 7 | 0 | F & SF |
| NRF9.3 C | 100 kcal | 81.8 | 100 | 3 | 0 | 6 | 0 | F & SF |
| NRF9.3 C | 100 g | 72.7 | 100 | 3 | 0 | 4 | 0 | F & SF |
| NRF9.3 C | portion | 81.8 | 100 | 3 | 0 | 7 | 0 | F & SF |
| NRF9.3 W + C | 100 kcal | 81.8 | 100 | 3 | 0 | 7 | 0 | F & SF |
| NRF9.3 W + C | 100 g | 72.7 | 100 | 3 | 0 | 4 | 0 | F & SF |
| NRF9.3 W + C | portion | 81.8 | 100 | 3 | 0 | 7 | 0 | F & SF |
| NRF9.3 C + W | 100 kcal | 81.8 | 100 | 3 | 0 | 7 | 0 | F & SF |
| NRF9.3 C + W | 100 g | 72.7 | 100 | 3 | 0 | 4 | 0 | F & SF |
| NRF9.3 C + W | portion | 81.8 | 100 | 3 | 0 | 7 | 0 | F & SF |
| NRF11.3 | 100 kcal | 81.8 | 100 | 3 | 0 | 5 | 0 | F & SF |
| NRF11.3 | 100 g | 72.7 | 100 | 4 | 0 | 5 | 0 | |
| NRF11.3 * | portion | 81.8 | 100 | 4 | 0 | 6 | 0 | |
| NRF11.3 W * | 100 kcal | 81.8 | 100 | 4 | 0 | 6 | 0 | |
| NRF11.3 W | 100 g | 72.7 | 100 | 4 | 0 | 5 | 0 | |
| NRF11.3 W | portion | 81.8 | 100 | 4 | 0 | 6 | 0 | |
| NRF11.3 C | 100 kcal | 81.8 | 100 | 3 | 0 | 5 | 0 | F & SF |
| NRF11.3 C | 100 g | 63.6 | 100 | 4 | 0 | 5 | 0 | |
| NRF11.3 C | portion | 81.8 | 100 | 4 | 0 | 6 | 0 | |
| NRF11.3 W + C | 100 kcal | 81.8 | 100 | 4 | 0 | 6 | 0 | |
| NRF11.3 W + C | 100 g | 72.7 | 100 | 4 | 0 | 5 | 0 | |
| NRF11.3 W + C | portion | 81.8 | 100 | 4 | 0 | 6 | 0 | |
| NRF11.3 C + W | 100 kcal | 81.8 | 100 | 4 | 0 | 6 | 0 | |
| NRF11.3 C + W | 100 g | 72.7 | 100 | 4 | 0 | 5 | 0 | |
| NRF11.3 C + W | portion | 81.8 | 100 | 4 | 0 | 6 | 0 | |
| NRF21.3 | 100 kcal | 81.8 | 90.9 | 3 | 0 | 7 | 0 | N & S |
| NRF21.3 | 100 g | 72.7 | 90.9 | 2 | 1 | 5 | 1 | F & B, V & L |
| NRF21.3 | portion | 54.5 | 90.9 | 3 | 1 | 5 | 1 | F & B, V & L |
| NRF21.3 W | 100 kcal | 81.8 | 100 | 3 | 0 | 7 | 0 | N & S |
| NRF21.3 W | 100 g | 72.7 | 90.9 | 2 | 1 | 5 | 1 | F & B, V & L |
| NRF21.3 W | portion | 63.6 | 100 | 3 | 0 | 5 | 0 | F & B |
| NRF21.3 C | 100 kcal | 81.8 | 90.9 | 2 | 0 | 6 | 0 | N & S, F & B |
| NRF21.3 C | 100 g | 63,6 | 90.9 | 2 | 1 | 5 | 1 | F & B, V & L |
| NRF21.3 C | portion | 54.5 | 90.9 | 3 | 1 | 5 | 1 | F & B |
| NRF21.3 W + C | 100 kcal | 81.8 | 100 | 3 | 0 | 6 | 0 | N & S |
| NRF21.3 W + C | 100 g | 72.7 | 100 | 2 | 0 | 5 | 0 | F & B, V & L |
| NRF21.3 W + C | portion | 63.6 | 100 | 3 | 0 | 5 | 0 | F & B |
| NRF21.3 C + W | 100 kcal | 81.8 | 100 | 3 | 0 | 6 | 0 | N & S |
| NRF21.3 C + W | 100 g | 72.7 | 90.9 | 3 | 1 | 6 | 1 | V & L |
| NRF21.3 C + W | portion | 63.6 | 100 | 3 | 0 | 5 | 0 | F & B |
1 NRF variants calculated with base algorithm, and with the application of weighting (W), capping (C), and a combination of both (W + C; C + W); 2 Q1 and Q5: highest and lowest quintile for NRF for 53 food subgroups; 3 % coherence: % of green (eat more of) and yellow (healthier alternative) food subgroups (Q1), % of red (eat less of) food subgroups (Q5); 4 number of green (eat more of) food groups according to the Swedish food-based dietary guidelines. Total number is 4: vegetables and legumes; fruits and berries; fish and seafood; nuts and seeds; 5 number of green (eat more of) food subgroups; 6 Missing green groups: F&SF (fish and seafood), N&S (nuts and seeds), V&L (vegetables and legumes), F&B (fruit and berries). In bold NRF variants with highest performance according to the three criteria. * NRF variants with the highest performance at the simplest calculation algorithm.
Table 3.
Food subgroups scoring in quintile one (Q1, highest quintile) for nutrient density, when calculated with the Nutrient Rich Food (NRF) index NRF11.3 per portion size and 100 kcal, with and without the application of capping and/or weighting.
Table 3.
Food subgroups scoring in quintile one (Q1, highest quintile) for nutrient density, when calculated with the Nutrient Rich Food (NRF) index NRF11.3 per portion size and 100 kcal, with and without the application of capping and/or weighting.
| NRF11.3 Per Portion | ||||
|---|---|---|---|---|
| No Weighting | Capped | Weighted | Weighted and Capped | Capped and Weighted |
| Salmon | Legumes | Salmon | Legumes | Legumes |
| Legumes | Seeds | Legumes | Seeds | Salmon |
| Seeds | Salmon | Seeds | Salmon | Seeds |
| Plant-based meat substitutes | Plant-based meat substitutes | Plant-based meat substitutes | Plant-based meat substitutes | Plant-based meat substitutes |
| Juice | Juice | Berries | Berries | Berries |
| Berries | Berries | Juice | Juice | Juice |
| Enriched plant-based drinks | Enriched plant-based drinks | Cabbage, broccoli, and spinach | Cabbage, broccoli, and spinach | Cabbage, broccoli, and spinach |
| Cabbage, broccoli, and spinach | Cabbage, broccoli, and spinach | Root vegetables | Root vegetables | Root vegetables |
| Root vegetables | Root vegetables | Poultry | Poultry | Poultry |
| Venison (deer bred in captivity) | Venison (deer bred in captivity) | Enriched plant-based drinks | Enriched plant-based drinks | Enriched plant-based drinks |
| Poultry | Poultry | Venison (deer bred in captivity) | Venison (deer bred in captivity) | Venison (deer bred in captivity) |
| NRF11.3 per 100 kcal | ||||
| No weighting | Capped | Weighted | Weighted and capped | Capped and weighted |
| Cabbage, broccoli, and spinach | Cabbage, broccoli, and spinach | Cabbage, broccoli, and spinach | Cabbage, broccoli, and spinach | Cabbage, broccoli, and spinach |
| Salad vegetables | Salad vegetables | Salad vegetables | Salad vegetables | Salad vegetables |
| Berries | Berries | Berries | Berries | Berries |
| Citrus fruit | Citrus fruit | Citrus fruit | Citrus fruit | Citrus fruit |
| Juice | Juice | Liver paste | Juice | Enriched plant-based drinks |
| Liver paste | Enriched plant-based drinks | Juice | Enriched plant-based drinks | Juice |
| Enriched plant-based drinks | Liver paste | Enriched plant-based drinks | Liver paste | Liver paste |
| Egg | Egg | Egg | Egg | Egg |
| Seeds | Seeds | Plant-based meat substitutes | Plant-based meat substitutes | Plant-based meat substitutes |
| Plant-based meat substitutes | Plant-based meat substitutes | Pelagic fish | Pelagic fish | Pelagic fish |
| Low fat milk, yoghurt, and soured milk | Low fat milk, yoghurt, and soured milk | Seeds | Seeds | Seeds |
Foods are color-coded according to the Swedish food-based dietary guidelines [3]: green indicates foods whose consumption should be increased, yellow indicates foods that represent healthier alternatives and should hence be preferred; red indicates foods whose consumption should be reduced.
Table 4.
Level of coherence with the dietary guidelines over and under the median for nutrient density in three food groups. Nutrient Rich Food (NRF) indexes calculated according to different methodological variables.
Table 4.
Level of coherence with the dietary guidelines over and under the median for nutrient density in three food groups. Nutrient Rich Food (NRF) indexes calculated according to different methodological variables.
| Nr and (%) Healthier Alternatives | |||||||
|---|---|---|---|---|---|---|---|
| Meat, Chicken, Egg 2 (n = 13) | Dairy Products 3 (n = 13) | Cereal Products 4 (n = 13) | |||||
| Index 1 | Reference Unit | Over Median | Under Median | Over Median | Under Median | Over Median | Under Median |
| NRF9.3 | 100 kcal | 2 (100) | 0 | 4 (100) | 0 | 5 (71) | 2 |
| NRF9.3 | 100 g | 2 (100) | 0 | 4 (100) | 0 | 5 (71) | 2 |
| NRF9.3 | portion | 2 (100) | 0 | 3 (75) | 1 | 5 (71) | 2 |
| NRF9.3 W | 100 kcal | 2 (100) | 0 | 4 (100) | 0 | 5 (71) | 2 |
| NRF9.3 W | 100 g | 2 (100) | 0 | 4 (100) | 0 | 5 (71) | 2 |
| NRF9.3 W | portion | 2 (100) | 0 | 3 (75) | 1 | 5 (71) | 2 |
| NRF9.3 C | 100 kcal | 2 (100) | 0 | 4 (100) | 0 | 5 (71) | 2 |
| NRF9.3 C | 100 g | 2 (100) | 0 | 4 (100) | 0 | 5 (71) | 2 |
| NRF9.3 C | portion | 2 (100) | 0 | 3 (75) | 1 | 5 (71) | 2 |
| NRF9.3 W + C | 100 kcal | 2 (100) | 0 | 4 (100) | 0 | 5 (71) | 2 |
| NRF9.3 W + C | 100 g | 2 (100) | 0 | 4 (100) | 0 | 5 (71) | 2 |
| NRF9.3 W + C | portion | 2 (100) | 0 | 3 (75) | 1 | 5 (71) | 2 |
| NRF9.3 C + W | 100 kcal | 2 (100) | 0 | 4 (100) | 0 | 5 (71) | 2 |
| NRF9.3 C + W | 100 g | 2 (100) | 0 | 4 (100) | 0 | 5 (71) | 2 |
| NRF9.3 C + W | portion | 2 (100) | 0 | 3 (75) | 1 | 5 (71) | 2 |
| NRF11.3 | 100 kcal | 2 (100) | 0 | 4 (100) | 0 | 5 (71) | 2 |
| NRF11.3 | 100 g | 2 (100) | 0 | 4 (100) | 0 | 5 (71) | 2 |
| NRF11.3 | portion | 2 (100) | 0 | 3 (75) | 1 | 5 (71) | 2 |
| NRF11.3 W | 100 kcal | 2 (100) | 0 | 3 (75) | 1 | 5 (71) | 2 |
| NRF11.3 W | 100 g | 2 (100) | 0 | 3 (75) | 1 | 5 (71) | 2 |
| NRF11.3 W | portion | 2 (100) | 0 | 3 (75) | 1 | 5 (71) | 2 |
| NRF11.3 C | 100 kcal | 2 (100) | 0 | 3 (75) | 1 | 5 (71) | 2 |
| NRF11.3 C | 100 g | 2 (100) | 0 | 3 (75) | 1 | 5 (71) | 2 |
| NRF11.3 C | portion | 2 (100) | 0 | 3 (75) | 1 | 5 (71) | 2 |
| NRF11.3 W + C | 100 kcal | 2 (100) | 0 | 3 (75) | 1 | 5 (71) | 2 |
| NRF11.3 W + C | 100 g | 2 (100) | 0 | 3 (75) | 1 | 5 (71) | 2 |
| NRF11.3 W + C | portion | 2 (100) | 0 | 3 (75) | 1 | 5 (71) | 2 |
| NRF11.3 C + W | 100 kcal | 2 (100) | 0 | 3 (75) | 1 | 5 (71) | 2 |
| NRF11.3 C + W | 100 g | 2 (100) | 0 | 3 (75) | 1 | 5 (71) | 2 |
| NRF11.3 C + W | portion | 2 (100) | 0 | 3 (75) | 1 | 5 (71) | 2 |
| NRF21.3 | 100 kcal | 2 (100) | 0 | 3 (75) | 1 | 5 (71) | 2 |
| NRF21.3 | 100 g | 2 (100) | 0 | 3 (75) | 1 | 5 (71) | 2 |
| NRF21.3 | portion | 1 (50) | 1 | 3 (75) | 1 | 4 (57) | 3 |
| NRF21.3 W | 100 kcal | 2 (100) | 0 | 3 (75) | 1 | 5 (71) | 2 |
| NRF21.3 W | 100 g | 2 (100) | 0 | 3 (75) | 1 | 5 (71) | 2 |
| NRF21.3 W | portion | 1 (50) | 1 | 3 (75) | 1 | 4 (57) | 3 |
| NRF21.3 C | 100 kcal | 2 (100) | 0 | 3 (75) | 1 | 5 (71) | 2 |
| NRF21.3 C | 100 g | 2 (100) | 0 | 3 (75) | 1 | 5 (71) | 2 |
| NRF21.3 C | portion | 1 (50) | 1 | 3 (75) | 1 | 4 (57) | 3 |
| NRF21.3 W + C | 100 kcal | 2 (100) | 0 | 3 (75) | 1 | 5 (71) | 2 |
| NRF21.3 W + C | 100 g | 2 (100) | 0 | 3 (75) | 1 | 5 (71) | 2 |
| NRF21.3 W + C | portion | 1 (50) | 1 | 3 (75) | 1 | 4 (57) | 3 |
| NRF21.3 C + W | 100 kcal | 2 (100) | 0 | 3 (75) | 1 | 5 (71) | 2 |
| NRF21.3 C + W | 100 g | 2 (100) | 0 | 3 (75) | 1 | 5 (71) | 2 |
| NRF21.3 C + W | portion | 1 (50) | 1 | 3 (75) | 1 | 4 (57) | 3 |
1 NRF variants calculated with base algorithm, and with the application of weighting (W), capping (C), and a combination of both (W + C; C + W); 2 Healthier alternatives are chicken and egg; 3 Healthier alternatives are low-fat dairy products; 4 Healthier alternatives are wholegrain products.
Table 5.
Summary of the key features of the Nutrient Rich Food (NRF) index NRF11.3.
| Attributes of the original NRF method development | Developed and validated in a science-driven process |
| Based on open-access food composition databases | |
| Balanced approach with the inclusion of both desirable and undesirable nutrients | |
| Usability across food categories | |
| Translate nutrient content per 100 kcal to percent of daily values and applies capping to 100% | |
| Validated against the Healthy Eating Index (HEI) in the US NHANES study 1 | |
| Specific attributes of NRF11.3 developed in this study | Validation based on the level of coherence to the Swedish food-based dietary guidelines |
| Food composition from the Swedish Food Composition Database | |
| Includes shortfall nutrients for the Swedish population (vit D, folate) | |
| Based on Dietary Reference Intakes for the Swedish population | |
| Selected algorithm based on uncapped weighted percent of daily values per 100 kcal or uncapped percent daily values per serving size | |
| Suitable to use in combination with environmental impact indicators 2 | |
| Validated against mortality in the Västerbotten Intervention Programme 3 |
Publisher’s Note: MDPI stays neutral with regard to jurisdictional claims in published maps and institutional affiliations. |
© 2020 by the authors. Licensee MDPI, Basel, Switzerland. This article is an open access article distributed under the terms and conditions of the Creative Commons Attribution (CC BY) license (http://creativecommons.org/licenses/by/4.0/).
Share and Cite
MDPI and ACS Style
Bianchi, M.; Strid, A.; Winkvist, A.; Lindroos, A.-K.; Sonesson, U.; Hallström, E. Systematic Evaluation of Nutrition Indicators for Use within Food LCA Studies. Sustainability 2020, 12, 8992. https://doi.org/10.3390/su12218992
AMA Style
Bianchi M, Strid A, Winkvist A, Lindroos A-K, Sonesson U, Hallström E. Systematic Evaluation of Nutrition Indicators for Use within Food LCA Studies. Sustainability. 2020; 12(21):8992. https://doi.org/10.3390/su12218992
Chicago/Turabian StyleBianchi, Marta, Anna Strid, Anna Winkvist, Anna-Karin Lindroos, Ulf Sonesson, and Elinor Hallström. 2020. "Systematic Evaluation of Nutrition Indicators for Use within Food LCA Studies" Sustainability 12, no. 21: 8992. https://doi.org/10.3390/su12218992
Note that from the first issue of 2016, this journal uses article numbers instead of page numbers. See further details here.