Article

Estimating Invasion Dynamics with Geopolitical Unit-Level Records: The Optimal Method Depends on Irregularity and Stochasticity of Spread

1
Department of Entomology and Plant Pathology, University of Tennessee, Knoxville, TN 37996, USA
2
Center for Geospatial Analytics, North Carolina State University, Raleigh, NC 27695, USA
3
Department of Geography, University of Tennessee, Knoxville, TN 37996, USA
4
Department of Forest Resources Management, University of British Columbia, Vancouver, BC V6T 1Z4, Canada
*
Author to whom correspondence should be addressed.
Sustainability 2020, 12(20), 8526; https://doi.org/10.3390/su12208526
Submission received: 3 August 2020 / Revised: 8 October 2020 / Accepted: 12 October 2020 / Published: 15 October 2020

Abstract

:
Biological invasions are an ongoing threat for sustainability of ecosystems, and estimating the spread of invasive species is critical for making management decisions. Geopolitical unit-level data (GULD) are often used to estimate invasions due to their wide availability, and researchers had evaluated the abilities of multiple methods to estimate invasion with GULD. However, earlier studies were case based and only addressed limited information on the spread, thus making it inadequate to determine which method to choose to estimate invasions with GULD under various spread scenarios. Here, we conducted a simulation study to (1) evaluate performances of eight methods on estimating expansion patterns, spread rates, and spread dynamics of invasive species with GULD; (2) assess the impact of size and homogeneity of size of geopolitical unit on the estimations by studied methods; (3) evaluate the similarities of all studied methods. Additionally, we presented a concave hull boundary displacement method (Ctd_BD) and an area-based regression method (SqrtNA_R) to estimate spread with GULD. Three regions with varying sizes of counties in the United States (U.S.) were selected to conduct the simulations, and three spread scenarios and three expansion patterns were simulated. AIC, and R2 and root mean square error (RMSE) were used to evaluate the accuracy of methods on estimating expansion pattern, and overall spread rate and spread dynamics, respectively. Correlation coefficient and RMSE were used to assess the similarity of eight methods. We found Ctd_BD and area-based regression methods consistently estimated the right expansion patterns. Boundary displacement and area-based regression methods estimated highly correlated spread rates and dynamics. Distance-based regression methods provided a high accuracy on estimating overall spread rate without long-distance jump dispersal but performed poorly on estimating the spread dynamics. We recommend boundary displacement method, especially Ctd_BD, for estimating spread with GULD, whereas for spread without clear infestation boundaries, distance-based regression can be used to estimate overall spread rate and area-based regression can be used to estimate spread dynamics.

1. Introduction

As a major component of global change, biological invasions continue to pose significant threats on ecosystems sustainability, decrease biodiversity, and cause substantial economic losses [1,2]. Management of invasive species is the key to minimize their economic and environmental impacts. Estimating the spread of invasive species can provide valuable information on when and where a further invasion may occur, thus guide the early management of the invasive species to increase control efficacy and promote environmental sustainability [1,3,4]. The spread of an invasive species may show an increasing, decreasing or stable rate, which can be affected by the internal dispersal ability of the species, environmental factors, and human activities [3,5,6]. Estimating spread dynamics of the invasive species can shed light on the trend of spread rate over the invasion period, and such information can effectively facilitate decision on early management and analysis on factors impacting the spread [5,6].
Estimating spread of invasive species has been conducted at local to global spatial scales [5,6,7,8]. Data collected through field sampling are frequently used in studies conducted at local scales [5,9], whereas research on regional or larger scales utilize records collected from online databases, published research, surveys, or field sampling [8,10]. The collected data for large-scale research are often aggregated to geopolitical unit-level records (i.e., city, county, parish, state, etc.) to unify their spatial scales [7,11,12]. Additionally, quarantines initiated by governments or institutions are usually conducted and reported at the geopolitical unit-level [13,14,15]. Consequently, geopolitical unit-level data (GULD), i.e., presence or absence at a geopolitical unit level, is usually the most abundant information for invasive species. During the past decades, several researchers worldwide used multiple methods to estimate spread of invasive species at various spatial scales with GULD [7,11].
Several researchers have compared the accuracy of these methods and validated the use of GULD to estimate invasion rates [14,15]. However, earlier research focused on specific species, thus the generality of their results on performances of these methods to estimate spread with different dispersal traits remain unknown [15]. Additionally, these studies only compared the overall spread rate, i.e., a spread rate for the whole invasion period, and lacked at evaluations of methods on estimating spread dynamics, i.e., the spread rate for different invasion periods. Spread of invasive species, especially at large scales, is commonly complex due to spatial heterogeneity and stochastic events, such as uncommon weather conditions or long-distance jump dispersal [8,16]. Estimating the spread with GULD further increases the complexity, as the spatial resolution is coarse and there can be large variations in the sizes of geopolitical units. Thus, compared to estimating one single overall spread rate, providing spread dynamics across different time scales are more informative for understanding the invasion process [16]. Additionally, earlier research did not examine the ability of different methods on estimating expansion patterns, i.e., the change pattern of spread rate through the invasion period. Estimating these expansion patterns of invasive species can provide insights on the temporal dynamics of the invasion rate and facilitate the prediction of future spread.
Despite the widely use of GULD to estimate spread of invasive species, studies evaluating the impact of geopolitical unit size on the estimated spread rates remain absent. Dramatic variations in geopolitical unit size are common especially for regional and larger spatial scales, which might lead to inaccurate assessments of the estimated invasion rate. Additionally, an evaluation of the similarity patterns of the commonly used methods on estimating overall spread rate and spread dynamics is rare [15,17,18]. A variety of measurements (such as number of infested county, total infested area, and spread distance) had been used by different estimation methods to estimate the invasions [15,17,18], thus the estimated spread rates may vary depending on the measurement used. However, the spatial or temporal change pattern of spread rate revealed by different methods could be essentially similar [3]. For example, spread rates estimated by using number of infested county and total infested area would vary largely; however, they might both indicate that the spread rate had a consistently increasing pattern over the invasion periods. This similarity of change pattern of spread rate by different methods can lead to similar analysis result when analyzing critical factors that impact the invasions. This research aims to address these research gaps.
Gilbert and Liebhold [19] conducted a simulation research to evaluate the accuracy of two regression methods and a boundary displacement method on estimating the overall invasion rate in response to different spatial sampling configurations and sampling density. Tisseuil et al. [18] conducted a simulation study to evaluate the accuracy of a regression method and a boundary displacement method on estimating the overall invasion rate with field sampling data under different sampling strategies, densities, and spatial interpolation approaches. Both research provided valuable guidance on estimating the overall spread rate of invasive species with field sampling data [18,19]. However, simulation of spread of invasive species with GULD is rare [11,12,13,14,15,17,18,19]. To fill the research gap of a systematic evaluation of different methods on estimating invasions with GULD, we used a simulated data approach to evaluate the ability of multiple methods on estimating invasion with GULD.
Specifically, we used simulated data to evaluate (1) the accuracy of eight methods to estimate expansion pattern with GULD, (2) the accuracy of eight methods on estimating overall rate and spread dynamic of invasive species with GULD, (3) the impact of the geopolitical unit size and its variation on each method, and (4) the similarity of different methods on estimating spread. Earlier simulation research provided valuable insight on simulating multiple spatial configurations of invasion with consideration of different levels of complexity and stochasticity [18,19]. Similar with simulation by Tisseuil et al. [18], we simulated a simple symmetric spread scenario and a more complicated spread scenario with spatial anisotropy. Although long-distance jump dispersal is random and rare in the spread of invasive species, research showed long-distance jump dispersal can be more influential than local dispersal for some species [6]. Thus, we also simulated a third spread scenario with long distance jump dispersal. Additionally, we formulated an alternative boundary displacement method and an area-based regression method for estimating spread with GULD.

2. Common Methods to Estimate Spread with Geopolitical Unit

The most commonly used methods to estimate spread are regression and boundary displacement methods, which can be used with all kinds of invasion records [15,19]. Note that this research aimed to evaluate commonly used methods of estimating spread with GULD; however, alternative approaches are also available for estimating spread with GULD and more detailed invasion record [17,20]. For example, Goldstein et al. [17] used a Gaussian process model to estimate a gradient surface of the invasion, and their method can estimate the rate and direction of the spread as well as detecting potential jump dispersal sites. Pio et al. [20] used a trend surface analysis and spatial error simultaneous autoregressive model to estimate spread rate of an infectious disease.

2.1. Regression Methods

The general idea of regression methods is to regress the measurement of spread (e.g., the cumulative area or the distance to the invasion origin) against time, beginning when the infestation is first observed. Rather than estimating the spread rate for every temporal unit, e.g., each year, the regression methods output a spread rate for the entire studied period.
Spread Distance—With GULD, one way to calculate spread distance is to derive the minimum distance between the spread origin and the polygon of each geopolitical unit [14,15]. Distances between the spread origin and centroids of infested geopolitical units also have been used [3,7].
Square Root AreaThis method assumes an invasive species spread by approximately concentric circles, for which the total spread distance ( D ) from invasion origin can be estimated as D = A / π , where A represents the cumulative area of the infested regions [21,22,23]. For GULD, the square root of the cumulative area of all infested geopolitical units is used as the measurement [15].
Number of Infested Geopolitical UnitDirectly regressing the cumulative number of infested geopolitical units, n , on invasion times has been used in previous studies [6,8,13]. However, we argue that the square root of the cumulative number of infested units, n , should be used instead [24]. If the total number of infested geopolitical units is n and the mean county size is A ¯ , then the total infested area could be estimated as A = n A ¯ . As mentioned above, the spread distance from invasion origin can be estimated as D = A / π for concentric spread, thus by replacing A with n A ¯ we get D = n A ¯ / π . Therefore, D is linearly associated with n . The spread rates estimated from n should be linearly correlated with the ones by spread distance regression and square root area regression. Additionally, the measurement n A ¯ can be an alternative to the n   method and can be used as an area-based regression method.

2.2. Boundary Displacement Method and Minimum Spread Distance Method

Boundary Displacement—This method estimates spread rates as the distance between two consecutive infestation boundaries, and can directly estimate the spread dynamics during different invasion periods. The outer boundary of geopolitical units infested within the same period can be used as the infestation boundary [5,25]. This method may require slight changes to the infestation boundaries to avoid folds, islands, and gaps on the boundary [5]. In addition to use county boundary to delineate infestation boundary, we also designed a concave hull method to derive the infestation boundaries by using polylines that connect centroids of all the outermost newly infested geopolitical units as the boundary. This method avoids the need to manually modify infestation boundaries, and the infestation boundaries can be derived automatically using programs such as R (see Supplementary Material 1). Additionally, Tobin et al. [15] used a spatial grid approach to delineate boundary with GULD. Although their method is not included in our analysis, we encourage readers to try their method, as the spatial grid approach also avoids the need of manually changing boundaries.
Minimum Spread Distance—This method takes the minimum distance between a newly infested geopolitical unit and all units infested in earlier periods as the distance that a species has to spread to invade the new unit [11,26]. The mean of all minimum distances of geopolitical units infested in the same period is taken as the spread rate in that period. Similar to boundary displacement methods, MSD also directly estimates temporal spread dynamics.

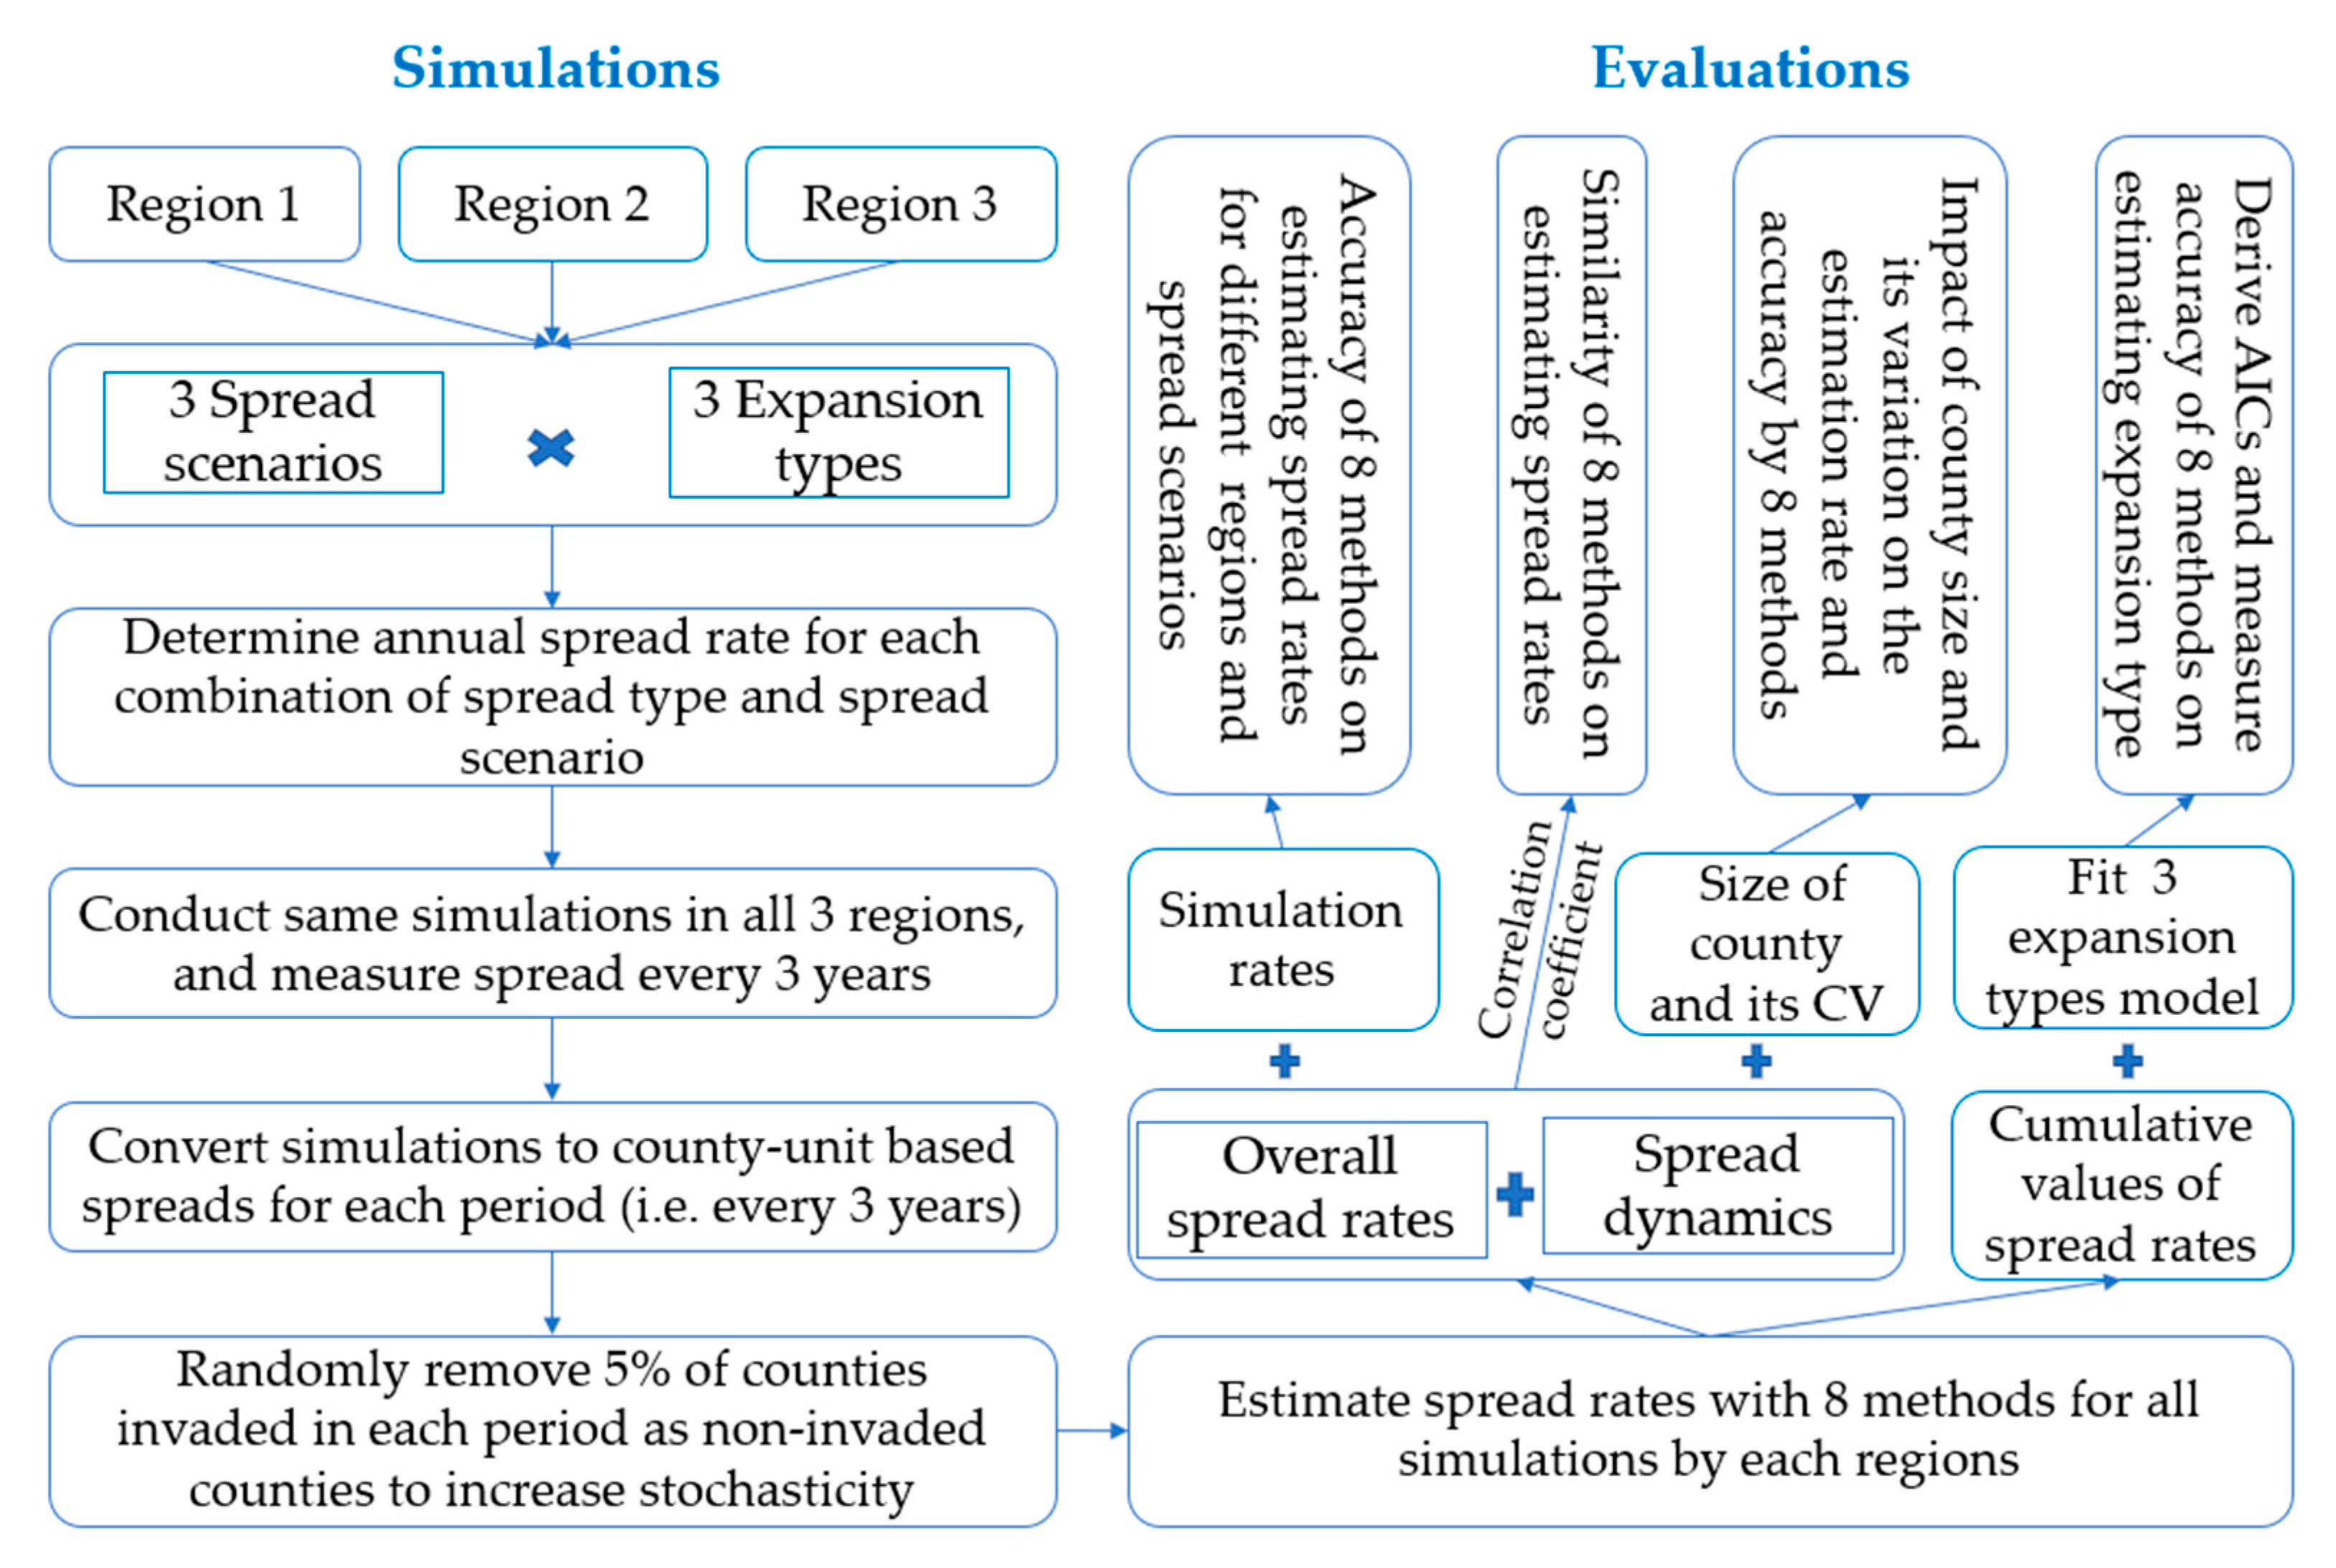
3. Materials and Methods

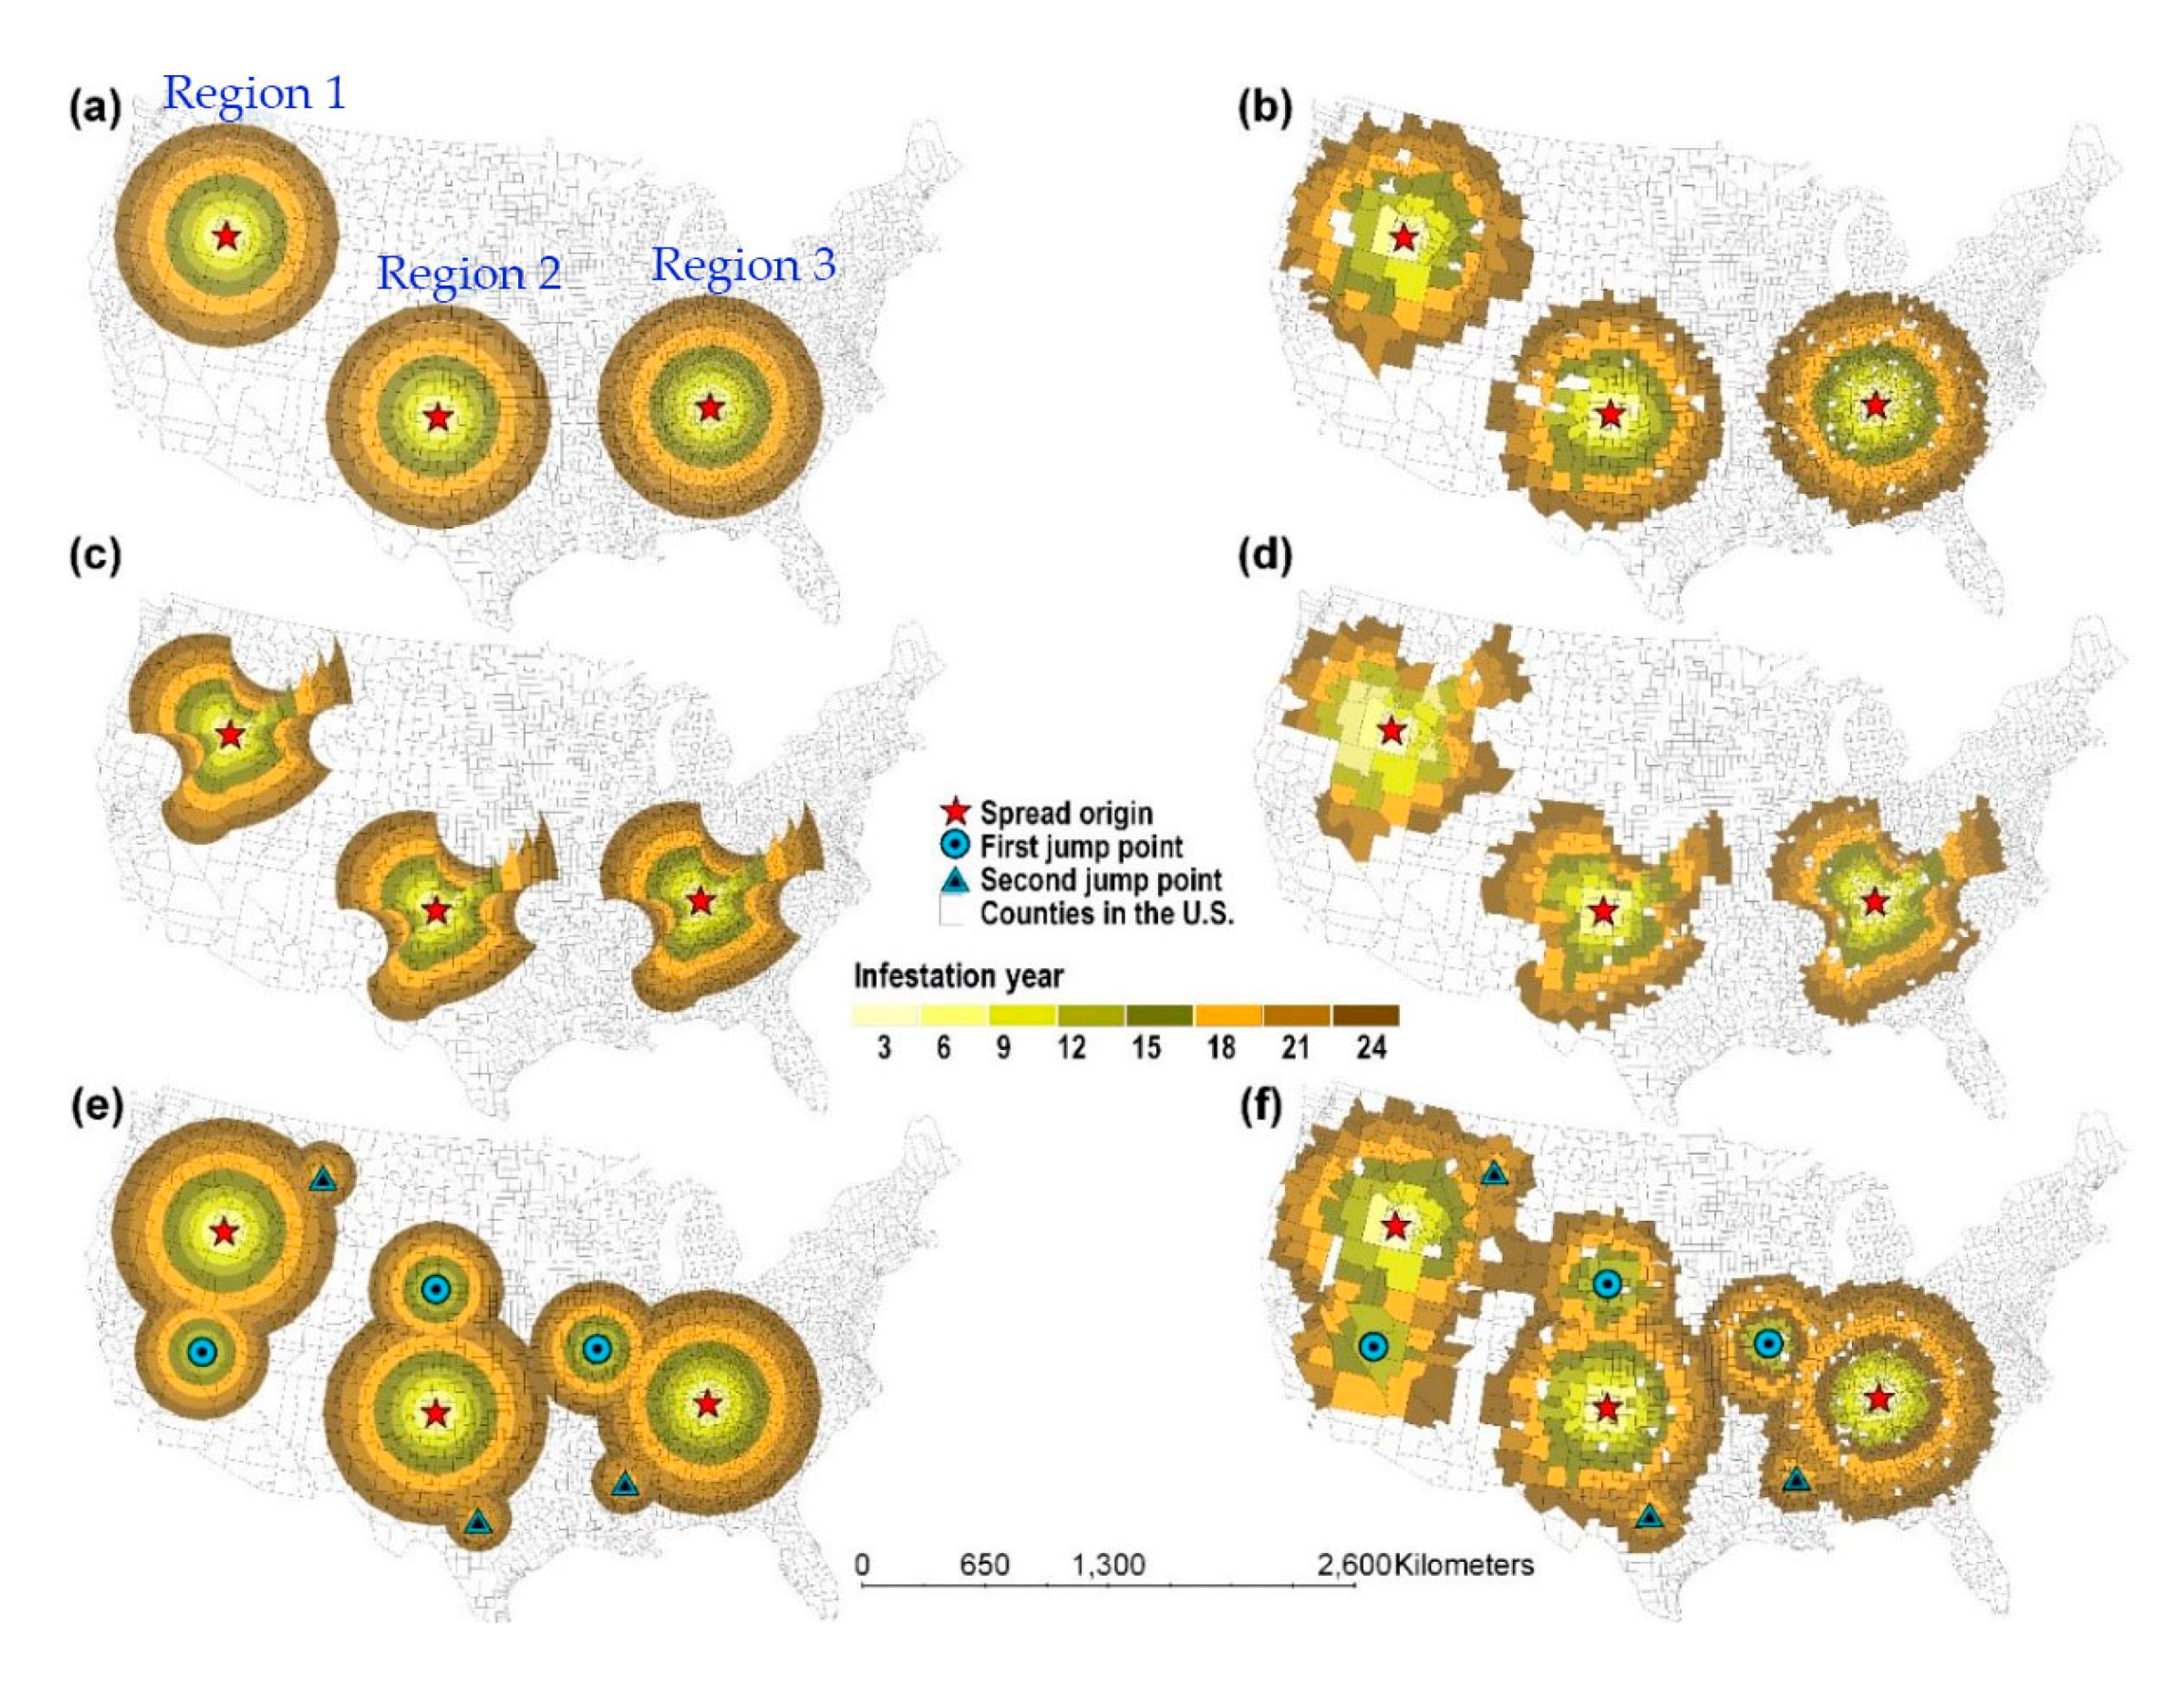
3.1. Spatial Area of Simulated Spread

The flowchart of the simulation research is detailed in Figure 1. All the simulations and results analysis were conducted with R program [27], and ‘rgdal’ was used to facilitate the spatial simulation and ‘Metrics’ was used to calculate the root mean square error (RMSE) [28,29]. To represent the real-world variety of geopolitical units we used the counties in the U.S. to conduct the simulation research (Figure 2a). The county size in the eastern U.S. (e.g., Tennessee) is consistently smaller than a majority of regions in the western U.S. (e.g., Nevada), whereas the county size in the Midwest and Southwest of the U.S. has more variations than the eastern U.S. This pattern of geopolitical unit size being more homogenous within one region than other regions is representative of many countries (e.g., Canada, China, and Mexico). To evaluate the performance of eight methods in response to different geopolitical unit sizes and homogeneity in sizes, we conducted the same simulations independently in three regions—Regions 1, 2, and 3 (Figure 2a). The county size and its coefficient of variation (CV) in three regions are listed in Table 1. In each region, we set a spread origin, from which the spread was simulated.

3.2. Simulation of Three Expansion Types and Three Spread Scenarios

3.2.1. Three Expansion Types

To evaluate abilities of eight methods for estimating expansion patterns of invasive species, we simulated three expansion types as summarized by Shigesada et al. [23]: (1) linear expansion, (2) biphasic expansion resulting from two linear-spread phases, and (3) logistic curve expansion. These three expansion patterns were commonly observed in research focused on invading organisms [12,27]. We simulated these three expansion types for each spread scenario in all regions.

3.2.2. Three Spread Scenarios

We simulated three spread scenarios to evaluate abilities of different methods on estimating spread with different types of stochasticities and irregularities: (1) a symmetric spread (S1) (Figure 2a,b), (2) an asymmetric spread (S2) (Figure 2c,d), and (3) a spread scenario with long-distance jump dispersal (S3) (Figure 2e,f). The details on simulating three spread scenarios were described as follows.
Simulation of Symmetric Spread—For S1, the linear expansion pattern had a constant spread rate for all periods. We set this rate to 20 km/year, as it approximates the mean spread rate of invasive species based on multiple research [6,11]. For biphasic expansion the simulated rate was set to 20 km/year for the first 12 invasion years and 30 km/year for the following 12 years; thus, the mean spread rate is 25 km/year. The logistic curve expansion followed a logistic growth function y = 826 / ( 1 + e 0.43 ( x 10 ) ) , where y and x represent the total spread distance and spread time, respectively. The parameters of the logistic growth were carefully set to ensure that (1) the overall spread rate of logistic curve expansion is not smaller than linear expansion, and (2) the overall spread rate is not so large that there is enough terrestrial land for conducting the spread simulations in each region.
Simulation of Asymmetric Spread—Simulations of the three expansion types for S2 were similar with S1, except that the rates varied among different directions. The change pattern of spread rate along each direction kept consistent with the corresponded expansion pattern (Figure 2c,d). The simulated rate in all directions varied between 10–24 km/year for linear expansion, and 12–31 km/year for biphasic and logistic curve expansions.
Simulation of Long-Distance Jump Dispersal—We added two jump dispersal events in S3 with one occurring in the nineth year and another occurring in the 18th year (Figure 2e,f). To make the S3 in three regions comparable, the distances among the two jump points and the spread origin were set the same for all regions (Figure 2e,f). The jump point served as a new spread origin from which further spreads occurred in all directions, and we set this further spread rate to 20 km/year for all jump points and expansion types for clarity and simplicity.

3.2.3. Simulation over Landscape and Conversion to Geopolitical Unit-Level Spread

To simulate the spread over different invasion periods, we first determined the cumulative invaded regions at different periods based on the spread rates. We then derived the newly invaded regions for a given period as the difference of the cumulative invaded region between current and previous invasion period. As shown in Figure 2a,c,e, the original simulated spreads had perfect geometric shapes over the landscape as no stochasticity (except long-distance jump dispersal for S3) was added before converting to GULD. To convert the simulated spread (shown in Figure 2a,c,e) to GULD (shown in Figure 2b,d,f), we selected counties that were infested in the same periods (i.e., every three years). A county was defined as first infested only if more than 10% of its area was covered by the simulated spread zone. To reflect real-world stochasticity of species invasion, we randomly removed 5% of the counties first infested in each period as non-infested counties (Figure 2b,d,f).

3.3. Estimating Overall Spread Rate and Spread Dynamics

Five regression methods, two boundary displacement methods and an MSD were included in this research to estimate overall spread rate and spread dynamics (Table 2). For boundary displacement methods, mean distance between two consecutive boundaries were measured as the mean length of all transects radiating from the spread origin at 2° [3,25]. Ctd_BD, Cty_BD, and MSD directly estimated spread dynamics, and the overall rate was calculated as the mean spread rate across all invasion periods. For regression method spread dynamic for a given period were estimated as the difference of measurements between current and previous period. The overall rate for regression methods were estimated as the slope of a linear model for linear expansion and mean of two slopes of a segmented linear model with break point at the 12th year for Biphasic. For logistic curve expansion, instead of using derivatives of the logistic growth function, we estimated the spread rate as follows for practical purpose:
Overall rate = cumulative spread distance/time since initial detection

3.4. Evaluation Statistics

3.4.1. Ability of All Methods to Estimate Expansion Types

The cumulative values of spread measure for each period were used to fit regression models against spread time to determine the expansion type. The spread measures for regression methods were already cumulative values, thus we only derived the cumulative values of spread measure for each period for Ctd_BD, Cty_BD, and MSD methods. We then fitted three regression models, i.e., linear, biphasic (i.e., segmental linear with one break-point at year 12), and non-linear with logistic curve function, to the cumulative values of each estimation method by each expansion type, spread scenario, and region. For each simulation (i.e., one combination of spread scenario and expansion type in one region), the Akaike information criterion (AIC) of three fitted regression models were derived and the model with lowest AIC was assigned as the estimated expansion pattern for this simulation [30]. The estimated expansion type was then compared to the simulated expansion type to determine the ability of each method to estimate expansion pattern. For linear expansion, we defined the method that can accurately estimate the expansion pattern if the linear or biphasic linear fit has the lowest AIC, as biphasic linear can be an overfitting of linear model but have lower AIC.

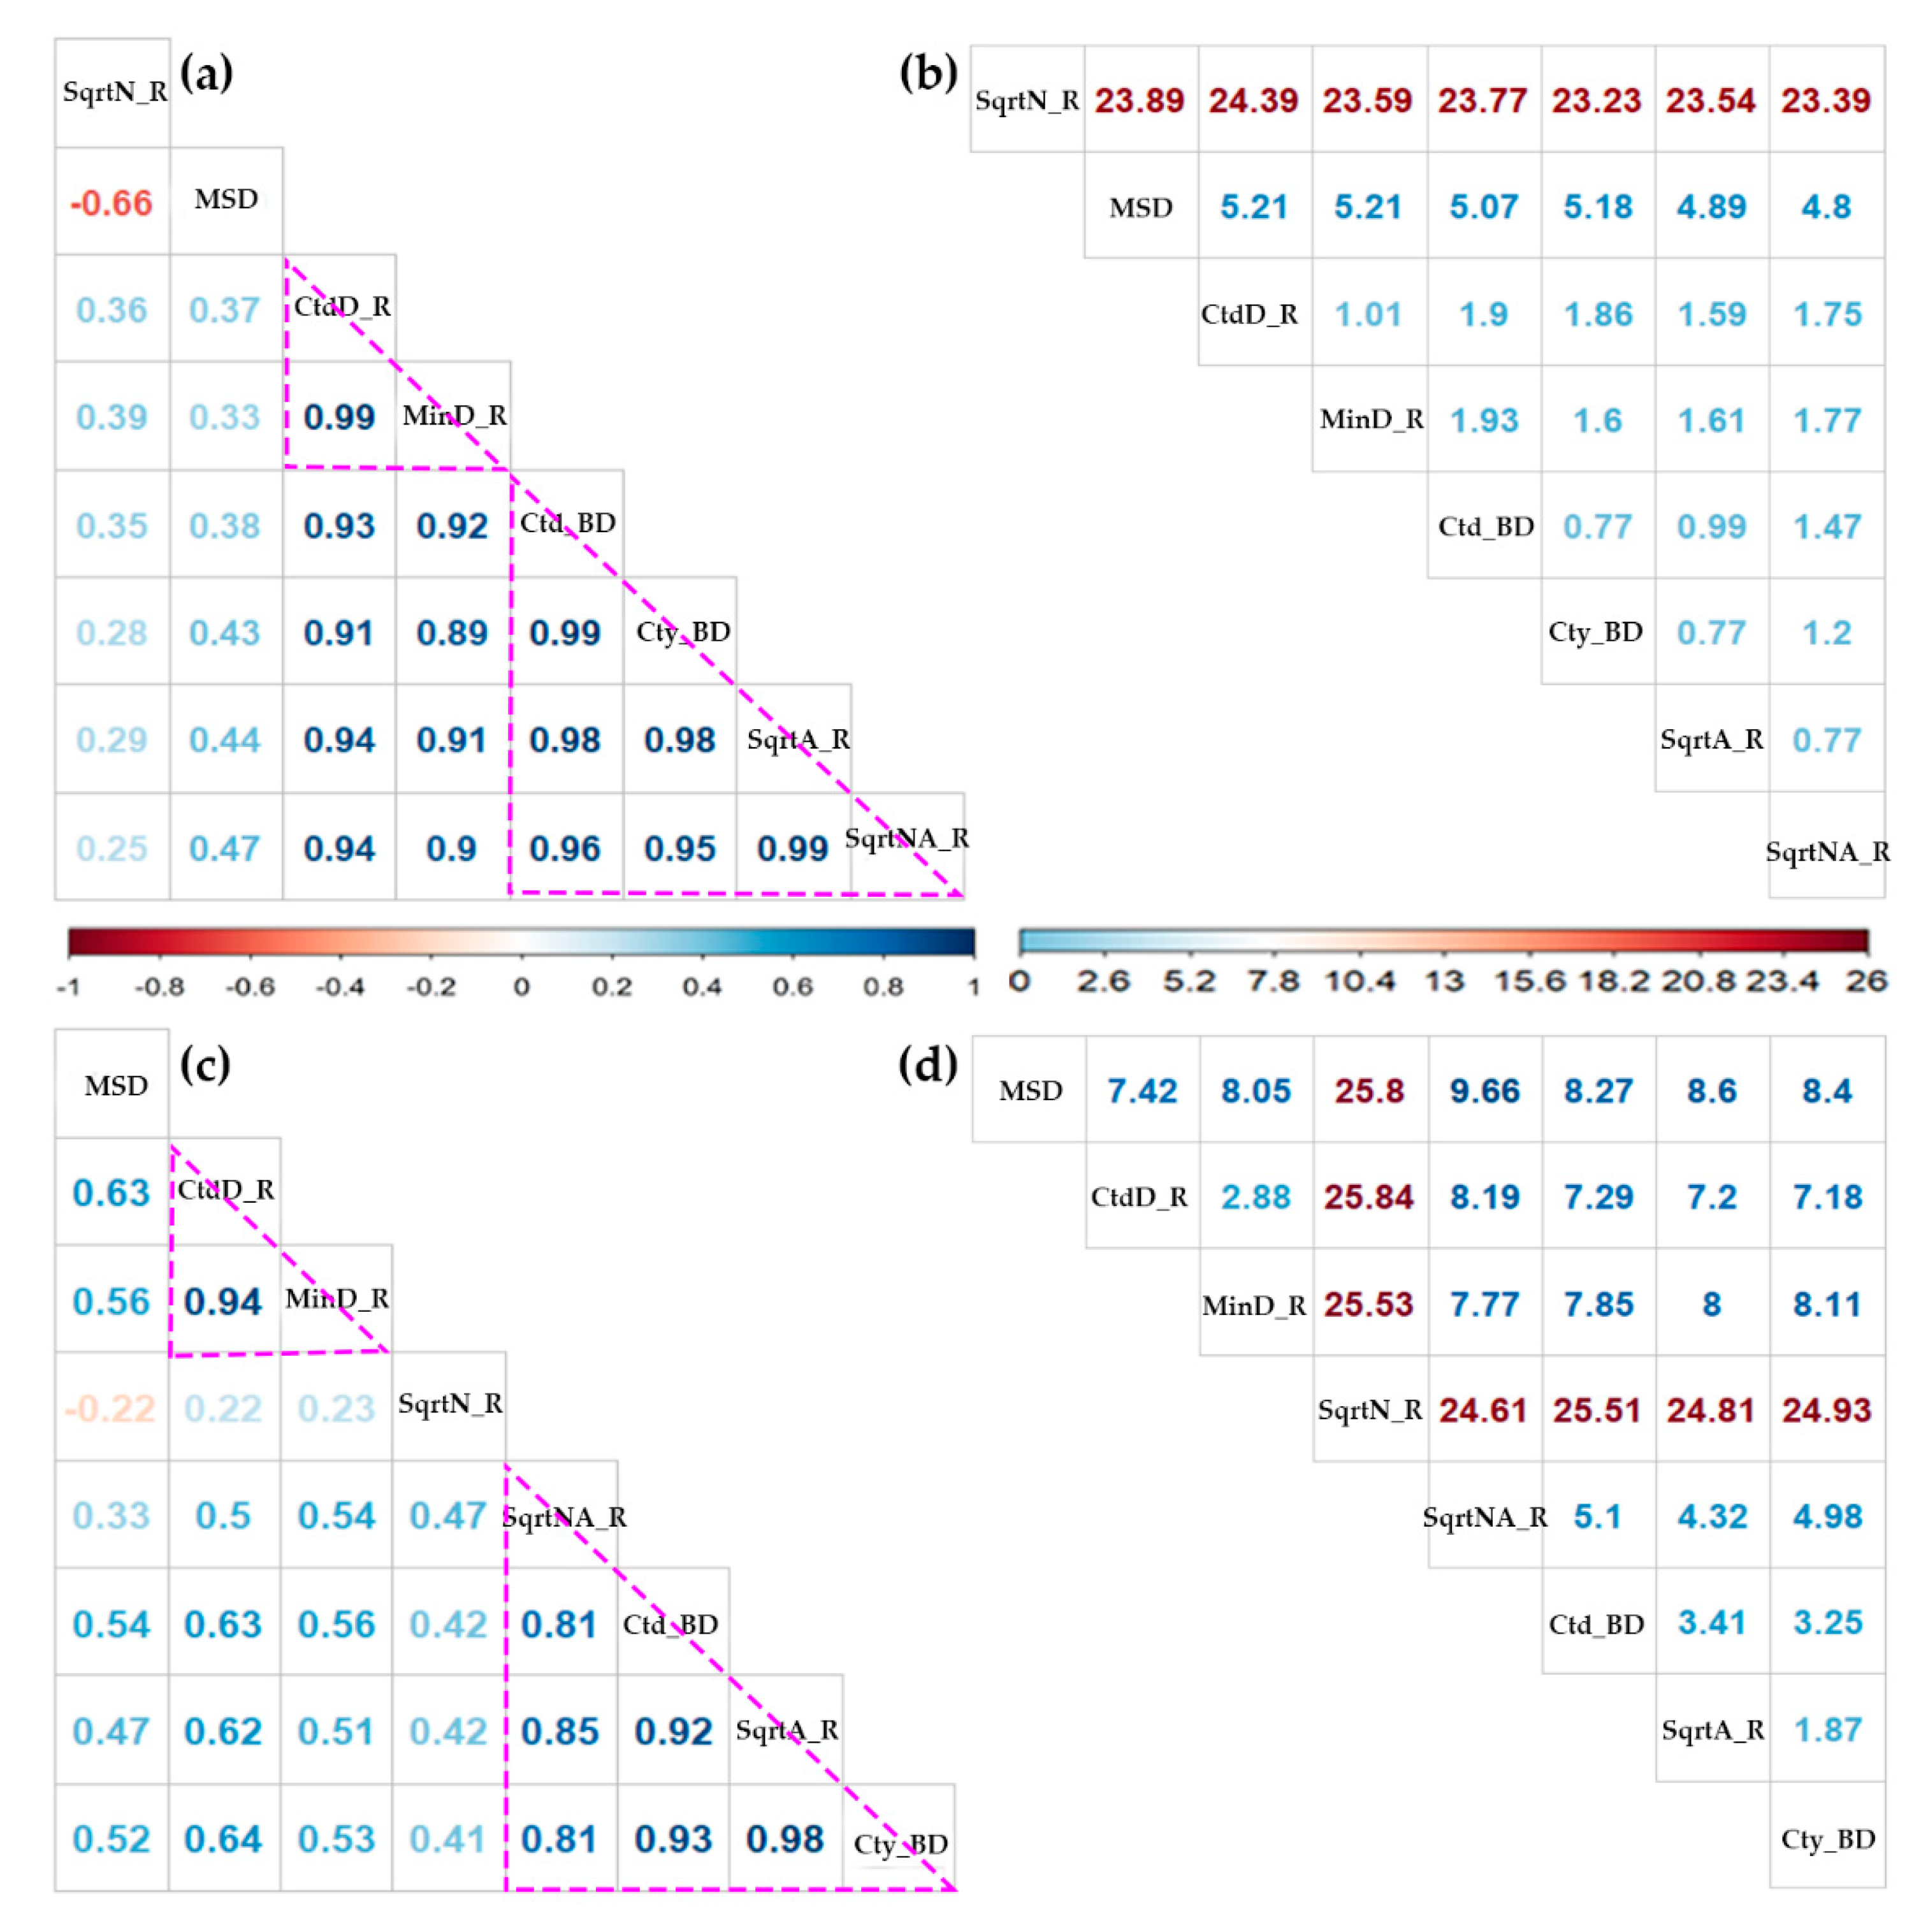
3.4.2. Accuracy and Similarity of All Methods

The simulated rate was defined as the distance between the simulated boundaries, and was used to evaluate the accuracy of eight methods on estimating spread rates. We derived R2 and the RMSE between the estimated and simulated overall rate and dynamics by each method for each spread scenario, expansion type, and spread region. R2, varying from 0 to 1, is scale independent with 1, indicating perfect estimation. RMSE measures the absolute deviation of estimation from the simulation, thus cannot be used on SqrtN_R method as the measure of this method is the square root of number of infested counties. We calculated the Pearson correlation coefficient (r) and the RMSE of estimated spread rates and dynamics among all methods to assess their similarity pattern. Hierarchical clustering (HC) with complete linkage using mean distance was conducted to group all methods based on their similarity of derived spread rates.

3.4.3. Impact of County Size on Spread Estimation

To determine whether the county size and the variation of county size affect the values of estimated rates, we tested the significance of correlations between the estimated rates with the mean and coefficient of variation (CV) of county size. To assess the impact of county size and the variation of county size on the accuracies of estimated rates, we tested the significance of correlations between the mean and CV of county size and R2 of the estimation from the simulation for each region and spread scenario.

4. Results

4.1. Ability of All Methods to Estimate Expansion Patterns

Both regression and boundary displacement methods can estimate the expansion patterns (Supplementary Material 2). Ctd_BD, SqrtN_R, and SqrtNA_R correctly estimated the expansion patterns for all scenarios and regions (see Supplementary Material 2 for AICs). For S1, except MSD, all other methods correctly estimated the expansion patterns (see Supplementary Material 2). For S2 and S3, SqrtA_R and Cty_BD correctly estimated all expansion patterns for Region 1 and Region 2, whereas MinD_R and MSD constantly misclassified the expansion patterns for S2 and S3 (see Supplementary Material 2).

4.2. Accuracy of All Methods

4.2.1. Accuracy on Estimating Overall Spread Rate

The estimated and simulated overall spread rates for all spread scenarios and expansion types were included in Supplementary Material 3. Based on R2, all methods had the best accuracy to estimate spread rate in S1 and the worst ability in S3 (Table 3). MSD and SqrtN_R estimated spread poorly when all three regions were analyzed (R2 < 0.1). Ctd_BD, CtdD_R, and MinD_R were the best three models to estimate overall rate without long-distance jump dispersal (Table 3, R2 for S1 and S2), whereas Cty_BD, SqrtA_R, and Ctd_BD were the best three models with occurring of long-distance jump dispersal (Table 3, R2 for S3). Based on both R2 and RMSE on spread rate for all scenarios and regions, Ctd_BD had the best estimation, followed by Cty_BD, and SqrtA_R.

4.2.2. Accuracy on Estimating Spread Dynamics

Compared to the overall rate, the ability to estimate spread dynamics decreased for all methods, i.e., lower R2 and higher RMSE values for spread dynamics estimation (Supplementary Material 4) than the overall rates (Table 4). All methods had better performance for S1 and Region 1 and lower performance for S3 and for Region 3, except SqrtN_R, SqrtNA_R, and MSD. MSD had low performances for all scenarios and regions. CtdD_R and MinD_R only had good estimation for S1 (Table 4). Ctd_BD, SqrtNA_R, and SqrtA_R were the best three methods for all scenarios and regions based on both R2 and RMSE (Table 4), among which Ctd_BD showed consistently good estimates for all regions and scenarios (R2 > 0.75).
Overall, Ctd_BD, SqrtNA_R, SqrtA_R, and Cty_BD were ranked as the best four methods for estimating both overall spread rate and spread dynamics, among which Ctd_BD constantly had the best estimation. The accuracy of two boundary displacement methods on estimating overall spread rate was not significantly different from each other (p = 0.69), whereas Ctd_BD had significantly higher accuracy on estimating spread dynamics than Cty_BD (p = 0.01). Between the two area-based regression methods, SqrtA_R had significantly better estimation on overall spread rate than SqrtNA_R (p = 0.001), whereas SqrtNA_R had marginally better estimation on spread dynamics than SqrtA_R (p = 0.07). Distance-based regression methods, CtdD_R and MinD_R, could provide good estimations for overall spread rate without long-distance jump dispersal, and had constantly lower performances on estimating spread dynamics compared to boundary displacement methods and area-based regression methods. There was also no significant difference of accuracy on estimated overall rate (p = 0.49) and spread dynamics (p = 0.48) between these two distance-based regression methods.

4.3. Impact of County Size and Its Variation on Estimation of Spread Rate

Overall, the county size and the variation in county size showed more significant impact on the estimation of spread dynamics than the overall spread rate (Table 5). However, significantly positive and negative correlations existed between the county size and spread rates estimated by MSD and SqrtN_R, respectively, for both spread dynamics and overall spread rate (Table 5). Additionally, larger county sizes led to higher estimated spread dynamics for SqrtA_R, Ctd_BD, and Cty_BD (Table 5). For the accuracy of estimated rates, significantly negative correlation of R2 with mean and CV of county size was only observed on the SqrtA_R method for overall rate but were observed on SqrtA_R, Ctd_BD, and Cty_BD for spread dynamics (Table 5). These negative correlations suggest that accuracy is negatively impacted by the county size and its variation. The accuracy of two boundary displacement methods on estimating spread dynamics were negatively impacted by the county size and its variation, whereas for SqrtN_R and SqrtNA_R the variation of mean county size among different periods is more influential than the mean size of county on the estimation accuracy.

4.4. Similarity of All Methods

The CtdD_R and MinD_R constantly estimated highly correlated overall spread rate and spread dynamics (r > 0.95, Figure 3a,c), and both estimations had low RMSE between two methods (Figure 3b,d). The spread rates estimated by MSD and SqrtN_R had low similarity with other methods when spread in all regions was analyzed, i.e., low correlation and high RMSE (Figure 3a–d). For asymmetric spread but with low variation in county size (i.e., S2 for Region 1), all methods still estimated highly correlated overall rates and spread dynamics (Supplementary Material 5—Figure S1a,b, Supplementary Material 5—Figure S2a, r > 0.75). With the increase of anisotropy, stochasticity, and variation of county size, strong correlations were observed among SqrtA_R, SqrtNA_R, Cty_BD, and Ctd_BD for both overall rate and spread dynamics (r > 0.80, Figure 3a,c). Additionally, the RMSE among these four methods also remained at a low level for estimation on overall spread rate (Figure 3b, RMSE < 1.5) and spread dynamics (Figure 3d, RMSE < 5). SqrtA_R, Ctd_BD, Cty_BD and SqrtNA_R were constantly classified into one group for both overall spread rate and spread dynamics due to their similarities on estimating spread rates (Figure 3a,c; Supplementary Material 5-Figures S1 and S2).

5. Discussion

Estimating spread is critical for predicting further invasion and guiding early management of invasive species and facilitates analysis of important factors affecting the spread to enhance agricultural and environmental sustainabilities [1,3,4]. Although researchers have been using GULD to estimate the spread of invasive species, a systematic evaluation of the performances of GULD to estimate invasion under different spread scenarios with multiple types of stochasticity and irregularity is lacking. This research filled this gap by using simulation data, and findings of this research can guide selection of optimal methods to estimate expansion pattern, overall spread rate, and spread dynamics of invasive species with GULD.

5.1. Ability of Common Methods to Estimate Expansion Pattern and Spread Dynamic

Regression methods have long been used to determine expansion patterns of invasive species [3,25,31]. Here we found the cumulative value of boundary displacement methods can correctly estimate expansion patterns. In the simulation study, the boundary displacement method, Ctd_BD, and two regression methods, SqrtN_R and SqrtNA_R, always estimated the correct expansion patterns regardless of variations in county size or anisotropy and stochasticity in spread.
Estimation of spread dynamic is more challenging than the estimation of overall spread rate. Boundary displacement and MSD have been commonly used to estimate spread dynamic of invasive species [5,11,32]. Nevertheless, our research suggests that regression methods can also estimate spread dynamics by using the difference of measurements between two consecutive periods. In fact, two regression methods, SqrtA_R and SqrtNA_R, together with two boundary displacement methods, Ctd_BD and Cty_BD, were the top four methods to estimate both overall spread rate and spread dynamic.

5.2. Estimating Spread with Anisotropy and Stochasticity with GULD

Compared to long-distance jump dispersal, asymmetric spread caused by spatial heterogeneity does not seriously challenge the ability of all focal methods to estimate overall spread rate. Meanwhile, boundary displacement methods and area-based regression methods can still have good estimation of spread dynamics with long-distance jump dispersal. However, when the spread is highly asymmetric and the study area is at regional or larger scales, estimating spread rates by taking the whole infested region as one area does not reveal the spatial dynamics of spread caused by heterogeneities [3,33]. Thus, this may lead to failure of recognizing critical factors influencing the invasions [3].
Our research suggests that dividing a highly asymmetrical spread into several relatively symmetric spreads can improve the estimation accuracy for each sub-region, thus we recommend the use of neighborhood measurement when the spread is highly asymmetric. The neighborhood measurement was applied in multiple studies for better estimating localized spread dynamics [34,35]. Estimating spread within different homogenous sub-regions can further contribute to better understanding of the spread dynamics and facilitates analysis of spatial factors impacting the spreads [3,33]. Andow et al. [33] first proposed to divide the large infested area into multiple neighborhoods to increase homogeneity within each neighborhood to well reveal localized spread dynamics for asymmetrical spread. Liang et al. [3] proposed a quantitative method, i.e., spatial constrained clustering, to classify a large heterogeneous region into environmentally homogeneous sub-regions.
Long-distance jump dispersal is often caused by rare random events and human-related activities [6,36]. However, despite its rarity and stochasticity, it greatly facilitates the spread of invasive species and can be more influential than local dispersal for some species [6,19,21,36]. Long-distance jump dispersal causes new spread origins and obscure the actual expansion pattern that is determined by life traits and dispersal ability of the target species itself [31,36]. To better estimate the ability of an invasive species to spread, researchers could set multiple spread origins, including the ones caused by long-distance jump dispersal [6,37], and then estimate spread rate from different origins. Goldstein et al. [17] developed a method which can detect possible long-distance jump dispersal. Methods that can analyze local spread rate determined by dispersal ability of invasive species and long-distance spread rate impacted by human-related activities separately can also be used to better facilitate estimation of further spread of invasive species. For example, Meentemeyer et al. [38] designed an approach to estimate the local dispersal ability of invasive species impacted by the biological trait and long-distance dispersal impacted by human activity separately to simulate the spread dynamics of invasive species.

5.3. Similarity of Methods to Estimate Overall Spread Rate and Spread Dynamics

When the spread is symmetrical and the county size is relatively uniform, estimates of spread rates and dynamics among all eight methods are similar. With increase of anisotropy and stochasticity in spread, only boundary displacement methods and area-based regression methods continued to estimate similar overall spread rate and spread dynamics. Unsurprisingly, the two distance-based regression methods, CtdD_R and MinD_R, always estimated highly correlated overall rates and spread dynamics. Meanwhile, no significant difference was observed on estimation accuracy of overall rate and spread dynamics between these two distance-based regression methods, thus these two methods can be used interchangeably. The two boundary displacement methods also always estimated very highly correlated overall spread rate and spread dynamic, nevertheless, the Ctd_BD showed significantly higher accuracy on estimating spread dynamics (p = 0.01). Additionally, Ctd_BD had better estimation on expansion pattern than Cty_BD, therefore Ctd_BD can be preferred over Cty_BD. The two-area based regression methods also consistently estimated highly correlated overall spread rate and spread dynamics. SqrtA_R showed significantly higher accuracy on estimating overall spread rate than SqrtNA_R (p = 0.001) but marginally lower accuracy on estimating spread dynamics (p = 0.07).

5.4. Selection of Method to Estimate Overall Spread Rate and Spread Dynamics with GULD

Earlier simulation research focused on comparing accuracy of multiple methods on estimating overall spread rate with different approaches of field sampling strategy [18,19], and they found regression method consistently have good estimations. Our simulation results on estimating overall spread rate are consistent with earlier findings as the spread scenarios in earlier research resembled the S1 and S2 spread scenarios. Distance-based regression methods, i.e., CtdD_R and MinD_R, showed the top level of accuracy (based on R2) on estimating overall spread rate for S1 and S2. However, distance-based regression methods have lower ability of estimating spread dynamics when compared to area-based regression methods and boundary displacement methods. Tobin et al. [14,15] found that the overall spread rate estimated from boundary displacement method was most similar to the rate estimated from field sampling data than the distance- and area-based regression methods. Our research confirmed their findings as the overall spread rate estimated by Ctd_BD had the lowest RMSE than all other methods.
Researchers have used MSD to estimate spread dynamic [11,26] and SqrtN_R to estimate overall rates and expansion types of invasive species [8,13]. However, when evaluating the accuracy across different regions, SqrtN_R and MSD constantly showed low abilities of estimating both overall rate and spread dynamics due to their sensitivity to the size of geopolitical units. Meanwhile, MSD constantly showed the lowest ability to estimate both overall rate and spread dynamics in all scenarios, and SqrtN_R had a low ability of estimating spread dynamics among all methods considered. Therefore, MSD is not recommended to estimate spread of invasive species, whereas SqrtN_R is only suggested to estimate overall spread rate when the mean sizes of geopolitical units across different periods or regions are relatively uniform. SqrtNA_R is a better alternative to the SqrtN_R as it rectifies the SqrtN_R by the mean area of geopolitical unit.
Generally, the abilities of all methods to estimate invasion rates decreased with the increase of irregularities and stochasticities, i.e. anisotropy and stochasticity in spread and size and variation in size of geopolitical unit. Additionally, we found these irregularities and stochasticities have more negative impact on the estimation accuracy of spread dynamics than overall spread rate. Selection of an optimal method depends on the question of interest and stochasticity in spread. Distance-based regression methods, i.e., CtdD_R and MinD_R, can provide a better estimation than area-based regression method and equally well estimation with CtD_BD on overall spread rate without long-distance jump dispersal. When the goal is to estimate the spread dynamics, boundary displacement methods and area-based regression method can be preferred. More specifically, SqrtNA_R showed better estimation on spread dynamics than SqrtA_R, whereas Ctd_BD constantly had the best estimation on both overall spread rate and spread dynamics. Additionally, Ctd_BD, SqrtN_R, and SqrtNA_R correctly estimated all the expansion patterns. Thus, Ctd_BD can be a top choice for estimating spread, whereas for spread without clear infestation boundaries, a distance-based regression method can be used to estimate overall spread rate, and an area-based regression method can be used to estimate spread dynamics.

6. Conclusions

Using simulated spread data, we found that GULD can be used for estimating spread of invasive species even with variations in geopolitical unit size. Both regression and boundary displacement methods are capable to estimate the expansion pattern, overall spread rate, and spread dynamics of invasive species. Selection of an optimal method depends on the question of interest and stochasticity in spread. We found the anisotropy and stochasticity in spread and the size and variation in size of geopolitical unit have more negative impact on the estimation accuracy of spread dynamics than overall spread rate, thus estimating spread dynamics is more challenging than estimating the overall rate with GULD. Boundary displacement methods and area-based regression methods estimated spread dynamics for all scenarios most reliably, among which Ctd_BD had the best estimation. Overall, we recommend the boundary displacement method, Ctd_BD, for estimating spread of invasive species, as it can reliably estimate expansion pattern, overall spread rate, and spread dynamics. However, for spread without clear infestation boundaries, area-based regression methods can be good alternatives to estimate spread dynamics and expansion pattern, whereas distance-based regression methods can be used to estimate overall spread rate without long-distance jump dispersal. We suggest readers to carefully design method to estimate spread rate with occurring of rare long-distance jump dispersal. Finally, in addition to the methods included in our analysis, we also encourage readers to explore other methods with GULD, such as the methods in Goldstein et al. [17] and Pio et al. [20].

Supplementary Materials

The following are available online at https://www.mdpi.com/2071-1050/12/20/8526/s1.

Author Contributions

Conceptualization, W.L., L.T. and J.G.; methodology, W.L. and L.T.; software, W.L. and V.S.; validation, W.L.; formal analysis, W.L. and L.T.; writing—original draft preparation, W.L.; writing—review and editing, all; visualization, W.L.; supervision, W.L., L.T. and J.G.; project administration, J.G.; funding acquisition, J.G. All authors have read and agreed to the published version of the manuscript.

Funding

This research received no external funding.

Acknowledgments

We would like to thank Gregory Wiggins at National Institute for Mathematical and Biological Synthesis and Scott Stewart at University of Tennessee for valuable discussions on this research. We also thank Chunlong Liu at Freie Universität Berlin for critical comments and suggestions. Last but not least, we thank the anonymous reviewers for their constructive comments and suggestions on the earlier version of this manuscript.

Conflicts of Interest

The authors declare no conflict of interest.

References

  1. Paini, D.R.; Sheppard, A.W.; Cook, D.C.; De Barro, P.J.; Worner, S.P.; Thomas, M.B. Global threat to agriculture from invasive species. Proc. Natl. Acad. Sci. USA 2016, 113, 7575–7579. [Google Scholar] [CrossRef] [PubMed] [Green Version]
  2. Pejchar, L.; Mooney, H.A. Invasive species, ecosystem services and human well-being. Trends Ecol. Evol. 2009, 24, 497–504. [Google Scholar] [CrossRef] [PubMed]
  3. Liang, W.; Tran, L.; Wiggins, G.; Grant, J.; Stewart, S.; Washington-Allen, R. Determining spread rate of kudzu bug (Hemiptera: Plataspidae) and its associations with environmental factors in a heterogeneous landscape. Environ. Entomol. 2019, 48, 309–317. [Google Scholar] [CrossRef]
  4. Stohlgren, T.J.; Schnase, J.L. Risk analysis for biological hazards: What we need to know about invasive species. Risk Anal. 2006, 26, 163–173. [Google Scholar] [CrossRef] [PubMed]
  5. Sharov, A.A.; Pijanowski, B.C.; Liebhold, A.M.; Gage, S.H. What affects the rate of gypsy moth (Lepidoptera: Lymantriidae) spread: Winter temperature or forest susceptibility? Agric. For. Entomol. 1999, 1, 37–45. [Google Scholar] [CrossRef] [Green Version]
  6. Suarez, A.V.; Holway, D.A.; Case, T.J. Patterns of spread in biological invasions dominated by long-distance jump spread: Insights from Argentine ants. Proc. Natl. Acad. Sci. USA 2001, 98, 1095–1100. [Google Scholar] [CrossRef] [PubMed] [Green Version]
  7. Evans, A.M.; Gregoire, T.G. A geographically variable model of hemlock woolly adelgid spread. Biol. Invasions 2007, 9, 369–382. [Google Scholar] [CrossRef]
  8. Pyšek, P.; Jarošík, V.; Müllerová, J.; Pergl, J.; Wild, J. Comparing the rate of invasion by Heracleum mantegazzianum at continental, regional, and local scales. Divers. Distrib. 2008, 14, 355–363. [Google Scholar] [CrossRef]
  9. Pratt, P.D.; Slone, D.H.; Rayamajhi, M.B.; Van, T.K.; Center, T.D. Geographic distribution and dispersal rate of Oxyops vitiosa (Coleoptera: Curculionidae), a biological control agent of the invasive tree Melaleuca quinquenervia in south Florida. Environ. Entomol. 2003, 32, 397–406. [Google Scholar] [CrossRef] [Green Version]
  10. Masciocchi, M.; Corley, J. Distribution, dispersal and spread of the invasive social wasp (Vespula germanica) in Argentina. Austral. Ecol. 2013, 38, 162–168. [Google Scholar] [CrossRef]
  11. Horvitz, N.; Wang, R.; Wan, F.H.; Nathan, R. Pervasive human-mediated large-scale invasion: Analysis of spread patterns and their underlying mechanisms in 17 of China’s worst invasive plants. J. Ecol. 2017, 105, 85–94. [Google Scholar] [CrossRef]
  12. Lantschner, M.V.; Villacide, J.M.; Garnas, J.R.; Croft, P.; Carnegie, A.J.; Liebhold, A.M.; Corley, J.C. Temperature explains variable spread rates of the invasive woodwasp Sirex noctilio in the Southern Hemisphere. Biol. Invasions 2014, 16, 329–339. [Google Scholar] [CrossRef] [Green Version]
  13. Perrins, J.; Fitter, A.; Williamson, M. Population biology and rates of invasion of three introduced Impatiens species in the British Isles. J. Biogeogr. 1993, 20, 33–44. [Google Scholar] [CrossRef]
  14. Tobin, P.C.; Liebhold, A.M.; Roberts, E.A. Comparison of methods for estimating the spread of a non-indigenous species. J. Biogeogr. 2007, 34, 305–312. [Google Scholar] [CrossRef]
  15. Tobin, P.C.; Liebhold, A.M.; Roberts, E.A.; Blackburn, L.M. Estimating spread rates of non-native species: The gypsy moth as a case study. In Pest Risk Modelling and Mapping for Invasive Alien Species; Venette, R.C., Ed.; CABI International and USDA: Wallingford, UK, 2015; pp. 131–145. [Google Scholar]
  16. Hastings, A.; Cuddington, K.; Davies, K.F.; Dugaw, C.J.; Elmendorf, S.; Freestone, A.; Harrison, S.; Holland, M.; Lambrinos, J.; Malvadkar, U.; et al. The spatial spread of invasions: New developments in theory and evidence. Ecol. Lett. 2005, 8, 91–101. [Google Scholar] [CrossRef]
  17. Goldstein, J.; Park, J.; Haran, M.; Liebhold, A.; Bjørnstad, O.N. Quantifying spatio-temporal variation of invasion spread. Proc. R. Soc. Biol. 2019, 286, 20182294. [Google Scholar] [CrossRef] [PubMed] [Green Version]
  18. Tisseuil, C.; Gryspeirt, A.; Lancelot, R.; Pioz, M.; Liebhold, A.; Gilbert, M. Evaluating methods to quantify spatial variation in the velocity of biological invasions. Ecography 2016, 39, 409–418. [Google Scholar] [CrossRef] [Green Version]
  19. Gilbert, M.; Liebhold, A.M. Comparing methods for measuring the rate of spread of invading populations. Ecography 2010, 33, 809–817. [Google Scholar] [CrossRef]
  20. Pioz, M.; Guis, H.; Calavas, D.; Durand, B.; Abrial, D.; Ducrot, C. Estimating front-wave velocity of infectious diseases: A simple, efficient method applied to bluetongue. Vet. Res. 2011, 42, 1–13. [Google Scholar] [CrossRef] [Green Version]
  21. Shigesada, N.; Kawasaki, K. Biological Invasions: Theory and Practice; Oxford University Press: Oxford, UK, 1997. [Google Scholar]
  22. Skellam, J.G. Random spread in theoretical populations. Biometrika 1951, 38, 196–218. [Google Scholar] [CrossRef]
  23. Shigesada, N.; Kawasaki, K.; Takeda, Y. Modeling stratified diffusion in biological invasions. Am. Nat. 1995, 146, 229–251. [Google Scholar] [CrossRef]
  24. Williamson, M.; Pyšek, P.; Jarošík, V.; Prach, K. On the rates and patterns of spread of alien plants in the Czech Republic, Britain, and Ireland. Ecoscience 2005, 12, 424–433. [Google Scholar] [CrossRef]
  25. Liebhold, A.M.; Halverson, J.A.; Elmes, G.A. Gypsy moth invasion in North America: A quantitative analysis. J. Biogeogr. 1992, 19, 513–520. [Google Scholar] [CrossRef]
  26. Aikio, S.; Duncan, R.P.; Hulme, P.E. Herbarium records identify the role of long-distance spread in the spatial distribution of alien plants in New Zealand. J. Biogeogr. 2010, 37, 1740–1751. [Google Scholar] [CrossRef]
  27. R Development Core Team. R: A Language and Environment for Statistical Computing; R Development Core Team: Vienna, Austria, 2013; Available online: http://www.R-project.org (accessed on 10 January 2018).
  28. Bivand, R.; Keitt, T.; Rowlingson, B.; Pebesma, E.; Sumner, M.; Hijmans, R.; Rouault, E.; Bivand, M.R. Package ‘rgdal’: Bindings for the Geospatial Data Abstraction Library. Available online: https://cran.r-project.org/web/packages/rgdal/index.html (accessed on 1 January 2018).
  29. Hamner, B.; Frasco, M.; LeDell, E. Package ‘Metrics’. Available online: https://cran.r-project.org/web/packages/Metrics/index.html (accessed on 1 January 2018).
  30. Akaike, H. Information theory and an extension of the maximum likelihood principle. In Selected Papers of hirotugu Akaike; Springer: New York, NY, USA, 1973. [Google Scholar]
  31. Mineur, F.; Davies, A.J.; Maggs, C.A.; Verlaque, M.; Johnson, M.P. Fronts, jumps and secondary introductions suggested as different invasion patterns in marine species, with an increase in spread rates over time. Proc. R. Soc. Lond. Biol. 2010, 277, 2693–2701. [Google Scholar] [CrossRef] [Green Version]
  32. Wang, R.; Wang, Y.Z. Invasion dynamics and potential spread of the invasive alien plant species Ageratina adenophora (Asteraceae) in China. Divers. Distrib. 2006, 12, 397–408. [Google Scholar] [CrossRef]
  33. Andow, D.A.; Kareiva, P.M.; Levin, S.A.; Okubo, A. Spread of invading organisms. Landsc. Ecol. 1990, 4, 177–188. [Google Scholar] [CrossRef]
  34. Fraser, E.J.; Lambin, X.; Travis, J.M.; Harrington, L.A.; Palmer, S.C.; Bocedi, G.; Macdonald, D.W. Range expansion of an invasive species through a heterogeneous landscape–the case of American mink in Scotland. Divers. Distrib. 2015, 21, 888–900. [Google Scholar] [CrossRef] [Green Version]
  35. Morin, R.S.; Liebhold, A.M.; Gottschalk, K.W. Anisotropic spread of hemlock woolly adelgid in the eastern United States. Biol. Invasions 2009, 11, 2341–2350. [Google Scholar] [CrossRef]
  36. Nathan, R. Long-distance dispersal of plants. Science 2006, 313, 786–788. [Google Scholar] [CrossRef] [Green Version]
  37. Muirhead, J.R.; Leung, B.; van Overdijk, C.; Kelly, D.W.; Nandakumar, K.; Marchant, K.R.; MacIsaac, H.J. Modelling local and long-distance dispersal of invasive emerald ash borer Agrilus planipennis (Coleoptera) in North America. Divers. Distrib. 2006, 12, 71–79. [Google Scholar] [CrossRef]
  38. Meentemeyer, R.K.; Cunniffe, N.J.; Cook, A.R.; Filipe, J.A.; Hunter, R.D.; Rizzo, D.M.; Gilligan, C.A. Epidemiological modeling of invasion in heterogeneous landscapes: Spread of sudden oak death in California (1990–2030). Ecosphere 2011, 2, 1–24. [Google Scholar] [CrossRef]
Publisher’s Note: MDPI stays neutral with regard to jurisdictional claims in published maps and institutional affiliations.
Figure 1. Technique flow diagram of the simulation study; CV is short for coefficient of variation.
Sustainability 12 08526 g001
Figure 2. Examples of simulated invasion dynamics and conversion to county-level spread for biphasic expansion pattern; (a,c,e) Simulated biphasic expansion during years 3–24 for spread scenarios 1, 2, and 3, respectively; (b,d,f) county-level spread record converted from (a,c,e), respectively. The distances between the spread origin and first and second jump points in (e,f) are set the same in all three regions.
Sustainability 12 08526 g002
Figure 3. Similarity matrix of eight methods on estimating overall spread rate and spread dynamics. (a,c) Correlation matrix and similarity pattern of estimated overall rate and spread dynamics, respectively, for all regions, expansion patterns, and spread scenarios. (b,d) Root mean square error (RMSE) of estimated overall rate and spread dynamics, respectively, among each method for all regions, expansion patterns, and spread scenarios. Methods that are enclosed in the same triangle are classified in the same group by hierarchical clustering based on similarity of estimated rate.
Sustainability 12 08526 g003
Table 1. Statistics of county size in each region for different spread scenarios and expansion types.
Spread ScenarioExpansion
Type
No. of Infested CountiesMean County Area (km2)Coefficient of Variation
R1R2R3R1R2R3R1R2R3
S1Linear6372401031188.213173.157564.290.120.070.29
Biphasic9193711721235.233133.177243.130.150.070.31
LGF9303771721236.823175.757229.180.160.100.32
S2Linear516198821125.043133.548472.740.020.090.29
Biphasic760209951176.033231.868062.710.060.070.33
LGF758209951175.653231.868062.710.070.130.26
S3Linear9143811461271.613273.848858.330.120.040.35
Biphasic11474712001290.963275.948169.050.130.040.35
LGF11584792001288.323274.227881.000.140.080.34
LGF is abbreviated for Logistic growth function; S1, S2, and S3 are short for symmetric spread scenario, asymmetric spread scenario, and long-distance jump dispersal scenario, respectively; R1, R2, and R3 are short for Regions 1, 2, and 3, respectively.
Table 2. Full and abbreviated names of all methods and the measurements used by all methods to estimate spread dynamics.
MethodName of MethodMeasurement
Full NameAbbreviation
Regression methodsCentroid distance between spread originCtdD_RMean distance between county centroids and spread origin
Minimum distance between county and originMinD_RMean of the minimum distance between counties and spread origin
Square root of infested areaSqrtA_R A / π
Square root of number of infested countiesSqrtN_R n
Square root area estimated from number of infested countiesSqrtNA_RSqrtN_R * A ¯ / π
Boundary displacementCentroid boundaryCtd_BDMean distance between two consecutive boundaries
County boundaryCty_BD
Minimum spread distanceMSDMean of the minimum distance between centroids of newly and earlier infested counties
A ,   n ,   and   A ¯ represent the cumulative infested area, number of all infested county, and mean area of invaded counties, respectively.
Table 3. R2 of estimated overall spread rate by each scenario and region, and R2 and root mean square error (RMSE) of estimated spread rates in all regions for all scenarios.
SpreadRegression MethodBoundary DisplacementMSD
CtdDRMinD_RSqrtA_RSqrtN_RSqrtNA_RCtd_BDCty_BD
R2 by scenarioS10.960.960.950.090.871.000.950.04
S20.960.960.920.090.860.940.930.03
S30.470.470.890.020.790.850.890.00
R2 by regionRegion 10.890.890.980.930.920.980.980.89
Region 20.800.800.960.960.950.970.980.76
Region 30.810.810.950.920.910.980.970.41
All ratesR20.810.810.950.140.910.980.970.13
RMSE1.781.781.06NA1.250.711.225.19
S1, S2, and S3 represent symmetric spread, asymmetric spread, and long-distance jump dispersal, respectively.
Table 4. R2 of estimated spread dynamics by each scenario and region, and R2 and root mean square error (RMSE) of estimated spread dynamics for all regions and scenarios.
SpreadRegression MethodBoundary DisplacementMSD
CtdDRMinD_RSqrtA_RSqrtN_RSqrtNA_RCtd_BDCty_BD
R2 by scenarioS10.830.810.840.360.840.900.830.24
S20.600.450.790.350.890.800.770.22
S30.050.060.570.240.630.770.580.07
R2 by regionRegion 10.370.390.960.460.890.970.960.27
Region 20.310.320.870.480.920.900.880.24
Region 30.310.310.570.380.650.770.550.30
All dynamicR20.330.340.760.240.800.860.760.19
RMSE7.447.253.86NA3.503.304.138.75
S1, S2, and S3 represent symmetric spread, asymmetric spread, and long-distance jump dispersal, respectively.
Table 5. Correlation coefficient between mean of county size and estimated overall rate and spread dynamics, and between mean/coefficient of variation of county size and R2 for each region, expansion type, and spread scenario.
Correlation of A and BRegression MethodBoundary DisplacementMSD
ABCtdDRMinD_RSqrtA_RSqrtN_RSqrtNA_RCtd_BDCty_BD
MeanOverall rate0.00−0.040.01−0.85 ***0.130.000.070.91 ***
Dynamics0.08−0.020.15 *−0.55 ***−0.040.15 *0.15 *0.67 ***
MeanR2 of overall rate−0.06−0.23−0.68 *0.510.510.180.42−0.58
CV0.07−0.19−0.620.180.180.130.14−0.38
MeanR2 of dynamics−0.08−0.22−0.85 ***−0.32−0.32−0.69 **−0.86 ***−0.38
CV−0.05−0.16−0.81 ***−0.53 *−0.53 *−0.62 **−0.77 ***−0.34
*, ** and *** Significant at level α = 0.05, 0.01, and 0.001, respectively.

