The Effects of the Selective Enlargement of Fare-Free Public Transport


Faculty of Economics, University of Gdansk, Armii Krajowej 119/121, 81-824 Sopot, Poland
*
Author to whom correspondence should be addressed.
Sustainability 2020, 12(16), 6390; https://doi.org/10.3390/su12166390
Submission received: 3 July 2020
/
Revised: 3 August 2020
/
Accepted: 6 August 2020
/
Published: 7 August 2020
(This article belongs to the Special Issue Trends in Transport Sustainability and Innovation)
Abstract
:In recent years fare-free public transport (FFPT) found itself at the centre of attention of various groups, such as economists, transport engineers and local authorities, as well as those responsible for the organisation of urban transport. The FFPT is hoped to be the answer to contemporary transport-related problems within cities, problems which largely result from insensible proportions between trips carried out via personal mode of transportation and those completed by the means of public transport. This article reviews the motives and effects connected with the introduction to date of fare-free transport zones across the globe. It also presents, using data obtained in market research, the actual impact of a selective extension of the entitlement to free fares on the demand for urban transport services. The effects observed in other urban transport systems were then compared against those observed in relation to one, examined system. Analyses of observed FFPT implementation effects were then used to establish good and bad practices in the introduction of FFPT. The article also contains forecasts on the effect of the extension of entitlement to free fares and an increase in the public transport offer may have on the volume of demand for such services. The analyses have shown that an increase in the public transport offer (understood as an increase in the volume of vehicle-kilometres) would increase the demand for urban transport services more than the selective implementation of FFPT (assuming that the costs incurred by the local authorities remain unchanged).
1. Introduction
Urban transport systems are still unsustainable in most cities and metropolis [1,2]. An increase in the attractiveness of the public transport offer is essential if the goals of sustainable mobility are to be attained [3,4,5,6]. The adjustment of service properties to meet the preferences and expectations of passengers whilst at the same time providing quality services, determines the attractiveness of public transport. The main aim of sustainable mobility is to create a permanent change in the transport behaviours of residents by increasing the share of trips completed via sustainable means of transport, such as public transport, bicycle and on foot [7]. The concept of sustainable mobility has evolved over the years. According to [8], the concept of sustainable mobility as it stands today consists of three main pillars. Therefore, sustainable mobility consists of electromobility (of all modes), collective transport 2.0 (based on various forms of shared mobility) and low-mobility societies (based on car-free cities) [8]. Fare-free public transport (FFTP) fits the idea of collective transport 2.0. This idea applies not only to traditional public transport (such as buses, trains and trams owned by national or local governments), but also to the concept of mobility as a service and shared mobility. This means that FFTP is only one of the possible solutions that can be taken on the path to sustainable mobility.
For years FFPT has been the object of economic, urban, environmental and political analyses. Attempts to introduce FFPT had already been made in the 20th century [9]. The exploitation, economic and political results of introduction of FFPT could not, however, be conclusively evaluated due to the vast differences in their scope, groups of residents entitled to such fares, the periodical introduction of such services, the experimental character of changes in some cities, as well as lack of standardised research methodology.
When offering FFPT, some politicians try to define it as a pure public good, see [10,11]. With such an approach some efforts are directed at proving that the final cost of introduction of FFPT becomes gradually lower due to the dropping revenues from fare sales. It cannot be, however, overlooked that the costs of public transport in Gdańsk Agglomeration are covered by 10%–40% from the revenues obtained from the sale of fares. This means that the introduction of FFPT for all residents living in larger cities would likely result in the increase of subventions required from the local authorities to an amount from tens to hundreds of millions of euros per annum. It should also be considered that the introduction of FFPT, despite the low-cost elasticity of public transport demand, may still significantly increase the demand for such services. The increase in cost shall result from the increased transport mobility of the current passengers and the transformation in part of the potential demand into effective demand (modal shifts seen as a change in the selected mode of transportation). It may result in a situation where the public transport capacity offered prior to the introduction of FFPT shall prove insufficient to meet the increased transport demand [12] whilst at the same time preserving at least the same quality of service provided prior to FFPT. The modal shift from private vehicle use to public transport shall require adjustments in the quality and volume of public transport services in order to meet the needs and transport preferences of private vehicle users who possess higher travel standards. Meeting such demands will, in turn, generate additional costs. In such circumstances the arguments supporting the possibility of the introduction of FFPT at relatively low cost do not bear scrutiny in the light of microeconomic theory. In effect, the introduction of FFPT is usually justified in political terms [13].
The literature on the subject emphasises the fact that a reduction in the volume of cars participating in traffic may be obtained solely with governmental programmes which in addition to a ‘carrot’ also offer a ‘stick’ [14]. This means that a reduction in the volume of car traffic and a modal shift among residents living in the cities to a more sustainable form of transport is more effective when the introduction of FFPT is coupled with restrictions regarding car travel (by introducing low emission zones or a fee for entering the city centre by car) and changes in parking policies (by extending paid parking zones, increasing parking fees or restraining parking supply) [15,16]. That should happen because the difference in the cost of travel by car and public transport would increase to a greater extent than if only FFPT was introduced. Thus, some authors suggest that strategies focused on increasing the cost of travelling by car might be more effective in achieving the modal shift objective than FFPT [11]. It should be emphasised that the idea of giving up passenger cars is often met with significant resistance among the city residents. The literature on the subject mentions many factors influencing transport behaviour. A. De Witte in his works proposes an approach that assumes these factors can be grouped into three categories: access, skills and appropriation [17,18]. Access factors are linked to the availability of different alternatives or travel modes. It is therefore due to the availability of transportation networks and the location of destinations of the journey. Skills enable or facilitate the use of particular means of transportation. This category also includes skills related to time and budget management. The appropriation category consists of experiences, habits, preferences and values linked to the travel modes. All of the above factors affect the way individuals appreciate their own access and skills to the different travel modes. The cost of travel therefore plays a small part in the factors that determine transport behavior and preferences.
It happens all too often that during the discussion on the introduction of FFPT, arguments raised in support of such actions are not sufficiently backed up by theoretical and empirical evidence. The still developing current knowledge on the effects of the introduction of such tariffs makes the aforementioned arguments pure hypothesis or suppositions without any scientific evidence from research and analysis. An example of such reckless decisions can be seen in the introduction of FFPT within the Gdansk Bay Metropolis (GBM) for students and pupils under 25 years of age. Prior to the 2018 elections, the authorities of Gdansk made the decision to introduce such a fare without consulting the remaining 13—inter-cooperating—communes, which were also members of the Metropolitan Public Transport Association of Gdansk Bay (MZKZG). The decision of the Gdansk authorities was contradictory to an agreement between the members of the Association that no member is to make individual decisions concerning the prices of fares as well as the scope of entitlements to reduced and FFPT within the GBM. In consequence, the remaining communes of the GBM, with two exceptions in rural districts, decided to follow suit and introduce the same FFPT, in an effort to eliminate differences in the tariffs offered. The decision passed by the authorities was not preceded by any research nor analyses of possible effects such additional FFPT entitlements may have on the long-term goals of sustainable mobility (with the exception of the forecasted decrease in the revenues obtained from the sale of fares). Those responsible for the decision were invoking the example of Tallinn (one of the best researched examples of FFPT implementation) whilst at the same time dismissing the specificity of transport behaviour and preferences of students, as well as the differences in the transport networks. They were also selectively giving the examples of the effects the introduction of the FFPT had on Estonia’s capital. They also pointed out the positive educational factor of the decision, which would allow for a change of the transport behaviours of young people in the future. This, however, was not supported by any research into the transport preferences of the group.
The paper contains three major sections. The first section provides an overview of existing experience related to the introduction of FFPT in many cities around the world. The second section presents the posed research questions and methodology used to find the answers to those questions. In the final section, the authors of this article present the effects of a selective introduction of FFPT for children and teenagers within the GBM using primary data (research into the volume and structure of demand). The results of research into transport preferences served as the basis for expansion in the change of demand, and in the case of certain cities (communes) a detailed analysis was also carried out.
The main aim of this article is to broaden the knowledge of the effects the FFPT has from the point of view of sustainable mobility. The work offers the results of the primary research into transport needs, demand, preferences and behaviours within the Gdansk Bay Metropolis (GBM) in Poland. The study also presents answers to key research questions regarding the effectiveness of FFPT implementation in the analysed area.
2. The Premises and Empirical Evidence Connected with Fare-Free Tariffs in Urban Transport
2.1. Complexity of Fare-Free Public Transport Policy from a Sustainable Transport Perspective
Propositions for the introduction of FFPT as a system solution funded by the government date back to the 1970s [19]. The catchment area of FFPT may include a particular transport network. In practice, this may mean any of the following: the entire area where public transport services are provided, a specified area (e.g., town centre), specified routes, specific public transport mode (e.g., only ferries), particular hours (e.g., off-peak hours), particular days (e.g., every first day of the month, weekends or Car Free Days) or particular group of users (e.g., students, children, elderly or visitors and tourists) [20,21]. For more on the various forms of full and partial FFPT, see for example [20,21,22].
The number of cities where attempts to introduce FFPT, diverse in their scope, is currently estimated to exceed 100, most of which are in Europe, especially France and Poland [23]. The cities with FFPT vary in size. In France, for example, FFPT was introduced in some 30 towns and cities, most with a population between 10,000 and 110,000 residents [24]. In Germany, on the other hand, FFPT tests were completed in two cities, each with a population of approximately 15,000 residents. FFPT is often introduced for a determined period of time (e.g., for the duration of a particular investment), for a trial period, as part of research, or in exceptional circumstances (e.g., flooding of Prague in 2002 or terrorist attacks in Paris and Brussels in 2015 and 2016, respectively) [25]. Outside Europe, FFPT was/is operational in, amongst others, the USA (39 cities) and Brazil (15 cities). One of the largest experiments concerning FFPT was carried out in the city of Chengdu, China—a city of nearly 15 million residents [26]. In summary, it can be said that FFPT is introduced both to help partially solve actual temporary problems (for example due to flooding or road reconstruction) as well as for strategic reasons.
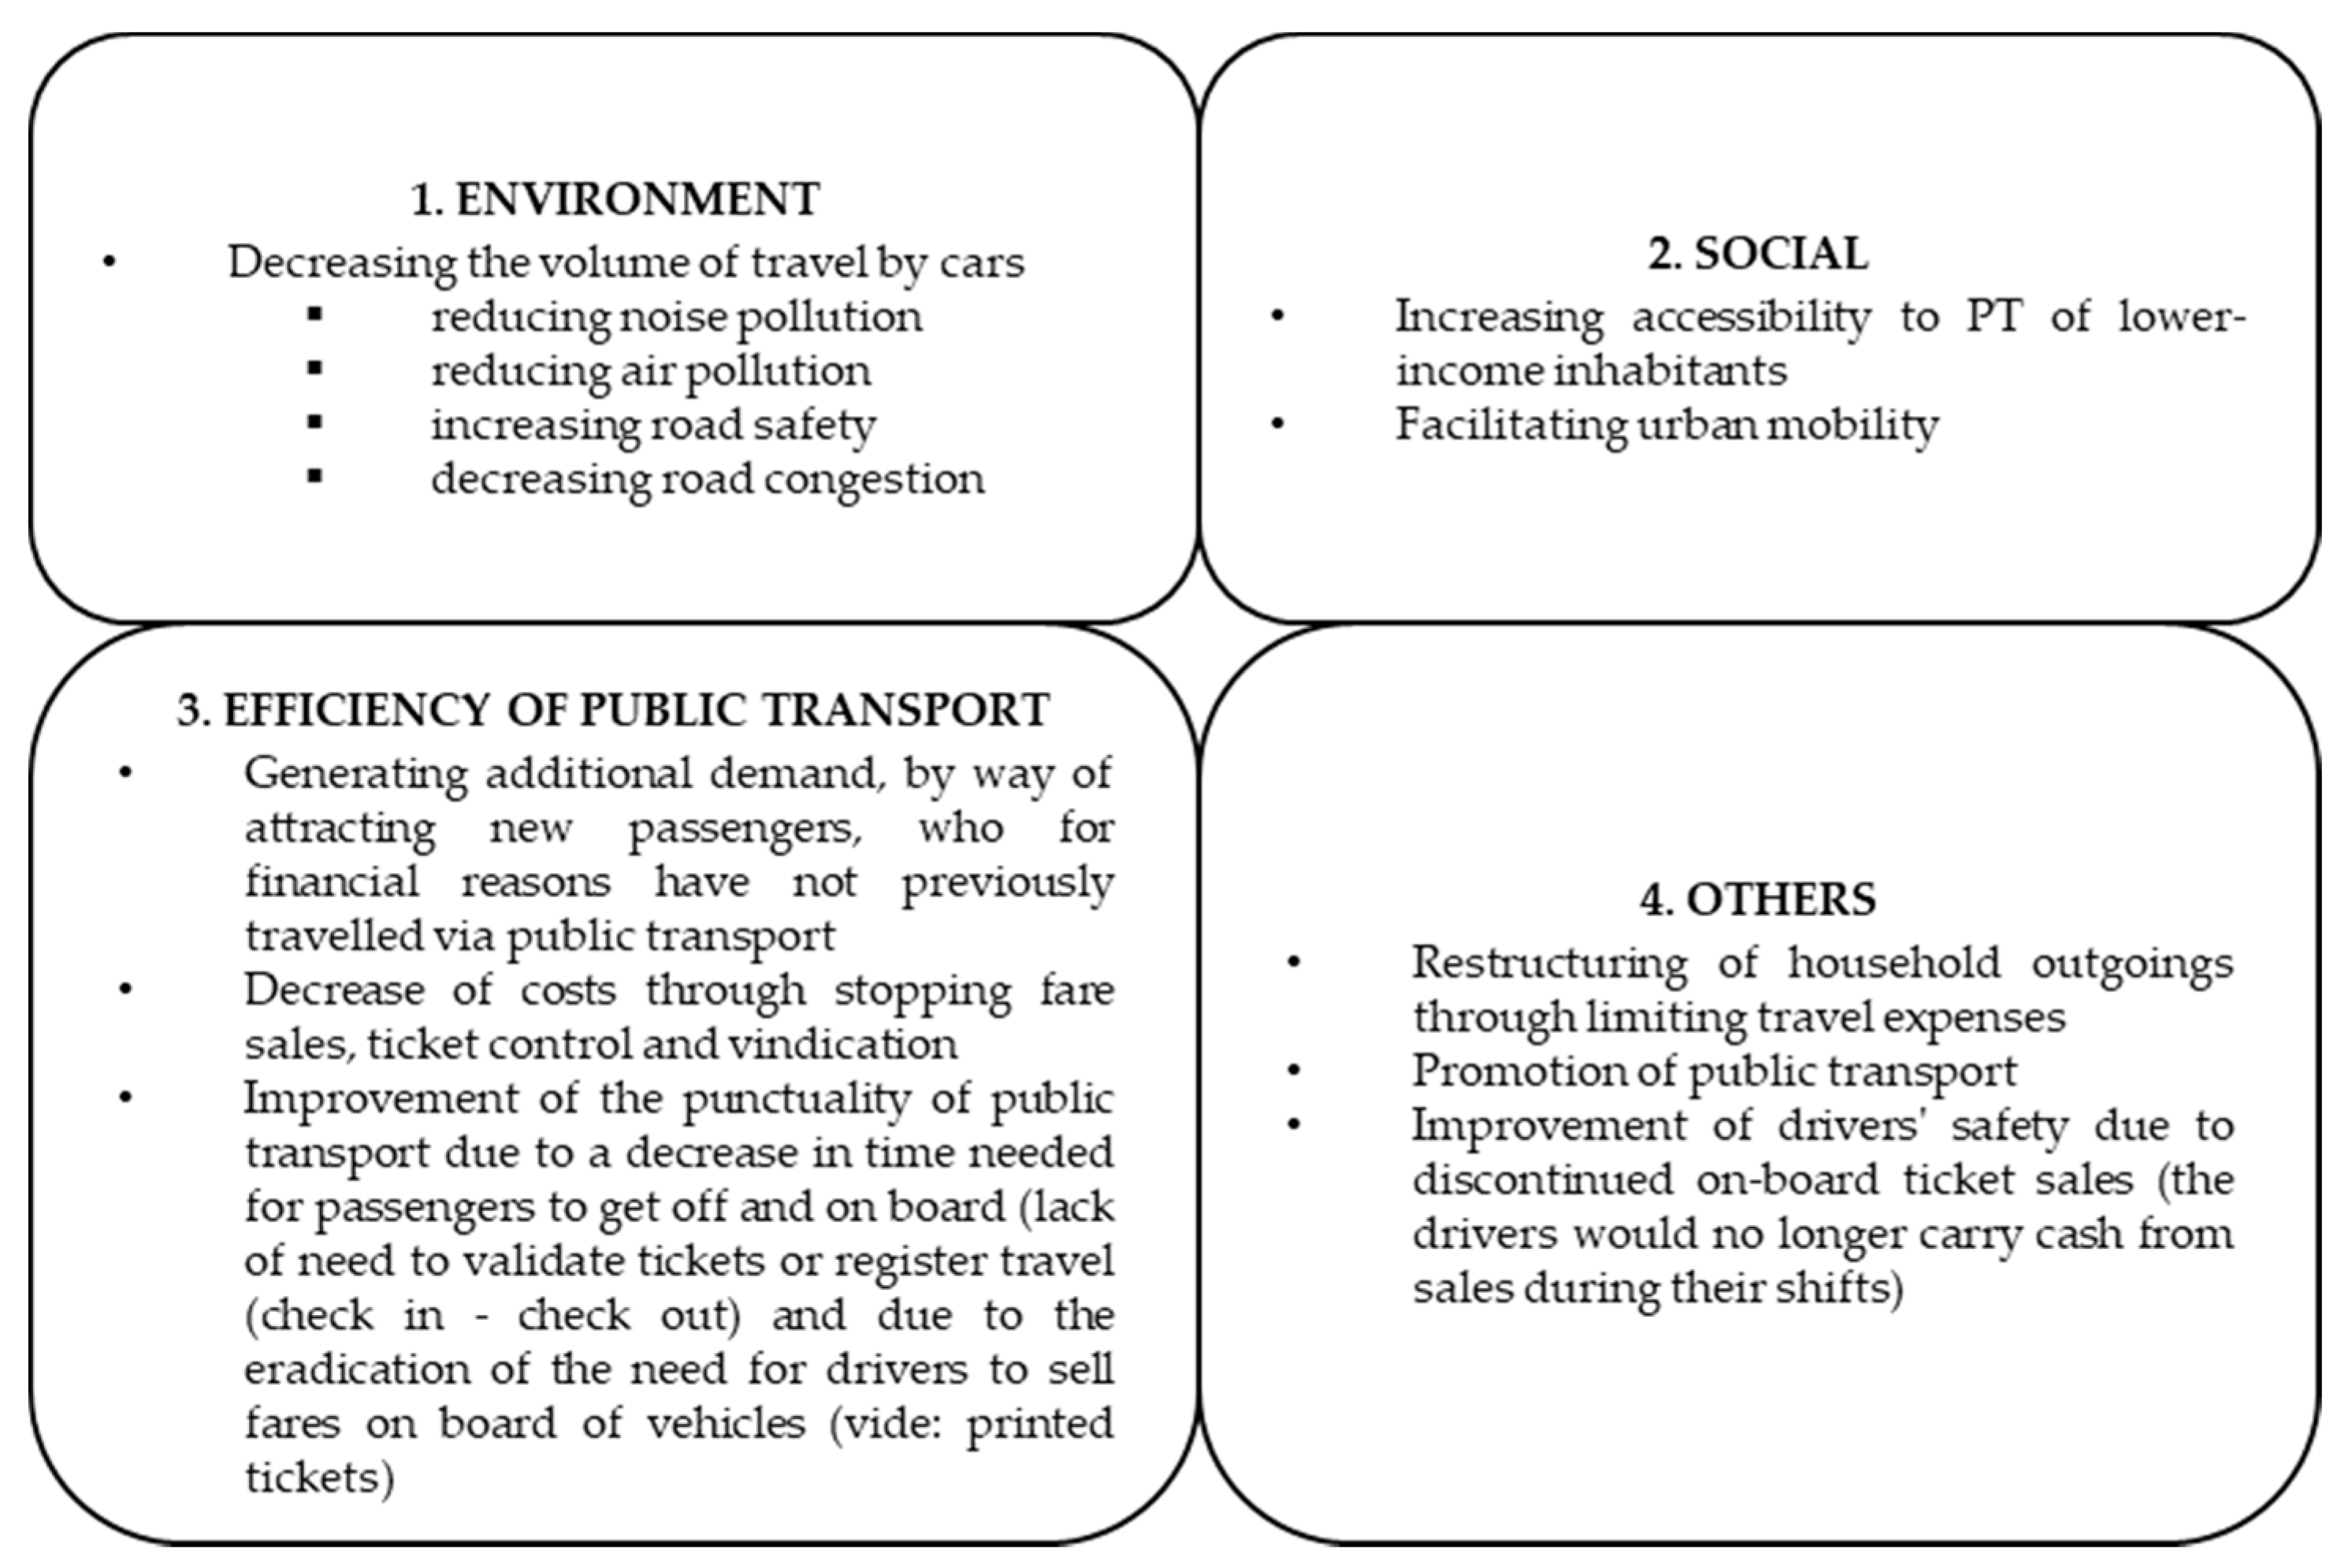
The findings of experiments connected with the introduction of FFPT vary between cities. In some cases, the implementation of such transport was done purely for research purposes, aimed at evaluating the influence FFPT have on the changing travel behaviours of residents. In other cases, FFPT was restricted to particular areas of cities or market segments in the hope of increasing demand for public transport services. Some of the cities where FFPT were being tested or were meant to remain as a permanent part of service, backtracked on their decisions (Kiruna, Templin, Lübben). The reasons for the retraction of FFPT can be seen in the failure to achieve set goals or the excessive cost associated with meeting those goals [3,27]. Advocates for FFPT point to a wide spectrum of anticipated benefits with regards to transport, social and environmental policies, as well as operating conditions. The main potential benefits of FFTP are presented in Figure 1.
All of the abovementioned benefits have to be taken into account when analysing the costs and benefits of implementation of FFPT.
Subventions for public transport are warranted by its social function. The groups that are financially vulnerable (residents with low income, non-drivers, elderly and disabled) can avoid the problems associated with social isolation thanks to the services provided by public transport. Students are also among those passengers who may increase the number of trips they make due to a decrease in fare prices [32]. It should be emphasised, therefore, that FFPT can be studied and perceived through different prisms. W. Kębłowski emphasised in his work that three main perspectives of FFPT can be distinguished. The debate on FFPT takes place regarding: economic rationality, sustainable development and socio-political transformation [20].
The authors of [12] are right to claim that the success or failure of FFPT projects can be determined largely by the initial formulation of their goals. These goals may relate to the financial and economic aspects of transport as well as to social policy. They also argue that the low quality of public transport makes the introduction of FFPT irrelevant. Effective systems of FFPT are those which mainly aim to develop the segment of loyal customers. The authors of [31,33] claim that FFPT seem to manifest higher potential outside large cities. This is unanimous with results of research into attributes that point to the fact that the importance of price grows proportionally with the distance of travel [34,35].
Economic justification of FFPT could be achieved “should the increase in subventions for public transport in connection with FFPT implementation be lower than the decrease of subventions on the account of urban car traffic that should decrease due to the possibility of free travel via public transport” [36]. It should also be pointed out that the potential implementation of FFPT should constitute an element of complex and coherent strategy aimed not only at propagating public transport but coupled with restrictions posed for car users. Any funds allocated for public transport should be used to improve its quality, perceiving it to be a tool indispensable in solving transport issues within cities [12].
The supporters of FFPT urge that its implementation shall cause a synergy effect, namely, a decrease in the volume of cars on the roads as a result of an increase in the number of passengers travelling by public transport. This should, in turn, lead to a decrease in traffic congestion that shall positively influence the improvement of public transport operations. The quality of service should be then expected to grow, therefore proving additional encouragement to use public transport. There is, however, no sufficient empirical data to support the existence of such a pattern to a satisfactory degree. The models and analyses of previous cases of FFPT implementation point to a possible increase in job opportunities by 20%–60% [33,37].
2.2. The Worldwide Experience of Fare-Free Public Transport Policy
Four tram lines, seven trolleybus lines, and sixty-five bus lines were included in the FFPT programme implemented in Tallinn. In the 12 months that followed the introduction of FFPT, the demand for public transport services increased by 14%. Transport work, on the other hand, increased by 24% due to the increase in the average distance travelled. It needs to be highlighted that the vast majority of the substitution effects were due to shift from soft modes—around 30%–40% from biking and around 35%–50% from walking [38]. This leads to the conclusion that the increase in public transport share took place within the segment of sustainable travel, in accordance with the results anticipated by [37]. The share of car travel decreased by 5%; however, the average distance travelled by car increased [38]. Such results significantly restrict the effects of FFPT from the point of view of sustainable mobility. The introduction of FFPT in Tallinn resulted in an increase in the share of public transport amongst the people with the lowest incomes. There is no evidence, however, that the ability to travel improved the life quality of those persons (understood as increase an in employability). The number of Tallinn’s residents increased, which, in turn, increased the revenues from taxes [38,39]. To a certain degree, this occurrence should be perceived as the ‘taking over the taxpayers’ effect, especially when concerning people who declared themselves as residents of the city when in fact they lived outside its borders. The advocates of the solution implemented in Estonia’s capital claim that the actions taken managed to reverse the annually declining trend of public transport passenger volumes [40]. The question must be posed whether the same, or even superior, effects could be achieved by allocating the same funds to increase supply and improve the quality of public transport services. The example of Tallinn seems to confirm earlier claims [27] that all public transport systems, which decide to implement FFPT, initially experience a boom in passenger volumes which sometimes persists. The increase usually takes place at the expense of pedestrian and bicycle travel—not car travel [41,42]. The analyses of FFPT in Tallinn reveal that the effects of the programme were limited as some of the main goals were not reached whilst others, related to the external influence of the project, cannot be verified.
It is also stressed that the project of FFPT was drafted by the administrative workers of the town’s Mayor without any consultation with experienced urbanists or transport managers. It also did not result from assumed strategies. The voices of critics are heard claiming that politicians created a demand for FFPT that had not previously existed by means of a referendum [43]. It is also emphasised that the effects of FFPT in Tallinn are more moderate than in other cities in Europe, which can be attributed to the low fare prices for public transport within the city (broad spectrum of entitlements for reduced fares) and the high share of public transport (40%) in the modal split.
Regardless of the varied opinions on the effects of the implementation of FFPT in Tallinn, in July 2018 the authorities of Estonia introduced free supralocal transport in 11 out of 15 provinces in order to revitalise suburban areas and counter their depopulation. The decision was made at a time when this mode of transport was already funded in more than 80% from public funds. The solution required passengers to apply for an electronic card, used to register each trip, or to obtain a printed ticket from the bus driver when boarding a bus. It has to be said that passengers of suburban lines travelling to Tallinn are still required to purchase tickets.
In search of more satisfying effects of the implementation of FFPT in light of sustainable mobility, our attention should be directed to the town of Hasselt, Belgium, with a population of 72,000. The introduction of FFPT in this town can provide us with an example of the positive results of such programmes. In the years 1987–1999 the motorisation indicator increased there by 25% whilst the number of inhabitants grew by only 3.3% [44]. Prior to the introduction of FFPT, the quality of public transport services was radically improved—the frequency of operations increased on those lines which were in highest demand, new lines were opened (three lines were in operation in 1996 whilst in 2012 this number grew to 11) and priority on roads for public transport vehicles was also implemented. The policies on mobility were, therefore, accompanied by coordinated actions such as coherent policies for cyclists and pedestrians; restrictive parking policies; policies in public areas spatial planning; significant development of services offered by public transport; and introduction of FFPT. As a result, the operation work increased from 500 thousand vehicle-kilometres, to 2.250 million vehicle-kilometres [45]. It is worth noting that public transport in Hasselt is partially funded by the Flemish government on the basis of a long-term agreement. It also has to be emphasised that all actions taken (service supply, marketing and funding) were integrated and constituted as part of mobility plans. It is estimated that after the introduction of FFPT on 1 July 1997, the number of passengers increased from 360 thousand in 1996 to over 4.5 million (12,600 passengers per day on average). Taking into account the increase in vehicle-kilometres (vkm) the passenger volume growth can be translated to an increase of 0.7–2 passengers per vehicle-kilometres. A free urban bicycle programme is operational in Hasslet as complementary to the FFPT offer. It is estimated that in the first year of the programme’s operations, approximately 16% of car users moved to public transport. A positive effect was also seen in the decrease of expenses on the development of transport infrastructure, especially on roads. In 2013 the local authorities were forced, due to financial reasons, to introduce a 60-eurocent fee. However, young people under the age of 19 were still entitled to free travel [46]. Similarly to Tallinn, part of demand for public transport services was generated at the expense of those passengers who, prior to FFPT, would walk or travel by bicycle.
In 2004, in the town of Leiden, Netherlands, FFPT was introduced for the duration of one year in the so-called ‘Hague corridor’. The aim of the project was to evaluate the influence of free bus transport on the decrease of congestion during travel to work. Free buses were operational from Monday to Friday. In effect, a total rise in demand of 40% was noted. From that, car drivers constituted the greatest share—45%. Ten percent of new passengers were those who previously would travel by motorised bicycles and bicycles, and a further 20–30% consisted of those who would previously travel using other means of public transport. Sixteen percent of the passengers were new public transport users, who switched to this mode of public travel with the generated demand. The congestion, however, did not decrease [12].
In January 1991, in the Netherlands a student card (OV Studentenkaart) was introduced, which entitled them to use public transport for free. A change in the travel behaviours of this group occurred as a result of the implementation of the new card. The share of public transport in trips to a place of study grew from 11% to 21% (the daily volume of public transport travel increased from 0.45 to 0.81). The share of cars in school-runs decreased by 34%, as did the share of bicycles by 52% [12].
Trial FFPT implementation in cities of over 50,000 inhabitants in the USA and Canada increased the demand by 30%–60%. Salt Lake City saw an increase in demand of only 13% and was an exception [37].
2.3. The Polish Experience of Fare-Free Public Transport Policy
As an example, in Poland, FFPT for a chosen segment of residents was introduced in Nysa. Residents of this town, with a population of 45,000, were allowed to travel for free on public transport in June 2012 should they be able to present a valid car registration certificate. In Gniezno a fare-free line was cancelled after three years of operation. It ran only a few times a day on Saturdays and its destination was the city centre. FFPT was also recently introduced in some regional Polish towns (among others in Police, Chocianów, Hajnówka, Kamienna Góra and Zambrowie). In 2019, it was estimated that FFPT was introduced, to varying degrees, in 66 municipalities across Poland [21]. D. Štraub in his work stated that through the use of FFPT, municipalities in Poland mainly try to reduce the external effects of transport, increase the mobility of their citizens, or both [21]. There is no credible data on changes in demand in connection with implementation of FFPT. It should be noted that in Polish conditions the introduction of a FFPT mainly occurs in small- and medium-sized municipalities with a less complex transport system [21]. This conclusion applies not only to Poland but to other countries around the world as well [47].
Another example of FFPT implementation in Poland took place in Żory in 2014—a town with 58,000 residents. FFPT was introduced on seven internal connections. Passengers travelling on six lines with destinations beyond the town’s boundaries were still required to purchase fares (these lines are operated by a municipal association). The results of FFPT introduction in Żory are difficult to establish since the only evaluations available were made by public officers and politicians. To quote one of such works: “It follows from the observations made by our public officers that between May and July the number of passengers grew fourfold—as was reported by one of Town Hall employees” [48]. In the first months following the introduction of FFPT in Żory, issues aroused concerning the transport capacity of vehicles. According to the contract the company which won the open tender delegated vehicles of small and medium capacity. In consequence, after four years of operation, the company declined to complete part of its scheduled runs citing the insufficient transport capacity of its vehicles as the reason which exposed the company to the possibility of being fined by administrative bodies and lose authorisation [49].
In other cities of Poland, local authorities have been extending entitlements to FFPT to additional groups of passengers. As rightly pointed out by [13], in Poland the substitutability of public transport and car travel, measured by the price of fuel and fares, is very low (on the contrary to countries of Western Europe). Fare prices are relatively lower when fuel prices reach levels comparable with those in the West of Europe. Therefore, the lower price elasticity of demand of these substitutes can be anticipated in countries like Poland. This means that the factual change in the volumes of modal shifts after implementation of FFPT shall be lower than in Western Europe and the USA.
3. Research Questions
The main research questions that arise following analysis of the abovementioned examples in European cities with regards to FFPT are as follows:
- Does the introduction of FFPT have a significant influence on the demand for such services?
- Is the introduction of FFPT the most efficient method (taking into account incurred costs and obtained benefits) of increasing the use of public transport?
- Are fare prices for public transport the key factor when choosing a mode of urban transport?
Following the introduction of free fares for students within the GBM, the authors of this article hypothesised that in order to significantly change transport behaviours, such actions should: be implemented in an integrated manner on the largest possible area in relation to the size of the agglomeration; concern segments that have the autonomy to decide about themselves (individuals have a real choice between options and they are free to decide of their own accord); and the quality of public transport should be seen as high in regards to meeting basic attributes.
4. Methodology
This article reviews and analyses the results of the decision made by the authorities of the communes of Gdansk Bay Metropolis in 2018 regarding the extension of FFPT entitlement to include all students using the findings of research into demand within the communes surrounding the core of the metropolis and in Sopot—the city which constitutes the core of the GBM (the entire core is created by three cities: Gdansk, Gdynia and Sopot).
Research into demand for public transport, which served as the basis for the analyses, is carried out annually following the agreements made by all communes located within the metropolitan area.
The research is conducted using the observation and note-taking method. All research takes place using conventional measuring tools (observation charts and registration charts). The observers and note-takers record the number of passengers as well as the type of fare or entitlement to free travel. Despite the fact that there are e-tickets in operation within the GBM area, the database on the ways in which they are used is incomplete and it does not provide enough information in order to base demand research solely on this source (no obligation to check in and check out within the metropolis). Moreover, only a certain part of passengers travel on e-tickets. Printed tickets still have a large share (30%–40%) in urban travel in this area and these are not recorded on the system.
Research is conducted once a year, from March to June, which are considered to be representative months in the year. The results of measurements carried out in these months show the smallest deviation from the annual average. The number of passengers is estimated for each vehicle. The structure of passengers (types of fares or fare-free entitlement) is estimated on selected rounds. The number of rounds on which the given passenger structure is being evaluated allows for the measurement of the structure indicator with an error lower than 1.5%–3% (depending on whether the data is collected in connection with the round, line, or city/commune’s area). In addition to the observers and note-takers, surveyors are present on board of participating vehicles. Their task is to examine the type of fixed-term fares used by passengers (1-h fares, 24-h fares and monthly fares). The data obtained allows for calculation of:
- the number of passengers in the cross-section of days of the week, year, rounds, lines, destinations, cities (communes);
- passenger structures in the cross-sections named above;
- revenues from fares in cross-sections named above.
The main aim of research within the GBM is the calculation of subventions, the amount of which should reflect the real (and not market) economic situation of public transport in a given city (commune). Two factors determine this situation: costs and revenues from fare sales. Using average amounts for a given network of public transport may lead to cross-funding of public transport of some cities (communes) by other cities (and communes). In a reality where organisation and management of public transport within the GBM is disintegrated (GBM is an inter-administrative association which in practice are only authorised to settle revenues from metropolitan tickets (there are three city tariffs in existence within the GBM, apart from the metropolitan tariff) and put forward recommendations regarding the unification of public transport) such practice is unacceptable from economic, formal and political standpoints. Lack of complete integration of public transport within the GBM, which is experienced on a daily basis by the passengers who perceive it as a major downside of this form of transport, paradoxically allows for a detailed analysis of the consequences of changes made to the services offered by public transport, inclusive of analyses of price elasticity of demand.
The findings of three most important analyses into this topic for three cities and five rural communes of the GBM are listed below.
5. Research Findings
5.1. Description of the Study Area
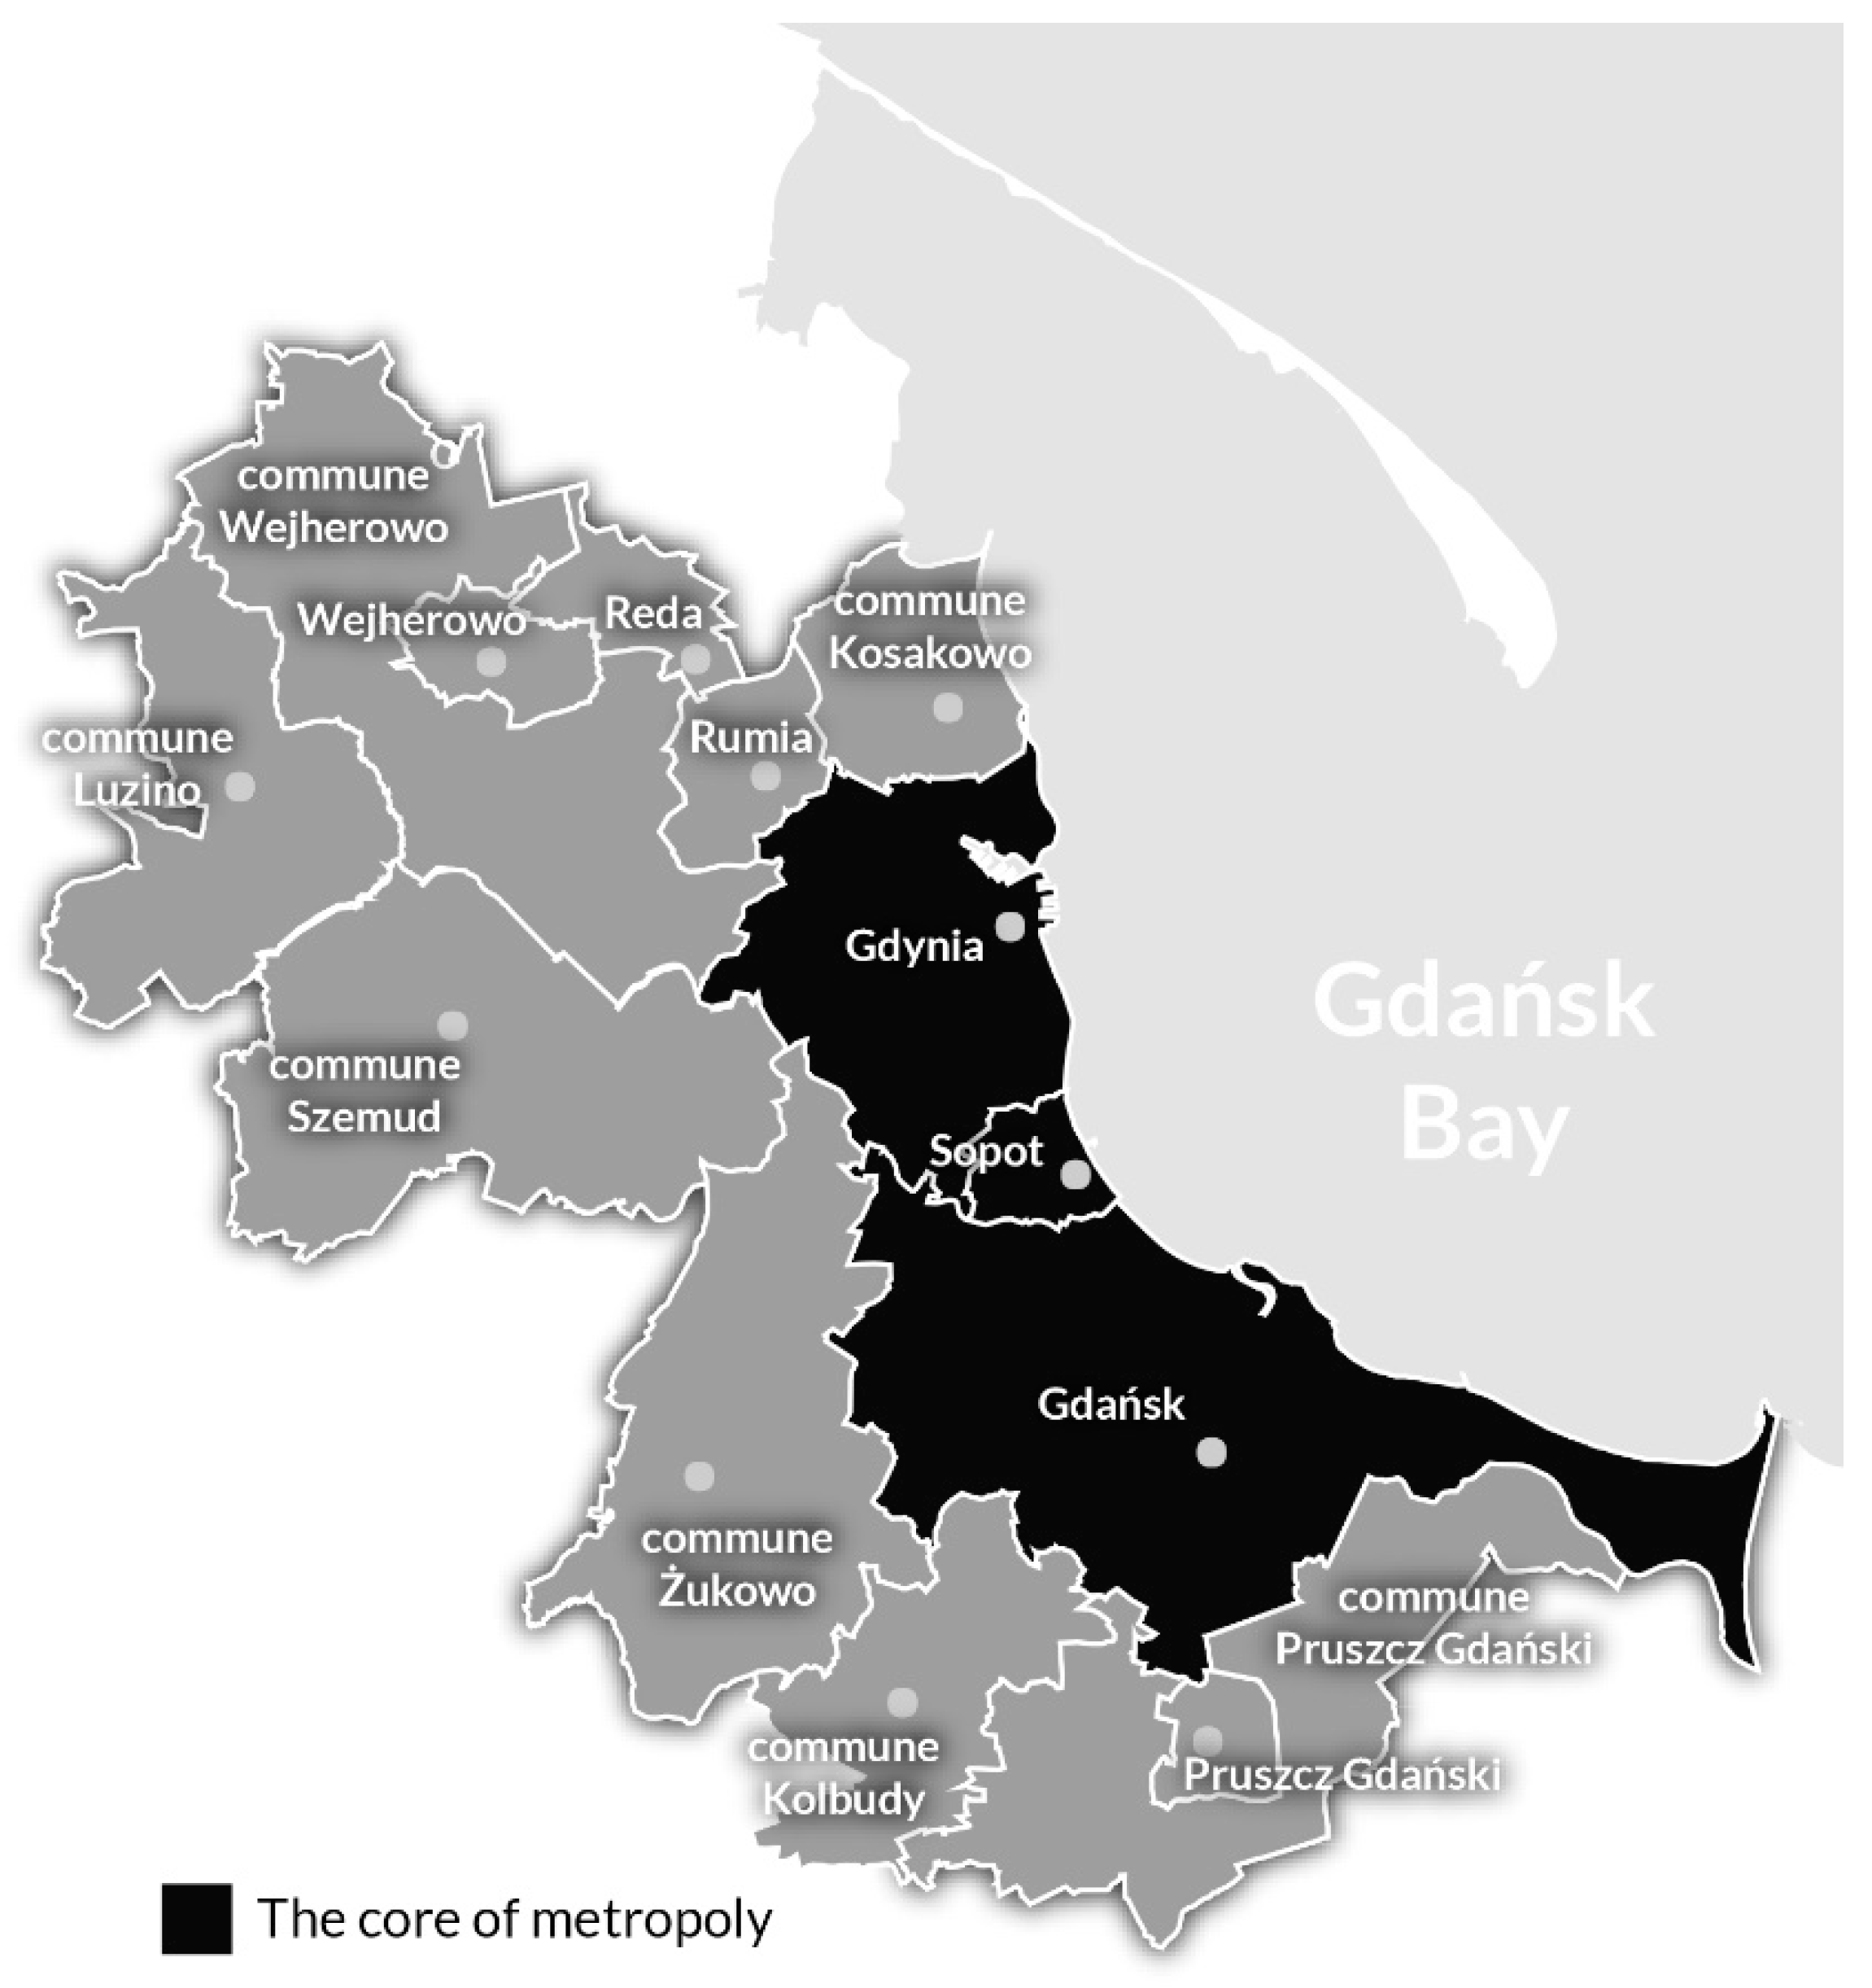
Fourteen communes with a total number of over 1 million residents are located within the Gdansk Bay Metropolitan area (Figure 2) [50]. Poland is divided into the following levels of administrative structure: commune (city), powiat (administrative district) and voivodeship governed by local authorities. Each level is responsible for managing public transport. In order to organise public transport across a number of communes or administrative districts, the local authorities may create municipal associations [51].
The public transport network in the study area is created by: bus lines, trolleybus lines, urban railway lines and metropolitan railway lines. Public transport is disintegrated and managed by Public Transport Boards, one commune (buses, trams and trolleybuses), as well as voivodeship office (railway). FFPT for students was introduced on bus, tram and trolleybus lines. Table 1 presents the profile of cities and communes included in the analysis.
Three of the areas included in research are cities, including one located in the core of the GBM (Sopot). The remaining five areas consist of rural communes located on the outskirts of the GBM. The population of cities amounts to 30,200–49,000 residents [50]. Rural areas are more diversified demographically. Their population is between 14,800 and 39,000 residents [50].
5.2. The Rationale of the Selective Enlargement of the Fare Free Public Transport
In 2018, prior to the local elections, the authorities of cities and communes passed a decision to extend the entitlement to FFPT. In his speech, the vice-president of Gdańsk for communal policy stated that “There is no evidence to defend the thesis that FFPT benefits city transport” [52]. He also emphasised that it was a social project (allowing for savings of a minimum of 214 PLN (49 EUR) per semester per child). The action was taken in an uncoordinated manner, with a number of varying age restrictions. For example, in Gdansk (the largest city within the GBM) the threshold for the entitlement was set at 24 years of age, whilst in Wejherowo, 15 years of age. All remaining local authorities, with the exception of Pruszcz Gdański, set the said threshold at 20 years of age. Thanks to this practice, data regarding the changes in demand between the subjects can be deemed as comparable. The spatial catchment area of the entitlement in the examined communes was restricted to their administrative borders, and the entitlement for students was valid only within those borders. The commune in which those entitlements were not extended (Pruszcz Gdański) became the point of reference for effects of FFPT on demand among students. The share of students under 21 years of age amounts to 9%–20% of the total number of residents, depending on the city (commune).
5.3. Results of Analysis
Price elasticity of demand differs depending on the time passed since price change. Therefore, the analyses have to differentiate between the short-, medium- and long-term effects. Most authors define ‘short-term’ as 1 or 2 years, ‘medium-term’ as 5–7 years, and ‘long-term’ as 12–15 years (sometimes even 20) [53]. Figures between periods may vary substantially [54]. It is, therefore, justifiable to conduct research during different periods since price change.
A review of the findings shows that the price elasticity of demand is strongly diversified [55,56]. For bus services it amounts from 0.4 in the short-term to 0.7 in the long-term [57]. Meta-analyses conducted by [58] show that the elasticity for vkm amounts to 1.05 in the short-term and 1.35 in the long-term.
At the initial stage of the analysis, the influence of factors other public transport services (measured in the volume of vehicle-kilometres) in a given period was eliminated. The reduction of influence of supply on demand was carried out in two cases (commune of Kolbudy and Pruszcz Gdański city) where the volume of vkm increased from 2017 to 2018 by 35% and 10%, respectively. In the remaining cases, the change in vkm was treated as an insignificant variable—the analyses of data gathered in previous years in the examined cities and communes did not point to a conclusive relationship between the change in vkm and number of passengers, where the vkm grew by less than 5% within the public transport network of a given commune.
In one case (Kolbudy commune), data obtained from research within the GBM allowed for an empirical elimination of the influence of the increase of vkm on demand since the research was conducted on a cross-section of particular operating lines. The data was reduced by demand generated by two newly established lines (the demand within this commune increased by 82.2% after establishing two new connections in connection with the opening of a new school). In the case of another commune (increase of vkm by 10%) an elasticity of 0.85 was assumed on the basis of data from previous research.
Table 2 presents the comparison of the results of the analysis into changes in demand within the examined cities. Reference [58] points out that the published analyses of price elasticity of demand in connection with public transport may be ‘partial’. Frequently there are rising doubts that only research with desired (or at least pointing in the desired direction) and significant findings are published. This article presents the results of analyses which are not always in accordance with the general models of price elasticity of demand. Instead of dismissing them, the authors decided to empirically explain them, pointing to the necessity of an individual approach to the examined issue and adding to the current knowledge of elasticity and effects of FFPT implementation.
The data presented in Table 2 points to the vastly diversified effects of new FFPT entitlements in the cross section of particular cities/communes. The following numbers of passengers were taken into account during the process of conducting analyses: overall number and number in two segments (analysed together) where demand shift took place—the segment of those entitled to reductions and free fares.
The demand in Kolbudy commune increased overall by 17.8%, and in the segment of passengers travelling on reduced and free fares only by 7.6%. Paradoxically, the extension of FFPT entitlement generated a larger demand among passengers who were required to travel on full price fares than in the segments of passengers which were analysed together and experienced demand shift (those travelling on reduced or free fares). This phenomenon can be explained if we take into account the particular circumstances in relation public transport in that commune. The opening of a new school (Zespół Szkół Metropolitalnych—Municipal School Complex) generated new demand also on lines which were not dedicated to the new school (note: demand for services of the two newly opened lines was removed from the analysis). The higher percentage growth of overall demand for public transport services in comparison with the reduced-free segment can be explained by the generated new source of movement demand (school) also on the lines which were already in operation (parents taking children to school on those routes, directly and with interchanges, as well as teachers and school employees travelling to their new workplace). The analysis points to the fact that despite the carried out reduction of the influence of public transport services supply increase within the Kolbudy commune, the force of influence of the new source of movement (school) on the pre-existing network prevents conclusive interpretation of price elasticity of demand in this commune.
The second commune named in Table 2 (Pruszcz Gd. commune) may be treated as a reference point for conclusions drawn from the analyses. The entitlement to free fares remained unchanged in this commune. Year on year (2018/2017) the volume of passengers decreased by 17%, 23.3% in the reduced-fare-free segment. In the previous two years, the demand in that commune also manifested a downward trend (in the years 2018/2017, 9% and 6%, respectively). Introduction of FFPT in neighbouring communes may have caused a faster drop in passenger volumes from which a group of passengers (students) began to travel on the lines where FFPT was accepted and which travelled via the Pruszcz Gdański commune area. This was confirmed indirectly in another research carried out within the GBM in the same commune in 2019 (the research was carried out by the Metropolitan Public Transport Association of Gdansk Bay (MZKZG), the results were forwarded to local authorities and public transport organisers). In conclusion, it cannot be clearly stated to what extent in Kolbudy commune the 17.8% increase in demand was generated by a new source of traffic and to what extent by free fare.
A total increase of 2.5% in the overall passenger volume was noted in the city of Pruszcz Gdański, and in the segment of reduced-fare-free the demand grew by 9.9%. The price elasticity of demand amounted to −0.045 and −0.099, respectively, making it considerably lower than in similar research carried out among British youth [59].
Sopot is the only city located within the core of the metropolis that was examined as part of the analysis. After the extension of fare-free entitlement, the overall passenger volume decreased by 1.4%, 2.2% of which was in the reduced-fare-free segment. In the same city the demand in the previous two years declined by 9.1% and 3.5%. This means that the extension of fare-free entitlements stopped the decline in the overall passenger volume; however, it did not manage to reverse it. Worse still, the passenger volume downward slide was not beaten within the segment of reduced-fare-free, namely, the main beneficiaries of FFPT implementation.
A similar scenario was seen in the rural commune of Żukowo. The overall number of passengers decreased annually by 11.3%, of which 12.4% was within the reduced-fare-free segment (main beneficiaries of the free fare), the consequence of which was positive elasticity. It should be added that following the extension of fare-free entitlement the overall passenger volume within the commune began to drop at a much faster rate than in the previous year (by 9.4%). The 6.4% increase in vkm introduced on one of the lines was unable to reverse that trend.
In the commune of Kosakowo, the overall number of passengers increased by 6.5%, of which 29% was within the reduced-fare-free segment. The situation of this particular commune is special as their authorities managed to negotiate the inclusion of free fare on the lines connecting Kosakowo with Gdynia (the second largest city within the metropolis). On the basis of this agreement students living in Kosakowo could travel for free to Gdynia and around Gdynia. This fact strongly influenced the increase in mobility of students living in Kosakowo also during travel which was not connected with education (past-time activities, recreation, cultural events, shopping). The increase of the overall volume of passengers is partly owing to a growing trend in passenger volumes that has been present in this commune for a number of years. On average, since 2014, the number of passengers has grown by 1.7%, which is also a result of the increase in population by 5% on average since that same year. The second factor of superior importance, which is reflected in data presented in Table 3, pointing to the overall increase in revenues from the sale of fares within the commune of Kosakowo, is the result of an increasing number of passengers which are required to purchase full price tickets. Owing to the fact that due to the lack of data it is impossible to calculate the influence of the abovementioned variables on demand, the data regarding the effect of FFPT implementation in the commune of Kosakowo should be treated with caution.
Rumia, the third city examined, noted an increase in the overall passenger volume of 3.9%, of which 6.9% was within the reduced-fare-free segment (main beneficiaries of FFPT introduction). Price elasticity of demand amounted to −0.070 and −0.069, respectively.
The final examined commune of Szemud noted an increase in demand of 0.5% and 0.9%, respectively, with elasticity of demand amounting to −0.010 and −0.009.
Table 3 presents the financial consequences connected with the extension of FFPT entitlement for the communes where, other than price, factors were not recognised as having significant influence on demand. The data points to the conclusion that the introduction of FFPT was connected with a decrease of 13%–27% in revenues from fare sales in four cities and communes.
Table 4 presents calculations comparing the change in demand following the extension of FFPT entitlements and a possible, achievable shift of that parameter, with an assumption that the increase in vkm would be covered by assets allocated for the entitlement extension (a relatively low indicator of supply elasticity of demand was adopted, evkm = 0.65, together with the average cost of vkm in a given commune).
The analysis of data presented in Table 4 shows conclusively that in all cases but one the assets designated for FFPT entitlements extension would provide a better result (understood as positive changes in the demand), should they be allocated for the purchase of additional vkm.
Moreover, marketing research is carried out every two years on the travel preferences and behaviour of the inhabitants in the area analysed. During the research, respondents are asked about the most important features of public transport for them. A recent study found that the most important for the inhabitants of the studied area is the frequency (17.7% of responses), punctuality (16.2% of responses) and directness (15.1% of responses) of public transport [60]. The cost of travel by public transport was indicated as significant when making transport decisions by 9.8% of the respondents. Therefore, these studies confirm that for the inhabitants of the metropolitan area, the quality of public transport is more important than the price of tickets. During the same research, the respondents indicated the most important reasons for using public transport, despite having a passenger car. These reasons included: difficulties in finding a free parking space, parking fees and road congestion. The main reasons why the residents travel by passenger cars were: greater comfort, shorter travel time by car and transportation of goods or purchases. This means that the FFPT concept does not meet the most important expectations regarding public transport. This statement is in line with [61]. The conclusion of this study is that the introduction of FFPT is not enough to produce a modal swift from private car to public transport.
6. Conclusions
The presented results and their analysis lead to the following conclusions:
- Implementation of FFPT within the GBM for the segment of students did not produce a satisfying result understood as an increase in demand. The increase in demand (should it occur at all) was lower than that noted in similar cases in other countries.
- The presented results prove the inefficiency of actions taken by the local authorities within the GBM. The main reasons behind the ineffectiveness or low effectiveness of actions taken can be identified as:
- 2.1
- The choice of target market segment. Students constitute a group of passengers that is unlikely to generate additional demand. Daily scope of travel within this segment is determined by education (fixed number of trips). Due to the age brackets of the group, the non-compulsory travel needs which may occur within it are largely met by travel in family cars where they also travel as passengers (this fact is grounded in findings of research into travel preferences and behaviour conducted within the cities and communes located with the GBM) [60,62,63].
- 2.2
- Lack of coordination of actions taken by local authorities regarding the age thresholds for the entitlement and their restriction to the area within the administrative borders of a given commune (this factor was primarily significant within the rural communes surrounding the metropolis where the number of potential travel destinations (past-time activities, recreation, shopping) is largely restricted).
- 2.3
- Identification of cost of travel as the key attribute in the decision-making process on whether to choose public transport, where it clearly shown in research into travel preferences and behaviours that this is a secondary factor. Travel cost was not found to be among the three main attributes in any of the research into transport preferences that took place in eight cities (communes) located with the GBM between the years 2010–2019 [60,62,63].
- A clearly positive demand reaction was achieved within regions where the implementation of FFPT was coupled with the broadening of public transport services offered (vkm volume). An exception to this rule could be seen in the communes where the demand for public transport services has been in rapid decline in recent years.
- Simulations point to the conclusion that, should funds equal to the amount lost from revenues (decrease in revenues due to FFPT implementation) be allocated to the broadening of services offered (increase in operational work), a much more satisfactory result would be achieved with regard to demand (increase in public transport passenger volume).
- One of the arguments supporting introduction of FFPT for students was to convince their parents to discontinue the car ‘school-run’. Research findings, however, cannot confirm that this goal was attained. Nevertheless, there is data available from research into transport preferences and behaviours conducted among the residents of the city of Sopot and the commune of Szemud which clearly shows that the cost of public transport (too high) was the main reason why parents choose to drive their children to school in only 3.0% of cases.
7. Discussion
The authors of this article have identified the following issues for further research and discussion:
- The presented data was collected over a short period of time (one year after the implementation of FFPT). The authors believe that should the current scope of FFPT entitlements remain unchanged, the chances for an increase in demand in the following years are slim. This results from the specificity of this segment and transport needs of students. A solution that may have a more positive influence on demand can be found in further extension of entitlements across the entire metropolis, as opposed to restricting them to within the administrative borders of the city/commune in which passengers reside. Research into this area shall be continued in the coming years.
- When adopting a selective implementation of FFPT (selected areas for selected segments), a demand profile has to be established, including in particular the price elasticity of target FFPT passengers. Some conclusions can be deemed as intuitive and do not require further detailed demand analyses. Practice shows that it is, however, permissible to ignore them in order to obtain ad hoc political benefits.
- FFPT introduction should be preceded by research into the perceived quality of public transport, and in particular the impact of certain attributes of services connected with the duration of travel (punctuality, frequency, direct travel, and accessibility), since a positive demand reaction can be anticipated should those attributes improve, as they are the ones with utmost importance to the residents and are not currently meeting their desired standards. The case of the city of Hasslet confirms this theory.
It is clear to all that mobility systems have been drastically affected by the COVID-19 pandemic. As a result of lockdowns, social distancing and hygiene requirements, demand for personal mobility has plummeted, while operational complexity has increased. At the same time, demand for e-commerce and home delivery has exploded. The epidemic restrictions introduced in public transport have meant that the passenger car has been perceived as a more reliable means of transport. The durability of transport behaviour changes is currently unknown. However, on the basis of the short period of the pandemic, certain regularities can be identified with regard to the analysed agglomeration market. COVID-19 is a phenomenon where the probability of its occurrence was known but not included in most strategies. Its specificity lies in the fact that it is not the result of market, political or technical and technological changes, which are officially included in setting the strategic goals of sustainable mobility. It is a factor which, as it is proven, will have a strong impact on the size and structure of transport needs and the supply of transport services.
According to the authors, during the first four months of its impact, the Coronavirus has already shown how serious the financial consequences for sustainable mobility systems can be. During the period of the greatest restrictions, the revenues from tickets in the Gdańsk agglomeration in some sub-markets decreased by as much as 80%–90%. Paradoxically, the pandemic was most negatively affected in local governments where public transport was characterised by the highest profitability rates (40%–50%). Research carried out in the Gdańsk agglomeration showed that small suburban communes that subsidised public transport by as much as 80%–90% before the pandemic not only did not suffer negatively financial consequences (at least in the short term), but in addition it was possible to reduce subsidies during the pandemic because of the reduced public transport offer. Inhabitants of those communes with the largest number of households with a car changed their transport behavior most quickly. In turn, in the cities of the agglomeration, the reduction in demand as a result of the restrictions resulted in a significant reduction in tickets revenues. Additionally, in order to maintain the expected transport capacity, additional courses were launched, which increased the costs of public transport and the need to increase subsidies. Cities authorities are currently analysing whether the entitlements introduced earlier and discussed in this article for free ride will be able to be maintained in the long term. The pandemic confirmed the thesis that free fare is not a universal tool for balancing mobility. Its choice should be selectively adjusted to the specificity of a given area, and above all, it should take into account the possibility of influencing changes in transport behavior in the long term, as well as taking into account the possibility of such phenomena as COVID-19.
Author Contributions
Conceptualization, K.G. and A.J.; methodology, K.G.; data collection, K.G. and A.J.; writing—original draft preparation, K.G. Section 1, Section 2, Section 4, Section 5, Section 6 and Section 7, A.J. Section 1, Section 3; writing—review and editing, K.G. and A.J.; supervision, K.G. All authors have read and agreed to the published version of the manuscript.
Funding
This research received no external funding.
Acknowledgments
We sincerely thank Metropolitan Public Transport Association of Gdansk Bay (MZKZG) and Public Transport Authority of Gdansk for providing the data.
Conflicts of Interest
The authors declare no conflict of interest.
References
- Holden, E.; Gilpin, G.; Banister, D. Sustainable mobility at thirty. Sustainability 2019, 11, 1965. [Google Scholar] [CrossRef] [Green Version]
- Black, W.R. Sustainable Transportation: Problems and Solutions; The Guilford Press: New York, NY, USA, 2010; ISBN 1606234854. [Google Scholar]
- Cervero, R. Transit pricing research—A review and synthesis. Transportation 1990, 17, 117–139. [Google Scholar] [CrossRef]
- Dincer, I. Renewable energy and sustainable development: A crucial review. Renew. Sustain. Energy Rev. 2000, 4, 157–175. [Google Scholar] [CrossRef]
- Hull, A. Policy integration: What will it take to achieve more sustainable transport solutions in cities? Transp. Policy 2008, 15, 94–103. [Google Scholar] [CrossRef]
- Stephenson, J.; Spector, S.; Hopkins, D.; McCarthy, A. Deep interventions for a sustainable transport future. Transp. Res. Part D Transp. Environ. 2018, 61, 356–372. [Google Scholar] [CrossRef]
- Goldman, T.; Gorham, R. Sustainable urban transport: Four innovative directions. Technol. Soc. 2006, 28, 261–273. [Google Scholar] [CrossRef]
- Holden, E.; Banister, D.; Gössling, S.; Gilpin, G.; Linnerud, K. Grand Narratives for sustainable mobility: A conceptual review. Energy Res. Soc. Sci. 2020, 65, 101454. [Google Scholar] [CrossRef]
- Studenmund, A.H.; Connor, D. The free-fare transit experiments. Transp. Res. Part A Gen. 1982, 16, 261–269. [Google Scholar] [CrossRef]
- Stiglitz, J.E. The Theory of Local Public Goods. In The Economics of Public Services; Palgrave Macmillan: London, UK, 1977. [Google Scholar]
- Cats, O.; Reimal, T.; Susilo, Y. Public Transport Pricing Policy—Empirical Evidence from a Fare-Free Scheme in Tallinn, Estonia. Transp. Res. Rec. 2014, 2415, 89–96. [Google Scholar] [CrossRef] [Green Version]
- Van Goeverden, C.; Rietveld, P.; Koelemeijer, J.; Peeters, P. Subsidies in public transport. Eur. Transp. Trasp. Eur. 2006, 32, 5–25. [Google Scholar]
- Tomanek, R. Free-fare public transport in the concept of sustainable urban mobility. Transp. Probl. 2017, 12, 95–105. [Google Scholar] [CrossRef] [Green Version]
- Gärling, T.; Schuitema, G. Travel demand management targeting reduced private car use: Effectiveness, public acceptability and political feasibility. J. Soc. Issues 2007, 63, 139–153. [Google Scholar] [CrossRef]
- Fearnley, N.; Flügel, S.; Killi, M.; Gregersen, F.A.; Wardman, M.; Caspersern, E.; Toner, J.P. Triggers of Urban Passenger Mode Shift - State of the Art and Model Evidence. Transp. Res. Procedia 2017, 26, 62–80. [Google Scholar] [CrossRef]
- ATCM. In-Town Parking: What Works? Innovative Practices in Parking Provision. Available online: https://thegreatbritishhighstreet.co.uk/pdf/GBHS-What-Works.pdf (accessed on 12 April 2020).
- De Witte, A.; Macharis, C.; Lannoy, P.; Polain, C.; Steenberghen, T.; Van de Walle, S. The impact of “free” public transport: The case of Brussels. Transp. Res. Part A Policy Pract. 2006, 40, 671–689. [Google Scholar] [CrossRef]
- De Witte, A.; Macharis, C.; Mairesse, O. How persuasive is “free” public transport? A survey among commuters in the Brussels Capital Region. Transp. Policy 2008, 15, 216–224. [Google Scholar] [CrossRef]
- Baum, H.J. Free Public Transport. J. Transp. Econ. Policy 1973, 7, 3–19. [Google Scholar]
- Kębłowski, W. Why (not) abolish fares? Exploring the global geography of fare-free public transport. Transportation 2019, 1–29. [Google Scholar] [CrossRef]
- Štraub, D. Riding without a ticket: Geography of free fare public transport policy in Poland. Urban Dev. Issues 2020, 64, 17–27. [Google Scholar] [CrossRef] [Green Version]
- Hebel, K.; Wołek, M.; Jagiełło, A. Trends in Free Fare Transport on the Urban Transport Service Market in Poland; Springer: Cham, Switzerland, 2019; Volume 844, ISBN 9783319994765. [Google Scholar]
- Rybus, G. Should Public Transport Be Free? More Cities Say, Why Not? Available online: https://www.nytimes.com/2020/01/14/us/free-public-transit.html (accessed on 2 April 2020).
- Wood, R. Public Transport in France: Can You Get by without a Car? Available online: https://www.completefrance.com/living-in-france/getting-by-in-france-without-a-car-1-6540261 (accessed on 12 April 2020).
- Prince, J.; Dellheim, J. Free Public Transit and Why We Don’t Pay for Ride Elevators, 1st ed.; Black Rose Books: Montreal, QC, Canada, 2018; ISBN 13 978-1551646572. [Google Scholar]
- Kębłowski, W. Fare-free public transport in Chengdu: Riding For Free in a Chinese Metropolis. In Free Public Transit: And Why We Don’t Pay to Ride Elevators; Jason, P., Dellheim, J., Eds.; Black Rose Books: Montreal, QC, Canada, 2018; pp. 215–221. [Google Scholar]
- Storchmann, K. Externalities by Automobiles and Fare-Free Transit in Germany—A Paradigm Shift? J. Public Transp. 2003, 6, 89–103. [Google Scholar] [CrossRef]
- Ison, S.; Rye, T. The Implementation and Effectiveness of Transport Demand Management Measures; Ison, S., Rye, T., Eds.; Ashgate Publishing Company: Dewsbury, UK, 2008; ISBN 9780754649533. [Google Scholar]
- Brie, M.; Candeias, M. Just Mobility Postfossil Conversion And Free Public Transport; Institute for Critical Social Analysis; Rosa Luxemburg Foundation: Luxemburg, 2012. [Google Scholar]
- Velder, S. The Largest Free Mass Transit Experiment in the World Rides. Available online: https://www.citylab.com/transportation/2014/01/largest-free-transit-experiment-world/8231/ (accessed on 12 August 2019).
- Fearnley, N. Free Fares Policies: Impact on Public Transport Mode Share and Other Transport Policy Goals. Int. J. Transp. 2013, 1, 75–90. [Google Scholar] [CrossRef] [Green Version]
- Litman, T. Transit Price Elasticities and Cross-Elasticities. J. Public Transp. 2004, 7, 37–58. [Google Scholar] [CrossRef] [Green Version]
- Hodge, D.C.; Orrell, J.; Strauss, T.R. Fare-Free Policy: Costs, Impacts on Transit Service and Attainment of Transit System Goals. Available online: https://trid.trb.org/view/387196 (accessed on 2 April 2020).
- Jørgensen, F.; Preston, J.M. The relationship between fare and travel distance—Some comments. J. Transp. Econ. Policy 2007, 41, 451–468. [Google Scholar]
- Jørgensen, F.; Preston, J. The relationship between fare elasticity and trip length—Some comments. Int. J. Transp. Econ. 2009, 36, 361–375. [Google Scholar]
- Wyszomirski, O. Analiza przesłanek celowości wprowadzenia bezpłatnej komunikacji miejskiej. Zesz. Nauk. Wydz. Ekon. Transp. Ekon. Transp. Lądowego 1979, 9, 123. [Google Scholar]
- Volinski, J. Implementation and Outcomes of Fare-Free Transit Systems; The National Academies Press: Washington, DC, USA, 2012. [Google Scholar]
- Cats, O.; Susilo, Y.O.; Reimal, T. The prospects of fare-free public transport: Evidence from Tallinn. Transportation 2017, 44, 1083–1104. [Google Scholar] [CrossRef] [Green Version]
- Shearlaw, M. The Tallinn experiment: What happens when a city makes public transport free? Available online: https://www.theguardian.com/cities/2016/oct/11/tallinn-experiment-estonia-public-transport-free-cities (accessed on 2 April 2020).
- Gabaldón-Estevan, D.; Kaufmann, C. Environmental innovation through transport policy: The implementation of the free fare policy on public transport in Tallinn, Estonia. At the XII Conference on Transport Engineering; 7-9 June; Valencia (Spain). Available online: http://ocs.editorial.upv.es/index.php/CIT/CIT2016/paper/viewFile/3532/1422 (accessed on 5 February 2020).
- Börjesson, M.; Hamilton, C.J.; Näsman, P.; Papaix, C. Factors driving public support for road congestion reduction policies: Congestion charging, free public transport and more roads in Stockholm, Helsinki and Lyon. Transp. Res. Part A Policy Pract. 2015, 78, 452–462. [Google Scholar] [CrossRef]
- John, T.; Berit, M. Breaking car use habits: The effectiveness of a free one-month travelcard. Transportation 2008, 35, 329–345. [Google Scholar]
- Hess, D.B. Transport in mikrorayons: Accessibility and proximity to centrally planned residential districts during the socialist era, 1957–1989. J. Plan. Hist. 2018, 17, 184–204. [Google Scholar] [CrossRef]
- Olsen, D. Fare-Free Public Transit Could Be Headed to a City Near You. Available online: https://www.alternet.org/2007/07/fare-free_public_transit_could_be_headed_to_a_city_near_you/ (accessed on 8 August 2019).
- Brand, R. Co-evolution of Technical and Social Change in Action: Hasselt’s Approach to Urban Mobility. Built Environ. 2008, 34, 182–199. [Google Scholar] [CrossRef]
- Canters, R. Hasselt Cancels Free Public Transport after 16 Years (Belgium). Available online: https://www.eltis.org/discover/news/hasselt-cancels-free-public-transport-after-16-years-belgium-0 (accessed on 15 September 2019).
- Carey, C. What Benefits Can Cities Expect from Fare-Free Transport? Available online: https://cities-today.com/what-benefits-can-cities-expect-from-fare-free-transport/ (accessed on 2 April 2020).
- Wrana, W. Bezpłatna Komunikacja W Żorach Cieszy Się Popularnością (Free Public Transport in Żory Is Widely Used). Available online: https://www.forbes.pl/csr/bezplatna-komunikacja-w-zorach-cieszy-sie-popularnoscia/eh2fz1v (accessed on 1 October 2019).
- Wrana, W. Bezpłatna Komunikacja W Żorach W Kryzysie (Free Public Transit in Żory in Crisis). Available online: https://www.tuzory.pl/wiadomosci,bezplatna-komunikacja-w-zorach-w-kryzysie-miasto-prosi-o-pomoc-pkm,wia5-3266-16824.html (accessed on 10 January 2020).
- Local Data Bank—Central Statistical Office of Poland. Available online: https://www.bdl.stat.gov.pl (accessed on 5 February 2020).
- Act of December 16, 2010 on Public Collective Transport (Journal of Laws of 2011, No. 5, item 13). Available online: https://isap.sejm.gov.pl/isap.nsf/DocDetails.xsp?id=WDU20110050013 (accessed on 20 January 2020).
- Radni Miasta Gdańska Przegłosowali: Od 1 Lipca Darmowe Przejazdy Komunikacją Miejską Dla Dzieci I Młodzieży. Available online: https://www.gdansk.pl/wiadomosci/miasto-wprowadza-darmowa-komunikacje-miejska-dla-dzieci-i-mlodziezy-od-1-lipca,a,101911 (accessed on 10 January 2020).
- Polat, C. The Demand Determinants for Urban Public Transport Services: A Review of the Literature. J. Appl. Sci. 2012, 12, 1211–1231. [Google Scholar] [CrossRef]
- Litman, T. Valuing Transit Service Quality Improvements. J. Public Transp. 2008, 11, 43–64. [Google Scholar] [CrossRef] [Green Version]
- Litman, T. Transport Elasticities: Impacts on Travel Behaviour Understanding Transport Demand to Support Sustainable Travel Behaviour Sustainable Urban Transport Technical Document # 11. Available online: https://www.sutp.org/publications/transport-elasticities-impacts-on-travel-behaviour/ (accessed on 5 February 2020).
- Bresson, G.; Dargay, J.; Madre, J.L.; Pirotte, A. Economic and structural determinants of the demand for public transport: An analysis on a panel of French urban areas using shrinkage estimators. Transp. Res. Part A Policy Pract. 2004, 38, 269–285. [Google Scholar] [CrossRef]
- Paulley, N.; Balcombe, R.; Mackett, R.; Titheridge, H.; Preston, J.; Wardman, M.; Shires, J.; White, P. The demand for public transport: The effects of fares, quality of service, income and car ownership. Transp. Policy 2006, 13, 1–22. [Google Scholar] [CrossRef] [Green Version]
- Holmgren, J. Meta-analysis of public transport demand. Transp. Res. Part A Policy Pract. 2007, 41, 1021–1035. [Google Scholar] [CrossRef] [Green Version]
- Cobb, K.; Burnett, G.; Lehman, C. Youth Concessions Research; Price Elasticity of Bus Travel Demand. Available online: https://assets.publishing.service.gov.uk/government/uploads/system/uploads/attachment_data/file/669090/youth-travel-concessions-price-elasticity.pdf (accessed on 5 February 2020).
- Preferencje i zachowania komunikacyjne mieszkańców Gdyni w 2018 r. (Preferences and Transport Behavior of Residents of Gdynia 2018). Available online: https://zkmgdynia.pl/files/Pliki%20do%20pobrania%20-%20inne/Preferencje%20i%20zachowania%20komunikacyjne%20mieszka%C5%84c%C3%B3w%20Gdyni%202018.pdf (accessed on 5 February 2020).
- Gabaldón-Estevan, D.; Orru, K.; Kaufmann, C.; Orru, H. Broader impacts of the fare-free public transportation system in Tallinn. Int. J. Urban Sustain. Dev. 2019, 11, 332–345. [Google Scholar] [CrossRef]
- Preferencje i zachowania komunikacyjne mieszkańców Gdyni. Raport z badań marketingowych 2015 (Preferences and Transport Behavior of Residents of Gdynia 2015). Available online: https://zkmgdynia.pl/files/Pliki%20do%20pobrania%20-%20inne/A4_zkmgdynia-PZKMG-raport%202015.pdf (accessed on 5 February 2020).
- Gdansk Development Office. Gdańskie Badania Ruchu 2016 wraz z opracowaniem modelu symulacyjnego Gdańska. Available online: https://www.gdansk.pl/urzad-miejski/wiadomosci/wyniki-gdanskiego-badania-ruchu-2016,a,65107 (accessed on 5 February 2020).
Figure 1.
Potential benefits of fare-free public transport (FFPT). (source: based on [22,28,29,30,31]).

Figure 2.
Metropolis of Gdansk Bay.


Table 1.
Profile of the analysed cities and communes of Gdansk Bay Metropolis (GBM).
| Name | Type | Location within the GBM | Population | Number of Students under 20 Years of Age | Annual vkm (2019) | Annual vkm (2018) |
|---|---|---|---|---|---|---|
| Kolbudy | Commune | Surroundings | 17,417 | 3122 | 149,542 | 111,042 |
| Pruszcz Gdańsk Gm.* | Commune | Surroundings | 30,878 | 5128 | 25,245 | 25,245 |
| Pruszcz Gdański | City | Surroundings | 30,232 | 4752 | 596,031 | 541,600 |
| Sopot | City | Core | 36,046 | 3380 | 1,130,734 | 1,113,263 |
| Żukowo | Commune | Surroundings | 39,051 | 7434 | 419,317 | 398,774 |
| Kosakowo | Commune | Surroundings | 14,850 | 2633 | 607,036 | 598,272 |
| Rumia | City | Surroundings | 49,031 | 7031 | 1,027,460 | 1,027,173 |
| Szemud | Commune | Surroundings | 17,816 | 3577 | 157,228 | 156,949 |
* fare-free entitlement unchanged. (source: population and number of students under 20 years of age adapted from [50]).
Table 2.
Changes in demand after extension of FFPT entitlement to students between 5 and 20 years of age.
Table 2.
Changes in demand after extension of FFPT entitlement to students between 5 and 20 years of age.
| City/Commune | Location within the GBM | Change in Passenger Volume in General [%] | Change in Passenger Volume in the Reduced-Fare-Free Segment [%] | Price Elasticity of Demand | Price Elasticity of Demand in the Reduced-Fare-Free Segment [%] |
|---|---|---|---|---|---|
| Kolbudy commune | Surroundings | 17.8 | 7.6 | −0.330 | −0.076 |
| Pruszcz * Gd. commune | Surroundings | −17.0 | −23.2 | - | - |
| Pruszcz Gd. | Surroundings | 2.5 | 9.9 | −0.045 | −0.099 |
| Sopot | Core | −1.4 | −2.2 | 0.030 | 0.022 |
| Żukowo commune | Surroundings | −11.3 | −12.4 | 0.200 | 0.124 |
| Kosakowo commune | Surroundings | 6.5 | 29.0 | −0.120 | −0.290 |
| Rumia | Surroundings | 3.9 | 6.9 | −0.070 | −0.069 |
| Szemud commune | Surroundings | 0.5 | 0.9 | −0.010 | −0.009 |
* commune with fare-free entitlement unchanged.
Table 3.
Annual financial consequences of fare-free entitlement extension for the examined cities/communes.
Table 3.
Annual financial consequences of fare-free entitlement extension for the examined cities/communes.
| City/Commune | Shift in Revenues from Fare Sales Overall [%] | Shift in Revenues from Reduced Fare Sales [%] | Sum of Decreased Revenues from Ticket Sales Overall [PLN] * |
|---|---|---|---|
| Pruszcz Gd. city | −27.4 | −56.9 | −415,209 (97,220 EUR **) |
| Sopot | −15.1 | −22.9 | −542,833 (127,103 EUR **) |
| Żukowo commune | −12.9 | −27.5 | −109,981 (25,751 EUR **) |
| Rumia | −20.7 | −24.2 | −898,364 (210,351 EUR **) |
| Szemud commune | 0.0 | 0.3 | 6 (1.4 EUR **) |
* Polish Złoty. ** Exchange rate PLN/EUR as of 11.11.2019.
Table 4.
Comparison of changes in demand after the extension of FFPT entitlements as well as the forecasted shift of demand assuming the purchase of additional vkm which would reflect the lost revenues.
Table 4.
Comparison of changes in demand after the extension of FFPT entitlements as well as the forecasted shift of demand assuming the purchase of additional vkm which would reflect the lost revenues.
| City/Commune | Change in the Overall Passenger Volume Following ff Introduction [%] | Forecasted Shift of the Overall Passenger Volume Assuming the Purchase of vkm Using the Funds Allocated for the Extension of Entitlements [%] |
|---|---|---|
| Pruszcz Gd. city | 2.5 | 7.0 |
| Sopot | −1.4 | 4.1 |
| Żukowo commune | −11.3 | 2.6 |
| Rumia | 3.9 | 7.3 |
| Szemud commune | 0.5 | 0 |
© 2020 by the authors. Licensee MDPI, Basel, Switzerland. This article is an open access article distributed under the terms and conditions of the Creative Commons Attribution (CC BY) license (http://creativecommons.org/licenses/by/4.0/).
Share and Cite
MDPI and ACS Style
Grzelec, K.; Jagiełło, A. The Effects of the Selective Enlargement of Fare-Free Public Transport. Sustainability 2020, 12, 6390. https://doi.org/10.3390/su12166390
AMA Style
Grzelec K, Jagiełło A. The Effects of the Selective Enlargement of Fare-Free Public Transport. Sustainability. 2020; 12(16):6390. https://doi.org/10.3390/su12166390
Chicago/Turabian StyleGrzelec, Krzysztof, and Aleksander Jagiełło. 2020. "The Effects of the Selective Enlargement of Fare-Free Public Transport" Sustainability 12, no. 16: 6390. https://doi.org/10.3390/su12166390
Note that from the first issue of 2016, this journal uses article numbers instead of page numbers. See further details here.