Article

Examining Fractional Vegetation Cover Dynamics in Response to Climate from 1982 to 2015 in the Amur River Basin for SDG 13

1
College of Earth Sciences, Jilin University, Changchun 130012, China
2
Key Laboratory of Wetland Ecology and Environment, Northeast Institute of Geography and Agroecology, Chinese Academy of Sciences, Changchun 130102, China
3
National Earth System Science Data Center, Beijing 100101, China
*
Author to whom correspondence should be addressed.
Sustainability 2020, 12(14), 5866; https://doi.org/10.3390/su12145866
Submission received: 1 July 2020 / Revised: 16 July 2020 / Accepted: 19 July 2020 / Published: 21 July 2020
(This article belongs to the Section Air, Climate Change and Sustainability)

Abstract

:
The impacts of climate and the need to improve resilience to current and possible future climate are highlighted in the UN’s Sustainable Development Goal (SDG) 13. Vegetation in the Amur River Basin (ARB), lying in the middle and high latitudes and being one of the 10 largest basins worldwide, plays an important role in the regional carbon cycle but is vulnerable to climate change. Based on GIMMS NDVI3g and CRU TS4.01 climate data, this study investigated the spatiotemporal patterns of fractional vegetation cover (FVC) in the ARB and their relationships with climatic changes from 1982 to 2015 varying over different seasons, vegetation types, geographical gradients, and countries. The results reveal that the FVC presented significant increasing trends (P < 0.05) in growing season (May to September) and autumn (September to October), but insignificant increasing trends in spring (April to May) and summer (June to August), with the largest annual FVC increase occurring in autumn. However, some areas showed significant decreases of FVC in growing season, mainly located on the China side of the ARB, such as the Changbai mountainous area, the Sanjiang plain, and the Lesser Khingan mountainous area. The FVC changes and their relationships varied among different vegetation types in various seasons. Specifically, grassland FVC experienced the largest increase in growing season, spring, and summer, while woodland FVC changed more dramatically in autumn. FVC correlated positively with air temperature in spring, especially for grassland, and correlated negatively with precipitation, especially for woodland. The correlations between FVC and climatic factors in growing season were zonal in latitude and longitude, while 120° E and 50° N were the approximate boundaries at which the values of mean correlation coefficients changed from positive to negative, respectively. These findings are beneficial to a better understanding the responses of vegetation in the middle and high latitudes to climate change and could provide fundamental information for sustainable ecosystem management in the ARB and the northern hemisphere.

1. Introduction

Climate change is an urgent challenge that humans must face, and it has direct and indirect influences on terrestrial ecosystems. Thus, the Sustainable Development Goals (SDGs) concern ‘urgent action to combat climate change and its impacts’ (SDG 13). Due to biophysical responses of plant photosynthesis and respiration, vegetation dynamics are a sensitive indicator that reacts to changes of climate [1,2]. Meanwhile, vegetation changes have feedback to climate, such as surface temperature and rainfall [3,4,5]. Therefore, understanding vegetation changes and their relationships with climatic changes will support the implementation of SDGs in navigating towards realizing ecosystem sustainability.
Multiple remotely sensed indicators can characterize the vegetation dynamic and its response to climate change in large scales for a long time series. Based on the normalized difference vegetation index (NDVI), de Jong et al. [6] found that global greening showed a slowing down trend from 1982 to 2008, and greening trend was stronger in the northern hemisphere. Regions with obvious vegetation change were identified at the middle and high latitudes in the northern hemisphere and were seriously influenced by temperature and precipitation [7]. By applying the net primary production (NPP), Piao et al. observed that the vegetation changes varying over different vegetation types in the Qinghai-Xizang Plateau from 1982 to 1999 and alpine meadows experienced the most obvious change [8]. Using the leaf area index (LAI), Chen et al. indicated that the vegetation activities enhanced in the 74.2% of the global land surface from 1981 to 2016, with combined effects of various drivers, such as CO2, climate [9]. Fractional vegetation cover (FVC) can represent the density of vegetation and the area of photosynthesis of plants and characterize the quality and change of terrestrial vegetation. Therefore, FVC plays an important role in presenting the change of ecosystem and environment [10], and documenting vegetation response to climatic changes. In addition, FVC calculated from NDVI can solve the problem of NDVI reaching saturation in dense vegetation canopies and effectively extend the range of the remote sensing data source to the surface information [11,12]. FVC is a promising indicator to explore vegetation changes in response to climate changes on a broad scale.
The Amur River Basin (ARB) is one of the 10 largest basins worldwide, with an area of approximately 2.1 million km2. The ARB also transits from the middle to high latitudes in the northern hemisphere where vegetation is sensitive to climate change [2]. Therefore, examining relationships of vegetation dynamics with climatic changes in the ARB and analyzing the heterogeneity of relationships are critical to sustainable ecosystem management. However, studies focusing on the vegetation changes and their relationships were scarce, and this limited the understanding regional ecosystem management for sustainability. Only Chu et al. [13] investigated the NDVI variations in response to climatic changes for the entire ARB, considering different vegetation types and seasons. Nevertheless, the study lacks the treatment of NDVI saturation and details on the heterogeneity of relationships between vegetation and climatic changes varied among geographic gradients and countries in the ARB. Thus, exploration of the response of FVC dynamics in the ARB to climatic changes, considering different seasons, vegetation types, geographic gradients, and countries, is beneficial to better understanding vegetation responses in the ARB in the context of the SDGs.
In this study, we examined the response of FVC dynamics from 1982 to 2015 to climatic changes in the ARB. Specifically, the objectives were to (1) document the spatiotemporal changes of FVC, mean annual temperature, and precipitation in different seasons during 1982-2015, (2) identify the relationships of FVC with climatic factors, and (3) explore the heterogeneity of the relationships varied among different seasons, vegetation types, geographic gradients, and countries in the ARB.

2. Materials and Methods
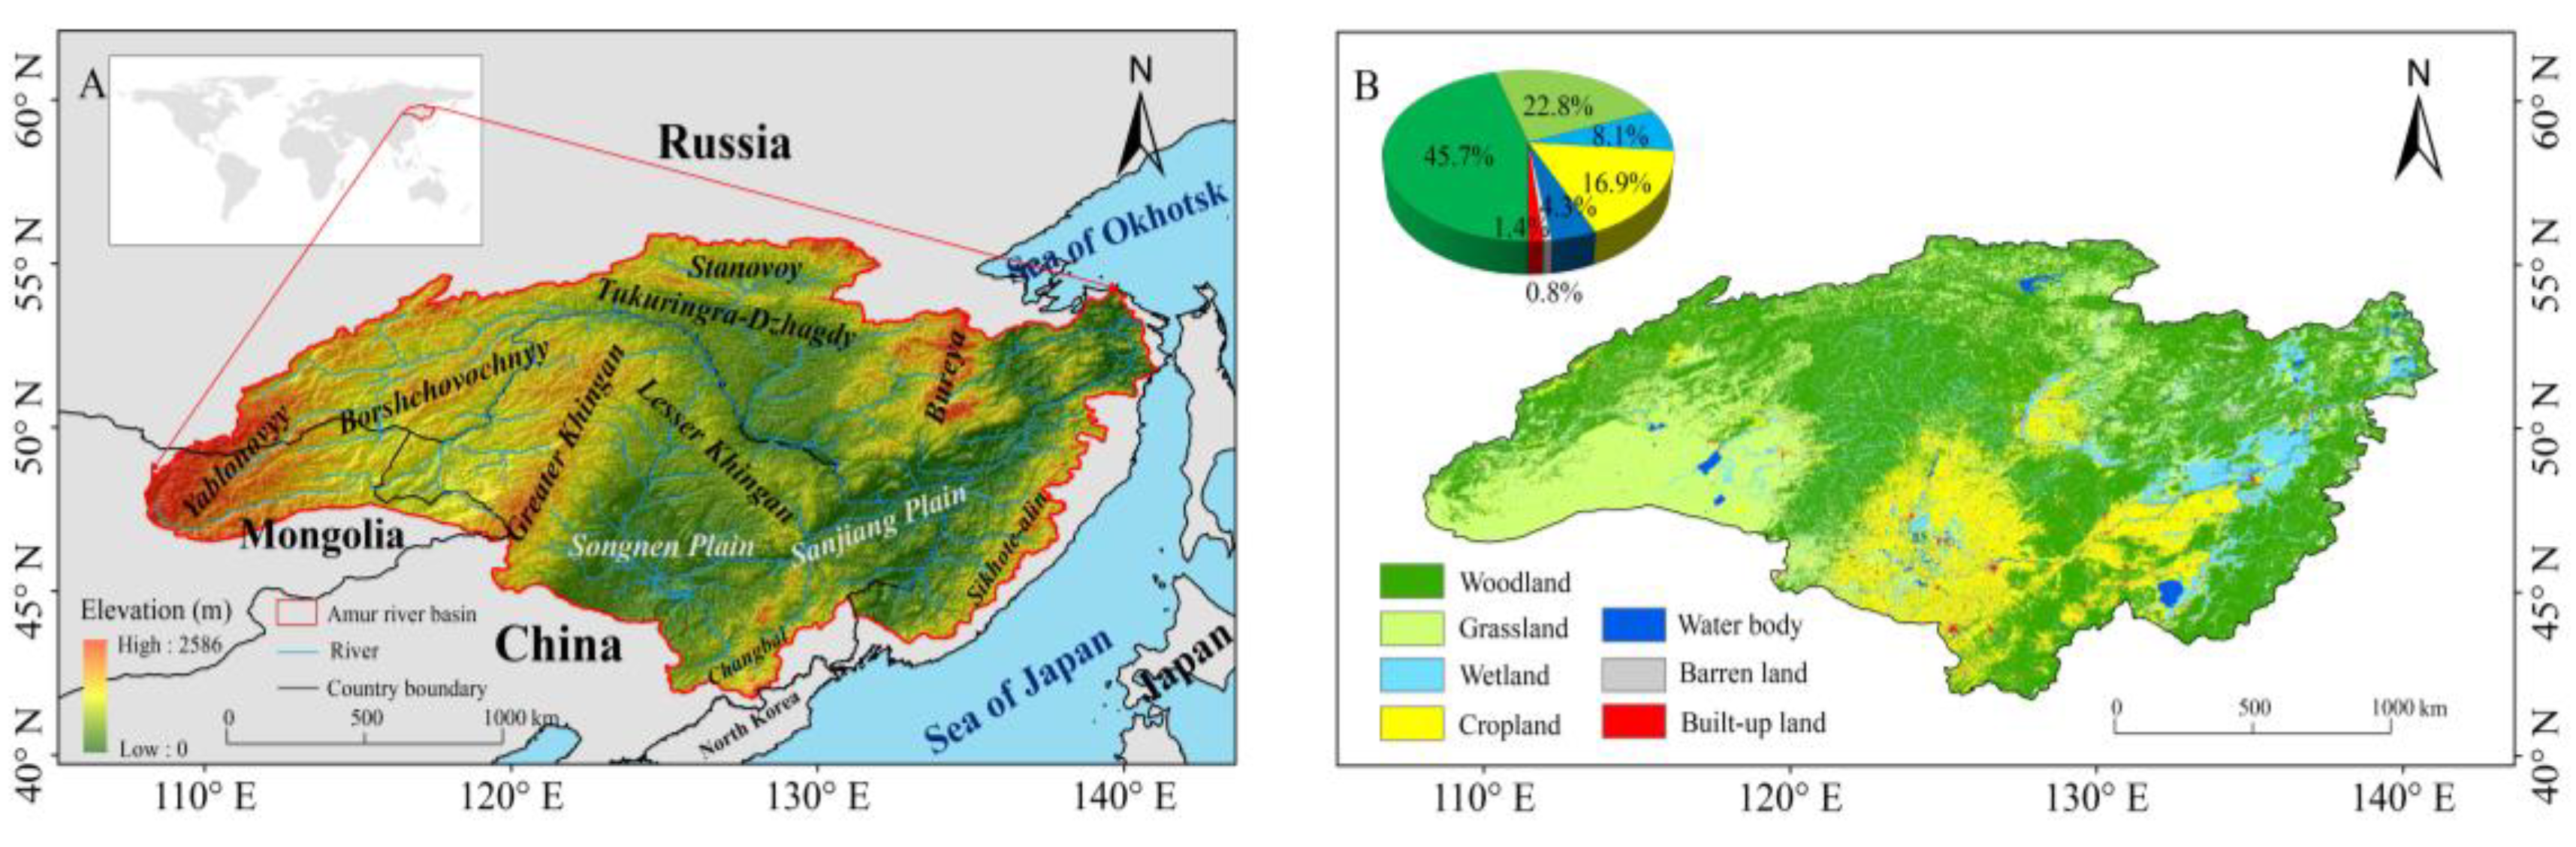
2.1. Study Area

The ARB extends from 107°31′ E to 141°14′ E and from 41°42′ N to 55°56′ N. The elevations of the ARB have obvious spatial variations, while the higher values are in the west and the lower values in the east (Figure 1A). The ARB is a transboundary region that is composed of the Russian far east (50% of the total ARB area), the northeast of China (41%), and the northeast of Mongolia (9%). There are obvious differences in vegetation types, social and economic development, and population distributions in the ARB. The main topographic types of this region are mountains and plains. The ARB has a high vegetation coverage, including woodland, grassland, cropland, and wetland (Figure 1B). Woodland dominated by coniferous forest, broadleaved forest, and mixed forest occupied 45.7% of the basin and was mainly observed in the northern and eastern ARB. Grassland covering 22.8% of the ARB was found primarily in western ARB. China’s northeastern plains are the major cropland distribution areas where corn, rice, and soybean are the dominant crop types. Moreover, wetland dominated with marsh, 8.1% of the ARB, plays an important role in regional carbon cycle and biodiversity conservation [14]. The temperate humid monsoon has wide influence on the eastern ARB in summer, but the monsoon from Siberia makes the ARB cold and dry in winter [13].

2.2. Data Source

The GIMMS NDVI 3g dataset was used in the present study, which can be freely downloaded from NASA (https://ecocast.arc.nasa.gov/data/pub/gimms/3g.v1). This dataset has a spatial resolution of 8 km and 15-day intervals from 1982 to 2015 and has been widely utilized in research on monitoring vegetation dynamics responding to climatic changes [15,16,17,18]. To reduce the interference of water vapor in the atmosphere and enhance the accuracy of this NDVI dataset, we obtained the monthly NDVI dataset from 1982 to 2015 using the Maximum Value Composite (MVC) method [19,20].
We selected two climatic factors (air temperature and precipitation) that have been regarded as the important drivers for vegetation changes. In this study, the Climatic Research Unit Time Series 4.01 (CRU TS4.01, available at http://date.ceada.ac.uk/badc/cru/data/) meteorological dataset with a spatial resolution of 0.5° was applied to obtain the monthly air temperature (TMP) and monthly precipitation (PRE) datasets from 1982 to 2015 for the ARB. The CRU dataset was produced by the Climate Research Unit, University of East Anglia, and has been used in a number of studies on climate change or vegetation growth [13,21,22]. The spatial resolution of temperature and precipitation data was resampled to 8 km using the nearest neighbor method when we explored the effects of climatic factors on FVC.
The land cover data were classified from Landsat data provided by the United States Geological Survey (USGS, http://glovis.usgs.gov/). In this study, we focused mainly on four vegetation types (Figure 1B): woodland (WO), grassland (GR), wetland (WE), and cropland (CR). We extracted areas with unchanged vegetation types from 1982 to 2015 in the ARB when we analyzed the trend of FVC and examined their relationships with climatic factors. The land cover data were also resampled to 8 km to match the spatial resolution of the NDVI dataset in ArcGIS 10.3 software.
The future air temperature and precipitation data produced by the CNRM-ESM2-1 model were used in this study to predict the trend of FVC changes in future under the influence of the climatic changes from 2016 to 2050 (available at https://esgf-node.llnl.gov/search/cmip6/). The CNRM-ESM2-1 model participated the 6th Phase of the Coupled Model Intercomparison Project (CMIP6), and its outputs were widely used in researches on future climate–vegetation interaction [23,24]. Moreover, some researchers found the outputs’ temporal behavior for Earth System Models (ESMs, including CNRM-ESM2-1) in CMIP6 was consistent with MODIS data [25]. In CMIP6, there are five main scenarios, and the sustainability scenario (SSP1) is the only scenario that can produce the future climatic data to support the policy goal that keeps global warming within 2 °C by 2100 [26]. Therefore, we exhibited the trends of mean annual air temperature and mean annual precipitation for growing season from 2016 to 2050 in the ARB in Figure 8, based on CNRM-ESM2-1 model and the sustainability scenario.

2.3. Methods

2.3.1. Pixel Dichotomy Model

The pixel dichotomy model, widely used for calculating FVC from the NDVI [20,27], was chosen for this study. In this model, each image pixel was regarded as a mixed pixel composed of two parts (vegetation and soil), so FVC can be obtained as:
F V C = N D V I N D V I s o i l N D V I v e g N D V I s o i l
where N D V I represents all information of the mixed pixel, N D V I v e g represents vegetation contribution information, and N D V I s o i l represents the soil contribution information.
Determining the value of N D V I v e g and N D V I s o i l is the key to obtaining accurate FVC. The values of N D V I v e g and N D V I s o i l should theoretically be 1 and close to 0, respectively. Previous studies confirmed that N D V I v e g and N D V I s o i l cannot be defined as the fixed value, as they changed with time and space for the influence of meteorological and vegetation type [28]. In this study, an approximate substitution method was applied to determine the values of N D V I v e g and N D V I s o i l [27]. Specifically, we obtained the NDVI values in remote sensing images and constructed the NDVI cumulative frequency table from 1982 to 2015. Then, the N D V I v e g was represented by the mean 0.5% highest N D V I value and the N D V I s o i l was represented by the mean 0.5% lowest N D V I value. Lastly, we obtained the monthly FVC dataset from 1982 to 2015 and calculated the mean annual FVC for growing season and different seasons in the ARB.

2.3.2. Linear Regression Analysis

In this study, we applied a simple linear regression analysis method based on ordinary least squares (OLS) [22,29] to detect the trend of mean annual FVC, temperature, and precipitation for growing season and the different seasons at the basin or pixel scale from 1982 to 2015. The expression of the slope is:
S l o p e = n × i = 1 n i × P i i = 1 n i i = 1 n P i n × i = 1 n i 2 ( i = 1 n i ) 2
where P i is the value of parameter (FVC or climatic factors) in the year i , and n represents the number of years. If the S l o p e > 0, it means the parameter exhibits an upward trend. Otherwise, if the S l o p e < 0, it means the parameter exhibits a downward trend. In addition, the T-test method was applied to indicate whether the trend of the parameter was significant at the basin or pixel scale. However, it should be noted that the results of T-test only represent the confidence level of the parameter’s trend and are not related to the trend’s velocity [30].

2.3.3. Correlation Analysis

Based on the method of Pearson correlation analysis [31], the correlation coefficients between the mean annual FVC and mean precipitation or mean temperature from 1982 to 2015 for growing season and the different seasons were calculated to present their relationships at basin or pixel scales. The equation is as follows:
R A B = i = 1 n ( A i A ¯ ) ( B i B ¯ ) i = 1 n ( A i A ¯ ) 2 i = 1 n ( B i B ¯ ) 2
where n is the number of years, A i represents the value of variable A in the year i , and B i represents the value of variable B in the year i . A ¯ and B ¯ represent means of the two respective variables. R A B represents the correlation coefficient between A and B ranging from −1 to 1. If the R A B > 0, it indicates variables A and B have a positive correlation. On the contrary, if the R A B < 0, it indicates variables A and B have a negative correlation. In addition, if the absolute value of R A B is closer to 1, the correlation between variable A and variable B is stronger.

2.3.4. Data Analysis

To present seasonal changes of FVC, we defined the growing season as May to September, spring from April to May, summer from June to August, and autumn from September to October [32]. We conducted three contrastive analyses to further explore the spatial heterogeneity vegetation dynamics in the ARB in response to climate change for different vegetation types (woodland, grassland, wetland, and cropland), different nations (China, Russia, and Mongolia), and different longitudinal and latitudinal zones (with 1° gradients).

3. Results

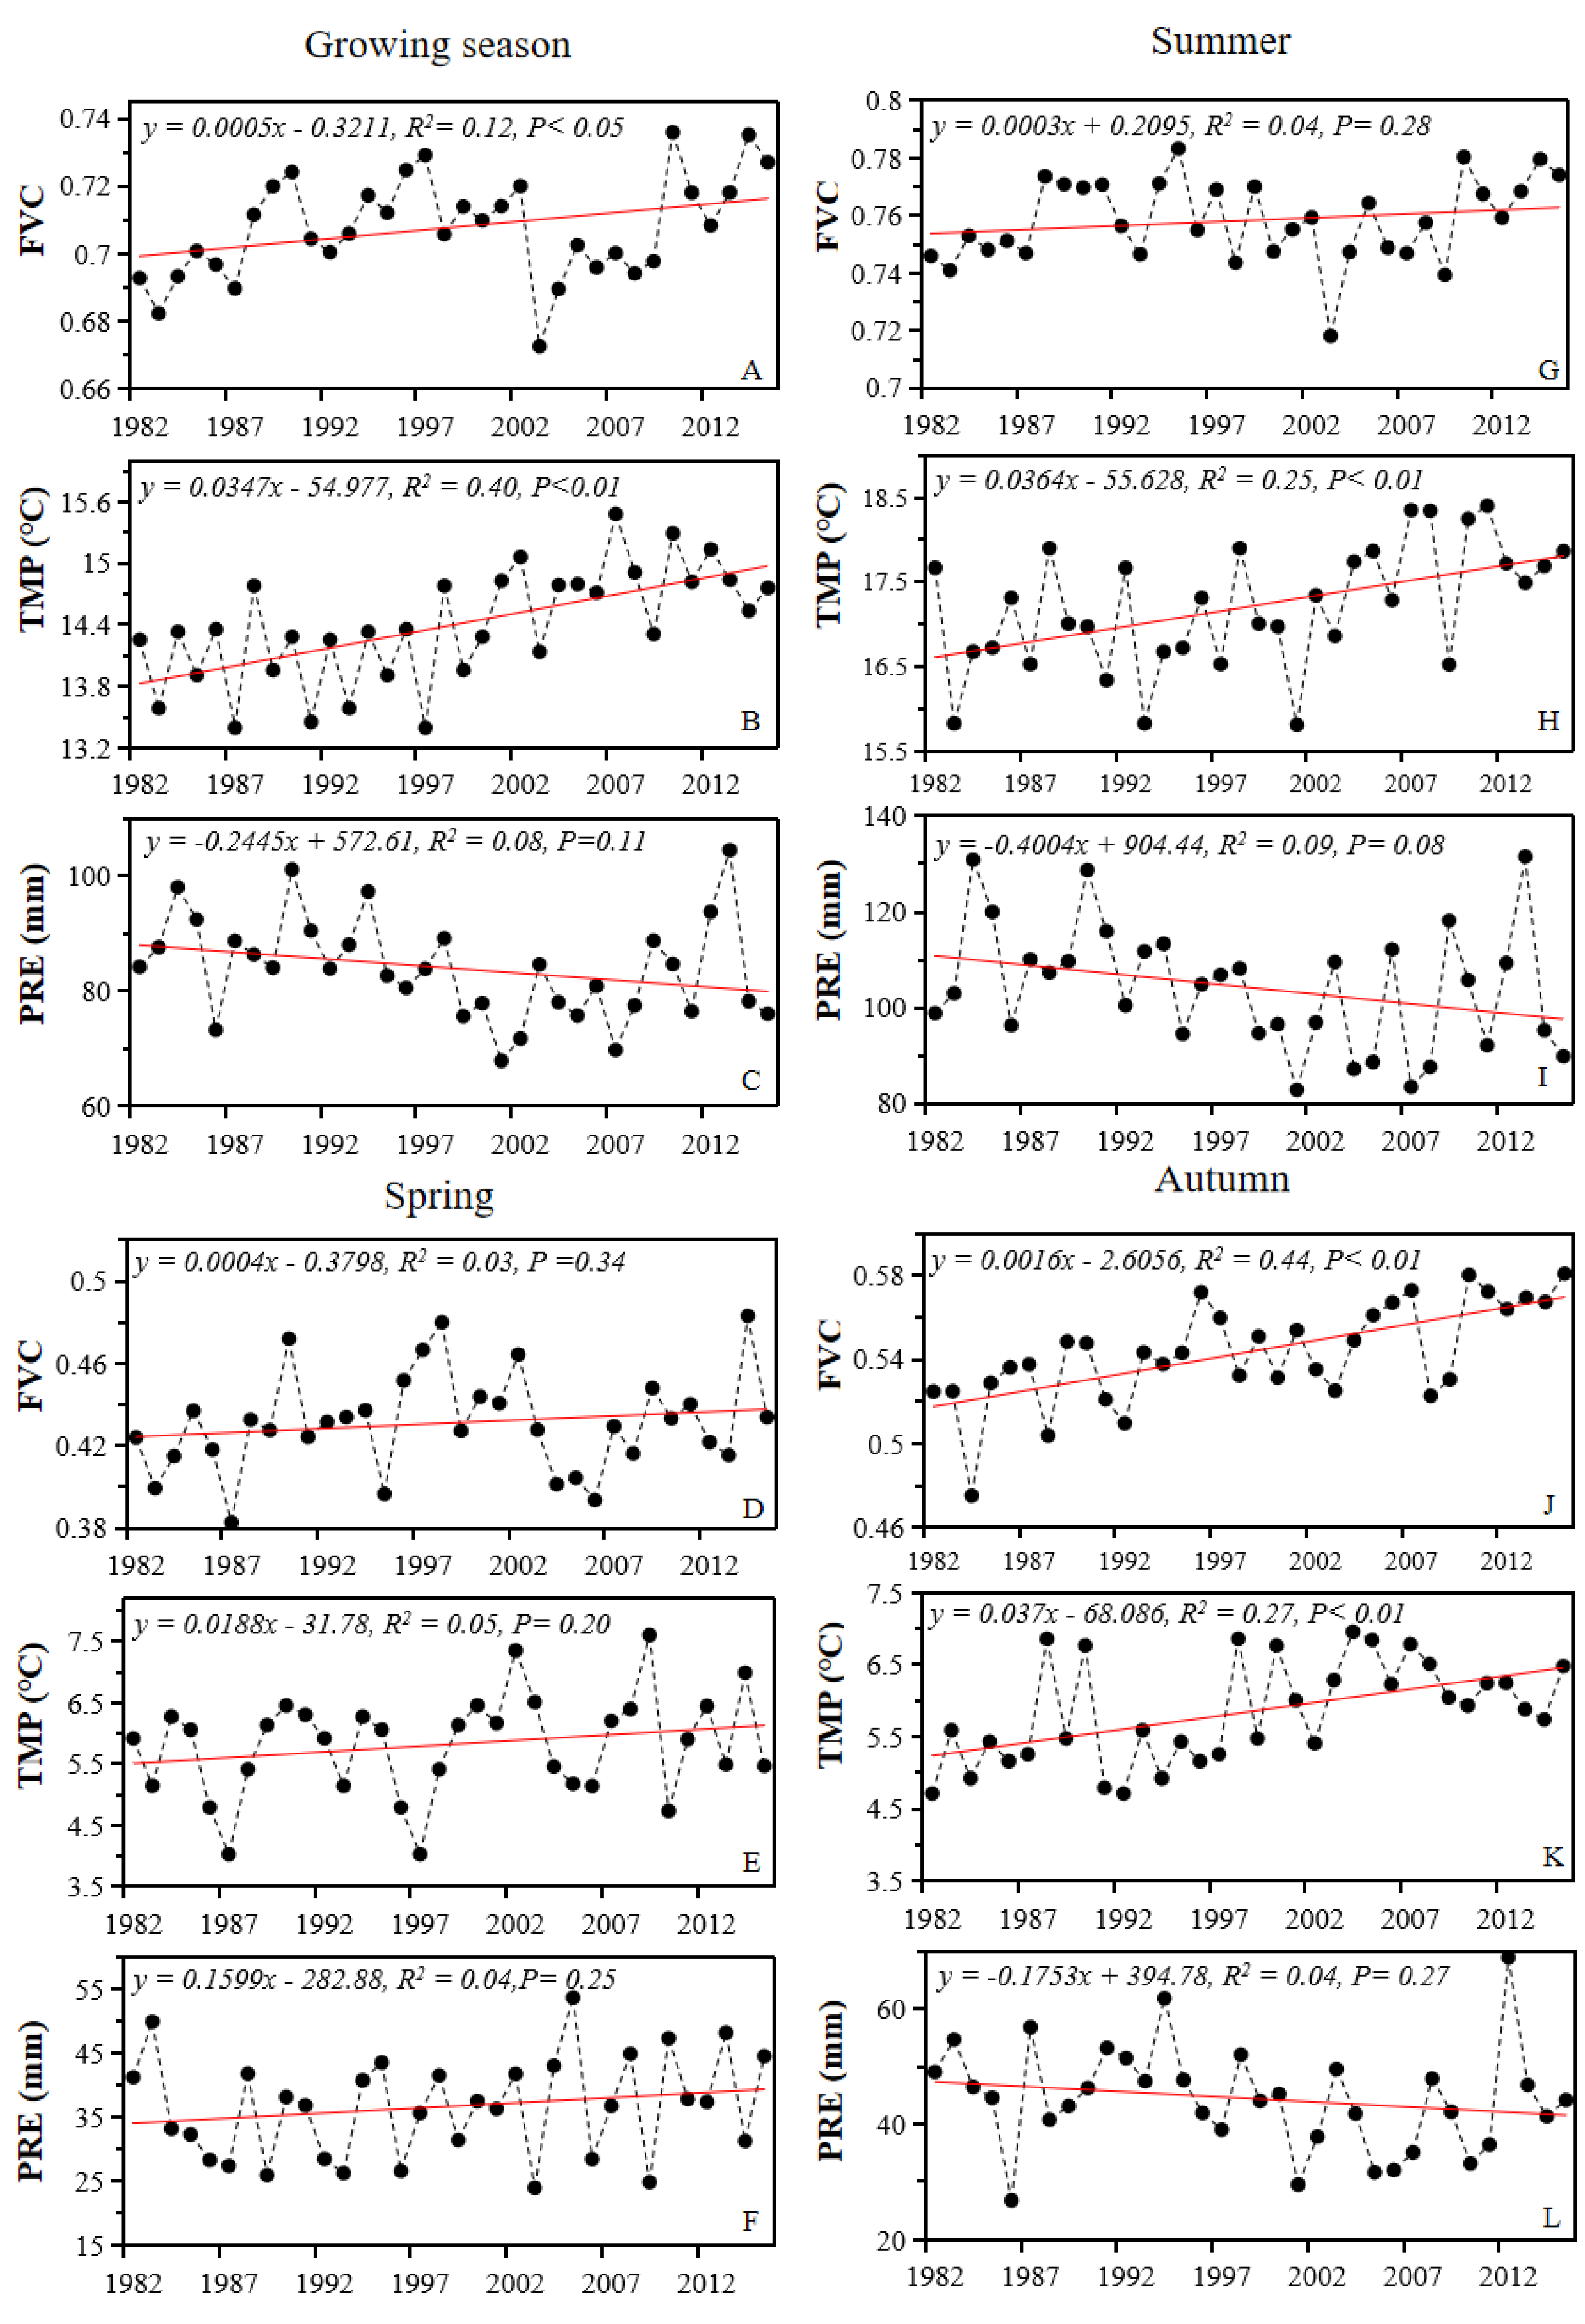
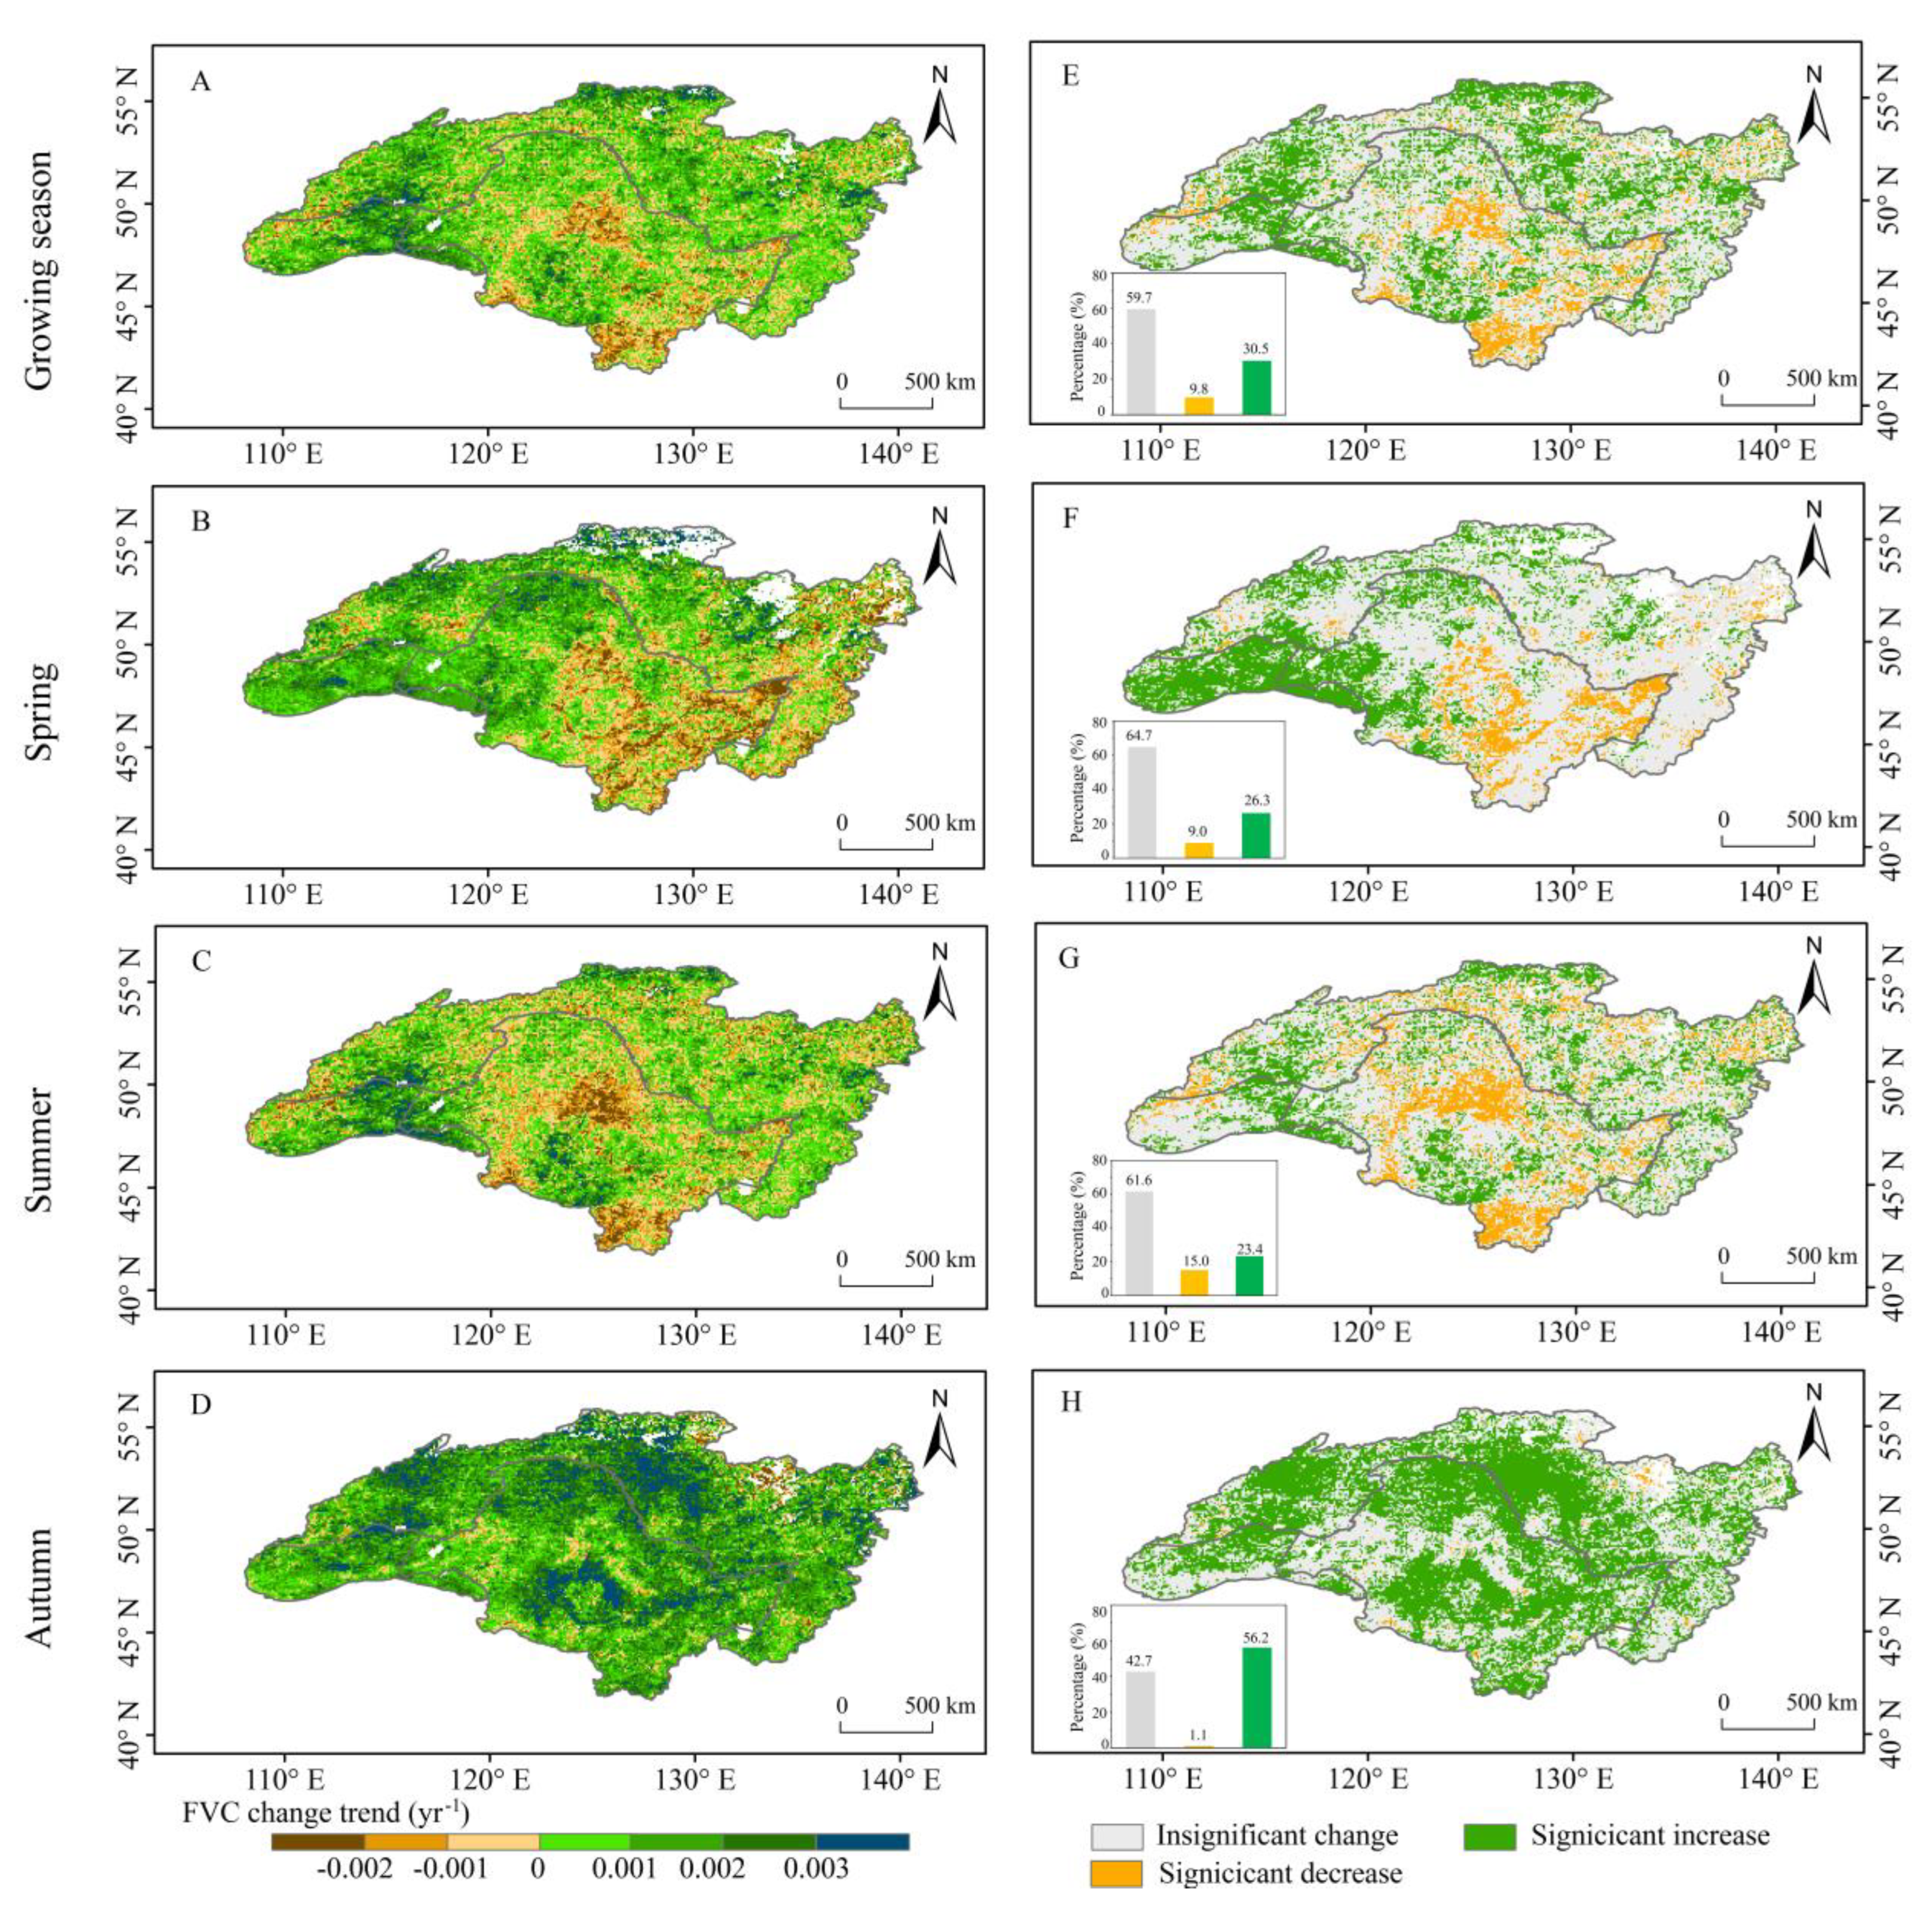
3.1. Spatiotemporal Patterns of FVC and Climatic Factors

At the basin scale, the mean annual FVC showed increasing trends in growing season, spring, summer, and autumn from 1982 to 2015 (Figure 2), and the increasing trends in growing season and autumn were significant (P < 0.05). Growing season and summer FVC had lower values in 2003.
Significant increase in air temperature was found in growing season (0.0347 °C yr−1, P < 0.01), summer (0.0364 °C yr−1, P < 0.01), and autumn (0.0370 °C yr−1, P < 0.01). However, the warming trend was insignificant in spring, with a rate of 0.0188 °C yr−1 (P = 0.20). Insignificant dryer trends were observed in growing season, summer, and autumn, and the largest rate of this precipitation decline was in summer (−0.4004 mm yr−1, P = 0.08). On the contrary, there was a slightly wetter trend in spring, with an annual precipitation increase of 0.1559 mm (P = 0.25).
At pixel scale, there were more pixels presenting FVC increase than decrease in growing season, spring, summer, and autumn from 1982 to 2015 in the ARB (Figure 3A–D). The variations of FVC trends were characterized as three types, namely significant increase (slope > 0, P < 0.05), significant decrease (slope < 0, P < 0.05), and insignificant change (P < 0.05), by combining the results of FVC trends and significance tests (Figure 3E–H). The majority of pixels with increasing and decreasing FVC were in autumn (90.3%, with a significant increase in 56.2%) and summer (42.1%, with a significant decrease in 15.0%). We also found the 67.0% of the entire area had growing season FVC increase, while 30.5% of the basin had significant increase detected mainly in the Songnen plain, northern mountainous areas, and the western ARB. Of the total pixels, 9.8% experienced significant FVC decreases in growing season, which were detected mainly in the Changbai mountainous area, the Sanjiang plain, and the Lesser Khingan mountainous area. In spring, the pixels with increased FVC accounted for 63.2% of the whole study area, while 26.3% of the ARB exhibited significant increasing trends aggregated mainly in the Greater Khingan mountainous area and the northern and western ARB. The spring FVC presented a significant decrease in the Songnen and Sanjiang plains.
For different vegetation types, the FVC values of woodland, grassland, and wetland presented increases in growing season, spring, summer, and autumn from 1982 to 2015 (Table 1), and the largest increase occurred in autumn for all vegetation types. Grassland FVC showed the largest increase of all vegetation types in growing season, spring, and summer. Areas with significant increase (P < 0.05) for grassland FVC in growing season, spring, and summer (Figure 4) accounted for 40.8%, 53.9%, and 31.1% of the total grassland area, respectively. Woodland had the largest areal proportion of significant FVC increases in autumn (60.3%) among all vegetation types.
The FVC showed significant increases (P < 0.05) in autumn in the three territories of China, Russia, and Mongolia, which was in accordance with the pattern of FVC for various vegetation types (Table 2). FVC in Mongolia also showed significant increasing trends in growing season, spring, and summer. Besides, 80.9% of FVC in Mongolia presented significant increase trends in spring (Figure 4B). China had the smallest increase in FVC and the largest area percentage of significant FVC decrease in spring, summer, and growing season compared with Russia and Mongolia.

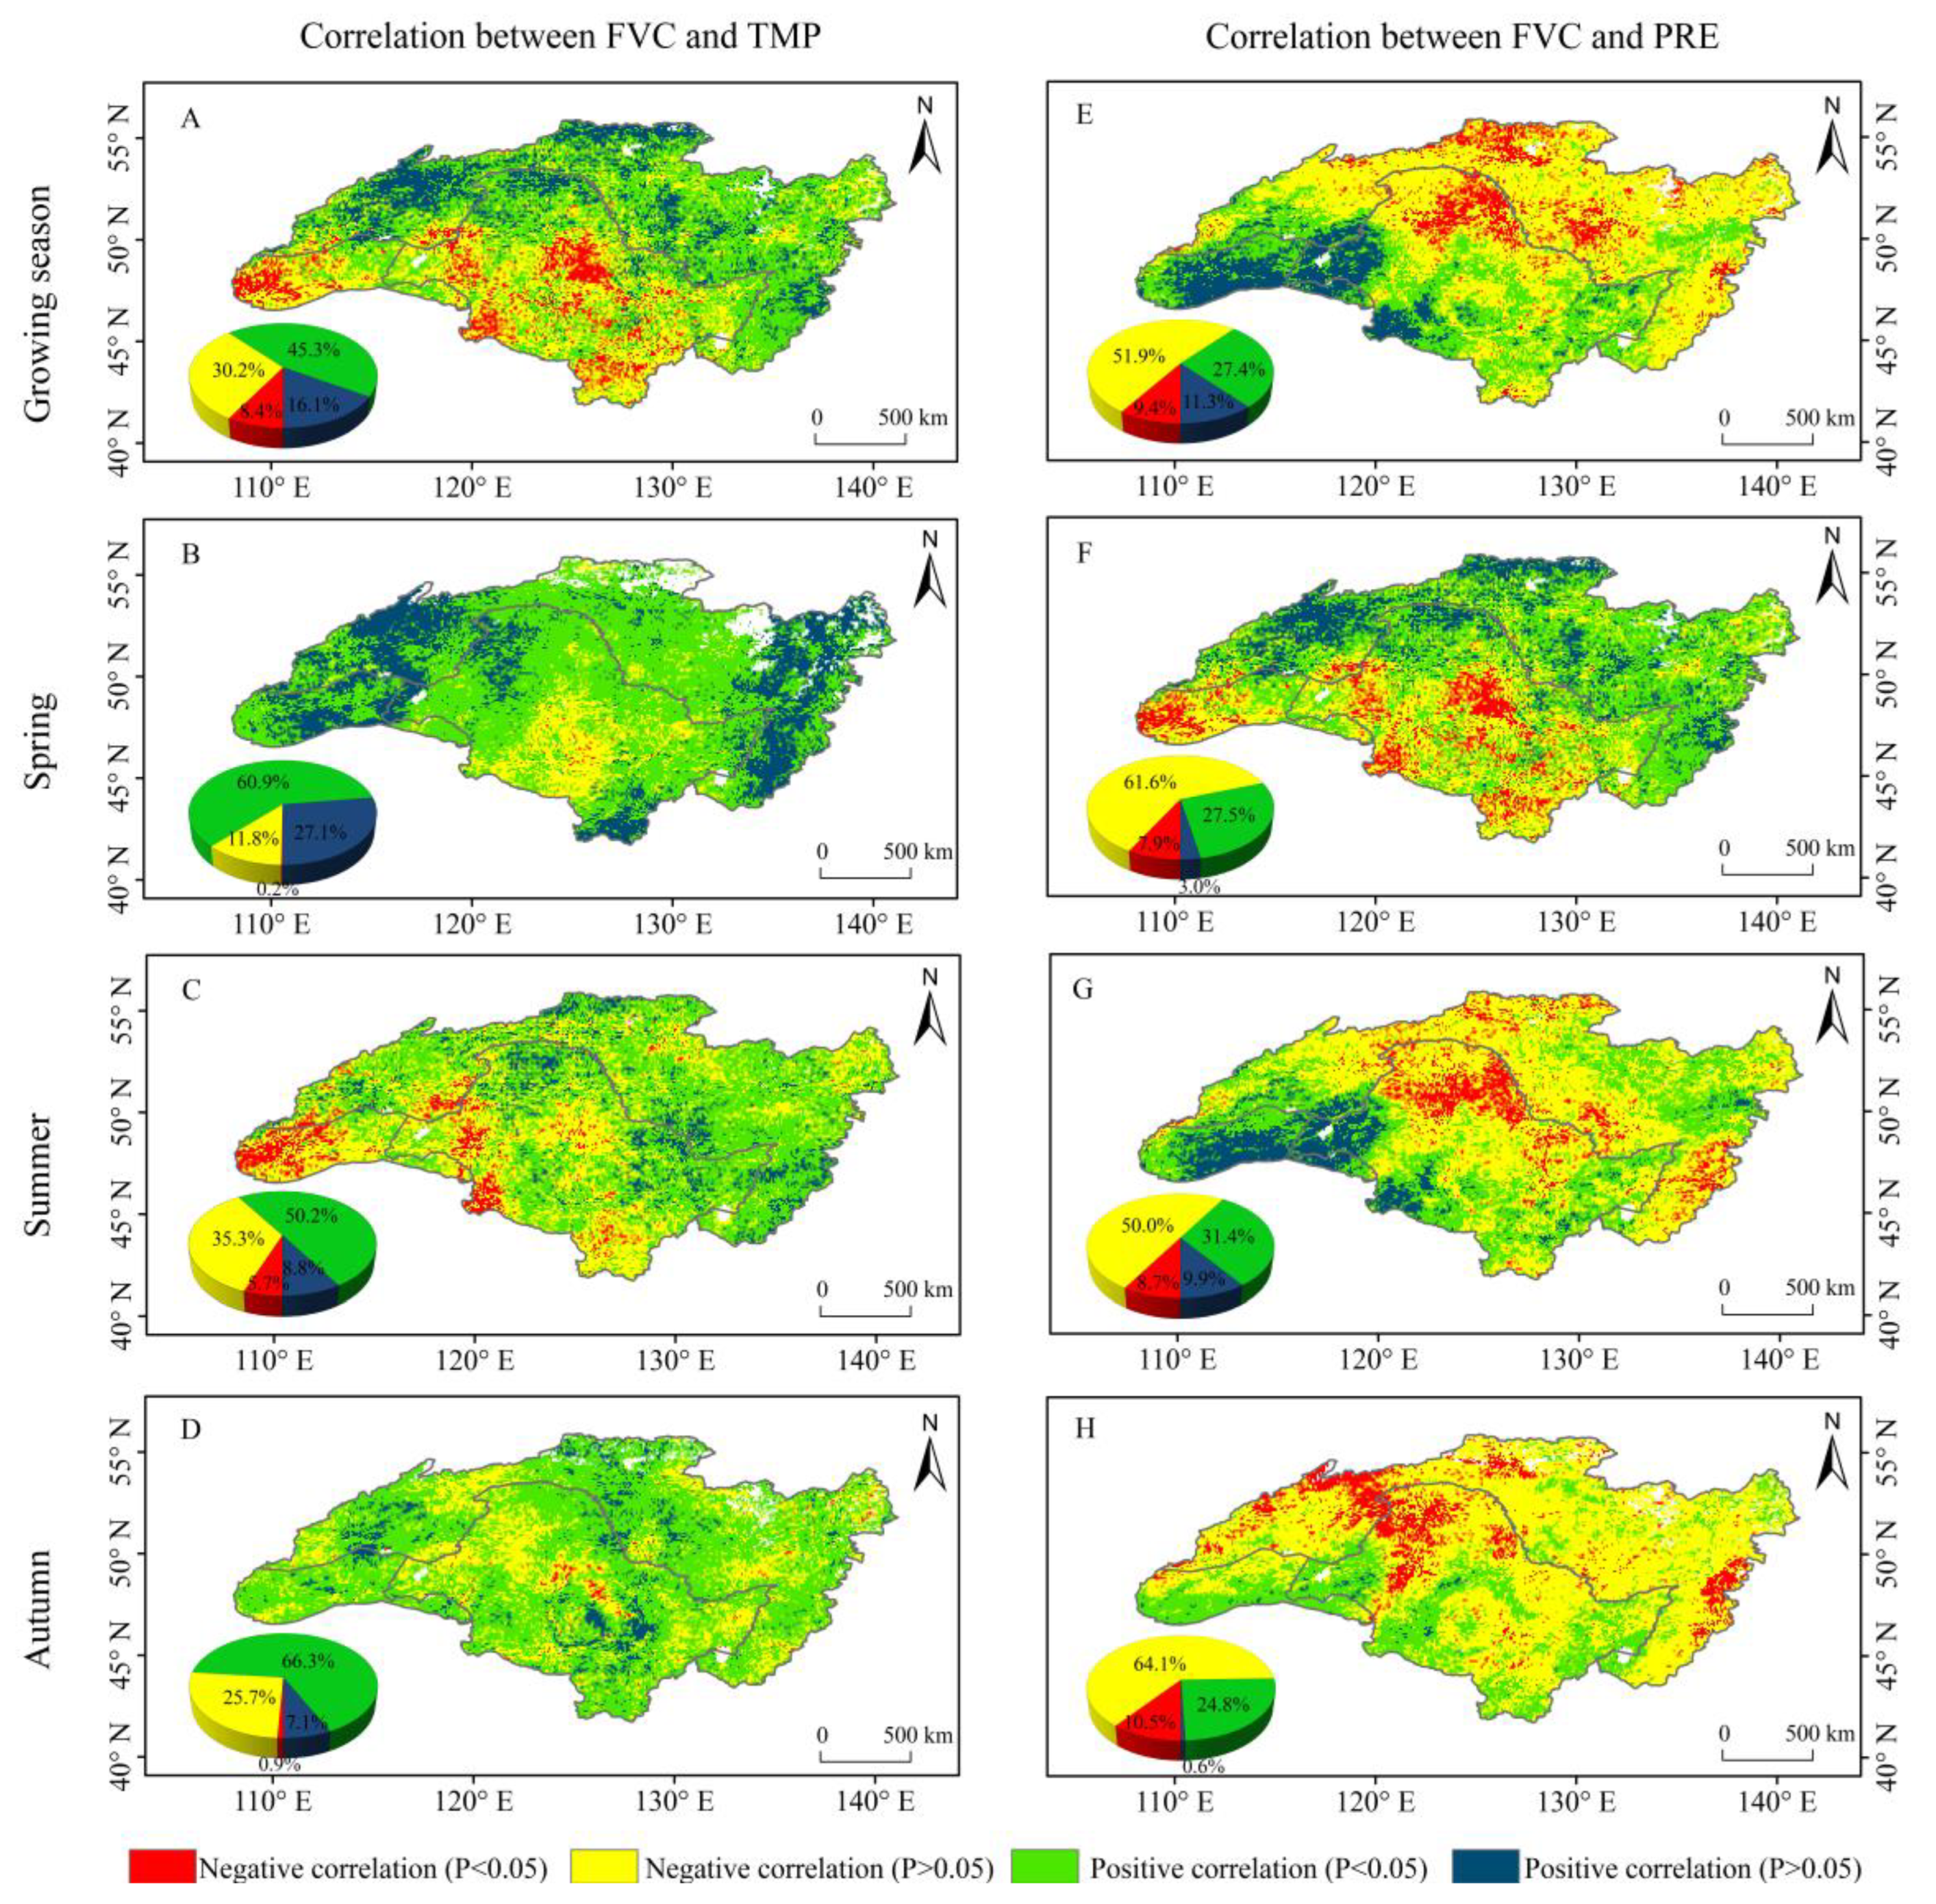
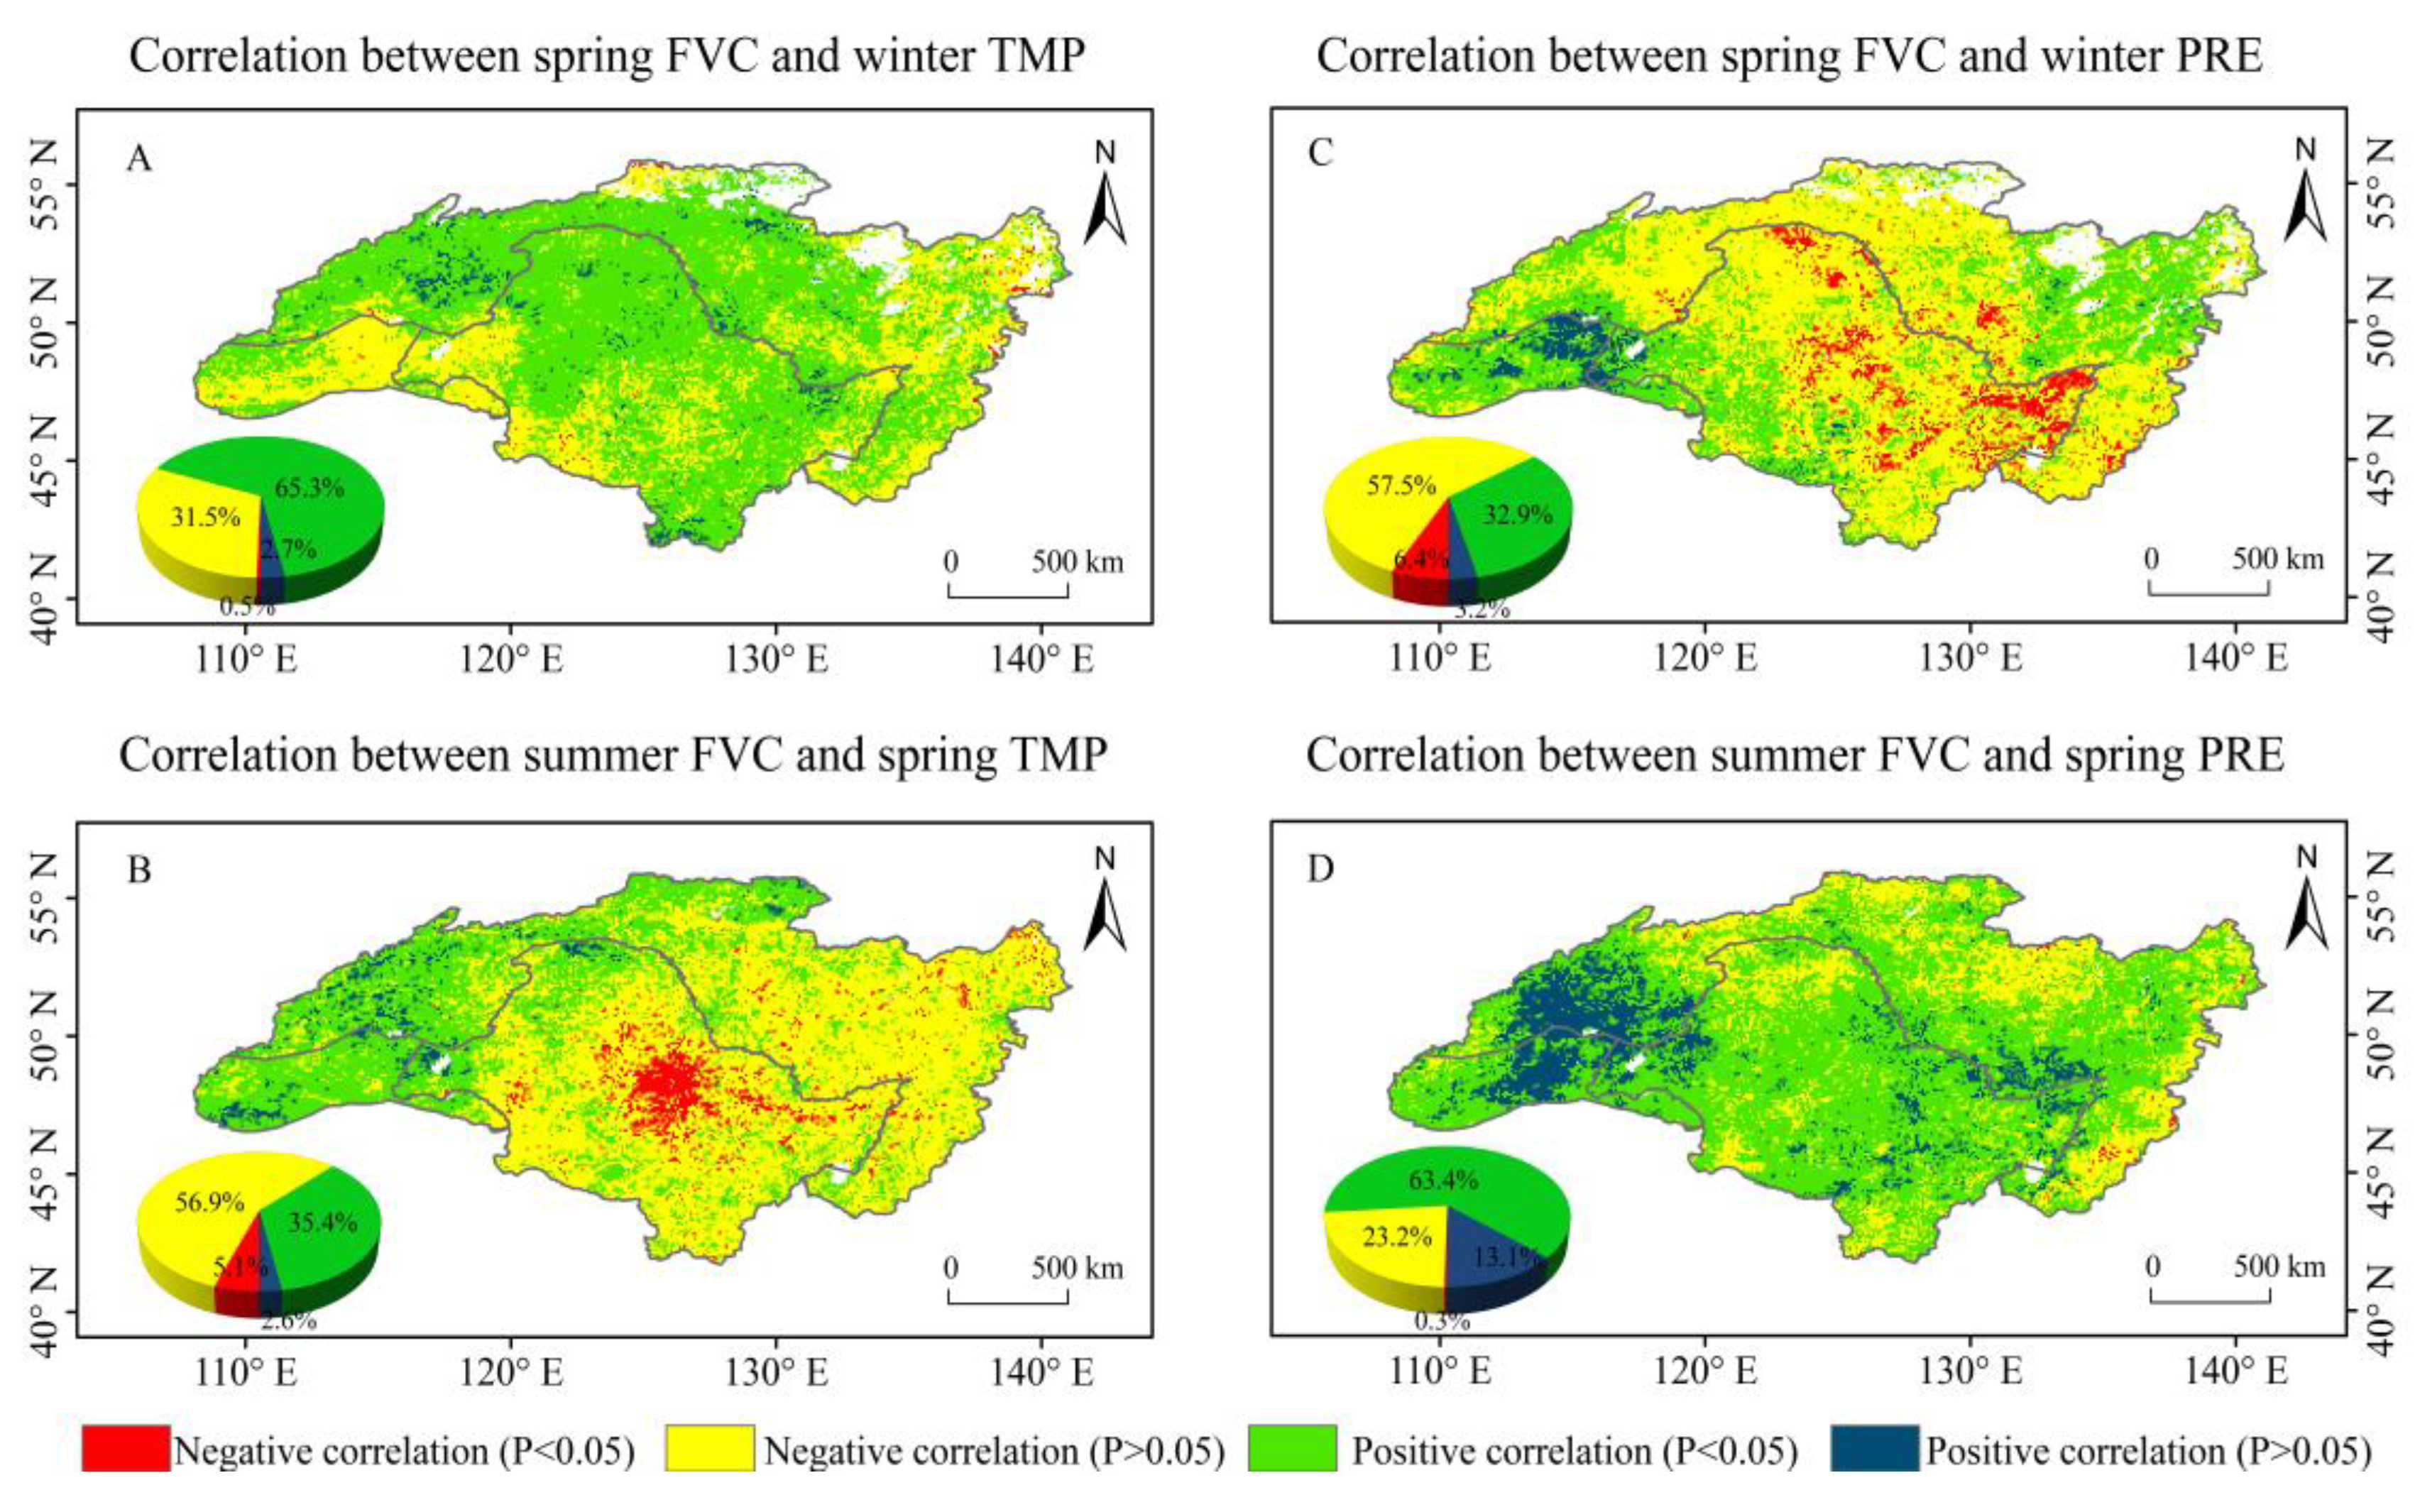
3.2. Spatiotemporal Patterns of the Correlations between FVC and Climatic Factors

The correlation coefficients between the FVC and air temperature (RFVC-TMP) and precipitation (RFVC-PRE) in growing season, spring, summer, and autumn were calculated using the Pearson correlation method at basin (Table 3) and pixel scales (Figure 5), respectively, to clarify the relationships of FVC with climatic changes from 1982 to 2015 in the ARB. FVC had a positive correlation with mean annual air temperature in growing season and the other three seasons (Table 3) at the basin scale. The largest Pearson correlation coefficient with a value of 0.329 between FVC and temperature was observed for spring. FVC had a negative correlation with precipitation in growing season and the other three seasons, and this negative correlation was the strongest in autumn with a value of −0.314.
There were more pixels exhibiting positive than negative correlation between FVC and temperature for growing season, spring, summer, and autumn in the ARB from 1982 to 2015 (Figure 5A–D). In growing season, the positive correlation between FVC and temperature was presented in 61.4% of the ARB. Significant positive correlation (P < 0.05) accounted for 16.1% of entire study area and mainly aggregated in the Greater Khingan mountainous area, northern mountainous areas, and the northwest of the ARB. Of the total pixels, 8.4% showed significant negative correlations between growing season FVC and temperature, and these were mainly located in the Songnen plain and the southwest of the ARB. In spring, FVC exhibited positive correlations with temperature in 88.0% of the entire basin. Significant positive correlations between spring FVC and temperature were present in 27.1% of the total pixels, which were located mainly in the eastern and western ARB. In summer, FVC showed negative correlations with temperature in 41.0% of the ARB, but only 5.7% of the basin presented significant positive correlations between FVC and temperature.
There were more pixels with negative correlation than that with positive correlation between FVC and precipitation in growing season, spring, summer, and autumn. The area showing significant negative correlation accounted for 10.5% of the ARB in autumn, larger than the area in growing season (9.4%), summer (8.7%), and spring (7.9%). In growing season and summer, pixels presenting significant negative correlation (P < 0.05) were identified mainly in Greater Khingan mountainous areas and northern mountainous areas of the ARB. Significant negative correlations in spring were situated mainly in the northeastern ARB. The positive correlation between FVC and precipitation in growing season and the other three seasons mainly occurred in the western ARB where the grassland was the dominant vegetation type (Figure 5E–H).
We examined the relationships of spring FVC with winter temperature and winter precipitation, and summer FVC with spring temperature and spring precipitation (Figure 6). Spring FVC showed a positive correlation with winter temperature in 68.0% of the ARB, while spring FVC presented a negative relationship with winter precipitation in 63.9% of the ARB. Furthermore, the significant negative correlation between spring FVC and winter precipitation occurred mainly in Sanjiang and Songnen plains where cropland is the dominant landscape type. Summer FVC showed positive correlations with spring precipitation in most areas (76.5% of the ARB), with significant positive correlation in 13.1% of the whole basin, and significant positive correlation coefficients were distributed mainly in the western ARB.

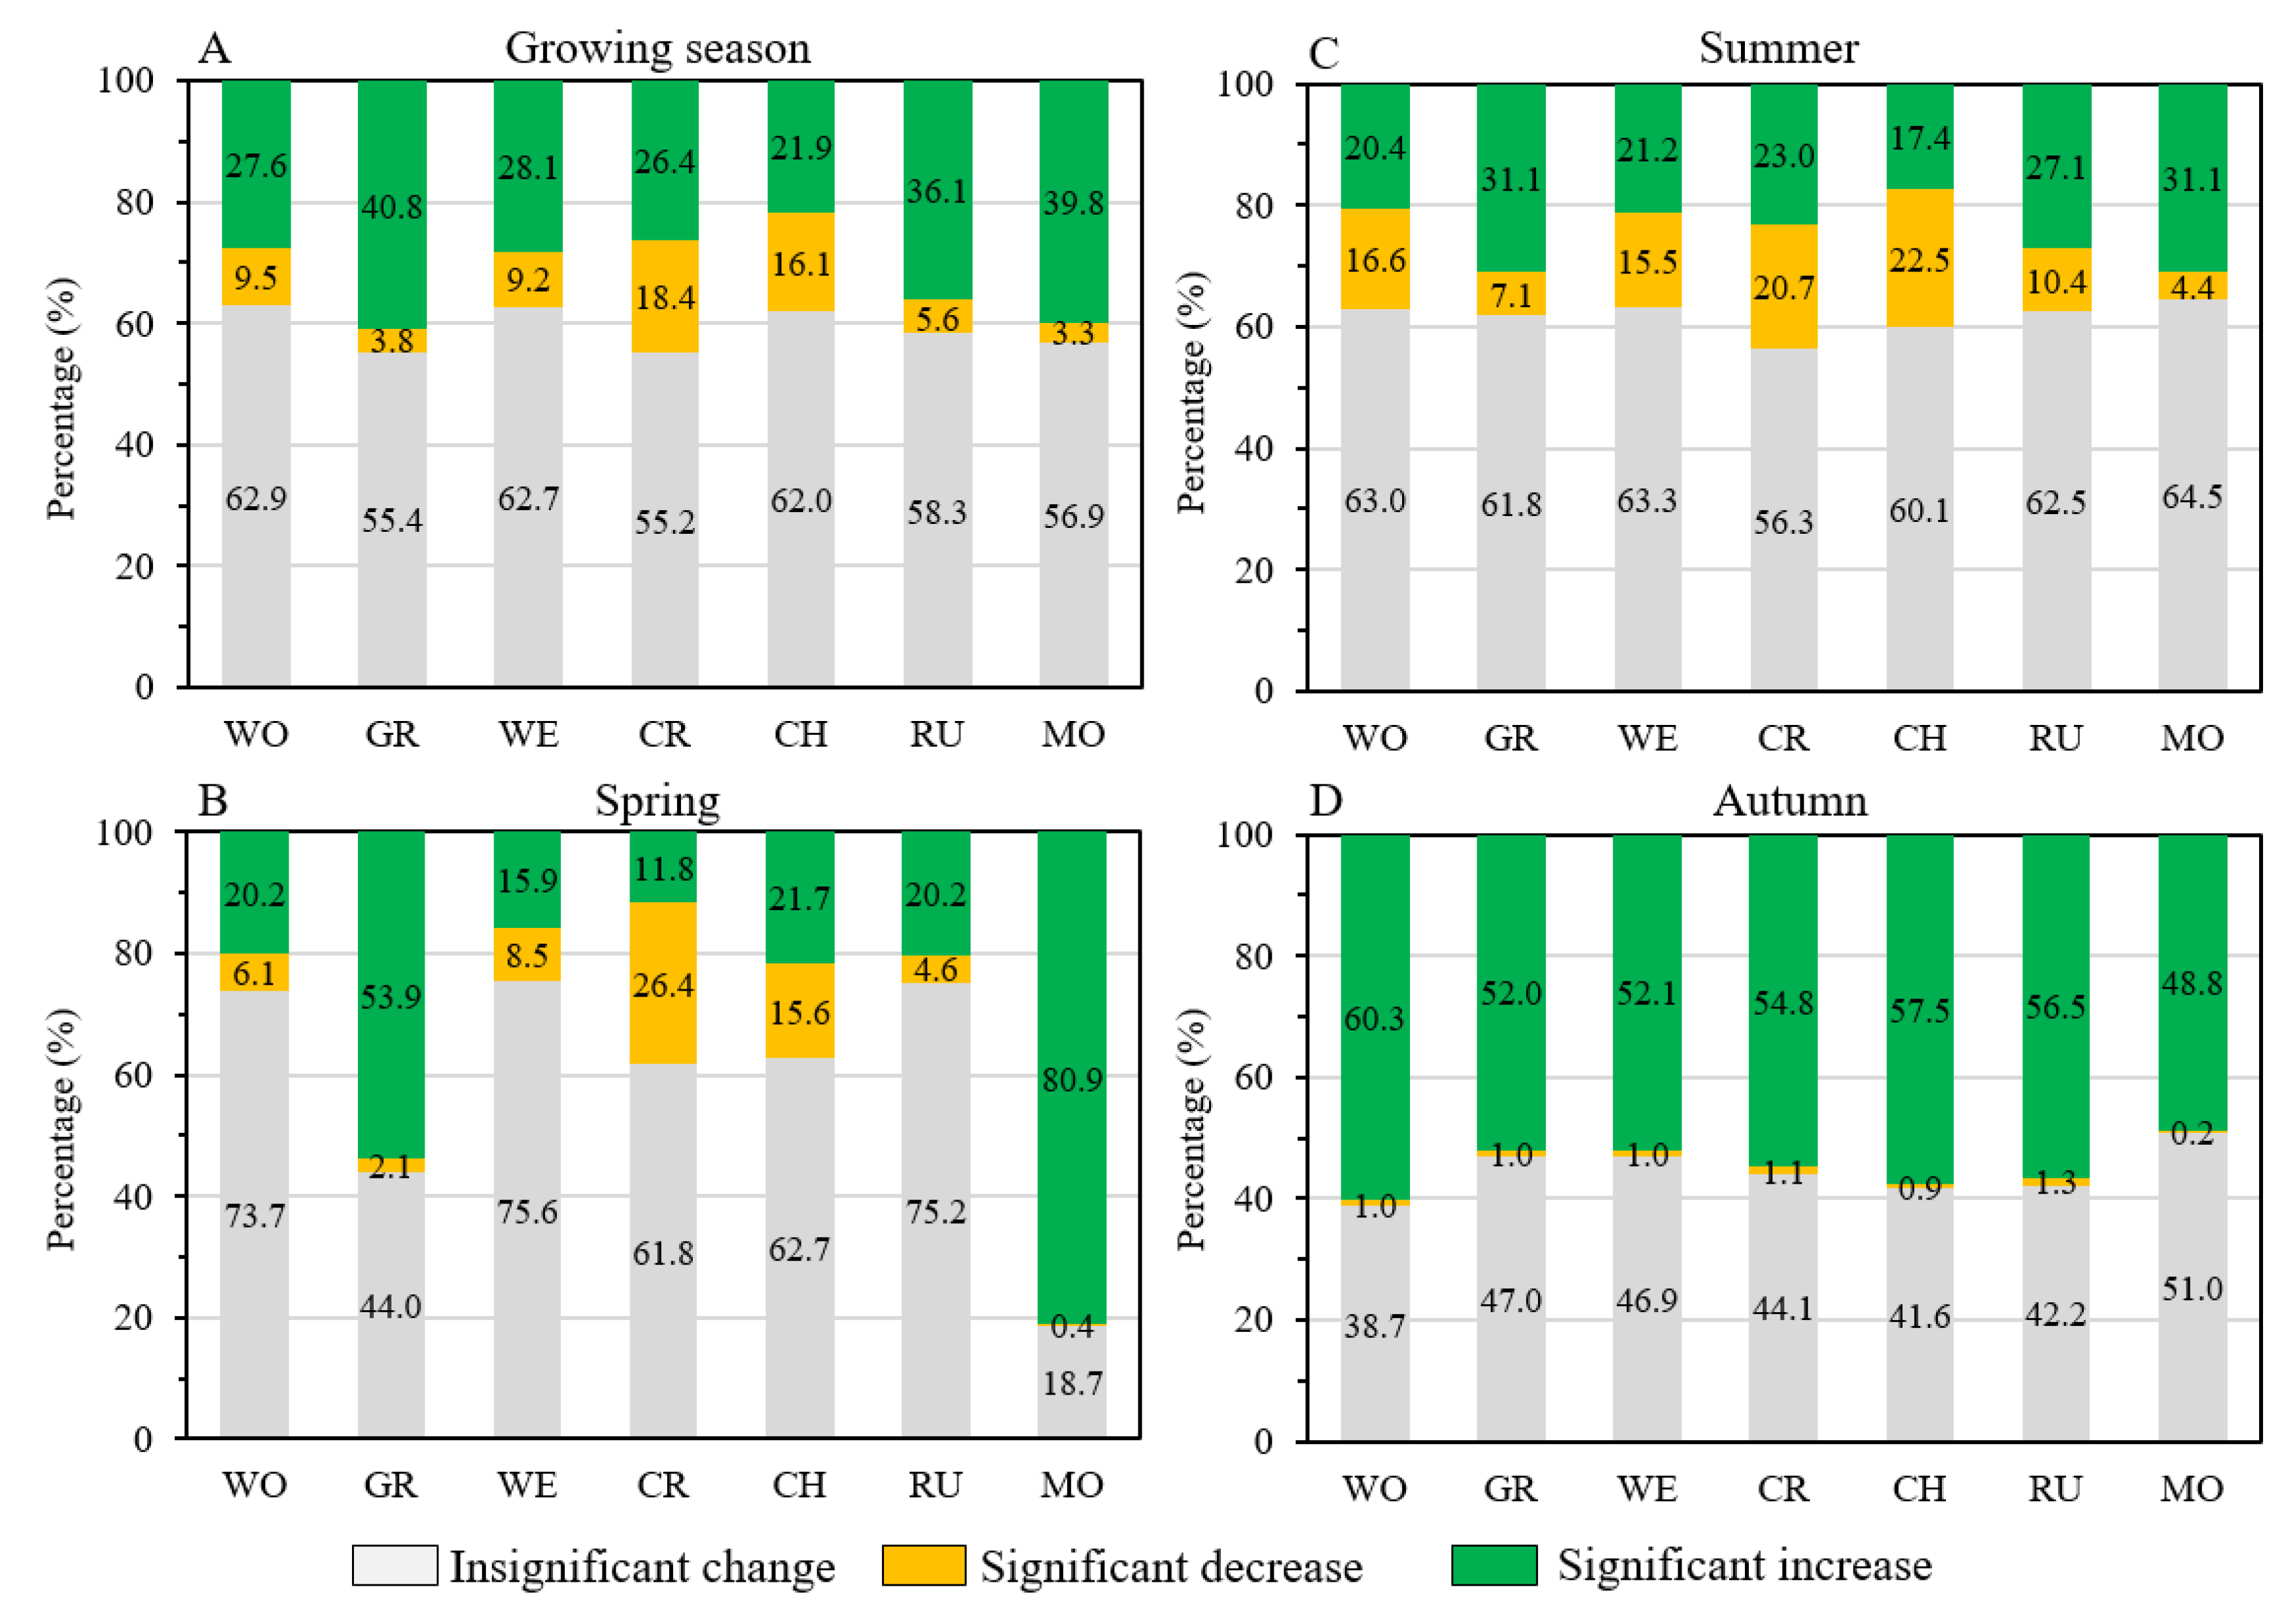
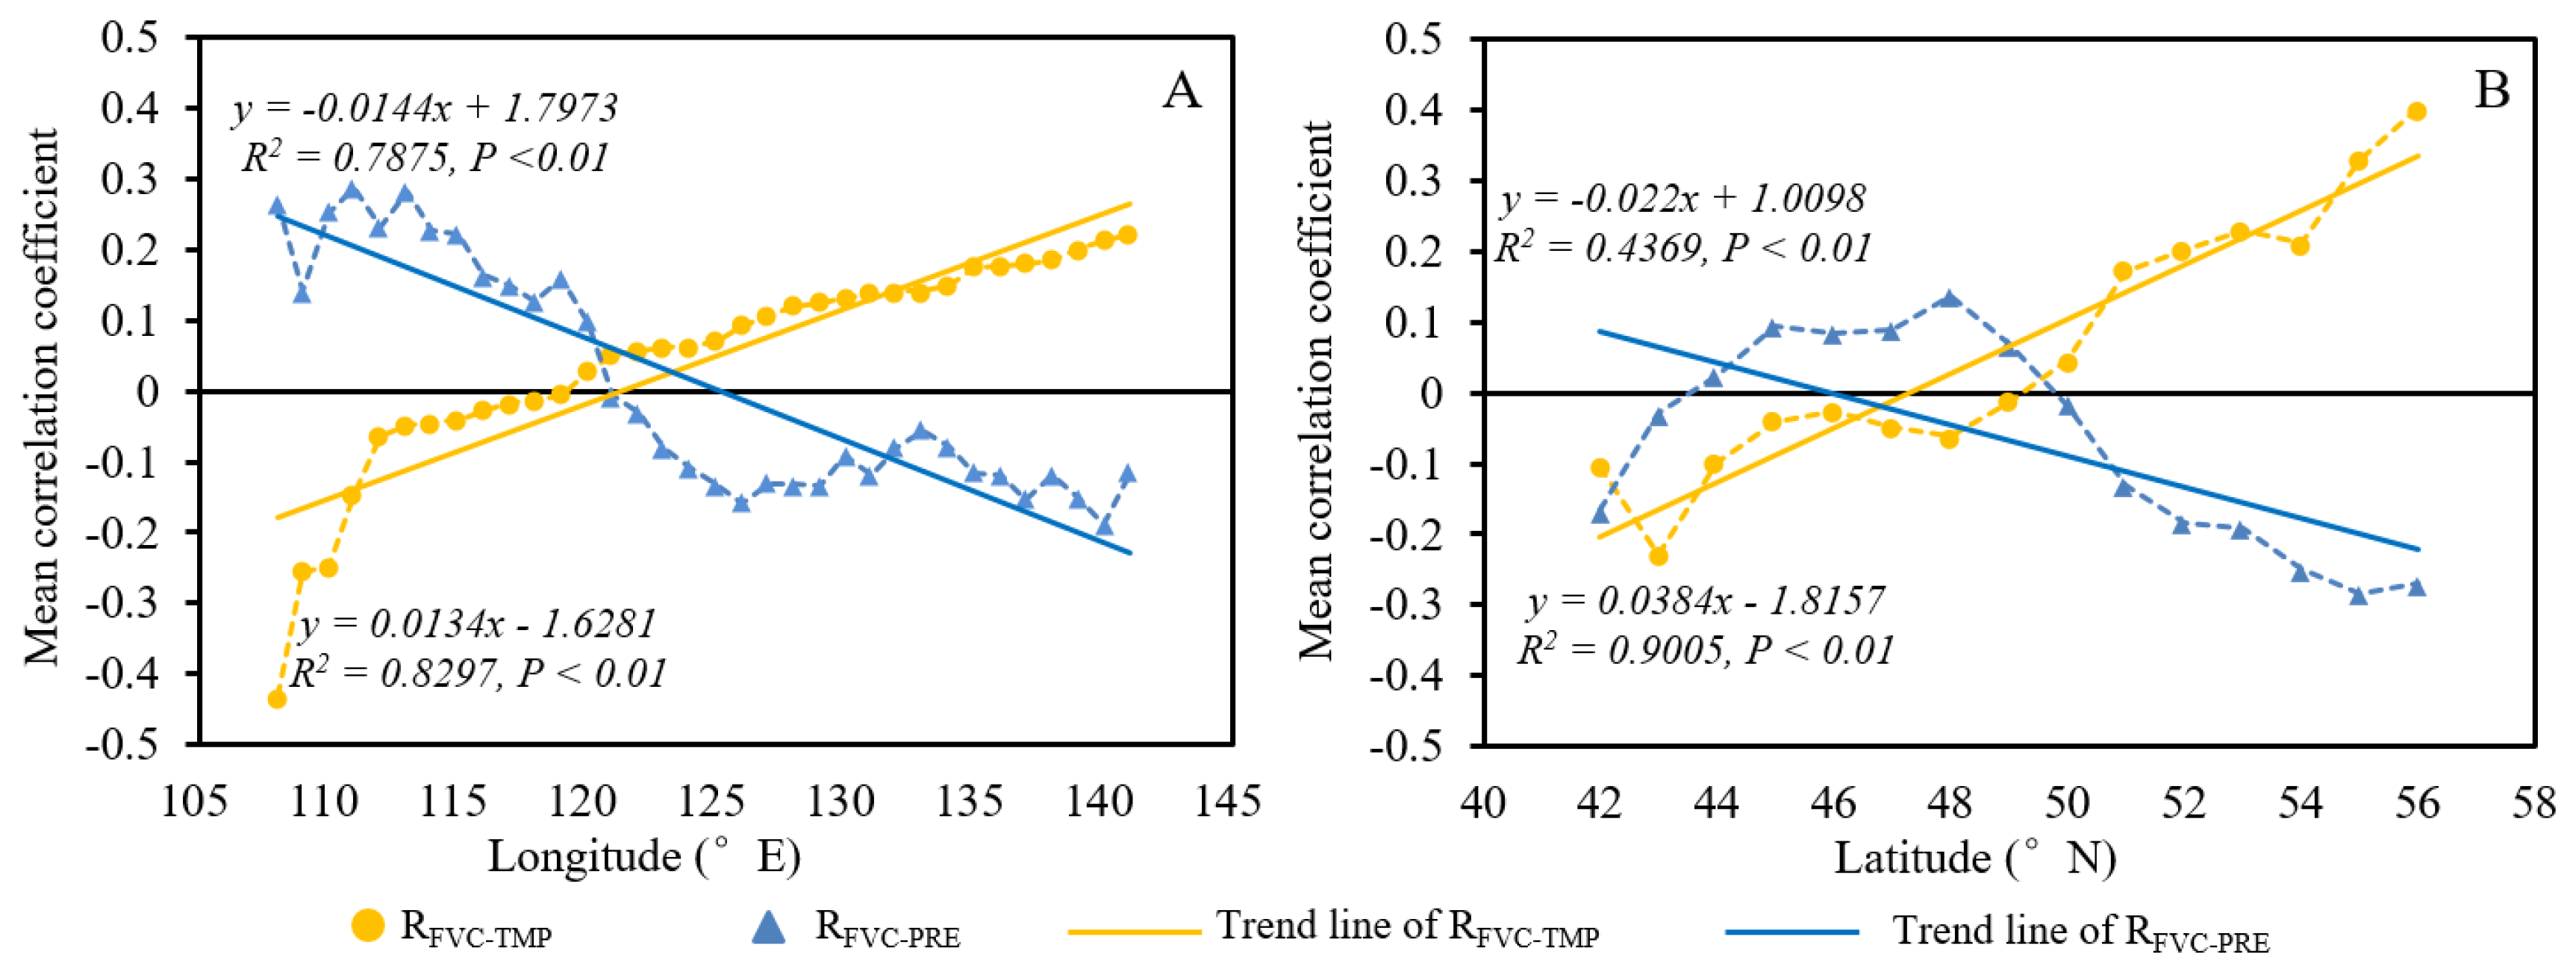
3.3. Variations in the Relationship of FVC with Climatic Factors among Different Vegetation Types, Nations, and Geographic Gradients

Except for cropland in growing season, the FVC of all vegetation types positively correlated with temperature in growing season and the other three seasons. Grassland FVC showed the most significant positive correlation (0.448) with temperature in spring (Table 1). The relationships of FVC with precipitation were more variable than temperature for different vegetation types. The FVC of woodland and wetland were negatively correlated with precipitation in growing season and the other three seasons, with woodland FVC exhibiting the strongest significant negative correlation with precipitation in autumn (−0.400). Grassland FVC was positively affected by precipitation in growing season, spring, and summer but negatively affected by precipitation in autumn.
The FVC in Russia presented significant positive correlations (p < 0.05) with temperature in growing season (0.448) and spring (0.376) but negative correlations with precipitation in growing season and the other three seasons (Table 2). The FVC in Mongolia showed the strongest positive correlation with temperature in spring (0.448) and significant positive correlations with precipitation in growing season (0.493), spring (0.366), and summer (0.460). However, we found the growing season FVC in China exhibited negative correlation with temperature and positive correlation with precipitation.
To further document the spatial heterogeneity of the FVC relationships with climatic factors, we calculated the mean correlation coefficients for each 1° longitudinal zone and each 1° latitudinal zone in growing season (Figure 7). Mean correlation coefficients showed obviously longitudinal and latitudinal zonalities. Specifically, the values of mean correlation coefficient between FVC and temperature (RFVC-TMP) increased clearly from negative to positive along with the increase of longitude and latitude. The mean correlation coefficients between FVC and precipitation (RFVC-PRE) presented a significant decreasing trend. Interestingly, 120° E and 50° N were the approximate boundaries between positive and negative values of mean correlation coefficients.

4. Discussion

4.1. FVC Dynamics and Its Relationship with Climatic Factors

At the basin scale, we found an increasing trend of growing season FVC with an annual rate of 0.0005 from 1982 to 2015, which could be attributed to increased temperature in the ARB [33,34]. Previous studies reveal that increased temperature enhanced photosynthetic intensity and extended growing season length for plants [2,29]. However, the increase of growing season FVC was not continuous, and there was an obvious decrease of FVC in 2003. This degradation phenomenon of vegetation was also found in another study [13] and can mainly be clarified by forest fires caused by long-lasting drought [33]. The FVC in spring represented the strongest positive correlation with temperature, since spring temperature regulated the start of the vegetation’s photosynthetic activity [35]. FVC showed the strongest negative correlation with precipitation in autumn because the increasing precipitation causes more clouds and less sunshine, which limits photosynthesis. We found that the correlation coefficient between autumn FVC and summer FVC was 0.340 (P < 0.05) at the river scale, which indicated autumn FVC was significantly dependent on summer vegetation growth and could partly explain the reason why autumn FVC had the highest rate of the increased trend.
For FVC in different nations, the trend of growing season FVC in China increased at the lowest rate and did not pass the T-test at the 0.05 level (Table 2). In fact, varied vegetation types and intensified human activities may be the reasons for difficultly in drawing a general conclusion on the FVC dynamics in the Chinese part of the ARB [13,36]. On the one hand, grassland, cropland, wetland, and woodland had different responses to climate change (Table 1), and all these vegetation types are present in the Chinese territory (Figure 1B). On the other hand, different human activities and policy implementations concerning farming and forest protection may have had different effects on FVC dynamics [37]. For example, the increasing FVC in the Songnen plain could be explained by the “Grain for Green” project that banned grazing in this region from 2006 [38,39]. In contrast, over-farming may partly explain the decreased FVC in the Sanjiang plain, the Lesser Khingan mountainous area, and the Changbai mountainous area [19,40,41]. In summary, the more vegetation types and human activities in the region, the more difficult it is to draw a general trend of its FVC dynamics. Thus, the increased trend of FVC in Mongolian territory was the most obvious.

4.2. Spatial Heterogeneity of Correlations between FVC and Climatic Factors

In this study, we found the obvious spatial heterogeneity of correlations between FVC and temperature or precipitation. The mean correlation coefficients for growing season presented obvious zonality of latitude and longitude (Figure 7). In the longitudinal direction, the boundary between positive and negative values of mean correlation coefficients was approximately consistent with the boundary between arid and humid areas [42,43]. Due to the influence of the temperate humid monsoon in summer, the humidity in the ARB presents an increasing trend from the west to east. In arid areas where precipitation has stronger control over vegetation growth temperature, the increased precipitation can promote photosynthetic activity [2], but the increased temperature enhances evaporation and reduces soil water content, which limits the vegetation growth. In humid areas, since the soil has relatively sufficient moisture, there is less of an effect of precipitation on vegetation growth, and temperature plays a major role in vegetation growth. Increased precipitation in this region means a higher probability of flooding and a larger area of open water, which seriously reduces the FVC [38]. In the latitudinal direction, the boundary between positive and negative values of mean correlation coefficients were approximately consistent with the boundary between the mid-temperate zone and the sub-frigid zone [42,44]. At the sub-frigid zone, the increased temperature means more available nitrogen in soil, which enhances the photosynthesis intensity of vegetation [10], and increased precipitation means more clouds and less sunshine, which may limit the vegetation growth [19].
Because of spatial differences of climate, the vegetation types across the ARB also showed spatial heterogeneity (Figure 1B). The woodlands were mainly distributed in the northern and eastern ARB, and most FVC of woodland in these areas presented significant negative correlation with precipitation in growing season, spring, summer, and autumn. However, the temperature had an obviously positive effect on woodland FVC, especially in spring (Figure 5). Actually, forests tend to have deeper roots, enabling access to deep soil water, which means that forests can sustain photosynthesis under lower rainfall for longer periods of time and are more resistant to droughts [45,46]. Therefore, woodland FVC is less dependent on precipitation water supply, and the temperature is the dominant factor for woodland FVC. Grasslands were distributed in the western ARB, and the FVC of grasslands in these areas was positively correlated with precipitation in growing season, spring, and summer, which was the opposite of the relationship of woodland FVC with precipitation. The soil of grasslands has little water, which causes the grasslands to be immediately and hugely affected by precipitation [47]. In addition, we also found FVC in grasslands had significant positive correlations with pre-season precipitation (Figure 6). For croplands mainly aggregated in Songnen and Sanjiang plains, we found that spring FVC showed significant negative correlation with winter precipitation in most of these areas. The increased precipitation in winter means longer snow cover periods and a later sowing date, which causes the decrease of cropland FVC in spring.

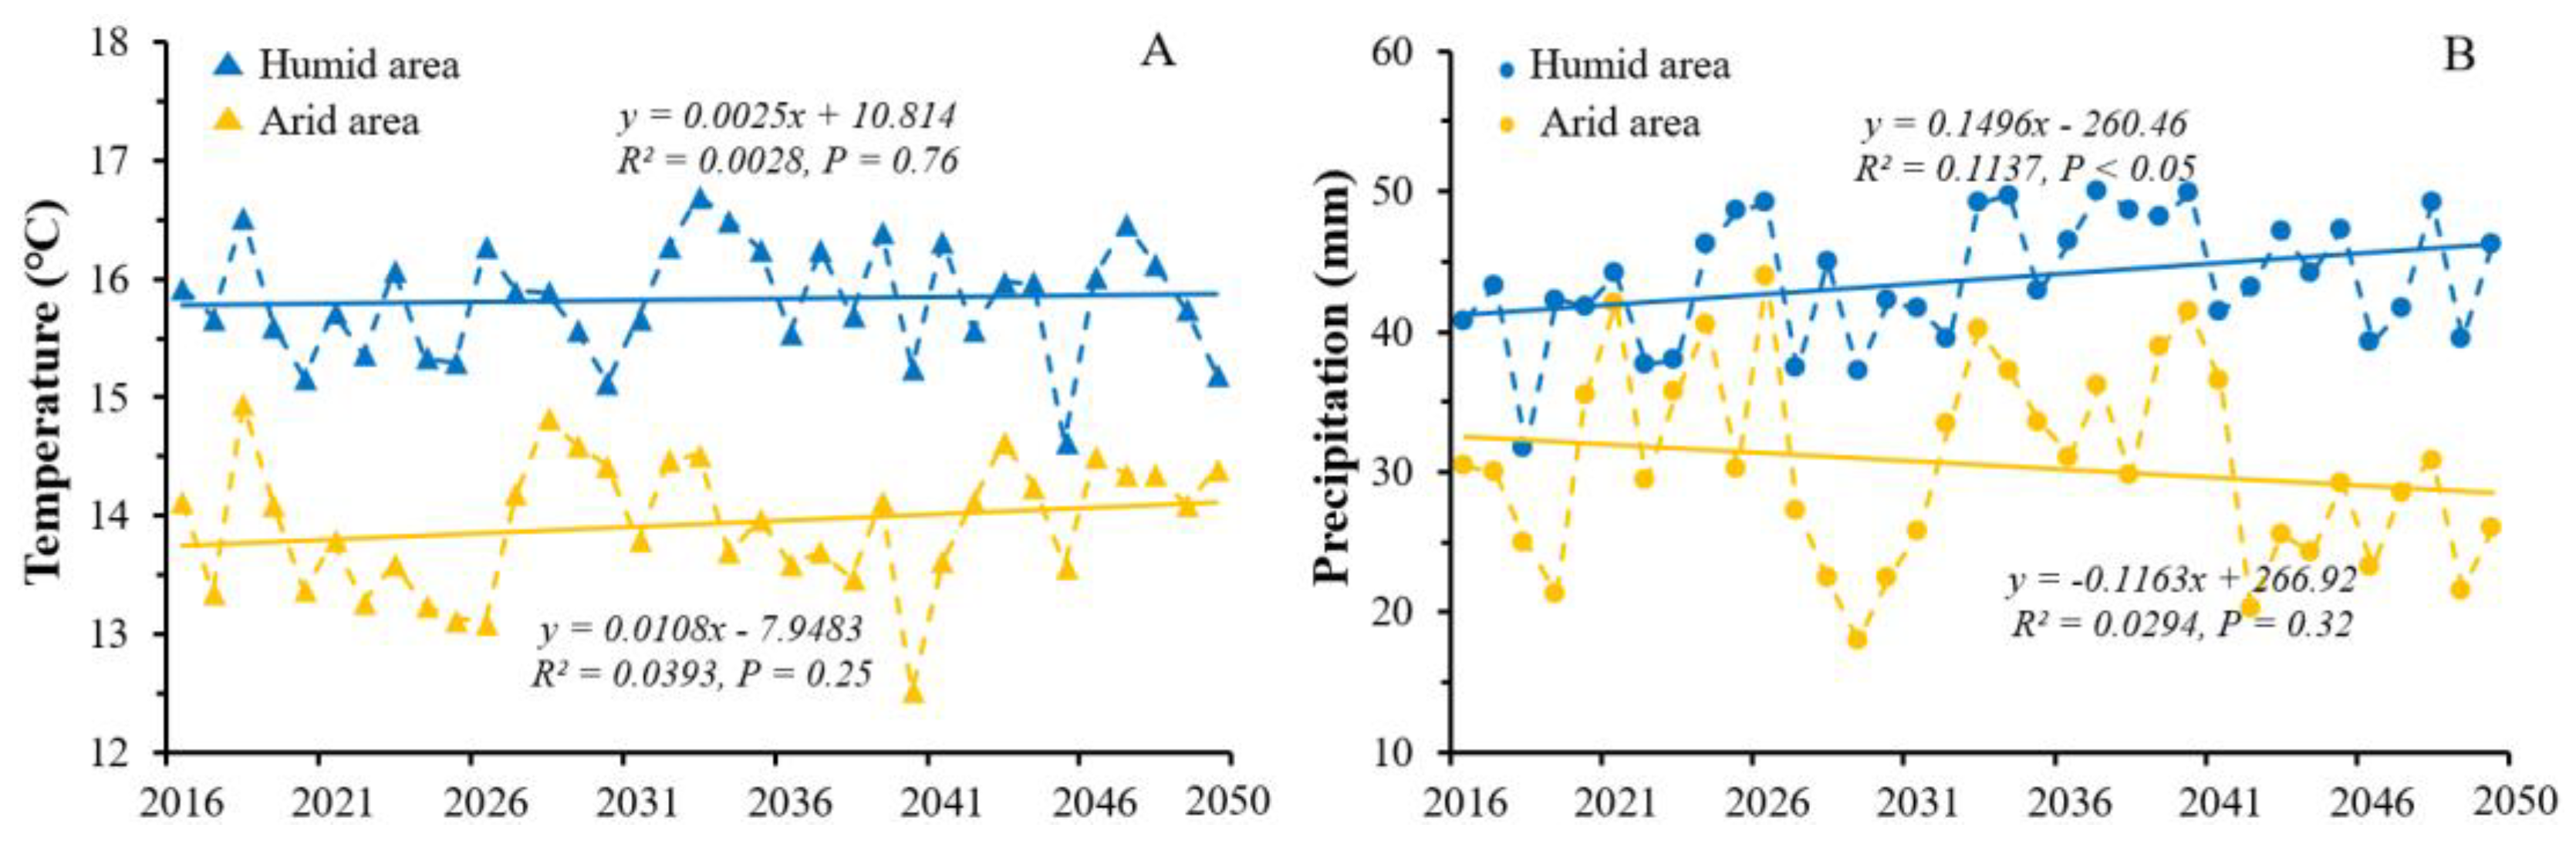
4.3. Effects of Future Climate Change on Vegetation and Management Implications

Based on the CNRM-ESM2-1 model and sustainability scenario, the climate will become warmer and dryer in arid areas of the ARB but will become warmer and wetter in humid areas of the ARB for growing season from 2016 to 2050 (Figure 8). Therefore, on the basis of previous analyses of the correlations between FVC and climatic factors, we predicted growing season FVC dynamics from 2015 to 2050 in the ARB. For woodlands, due to the increased temperature, the freeze-thaw action will be aggravated, and the available water for soil will increase, which will cause an increase of FVC in these regions. However, it should be noted that some woodlands were located in arid areas of the ARB where the long-term drought will still increase the probability of forest fires that may reduce woodland FVC suddenly in future. FVC of croplands and wetlands located mainly in humid areas will show an increasing trend because of the warmer and wetter trend in the future. However, the significant increasing precipitation in these areas will more possibly cause larger open water areas during the flood period, which will reduce the FVC of croplands and wetlands in future. For grasslands that were distributed mainly in arid area of the ARB, the warmer and dryer trend will lead to lower FVC in these areas.
Based on the former prediction, we formed three management implications. Firstly, the prevention work of forest fires should be more concentrated in the northwestern ARB. Secondly, the artificial irrigation and flood control system should be further developed in China to achieve better protection and utilization of wetlands and croplands. Thirdly, the grazing behavior in the western ARB should be restricted to relieve possible grassland degradation in future.

5. Conclusions

Based on GIMMS NDVI3g and CRU TS climate data, this study investigated the spatiotemporal patterns of fractional vegetation cover (FVC) in the ARB and their relationships with climatic changes from 1982 to 2015 varying over different seasons, vegetation types, geographical gradients, and countries. In the 34-year period, FVC presented significant increasing trends in growing season and autumn but insignificant increasing trends in spring and summer, with the largest increasing trend rate of FVC occurring in autumn. However, there were some areas showing significant decrease of FVC in growing season, which were located mainly in the Chinese territory of the ARB. The FVC dynamics varied among different vegetation types in various seasons. Grassland FVC experienced the largest increase in growing season, spring, and summer, while woodland FVC changed more dramatically in autumn. FVC showed a hugely positive correlation with air temperature in spring, especially for grassland. In autumn, FVC exhibited the strongest negative correlation with precipitation, especially for woodland. The correlations between FVC and climatic factors in growing season were zonal in latitude and longitude, while 120° E and 50° N were the approximate boundaries at which the values of mean correlation coefficients changed from positive to negative, respectively. These findings are beneficial to a better understanding of the responses of vegetation in the middle and high latitudes to climate changes and could provide fundamental information for sustainable ecosystem management in the ARB and the northern hemisphere.

Author Contributions

R.Y., X.L., and D.M. conceived the study. R.Y., Y.T., and Y.D. generated the datasets. R.Y. and D.M. performed the data analysis and prepared the manuscript. X.L. and Z.W. provided critical feedback and edited the manuscript. All authors have read and agreed to the published version of the manuscript.

Funding

This research was funded by the National Key R&D Program of China (No. 2016YFA0602301), the funding from Youth Innovation Promotion Association, Chinese Academy of Sciences (No. 2017277, and 2012178), and the Nature Science Foundation of Jilin Province, China (No. 20200201048JC).

Acknowledgments

We thank the three anonymous reviewers for the constructive comments and suggestions, which help improve the quality of this manuscript and the National Earth System Science Data Center of China for supporting geographic data (www.geodata.cn).

Conflicts of Interest

The authors declare no conflict of interest.

References

  1. Gitelson, A.A.; Kaufman, Y.J.; Stark, R.; Rundquist, D. Novel algorithms for remote estimation of vegetation fraction. Remote Sens. Environ. 2002, 80, 76–87. [Google Scholar] [CrossRef] [Green Version]
  2. Peng, S.; Piao, S.; Ciais, P.; Myneni, R.B.; Chen, A.; Chevallier, F.; Dolman, A.J.; Janssens, I.A.; Penuelas, J.; Zhang, G. Asymmetric effects of daytime and night-time warming on Northern Hemisphere vegetation. Nature 2013, 501, 88–92. [Google Scholar] [CrossRef] [PubMed]
  3. Betts, R.A. Biogeophysical impacts of land use on present-day climate: Near-surface temperature change and radiative forcing. Atmos. Sci. Lett. 2001, 2, 39–51. [Google Scholar] [CrossRef]
  4. Boyaj, A.; Dasari, H.P.; Hoteit, I.; Ashok, K. Increasing heavy rainfall events in South India due to changing land use land cover. Q. J. R. Meteorol. Soc. 2020. [Google Scholar] [CrossRef]
  5. Ahmad, W.; Khan, A.U.; Khan, F.A.; Farooq, M.; Baig, A.A.; Shah, L.A.; Khan, J. How vegetation spatially alters the response of precipitation and air temperature? Evidence from Pakistan. Asian J. Atmos. Environ. 2020, 14, 133–145. [Google Scholar] [CrossRef]
  6. De Jong, R.; Verbesselt, J.; Schaepman, M.E.; De Bruin, S. Trend changes in global greening and browning: Contribution of short-term trends to longer-term change. Glob. Chang. Biol. 2012, 18, 642–655. [Google Scholar] [CrossRef]
  7. Li, A.; Deng, W.; Liang, S.; Huang, C. Investigation on the patterns of global vegetation change using a satellite-sensed vegetation index. Remote Sens. 2010, 2, 1530–1548. [Google Scholar] [CrossRef] [Green Version]
  8. Piao, S.; Fang, J.; He, J. Variations in vegetation net primary production in the Qinghai-Xizang Plateau, China, from 1982 to 1999. Clim. Chang. 2006, 74, 253–267. [Google Scholar] [CrossRef]
  9. Chen, J.; Ju, W.; Ciais, P.; Viovy, N.; Liu, R.; Liu, Y.; Lu, X. Vegetation structural change since 1981 significantly enhanced the terrestrial carbon sink. Nat. Commun. 2019, 10, 1–7. [Google Scholar] [CrossRef]
  10. Taylor, C.M.; Lambin, E.F.; Stephenne, N.; Harding, R.J.; Essery, R.L. The influence of land use change on climate in the Sahel. J. Clim. 2002, 15, 3615–3629. [Google Scholar] [CrossRef]
  11. Chen, P.; Fedosejevs, G.; Tiscareno-Lopez, M.; Arnold, J.G. Assessment of MODIS-EVI, MODIS-NDVI and VEGETATION-NDVI composite data using agricultural measurements: An example at corn fields in western Mexico. Environ. Monit. Assess. 2006, 119, 69–82. [Google Scholar] [CrossRef] [PubMed]
  12. Zeng, X.; Dickinson, R.E.; Walker, A.; Shaikh, M.; DeFries, R.S.; Qi, J. Derivation and evaluation of global 1-km fractional vegetation cover data for land modeling. J. Appl. Meteorol. 2000, 39, 826–839. [Google Scholar] [CrossRef]
  13. Chu, H.; Venevsky, S.; Wu, C.; Wang, M. NDVI-based vegetation dynamics and its response to climate changes at Amur-Heilongjiang River Basin from 1982 to 2015. Sci. Total Environ. 2019, 650, 2051–2062. [Google Scholar] [CrossRef] [PubMed]
  14. Mao, D.; Wang, Z.; Du, B.; Li, L.; Tian, Y.; Jia, M.; Zeng, Y.; Song, K.; Jiang, M.; Wang, Y. National wetland mapping in China: A new product resulting from object-based and hierarchical classification of Landsat 8 OLI images. ISPRS J. Photogramm. Remote Sens. 2020, 164, 11–25. [Google Scholar] [CrossRef]
  15. Li, C.; Leal Filho, W.; Yin, J.; Hu, R.; Wang, J.; Yang, C.; Yin, S.; Bao, Y.; Ayal, D.Y. Assessing vegetation response to multi-time-scale drought across inner Mongolia plateau. J. Clean. Prod. 2018, 179, 210–216. [Google Scholar] [CrossRef]
  16. Li, C.; Li, H.; Li, J.; Lei, Y.; Li, C.; Manevski, K.; Shen, Y. Using NDVI percentiles to monitor real-time crop growth. Comput. Electron. Agric. 2019, 162, 357–363. [Google Scholar] [CrossRef]
  17. Liu, W.; Cai, T.; Ju, C.; Fu, G.; Yao, Y.; Cui, X. Assessing vegetation dynamics and their relationships with climatic variability in Heilongjiang province, northeast China. Environ. Earth Sci. 2011, 64, 2013–2024. [Google Scholar] [CrossRef]
  18. Jia, M.; Wang, Z.; Wang, C.; Mao, D.; Zhang, Y. A new vegetation index to detect periodically submerged mangrove forest using single-tide Sentinel-2 imagery. Remote Sens. 2019, 11, 2043. [Google Scholar] [CrossRef] [Green Version]
  19. Mao, D.; Wang, Z.; Luo, L.; Ren, C. Integrating AVHRR and MODIS data to monitor NDVI changes and their relationships with climatic parameters in Northeast China. Int. J. Appl. Earth Obs. Geoinf. 2012, 18, 528–536. [Google Scholar] [CrossRef]
  20. Tong, S.; Zhang, J.; Ha, S.; Lai, Q.; Ma, Q. Dynamics of fractional vegetation coverage and its relationship with climate and human activities in Inner Mongolia, China. Remote Sens. 2016, 8, 776. [Google Scholar] [CrossRef] [Green Version]
  21. Haag, I.; Jones, P.D.; Samimi, C. Central Asia’s changing climate: How temperature and precipitation have changed across time, space, and altitude. Climate 2019, 7, 123. [Google Scholar] [CrossRef] [Green Version]
  22. Meng, M.; Huang, N.; Wu, M.; Pei, J.; Wang, J.; Niu, Z. Vegetation change in response to climate factors and human activities on the Mongolian Plateau. PeerJ 2019, 7, e7735. [Google Scholar] [CrossRef]
  23. Jiang, J.; Zhou, T.; Chen, X.; Zhang, L. Future changes in precipitation over Central Asia based on CMIP6 projections. Environ. Res. Lett. 2020, 15, 54009. [Google Scholar] [CrossRef]
  24. Séférian, R.; Nabat, P.; Michou, M.; Saint Martin, D.; Voldoire, A.; Colin, J.; Decharme, B.; Delire, C.; Berthet, S.; Chevallier, M. Evaluation of CNRM Earth System Model, CNRM-ESM2-1: Role of earth system processes in present-day and future climate. J. Adv. Model. Earth Syst. 2019, 11, 4182–4227. [Google Scholar] [CrossRef] [Green Version]
  25. Yuan, F.; Liu, J.; Zuo, Y.; Guo, Z.; Wang, N.; Song, C.; Wang, Z.; Sun, L.; Guo, Y.; Song, Y.; et al. Rising vegetation activity dominates growing water use efficiency in the Asian permafrost region from 1900 to 2100. Sci. Total Environ. 2020, 736, 139587. [Google Scholar] [CrossRef] [PubMed]
  26. O’Neill, B.C.; Tebaldi, C.; Van Vuuren, D.P.; Eyring, V.; Friedlingstein, P.; Hurtt, G.; Knutti, R.; Kriegler, E.; Lamarque, J.; Lowe, J. The scenario model intercomparison project (ScenarioMIP) for CMIP6. Geosci. Model Dev. 2016, 9, 3461–3482. [Google Scholar] [CrossRef] [Green Version]
  27. Ma, Z.; Yan, N.; Wu, B.; Stein, A.; Zhu, W.; Zeng, H. Variation in actual evapotranspiration following changes in climate and vegetation cover during an ecological restoration period (2000–2015) in the Loess Plateau, China. Sci. Total Environ. 2019, 689, 534–545. [Google Scholar] [CrossRef]
  28. Wu, D.; Wu, H.; Zhao, X.; Zhou, T.; Tang, B.; Zhao, W.; Jia, K. Evaluation of spatiotemporal variations of global fractional vegetation cover based on GIMMS NDVI data from 1982 to 2011. Remote Sens. 2014, 6, 4217–4239. [Google Scholar] [CrossRef] [Green Version]
  29. Jiang, L.; Bao, A.; Guo, H.; Ndayisaba, F. Vegetation dynamics and responses to climate change and human activities in Central Asia. Sci. Total Environ. 2017, 599, 967–980. [Google Scholar] [CrossRef]
  30. Chen, I.; Hill, J.K.; Ohlemüller, R.; Roy, D.B.; Thomas, C.D. Rapid range shifts of species associated with high levels of climate warming. Science 2011, 333, 1024–1026. [Google Scholar] [CrossRef]
  31. Chang, Z.; Gong, H.; Zhang, J.; Chen, M. Correlation analysis on interferometric coherence degree and probability of residue occurrence in interferogram. IEEE Sens. J. 2014, 14, 2369–2375. [Google Scholar] [CrossRef]
  32. Liu, Y.; Lei, H. Responses of natural vegetation dynamics to climate drivers in China from 1982 to 2011. Remote Sens. 2015, 7, 10243–10268. [Google Scholar] [CrossRef] [Green Version]
  33. Novorotskii, P.V. Climate changes in the Amur River basin in the last 115 years. Russ. Meteorol. Hydrol. 2007, 32, 102–109. [Google Scholar] [CrossRef]
  34. Shaver, G.R.; Canadell, J.; Chapin, F.S.; Gurevitch, J.; Harte, J.; Henry, G.; Ineson, P.; Jonasson, S.; Melillo, J.; Pitelka, L.; et al. Global warming and terrestrial ecosystems: A conceptual framework for analysis. Bioscience 2000, 50, 871–882. [Google Scholar] [CrossRef]
  35. Tanja, S.; Berninger, F.; Vesala, T.; Markkanen, T.; Hari, P.; Mäkelä, A.; Ilvesniemi, H.; Hänninen, H.; Nikinmaa, E.; Huttula, T. Air temperature triggers the recovery of evergreen boreal forest photosynthesis in spring. Glob. Chang. Biol. 2003, 9, 1410–1426. [Google Scholar] [CrossRef]
  36. Guo, J.; Hu, Y.; Xiong, Z.; Yan, X.; Ren, B.; Bu, R. Spatiotemporal variations of growing-season NDVI associated with climate change in Northeastern China’s permafrost zone. Pol. J. Environ. Stud. 2017, 26, 1521–1529. [Google Scholar] [CrossRef]
  37. Mao, D.; He, X.; Wang, Z.; Tian, Y.; Xiang, H.; Yu, H.; Man, W.; Jia, M.; Ren, C.; Zheng, H. Diverse policies leading to contrasting impacts on land cover and ecosystem services in Northeast China. J. Clean. Prod. 2019, 240, 117961. [Google Scholar] [CrossRef]
  38. Shen, X.; Xue, Z.; Jiang, M.; Lu, X. Spatiotemporal change of vegetation coverage and its relationship with climate change in freshwater marshes of Northeast China. Wetlands 2019, 39, 429–439. [Google Scholar] [CrossRef]
  39. Mao, D.; Luo, L.; Wang, Z.; Wilson, M.C.; Zeng, Y.; Wu, B.; Wu, J. Conversions between natural wetlands and farmland in China: A multiscale geospatial analysis. Sci. Total Environ. 2018, 634, 550–560. [Google Scholar] [CrossRef]
  40. Liu, Y.; Wang, X.; Guo, M.; Tani, H.; Matsuoka, N.; Matsumura, S. Spatial and temporal relationships among NDVI, climate factors, and land cover changes in Northeast Asia from 1982 to 2009. Gisci. Remote Sens. 2011, 48, 371–393. [Google Scholar] [CrossRef]
  41. Mao, D.; Wang, Z.; Wu, J.; Wu, B.; Zeng, Y.; Song, K.; Yi, K.; Luo, L. China’s wetlands loss to urban expansion. Land Degrad. Dev. 2018, 29, 2644–2657. [Google Scholar] [CrossRef]
  42. Beck, H.E.; Zimmermann, N.E.; McVicar, T.R.; Vergopolan, N.; Berg, A.; Wood, E.F. Present and future Köppen-Geiger climate classification maps at 1-km resolution. Sci. Data 2018, 5, 180214. [Google Scholar] [CrossRef] [Green Version]
  43. Ma, Z.G.; Fu, C.B.; Dan, L. Decadal variations of arid and semi-arid boundary in China. Chin. J. Geophys. 2005, 48, 574–581. [Google Scholar] [CrossRef]
  44. Li, H.; Wang, S.; Bai, X.; Cao, Y.; Wu, L. Spatiotemporal evolution of carbon sequestration of limestone weathering in China. Sci. China Earth Sci. 2019, 62, 974–991. [Google Scholar] [CrossRef]
  45. He, B.; Chen, A.; Wang, H.; Wang, Q. Dynamic response of satellite-derived vegetation growth to climate change in the Three North Shelter Forest Region in China. Remote Sens. 2015, 7, 9998–10016. [Google Scholar] [CrossRef] [Green Version]
  46. Teuling, A.J.; Seneviratne, S.I.; Stöckli, R.; Reichstein, M.; Moors, E.; Ciais, P.; Luyssaert, S.; Van Den Hurk, B.; Ammann, C.; Bernhofer, C. Contrasting response of European forest and grassland energy exchange to heatwaves. Nat Geosci. 2010, 3, 722–727. [Google Scholar] [CrossRef]
  47. Yang, Y.; Piao, S. Variations in grassland vegetation cover in relation to climatic factors on the Tibetan Plateau. Chin. J. Plant Ecol. 2006, 30, 1–8. [Google Scholar]
Figure 1. Geographical features of the Amur River Basin (ARB). (A) Location of ARB and spatial terrain pattern; (B) the distribution of different land covers. The pie chart illustrates the area percentage of different land covers.
Sustainability 12 05866 g001
Figure 2. The changes of fractional vegetation cover (FVC), mean temperature (TMP), and mean precipitation (PRE) in growing season (AC), spring (DF), summer (GI), and autumn (JL) in the ARB over the period of 1982 to 2015.
Sustainability 12 05866 g002
Figure 3. Spatial distributions of FVC trends and trend types in the ARB from 1982 to 2015 for growing season (A,E), spring (B,F), summer (C,G), and autumn (D,H).
Sustainability 12 05866 g003
Figure 4. The percentage (%) of FVC change types for different vegetation types and nations in growing season (A), spring (B), summer (C), and autumn (D). WO: Woodland; GR: Grassland; WE: Wetland; CR: Cropland; CH: China; RU: Russia; MO: Mongolia.
Sustainability 12 05866 g004
Figure 5. Spatial patterns of the correlation between FVC and temperature (TMP) and precipitation (PRE) for growing season (A,E), spring (B,F), summer (C,G), and autumn (D,H). The pie charts illustrate the area percentage of different spatial patterns of the correlations.
Sustainability 12 05866 g005
Figure 6. Spatial pattern of correlation between spring FVC and (A) winter temperature and (B) winter precipitation, summer FVC and (C) spring temperature and (D) spring precipitation. The pie charts illustrate the area percentage of different spatial patterns of the correlations.
Sustainability 12 05866 g006
Figure 7. Changes in mean correlation coefficients between FVC and temperature and precipitation for growing season in (A) longitudinal and (B) latitudinal direction.
Sustainability 12 05866 g007
Figure 8. The trends of (A) mean temperature and (B) mean precipitation for growing season from 2016 to 2050 in the ARB. The blue represents the humid areas that were defined as the areas located at >120° E. The yellow represents the arid areas that were defined as the areas located at <120° E.
Sustainability 12 05866 g008
Table 1. The trends of FVC (yr−1), temperature (TMP, °C yr−1), and precipitation (PRE, mm yr−1) and Pearson correlation coefficients between FVC and mean temperature (RFVC-TMP) and mean precipitation (RFVC-PRE) for different vegetation types in growing season and other three seasonal periods.
Vegetation TypesPeriodsTrendsPearson Correlation Coefficients
FVCTMPPRERFVC-TMPRFVC-PRE
WoodlandGrowing season0.00040.032 **−0.2090.240−0.236
Spring0.00040.0170.1510.330−0.208
Summer0.00010.035 **−0.3600.244−0.270
Autumn0.0016 **0.034 **−0.1530.234−0.400 *
GrasslandGrowing season0.0010 **0.045 **−0.348 *0.1500.284
Spring0.0011 **0.0290.1310.448 **0.199
Summer0.0008 *0.049 **−0.561 *0.0490.300
Autumn0.0015 **0.038 **−0.1560.363*−0.127
WetlandGrowing season0.00040.030 **−0.1280.263−0.156
Spring0.00010.0130.1860.336−0.225
Summer0.00010.029 **−0.2140.290−0.137
Autumn0.0015 **0.038 **−0.2490.224−0.323
CroplandGrowing season0.00010.032 **−0.301−0.2210.164
Spring−0.00040.0160.2100.103−0.249
Summer0.00010.030 **−0.4370.0540.080
Autumn0.0016 **0.044 **−0.2800.211−0.088
* and ** represent significance at the 0.05 level and the 0.01 level, respectively.
Table 2. The trends of FVC (yr−1), temperature (TMP, °C yr−1), and precipitation (PRE, mm yr−1) and Pearson correlation coefficients between FVC and mean temperature (RFVC-TMP) and mean precipitation (RFVC-PRE) for different nations in growing season and other three seasonal periods.
NationsPeriodsTrendsPearson Correlation Coefficients
FVCTMPPRERFVC-TMPRFVC-PRE
ChinaGrowing season0.00010.034 **−0.325−0.1520.049
Spring0.00010.0180.1810.222−0.254
Summer−0.00010.034 **−0.4780.079−0.008
Autumn0.0016 **0.041 **−0.2770.246−0.247
RussiaGrowing season0.0007 *0.032 **−0.1370.413 *−0.202
Spring0.00050.0170.1360.376 *−0.214
Summer0.00040.034 **−0.2770.305−0.159
Autumn0.0015 **0.038 **−0.2490.224−0.323
MongoliaGrowing season0.0012 *0.057 **−0.486 *−0.1580.493 **
Spring0.0014 **0.036 **0.202 *0.448 **0.366 *
Summer0.00120.017 **−0.751 *−0.2260.460 **
Autumn0.0015 **0.040 **−0.250 *0.2430.082
* and ** represent significance at the 0.05 level and the 0.01 level, respectively.
Table 3. Correlations between mean FVC and mean temperature (RFVC-TMP) and mean precipitation (RFVC-PRE) in growing season and the other three seasons at the basin scale.
PeriodsRFVC-TMPpRFVC-PREp
Growing season0.2040.247−0.0390.828
Spring0.3290.057−0.1350.445
Summer0.2310.188−0.0530.766
Autumn0.3000.085−0.3140.070
• represents significance at the 0.1 level.

