Article

Composite Multi-Criteria Decision Analysis for Optimization of Hybrid Renewable Energy Systems for Geopolitical Zones in Nigeria

by
Michael O. Ukoba
1,
Ogheneruona E. Diemuodeke
1,*,
Mohammed Alghassab
2,
Henry I. Njoku
3,
Muhammad Imran
4 and
Zafar A. Khan
5
1
Energy and Thermofluid Research Group, Department of Mechanical Engineering, Faculty of Engineering, University of Port Harcourt, Port Harcourt PMB 5323, Rivers State, Nigeria
2
Department of Electrical and Computer Engineering, Shaqra University, Riyadh B11911, Saudi Arabia
3
Department of Mechanical Engineering, School of Engineering and Technology, Federal University of Technology Owerri, Owerri PMB 1526, Imo State, Nigeria
4
Mechanical Engineering and Design, School of Engineering and Applied Science, Aston University, Birmingham B4 7ET, UK
5
Department of Electrical Engineering, Mirpur University of Science and Technology, Mirpur 10250, Azad Kashmir, Pakistan
*
Author to whom correspondence should be addressed.
Sustainability 2020, 12(14), 5732; https://doi.org/10.3390/su12145732
Submission received: 8 June 2020 / Revised: 10 July 2020 / Accepted: 13 July 2020 / Published: 16 July 2020
(This article belongs to the Special Issue Hybrid Energy System)

Abstract

:
This paper presents eight hybrid renewable energy (RE) systems that are derived from solar, wind and biomass, with energy storage, to meet the energy demands of an average household in the six geopolitical zones of Nigeria. The resource assessments show that the solar insolation, wind speed (at 30 m hub height) and biomass in the country range, respectively, from 4.38–6.00 kWh/m2/day, 3.74 to 11.04 m/s and 5.709–15.80 kg/household/day. The HOMER software was used to obtain optimal configurations of the eight hybrid energy systems along the six geopolitical zones’ RE resources. The eight optimal systems were further subjected to a multi-criteria decision making (MCDM) analysis, which considers technical, economic, environmental and socio-cultural criteria. The TOPSIS-AHP composite procedure was adopted for the MCDM analysis in order to have more realistic criteria weighting factors. In all the eight techno-economic optimal system configurations considered, the biomass generator-solar PV-battery energy system (GPBES) was the best system for all the geopolitical zones. The best system has the potential of capturing carbon from the atmosphere, an attribute that is desirous for climate change mitigation. The cost of energy (COE) was seen to be within the range of 0.151–0.156 US$/kWh, which is competitive with the existing electricity cost from the national grid, average 0.131 US$/kWh. It is shown that the Federal Government of Nigeria favorable energy policy towards the adoption of biomass-to-electricity systems would make the proposed system very affordable to the rural households.

1. Introduction

No doubt that an adequate supply of sustainable energy is bedrock of modern development, but Nigeria is still battling with inadequate and epileptic power generation for its citizenries and industries (interested readers could consult references [1,2] for details). Nigeria is not alone in the energy crisis; the majority of developing nations in the global south is facing the energy crisis. A sustainable solution to the energy crisis will contribute immensely to the fiscal and infrastructural advancement of Nigeria and other developing nations [3]. The country has made some remarkable efforts in the past decades to develop the energy access sector, still, the power supply in the country is grossly inadequate, which may be attributed in part to the energy conversion technologies dominated by fossil fuels. The dominant and the continuous use of fossil fuel is partly responsible for the climate change because the emissions, namely methane, carbon dioxide and nitrous oxide, from the fossil fuel utilisation are stratospheric unfriendly [4]. The negative impact of climate change is currently ravaging the global economy, for example heat waves, floods, irregular rainfall, drought, hurricanes, typhoons, melting of glacier etc. If the climate change is not unabated, the global south would bear the severe burden due to weak adaptive measures. Therefore, it is of utmost importance to investigate various options in tackling the energy crises in the country in full view of environmental effects, cost implications, available technology and sustainability of the system, which support the international advocacy for global temperature reduction below 2.0 °C pre-industrial revolution [5].
Sustainable energy generation has a major role to play in the developing nation, especially in sub Saharan Africa nations, Nigeria for example. Adequate power generation and supply will enhanced low product cost; improved standard of living; comfort at home and work place; improved storage of perishable products; improved standard of education; and many more [6]. China has shown the it-is-doable attitude by moving substantial percentage of its population out of the poverty line, which can be attributed to improved energy access [7]. Nigeria, with well over 170 million people [8], needs to effectively tackle the power challenges facing the nation in order to combat poverty, crime and low productivity epidemics. However, the energy sector in Nigeria is still dominated by conventional energy generation systems—mainly fossil fuels. One predicament of the conventional (non-renewable) form of power generation in the country is the inequitable distribution of crude-oil/natural gas resources across the geo-political zones, coupled with the negative environmental effect it has on the society. The conventional power generation and its distribution have been centralized through the national grid. The national grid in Nigeria is weak, with limited national coverage. The rural communities are largely not connected to the national grid with the consequential effects of heavy reliance on crude and dirty energy sources; about 80% of the energy demand in the rural communities is met by biofuels (e.g., firewood, charcoal etc.) and wastes (mainly agro-waste) [9]. The extension of the national grid to the unserved communities will take decades to achieve because it is economically prohibitive to extend the grid to the low energy demand density areas—mainly the rural communities. In order to achieve the universal energy access by the year 2030, distributed energy supply is highly favoured. These reasons have prompted several researches on off grid hybrid renewable energy (RE) technologies, where renewable resources are combined for continuous, cost effective, efficient, sustainable and clean mode power generation. The continuous mode of electricity supply demands an optimal combination of various renewable energy sources, which are normally intermittent in supply. Many research on hybrid renewable energy systems have been made in a bid to tackle the irregular power challenge, high cost of power generation, negative environmental impact and sustainable form of power generation [10,11,12,13,14]
Several works have been done on the combination of different renewable sources with diesel generator; a conventional fuel source from fossil [15,16]. Olatomiwa [17] used the HOMER software to optimally combined energy sources to meet the energy demand of a healthcare facility in an off-grid rural community. Reference [18] argued that the irregular energy supply and the high cost of petroleum products required the Nigerian government to strategically accelerate the development and implementation of biogas production facilities. The study showed the current biomass potential for biogas production in the country and the feedstocks for biogas production plants. The agro-wastes must be converted to useful energy because the rural communities that lack access to modern energy are burdened with fire hazards and pests from mountains of agro-wastes. Reference [19] carried out an analysis, on the HOMER software platform, of a hybrid (PV-biogas-wind) renewable energy systems to provide the energy needs of a dairy farm in Cuba. The author stressed that the choice of PV-biogas-wind energy system was anchored on the drive for sustainable energy development in Cuba. However, the optimization procedure of HOMER software is based on economic data, namely Net Present Cost (NPC), without the due consideration of other factors—social-cultural, technological and environmental. The implication is that there is a need for further analysis of the optimal hybrid systems against social-cultural, economic, technical and environmental landscapes; this requires the deployment of an appropriate multi-criterial decision method (MCDM).
The Technique for Order Preference by Similarity to Ideal Solution (TOPSIS) is among the appropriate MCDMs that has found satisfactory applications in the energy sector [20,21,22]; and it has been demonstrated to be efficient in distributed energy and power generation systems [23,24,25,26]. TOPSIS offers some advantages over other MCDM algorithms in the form of comprehensibility, simplicity, rationality, computational efficiency and simple mathematics that relate the relative performance of the alternatives [11]. Reference [11] obtained the best configuration of renewable energy conversion technologies for locations in the South-South region of Nigeria with the aid of HOMER design and simulation software, and Technique for Order of Preference by Similarity to the Ideal Solution (TOPSIS) multi-criterial decision making algorithm. However, the wholly TOPSIS algorithm is somehow biased due to the diverse opinions in the generation of the criteria weighting factor. In this regard, the TOPSIS algorithm is required to be coupled with another MCDM in order to obtain objective weighting factors. The Analytic Hierarchy Process (AHP) could solve the problem of biased weighting factor according to the analysis presented in [27].
The application of renewable energy sources, namely solar, biomass and wind, for power generation has the potential to achieve sustainability, environmental friendliness, energy security and carbon neutrality. However, the focus has been largely on economic (mainly cost of energy and net present cost) consideration without the appropriate consideration of other important parameters, which are related to social-cultural, policy, technical and environment. Therefore, this paper presents an important aspect of the roadmap to renewable energy utilization in Nigeria by optimally matching hybrid renewable energy sources (solar, wind and biomass), with consideration of energy storage, along the six-geopolitical zones of the country. The emphasis is on off-grid application of renewable energy since over 40% of Nigeria population has no access to the national grid [28]. The off-grid consideration has shown to be the most viable energy access solution for poor rural communities with low energy demand, disperse settlement and rugged terrain [29,30]. However, the need to match current proven energy conversion technologies with available energy resources in the poor rural communities has not been properly investigated. In this light, a composite MCDM procedure, which coupled TOPSIS and AHP algorithms, was deployed to select a techno-economically feasible optimal hybrid system against environmental, techno-economic, socio-cultural and policy factors. The overarching aim of the work is to weigh the suitability of various optimal hybrid solar PV-wind-biomass energy systems against technical, economic, socio-cultural and environmental data using a composite multi-criterial decision analysis.

2. Materials and Methods

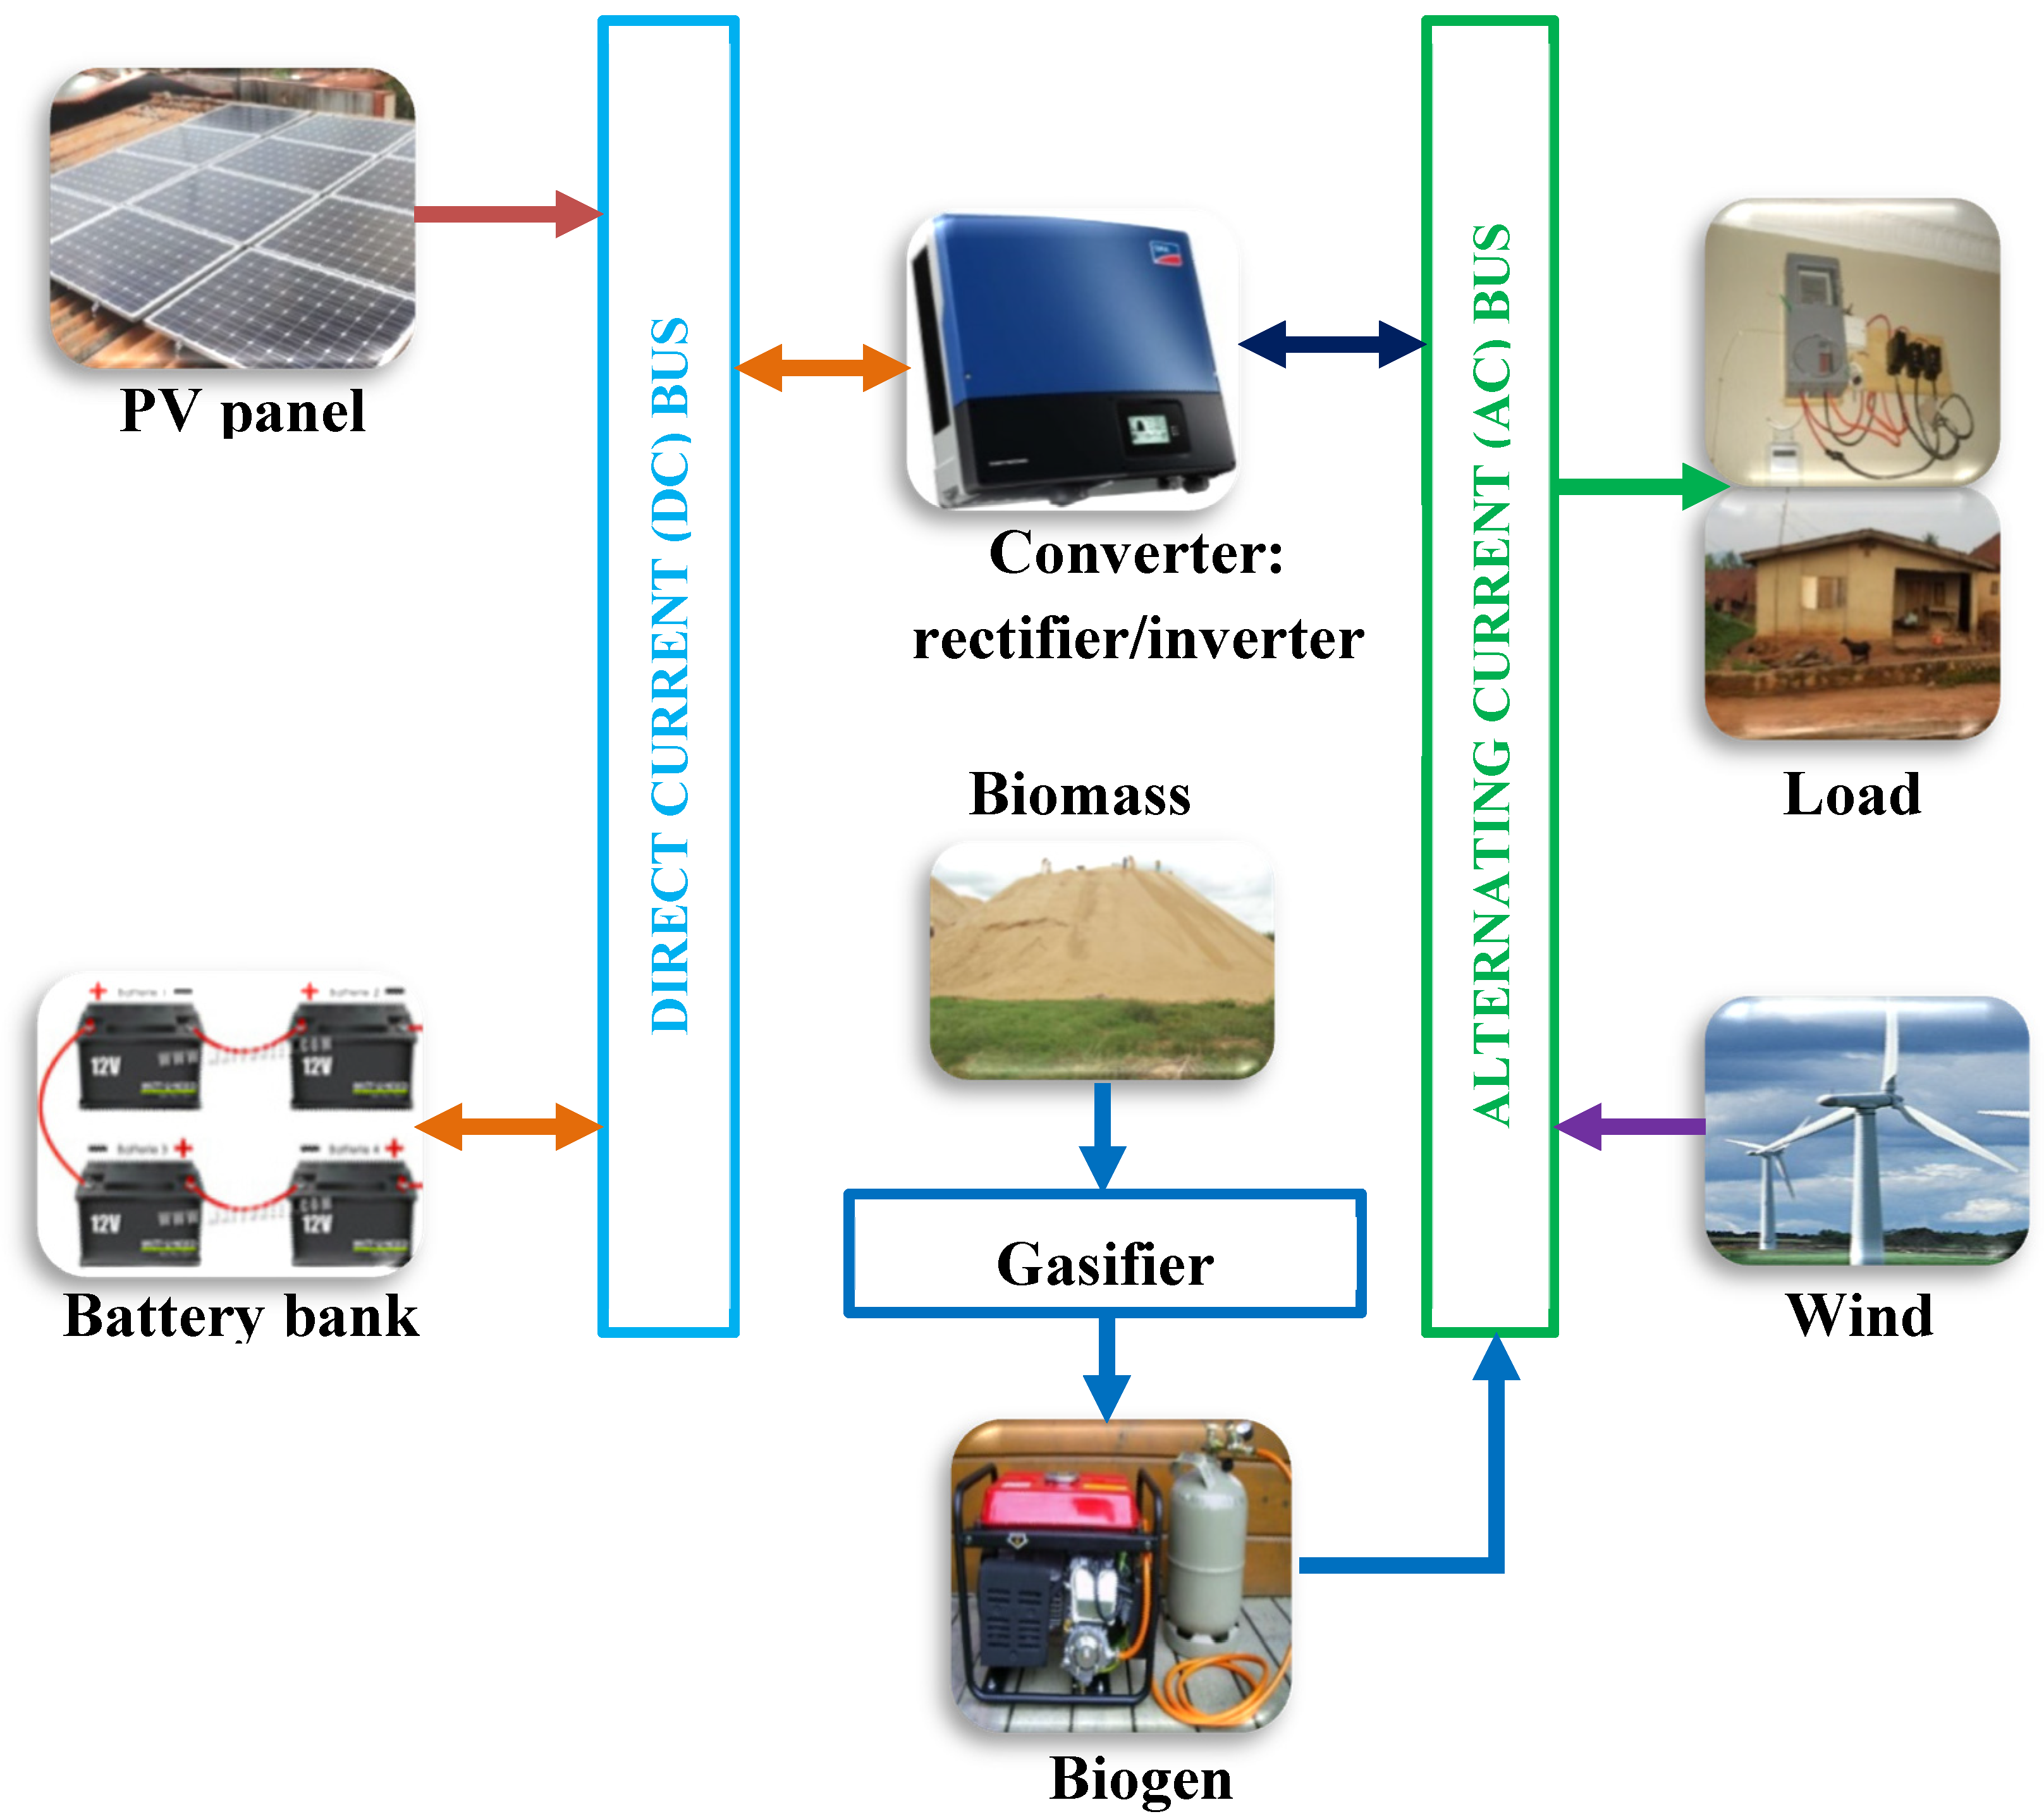
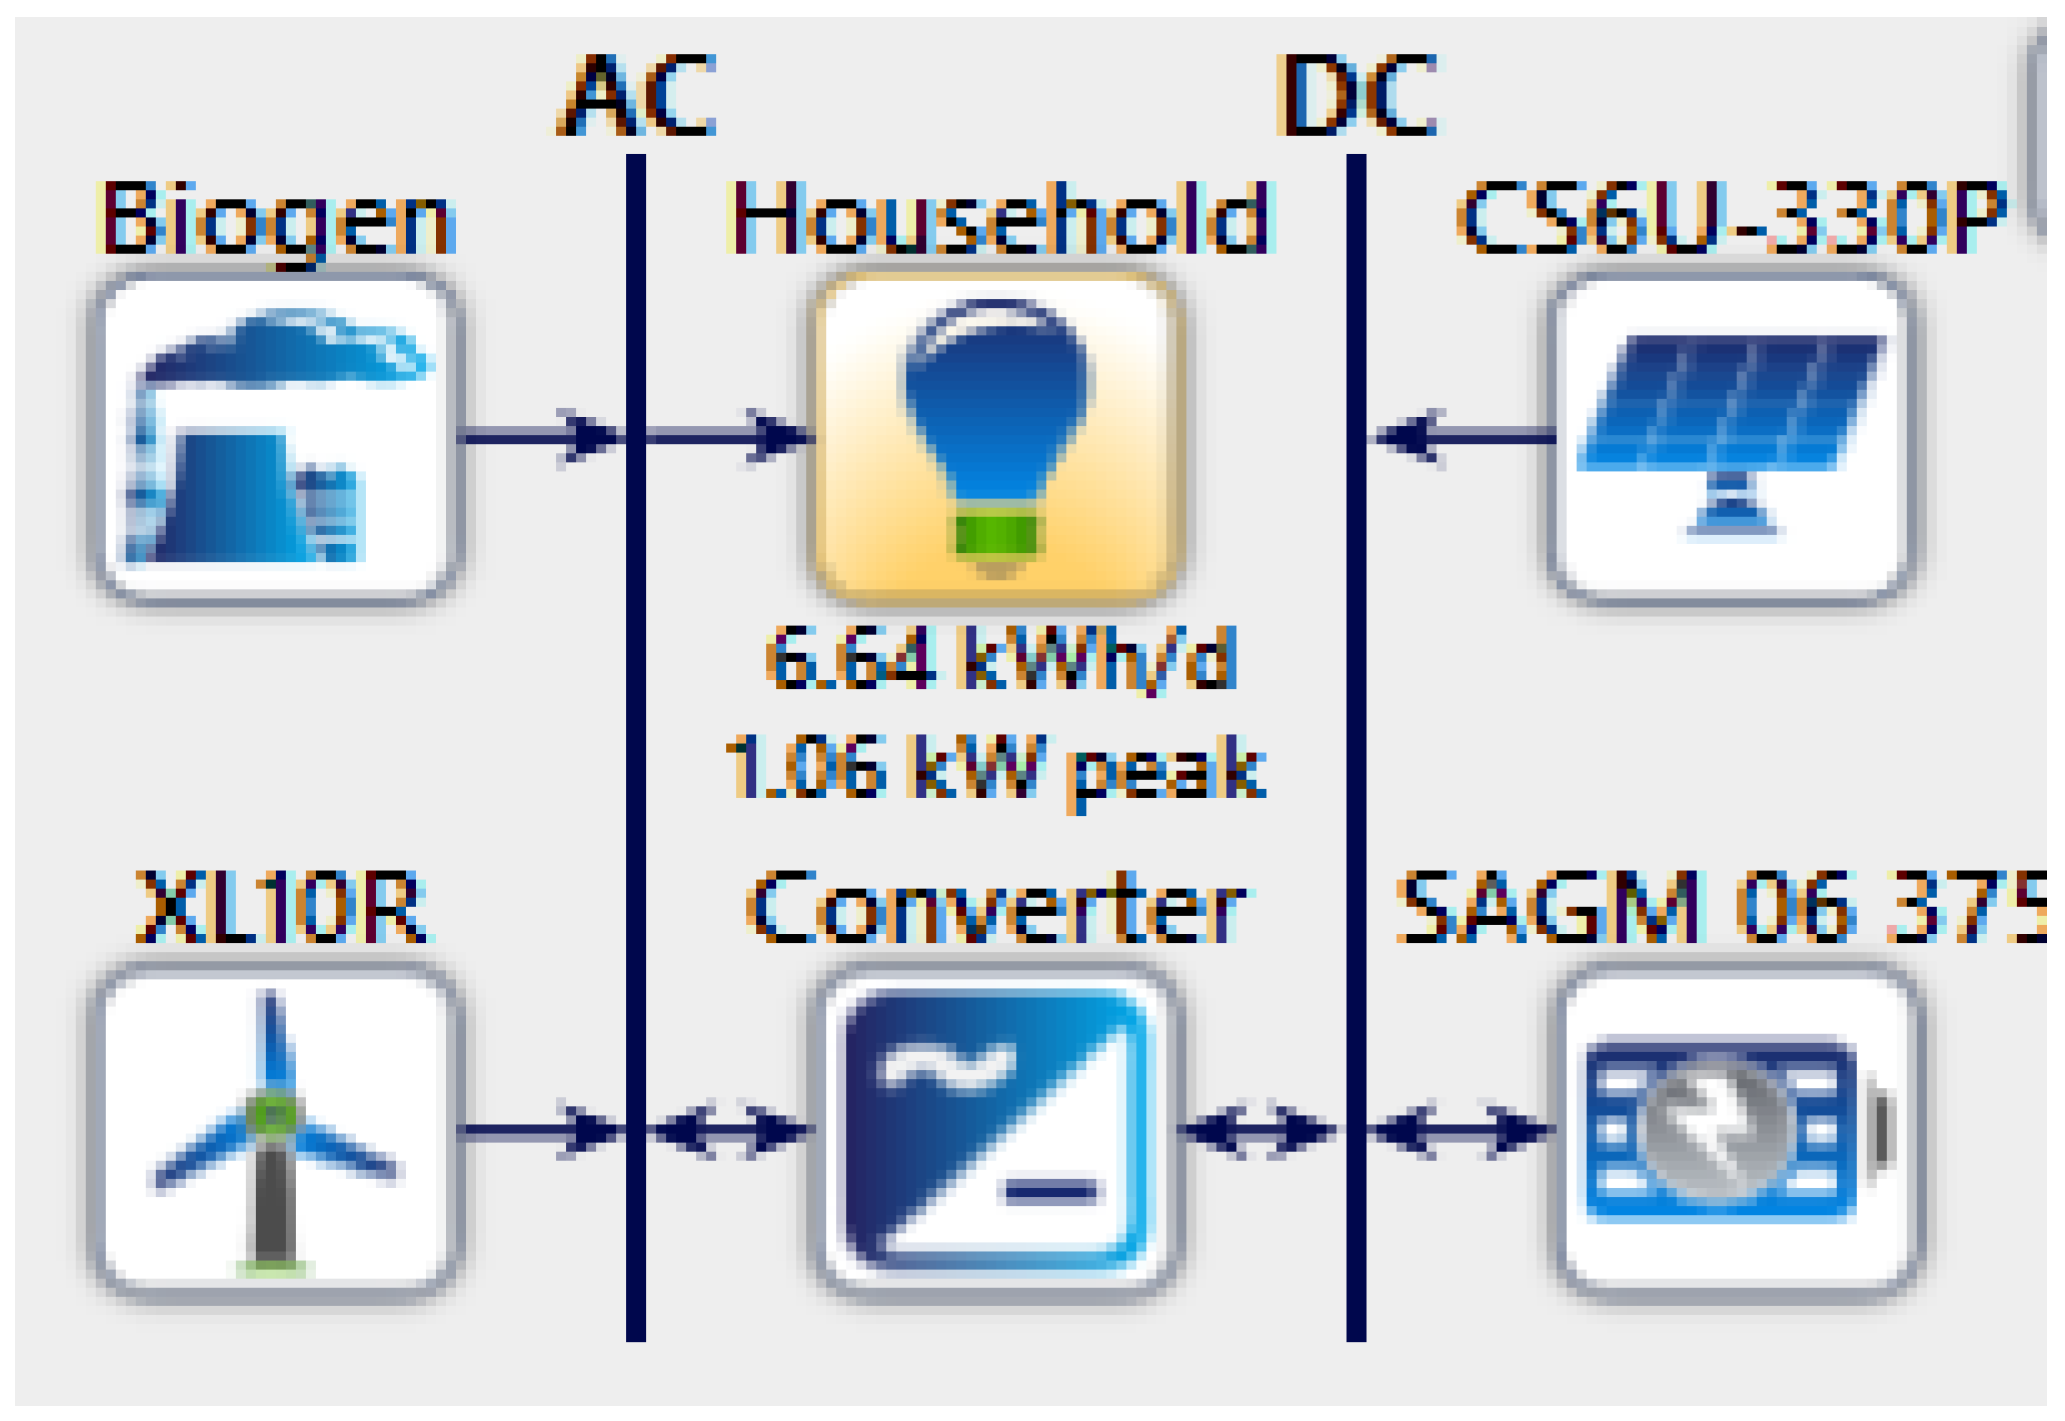
2.1. System Description

The rural communities, with dominant agricultural activities, are largely not connected to the national grid with the consequential effects of heavy reliance on crude and dirty energy sources, namely firewood, charcoal, kerosene and agro-wastes. The communities are within favourable solar and wind energy zones and, at the same time, they are burdened with fire hazards and pests from mountains of agro-wastes. Therefore, natural equity and sustainability demand that appropriate energy solutions that depend on solar, wind and agro-wastes be fashioned for the rural communities. In this regard, eight alternative off-grid energy solutions are devised to meet the energy demands of the rural communities. Figure 1 shows the hybridization of various renewable energy conversion technologies (PV, wind turbine and biogas generator), battery bank, balance-of-system and the load demand of a household. The figure could be decoupled to several configurations; biomass generator energy system (GES), biomass generator-battery energy system (GBES), PV-battery energy system (PBES), wind-battery energy system (WBES), biomass generator-PV-battery energy system (GPBES), biomass generator-wind-battery energy system (GWBES), PV-wind-battery energy system (PWBES) and biomass generator-PV-wind-battery energy system (GPWBES). These configurations serve as the basis for the current study. The eight configurations are selected based on the technical feasible configurations presented in the literature in the public domain [31,32,33,34,35] and the technology that could be supported by the available energy resources in the rural context—namely solar, biomass (agro-waste) and wind.

2.1.1. Biomass Generator-PV-Wind-Battery Energy System (GPWBES)

This hybrid system comprises all the three renewable energy sources—biomass generator, wind and solar—and battery energy storage as shown in Figure 1. The biogen (biomass generator) supplies electrical energy directly to the household load; the PV supplies energy to the battery and/or the household depending on the capacity shortage; same control reasoning applies to the wind turbine, but the excess energy (AC type) has to be converted to DC before being stored in the battery. The battery releases the stored energy, first converted to AC by the converter, during the capacity shortage.

2.1.2. PV-Wind-Battery Energy System (PWBES)

This system hybridizes the photovoltaic, wind turbine and battery bank, without the biogen. As the GPWBES case, the PV supplies DC, with the ability to supply to the battery storage and/or the load facility depending to the level of energy demand by the load facility. The output from the PV and the battery must be inverted to AC before supplying the load facility. Appropriate control method is adopted to match energy supply, generation and storage.

2.1.3. Biomass Generator-Wind-Battery Energy System (GWBES)

This hybrid configuration considers the biomass generator, wind turbine and battery bank, without the PV—only the battery is connected to the DC bus. Here, the excess energy generated is converted (rectified) to DC power and stored in the battery bank; thereafter, the energy is released to the load facility after being inverted to AC power during a capacity shortage.

2.1.4. Biomass Generator-PV-Battery Energy System (GPBES)

This involves the combination of the biomass generator, PV and battery, without the wind turbine. The PV has the capacity to supply the load energy demand and the battery depending on the favourable control condition. In this system, the biogen supplies electrical energy directly to the load, but can still charge the battery after conversion to DC during excess power generation. The stored energy in the battery bank is released to the facility after appropriate conversion (inverter).

2.1.5. Wind-Battery Energy System (WBES)

This configuration consists of the wind turbine and the battery bank, without the PV and biomass generator (biogen). The wind turbine supplies energy to the battery depending on the energy demand of the facility; only the battery bank controls the DC bus. The battery supplies the load facility during capacity shortage.

2.1.6. PV-Battery Energy System (PBES)

This configuration is a hybrid PV and battery bank standalone. Depending on the energy generation and demand, the PV directly charges the battery. The energy stored in the battery during excess energy generation is released during capacity shortage. Appropriate control mechanism for charging-discharging exists in the system.

2.1.7. Biomass Generator-Battery Energy System (GBES)

This system consist the biomass generator (biogen) and a battery bank, without the PV and wind turbine. The energy from the biogen is properly balanced against the load facility and battery bank. The battery has the capacity to solely meet the energy demand of the facility in the absence of the biogen for a pre-determined time scale.

2.1.8. Biomass Generator Energy System (GES)

This configuration is modelled along the existing supply strategy of a diesel generator—the power supply stops when the biogen goes off. However, the biogen is designed to have the same energy supply reliability as considered in the other systems.

2.2. Assessments

2.2.1. Demand Assessment

Electricity is generally required for refrigeration, lighting (especially at night), pumping of water from bore holes, hair care, laundry, cooking (electric cookers/ stoves/gas/heater) and other domestic uses. However, the focus of this work is to meet the energy demand of an average household. The hourly energy requirements for household appliances can be computed using Equations (1)–(3) according to reference [36].
E k , j = i N H P i j k N H ; j = 0 , 1 , 2 , , 23
where P ( W h ) is the energy consumed per hour, N H is the number of houses, k and i   are, respectively, the household of interest and appliance, and j is the current hour of the day.
Average energy demand per household, E ¯ j (Wh/household/day), is obtained as:
E ¯ j = k A E k j ; j = 0 , 1 , 2 , , 23
where A is the total number of appliances.
Average daily energy requirement, E m (Wh/household/day)
E m = j = 0 23 E ¯ j

2.2.2. Solar Assessment

The power output of the solar PV system is given in Equation (4) [17,37]:
P o u t = P r a t e d × f p v ( G G r e f ) × [ 1 + K T , p v ( T c T r e f ) ]
where P r a t e d ( k W ) is the PV rated power at standard test condition (STC), f p v (%) is the PV derating factor, G r e f (kW/m2) is the radiation at STC, G (kW/m2) is the global solar irradiance incident on the PV surface, K T , p v ( 1 / K ) is the temperature coefficient of the PV module, T r e f is the cell temperature at STC, T a m b (°C) is the ambient temperature and T c (°C) is the PV cell temperature, which can be estimated as [38];
T c = T a m b + 0.0256 G

2.2.3. Biomass (Agro) Assessment

The population size and average household size of the six geopolitical zones in Nigeria are presented in Table 1. These data are used to obtain the daily biomass resource per household in each of the zones.
Number of households, H A ( ) , in each zone,
H A i = P s , i H s , i ; i ( N C , N E , N W , S E , S S   a n d   S W )
where P s is the population size of zone i and H s   is the household size.
Average monthly biomass resources for zone i , B r / m ,   i ( m e t r i c   t o n n e s ) :
B r / m ,   i = B r / y ,   i N m / y
where B r / y ,   i ( m e t r i c   t o n n e s ) is the annual biomass resources for zone i   and N m / y is the number of months ( N m / y   i s   f i x e d at 12 months).
Average daily biomass resources for zone i ,   B r / d ,   i ( m e t r i c   t o n n e s ) :
B r / d ,   i = B r / y ,   i N d / y
where B r / y ,   i   ( m e t r i c   t o n n e s ) is the annual biomass resource for zone i   and N d / y is the number of days in a year ( N d / y is fixed at 365 days).
Average daily biomass resources B r / h / d ,   i ( m e t r i c   t o n n e s / h o u s e h o l d ) for each zone i is given as:
B r / h / d ,   i = B r / d ,   i H A , i
The biogas cogeneration system is a biomass-to-electricity system. First, the biomass resource fed into the biogas system is converted to biogas through biomass gasification. The gas is subsequently converted into electricity in a biogas generator. HOMER can calculate the biomass consumed to generate electrical energy from the gasification ration. The value of 0.05 was adopted for the gasification ratio, which compares the amount of gas generated to the amount of biomass feedstock supplied to the gasifier [19].

2.2.4. Wind Assessment

Two major methods used in finding the wind energy potential are the probability distribution function (mostly used) and the values measured at meteorological stations. Weibull distribution, an example of a probability distribution, is considered appropriate for wind data analysis due to its simplicity and flexibility [11]; and can be presented as:
f p ( v ) = k c ( v c ) k 1 e ( v c ) k
where k ( ) is the shape factor, c ( m / s ) is the scale factor and v ( m / s ) is wind speed.
The Weibull’s cumulative distribution function may be expressed as:
f c ( v ) = 1 e ( v c ) k
Adopting the standard deviation method, the Weibull factors can be obtained as [13]:
k = ( σ v ¯ ) 1.086
and
c = v ¯ Γ ( 1 + 1 k )
where v ¯ ( m / s ) is the mean speed and σ ( ) is the standard deviation, which can be computed, respectively, as
v ¯ = 1 N i = 1 N v i
and
σ = [ (   1 N 1   i = 1 N   ( v i v ¯ ) 2 ) ] 1 / 2
The optimum wind speed, v ¯ o p ( m / s ) , can be computed as [12]
v ¯ o p = c ( 1 + 2 k ) 1 / k
The power extracted from the wind turbine, P (W), is estimated as
P = 1 2 ρ A v ¯ o p 3
where ρ ( kg / m 3 ) represents density, approximately 1.225 (kg/m3) [11], and A   ( m 2 ) is the rotor blades sweep area (m2).
Wind power density, P ¯ (W/m2), is expressed as [40]:
P ¯ = 1 2 ρ c 3 Γ ( 1 + 3 k )

2.2.5. Cost Assessment

Biomass generator: The Generic biogas genset (size-your-own) at a fuel consumption rate of 0.65 m3/kWh was adopted for the biomass generator. The estimated initial and replacement cost are both $500/kW, whereas the O&M cost is set at approximately $0.015 per year. The system life span is 15,000 h. Another parameter considered in modelling the generator was the fuel curve, which entails the power output against unit fuel consumed, as shown in Figure 2—this was derived from HOMER. The generator is fuelled by the biogas derived from the biomass through the gasification process. The process of biomass conversion to biogas is embedded in HOMER software.
PV array: CanadiaSolar MaxPower CS6U-330P (solar PV) comes in 0.315 kW, 0.320 kW, 0.325 kW and 0.330 kW nominal maximum power. A CanadiaSolar MaxPower CS6U-330P with a maximum power of 330 W, an operating temperature of 45 °C, temperature coefficient −0.41 of the polycrystalline module was used for the analysis. It has a high density and offers an excellent module efficiency of 16.97%. The initial, replacement and, operation and maintenance costs were estimated at $2100/kWp, $1400/kWp, $100/year, respectively. The derating factor is 88% and the expected lifespan is estimated to be 25 years.
Converter: Generic system converter, which embodies the controller, the rectifier and the inverter, is adopted. The initial and replacement costs are both $300/kW and efficiency can be adopted as 95%, with a life span of about 15 years.
Wind turbine: Bergey Excel 1-R with a capacity of 1 kW was considered. It is adequate for low speed wind, with 2.5 m/s cut-in wind speed, and off-grid applications. Its initial and replacement costs are $3000/kW and $2600/kW, respectively, with operation and maintenance cost of $50/year. The expected life span of the wind turbine plant is assumed to be 20 years.
Battery: Trojan SAGM 06375, with a nominal voltage of 6 V, nominal capacity of 2.46 kWh, maximum capacity of 409 Ah, a capacity ratio of 0.536, rated constant of 0.376 per-hour, efficiency of 85%, maximum charge current of 75A, the maximum discharge current of 300A and maximum charge rate of 1 A/Ah, was adopted. The capital and replacement costs are $300 and $240, respectively. The battery life span was estimated at 5 years.
Financial analysis: Real interest rate adopted for this work is 9%, which is the mean real interest rate in Nigeria from 2007 to 2016 [41], and is considered appropriate under the nations stable economy [11,12,13,14,15,16,17,18,19,20,21,22,23,24,25,26,27,28,29,30,31,32,33,34,35,36,37,38,39,40,41,42]. The project lifespan is considered to be 25 years which is within the range of data presented in the literature, 20–30 years [43]. The value of 10% was adopted for the loss of load probability.

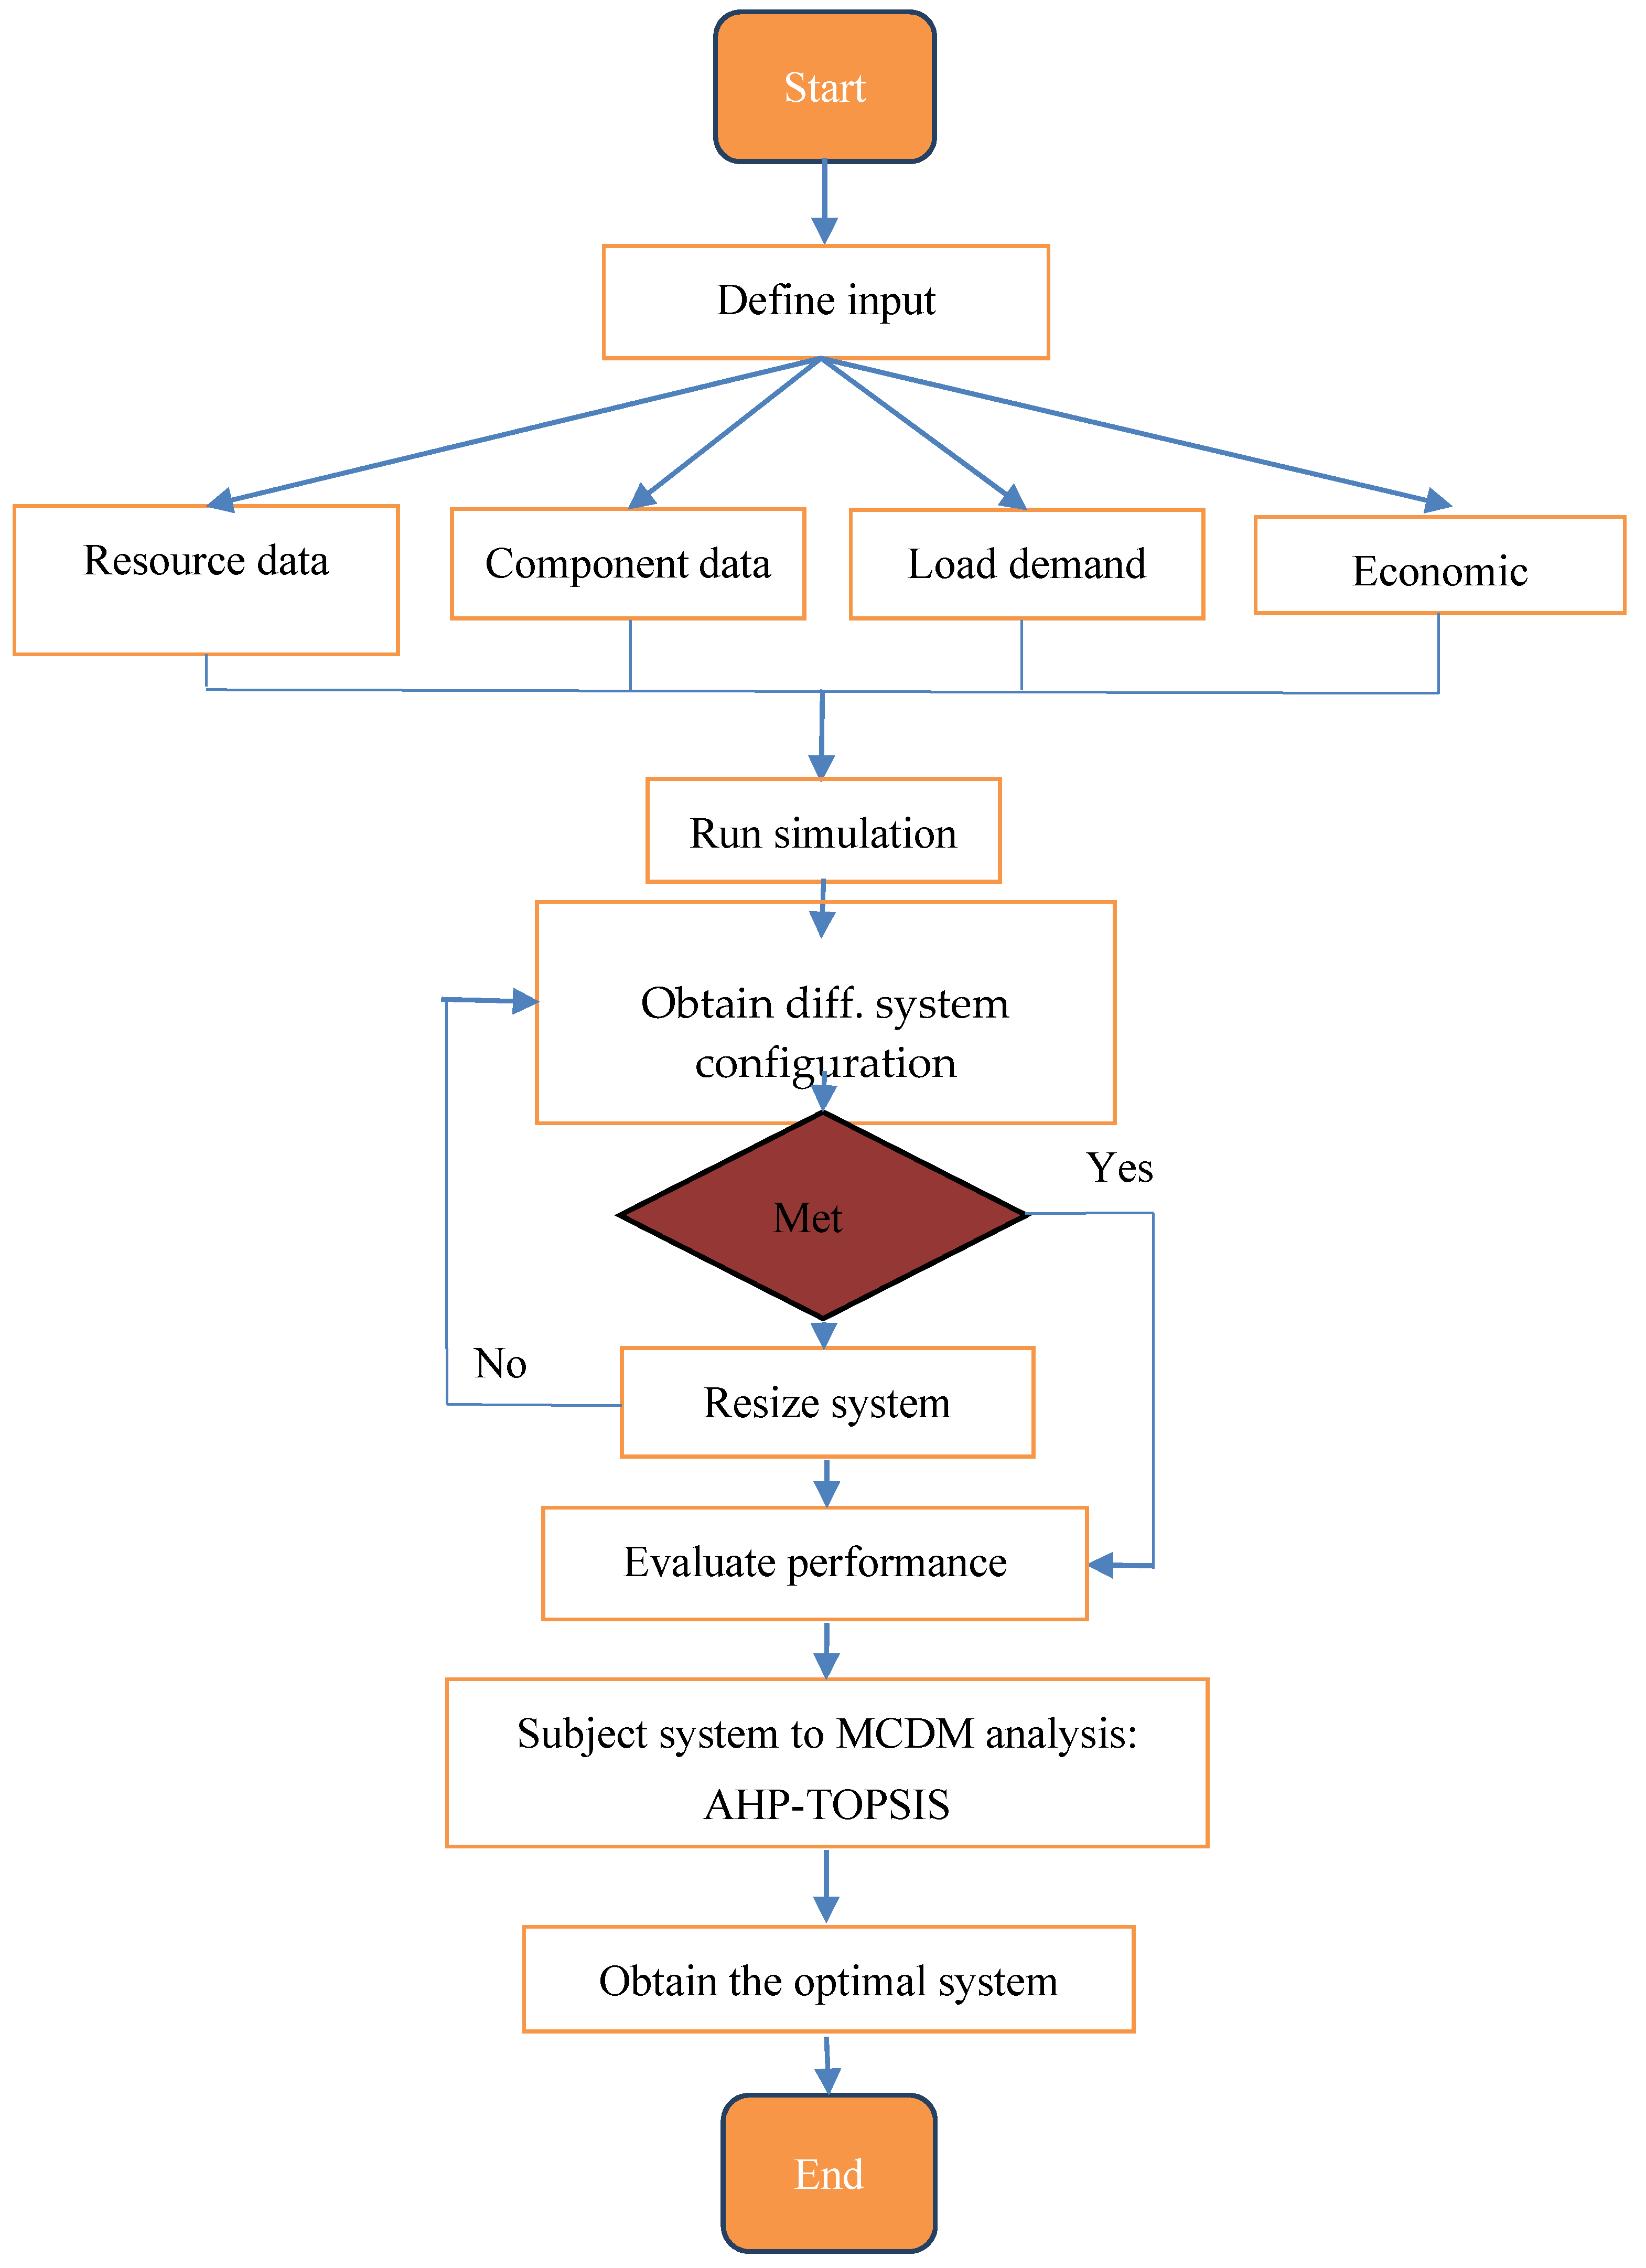
2.3. System Optimization

The HOMER (Hybrid Optimization Model for Electric Renewable) software developed by US NREL, Golden, CO, USA, for standalone energy application was used to obtain the optimal configuration, alongside a composite multi-criteria decision analysis procedure. The choice of HOMER for the current study was predicated on its computational efficiency, its high fidelity in the off-grid industry and its suitability for alternative hybrid energy systems analyses. In fact, HOMER software dictates the world’s micro-grid simulation software for optimal techno-economic design and analysis of off-grid and/or on-grid energy systems [44]. The propose energy demand, renewable energy resource data (solar insolation, wind speed and biomass tonnage) and the system cost data serve as input in the HOMER platform. Results from HOMER platform and other relevant data related to sustainability, techno-economic and clean power generation serve as the input data in the composite MCDM algorithm.

2.3.1. Homer Analysis

HOMER software has been observed to be user friendly [19]. It uses hourly simulations and environmental data for the assessment of the hybrid renewable energy system and performs optimization based on Net Present Cost. The system configuration consists hydro, wind and agro-waste turbine, PV arrays, batteries, inverter, charge controller and balance-of-system, as shown in Figure 3; however, the system could be devolved into other seven configurations enumerated in Section 2.1. HOMER gives the most suitable configuration on balancing energy demand and supply simulation [45]. In balancing the energy demand, the load demand, the systems control, resources, cost, components details, the constraints, and the emission data are balanced through the net present cost (NPC), as the objective function, with the consideration of the battery bank and other techno-economic constraints. The PV module’s life is considered to be the system life [46].

2.3.2. Multi-Criteria Decision Making Analysis

Multi-criteria decision analysis is applied in order to ascertain the best system configuration [11]. The decision is centred on environmental, techno-economic, socio-cultural and policy criteria for the diverse zones in Nigeria. The Technique for Order Preference by Similarity to Ideal Solution (TOPSIS) is among the appropriate MCDMs that has found satisfactory applications in the energy sector [20,21,22]; and it has been demonstrated to be efficient in distributed energy and power generation systems [23,24,25,26]. TOPSIS multi-criteria decision analysis is simple and robust [47]. However, the wholly TOPSIS algorithm is somehow biased due to the diverse opinions in the generation of the criteria weighting factor. In this regard, the TOPSIS algorithm is required to be coupled with another MCDM in order to obtain objective weighting factors. The Analytic Hierarchy Process (AHP) could solve the problem of biased weighting factor according to the analysis presented in [28]. Therefore, TOPSIS and AHP procedures are hybridised to play a complementarity role—a procedure that is adopted for the present analysis. Before applying the TOPSIS analysis, the weight factor is first obtained using pair-wise comparison matrix method based on the AHP algorithm, which is the basis of the current composite analysis. Based on the level of importance (LOI) of each criterion to the project, the number 1 7 are assigned to the criteria representing; very very high (VVH), very high (VH), high (H), moderately high (MH), moderately low (ML), low (L) and very low (VL) in that order. The composite MCDM analysis is based on the Algorithms 1 and 2. Algorithm 2 (the AHP) is coupled to Algorithm 1 (the TOPSIS) through the generation of criteria weighting factors.
Algorithm 1. The TOPSIS Algorithm.
  • State the criteria ( m ) and the alternatives ( n ) , respectively, i = 1 , 2 , ,   m and j = 1 , 2 , ,   n
  • Construct the decision matrix, C , and weight of criteria, D (obtain from Algorithm 2)
    where, C = c i j ; is the element of the matrix in the i -th column and j -th row. D = [ d i ] a weight vector, where i = 1 m d i = 1 ;
  • Obtain normalized matrix R ;  R = { ( r i j ) } c i j ( i = 1 m c i j 2 ) 1 / 2
    where: r i j is elements of normalised matrix
  • Compute weighted normalized matrix, V ;   V = { v i j } R × D
    where v i j is elements of weighted normalised matrix
  • Determine A + and A ideal solutions;
         A + = ( v 1 + , , v i + ,   , v m + ) = { ( max j v i j | i ϵ P ) , ( min j v i j | i ϵ N ) }
         A = ( v 1 , , v i ,   , v m ) = { ( min j v i j | i ϵ P ) , ( min j v i j | i ϵ N ) }
    where P is positive criteria; N is negative criteria.
  • Calculate relative distance by applying ‘Euclidean metric’ from the + and ideal solutions
    Relative distance from + ideal solution,   S j + ;
         S j + = i = 1 m ( v i + v i j ) 2 ; j = 1 , 2 , , n
      Relative distance from   ideal solution,   S j
         S j = i = 1 m ( v i v i j ) 2 ; j = 1 , 2 , , n
      Calculate each alternative relative proximity to the ideal solution
       L j = S j s j + + S j ; 0 L j 1 ,               j = 1 , 2 , , n
  • Obtain optimum solution.
Algorithm 2. Determination of Weight Factors by AHP.
Step 1:
  • Specify the criteria m and form a matrix ( m × m ) ; i = 1 , 2 , ,   m
  • Assign the number; j = 1 , 2 , ,   7 in the order of importance of criteria ( m ) to the project, where the elements in the matrix are characterized in i -th column and j -th row.
  • Produce the corresponding transpose j = 1 , 2 , ,   7 and insert in i = 1 , 2.. , 7
  • Generate the rest data in the matrix C ; where C = c i j is the element of the decision matrix residing in the i -th column and j -th row
Step 2:
i.
Obtain the normalize matrix R ;   R = { ( r i j ) } c i j i = 1 m c i j
where r i j are elements of normalised matrix
v.
Produce the average weighting factor for each criterion by taking the average in j -th row;
d j = i = 1 m r i j m
Step 3:  Check for correctness of the produced weighting factors;
  • Obtain p = i = 1 m r i j × w j
  • Obtain q = p
  • Permissive Error (E) = C I / R I 0.1 ; where C I = ( p n ) / ( n 1 ) and R I is obtained from a table based on the m value.

2.3.3. Computational Algorithm

Figure 4 shows the flow chart of the computational procedures. Information regarding the load, solar radiation, wind, power generated capacity and the market price of various hybrid systems are required. All input parameters are fed into the HOMER software to obtain the optimal systems; the alternatives. Then, the outcomes of the system configuration and other criteria are fed into the MCDM to obtain the best configuration for each geo-political zone.

3. Results and Discussion

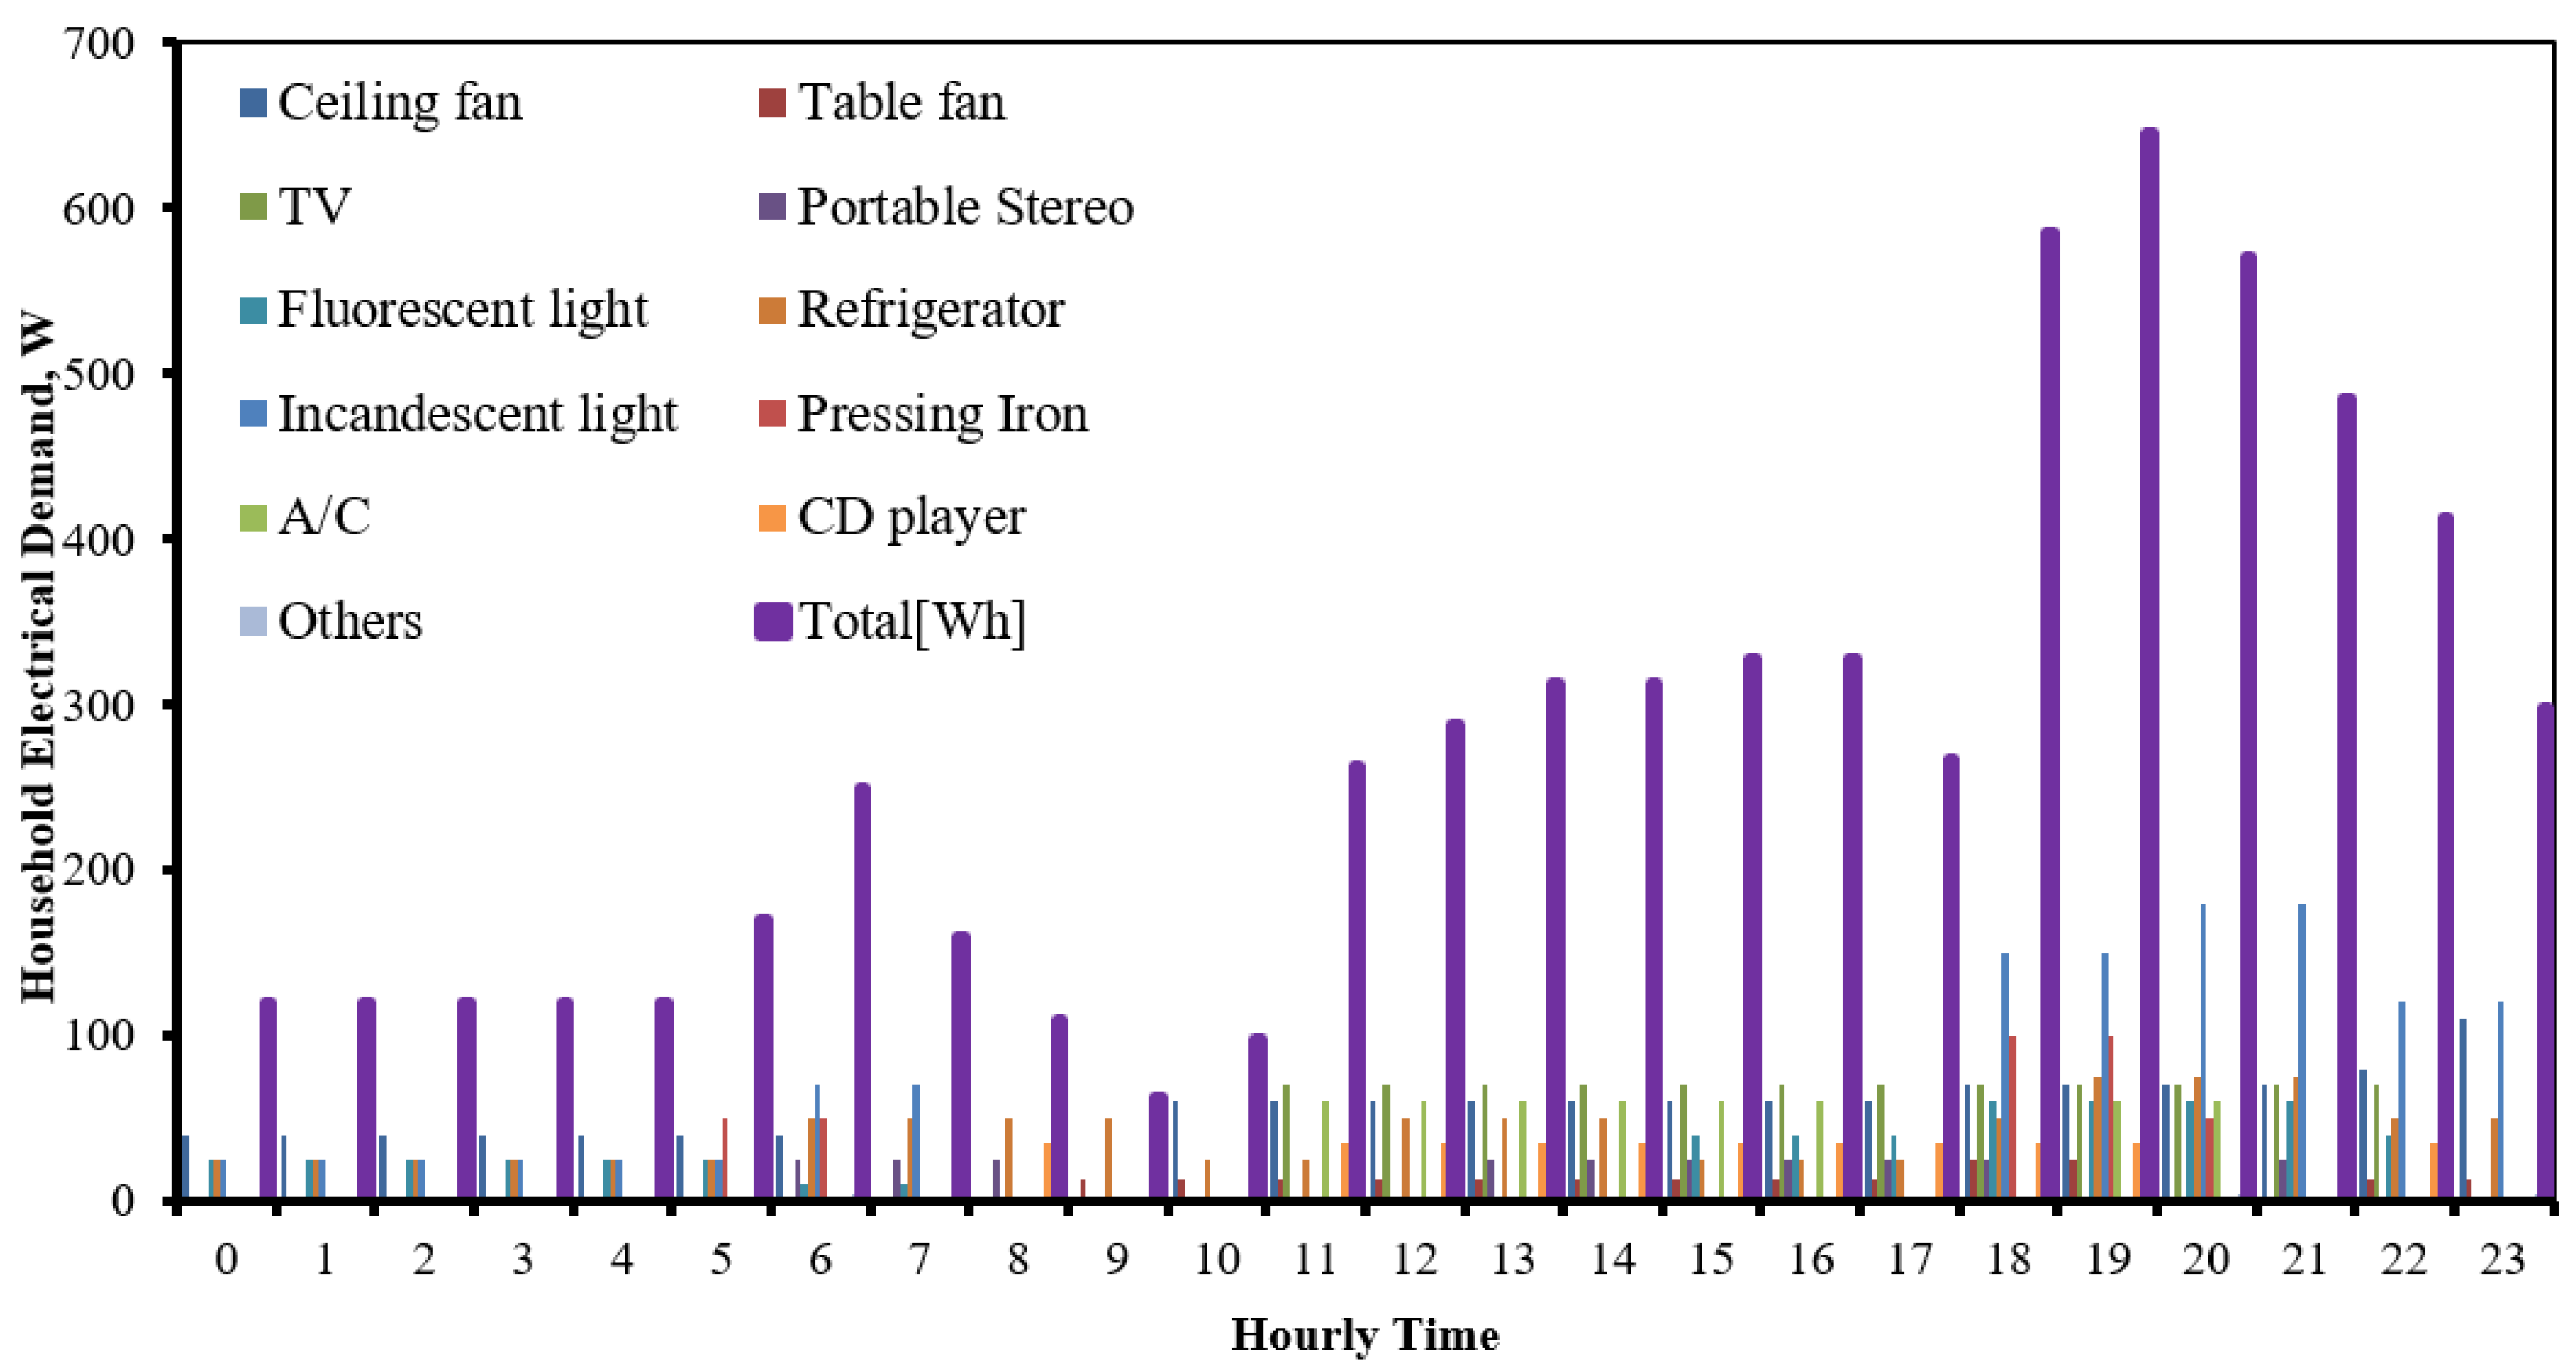
3.1. Energy Demand Profile
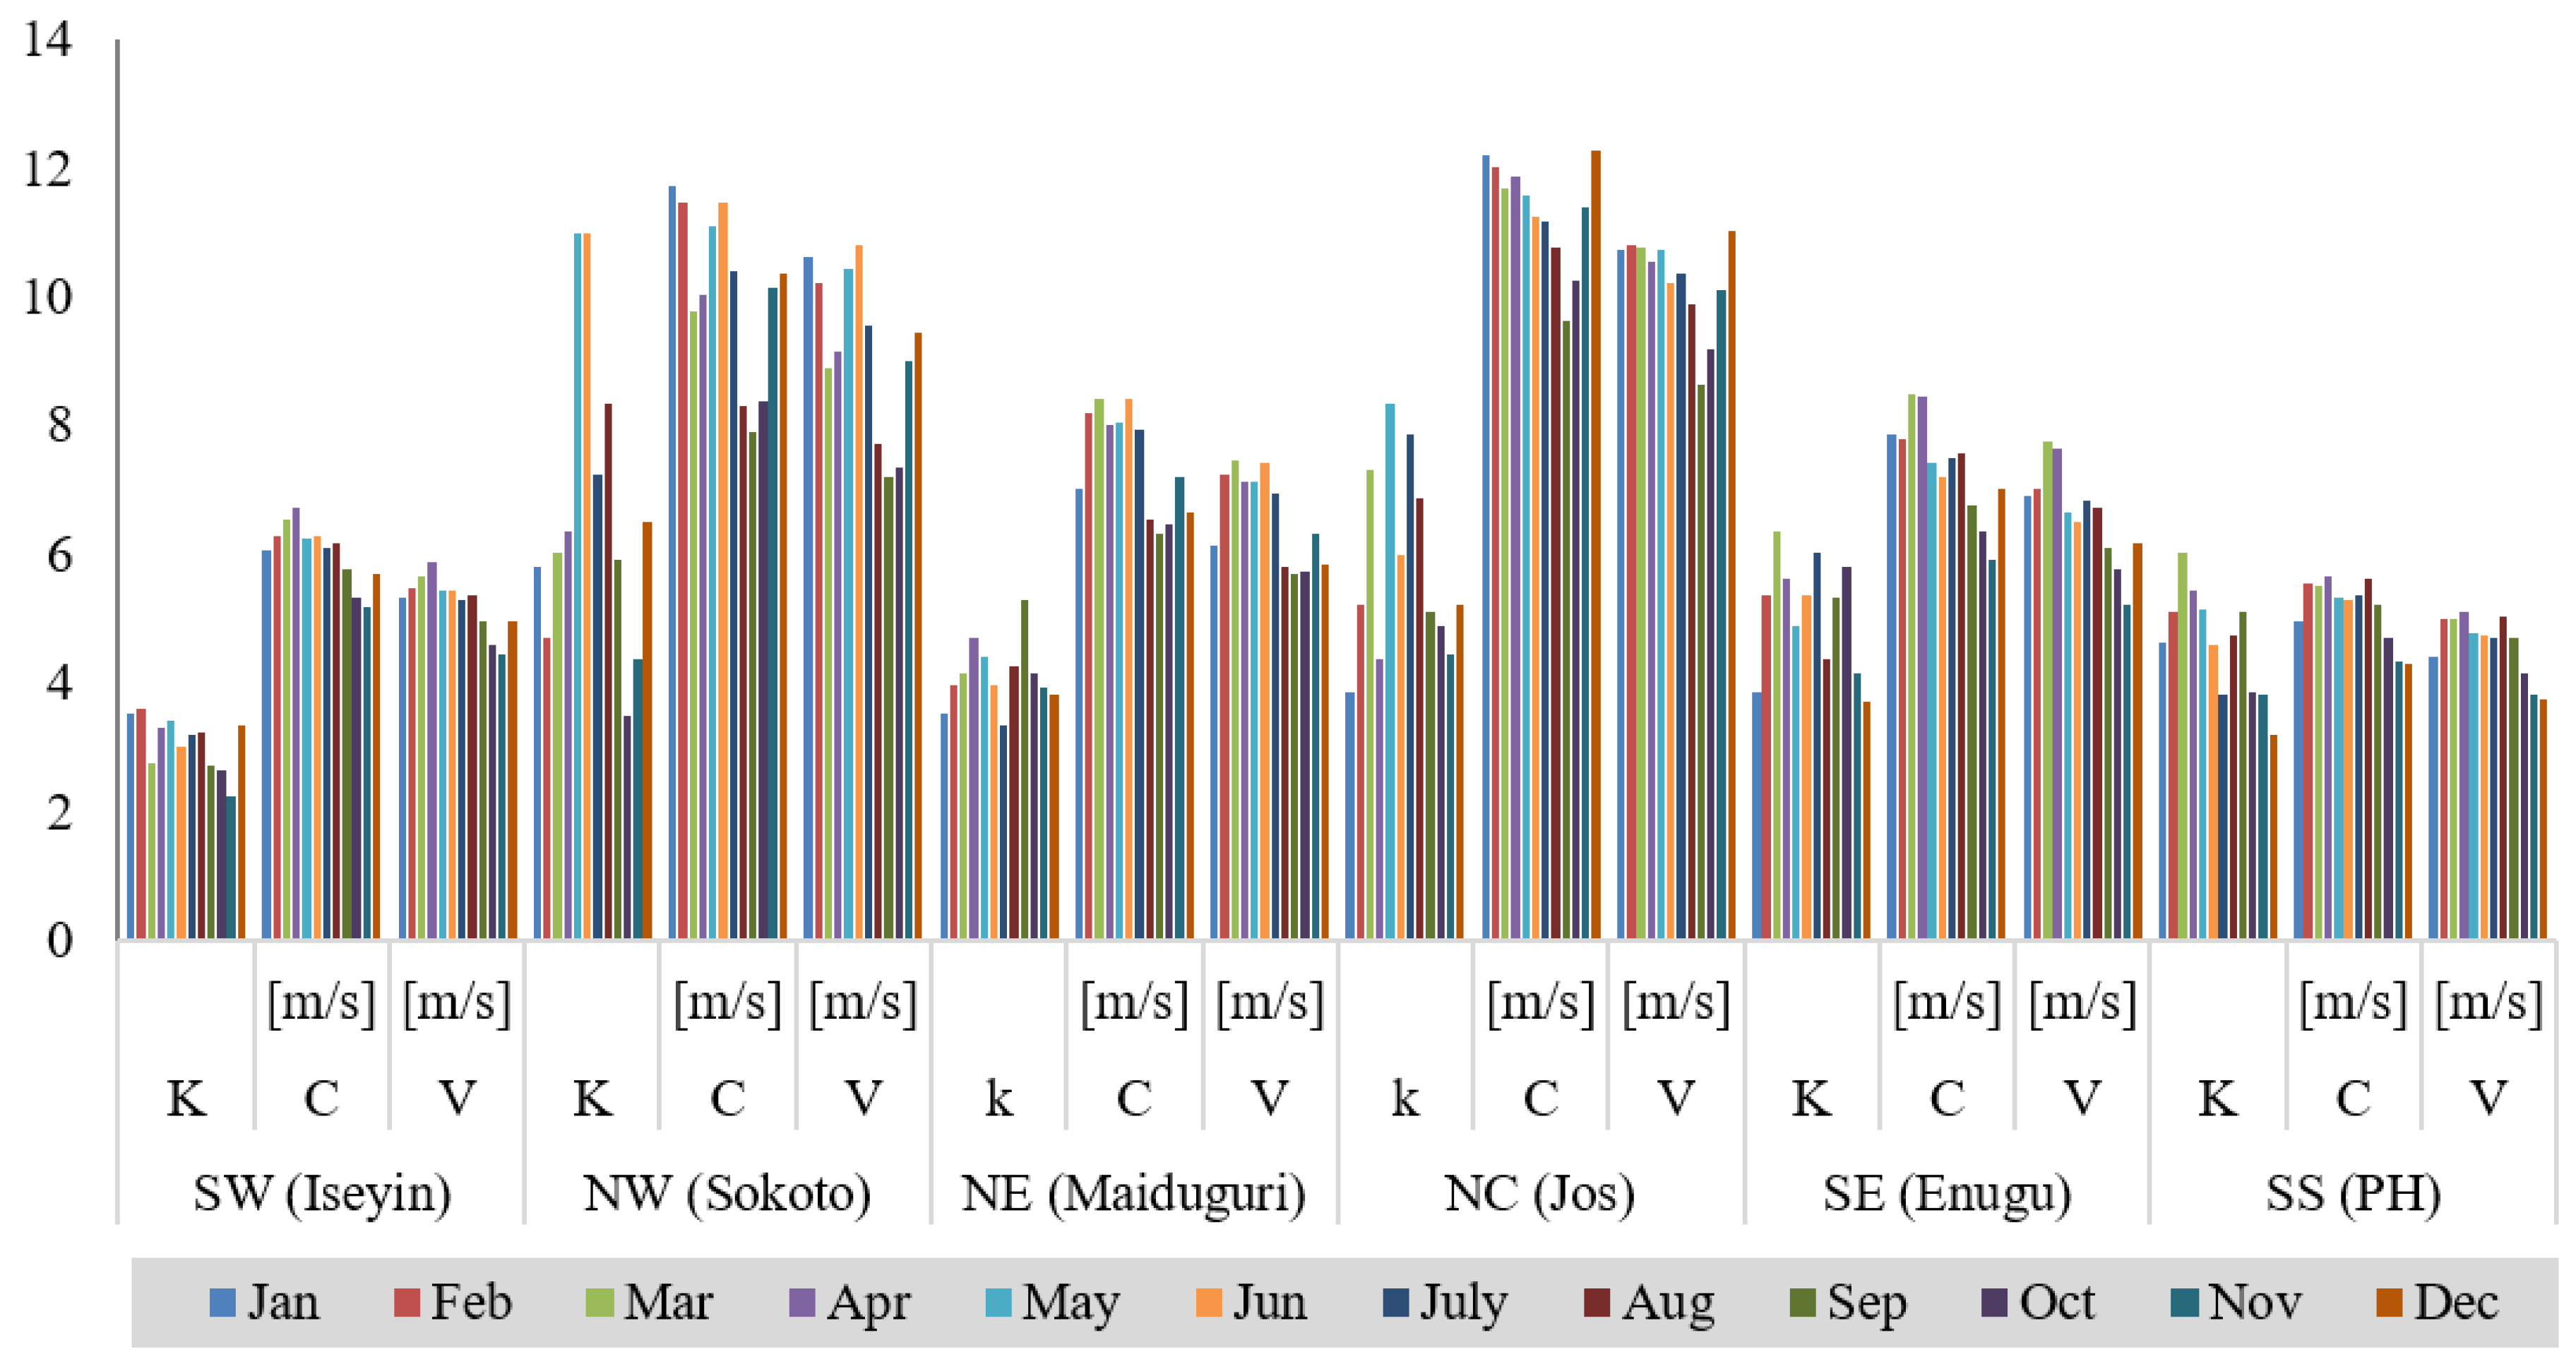
The energy demand estimate carried out by reference [36] was adopted in this study as shown in Figure 5. Uniform energy demand is assumed across the geopolitical zones in Nigeria. It is widely seen that electrical appliances such as; refrigerators, air-conditionals, fans and others have less use during the raining season than in dry season, as a result of low temperature difference. Hence, 20% seasonal variation has been assumed to accommodate this fluctuation, leaving the daily energy demand estimate for a typical household at 6.64 kWh/da, with twenty-four hours electrification. Figure 5 serves as the household load profile data in the HOMER platform.

3.2. Wind Data

A wind turbine generates electricity when wind flows across the turbine blades at a minimum wind speed, the cut-in speed. Mechanical work is first produced as the turbine blade turns and, thereafter, electricity is generated due to the shaft connected to the alternator. The wind speed data were obtained from the Nigeria Meteorological Agency (NiMET) at a hub height of 10 m for airport like locations and complimented with satellite data from NREL database, which has been proved sufficient for locations in Nigeria [48]. Figure 6 shows the extrapolated monthly averaged wind-speed and Weibull factors across the geo-political zones in Nigeria at hub height 30 m. From the figure, wind speed, v (m/s), and scale parameter, c ( m / s ) , across the geopolitical zones in the country are maximum in the North-central zone (11.035 m/s and 12.266 m/s, respectively) in December and minimum in the South-South zone (3.741 m/s and 4.304 m/s, respectively) still in December, while the shape parameter k ( ) is maximum in the North-West zone (11.001) in May and minimum in South-West (2.238) zone in November. The annual mean wind speed potential is observed to be highest in NC, followed by NW, SE, NE, SW and SS, in that order.
Table 2 shows the annual average wind speed, Weibull parameters and power density in Nigeria at 30 m and 50 m hub heights. From the table, it can be observed that the average monthly wind speed and scale parameter are both maximum and minimum in February and October, respectively, with annual average values of 7.0795 m/s and 7.9040 m/s, respectively, corresponding to a height of 30 m; and 7.7893 m/s and 8.7734 m/s, respectively, corresponding to a height of 50 m. The table also shows that the power density, P ( W / m 2 ) , is maximum and minimum in the months of February and September, respectively, with annual average values of 455.86 W/m2 and 599.71 W/m2, at heights of 30 m and 50 m, respectively. It can also be seen that the wind-speed, Weibull factors and power density increase with the hub height, which is expected because the higher the altitude the higher the wind velocity. The data in Table 2 serve as the wind resource data in the HOMER software platform.

3.3. Solar Data

Input data for solar resources in the representative locations of each of the geopolitical zones are presented in Table 3. These data were obtained from the National Renewable Energy Lab database, National Solar Radiation Database, cell number: 472281; cell dimensions: 40km×40km; cell midpoint latitude: 8.03; cell midpoint longitude: 3.630561.
From the table, it can be seen that the NC zone has the highest average global solar radiation of 6.00 kWh/m2/day, with a peak value of 6.601 kWh/m2/day, observed in the month of April and a least value of 5.027 kWh/m2/day observed in the month of August. The SS has the lowest average global solar radiation of 4.380 kWh/m2/day, with a peak value of 4.923 kWh/m2/day, observed in the month of February and least value of 3.546 kWh/m2/day, observed in the month of July. In all the zones, SE has the least global solar radiation of 3.385 kWh/m2/day, observed in the month of July while NC has the highest global solar radiation of 6.601 kWh/m2/day observed in the month of April. The dry season, October to April, shows the highest global solar radiation, which corresponds with most literature on global solar radiation in the various months of the year [10]. The solar energy is viable for solar PV utilisation in all the zones of the country. The data in Table 3 serve as the input data for solar resource in the HOMER software platform.

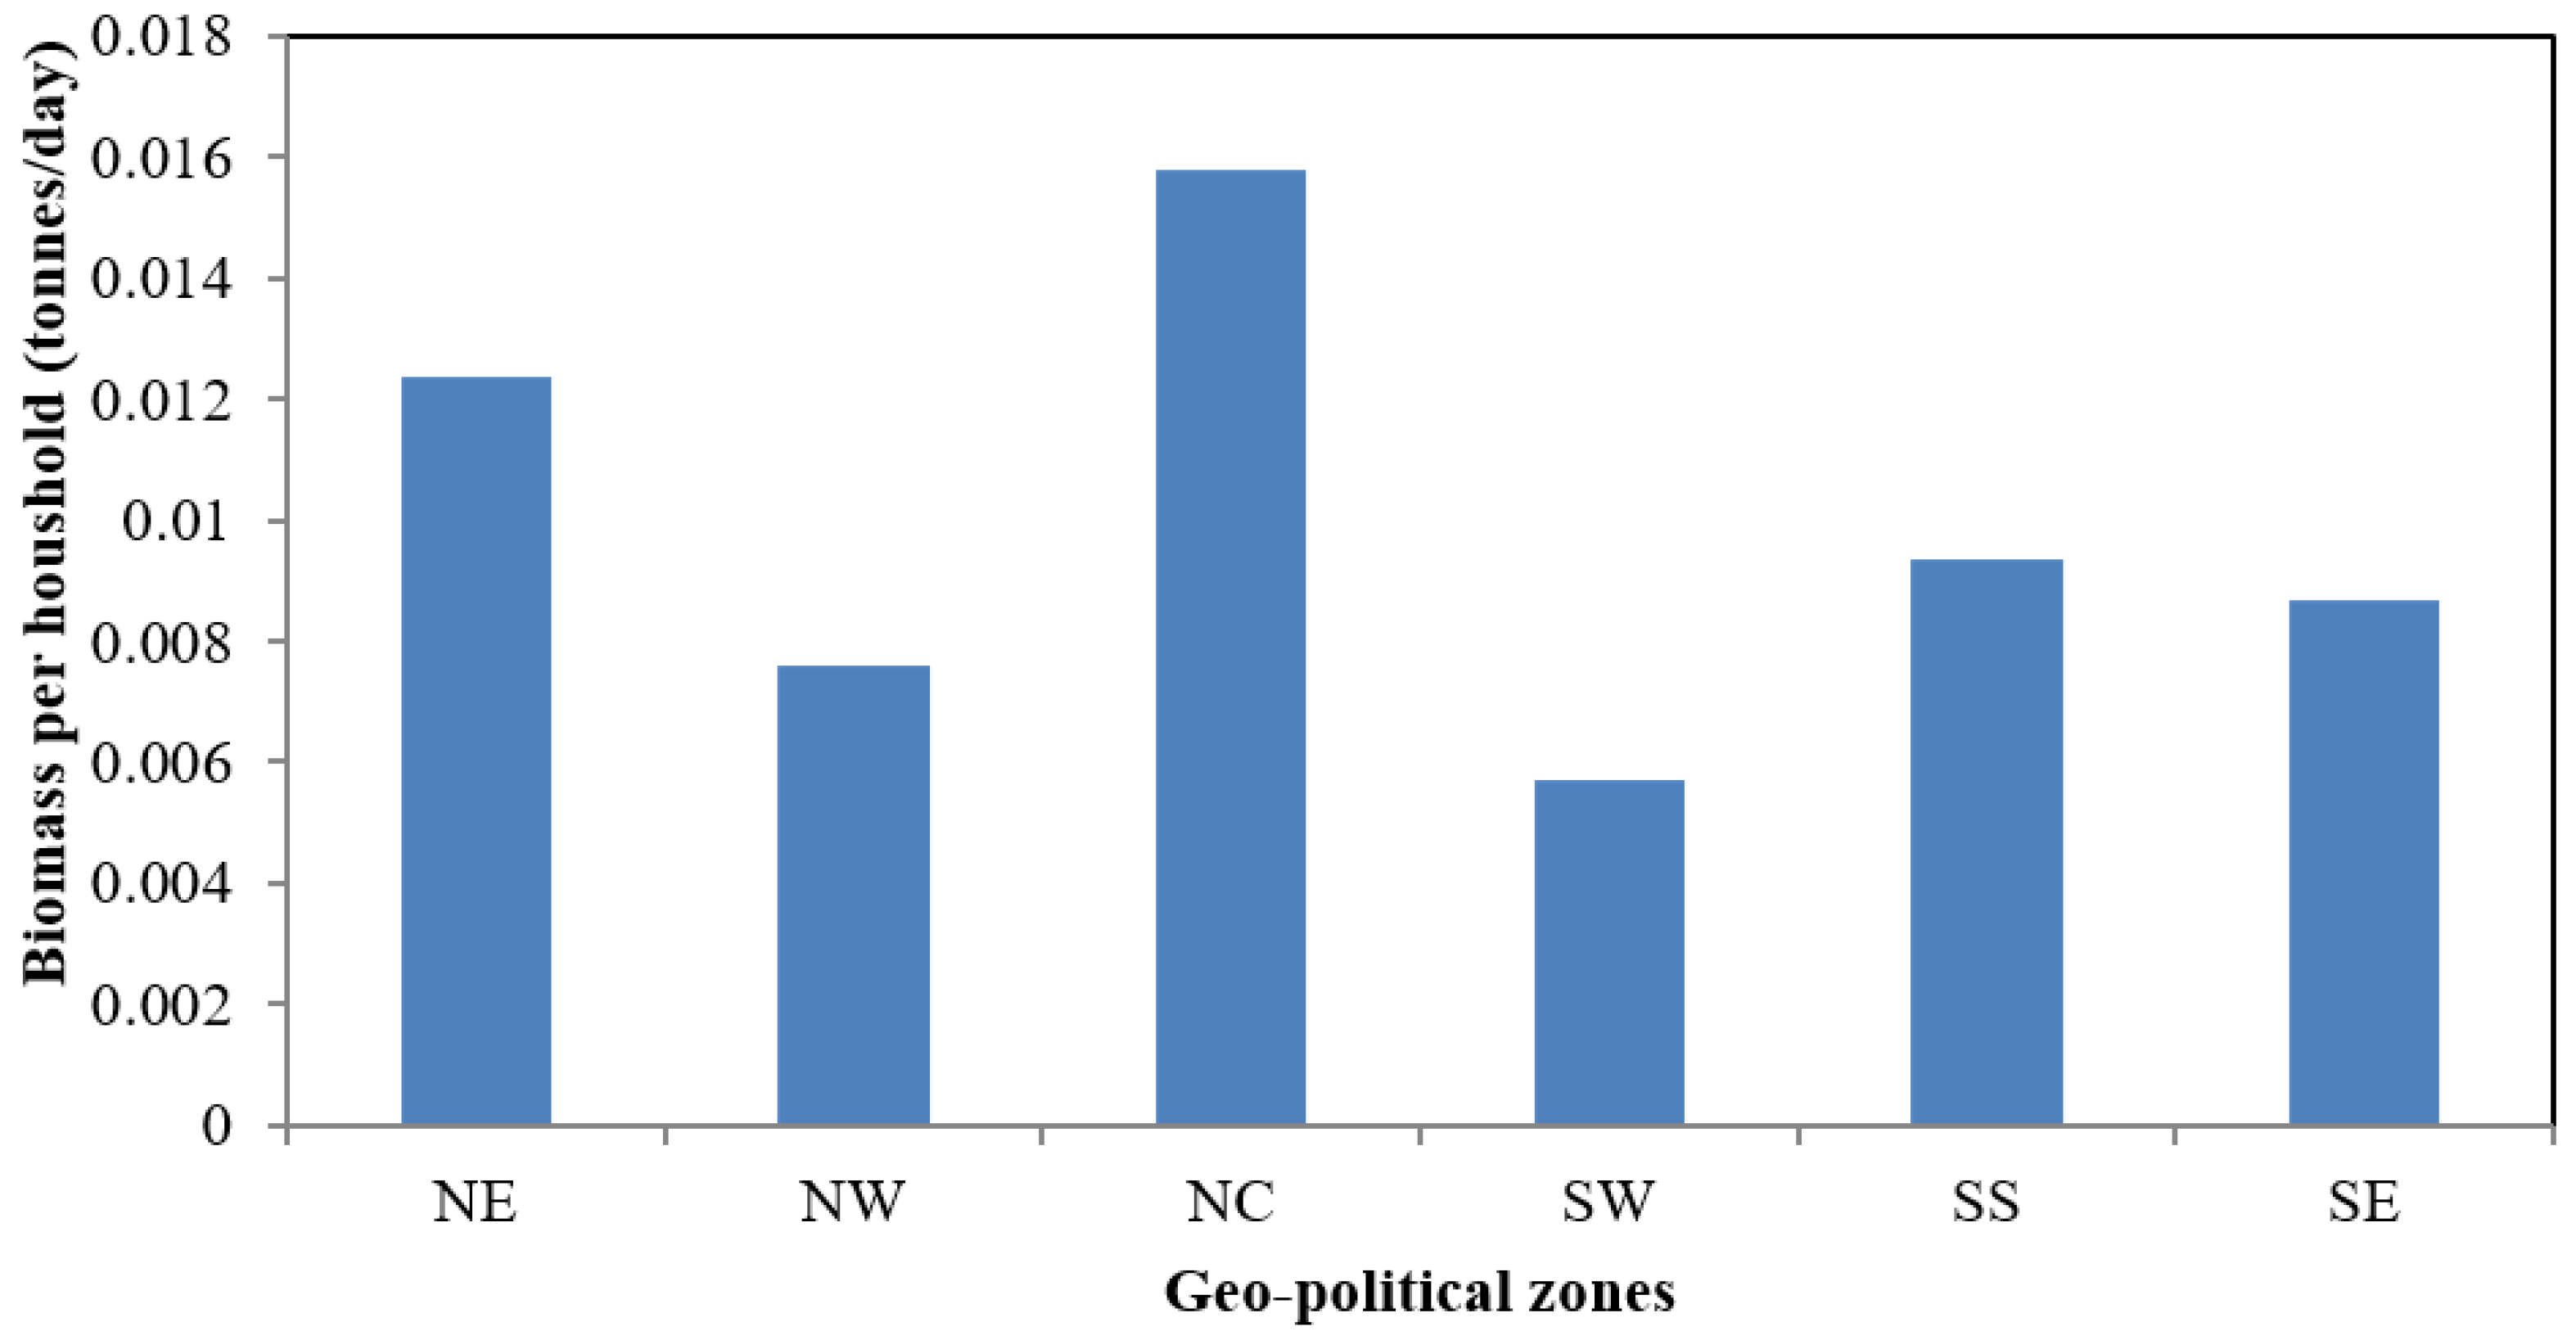
3.4. Biomass Data and Analysis

Table 4 shows the total number of households and biomass resources in various geopolitical zones in Nigeria. The total biomass (agro-waste) resources in the country, estimated as 111,840,170 metric tonnes with NC and NE having the highest and least agro resource of 26,026,300 and 13,604,750 metric tonnes, respectively. Table 4 is obtained based on the information presented in Table 1, and the total major agricultural crops production in Nigeria in the year 2010 [49]. The data for agro-waste presented in Table 4 could be considered as very conservative because agricultural production has seen increase in recent times; however, the data are adequate for first approximation.
The daily biomass (agro) resources per household for each of the geopolitical zones are shown in Figure 7. NC is seen to have the highest daily biomass resource of 0.0158 metric tonnes per household. Regardless of having the second largest biomass resource per year, SW has the least daily biomass (agro) resource per household. This can be attributed to its high population density (36 million persons) and low average household size (4 persons per household) in the country. It should be noted that in estimating the biomass resources per household, there was no distinction between rural and urban households. Therefore, the estimated biomass (agro-waste) per household is a conservative estimate for the rural communities, which is adequate for first approximation analysis because the agro-waste generation is prominent in the rural communities.
Table 5 shows the geographic locations of the selected sites in the geopolitical zones, their average annual global solar radiation, wind speed at hub height 50 m, biomass resources per household and temperature. The annual average temperature for the selected sites in the different zones ranges from 24.25–26.97 °C with NC (Jos) is having the lowest temperature and NE (Maiduguri) is showing the highest temperature. Annual biomass resources generation per household ranges between 2.1–5.78 metric tonnes, with NW is having the lowest and NC is having the highest biomass resource potentials. The average wind speed for the year at hub height of 50 m falls within the range of 5.17 to 11.11 m/s with SS (Port Harcourt) and NC (Jos) are having the lowest and highest wind speed, respectively. The average global solar radiation is within the range of 4.38–6.00 kWh/m2/day, with SS (Port Harcourt) and NC (Jos) having the lowest and highest solar radiation, respectively. The table further reveals that NC zone has the highest annual average renewable resource potential as considered in this work, while, SS has the least renewable energy resources potential, except in the case of the biomass resources.

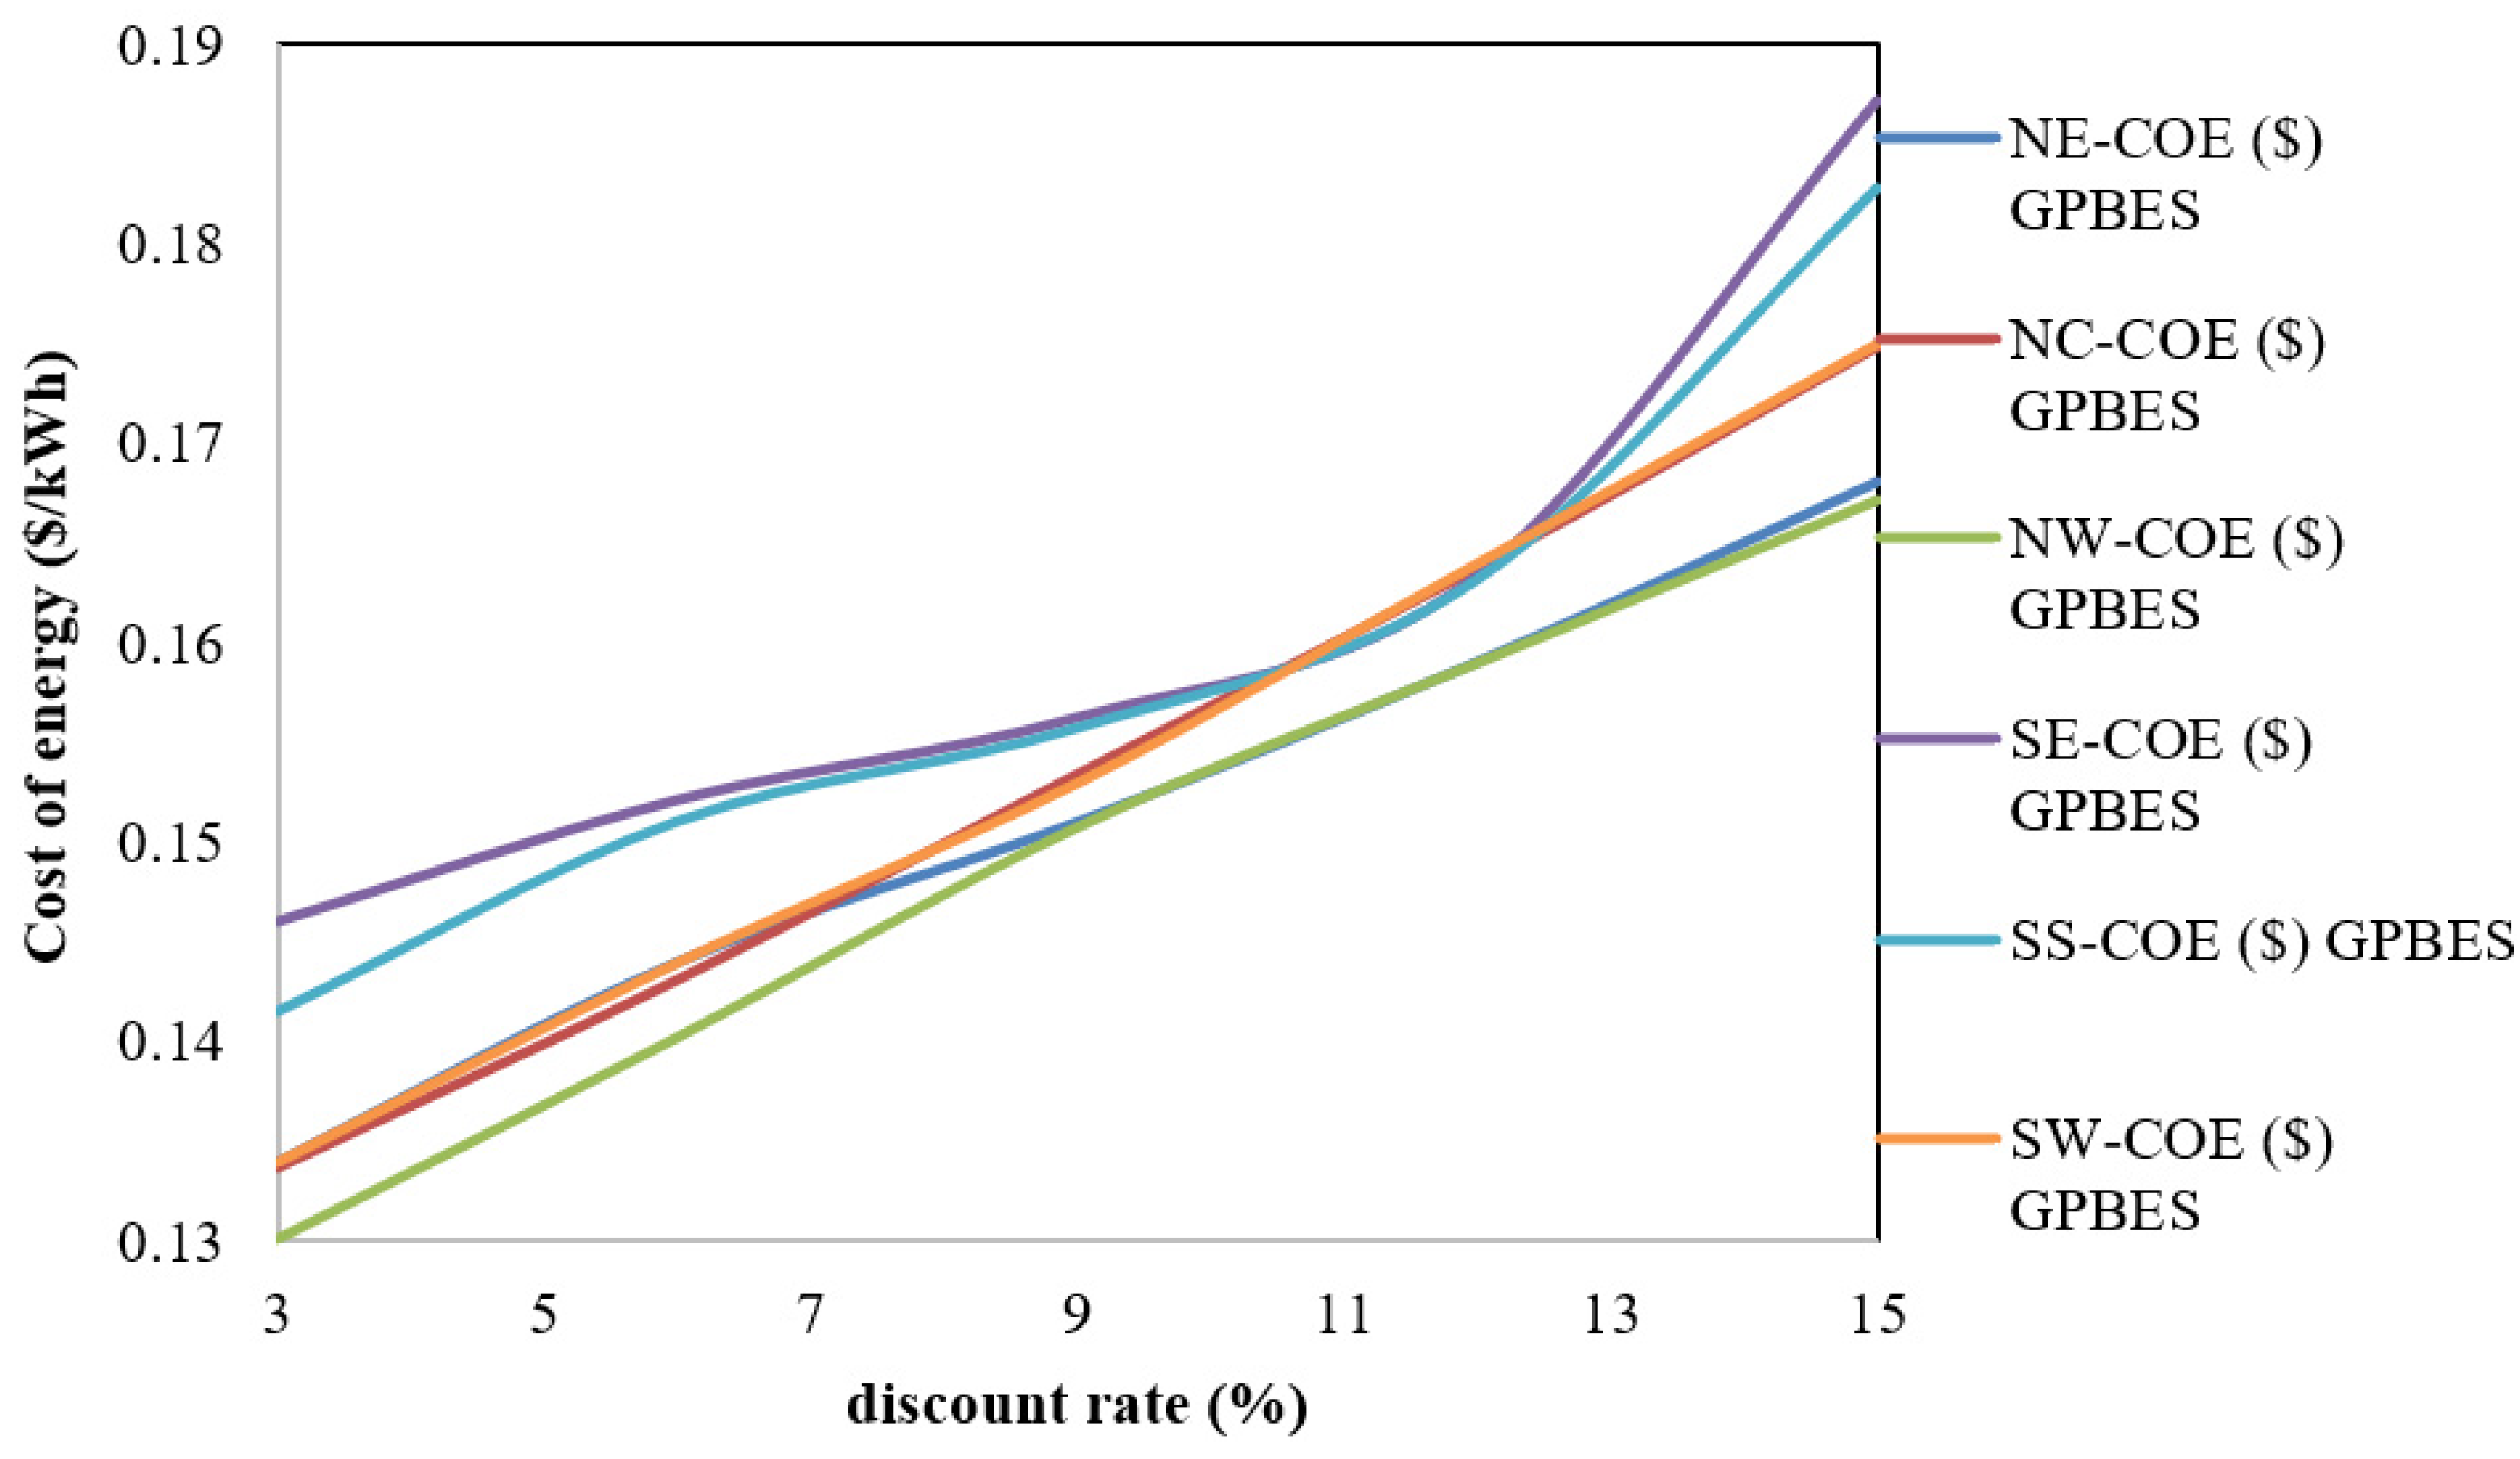
3.5. Optimum System Configuration

HOMER simulation platform was used to carry out the sizing of the eight energy systems—GES, GBES, PBES, WBES, GPBES, GWBES, PWBES and GPWBES—along the six geo-political zone. The energy demand, renewable energy resources and cost assessment make up the input data for the HOMER computation. Wind speed extrapolated data to a hub height of 50 m from wind characteristic data, solar parameters presented in Table 3 and the daily biomass (agro) resources per household for each geopolitical zones presented in Figure 7, were used in the HOMER software. The output data obtained from HOMER are used as the first eight criteria presented in Table 6 while the remaining criteria are obtained from experts and other literature [11]. Techno-economic analysis of some of the hybrid systems that feature biomass did not consider the cost of gathering the biomass; however, the outcome is sufficient within the scope of this study.
To begin the TOPSIS MCDM analysis, the weighting factor of the criteria is first determined using the AHP based algorithm. The MCDM phase analysis depends on the output data from the HOMER analysis and expert judgement from literature in the open domain. Table 7 gives the weights of the criteria considered, and is obtained using the Algorithm 2. It is thus used to form the decision matrix for each of the geo-political zones. The criteria imposed on the composite MCDM analysis are: (a) economic: initial cost (IC), O&M (OM) cost, NPC, COE and COF (cost of fuel); (b) environment: environmental impact (EI) and CO2 release; (c) technical: unmet load (UL), technology readiness (TR) and ease of installation ease (EoI); (d) resource availability: solar (SA), wind (WA) and biomass (BA) availability; (e) system life cycle (SC) and (f) socio-cultural awareness (SA). Table 6 shows the pairwise comparison data, which starts the AHP algorithm phase. The data were obtained from the HOMER analysis and expert judgement from literature in the open domain. The final decomposition of the data presented in Table 6, using the AHP Algorithm 2, gives the criteria weights presented in Table 7. The data in Table 7 serve as the weight factor for the TOPSIS analysis, the Algorithm 2.
The combination of Table 7 and the initial decision matrix presented in the Table A1, Table A2, Table A3, Table A4, Table A5 and Table A6 using the step iii in Algorithm 1 gives the normalized decision matrix. Thereafter, follow through Algorithm 1 to obtain the data presented in Table 8. Table 8 shows the + and ideal solutions for the different system configurations in each geo-political zone in the country, obtained by passing through Algorithm 1, which is based on the TOPSIS analysis procedure.
Table 9 gives the various system configurations and how close they are to the ideal solution of one. The data in Table 8 were further processed to obtain Table 9 following through Algorithm 1. It is observed that the first three hybrid system configurations are closest to the ideal solution, in the order of GPBES, GES and GBES, which imply, respectively, the first, second and third most optimum system configuration for all the zones (selected sites) in Nigeria. This shows that biogas (obtained from biomass resources) is a good substitute for diesel, which is the conventional source of thermal power generation in Nigeria. It can also be seen that all the configurations in NC zone, (aside PBES), fall above average in terms of closeness to the ideal solution, hence, are suitable for energy generation. However, the best three in their order remains GPBES, GES and GBES, respectively. The WBES, PWBES, and GWBES come 4th, 5th and 6th optimal system configuration for NE, NW and SW zones, respectively. The GPWBES, WBES and GWBES come 4th, 5th and 6th optimal configuration respectively for SE zone, while the GWBES and GPWBES come 4th and 5th optimal configuration for the NC and SS zones. The PBES stands as the least system configuration for all the zones except for SE zone where PWBES is the least. Furthermore, all the system configurations are environmental friendly and have low O&M cost.
Table 10 shows the design parameters for the optimal hybrid renewable energy system configuration (GPBES) in Nigeria. The energy consumption in the optimal system configuration is approximately 2424 kWh/year per household. The data (the converter capacity) suggest that the control mechanism is such that the battery bank releases its stored only in the low energy demand periods.
Table 11 shows the pertinent economic and environmental data for the hybrid renewable energy system in each geopolitical zone. The cost of energy (COE) generation was seen to be within the range of 0.151–0.156 US$/kWh. This is more economical when compared to the existing electricity cost from the national grid and previous studies in the open domain, where the cost of energy generation ranges from 0.459–0.911 US$/kWh [10,11,50]. The difference in COE can be attributed mainly to the use of biogas in place of diesel and the difference in load demand. This shows that Nigeria can meet rural household energy demand, if biomass (agro-waste) is properly harnessed for electricity generation. The proposed system has the potential of absorbing CO2 from the atmosphere, which is very important to climate change mitigation.
Figure 8 shows the effect of discount rate on cost of energy (COE). From the figure, the COE increases with discount rate for all the zones. The SE has the highest COE, while NW has the lowest COE at each discount rate. The implication is that the Federal Government of Nigeria favourable energy policy towards the adoption of biomass-to-electricity system would make the proposed system very affordable.

4. Conclusions

The energy landscape in Nigeria requires an urgent solution since the access is very poor and the conventional power generation has been dominated by environment impeding fossil fuels. The rural community is mostly affected by the acute shortage of energy in the country; however, the rural community is burdened with heap of agro-wastes that could be utilised for power generation. The literatures in the public domain show that the system optimisation alone cannot wholly drive energy access. The implication is that there is a need to combine optimisation at the system level and optimisation at the decision level. Therefore, a composite multi-criteria decision analysis of optimised solar-wind-biomass energy system for application in rural household is presented. Eight renewable energy systems are derived from solar, wind and biomass, with energy storage, to meet the energy demands of average households in the six geopolitical zones of the country. The resource assessments show that the solar insulation, wind speed (at 30 m hub height) and biomass in the country range, respectively, from 4.38–6.00 kWh/m2/day, 3.74 to 11.04 m/s and 5.709–15.80 kg/household/day, which serve as the input data. The HOMER software was used to obtain optimal configurations of the eight energy systems alongside the renewable energy resources in the six geopolitical zones. The eight optimal systems were further subjected to a multi-criteria decision making (MCDM) analysis, which considers technical, economic, environment and socio-cultural criteria. The TOPSIS, coupled with AHP, algorithm was adopted for the MCDM analysis. It became imperative to combine TOPSIS and AHP in the current analysis in order to have more objective criteria weighting factors. In all the eight system configurations considered, the biomass generator-solar PV-Battery energy system (GPBES) was the best system for all the geopolitical zones. The best system has the potential of capturing carbon from the atmosphere, an attribute that is desirous for climate change mitigation. The cost of energy (COE) generation was seen to be within the range of 0.151–0.156 US$/kWh, which is competitive with the existing electricity cost from the national grid and less than previous studies in the open domain, where the cost of energy generation ranges from 0.459–0.911 US$/kWh. The economic analysis does not consider the cost of gathering the biomass and the estimated agro-waste/household may be too conservative for the rural communities that are dominated by agricultural activities; however, the outcome is sufficient within the scope of this study and adequate for first approximation. The low COE obtained is associated with the cheap biomass-to-electricity technology adopted in the current analysis. It is shown that the Federal Government of Nigeria favourable energy policy towards the adoption of biomass-to-electricity system would make the proposed system very affordable to the rural dwellers. One possible way to advance the observation is for the policymakers to formulate or reinforce the existing energy policies to ensure import duty waver for the system’s components and award of special seed grants to energy entrepreneurs in the energy access sector of the country.

Author Contributions

Conceptualization, O.E.D., Z.A.K. and M.I.; methodology, O.E.D. and M.O.U.; software, M.O.U. and M.A.; validation, M.O.U., O.E.D., M.I. and H.I.N.; formal analysis, M.O.U. and O.E.D.; investigation, M.O.U.; resources, O.E.D., Z.A.K. and M.O.U.; data curation, M.O.U. and H.I.N.; writing—original draft preparation, M.O.U.; writing—review and editing, O.E.D., M.I., M.A., Z.A.K. and H.I.N.; visualization, M.O.U.; supervision, O.E.D.; project administration, O.E.D.; funding acquisition, Z.A.K., M.I. and M.A. All authors have read and agreed to the published version of the manuscript.

Funding

This research received no external funding

Conflicts of Interest

The authors declare no conflict of interest.

Appendix A

Table A1. Initial decision matrix for North Central.
S/NCriteriaTypeAlternatives
GESGBESPBESWBESGPBESGWBESPWBESGPWBES
1Initial capital cost, $(−)5001197.829,272.83343.91204.83897.13345.94235.9
2O&M cost, $(−)131.460.3366.75060.758.850.059.9
3Cost of energy, $/kWh(−)0.1900.1531.4430.1900.1530.2010.1900.213
4Cost of fuel, $(−)0.04000.0358000.03560.00400.003
5CO2 emissions (kg/year) (−)−6 × 10⁻³−6 × 10−300−6 × 10⁻³−6 × 10⁻³⁰−5 × 10⁻³
6Environmental impact, - (−)33333333
7Unmet load, kWh/year (−)0.128 × 10−14214.92180.467 × 10−141 × 10−14175.241 × 10−14
8Net present cost, $(+)4513.93641.431,310.84185.93651.94773.54196.25068.5
9Socio-cultural awareness, -(+)54856576
10Technology readiness, -(+)87868666
11Ease of installation, -(+)76656666
12Natural resources A.(wind) (+)22282554
13Natural resources A.(sun)(+)22825254
14Natural resources A(biomass)(+)88225524
15System life cycle, -(+)98555554
Table A2. Initial decision matrix for North East.
S/NCriteriaTypeAlternatives
GESGBESPBESWBESGPBESGWBESPWBESGPWBES
1Initial capital cost, $(−)5001193.60734161193391734204246
2O&M cost, $(−)131.463.89192.0350.0064.8159.8950.0567.02
3Cost of energy, $/kWh(−)0.1910.1550.4130.2000.1530.2010.2010.2210
4Cost of fuel, $ (−)0.0420.038000.0370.00500.006
5CO2 emissions (kg/year) (−)−6 × 10⁻³−6 × 10−300−6 × 10⁻³−7 × 10−40−9 × 10⁻⁴
6Environmental impact, - (−)33333333
7Unmet load, kWh/year (−)11.380.03190.71172.050.032 × 10−14171.350.06
8Net present cost, $(+)45143678905744323685494644385263
9Socio-cultural awareness, -(+)54856576
10Technology readiness, -(+)87868666
11Ease of installation, -(+)76656666
12Natural resources A.(wind) (+)22282554
13Natural resources A.(sun)(+)22825254
14Natural resources A(biomass)(+)88225524
15System life cycle, -(+)98555554
Table A3. Initial decision matrix for North West.
S/NCriteriaTypeAlternatives
GESGBESPBESWBESGPBESGWBESPWBESGPWBES
1Initial capital cost, $(−)5001237474533541232390333583954
2O&M cost, $(−)131.447.93158.505048.3559.8150.0267.32
3Cost of energy, $/kWh(−)0.1900.1510.3460.1950.1510.2040.1950.209
4Cost of fuel, $ (−)0.0400.037000.0360.00400.005
5CO2 emissions [kg/year] (−)−6 × 10⁻³−6 × 10−300−6 × 10⁻³−7 × 10−40−8 × 10⁻⁴
6Environmental impact, - (−)33333333
7Unmet load, kWh/year (−)0.5801 × 10−13186.34189.291 × 10−132 × 10−14181.188 × 10−15
8Net present cost, $(+)45143584761442763588485442914971
9Socio-cultural awareness, -(+)54856576
10Technology readiness, -(+)87868666
11Ease of installation, -(+)76656666
12Natural resources A.(wind) (+)22282554
13Natural resources A.(sun)(+)22825254
14Natural resources A(biomass)(+)88225524
15System life cycle, -(+)98555554
Table A4. Initial decision matrix for South East.
S/NCriteriaTypeAlternatives
GESGBESPBESWBESGPBESGWBESPWBESGPWBES
1Initial capital cost, $(−)50085367113347862389787133917
2O&M cost, $(−)131.485.43205.795086.1058.78254.1768.32
3Cost of energy, $/kWh(−)0.1890.1560.4460.1880.1560.2010.4830.208
4Cost of fuel, $ (−)0.0390.034000.0340.00300.005
5CO2 emissions [kg/year] (−)−6 × 10⁻²−5 × 10−300−5 × 10⁻³−5 × 10−40−7 × 10⁻⁴
6Environmental impact, - (−)33333333
7Unmet load, kWh/year (−)2.410.09193.54150.870.090.481.342.01
8Net present cost, $(+)451437049778419337194788114814958
9Socio-cultural awareness, -(+)54856576
10Technology readiness, -(+)87868666
11Ease of installation, -(+)76656666
12Natural resources A.(wind) (+)22282554
13Natural resources A.(sun)(+)22825254
14Natural resources A(biomass)(+)88225524
15System life cycle, -(+)98555554
Table A5. Initial decision matrix for South South.
S/NCriteriaTypeAlternatives
GESGBESPBESWBESGPBESGWBESPWBESGPWBES
1Initial capital cost, $(−)50085471583702854389737214220
2O&M cost, $(−)131.485.43214.605085.7466.6250.8868.09
3Cost of energy, $/kWh(−)0.1890.1550.4660.2140.1560.2140.2150.225
4Cost of fuel, $ (−)0.0400.034000.0340.00600.006
5CO2 emissions [kg/year] (−)−6 × 10⁻³−5 × 10−300−5 × 10⁻³−1 × 10⁻³⁰−1 × 10⁻³
6Environmental impact, - (−)33333333
7Unmet load, kWh/year (−)0.506× 10−14195.5160.23 × 10−140.321159.150.420
8Net present cost, $(+)45143701102147673708511747935353
9Socio-cultural awareness, -(+)54856576
10Technology readiness, -(+)87868666
11Ease of installation, -(+)76656666
12Natural resources A.(wind) (+)22282554
13Natural resources A.(sun)(+)22825254
14Natural resources A(biomass)(+)88225524
15System life cycle, -(+)98555554
Table A6. Initial decision matrix for South West.
S/NCriteriaTypeAlternatives
GESGBESPBESWBESGPBESGWBESPWBESGPWBES
1Initial capital cost, $(−)50089148923336896388533583902
2O&M cost, $(−)131.473.2149.085072.9458.9751.0158.68
3Cost of energy, $/kWh(−)0.1890.1510.3470.1840.1520.1990.1860.200
4Cost of fuel, $ (−)0.0390.035000.0350.00300.003
5CO2 emissions [kg/year] (−)−6 × 10⁻³−6 × 10−3006E-3−5 × 10−40−5 × 10⁻⁴
6Environmental impact, - (−)33333333
7Unmet load, kWh/year (−)1.7020.063194.561390.0488 × 10−15137.609 × 10−15
8Net present cost, $(+)45143614759541433621473841754757
9Socio-cultural awareness, -(+)54856576
10Technology readiness, -(+)87868666
11Ease of installation, -(+)76656666
12Natural resources A.(wind) (+)22282554
13Natural resources A.(sun)(+)22825254
14Natural resources A(biomass)(+)88225524
15System life cycle, -(+)98555554

References

  1. Ugwoke, B.; Gershon, O.; Becchio, C.; Corgnati, S.P.; Leone, P. A review of Nigerian energy access studies: The story told so far. Renew. Sustain. Energy Rev. 2020, 120, 109646. [Google Scholar] [CrossRef]
  2. Dioha, M.O.; Kumar, A. Exploring sustainable energy transitions in sub-Saharan Africa residential sector: The case of Nigeria. Renew. Sustain. Energy Rev. 2020, 117, 109510. [Google Scholar] [CrossRef]
  3. Olatomiwa, L.; Mekhilef, S.; Huda, A.S.N.; Ohunakin, O.S. Economic evaluation of hybrid energy systems for rural electrification in six geo-political zones of Nigeria. Renew. Energy 2015, 83, 435–446. [Google Scholar] [CrossRef]
  4. FGN. Renewable Master Plan; FGN: Abuja, Nigeria, 2005. [Google Scholar]
  5. Ibrahim, H.A.; Kirkil, G. Electricity Demand and Supply Scenario Analysis for Nigeria Using Long Range Energy Alternatives Planning (LEAP). J. Sci. Res. Rep. 2018, 19, 1–12. [Google Scholar] [CrossRef]
  6. Ikeme, J.; Ebohon, O.J. Nigeria’s electric power sector reform, what should form the key objectives. Energy Policy 2005, 33, 1213–1221. [Google Scholar] [CrossRef]
  7. The World Bank. The World Bank in China. 2019. Available online: https://www.worldbank.org/en/country/china/overview (accessed on 26 March 2020).
  8. Nigeria Population Commission. National Population Estimates for Nigeria 2018. Available online: https://nigerianstat.gov.ng/download/474 (accessed on 29 March 2020).
  9. IEA. Nigeria Final Energy Consumption. IEA Statistics 2020. Available online: https://www.iea.org/sankey/#?c=Nigeria&s=Final consumption (accessed on 15 June 2020).
  10. Olatomiwa, L.; Mekhilef, S.; Ohunakin, O.S. Hybrid renewable power supply for rural health clinics in six geo-political zones of Nigeria. Sustain. Energy Technol. Assess. 2016, 13, 1–12. [Google Scholar] [CrossRef]
  11. Diemuodeke, E.O.; Addo, A.; Oko, C.O.C.; Mulugetta, Y.; Ojapah, M.M. Optimal mapping of hybrid renewable energy systems for locations using multi-criteria decision-making algorithm. Renew. Energy 2019, 134, 461–477. [Google Scholar] [CrossRef]
  12. Genchi, S.A.; Vitale, A.J.; Piccolo, M.C.; Perillo, G.M. Wind energy potential assessment and techno-economic performance of wind turbines in coastal sites of Buenos Aires Province, Argentina. Int. J. Green Energy 2016, 13, 352–365. [Google Scholar] [CrossRef]
  13. Mohammadi, K.; Mostafaeipour, A. Using different methods for comprehensive study of wind turbine utilization in Zarrineh, Iran. Glob. Conf. Renew. Energy Energy Effic. Desert Reg. 2011 2013, 65, 463–470. [Google Scholar] [CrossRef]
  14. Hashemi-Tilehnoee, M.; Babayani, D.; Khaleghi, M.; Tashakor, S. Evaluating Wind Energy Potential in Gorgan—Iran Using Two Methods of Weibull Distribution Function. Int. J. Renew. Energy Dev. J. Renew. Energy Dev. 2016, 5, 43–48. [Google Scholar] [CrossRef]
  15. Siddaiah, R.; Saini, R.P. A review on planning, configurations, modeling and optimization techniques of hybrid renewable energy systems for off grid applications. Renew. Sustain. Energy Rev. 2016, 58, 376–396. [Google Scholar] [CrossRef]
  16. Rezaei, M.; Mostafaeipour, A.; Qolipour, M.; Tavakkoli-Moghaddam, R. Investigation of the optimal location design of a hybrid wind-solar plant: A. case study. Hydrog. Energy 2018, 43, 100–114. [Google Scholar] [CrossRef]
  17. Olatomiwa, L. Optimal configuration assessments of hybrid renewable power supply for rural healthcare facilities. Energy Rep. 2016, 2, 141–146. [Google Scholar] [CrossRef] [Green Version]
  18. Igbum, O.G.; Eloka-Eboka, A.C.; Adoga, S. Feasibility study of biogas energy generation from refuse dump in a community-based distribution in Nigeria. Int. J. Low-Carbon Technol. 2019, 14, 227–233. [Google Scholar] [CrossRef]
  19. Malin, F. Simulation and Optimization of a Hybrid Renewable Energy System for Application on a Cuban Farm. Ph.D. Thesis, Uppsala University, Disciplinary Domain of Science and Technology, Uppsala, Cuba, 2017. [Google Scholar]
  20. Behzadian, M.; Otaghsara, S.K.; Yazdani, M.; Ignatius, J. A state-of the-art survey of TOPSIS applications. Expert Syst. Appl. 2012, 39, 13051–13069. [Google Scholar] [CrossRef]
  21. Pestana, C.; Wanke, P. An analysis of African airlines efficiency with two-stage TOPSIS and neural networks. J. Air Transp. Manag. 2015, 44–45, 90–102. [Google Scholar]
  22. Kolios, A.; Mytilinou, V.; Lozano-Minguez, E.; Salonitis, K. A Comparative Study of Multiple-Criteria Decision-Making Methods under Stochastic Inputs. Energies 2016, 9, 566. [Google Scholar] [CrossRef] [Green Version]
  23. Diemuodeke, E.O.; Hamilton, S.; Addo, A. Multi-criteria assessment of hybrid renewable energy systems for Nigeria’s coastline communities. Energy Sustain. Soc. 2016, 6, 1–12. [Google Scholar] [CrossRef]
  24. Wang, B.; Nistor, I.; Murty, T.; Wei, Y.M. Efficiency assessment of hydroelectric power plants in Canada: A multi criteria decision making approach. Energy Econ. 2014, 46, 112–121. [Google Scholar] [CrossRef]
  25. Wang, J.J.; Jing, Y.Y.; Zhang, C.F.; Zhao, J.H. Review on multi-criteria decision analysis aid in sustainable energy. Renew. Sustain. Energy Rev. 2009, 13, 2263–2278. [Google Scholar] [CrossRef]
  26. Lozano-Minguez, E.; Kolios, A.J.; Brennan, F.P. Multi-criteria assessment of offshore wind turbine support structures. Renew. Energy 2011, 36, 2831–2837. [Google Scholar] [CrossRef]
  27. Budak, G.; Chen, X.; Celik, S.; Ozturk, B. A systematic approach for assessment of renewable energy using analytic hierarchy process. Energy Sustain. Soc. 2019, 9, 37. [Google Scholar] [CrossRef] [Green Version]
  28. Nigerian Bureau of Statistics. LSMS Integrated Surveys on Agriculture Nigeria General Household SurveyPanel, Wave 4. Federal Republic of Nigeria-Energy, 2019. Available online: https://nigerianstat.gov.ng/elibrary?queries[search]=household (accessed on 16 June 2020).
  29. Korkovelos, A.; Zerriffi, H.; Howells, M.; Bazilian, M.; Rogner, H.; Nerini, F.F. A Retrospective Analysis of Energy Access with a Focus on the Role of Mini-Grids. Sustainability 2020, 12, 1793. [Google Scholar] [CrossRef] [Green Version]
  30. Murugaperumal, K.; Raj, P.A.D.V. Feasibility design and techno-economic analysis of hybrid renewable energy system for rural electrification. Sol. Energy 2019, 188, 1068–1083. [Google Scholar] [CrossRef]
  31. Karsh, R.K.; Debnath, R.; Soren, N.; Roy, A.K.; Pandey, A.D. Optimal Economical Analysis and Performance Assessment of Wind-Biomass Hybrid Energy System. In Proceedings of the International Conference on Automation, Computational and Technology Management (ICACTM), London, UK, 24–26 April 2019; pp. 473–478. [Google Scholar]
  32. Mehrjerdi, H. Modeling and optimization of an island water-energy nexus powered by a hybrid solar-wind renewable system. Energy 2020, 197, 117217. [Google Scholar] [CrossRef]
  33. Sarkar, T.; Bhattacharjee, A.; Samanta, H.; Bhattacharya, K.; Saha, H. Optimal design and implementation of solar PV-wind-biogas-VRFB storage integrated smart hybrid microgrid for ensuring zero loss of power supply probability. Energy Convers. Manag. 2019, 191, 102–118. [Google Scholar] [CrossRef]
  34. Parihar, A.K.S.; Sethi, V.; Banerjee, R. Sizing of biomass based distributed hybrid power generation systems in India. Renew. Energy 2019, 134, 1400–1422. [Google Scholar] [CrossRef]
  35. Zhang, C.; Sun, J.; Ma, J.; Xu, F.; Qiu, L. Environmental Assessment of a Hybrid Solar-Biomass Energy Supplying System: A Case Study. Int. J. Environ Res. Public Health 2019, 16, 2222. [Google Scholar] [CrossRef] [Green Version]
  36. Diemuodeke, E.O.; Addo, A.; Dabipi-Kalio, I.; Oko, C.O.C.; Mulugetta, Y. Domestic energy demand assessment of coastline rural communities with solar electrification. Energy Policy Res. 2017, 4, 1–9. [Google Scholar] [CrossRef]
  37. Lambert, T.; Gilman, P.; Lilienthal, P. Micropower System Modeling with Homer. Integr. Altern. Sources Energy 2006, 1, 379–418. [Google Scholar]
  38. Duffie, J.A.; Beckman, W.A. Solar Engineering of Thermal Processes, 2nd ed.; John Wiley & Sons: New York, NY, USA, 1991. [Google Scholar]
  39. Kayode, T.; Benjamin, O.; Seiichi, C.M.; Tetsuo, O. Estimating residential electricity consumption in Nigeria to support energy transitions. Int. J. Sustain. 2018, 10, 1440. [Google Scholar]
  40. Okeniyi, J.O.; Ohunakin, O.S.; Okeniyi, E. Assessments of Wind-Energy Potential in Selected Sites from Three Geopolitical Zones in Nigeria: Implications for Renewable/Sustainable Rural Electrification. Sci. World J. 2015, 2015, 581679. [Google Scholar] [CrossRef] [PubMed]
  41. Trading Economics. Interest Rate in Nigeria. Available online: https://tradingeconomics.com/nigeria/deposit-interest-rate (accessed on 15 June 2017).
  42. Gujba, H.; Mulugetta, Y.; Azapagic, A. Environmental and economic appraisal of power generation capacity expansion plan in Nigeria. Energy Policy 2010, 38, 5636–5652. [Google Scholar] [CrossRef]
  43. Ouedraogo, B.I.; Kouame, S.; Azoumah, Y.; Yamegueu, D. Incentives for rural off grid electrification in Burkina Faso using LCOE. Renew. Energy 2015, 78, 573–582. [Google Scholar] [CrossRef]
  44. Saleh, A.; Faridun, M.; Tajuddin, N.; Ra, M.; Fayzul, M.; Ramli, M.A.M. Feasibility analysis of grid-connected and islanded operation of a solar PV microgrid system: A case study of Iraq. Energy 2020, 191. [Google Scholar] [CrossRef]
  45. Shahzad, M.K.; Zahid, A.; ur Rashid, T.; Rehan, M.A.; Ali, M.; Ahmad, M. Techno-economic feasibility analysis of a solar-biomass off grid system for the electri fi cation of remote rural areas in Pakistan using HOMER software. Renew. Energy 2017, 106, 264–273. [Google Scholar] [CrossRef]
  46. Dufo-López, R.; Bernal-Agustín, J.L. Design and control strategies of PV-Diesel systems using genetic algorithms. Sol. Energy 2005, 71, 33–46. [Google Scholar] [CrossRef]
  47. Roszkowska, E. Multi-criteria decision making models by applying the TOPSIS method to crisp and interval data. Multi Criteria Decis. Mak. 2011, 6, 200–230. [Google Scholar]
  48. Ajayi, O.O.; Fagbenle, R.O.; Katende, J.; Aasa, S.A.; Okeniyi, J.O. Wind profile characteristics and turbine performance analysis in Kano, north-western Nigeria. Int. J. Energy Environ. Eng. 2013, 4, 27. [Google Scholar] [CrossRef] [Green Version]
  49. Akinbomi, J.; Brandberg, T.; Sanni, S.A.; Taherzadeh, M.J. Development and dissemination strategies for accelerating biogas production in Nigeria. Niger. Biogas Technol. Bioresour. 2014, 9, 5707–5737. [Google Scholar]
  50. Al-Sharafi, A.; Sahin, A.Z.; Ayar, T.; Yilbas, B.S. Techno-economic analysis and optimization of solar and wind energy systems for power generation and hydrogen production in Saudi Arabia. Renew. Sustain. Energy Rev. 2017, 69, 33–49. [Google Scholar] [CrossRef]
Figure 1. Schematic structure of hybrid system configuration.
Sustainability 12 05732 g001
Figure 2. Fuel curve of a biogas generator.
Sustainability 12 05732 g002
Figure 3. Schematic structure of hybrid system configuration in HOMER environment.
Sustainability 12 05732 g003
Figure 4. Computational algorithm.
Sustainability 12 05732 g004
Figure 5. Typical household daily electrical energy demand [36].
Sustainability 12 05732 g005
Figure 6. Extrapolated monthly averaged wind-speed and Weibull factors across Nigeria at 30 m.
Sustainability 12 05732 g006
Figure 7. Biomass resources per house hold per day in Nigeria (Input data).
Sustainability 12 05732 g007
Figure 8. Effect of discount rate on cost of energy.
Sustainability 12 05732 g008
Table 1. Population and average household size of each geopolitical zone in Nigeria.
Zone *Population (Million)Average Household Size
SE214
SS275
SW364
NC276
NE248
NW467
Source: Reference [39]; * SE: South-East; SS: South-South; SW: South-West; NC: North-Central; NE: North-East; NW: North-West.
Table 2. Monthly averaged wind-speed characteristics in Nigeria at 30 m and 50 m.
Month30 m50 m
v
[ m / s ]
k
[ ]
c
[ m / s ]
P
[ W / m 2 ]
v
[ m / s ]
k
[ ]
c
[ m / s ]
P
[ W / m 2 ]
Jan.7.35834.20588.3036572.718.06454.42609.1895741.87
Feb.7.62974.67188.5476575.098.36234.91659.4518747.99
Mar.7.58995.44478.4126503.468.33585.72999.3149662.75
Apr.7.58134.96898.4644526.628.32025.22919.3692690.10
May7.53886.20808.2833496.218.28746.53319.1743652.39
Jun.7.51845.65238.3199510.338.25765.94829.2128669.65
Jul.7.28005.25498.0819458.278.00705.53008.9644605.30
Aug.6.75185.30527.4989354.197.45805.58308.3525474.27
Sep.6.21614.91506.9394279.506.89145.17247.7604378.84
Oct.6.12684.14146.9228307.026.78004.35827.7376411.90
Nov.6.49083.82987.3553415.437.14964.03038.1866545.72
Dec.6.87164.29627.7186471.507.55724.52128.5670615.75
Ave.7.07954.90787.9040455.867.78935.16488.7734599.71
Table 3. Mean monthly solar radiation.
MonthGlobal Solar Radiation (kWh/m2/Day)
NC (Jos)NE (Maid.)NW (Sok.)SE (Enugu)SS (PH)SW (Iseyin)
Jan5.8975.7365.4135.2364.8345.259
Feb6.1406.1115.9915.3194.9235.546
Mar6.4716.4226.1115.2214.7715.562
Apr6.6016.5656.4624.8994.5575.515
May6.3446.4996.3684.4684.2835.192
Jun6.0066.1266.1534.0783.8434.701
Jul5.2205.4625.6733.3853.5464.027
Aug5.0275.2685.4454.2643.7044.146
Sep5.7375.6425.9214.2894.2664.397
Oct6.4076.1835.9664.6924.3635.092
Nov6.1825.9775.6785.1604.6025.581
Dec6.0255.6425.3035.2284.8085.301
Ave.6.0005.9705.8704.6904.3805.030
Table 4. Average household and biomass resources in Nigeria.
ZoneTotal Annual Biomass (Agro) Resource
(×103 Metric Tonnes) a
Average Number of Households
(×106) b
SE5.255.25
SS5.405.40
SW9.009.00
NC4.504.50
NE3.003.00
NW6.576.57
a Reference [49], b Reference [39].
Table 5. Annual solar radiation, wind speed and biomass resource per household in Nigeria.
ZoneLocationGlobal Solar Radiation (kWh/m2/day)Wind Speed at 50 m (m/s)Biomass Resources per Household (Metric Tonnes)Temperature
(°C)
NC(Jos)9°53.8′N, 8°51.5′E6.0011.115.78424.25
NE(Maiduguri)11°49.9′N, 13°9.1′E5.977.264.53526.97
NW(Sokoto)13°0.4′N, 5°14.9′E5.8710.042.77525.38
SE(Enugu)6°27.5′N, 7°32.8′E4.697.313.17525.24
SS(PH)4°48.9′N, 7°3.0′E4.385.173.42625.33
SW (Iseyin)7°58.6′N, 3°35.5′E5.035.832.089625.17
Table 6. Input data for AHP.
CriteriaICOMCOECOFCO2 EIULNPCScATREoIWASABASC
I.C1.003.001.004.001.002.006.003.007.004.004.003.003.003.005.00
OM0.331.000.331.330.330.672.001.002.331.331.331.001.001.001.67
COE1.003.001.004.001.002.006.003.007.004.004.003.003.003.005.00
COF0.250.750.251.000.250.501.500.751.751.001.000.750.750.751.25
CO21.003.001.004.001.002.006.003.007.004.004.003.003.003.005.00
EI0.501.500.502.000.501.003.001.503.502.002.001.501.501.502.50
UL0.160.500.170.670.170.331.000.501.170.670.670.500.500.500.83
NPC0.331.000.331.330.330.672.001.002.331.331.331.001.001.001.67
ScA0.140.430.140.570.140.290.860.431.000.570.570.430.430.430.71
TR0.250.750.251.000.250.501.500.751.751.001.000.750.750.751.25
EoI0.250.750.251.000.250.501.500.751.751.001.000.750.750.751.25
WA0.331.000.331.330.330.672.001.002.331.331.331.001.001.001.67
SA0.331.000.331.330.330.672.001.002.331.331.331.001.001.001.67
BA0.331.000.331.330.330.672.001.002.331.331.331.001.001.001.67
SC0.200.600.200.800.200.401.200.601.400.800.800.600.600.601.00
Table 7. Characteristics of the criteria considered
iCriteriaTypeWeight
1Initial capital cost, $(−)0.1556
2Operation and maintenance cost, $(−)0.0519
3Cost of energy, $/kWh(−)0.1556
4Cost of fuel, $ (−)0.0389
5CO2 emissions [kg/year] (−)0.1556
6Environmental impact,-(−)0.0778
7Unmet load, kWh/year(−)0.0259
8Net present cost, $(+)0.0519
9Socio-cultural awareness, -(+)0.0222
10Technology readiness, -(+)0.0389
11Ease of installation, -(+)0.0389
12Natural resources Availability/predictability/randomness-wind (+)0.0519
13Natural resources availability/predictability/randomness -sun (+)0.0519
14Natural resources availability/predictability/randomness-biomass(+)0.0519
15System life cycle, -(+)0.0311
Table 8. Positive and negative ideal solutions.
Location Alternatives
GESGBESPBESWBESGPBESGWBESPWBESGPWBES
NC (Jos)d+0.06150.06170.22710.11290.05880.10390.11120.1038
d-0.22200.21890.05610.19230.21820.18910.19150.1868
NE(Maidu.)d+0.04970.04770.14160.11690.04380.11390.11550.1138
d−0.13450.12650.03930.06550.12550.05820.06260.0573
NW (Sok.)d+0.04960.04800.13800.11510.04410.10970.11350.1087
d−0.13040.12300.03890.06240.12210.05580.05980.0536
SE (Enu.)d+0.05000.05020.14370.11330.04660.10660.15910.1032
d−0.15540.14770.04790.09790.14670.09170.04300.0901
SS (PH)d+0.05040.05010.16140.11690.04640.10330.11550.1054
d−0.15460.14710.04200.08810.14630.08550.08590.0809
SW (Iseyin)d+0.04980.04900.15140.11430.04530.10650.11270.1076
d−0.14380.13660.04050.07950.13560.07310.07750.0688
Table 9. Relative closeness of each alternative to the ideal solution.
LocationAlternatives
GESGBESPBESWBESGPBESGWBESPWBESGPWBES
NC (Jos)0.78320.78010.19820.63010.78790.64540.63260.6428
NE (Maid.)0.73030.72620.21720.35900.74140.33820.35150.3346
NW (Sok.)0.72470.71940.21970.35150.73470.33710.34520.3302
SE (Enugu)0.75680.74630.25000.46370.75890.46250.21290.4661
SS (PH)0.75420.74590.20650.42970.75910.45270.42670.4343
SW (Iseyin)0.74260.73600.21120.41030.74990.40710.40730.3899
Table 10. Design parameters for the optimal configuration.
LocationHybrid SystemBiogas Generator
kW
PV
kW
Battery
kWh
Converter
kW
Energy Consumed
kWh/year
NC (Jos)GPBES1.0000.03314.9200.32622423.60
NE (Maiduguri)GPBES1.0000.0233 2.4600.30222424.00
NW(Sokoto)GPBES1.0000.02144.9200.44002423.60
SE (Enugu)GPBES1.0000.04372.4600.30612423.55
SS (PH)GPBES1.0000.04892.4600.30602423.60
SW(Iseyin)GPBES1.0000.04124.9200.30402423.57
Table 11. Pertinent economic and environmental data.
LocationHybrid SystemCOE,
US$/kWh
NPV,
US$
CO2.E
kg/yr
NC (Jos)GPBES0.15343651.92−0.0056
NE (Maid.)GPBES0.15123599.18−0.0055
NW (Sok.)GPBES0.15073588.35−0.0057
SE (Enugu)GPBES0.15623719.23−0.0054
SS (PH)GPBES0.15573707.57−0.0054
SW (Iseyin)GPBES0.15353653.31−0.0059

