Prevention and Fighting against Web Attacks through Anomaly Detection Technology. A Systematic Review

 , , , and
Abstract
:1. Introduction & Motivation
- Signature-based detection (SD): A signature corresponds to a known pattern of attack. In order to detect possible intrusions, the patterns are compared to the captured data. Alternative names for SD are Knowledge-Based Detection or Misuse Detection.
- Anomaly-based detection (AD): An anomaly is detected when there is a deviation from usual behavior, which is represented by profiles (static or dynamic). Anomaly detection is made by comparing the normal profiles with the observed events in order to detect attacks or intrusions. AD is also called Behavior-Based Detection.
- Stateful protocol analysis (SPA): SPA relies on generic profiles for specific protocols developed by the providers. Generally, SPA network protocol models are typically based on standards of protocols from international organizations. This is also known as specification-based detection.
- An extensive and rigorous review of the existing scientific literature on the use of anomaly detection techniques in web attack detection.
- Identification and classification of the papers reviewed according to the types of datasets, techniques, metrics, results, etc. of each one of them.
- The results and metrics obtained by the different anomaly detection techniques studied in the papers reviewed are detailed.
- Identification of opportunities to improve research aimed at the prevention and detection of web attacks through the use of anomaly detection techniques. These opportunities include: generation of publicly available datasets that allow replication and validation of the experimental work, incorporation of metrics such as F-Score, Area Under the Curve (AUC) and Precision that allow complementing the usual metrics in this type of research, better definition of the attacks analyzed in each study since, as will be seen in Section 5, most of the studies reviewed do not detail the types of attack that are attempted to be detected.
2. Background
2.1. Related Work
2.2. Anomaly Detection Definition
2.3. Types of Anomaly Detection Algorithms
- Supervised algorithms: Supervised algorithms model the relationships between input data and prediction. They try to predict the output values that will be obtained when feeding the model with new input data. This prediction is based on the relationships learned from the tagged training data. Examples of supervised algorithms are Nearest Neighbor, Naive Bayes, Decision Trees, Linear Regression, Support Vector Machines (SVM), Neural Networks.
- Unsupervised algorithms: As there is no tagged training data on which the algorithm can perform its learning, these algorithms perform pattern detection on the input data. Examples of unsupervised algorithms are association rules and k-means.
- Semi-supervised algorithms: Semi-supervised algorithms use little tagged data and a lot of untagged data as part of the training set. These algorithms try to explore the structural information contained in the unlabeled data to generate predictive models that work better than those that only use labeled data. Common examples of unsupervised algorithms are: Generative models, Low-density separation and Graph-based methods.
- Reinforcement algorithms: The objective is the development of a system (called agent) that is intended to improve its efficiency by performing a certain task based on the interaction with its environment, receiving rewards that allow it to adapt its behavior. As the agent receives rewards, it must develop the right strategy (called policy) that leads it to obtain positive rewards in all possible situations. Common examples of reinforcement algorithms are: Q-Learning, Temporal Difference (TD) and Deep Adversarial Networks.
- Feature extraction: N-grams, Bag of Words, multi-features information entropy prediction model.
- Dimensionality reduction: Principal Component Analysis (PCA), Random Projection, Diffusion Maps.
- Parameter estimation: Limited-memory Broyden—Fletcher—Goldfarb—Shanno (L-BFGS) algorithm.
- Regular expression generator: Simple (SREG) and Complex (CREG) Expression Generator.
2.4. Advantages and Disadvantages of Anomaly Detection Algorithms
3. Review Methodology
3.1. Preparing the Review
3.2. Research Questions
3.3. Information Sources
- IEEE Xplore (https://ieeexplore.ieee.org/Xplore/home.jsp)
- ScienceDirect (https://www.sciencedirect.com/)
- Springer (https://link.springer.com/)
- Wiley Interscience (https://onlinelibrary.wiley.com/)
- ACM Digital Library (https://dl.acm.org/dl.cfm)
3.4. Search Criteria
3.5. Criteria for Inclusion and Exclusion of Papers
3.6. Quality Assurance
3.7. Quality Evaluation Results
3.8. Information Retrieval
4. Results
4.1. Specific Attack Detection/Prevention
4.1.1. DDoS Attacks
4.1.2. Injection Attacks
4.1.3. Botnets Attacks
4.1.4. Defacement
4.1.5. Other Attacks
4.2. Current Status of Anomaly Detection
4.2.1. Clustering Algorithms
- K-Means: K-means is an unsupervised classification (clustering) algorithm that groups objects into k groups based on their characteristics. Clustering is done by minimizing the sum of distances between each object and the centroid of its group or cluster. The quadratic distance is usually used. The k-means algorithm solves an optimization problem. The function to optimize (minimize) is the sum of the quadratic distances of each object to the centroid of its cluster. [126]The objects are represented with real vectors of n dimensions and the k-means algorithm constructs k groups where the sum of distances of the objects is minimized, within each group , to its centroid. The problem can be formulated as follows [126]:where S is the set of data whose elements are the objects represented by vectors, where each of its elements represent a characteristic or attribute. We will have k groups or clusters with their corresponding centroid [126].In each update of the centroids, from the mathematical point of view, we impose the necessary end condition on the function which, for the quadratic function (1) is:and the average of the elements of each group is taken as a new centroid.
- Gaussian Mixture Model: Gaussian mixture models are a probabilistic model for representing normally distributed subpopulations within an overall population. Mixture models, in general don’t require knowing which subpopulation a data point belongs to, allowing the model to learn the subpopulations automatically. Since subpopulation assignment is not known, this constitutes a form of unsupervised learning. The Gaussian Mixture function is formed by several Gaussians, individually identified by , where K is the number of groups formed in the data set. Each Gaussian k is composed of mean (defines its center), covariance (defines its width), a mixture probability (defines the size of the Gaussian function). The mixing coefficients are probabilistic and must meet this condition:In general, the Gaussian density function is defined by:where x represents the data points, D is the number of dimensions of each data point. is the mean and is the covariance.
- Mahalanobis Distance: The Mahalanobis Distance is a multivariate distance metric that measures the distance between a point (vector) and a distribution. The most common use for Mahalanobis Distance is to find multivariate outliers, which indicates unusual combinations of two or more variables. The formal definition is:where is the square of the Mahalanobis Distance, x is the vector of observations, m is the vector of mean values of independents variables, is the inverse covariance matrix of independent variables.
- Affinity Propagation: Affinity Propagation does not require the number of clusters to be determined before running the algorithm. The data points can be seen as a network where all the data points send messages to all other points [127]. The subject of the messages is the determination of the points being an exemplar. The exemplars are points that explain the other data points “better” and are the most significant of their aggregation. All data points want to determine collectively the data points that are an exemplar to them. These messages are saved in two matrices:
- –
- Responsibility Matrix R. In this matrix, reflects how well point k is adjusted to be an exemplar for point i.
- –
- Availability Matrix A. reflects how accurate it would be for point i to select point k as an exemplar.
Let be a set of data points, with no internal structure assumptions, and let s be a function that measures the degree of similarity between any two points, such that is more similar to than to .Similarity matrix(S) gives us information about the similarity between two data points:that is defined as the negative of the euclidean distance between the two instances. The greater the distance between any two instances, smaller is the similarity between them. The diagonal of s represents the input preference, i.e., the probability that a given input will become an exemplar. When the same value is set for all entries, it controls how many classes the algorithm produces. A value close to the lowest possible similarity produces fewer classes, while a value close to or greater than the highest possible similarity produces many classes. It is usually initialized with the median similarity of all pairs of entries.The algorithm proceeds by alternating two message passing stages, to update the Responsibility Matrix and the Availability Matrix. Both matrices are initialized with zeros and can be viewed as log probability tables. These updates are performed on an iterative basis:First, Responsibility updates are sent:Then, availability is updated per:for andThe iterations are performed until either the cluster boundaries remain unchanged over a number of iterations, or after some predetermined number of iterations. The exemplars whose sum of responsibility and availability is positive are obtained: - DBSCAN: Density-based spatial clustering of applications with noise (DBSCAN) [128] is a density-based clustering algorithm because it finds a number of groups (clusters) starting with a given density distribution of the corresponding nodes. Clustering happens based on two parameters: Neighbourhood, cutoff distance of a point from core point for it to be considered a part of a cluster. Commonly referred to as . Minimum points, minimum number of points required to form a cluster. Commonly referred to as minPts.There are three types of points after the DBSCAN clustering is complete: Core, this is a point which has at least minPts points within distance from itself. Border, this is a point which has at least one Core point at a distance . Noise, this is a point which is neither a Core nor a Border. It has less than minPts points within distance from itself.DBSCAN can be summarized in following steps: The algorithm begins with an arbitrary point that has not been visited. The neighborhood of this point is limited, and if it contains specific points, a cluster starts on it. Otherwise, the point is labeled as noise. Note that the point in question may belong to another neighborhood than the specific one in the corresponding cluster. If a point is included in the dense part of a cluster, its neighborhood is also part of the cluster. Thus, all points in that neighborhood are added to the cluster, as are the neighborhoods of these points that are sufficiently dense. This process continues until a densely connected cluster is completely built. Then, a new point not visited is visited and processed in order to discover another cluster or noise.
- Nearest Neighbor based Local Outlier Factor: The Local Outlier Factor (LOF) [129] is based on the concept of a local density, where the locality is given by the k-nearest neighbours. The density is estimated by the distance between close neighbours. If an object’s density is compared with the densities of its neighbours, regions with similar density values and points with density values far below the values obtained by its neighbours will be identified. These points are considered outliers. The steps to calculate the LOF are detailed below:
- –
- Calculate distance between the pair of observations.
- –
- Find the kth nearest neighbor observation; calculate the distance between the observation and k-Nearest neighbor.
- –
- Calculate the reachability distance between object p and o:
- –
- Calculate Local Reachability Density (LRD): the most optimal distance in any direction from the neighbor to the individual point. The local reachability density of an object p is the inverse of the average reachability distance based on the MinPts (minimum number of objects) nearest neighbors of p.
- –
- Calculate Local Outlier Factor: It is the average of the ratio of the local reachability density of p and those of ; captures the degree to which we call p an outlier.
- Expectation–Maximization: The Expectation–Maximization (EM) algorithm is a way to find maximum likelihood estimates for model parameters when the data is incomplete, has missing data points, or has unobserved (hidden) latent variables. It is an iterative way to approximate the maximum likelihood function [130,131]. The basics steps for the algorithm are:
- –
- An initial guess is made for the model’s parameters and a probability distribution is created (E-step).
- –
- Until stability is reached, do:
- *
- Newly observed data is added to the model.
- *
- The probability distribution from the E-step is tweaked to include the new data (M-step).
Formally:Given the statistical model which generates a set X of observed data, a set of unobserved latent data or missing values Z, and a vector of unknown parameters , along with a likelihood function , the maximum likelihood estimate of the unknown parameters is determined by maximizing the marginal likelihood of the observed data. [132]The EM algorithm finds the MLE by iteratively calculating the [132]:- –
- Expectation Step (E-Step): Define as the expected value of the log likelihood function of , with respect to the current conditional distribution of Z given X and the current estimates of the parameters
- –
- Maximization step (M step): Find the parameters that maximize:
4.2.2. Classification Algorithms
- One Class Support Vector Machine: The problem addressed by One Class Support Vector Machine (OCSVM) is novelty detection [134]. The idea of novelty detection is to detect rare events, i.e., events that happen rarely, and hence, with very little samples. The problem is then, that the usual way of training a classifier will not work. Here the idea is to find a function that is positive for regions with high density of points, and negative for small densities.Consider a dataset:; in a multi-dimensional space where is the i –th input data point and is the i –th output pattern, indicating the class membership.SVMs can create a non-linear decision boundary by projecting the data through a non-linear function to a space with a higher dimension. This means that data points which can’t be separated by a straight line in their original space I are lifted to a feature space F where there can be a straight hyperplane that separates the data points of one class from another. When that hyperplane would be projected back to the input space I, it would have the form of a non-linear curve.OCSVM separates all the data points from the origin (in feature space F) and maximizes the distance from this hyperplane to the origin. This results in a binary function which captures regions in the input space where the probability density of the data lives.
- Hidden Markov Model: A Hidden Markov Model (HMM) is a statistical model in which the system to be modeled is assumed to be a Markov process of unknown parameters. The objective is to determine the hidden parameters of that string from the observable parameters. In a normal Markov model, the state is directly visible to the observer, so the transition probabilities between states are the only parameters. In a hidden Markov model, the state is not directly visible, but only the variables influenced by the state are visible. Each state has a probability distribution over the possible output symbols. Consequently, the symbol sequence generated by an HMM provides some information about the state sequence [135].Formally, a HMM is a quintuple , characterized by the following elements [136]:
- –
- is the set of states, where N is the number of states. The triplet represents a Markov chain; the states are hidden and never observable directly.
- –
- is the discrete set of possible symbol observations, where M represents the number of observations.
- –
- is the initial probability distribution on states. It gives the probability of starting in each state. It can be expected that:
- –
- is the transition probability of moving from state to state . It can be expected that for each and , and that for each .
- –
- is the emission probability that symbol is seen in state .
The model makes two assumptions:- –
- The Markov assumption: represents the memory of the model, so current state depends only on the previous state. Formally:
- –
- The independence assumption: the output observation at time t is dependent only on the current state and it is independent of previous observations and states. Formally:
- K-Nearest Neighbors: The K-Nearest Neighbors (KNN) algorithm classifies new objects according to the outcome of the closest object or the outcomes of several closest objects in the feature space of the training set [137]. An object is classified by a majority vote of its neighbors, with the new object being assigned to the class that is most common among its k nearest neighbors (k is a positive integer, and typically small). The neighbors are taken from a set of objects for which the correct classification is known. In the classification phase, k is a user-defined constant, and a new object with given features is classified by assigning to it the label that is most frequent among the k training samples nearest to that new object. With continuous features, Euclidean distance is used as distance metric, while with categorical features the Hamming distance is used. Finally, the input x gets assigned to the class with the largest probability.
- Naive Bayes: The Naive Bayesian classifier is based on Bayes’ theorem with the independence assumptions between predictors [138,139,140]. Bayes theorem provides a way of calculating the posterior probability, , from , , and . Naive Bayes classifier assumes that the effect of the value of a predictor on a given class is independent of the values of other predictors, i.e., class conditional independence. Formally:where:
- –
- is the posterior probability of class given predictor.
- –
- is the prior probability of class.
- –
- is the likelihood which is the probability of predictor given class.
- –
- is the prior probability of predictor.
As the denominator does not depend on C and the values of the features are given, the denominator is constant. The numerator is equivalent to the joint probability model and, using the chain rule:Supposing that all features in x are independent of each other, depending on the category , then:Thus, the joint model can be expressed as:where denotes proportionality.
4.2.3. Neural Network
- Stacked Auto-encoder: Autoencoder is a kind of unsupervised learning structure that owns three layers: input layer, hidden layer, and output layer. The structure of a stacked auto-encoder consists of several hidden layers of auto-encoders in a neural network. The output of each hidden layer is connected to the input of the next layer. The hidden layers are trained by an unsupervised algorithm and then tuned by a supervised method. Stacked autoencoder mainly consists of three steps [142]:
- –
- Train the first autoencoder by input data and obtain the learned feature vector.
- –
- The feature vector of the former layer is used as the input for the next layer, and this procedure is repeated until the training completes.
- –
- After all the hidden layers are trained, backpropagation algorithm (BP) [143] is used to minimize the cost function and update the weights with labeled training set to achieve fine-tuning.
- Word2vec: Word2vec is a two-layer neural net that processes text by transforming words into vectors. Its input is a text corpus and its output is a set of vectors: feature vectors that represent words in that corpus. Word2vec tries to group vectors of similar words together in vectorspace [144,145]. There are two different architectures capable of representing words in a distributed way: continuous bag of words (CBOW) and continuous skip-gram. Word2vec is capable of using any of them. The word prediction is done in a different way depending on the selected architecture: in the CBOW architecture, the prediction is done based on a window of context words, without being influenced by the order of those contextual words. In the skip-gram architecture, the surrounding context words are predicted from the current word, with the nearby words having more weight in the context than those that are distant.
4.2.4. Feature Selection and Extraction
- N-Grams: This is a consecutive sequence of n elements that constitute a text sample; based on a probabilistic language model, the next element in the sequence is predicted in the form of an order Markov Model. An N-gram model predicts based on , i.e.,: . Formally [146,147]: Given a sequence of tokens over the token alphabet , where N and n are positive integers, an of the sequence S is any subsequence of consecutive tokens. The of S is the sequence .
- Bag Of Words: Bag Of Words (BOW) algorithm encodes words of the text (that represent categorical features) into real-valued vectors, making a list of unique words in the text corpus called vocabulary. Each sentence or document can be represented as a vector with a value of 1 if the word is present in the vocabulary, or 0 otherwise. Another representation can be done by counting the number of times each word appears in the document, using the Term Frequency-Inverse Document Frequency (TF-IDF) technique [148,149].
- –
- Term Frequency (TF): where is the number of times term t appears in a document and is the number of terms in the document.
- –
- Inverse Document Frequency (IDF): , where N is the number of documents and n is the number of documents a term t has appeared in. The of a rare word is high, whereas the of a frequent word is likely to be low.
- –
- Term Frequency-Inverse Document Frequency (TF-IDF):
4.2.5. Attribute Character Distribution
- Idealized Character Distribution: In [98] approach, the Idealized Character Distribution (ICD) is obtained during the training phase from normal requests sent to web application. The IDC is calculated as the mean value of all character distributions. During the detection phase, the probability that the character distribution of a sequence is an actual sample drawn from its ICD is evaluated. For that purpose Chi-Square metric is used. Let be the Chi-Square metric for a sequence Q where N indicates the length of Q, the distribution established for all the samples, the standard deviation from the , and h the distribution of the sequence that is being tested Q, then the value of is computed as:In [87], Kozik et al. group the characters for which the decimal value in ASCII table belongs to the followings ranges: , , , , , , , , .
4.2.6. Dimensionality Reduction
- Principal Component Analysis: This is the most commonly used technique of dimensionality reduction; it works by linearly reducing the existing data to a lower dimensionality space, trying to preserve the maximum variance of the data in the lower dimensionality space. [151,152]. Principal Component Analysis (PCA) is mathematically defined as an orthogonal linear transformation that transforms the data to a new coordinate system such that the greatest variance by some scalar projection of the data comes to lie on the first coordinate, the second greatest variance on the second coordinate, and so on [153]. The process of obtaining PCA from a given dataset can be summarized as:
- –
- Take a whole dataset of dimension ignoring the label field, so the dataset becomes d dimensional.
- –
- Compute the mean of every dimension of the whole d dimension dataset and represent it in a matrix A.
- –
- Compute the covariance matrix of A. The result would be a square matrix of d × d dimensions.
- –
- Compute Eigenvectors and corresponding Eigenvalues.
- –
- Sort the Eigenvectors by decreasing Eigenvalues and choose k Eigenvectors with the largest Eigenvalues to form a d × k dimensional matrix W.
- –
- Transform the samples onto the new subspace.
- Linear Discriminant Analysis: Linear discriminant analysis (LDA) is a generalization of Fisher’s linear discriminant to find a linear combination of features that characterizes or separates two or more classes of objects or events. LDA attempts to express one dependent variable as a linear combination of other features or measurements [154,155,156]. The goal of an LDA is to project a n dimensional feature space onto a smaller subspace k where . The process of obtaining LDA from a given dataset can be summarized as:
- –
- Compute the d-dimensional mean vectors for the different classes from the dataset.
- –
- Compute the scatter matrices.
- –
- Compute the eigenvectors and corresponding eigenvalues for the scatter matrices.
- –
- Sort the eigenvectors by decreasing eigenvalues and choose k eigenvectors with the largest eigenvalues to form a d × k dimensional matrix W, where every column represents an eigenvector.
- –
- Use W matrix to transform the samples onto the new subspace.
- Diffusion Map: Unlike others popular dimensionality reduction techniques like PCA and LDA, Diffusion Maps are non-linear and focus on discovering the underlying manifold, i.e.,: lower-dimensional constrained “surface” upon which the data is embedded [157,158,159]. It achieves dimensionality reduction by re-organising data according to parameters of its underlying geometry. A diffusion map embeds data in (transforms data to) a lower-dimensional space, such that the Euclidean distance between points approximates the diffusion distance in the original feature space. The dimension of the diffusion space is determined by the geometric structure underlying the data, and the accuracy by which the diffusion distance is approximated.
4.2.7. Statistical Techniques and Probability Distribution
- Chebyshev’s Inequality. Let K is any positive real number greater than 1. Chebyshev’s Inequality says that at least of data from a sample must fall within K standard deviations from the mean [160]. In a normal distribution, 68% of the data is one standard deviation from the mean, 95% is two standard deviations from the mean, and approximately 99% is three standard deviations from the mean. If data set is not normally distributed then the use of Chebyshev’s Inequality provides a way to, knowing only the mean and standard deviation of the sample, estimate the worst scenario in which the data is distributed: i.e.,: for any distribution, at least 75% of the data must be between two standard deviations from the mean. For example:
- –
- If , then of the data values of any distribution must be within two standard deviations of the mean.
- –
- If , then of the data values of any distribution must be within three standard deviations of the mean.
- –
- If , then of the data values of any distribution must be within four standard deviations of the mean.
- Pearson’s Chi Square Test. Pearson’s chi-squared test is a statistical test applied to sets of categorical data to evaluate how likely it is that any observed difference between the sets arose by chance. The chi-square test belongs to the so-called goodness-of-fit or contrast tests, which aim at deciding whether the hypothesis that a given sample comes from a population with a probability distribution fully specified in the null hypothesis can be accepted, allowing the comparison of the goodness of fit, the independence of the variables and the level of homogeneity of a distribution. The comparisons are based on the comparison of observed frequencies (empirical frequencies) in the sample with those that would be expected (theoretical or expected frequencies) if the null hypothesis were true. Thus, the null hypothesis is rejected if there is a significant difference between the observed and expected frequencies. [161]. To calculate the statistic, the procedure is as follows:
- –
- Calculate the chi-squared test statistic.
- –
- Determine the degrees of freedom (df) of that statistic.
- –
- Select a desired level of confidence.
- –
- Compare to the critical value from the chi-squared distribution with df degrees of freedom and the selected confidence level.
- –
- The difference between the observed and expected frequencies of a distribution is evaluated using the statistic. If the difference between observed and expected frequencies is large, the null hypothesis is false and may be rejected, i.e., this distribution does not fit the theoretical distribution. The alternative hypothesis can be accepted.
- Bayesian Probability. Bayesian Probability theory provides a mathematical framework for performing inference, or reasoning, using probability. It is most often used to judge the relative validity of hypotheses in the face of noisy, sparse, or uncertain data, or to adjust the parameters of a specific model [162]. The combined probability of two events, A and B, can be expressed as . Assuming that one of the events is the hypothesis H and the other is data D, it is possible to judge the relative certainty of the hypothesis in relation to the data: According to Bayes’ rule:Another way of interpreting Bayes’ rule is by taking into account the acquired learning. That is, the transformation from to reflects the level of learning about the validity of the hypothesis from the data.
4.3. Datasets
- DARPA: Created in 1998 by Lincoln Laboratory, Massachusetts Institute of Technology (MIT), promoted by DARPA and the Air Force Research Laboratory. After some time, due to the quickly changing of technology, another version of the dataset was created in 1999 (including novel attacks and a Windows NT target) [168]. DARPA98 and DARPA99 consist of raw tcpdump data, allowing testing of 244 labeled instances of 58 different attacks on four operating systems (SunOS, Solaris, Linux, and Windows NT) [164]. These datasets have been widely criticized by several academic papers [18,19], mainly due to the use of artificial data: customized software was used to synthesize typical user behavior and usual network traffic to generate a small, isolated network as if it were part of an Air Force network. According to McHugh [18], the dataset suffers from flaws in traffic data collection as there is no statistical evidence of similarity to typical Air Force network traffic (mainly with respect to the false alarm rate), attack taxonomy and distribution, and evaluation criteria. In the work of Mahoney et al. [19], numerous irregularities were found, including the fact that, due to the way the data had been generated, all malicious packets had a TTL of 126 or 253, while most normal traffic had a TTL of 127 or 254.
- KDD Cup 99: This is a transformed version of the DARPA dataset containing 41 features appropriate for machine learning classification algorithms. The data set can be obtained in three different versions: a complete training set, a 10% version of the training set and a test data set. Records duplication on both training and test sets can produce skewed results for more common cases [17]. Based on the works of McHugh [18] and Mahoney and Chan [19], the archival authority of Irvine KDD Archive, University of California, discourage the use of DARPA and KDD Cup 99 data sets [20].
- NSL-KDD: Created in 2009 by the Information Security Center of Excellence (ISCX), University of New Brunswick (UNB), in order to solve the problem of duplicate records found in KDD Cup 99 [17]; this duplication of records could cause biased results by the learning algorithms, as well as the lack of learning of infrequent records. After applying the cleanup operations, the recordset of 4,900,000 and 2,000,000 in the KDD Cup 99 training and test data set was reduced to 125,973 and 22,544 in the new NSL-KDD training and test data sets, respectively.
- UNSW-NB15: This dataset was created on by the IXIA PerfectStorm tool in the Cyber Range Lab of the Australian Centre for Cyber Security (ACCS) for generating a hybrid of real modern normal activities and synthetic contemporary attack behaviours; has nine types of attacks, namely, Fuzzers, Analysis, Backdoors, DoS, Exploits, Generic, Reconnaissance, Shellcode and Worms [169,170]. The number of records is 175,341 and 82,332 in the training and testing sets respectively. The simulation period was 16 h on 22 January 2015 and 15 h on 17 February 2015 [171].
- Kyoto 2006: Both KDD Cup ‘99 dataset and NSL-KDD dataset do not reflect real data flow in computer network since they are generated by simulation over the virtual network. The Kyoto 2006+ data set is built on real three year-traffic data from November 2006 to August 2009. This data set is captured using honeypots, darknet sensors, e-mail server and web crawler [172].
- ISCX: Shiravi et al. [173] devised a systematic approach to be able to generate datasets to analyse and evaluate intrusion detection systems, mainly through the use of anomaly detection techniques. It is intended that researchers will be able to generate datasets from a set of profiles that can be combined to create a diverse set of dataset. From this work, the ISCX (Information Security Centre of Excellence) dataset emerged. This dataset consists of simulated traffic for one week, each record consists of 11 different features. The dataset is labeled, containing a description of the legitimate network traffic and attacks.
- CSIC-2010: The CSIC 2010 dataset contains the generated traffic targeted to an e-commerce Web application developed at Spanish Research National Council (CSIC). In this web application, users can buy items using a shopping cart and register by providing some personal information. The dataset was generated automatically and contains 36,000 normal requests and more than 25,000 anomalous requests; the requests are labeled as normal or anomalous [174].
- ECML/PKDD 2007: As part of the 18th European Conference on Machine Learning (ECML) and the 11th European Conference on Principles and Practice of Knowledge Discovery in Databases (PKDD)—ECML/PKDD 2007 Discovery Challenge, a dataset was provided containing 35,006 requests classified as normal traffic and 15,110 requests classified as attacks. The dataset was generated by collecting real traffic which was then processed to mask parameter names and values, replacing them with random values [175].
4.4. Metrics
- Accuracy: Accuracy (ACC) is ratio of payloads correctly identified divided by the total generated payloads.
- False Alarm Rate, False Positive Rate: False Alarm Rate (FAR) or False Positive Rate (FPR), it’s the probability that a false alarm will be raised: that a positive result will be given when the true value is negative.
- True Negative Rate, Specificity: True Negative Rate (TNR) or Specificity measures the proportion of actual negatives that are correctly identified.
- True Positive Rate, Recall, Sensitivity, Detection Rate: True Positive Rate (TPR), Recall, Sensitivity or Detection Rate (DR) measures the proportion of actual positives that are correctly identified.
- Precision, Positive Predictive Value: Precision or Positive Predictive Value (PPV) is the ratio of the number of malicious payloads correctly detected divided by the number of total malicious payloads.
- False Negative Rate: False Negative Rate (FNR) is the proportion of positives that yield negative test outcomes with the test, i.e., the conditional probability of a negative test result given that the condition being looked for is present.
- Classification error: Classification error (CE) depends on the number of samples incorrectly classified (false positives plus false negatives) and is evaluated by the formula:where f is the number of sample cases incorrectly classified, and n is the total number of sample cases.
- Matthews Correlation Coefficient: The Matthews Correlation Coefficient (MCC) is used in machine learning as a measure of the quality of binary (two-class) classifications [179]. MCC is a correlation coefficient between the observed and predicted binary classifications; it returns a value between −1 and +1. A coefficient of +1 represents a perfect prediction, 0 no better than random prediction and −1 indicates total disagreement between prediction and observation.It’s equivalent to phi coefficient.
- Area Under the Curve: A Receiver Operating Characteristic Curve or ROC curve is a graph that shows the performance of a classification model at all classification thresholds, representing the true positive rate (TPR) against the false positive rate (FPR). The AUC measures the entire two-dimensional area below the full ROC curve, ranging from 0 (model with 100% incorrect predictions) to 1 (model with 100% correct predictions), representing degrees of separability and thus indicating a model’s ability to distinguish between classes. [180].
5. Discussion
- Attacks: 11 (12.5%) of the 88 studies reviewed focus on prevention and mitigation of SQLI attacks. The same amount and percentage applies to prevention and mitigation of denial of service (DDoS) attacks. Both types of attacks are included as high risk in various attack classification systems such as OWASP Top Ten Project [181], Common Attack Pattern Enumeration and Classification(CAPEC) [182], Common Weakness Enumeration (CWE) [183], OWASP Automated Threat Handbook Web Applications [184], etc. Only 2 of the studies reviewed target the detection of Botnet attacks (2.27%) and two more focus on the detection of Defacement attacks (2.27%). Also, the type of attack is not clearly specified in the vast majority of studies reviewed: 62 out of 88 (70.45%). Figure 5 presents an overview of the percentage of studies focused on the prevention or detection of specific attacks.Due to the wide variety of web attacks that currently exist, it seems necessary to make efforts aimed at specifying clearly and in detail the types of attacks studied in the new papers that will be published from now on. In addition, it is suggested to use recognized resources (e.g., OWASP Top Ten, CAPEC, etc.) to be able to determine the types of attacks with the highest prevalence and thus be able to focus on their study and detection.
- Algorithms and techniques used:
- –
- Clusterin algorithms: 27 (30.68%) of the 88 studies reviewed used some kind of clustering algorithm. 7 (25.93%) of these 27 studies used more than one type of clustering algorithm: for example, Zolotukhin et al. [35] used 5 clustering algorithms, namely: K-Means, DBSCAN, single-linkage clustering, Self-Organizing Map (SOM), Fuzzy C-Means. The K-Means clustering algorithm is the most used: it is included in 7 of the 27 studies, although in 3 of them it is combined with other clustering algorithms. Gaussian Mixture Model (GMM) is used in 4 different studies, always in combination with other clustering algorithms: Yuan et al. [45] combine GMM with deep learning enabled subspace spectral ensemble clustering (DEP-SSEC) and Subspace Spectral Ensemble Clustering (SSEC). In [163], Kozik, Choraś and Holubowicz combine GMM with Expectation Maximisation (EM). Betarte et al. [93] combine GMM with Mahalanobis Distance and Expectation Maximisation (EM). In [94], Lin et al. combine GMM with Subspace Weighted Ensemble Clustering (SWEC).
- –
- Classification algorithms: 47 (53.41%) of the 88 studies reviewed propose some kind of classification algorithm (including those that propose the use of neural networks). Markov-type models represent a 31.91% (15 of 47 studies): Hidden Markov Model (HMM), Semi-Markov Model, Continuous Time Markov Chains, Markov Chain Monte Carlo, Markov Random Field, etc. In 13 (27.66%) of the 47 studies reviewed, the use of decision tree algorithms is proposed, Random Forest and Isolation Forest: Reduced Error Pruning Tree (REPTree), Decision Stump (DS), Isolation Forest, Information Gain (IG), XGBoost, etc. The use of Support Vector Machine (SVM) is proposed in 11 (23.40%) of the 47 studies, although 9 (19.15%) of them are of the One-Class Support Vector Machine (OCSVM) type, while the K-Nearest Neighbors (K-NN) algorithm is proposed in 5 (10.64%) of the 47 studies. Combining different classification algorithms is common: Wang and Zhang [103] introduced Information Gain based attribute selection, and then K-NN and OCSVM were used to detect anomalies. Zhang, Lu and Xu [63] propose a multi-model approach: First, the web request is partitioned into 7 fields: method, web resource, HTTP version, headers and headers inputs values are inspected by a probability distribution model, attribute sequence is inspected by HMM and attribute value is inspected by OCSVM. If one of the algorithms detects the request as anomalous, it is classified as anomalous. Kim and Cho [89] proposed a C-LSTM neural network to model the spatial and temporal information contained in traffic data. More complex characteristics are extracted from the data, combining Convolutional Neural Network (CNN) and Recurrent Neural Network (RNN)—used to reduce frequency variation in the spatial information—, Long Short Term Memory (LSTM)—reduces temporal variation—and a Deep Neural Network (DNN)—used as a classifier, mapping the data in a more defined space. The detection of anomalies is done through the use of a SOFTMAX function.
- –
- Feature Selection and Extraction: 17 of the 88 studies reviewed propose some kind of classification Feature Selection algorithm. 12 (70.59%) of these 17 studies are based on the N-grams algorithm for selection and feature extraction. 2 (11.76%) are based on the Bag of Words (BOW) algorithm. Vartouni, Kashi and Teshnehlab [59] propose an anomaly detection model in which the characteristics of web requests are extracted using an n-grams model based on character distribution. Subsequently, a dimensionality reduction is performed by means of SAE and finally, a classification task is performed by means of Isolation Forest. Zolotukhin et al. [60] propose an anomaly detection model in which n-grams are applied to extract the characteristics of web requests. Sample Entropy is used to capture the degree of dispersion or concentration of the web request parameter distribution in a given time interval. Unsupervised models are then used to generate a normal pattern. Using PCA, a dimensionality reduction is performed. Once PCA is applied, SVDD is applied to the transformed vectors of the training set, to build a hypersphere containing all the data in one category. To detect anomalies in the parameters of a web request, k-means is used. The detection of intrusions inside the user agent is carried out by DBSCAN. Asselin, Aguilar-Melchor and Jakllari [61] propose the use of n-grams to extract all the bi-grams from the URLs of a web server and generate a harmonic average of the probabilities that a given bi-gram is part of a normal request. New requests are classified as normal or abnormal depending on the probability of their bi-grams. Ren et al. [48] propose a model in which by means of BOW the extraction of characteristics of the web requests is carried out. Then, the detection of anomalies is done by HMM.
- –
- Dimensionality Reduction: Only in 7 (7.95%) of the studies reviewed is some kind of dimensionality reduction technique applied. Principal Component Analysis (PCA) is applied in 6 of these 7 studies although in one of them it is combined with Random Projection (RP) and Diffusion Map (DM) and, in another one, it is combined with Sample Entropy. The remaining study applies Linear Discriminant Analysis (LDA) as a dimensionality reduction technique. Juvonen, Sipola and Hämäläinen [57] present the results from three methods that can be used for web log dimensionality reduction in order in order to allow the analysis and detection of anomalies: random projection, principal component analysis and diffusion maps. Based on the experimental results, they propose that RP and DM should be used together. RP methodology is efficient for daily analysis of huge amounts of traffic, while DM produces better visualizations and more accurate analysis of smaller amounts of data when needed. PCA falls in between of the other methods, but does not seem to offer any major advantages. In [49], Kozik, Choraś and Holubowicz estimated LDA transformation vector with Simulated Annealing approach in order to increase the effectiveness of SQL injection attack detection.
The use of dimensionality reduction techniques is recommended as an area for improvement in new research work. As previously mentioned, less than 8% of the papers reviewed incorporate this type of techniques, which allow the reduction of the number of characteristics of complex data samples, thus generating simpler models that avoid their overfitting to the training data and, therefore, a low performance with real data. - Datasets: Only 26 (29.55%) of the 88 papers include public datasets in their experiments. The rest (70.45%) include private, synthetic or unspecified datasets, making it impossible to replicate the experiments and verify the results. Of the 26 studies that include public datasets, 12 of them include datasets that belong to the DARPA and KDD families, which have been widely criticized in several studies [17,18,19,20].The creation of public datasets, including new types of attacks, appears to be a major area to which new research efforts should be directed. Of considerable concern is the fact that the results obtained by 70% of the papers reviewed cannot be audited, replicated or validated because there is no access to the data on which these results are based. The availability of public data endorsed by the scientific community would allow further progress in the prevention of web attacks while avoiding problems associated with data privacy.
- Metrics: While most of the studies reviewed use FPR (61 of 88), TPR/Recall/Sensitivity/DR (49 of 88) and Accuracy (24 of 88), and which represent 69.32%, 55.68%, and 27.27% respectively, only 12 of them use F-Score (13.64%), 11 use precision (12.5%), and 10 use ROC/AUC (11.36%) as metrics to evaluate the experiments performed with the different algorithms analyzed. This fact is noteworthy because F-Score, accuracy and ROC/AUC are widely used metrics in work related to vulnerability detection, tool comparison, etc. [185].The comparison of the results of the different techniques applied in the studies reviewed is difficult since there is no single public dataset widely accepted by the scientific community that allows for the replication of results, with most of the studies reviewed being based on non-publicly accessible datasets; because of this, the authors have decided to analyse the most representative results of the studies that are based on publicly accessible datasets.Nguyen, Nguyen and Vu [77] combine an n-gram model for feature extraction and OCSVM for anomaly detection, based on the DARPA dataset, obtaining an AUC of 0.91425 for generic attacks, an AUC of 0.9912 for Shell-Code attacks and an AUC of 0.9831 for Traditional Polymorphic Attacks (CLET). Jamdagni et al. [102] propose an anomaly detection model based on Geometrical Structure Anomaly Detection (GSAD): this is a pattern recognition technique used in image processing. GSAD analyzes the correlations between various payload characteristics, using Mahalanobis Distance Map (MDM) to calculate the difference between normal and abnormal traffic, based on the DARPA dataset. The results obtained are 100% True Positive Rate (TPR) and 0.087% False Positive rate (FPR). Angiulli, Argento and Furfaro [82] identify anomalous packets in the DARPA dataset, by dividing the payload into segments of equal length, using n-grams to learn the byte sequences that usually appear in each chunk. Using a semi-supervised approach, a model is built that associates the protocol-packet length pair. This model is used to classify incoming traffic. Anomaly detection is carried out using Mahalanobis distance to determine whether a sequence of n-grams is unusual or not. A TPR of 100% and an FPR of 0.588% are obtained, but only for FTP traffic.Wang et al. [58] use the Affinity Propagation (AP) algorithm by which they learn a subject’s behavior through dynamic clustering of the data flow. It automatically tags the data and adapts to normal changes in behavior while detecting anomalies. Its study is based on the KDD-Cup 99 dataset and obtains a TPR of 98.4% and an FPR of 1.01%. Kaur and Bansal [81] implement the genetic algorithm (GA) to form clusters of normal and abnormal traffic in the training data set. The resulting clusters are used to generate normal and abnormal data partitions in the test data set. Finally, a classification of attack types is performed using SVM. The study is based on the KDD-Cup 99 dataset and obtains a TPR of 99.46%, an FPR of 1.96% and an Accuracy of 92.09%. Li et al. [97] propose an anomaly detection system based on Transductive Confidence Machines for K-NN (TCM-KNN). GA is used to reduce the size of the training dataset for the TCM-KNN model. Based on the KDD-Cup 99 dataset, it obtains a TPR of 99.38% and an FPR of 3.87%, complementing the TCM-KNN model with CHC (A genetic Algorithm called heterogeneous recombination and cataclysmic mutation used as search strategy).Kamarudin et al. [75] propose a web anomaly detection model based on two stages: pre-processing and data mining. Pre-processing adopts the Hybrid Feature Selection (HFS) technique. In this phase, the characteristics are extracted. In the data mining phase, the classification is done by the LogitBoost algorithm. This study is based on the NSL-KDD and UNSW-NB15 datasets, obtaining a TPR of 89.75%, a FPR of 8.22% and a 90.33% of Accuracy in the NSL-KDD dataset; in the UNSW-NB15 dataset, the results obtained are as follows TPR: 99.1%, FPR: 0.18%, Accuracy: 99.45%.Moustafa, Misra and Slay [79] propose a 4-step methodology: 1- Collect attack data by crawling websites and represent this data as feature vectors, 2- Extract features by association rules (ARM), 3- Use the extracted features to simulate web attacks, 4- Use a new Outlier Gaussian Mixture (OGM) algorithm to detect attacks. The data is obtained from the UNSW-NB15 dataset and from a non-publicly accessible dataset; a TPR of 95.56% and an FPR of 4.43% are obtained with the UNSW-NB15 dataset data. The metrics obtained with the data from the private dataset are TPR of 97.28% and FPR of 2.72%.Alhakami et al. [116] propose a model in which patterns of activities (both normal and abnormal) are learned through Bayesian-based MCMC inference for infinite bounded generalized Gaussian mixture models. Unlike classical clustering methods, this approach does not need to specify the number of clusters, takes into account uncertainty by introducing prior knowledge for the parameters of the model, and allows to solve problems related to over and under evaluation. To obtain better cluster performance, weights of characteristics, model parameters and number of clusters are estimated simultaneously and automatically. The model evaluation data come from the KDD-Cup 99, Kyoto 2006 and ISCX datasets. The following metrics are obtained: Accuracy 83.49%, 87.41%, 90.4% FPR: 16.84%, 14.24%, 9.79% in the KDD-Cup 99, Kyoto 2006 and ISCX datasets respectively.Alrawashdeh and Purdy [80] propose a rapid activation Adaptive Linear Function (ALF) that increases the speed of convergence and the accuracy of deep learning networks in real-time applications. Accuracy levels are as follows: 96.57%, 98.59%, 99.96% and 98.4% in the CSIC-2010, KDD-Cup 99, NSL-KDD and Kyoto 2006 datasets respectively.Vartouni, Kashi and Teshnehlab [59] propose a model in which the characteristics of the web requests are extracted through an n-grams model based on character distribution. Subsequently, a dimensionality reduction is performed by means of SAE and finally a classification task is carried out by means of Isolation Forest. The evaluation data come from the dataset CSIC-2010; the metrics obtained are TPR: 88.34%, Precision: 80.29%, Accuracy: 88.32%, Specificity: 88.32%, F-Score: 84.12%.Parhizkar and Abadi [64] propose a model in which, in the training phase, an initial set of One-Class Support Vector Machine is extracted (OCSVM) on the basis of legitimate requests. This initial set of OCSVM is then pruned using the ABC BeeSnips algorithm, with the aim of finding a “quasi-optimal” subset. In the detection phase, the outputs of the OCSVM present in the subset are combined to classify a new request as normal or abnormal. Based on the CSIC-2010 dataset, the metrics obtained are as follows: TPR: 95.9%, FPR: 2.82%, Accuracy: 96.54%.Betartte et al. [93] try to improve the detection of ModSecurity through two approaches: the first, by building a One-Class Classification model. The second, by using N-grams for anomaly detection. In the One-Class Classification model, Gaussian Mixture Model (GMM) is used as the probability density distribution of the training data. Expectation Maximisation (EM) is used to estimate GMM parameters and the number of clusters. In the use of n-grams, Mahalanobis distance is used to detect the anomalies. The model evaluation data come from the CSIC-2010 dataset; for N-grams = 3, it obtains a TPR of 96.1% and a specificity of 99.5%.Moradi Vartouni, Teshnehlab and Sedighian Kashi [114] propose a model that uses stacked auto-encoder (SAE) and deep belief network as feature learning methods in which only normal data is used in the learning phase. Subsequently, OCSVM, Isolation Forest and Elliptic Envelope are used as classifiers. The model is based on the datasets CSIC-2010 and ECML/PKDD 2007; the best values obtained are DR: 89.48%, Specificity: 89.11%, F-Score: 85.35% in the CSIC-2010 dataset and TPR: 89.75%, Specificity: 78.25%, F-Score: 84.93% in the ECML/PKDD 2007 dataset.Kozik and Choraś [65] propose a model in which, firstly, an extraction of the tokens and the data between them is performed, to later transform them into a characteristics vector by distributing characters in different ranges of the ASCII table, thus achieving a reduction in dimensionality. The classification is carried out by means of a set of One Class Classifiers, specifically Decision Stump (DS) and RepTree. The data come from the dataset CSIC-2010 and the results obtained are TPR: 98.3%, FPR: 1.9%, Precision: 94.6%, F-Score: 96.4%.Choraś and Kozik [72] propose a model in which they use a graphical approach to build a set of regular expressions to model HTTP requests. An attempt is made to group similar web requests and represent them using a single pattern. The measure of dissimilarity between components is done by the Needleman-Wunsch algorithm. The data come from the dataset CSIC-2010, obtaining a TPR of 94.46% and an FPR of 4.5%.Kozik et al. [87] present a model in which a character pattern extraction method is used in web requests, based on the ICD (Ideal Character Distribution) proposed by Kruegel [186], but applied to different ranges of the ASCII table in order to reduce the dimensionality. The data come from the dataset CSIC-2010 and the results obtained are TPR: 86.6%, FPR: 1.8% for 1% of the dataset (300 samples), TPR: 95.6%, FPR: 5.8% for 10% of the dataset (3000 samples), TPR: 96.9%, FPR: 6.8% for 20% of the dataset (6000 samples), TPR: 97.7%, FPR: 8.1% for 100% of the dataset (32,400 samples).Kozik, Choraś and Hołubowicz [43] propose a model in which the genetic algorithm is used to determine the valid subset of extracted tokens and their correct order. The data between tokens is classified by assigning the distribution of characters to different intervals in the ASCII table. RepTree and DS are used as classifiers. The data come from the extended CSIC-2010 dataset (CSIC-2010+) using new data samples collected during penetration tests carried out in a web-based Geographic Information System (GIS)-system. The total number of records from the original dataset was increased by 3.6%, adding 2.08% of normal samples (around 1500 requests) as well as 7.9% of new attacks (around 2000 anomalous requests). This results in a Precision level of 98%.In [74], Kozik, Choraś and Hołubowicz propose the processing of web requests in order to extract vectors of constant length characteristics. Then k-means is applied in order to group web requests of similar characteristics. Finally, through multiple sequence alignment (MSA), an analysis of the request structure is performed. The data come from the dataset CSIC-2010+, obtaining a TPR of 92.7% and a FPR of 6.4%.Kozik and Choraś [85] propose a model in which a genetic algorithm (GA) is used to realign HTTP payload sequences and extract their structure. The number of characters falling into different ranges of the ASCII table is counted. A hybrid classification technique combining REPTree and AdaBoost is used. The data come from the dataset CSIC-2010+, obtaining a TPR of 91.5% and an FPR of 0.7%.In [86], Kozik et al. propose a model in which, after extracting the characteristics of web requests by distributing characters that fall within a given range of the ASCII table, Extreme Learning Machine is applied to classify the data as normal or abnormal. The data come from the dataset CSIC-2010+, obtaining a TPR of 94.98% and an FPR of 0.79%.In [117], Kozik and Choraś propose a modified version of the Random Forest algorithm as a classifier. The study uses data from the dataset CSIC-2010+ and the results obtained are TPR: 93.5% and FPR: 0.5%.Please note that the results of studies using data from the DARPA and KDD-Cup 99 datasets should be taken with caution, as these datasets have been widely criticized by the scientific community [17,18,19,20].Table 11 provides a summary of the results of the different studies based on public datasets.The authors recommend selecting the appropriate result validation metrics based on the type of vulnerability scenario to be protected (Business-Critical Applications, Heightened-Critical Applications, Best Effort, Minimum Effort) as recommended in [185].
6. Conclusions
Author Contributions
Funding
Conflicts of Interest
Appendix A. Appendix Quality Assurance Form
Appendix A.1. Section 1
- This section includes: intrusion detection, DDoS attacks, IDS/IPS improvement, WAF, RASP, detection and prevention of any attack classified in OWASP Top Ten.
- The study should focus on the detection of anomalies using different techniques: probability distribution models, Markov models, one-class SVM, clustering models, data minig and, in general, any automatic learning technique.
Appendix A.2. Section 2
- Check whether the study provides any kind of empirical measure that allows the objective interpretation of the data obtained.
Appendix A.3. Section 3
- Are the research objectives clearly defined?
- Is the choice of techniques used correctly justified?
- Are the techniques used correctly detailed?
- Is the measurement of the variables involved correct?
- Are data collection methods correctly described?
- Are objective indicators applied for the analysis of the results obtained?
- Are the objective indicators applied adequate, correctly described and justified?
- Are all research objectives adequately addressed?
- Are negative results specified?
- Are problems of validity or trust of the results obtained adequately discussed?
- Is there a clearly defined relationship between objectives, data obtained, interpretation and conclusions?
Appendix B. Appendix Data Retrieval Form
| Data Item | Description |
| Study identifier | Unique ID for the study |
| Date of data retrieval | |
| Bibliographic data | Title of the study, name(s) of the author(s), publication year |
| Type of study | Journal, conference, workshop, etc. |
| Study objective | What is the principal objective of the study, what research areas the study is focused on |
| Study classification | Case study, experiment, survey, comparative analysis, etc. |
| Type of anomaly detection technique used | |
| What statistical indexes are used and its values | Values of the statistical indexes used for the objective validation of the results of the study experiments |
| Type of dataset | It refers specifically to the type of dataset used for the development of the experiment or the validation of the proposed model. (Publicly available, from private institution, synthetically generated, etc.) |
| Study findings | Major findings or conclusions from the study |
References
- Liao, H.J.; Richard Lin, C.H.; Lin, Y.C.; Tung, K.Y. Intrusion detection system: A comprehensive review. J. Netw. Comput. Appl. 2013, 36, 16–24. [Google Scholar] [CrossRef]
- Jyothsna, V. A Review of Anomaly based Intrusion Detection Systems. Int. J. Comput. Appl. 2011, 28, 26–35. [Google Scholar] [CrossRef]
- Kakavand, M.; Mustapha, N.; Mustapha, A.; Abdullah, M.T.; Riahi, H. A Survey of Anomaly Detection Using Data Mining Methods for Hypertext Transfer Protocol Web Services. JCS 2015, 11, 89–97. [Google Scholar] [CrossRef] [Green Version]
- Samrin, R.; Vasumathi, D. Review on anomaly based network intrusion detection system. In Proceedings of the 2017 International Conference on Electrical, Electronics, Communication, Computer, and Optimization Techniques (ICEECCOT), Mysuru, India, 15–16 December 2017; pp. 141–147. [Google Scholar] [CrossRef]
- Kitchenham, B.; Charters, S. Guidelines for Performing Systematic Literature Reviews in Software Engineering Version 2.3; Technical Report; Keele University: Keele, UK; University of Durham: Durham, UK, 2007. [Google Scholar]
- Brereton, P.; Kitchenham, B.A.; Budgen, D.; Turner, M.; Khalil, M. Lessons from applying the systematic literature review process within the software engineering domain. J. Syst. Softw. 2007, 80, 571–583. [Google Scholar] [CrossRef] [Green Version]
- Budgen, D.; Brereton, P. Performing Systematic Literature Reviews in Software Engineering. In Proceedings of the 28th International Conference on Software Engineering, Shanghai, China, 20–28 December 2006; Association for Computing Machinery: New York, NY, USA, 2006; pp. 1051–1052. [Google Scholar] [CrossRef]
- Kitchenham, B.; Pearl Brereton, O.; Budgen, D.; Turner, M.; Bailey, J.; Linkman, S. Systematic literature reviews in software engineering—A systematic literature review. Inf. Softw. Technol. 2009, 51, 7–15. [Google Scholar] [CrossRef]
- Kitchenham, B.; Brereton, P. A Systematic Review of Systematic Review Process Research in Software Engineering. Manuscr. Publ. Inf. Softw. Technol. 2013, 55, 2049–2075. [Google Scholar] [CrossRef]
- Patel, A.; Taghavi, M.; Bakhtiyari, K.; Celestino Júnior, J. An intrusion detection and prevention system in cloud computing: A systematic review. J. Netw. Comput. Appl. 2013, 36, 25–41. [Google Scholar] [CrossRef]
- Raghav, I.; Chhikara, S.; Hasteer, N. Article: Intrusion Detection and Prevention in Cloud Environment: A Systematic Review. Int. J. Comput. Appl. 2013, 68, 7–11. [Google Scholar]
- Patcha, A.; Park, J.M. An overview of anomaly detection techniques: Existing solutions and latest technological trends. Comput. Netw. 2007, 51, 3448–3470. [Google Scholar] [CrossRef]
- Chandola, V.; Banerjee, A.; Kumar, V. Anomaly Detection: A Survey. ACM Comput. Surv. 2009, 41. [Google Scholar] [CrossRef]
- Jose, S.; Malathi, D.; Reddy, B.; Jayaseeli, D. A Survey on Anomaly Based Host Intrusion Detection System. J. Phys. Conf. Ser. 2018. [Google Scholar] [CrossRef]
- Fernandes, G.; Rodrigues, J.J.P.C.; Carvalho, L.F.; Al-Muhtadi, J.F.; Proença, M.L. A comprehensive survey on network anomaly detection. Telecommun. Syst. 2019, 70, 447–489. [Google Scholar] [CrossRef]
- Kwon, D.; Kim, H.; Kim, J.; Suh, S.C.; Kim, I.; Kim, K.J. A survey of deep learning-based network anomaly detection. Clust. Comput. 2019, 22, 949–961. [Google Scholar] [CrossRef]
- Tavallaee, M.; Bagheri, E.; Lu, W.; Ghorbani, A.A. A Detailed Analysis of the KDD CUP 99 Data Set. In Proceedings of the Second IEEE International Conference on Computational Intelligence for Security and Defense Applications, Ottawa, ON, Canada, 8–10 July 2009; IEEE Press: Piscataway, NJ, USA, 2009; pp. 53–58. [Google Scholar]
- McHugh, J. Testing Intrusion Detection Systems: A Critique of the 1998 and 1999 DARPA Intrusion Detection System Evaluations as Performed by Lincoln Laboratory. ACM Trans. Inf. Syst. Secur. 2000, 3, 262–294. [Google Scholar] [CrossRef]
- Mahoney, M.V.; Chan, P.K. An Analysis of the 1999 DARPA/Lincoln Laboratory Evaluation Data for Network Anomaly Detection BT—Recent Advances in Intrusion Detection. In Recent Advances in Intrusion Detection; Vigna, G., Kruegel, C., Jonsson, E., Eds.; Springer: Berlin/Heidelberg, Germany, 2003; pp. 220–237. [Google Scholar]
- Brugger, T. KDD Cup ’99 dataset (Network Intrusion) considered harmful. KDnuggets News 2007, 7, 15. [Google Scholar]
- Ieracitano, C.; Adeel, A.; Gogate, M.; Dashtipour, K.; Morabito, F.C.; Larijani, H.; Raza, A.; Hussain, A. Statistical Analysis Driven Optimized Deep Learning System for Intrusion Detection BT. In Advances in Brain Inspired Cognitive Systems; Ren, J., Hussain, A., Zheng, J., Liu, C.L., Luo, B., Zhao, H., Zhao, X., Eds.; Springer International Publishing: Cham, Switzerland, 2018; pp. 759–769. [Google Scholar]
- Ieracitano, C.; Adeel, A.; Morabito, F.C.; Hussain, A. A novel statistical analysis and autoencoder driven intelligent intrusion detection approach. Neurocomputing 2020, 387, 51–62. [Google Scholar] [CrossRef]
- Khraisat, A.; Gondal, I.; Vamplew, P.; Kamruzzaman, J. Survey of intrusion detection systems: Techniques, datasets and challenges. Cybersecurity 2019, 2, 20. [Google Scholar] [CrossRef]
- Ahmed, M.; Naser Mahmood, A.; Hu, J. A survey of network anomaly detection techniques. J. Netw. Comput. Appl. 2016, 60, 19–31. [Google Scholar] [CrossRef]
- Kotu, V.; Deshpande, B. Chapter 13—Anomaly Detection. In Data Science, 2nd ed.; Kotu, V., Deshpande, B., Eds.; Morgan Kaufmann: Burlington, MA, USA, 2019; pp. 447–465. [Google Scholar] [CrossRef]
- Hodge, V.J.; Austin, J. A Survey of Outlier Detection Methodologies. Artif. Intell. Rev. 2004, 22, 85–126. [Google Scholar] [CrossRef] [Green Version]
- Kaelbling, L.P.; Littman, M.L.; Moore, A.W. Reinforcement learning: A survey. J. Artif. Intell. Res. 1996, 4, 237–285. [Google Scholar] [CrossRef] [Green Version]
- Guyon, I.; Elisseeff, A. An Introduction to Variable and Feature Selection. J. Mach. Learn. Res. 2003, 3, 1157–1182. [Google Scholar]
- Pudil, P.; Novovičová, J. Novel Methods for Feature Subset Selection with Respect to Problem Knowledge BT—Feature Extraction, Construction and Selection: A Data Mining Perspective. In Feature Extraction, Construction and Selection. The Springer International Series in Engineering and Computer Science; Liu, H., Motoda, H., Eds.; Springer: Boston, MA, USA, 1998; Volume 453, pp. 101–116. [Google Scholar] [CrossRef]
- Hu, H.; Zahorian, S.A. Dimensionality reduction methods for HMM phonetic recognition. In Proceedings of the 2010 IEEE International Conference on Acoustics, Speech and Signal Processing, Dallas, TX, USA, 14–19 March 2010; pp. 4854–4857. [Google Scholar] [CrossRef]
- García-Teodoro, P.; Díaz-Verdejo, J.; Maciá-Fernández, G.; Vázquez, E. Anomaly-based network intrusion detection: Techniques, systems and challenges. Comput. Secur. 2009, 28, 18–28. [Google Scholar] [CrossRef]
- Thang, T.M.; Nguyen, K.V. FDDA: A Framework For Fast Detecting Source Attack In Web Application DDoS Attack. In Proceedings of the Eighth International Symposium on Information and Communication Technology, Nha Trang, Vietnam, 7–8 December 2017; Association for Computing Machinery: New York, NY, USA, 2017. SoICT 2017. pp. 278–285. [Google Scholar] [CrossRef]
- Tripathi, N.; Hubballi, N. Slow Rate Denial of Service Attacks against HTTP/2 and Detection. Comput. Secur. 2018, 72, 255–272. [Google Scholar] [CrossRef]
- Najafabadi, M.M.; Khoshgoftaar, T.M.; Calvert, C.; Kemp, C. User Behavior Anomaly Detection for Application Layer DDoS Attacks. In Proceedings of the 2017 IEEE International Conference on Information Reuse and Integration (IRI), San Diego, CA, USA, 4–6 August 2017; pp. 154–161. [Google Scholar] [CrossRef]
- Zolotukhin, M.; Hämäläinen, T.; Kokkonen, T.; Siltanen, J. Increasing web service availability by detecting application-layer DDoS attacks in encrypted traffic. In Proceedings of the 2016 23rd International Conference on Telecommunications (ICT), Thessaloniki, Greece, 16–18 May 2016; pp. 1–6. [Google Scholar] [CrossRef]
- Shirani, P.; Azgomi, M.A.; Alrabaee, S. A method for intrusion detection in web services based on time series. In Proceedings of the 2015 IEEE 28th Canadian Conference on Electrical and Computer Engineering (CCECE), Halifax, NS, Canada, 3–6 May 2015; pp. 836–841. [Google Scholar] [CrossRef]
- Tripathi, N.; Hubballi, N.; Singh, Y. How Secure are Web Servers? In An Empirical Study of Slow HTTP DoS Attacks and Detection. In Proceedings of the 2016 11th International Conference on Availability, Reliability and Security (ARES), Salzburg, Austria, 31 August–2 September 2016; pp. 454–463. [Google Scholar] [CrossRef]
- Wang, C.; Miu, T.T.N.; Luo, X.; Wang, J. SkyShield: A Sketch-Based Defense System Against Application Layer DDoS Attacks. IEEE Trans. Inf. Forensics Secur. 2018, 13, 559–573. [Google Scholar] [CrossRef]
- Wang, Y.; Liu, L.; Si, C.; Sun, B. A novel approach for countering application layer DDoS attacks. In Proceedings of the 2017 IEEE 2nd Advanced Information Technology, Electronic and Automation Control Conference (IAEAC), Chongqing, China, 25–26 March 2017; pp. 1814–1817. [Google Scholar] [CrossRef]
- Xie, Y.; Tang, S. Online Anomaly Detection Based on Web Usage Mining. In Proceedings of the 2012 IEEE 26th International Parallel and Distributed Processing Symposium Workshops PhD Forum, Shanghai, China, 21–25 May 2012; pp. 1177–1182. [Google Scholar] [CrossRef]
- Lin, H.; Cao, S.; Wu, J.; Cao, Z.; Wang, F. Identifying Application-Layer DDoS Attacks Based on Request Rhythm Matrices. IEEE Access 2019, 7, 164480–164491. [Google Scholar] [CrossRef]
- Xiao, R.; Su, J.; Du, X.; Jiang, J.; Lin, X.; Lin, L. SFAD: Toward effective anomaly detection based on session feature similarity. Knowl.-Based Syst. 2019, 165, 149–156. [Google Scholar] [CrossRef]
- Kozik, R.; Choraś, M.; Hołubowicz, W. Evolutionary-based packets classification for anomaly detection in web layer. Secur. Commun. Netw. 2016, 9, 2901–2910. [Google Scholar] [CrossRef] [Green Version]
- Wang, L.; Cao, S.; Wan, L.; Wang, F. Web Anomaly Detection Based on Frequent Closed Episode Rules. In Proceedings of the 2017 IEEE Trustcom/BigDataSE/ICESS, Sydney, NSW, Australia, 1–4 August 2017; pp. 967–972. [Google Scholar] [CrossRef]
- Yuan, G.; Li, B.; Yao, Y.; Zhang, S. A deep learning enabled subspace spectral ensemble clustering approach for web anomaly detection. In Proceedings of the 2017 International Joint Conference on Neural Networks (IJCNN), Anchorage, AK, USA, 14–19 May 2017; pp. 3896–3903. [Google Scholar] [CrossRef]
- Bronte, R.; Shahriar, H.; Haddad, H. Information Theoretic Anomaly Detection Framework for Web Application. In Proceedings of the 2016 IEEE 40th Annual Computer Software and Applications Conference (COMPSAC), Atlanta, GA, USA, 10–14 June 2016; Volume 2, pp. 394–399. [Google Scholar] [CrossRef]
- Luo, Y.; Cheng, S.; Liu, C.; Jiang, F. PU Learning in Payload-based Web Anomaly Detection. In Proceedings of the 2018 Third International Conference on Security of Smart Cities, Industrial Control System and Communications (SSIC), Shanghai, China, 18–19 October 2018; pp. 1–5. [Google Scholar] [CrossRef]
- Ren, X.; Hu, Y.; Kuang, W.; Souleymanou, M.B. A Web Attack Detection Technology Based on Bag of Words and Hidden Markov Model. In Proceedings of the 2018 IEEE 15th International Conference on Mobile Ad Hoc and Sensor Systems (MASS), Chengdu, China, 9–12 October 2018; pp. 526–531. [Google Scholar] [CrossRef]
- Kozik, R.; Choraś, M.; Hołubowicz, W. Hardening Web Applications against SQL Injection Attacks Using Anomaly Detection Approach. In Image Processing & Communications Challenges 6; Choraś, R.S., Ed.; Springer International Publishing: Cham, Switzerland, 2015; pp. 285–292. [Google Scholar]
- Maggi, F.; Robertson, W.; Kruegel, C.; Vigna, G. Protecting a Moving Target: Addressing Web Application Concept Drift. In Recent Advances in Intrusion Detection; Kirda, E., Jha, S., Balzarotti, D., Eds.; Springer: Berlin/Heidelberg, Germany, 2009; pp. 21–40. [Google Scholar]
- Valeur, F.; Vigna, G.; Kruegel, C.; Kirda, E. An Anomaly-Driven Reverse Proxy for Web Applications. In Proceedings of the 2006 ACM Symposium on Applied Computing, Dijon, France, 23–27 April 2006; Association for Computing Machinery: New York, NY, USA, 2006; pp. 361–368. [Google Scholar] [CrossRef] [Green Version]
- Guangmin, L. Modeling Unknown Web Attacks in Network Anomaly Detection. In Proceedings of the 2008 Third International Conference on Convergence and Hybrid Information Technology, Busan, Korea, 11–13 November 2008; Volume 2, pp. 112–116. [Google Scholar] [CrossRef]
- Yu, S.; Guo, S.; Stojmenovic, I. Fool Me If You Can: Mimicking Attacks and Anti-Attacks in Cyberspace. IEEE Trans. Comput. 2015, 64, 139–151. [Google Scholar] [CrossRef]
- Sakib, M.N.; Huang, C. Using anomaly detection based techniques to detect HTTP-based botnet C C traffic. In Proceedings of the 2016 IEEE International Conference on Communications (ICC), Kuala Lumpur, Malaysia, 22–27 May 2016; pp. 1–6. [Google Scholar] [CrossRef]
- Medvet, E.; Bartoli, A. On the Effects of Learning Set Corruption in Anomaly-Based Detection of Web Defacements. In Detection of Intrusions and Malware, and Vulnerability Assessment; Hämmerli, M.B., Sommer, R., Eds.; Springer: Berlin/Heidelberg, Germany, 2007; pp. 60–78. [Google Scholar]
- Davanzo, G.; Medvet, E.; Bartoli, A. Anomaly detection techniques for a web defacement monitoring service. Expert Syst. Appl. 2011, 38, 12521–12530. [Google Scholar] [CrossRef]
- Juvonen, A.; Sipola, T.; Hämäläinen, T. Online anomaly detection using dimensionality reduction techniques for HTTP log analysis. Comput. Netw. 2015, 91, 46–56. [Google Scholar] [CrossRef]
- Wang, W.; Guyet, T.; Quiniou, R.; Cordier, M.O.; Masseglia, F.; Zhang, X. Autonomic Intrusion Detection. Know.-Based Syst. 2014, 70, 103–117. [Google Scholar] [CrossRef] [Green Version]
- Vartouni, A.M.; Kashi, S.S.; Teshnehlab, M. An anomaly detection method to detect web attacks using Stacked Auto-Encoder. In Proceedings of the 2018 6th Iranian Joint Congress on Fuzzy and Intelligent Systems (CFIS), Kerman, Iran, 28 February–2 March 2018; pp. 131–134. [Google Scholar] [CrossRef]
- Zolotukhin, M.; Hämäläinen, T.; Kokkonen, T.; Siltanen, J. Analysis of HTTP requests for anomaly detection of web attacks. In Proceedings of the 2014 World Ubiquitous Science Congress: 2014 IEEE 12th International Conference on Dependable, Autonomic and Secure Computing, DASC 2014, Dalian, China, 24–27 August 2014; IEEE: Piscataway, NJ, USA, 2014; pp. 406–411. [Google Scholar] [CrossRef]
- Asselin, E.; Aguilar-Melchor, C.; Jakllari, G. Anomaly detection for web server log reduction: A simple yet efficient crawling based approach. In Proceedings of the 2016 IEEE Conference on Communications and Network Security (CNS), Philadelphia, PA, USA, 17–19 October 2016; pp. 586–590. [Google Scholar] [CrossRef]
- Zhang, S.; Li, B.; Li, J.; Zhang, M.; Chen, Y. A Novel Anomaly Detection Approach for Mitigating Web-Based Attacks Against Clouds. In Proceedings of the 2015 IEEE 2nd International Conference on Cyber Security and Cloud Computing (CSCloud), New York, NY, USA, 3–5 November 2015; IEEE Computer Society: Piscataway, NJ, USA, 2015; pp. 289–294. [Google Scholar] [CrossRef]
- Zhang, M.; Lu, S.; Xu, B. An Anomaly Detection Method Based on Multi-models to Detect Web Attacks. In Proceedings of the 2017 10th International Symposium on Computational Intelligence and Design (ISCID), Hangzhou, China, 9–10 December 2017; Volume 2, pp. 404–409. [Google Scholar] [CrossRef]
- Parhizkar, E.; Abadi, M. OC-WAD: A one-class classifier ensemble approach for anomaly detection in web traffic. In Proceedings of the 2015 23rd Iranian Conference on Electrical Engineering, Tehran, Iran, 10–14 May 2015; pp. 631–636. [Google Scholar] [CrossRef]
- Kozik, R.; Choras, M. Adapting an Ensemble of One-Class Classifiers for a Web-Layer Anomaly Detection System. In Proceedings of the 2015 10th International Conference on P2P Parallel, Grid, Cloud and Internet Computing 3PGCIC, Krakow, Poland, 4–6 November 2015; IEEE: Piscataway, NJ, USA, 2015; pp. 724–729. [Google Scholar] [CrossRef]
- Cao, Q.; Qiao, Y.; Lyu, Z. Machine learning to detect anomalies in web log analysis. In Proceedings of the 2017 3rd IEEE International Conference on Computer and Communications (ICCC), Chengdu, China, 13–16 December 2017; pp. 519–523. [Google Scholar] [CrossRef]
- Yu, J.; Tao, D.; Lin, Z. A hybrid web log based intrusion detection model. In Proceedings of the 2016 4th IEEE International Conference on Cloud Computing and Intelligence Systems, CCIS 2016, Beijing, China, 17–19 August 2016; IEEE: Piscataway, NJ, USA, 2016; pp. 356–360. [Google Scholar] [CrossRef]
- Threepak, T.; Watcharapupong, A. Web attack detection using entropy-based analysis. In Proceedings of theInternational Conference on Information Networking, Phuket, Thailand, 10–12 February 2014; IEEE: Piscataway, NJ, USA, 2014; pp. 244–247. [Google Scholar] [CrossRef]
- Swarnkar, M.; Hubballi, N. Rangegram: A novel payload based anomaly detection technique against web traffic. In Proceedings of the 2015 IEEE International Conference on Advanced Networks and Telecommuncations Systems (ANTS), Kolkata, India, 15–18 Decemnber 2015; pp. 1–6. [Google Scholar] [CrossRef]
- Xu, H.; Tao, L.; Lin, W.; Wu, Y.; Liu, J.; Wang, C. A model for website anomaly detection based on log analysis. In Proceedings of the 2014 IEEE 3rd International Conference on Cloud Computing and Intelligence Systems, Shenzhen, China, 27–29 November 2014; pp. 604–608. [Google Scholar] [CrossRef]
- Park, S.; Kim, M.; Lee, S. Anomaly Detection for HTTP Using Convolutional Autoencoders. IEEE Access 2018, 6, 70884–70901. [Google Scholar] [CrossRef]
- Choraś, M.; Kozik, R. Machine learning techniques applied to detect cyber attacks on web applications. Log. J. IGPL 2014, 23, 45–56. [Google Scholar] [CrossRef]
- Tharshini, M.; Ragavinodini, M.; Senthilkumar, R. Access Log Anomaly Detection. In Proceedings of the 2017 Ninth International Conference on Advanced Computing (ICoAC), Chennai, India, 14–16 December 2017; pp. 375–381. [Google Scholar]
- Kozik, R.; Choraś, M.; Hołubowicz, W. Packets tokenization methods for web layer cyber security. Log. J. IGPL 2016, 25, 103–113. [Google Scholar] [CrossRef]
- Kamarudin, M.H.; Maple, C.; Watson, T.; Safa, N.S. A LogitBoost-Based Algorithm for Detecting Known and Unknown Web Attacks. IEEE Access 2017, 5, 26190–26200. [Google Scholar] [CrossRef]
- Yu, Y.; Liu, G.; Yan, H.; Li, H.; Guan, H. Attention-Based Bi-LSTM Model for Anomalous HTTP Traffic Detection. In Proceedings of the 2018 15th International Conference on Service Systems and Service Management (ICSSSM), Hangzhou, China, 21–22 July 2018; pp. 1–6. [Google Scholar]
- Nguyen, X.N.; Nguyen, D.T.; Vu, L.H. POCAD: A novel pay load-based one-class classifier for anomaly detection. In Proceedings of the 2016 3rd National Foundation for Science and Technology Development Conference on Information and Computer Science (NICS), Danang, Vietnam, 14–16 September 2016; pp. 74–79. [Google Scholar] [CrossRef]
- Lu, L.; Zhu, X.; Zhang, X.; Liu, J.; Bhuiyan, M.Z.A.; Cui, G. One Intrusion Detection Method Based On Uniformed Conditional Dynamic Mutual Information. In Proceedings of the 2018 17th IEEE International Conference On Trust, Security And Privacy In Computing And Communications/12th IEEE International Conference On Big Data Science And Engineering (TrustCom/BigDataSE), New York, NY, USA, 1–3 August 2018; pp. 1236–1241. [Google Scholar] [CrossRef]
- Moustafa, N.; Misra, G.; Slay, J. Generalized Outlier Gaussian Mixture technique based on Automated Association Features for Simulating and Detecting Web Application Attacks. IEEE Trans. Sustain. Comput. 2018, 1. [Google Scholar] [CrossRef]
- Alrawashdeh, K.; Purdy, C. Fast Activation Function Approach for Deep Learning Based Online Anomaly Intrusion Detection. In Proceedings of the 2018 IEEE 4th International Conference on Big Data Security on Cloud (BigDataSecurity), IEEE International Conference on High Performance and Smart Computing, (HPSC) and IEEE International Conference on Intelligent Data and Security (IDS), Omaha, NE, USA, 3–5 May 2018; pp. 5–13. [Google Scholar] [CrossRef]
- Kaur, R.; Bansal, M. Multidimensional attacks classification based on genetic algorithm and SVM. In Proceedings of the 2016 2nd International Conference on Next Generation Computing Technologies (NGCT), Dehradun, India, 14–16 October 2016; pp. 561–565. [Google Scholar] [CrossRef]
- Angiulli, F.; Argento, L.; Furfaro, A. Exploiting N-Gram Location for Intrusion Detection. In Proceedings of the 2015 IEEE 27th International Conference on Tools with Artificial Intelligence (ICTAI), Vietri sul Mare, Italy, 9–11 November 2015; pp. 1093–1098. [Google Scholar] [CrossRef] [Green Version]
- Hiremagalore, S.; Barbará, D.; Fleck, D.; Powell, W.; Stavrou, A. transAD: An Anomaly Detection Network Intrusion Sensor for the Web. In Information Security; Chow, S.S.M., Camenisch, J., Hui, L.C.K., Yiu, S.M., Eds.; Springer International Publishing: Cham, Switzerland, 2014; pp. 477–489. [Google Scholar] [CrossRef]
- Favaretto, M.; Spolaor, R.; Conti, M.; Ferrante, M. You Surf so Strange Today: Anomaly Detection in Web Services via HMM and CTMC. In Green, Pervasive, and Cloud Computing; Au, M.H.A., Castiglione, A., Choo, K.K.R., Palmieri, F., Li, K.C., Eds.; Springer International Publishing: Cham, Switzerland, 2017; pp. 426–440. [Google Scholar] [CrossRef]
- Kozik, R.; Chorás, M. The http content segmentation method combined with adaboost classifier for web-layer anomaly detection system. Adv. Intell. Syst. Comput. 2017, 527, 555–563. [Google Scholar] [CrossRef]
- Kozik, R.; Choraś, M.; Holubowicz, W.; Renk, R. Extreme Learning Machines for Web Layer Anomaly Detection. In Image Processing and Communications Challenges 8; Choraś, R.S., Ed.; Springer International Publishing: Cham, Switzerland, 2017; pp. 226–233. [Google Scholar] [CrossRef]
- Kozik, R.; Choraś, M.; Renk, R.; Holubowicz, W. Patterns Extraction Method for Anomaly Detection in HTTP Traffic. In Proceedings of the International Joint Conference; Herrero, Á., Baruque, B., Sedano, J., Quintián, H., Corchado, E., Eds.; Springer International Publishing: Cham, Switzerland, 2015; pp. 227–236. [Google Scholar] [CrossRef]
- Shi, Y.; Wang, S.; Zhao, Q.; Li, J. A Hybrid Approach of HTTP Anomaly Detection. In Web and Big Data; Springer International Publishing: Cham, Switzerland, 2017; pp. 128–137. [Google Scholar] [CrossRef]
- Kim, T.Y.; Cho, S.B. Web traffic anomaly detection using C-LSTM neural networks. Expert Syst. Appl. 2018, 106, 66–76. [Google Scholar] [CrossRef]
- Jin, X.; Cui, B.; Li, D.; Cheng, Z.; Yin, C. An improved payload-based anomaly detector for web applications. J. Netw. Comput. Appl. 2018, 106, 111–116. [Google Scholar] [CrossRef]
- Wang, W.; Liu, J.; Pitsilis, G.; Zhang, X. Abstracting massive data for lightweight intrusion detection in computer networks. Inf. Sci. 2018, 433–434, 417–430. [Google Scholar] [CrossRef]
- Liu, T.; Zhang, L. Application of Logistic Regression in WEB Vulnerability Scanning. In Proceedings of the 2018 International Conference on Sensor Networks and Signal Processing (SNSP), Xi’an, China, 28–31 October 2018; pp. 486–490. [Google Scholar] [CrossRef]
- Betarte, G.; Gimenez, E.; Martinez, R.; Pardo, A. Improving Web Application Firewalls through Anomaly Detection. In Proceedings of the 2018 17th IEEE International Conference on Machine Learning and Applications (ICMLA), Orlando, FL, USA, 17–20 December 2018; pp. 779–784. [Google Scholar] [CrossRef]
- Li, B.; Yuan, G.; Shen, L.; Zhang, R.; Yao, Y. Incorporating URL embedding into ensemble clustering to detect web anomalies. Future Gener. Comput. Syst. 2019, 96, 176–184. [Google Scholar] [CrossRef]
- Yun, Y.; Park, S.; Kim, Y.; Ryou, J. A Design and Implementation of Profile Based Web Application Securing Proxy. In Information Security Practice and Experience; Chen, K., Deng, R., Lai, X., Zhou, J., Eds.; Springer: Berlin/Heidelberg, Germany, 2006; pp. 248–259. [Google Scholar] [CrossRef]
- Bolzoni, D.; Etalle, S. Boosting Web Intrusion Detection Systems by Inferring Positive Signatures. In On the Move to Meaningful Internet Systems: OTM 2008; Meersman, R., Tari, Z., Eds.; Springer: Berlin/Heidelberg, Germany, 2008; pp. 938–955. [Google Scholar] [CrossRef] [Green Version]
- Li, Y.; Guo, L.; Tian, Z.H.; Lu, T.B. A Lightweight Web Server Anomaly Detection Method Based on Transductive Scheme and Genetic Algorithms. Comput. Commun. 2008, 31, 4018–4025. [Google Scholar] [CrossRef]
- Kruegel, C.; Vigna, G.; Robertson, W. A multi-model approach to the detection of web-based attacks. Comput. Netw. 2005, 48, 717–738. [Google Scholar] [CrossRef]
- Cho, S.; Cha, S. SAD: Web session anomaly detection based on parameter estimation. Comput. Secur. 2004, 23, 312–319. [Google Scholar] [CrossRef]
- Yamada, A.; Miyake, Y.; Takemori, K.; Studer, A.; Perrig, A. Intrusion Detection for Encrypted Web Accesses. In Proceedings of the 21st International Conference on Advanced Information Networking and Applications Workshops (AINAW’07), Niagara Falls, ON, Canada, 21–23 May 2007; Volume 1, pp. 569–576. [Google Scholar] [CrossRef]
- Yan, C.; Qin, Z.; Shi, Y. Sequence Analysis and Anomaly Detection of Web Service Composition. In Proceedings of the 2008 International Conference on Computer Science and Software Engineering, Wuhan, China, 12–14 December 2008; Volume 3, pp. 1043–1048. [Google Scholar] [CrossRef]
- Jamdagni, A.; Tan, Z.; Nanda, P.; He, X.; Liu, R.P. Intrusion Detection Using GSAD Model for HTTP Traffic on Web Services. In Proceedings of the 6th International Wireless Communications and Mobile Computing Conference, Caen, France, 15 January 2010; Association for Computing Machinery: New York, NY, USA, 2010; pp. 1193–1197. [Google Scholar] [CrossRef]
- Wang, W.; Zhang, X. High-Speed Web Attack Detection through Extracting Exemplars from HTTP Traffic. In Proceedings of the 2011 ACM Symposium on Applied Computing, TaiChung, Taiwan, 21–24 March 2011; Association for Computing Machinery: New York, NY, USA, 2011; pp. 1538–1543. [Google Scholar] [CrossRef]
- Kruegel, C.; Vigna, G. Anomaly detection of Web-based attacks. In Proceedings of the ACM Conference on Computer and Communications Security, Washington, DC, USA, 27–30 October 2003; ACM Press: New York, NY, USA, 2003; pp. 251–261. [Google Scholar] [CrossRef] [Green Version]
- Rahnavard, G.; Najjar, M.S.A.; Taherifar, S. A method to evaluate Web Services Anomaly Detection using Hidden Markov Models. In Proceedings of the 2010 International Conference on Computer Applications and Industrial Electronics, Kuala Lumpur, Malaysia, 5–8 December 2010; pp. 261–265. [Google Scholar] [CrossRef]
- Das, D.; Sharma, U.; Bhattacharyya, D.K. A Web Intrusion Detection Mechanism based on Feature based Data Clustering. In Proceedings of the 2009 IEEE International Advance Computing Conference, Patiala, India, 6–7 March 2009; pp. 1124–1129. [Google Scholar] [CrossRef]
- Li, X.; Xue, Y.; Malin, B. Detecting Anomalous User Behaviors in Workflow-Driven Web Applications. In Proceedings of the 2012 IEEE 31st Symposium on Reliable Distributed Systems, Irvine, CA, USA, 8–11 October 2012; pp. 1–10. [Google Scholar] [CrossRef]
- Le, M.; Stavrou, A.; Kang, B.B. DoubleGuard: Detecting Intrusions in Multitier Web Applications. IEEE Trans. Dependable Secur. Comput. 2012, 9, 512–525. [Google Scholar] [CrossRef]
- Xie, Y.; Yu, S.Z. Light-weight detection of HTTP attacks for large-scale Web sites. In Proceedings of the 2008 11th IEEE Singapore International Conference on Communication Systems, Guangzhou, China, 19–21 November 2008; pp. 1182–1186. [Google Scholar] [CrossRef]
- Sriraghavan, R.G.; Lucchese, L. Data processing and anomaly detection in web-based applications. In Proceedings of the 2008 IEEE Workshop on Machine Learning for Signal Processing, Cancun, Mexico, 16–19 October 2008; pp. 187–192. [Google Scholar] [CrossRef]
- Fan, W.K.G. An adaptive anomaly detection of WEB-based attacks. In Proceedings of the 2012 7th International Conference on Computer Science Education (ICCSE), Melbourne, VIC, Australia, 14–17 July 2012; pp. 690–694. [Google Scholar] [CrossRef]
- Kirchner, M. A framework for detecting anomalies in HTTP traffic using instance-based learning and k-nearest neighbor classification. In Proceedings of the 2010 2nd International Workshop on Security and Communication Networks (IWSCN), Karlstad, Sweden, 26–28 May 2010; pp. 1–8. [Google Scholar] [CrossRef]
- Kakavand, M.; Mustapha, A.; Tan, Z.; Yazdani, S.F.; Arulsamy, L. O-ADPI: Online Adaptive Deep-Packet Inspector Using Mahalanobis Distance Map for Web Service Attacks Classification. IEEE Access 2019, 7, 167141–167156. [Google Scholar] [CrossRef]
- Moradi Vartouni, A.; Teshnehlab, M.; Sedighian Kashi, S. Leveraging deep neural networks for anomaly-based web application firewall. IET Inf. Secur. 2019, 13, 352–361. [Google Scholar] [CrossRef]
- Li, J.; Fu, Y.; Xu, J.; Ren, C.; Xiang, X.; Guo, J. Web application attack detection based on attention and gated convolution networks. IEEE Access 2019, 1. [Google Scholar] [CrossRef]
- Alhakami, W.; ALharbi, A.; Bourouis, S.; Alroobaea, R.; Bouguila, N. Network Anomaly Intrusion Detection Using a Nonparametric Bayesian Approach and Feature Selection. IEEE Access 2019, 7, 52181–52190. [Google Scholar] [CrossRef]
- Kozik, R.; Choraś, M. Protecting the application layer in the public domain with machine learning methods. Log. J. IGPL 2018, 27, 149–159. [Google Scholar] [CrossRef]
- Jin, L.; Wang, X.J.; Zhang, Y.; Yao, L. Anomaly Detection in the Web Logs Using Unsupervised Algorithm. In Human Centered Computing; Tang, Y., Zu, Q., Rodríguez García, J.G., Eds.; Springer International Publishing: Cham, Switzerland, 2019; pp. 393–405. [Google Scholar] [CrossRef]
- Bhattacharyya, D.K.; Kalita, J.K. DDoS Attacks: Evolution, Detection, Prevention, Reaction, and Tolerance; CRC Press: Boca Raton, FL, USA, 2016. [Google Scholar]
- OWASP Foundation. Injection Flaws | OWASP. Available online: https://owasp.org/www-community/Injection_Flaws (accessed on 15 May 2020).
- Wei, K.; Muthuprasanna, M.; Kothari, S. Preventing SQL injection attacks in stored procedures. In Proceedings of the Australian Software Engineering Conference (ASWEC’06), Sydney, NSW, Australia, 18–21 April 2006; pp. 8–198. [Google Scholar] [CrossRef]
- Leonard, J.; Xu, S.; Sandhu, R. A Framework for Understanding Botnets. In Proceedings of the 2009 International Conference on Availability, Reliability and Security, Fukuoka, Japan, 16–19 March 2009; pp. 917–922. [Google Scholar]
- Hadianto, R.; Purboyo, T.W. A Survey Paper on Botnet Attacks and Defenses in Software Defined Networking. Int. J. Appl. Eng. Res. 2018, 13, 483–489. [Google Scholar]
- Gurjwar, R.K.; Sahu, D.R.; Tomar, D.S. An approach to reveal website defacement. Int. J. Comput. Sci. Inf. Secur. 2013, 11, 73. [Google Scholar]
- Cluster analysis—Wikipedia. Available online: https://en.wikipedia.org/wiki/Cluster_analysis#Definition. (accessed on 9 February 2020).
- Unioviedo. kmeans. Available online: https://www.unioviedo.es/compnum/labs/new/kmeans.html. (accessed on 17 May 2020).
- Frey, B.J.; Dueck, D. Clustering by Passing Messages Between Data Points. Science 2007, 315, 972–976. [Google Scholar] [CrossRef] [PubMed] [Green Version]
- Ester, M.; Kriegel, H.P.; Sander, J.; Xu, X. A Density-Based Algorithm for Discovering Clusters a Density-Based Algorithm for Discovering Clusters in Large Spatial Databases with Noise. In Proceedings of the Second International Conference on Knowledge Discovery and Data Mining, Portland, OR, USA, 2–4 August 1996; KDD’96. pp. 226–231. [Google Scholar]
- Breunig, M.M.; Kriegel, H.P.; Ng, R.T.; Sander, J. LOF: Identifying Density-Based Local Outliers. In Proceedings of the 2000 ACM SIGMOD International Conference on Management of Data; Association for Computing Machinery: New York, NY, USA, 2000; pp. 93–104. [Google Scholar] [CrossRef]
- Dempster, A.P.; Laird, N.M.; Rubin, D.B. Maximum Likelihood from Incomplete Data via the EM Algorithm. J. R. Stat. Soc. Ser. B (Methodol.) 1977, 39, 1–38. [Google Scholar]
- Gupta, M.R.; Chen, Y. Theory and Use of the EM Algorithm. Found. Trends Signal Process. 2011, 4, 223–296. [Google Scholar] [CrossRef]
- Rahul, A.E.; Narukulla, S. Introduction to Data Mining and Machine Learning Algorithms. Int. J. Res. Eng. Sci. Manag. 2018, 1. [Google Scholar]
- Duda, R.O.; Hart, P.E. Pattern Classification and Scene Analysis; Duda, R.O., Hart, P.E., Eds.; Wiley: New York, NY, USA, 1973. [Google Scholar]
- Schölkopf, B.; Williamson, R.; Smola, A.; Shawe-Taylor, J.; Platt, J. Support Vector Method for Novelty Detection. In Proceedings of the 12th International Conference on Neural Information Processing Systems; MIT Press: Cambridge, MA, USA, 1999; pp. 582–588. [Google Scholar]
- Franzese, M.; Iuliano, A. Hidden Markov Models. In Encyclopedia of Bioinformatics and Computational Biology; Ranganathan, S., Gribskov, M., Nakai, K., Schönbach, C.B.T.E.O.B., Eds.; Academic Press: Oxford, UK, 2019; pp. 753–762. [Google Scholar] [CrossRef]
- Rabiner, L.; Juang, B. An introduction to hidden Markov models. IEEE ASSP Mag. 1986, 3, 4–16. [Google Scholar] [CrossRef]
- Altman, N.S. An Introduction to Kernel and Nearest-Neighbor Nonparametric Regression. Am. Stat. 1992, 46, 175–185. [Google Scholar] [CrossRef] [Green Version]
- Maron, M.E. Automatic Indexing: An Experimental Inquiry. J. ACM 1961, 8, 404–417. [Google Scholar] [CrossRef]
- Domingos, P.; Pazzani, M. On the Optimality of the Simple Bayesian Classifier under Zero-One Loss. Mach. Learn. 1997, 29, 103–130. [Google Scholar] [CrossRef]
- Webb, G.I.; Boughton, J.R.; Wang, Z. Not So Naive Bayes: Aggregating One-Dependence Estimators. Mach. Learn. 2005, 58, 5–24. [Google Scholar] [CrossRef] [Green Version]
- Hopfield, J.J. Neural networks and physical systems with emergent collective computational abilities. Proc. Natl. Acad. Sci. USA 1982, 79, 2554–2558. [Google Scholar] [CrossRef] [PubMed] [Green Version]
- Liu, G.; Bao, H.; Han, B. A Stacked Autoencoder-Based Deep Neural Network for Achieving Gearbox Fault Diagnosis. Math. Probl. Eng. 2018, 2018, 5105709. [Google Scholar] [CrossRef] [Green Version]
- Puig-Arnavat, M.; Bruno, J.C. Artificial Neural Networks for Thermochemical Conversion of Biomass. Recent Adv. Thermo-Chem. Convers. Biomass 2015, 133–156. [Google Scholar] [CrossRef] [Green Version]
- Mikolov, T.; Chen, K.; Corrado, G.; Dean, J. Efficient estimation of word representations in vector space. arXiv 2013, arXiv:1301.3781. [Google Scholar]
- Mikolov, T.; Sutskever, I.; Chen, K.; Corrado, G.S.; Dean, J. Distributed representations of words and phrases and their compositionality. In Advances in Neural Information Processing Systems; The MIT Press: Cambridge, MA, USA, 2013; pp. 3111–3119. [Google Scholar]
- Tomović, A.; Janičić, P.; Kešelj, V. n-Gram-based classification and unsupervised hierarchical clustering of genome sequences. Comput. Methods Programs Biomed. 2006, 81, 137–153. [Google Scholar] [CrossRef]
- Tauritz, D. Applications of n-grams; Technical Report; Department of Computer Science, University of Missouri-Rolla: Rolla, MI, USA, 2002. [Google Scholar]
- Manning, C.D.; Raghavan, P.; Schütze, H. Scoring, term weighting, and the vector space model. In Introduction to Information Retrieval; Manning, C.D., Schütze, H., Raghavan, P., Eds.; Cambridge University Press: Cambridge, UK, 2008; pp. 100–123. [Google Scholar] [CrossRef]
- Stephen, R. Understanding inverse document frequency: On theoretical arguments for IDF. J. Doc. 2004, 60, 503–520. [Google Scholar] [CrossRef] [Green Version]
- Roweis, S.T.; Saul, L.K. Nonlinear Dimensionality Reduction by Locally Linear Embedding. Science 2000, 290, 2323–2326. [Google Scholar] [CrossRef] [Green Version]
- Pearson, K. LIII. On lines and planes of closest fit to systems of points in space. Philos. Mag. J. Sci. 1901, 2, 559–572. [Google Scholar] [CrossRef] [Green Version]
- Hotelling, H. Relations Between Two Sets of Variates. Biometrika 1936, 28, 321–377. [Google Scholar] [CrossRef]
- Jolliffe, I.T. Principal Component Analysis; Springer Series in Statistics; Springer: New York, NY, USA, 2002. [Google Scholar] [CrossRef]
- Fisher, R.A. The Use of Multiple Measurements in Taxonomic Problems. Ann. Eugen. 1936, 7, 179–188. [Google Scholar] [CrossRef]
- McLachlan, G.J. Discriminant Analysis and Statistical Pattern Recognition; John Wiley & Sons: Hoboken, NJ, USA, 2004; Volume 544. [Google Scholar]
- Rao, C.R. The Utilization of Multiple Measurements in Problems of Biological Classification. J. R. Stat. Soc. Ser. B (Methodol.) 1948, 10, 159–203. [Google Scholar] [CrossRef]
- Coifman, R.R.; Lafon, S.; Lee, A.B.; Maggioni, M.; Nadler, B.; Warner, F.; Zucker, S.W. Geometric diffusions as a tool for harmonic analysis and structure definition of data: Diffusion maps. Proc. Natl. Acad. Sci. USA 2005, 102, 7426–7431. [Google Scholar] [CrossRef] [PubMed] [Green Version]
- Coifman, R.R.; Lafon, S. Diffusion maps. Appl. Comput. Harmon. Anal. 2006, 21, 5–30. [Google Scholar] [CrossRef] [Green Version]
- Delaporte, J.; Herbst, B.M.; Hereman, W.; der Walt Stéfan, V. An introduction to diffusion maps. In Proceedings of the 19th Symposium of the Pattern Recognition Association of South Africa (PRASA 2008), Cape Town, South Africa, 27–28 November 2008. [Google Scholar]
- Steliga, K.; Szynal, D. On Markov-type inequalities. Int. J. Pure Appl. Math. 2010, 58, 137–152. [Google Scholar]
- Pearson, K.X. On the criterion that a given system of deviations from the probable in the case of a correlated system of variables is such that it can be reasonably supposed to have arisen from random sampling. Lond. Edinb. Dublin Philos. Mag. J. Sci. 1900, 50, 157–175. [Google Scholar] [CrossRef] [Green Version]
- Olshausen, B.A. Bayesian Probability Theory; The Redwood Center for Theoretical Neuroscience, Helen Wills Neuroscience Institute at the University of California at Berkeley: Berkeley, CA, USA, 2004. [Google Scholar]
- Kozik, R.; Choraś, M.; Renk, R.; Holubowicz, W. Semi-unsupervised Machine Learning for Anomaly Detection in HTTP Traffic. In Proceedings of the 9th International Conference on Computer Recognition Systems CORES 2015, Wroclaw, Poland, 25–27 May 2015; Springer International Publishing: Cham, Switzerland, 2016; pp. 767–775. [Google Scholar] [CrossRef]
- Lichman, M. 1999 DARPA Intrusion Detection Evaluation Dataset; MIT Lincoln Laboratory: Cambridge, MA, USA, 2000. [Google Scholar]
- Hettich, S.; Bay, S.D. The UCI KDD Archive. Available online: http://kdd.ics.uci.edu (accessed on 15 March 2020).
- Sommer, R.; Paxson, V. Outside the Closed World: On Using Machine Learning for Network Intrusion Detection. In Proceedings of the 2010 IEEE Symposium on Security and Privacy, Berkeley/Oakland, CA, USA, 16–19 May 2010; pp. 305–316. [Google Scholar] [CrossRef] [Green Version]
- Sommer, R. Viable Network Intrusion Detection: Trade-Offs in High-Performance Environments; VDM Verlag: Saarbrücken, DEU, 2008. [Google Scholar]
- Siddique, K.; Akhtar, Z.; Khan, F.A.; Kim, Y. KDD Cup 99 Data Sets: A Perspective on the Role of Data Sets in Network Intrusion Detection Research. Computer 2019, 52, 41–51. [Google Scholar] [CrossRef]
- Moustafa, N. The UNSW-NB15 data set description.
- Moustafa, N.M.; Slay, J. The significant features of the UNSW-NB15 and the KDD99 Data sets for Network Intrusion Detection Systems. In Proceedings of the 2015 4th International Workshop on Building Analysis Datasets and Gathering Experience Returns for Security (BADGERS), Kyoto, Japan, 5 November 2015. [Google Scholar] [CrossRef]
- Moustafa, N.; Slay, J. UNSW-NB15: A comprehensive data set for network intrusion detection systems (UNSW-NB15 network data set). In Proceedings of the 2015 Military Communications and Information Systems Conference (MilCIS), Canberra, ACT, Australia, 10–12 November 2015; pp. 1–6. [Google Scholar] [CrossRef]
- Singh, R.; Kumar, H.; Singla, R. An intrusion detection system using network traffic profiling and online sequential extreme learning machine. Expert Syst. Appl. 2015, 42, 8609–8624. [Google Scholar] [CrossRef]
- Shiravi, A.; Shiravi, H.; Tavallaee, M.; Ghorbani, A.A. Toward developing a systematic approach to generate benchmark datasets for intrusion detection. Comput. Secur. 2012, 31, 357–374. [Google Scholar] [CrossRef]
- Torrano-Gimenez, C.; Perez-Villegas, A.; Alvarez, G.A. A Self-learning Anomaly-Based Web Application Firewall. In Computational Intelligence in Security for Information Systems; Advances in Intelligent and Soft Computing; Herrero, Á., Gastaldo, P., Zunino, R., Corchado, E., Eds.; Springer: Berlin/Heidelberg, Germany, 2009; pp. 85–92. [Google Scholar]
- Raïssi, C.; Brissaud, J.; Dray, G.; Poncelet, P.; Roche, M.; Teisseire, M. Web Analyzing Traffic Challenge: Description and Results. In Proceedings of the ECML/PKDD’2007 Discovery Challenge, Warsaw, Poland, 17 September 2007; p. 6. [Google Scholar]
- Van Rijsbergen, C. Information Retrieval, 2nd ed.; Butterworth-Heinemann: Newton, MA, USA, 1979. [Google Scholar]
- Díaz, G.; Bermejo, J.R. Static analysis of source code security: Assessment of tools against SAMATE tests. Inf. Softw. Technol. 2013, 55, 1462–1476. [Google Scholar] [CrossRef]
- Bermejo Higuera, J.R. Metodología de Evaluación de Herramientas de Análisis Automático de Seguridad de Aplicaciones Web Para su Adaptación en el ciclo de vida de Desarrollo. Ph.D. Thesis, Universidad Nacional Educación a Distancia (UNED), Madrid, Spain, 2013. [Google Scholar]
- Matthews, B.W. Comparison of the predicted and observed secondary structure of T4 phage lysozyme. Biochim. Et Biophys. Acta (BBA) - Protein Struct. 1975, 405, 442–451. [Google Scholar] [CrossRef]
- Swets, J.A. Signal Detection Theory and ROC Analysis in Psychology and Diagnostics: Collected Papers; Scientific Psychology Series; Lawrence Erlbaum Associates Inc.: Hillsdale, NJ, USA, 1996. [Google Scholar]
- OWASP Foundation. OWASP Top Ten. 2017. [Google Scholar]
- MITRE Corporation. CAPEC—Common Attack Pattern Enumeration and Classification (CAPEC). 2011. [Google Scholar]
- MITRE Corporation. CWE—Common Weakness Enumeration.
- OWASP Foundation. OWASP Automated Threats to Web Applications. Available online: https://owasp.org/www-project-automated-threats-to-web-applications/ (accessed on 3 March 2020).
- Antunes, N.; Vieira, M. On the Metrics for Benchmarking Vulnerability Detection Tools. In Proceedings of the 2015 45th Annual IEEE/IFIP International Conference on Dependable Systems and Networks, Rio de Janeiro, Brazil, 22–25 June 2015; pp. 505–516. [Google Scholar] [CrossRef]
- Kruegel, C.; Toth, T.; Kirda, E. Service Specific Anomaly Detection for Network Intrusion Detection. In Proceedings of the 2002 ACM Symposium on Applied Computing; Association for Computing Machinery: New York, NY, USA, 2002; pp. 201–208. [Google Scholar] [CrossRef]


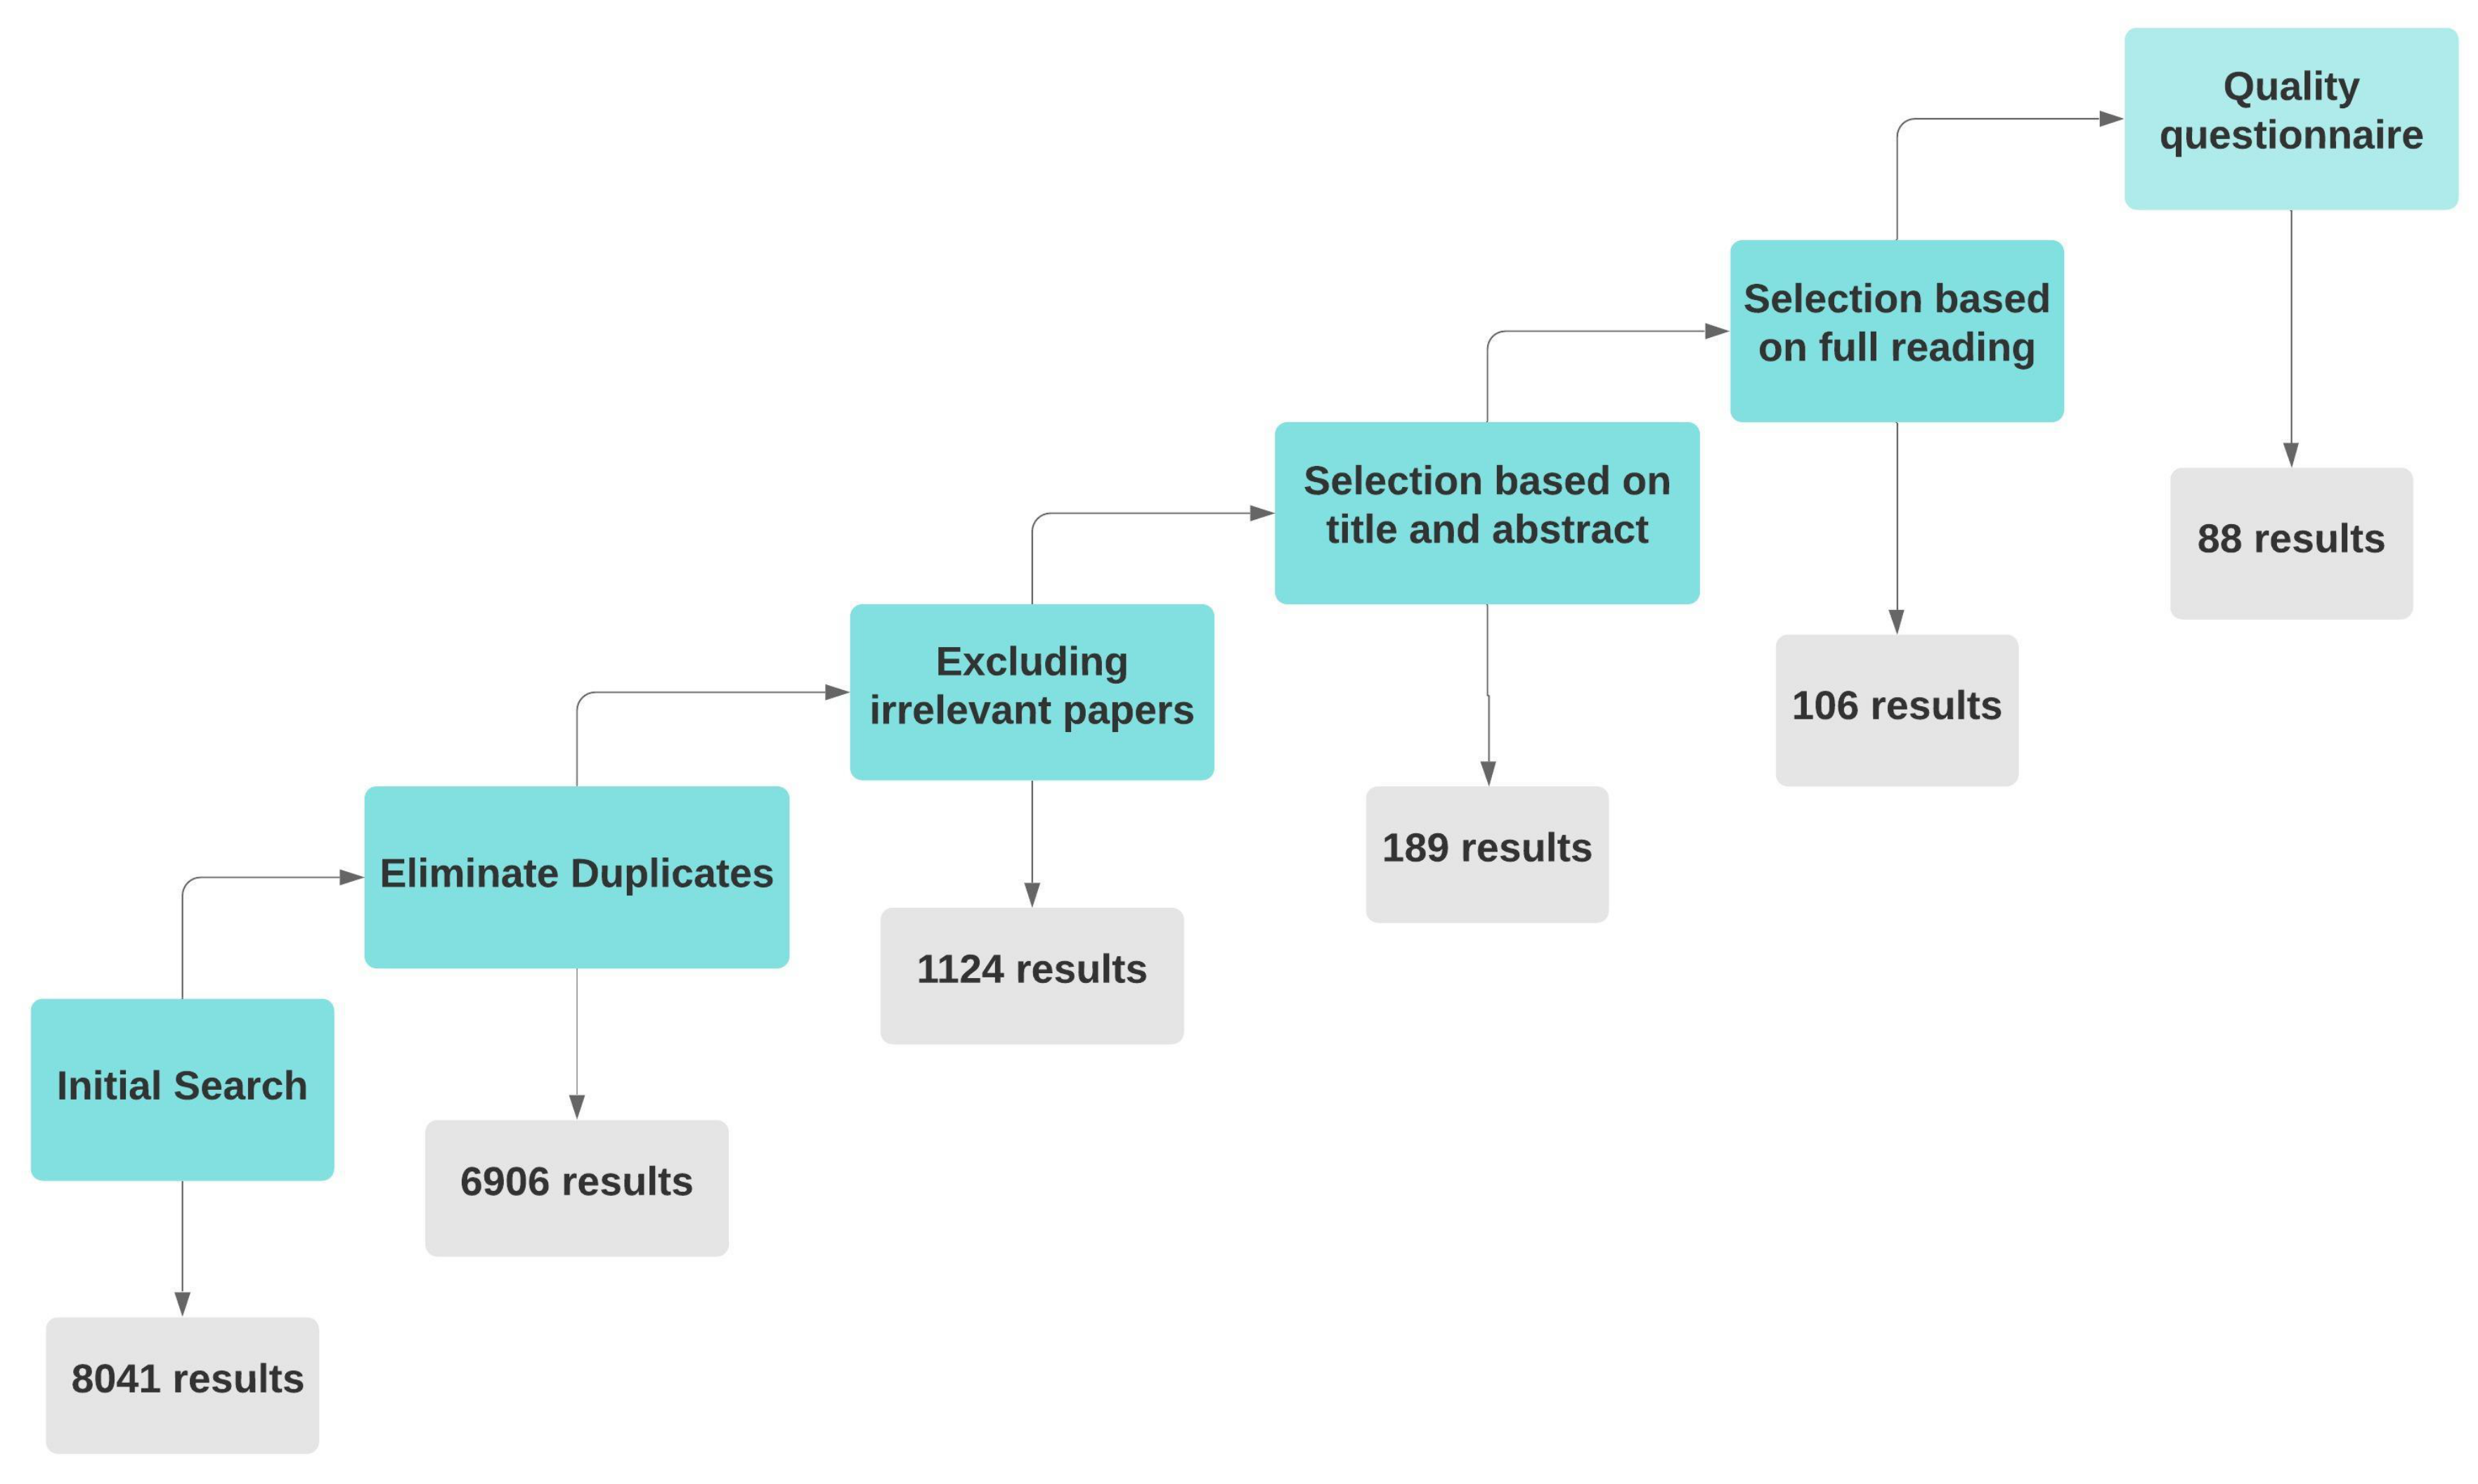
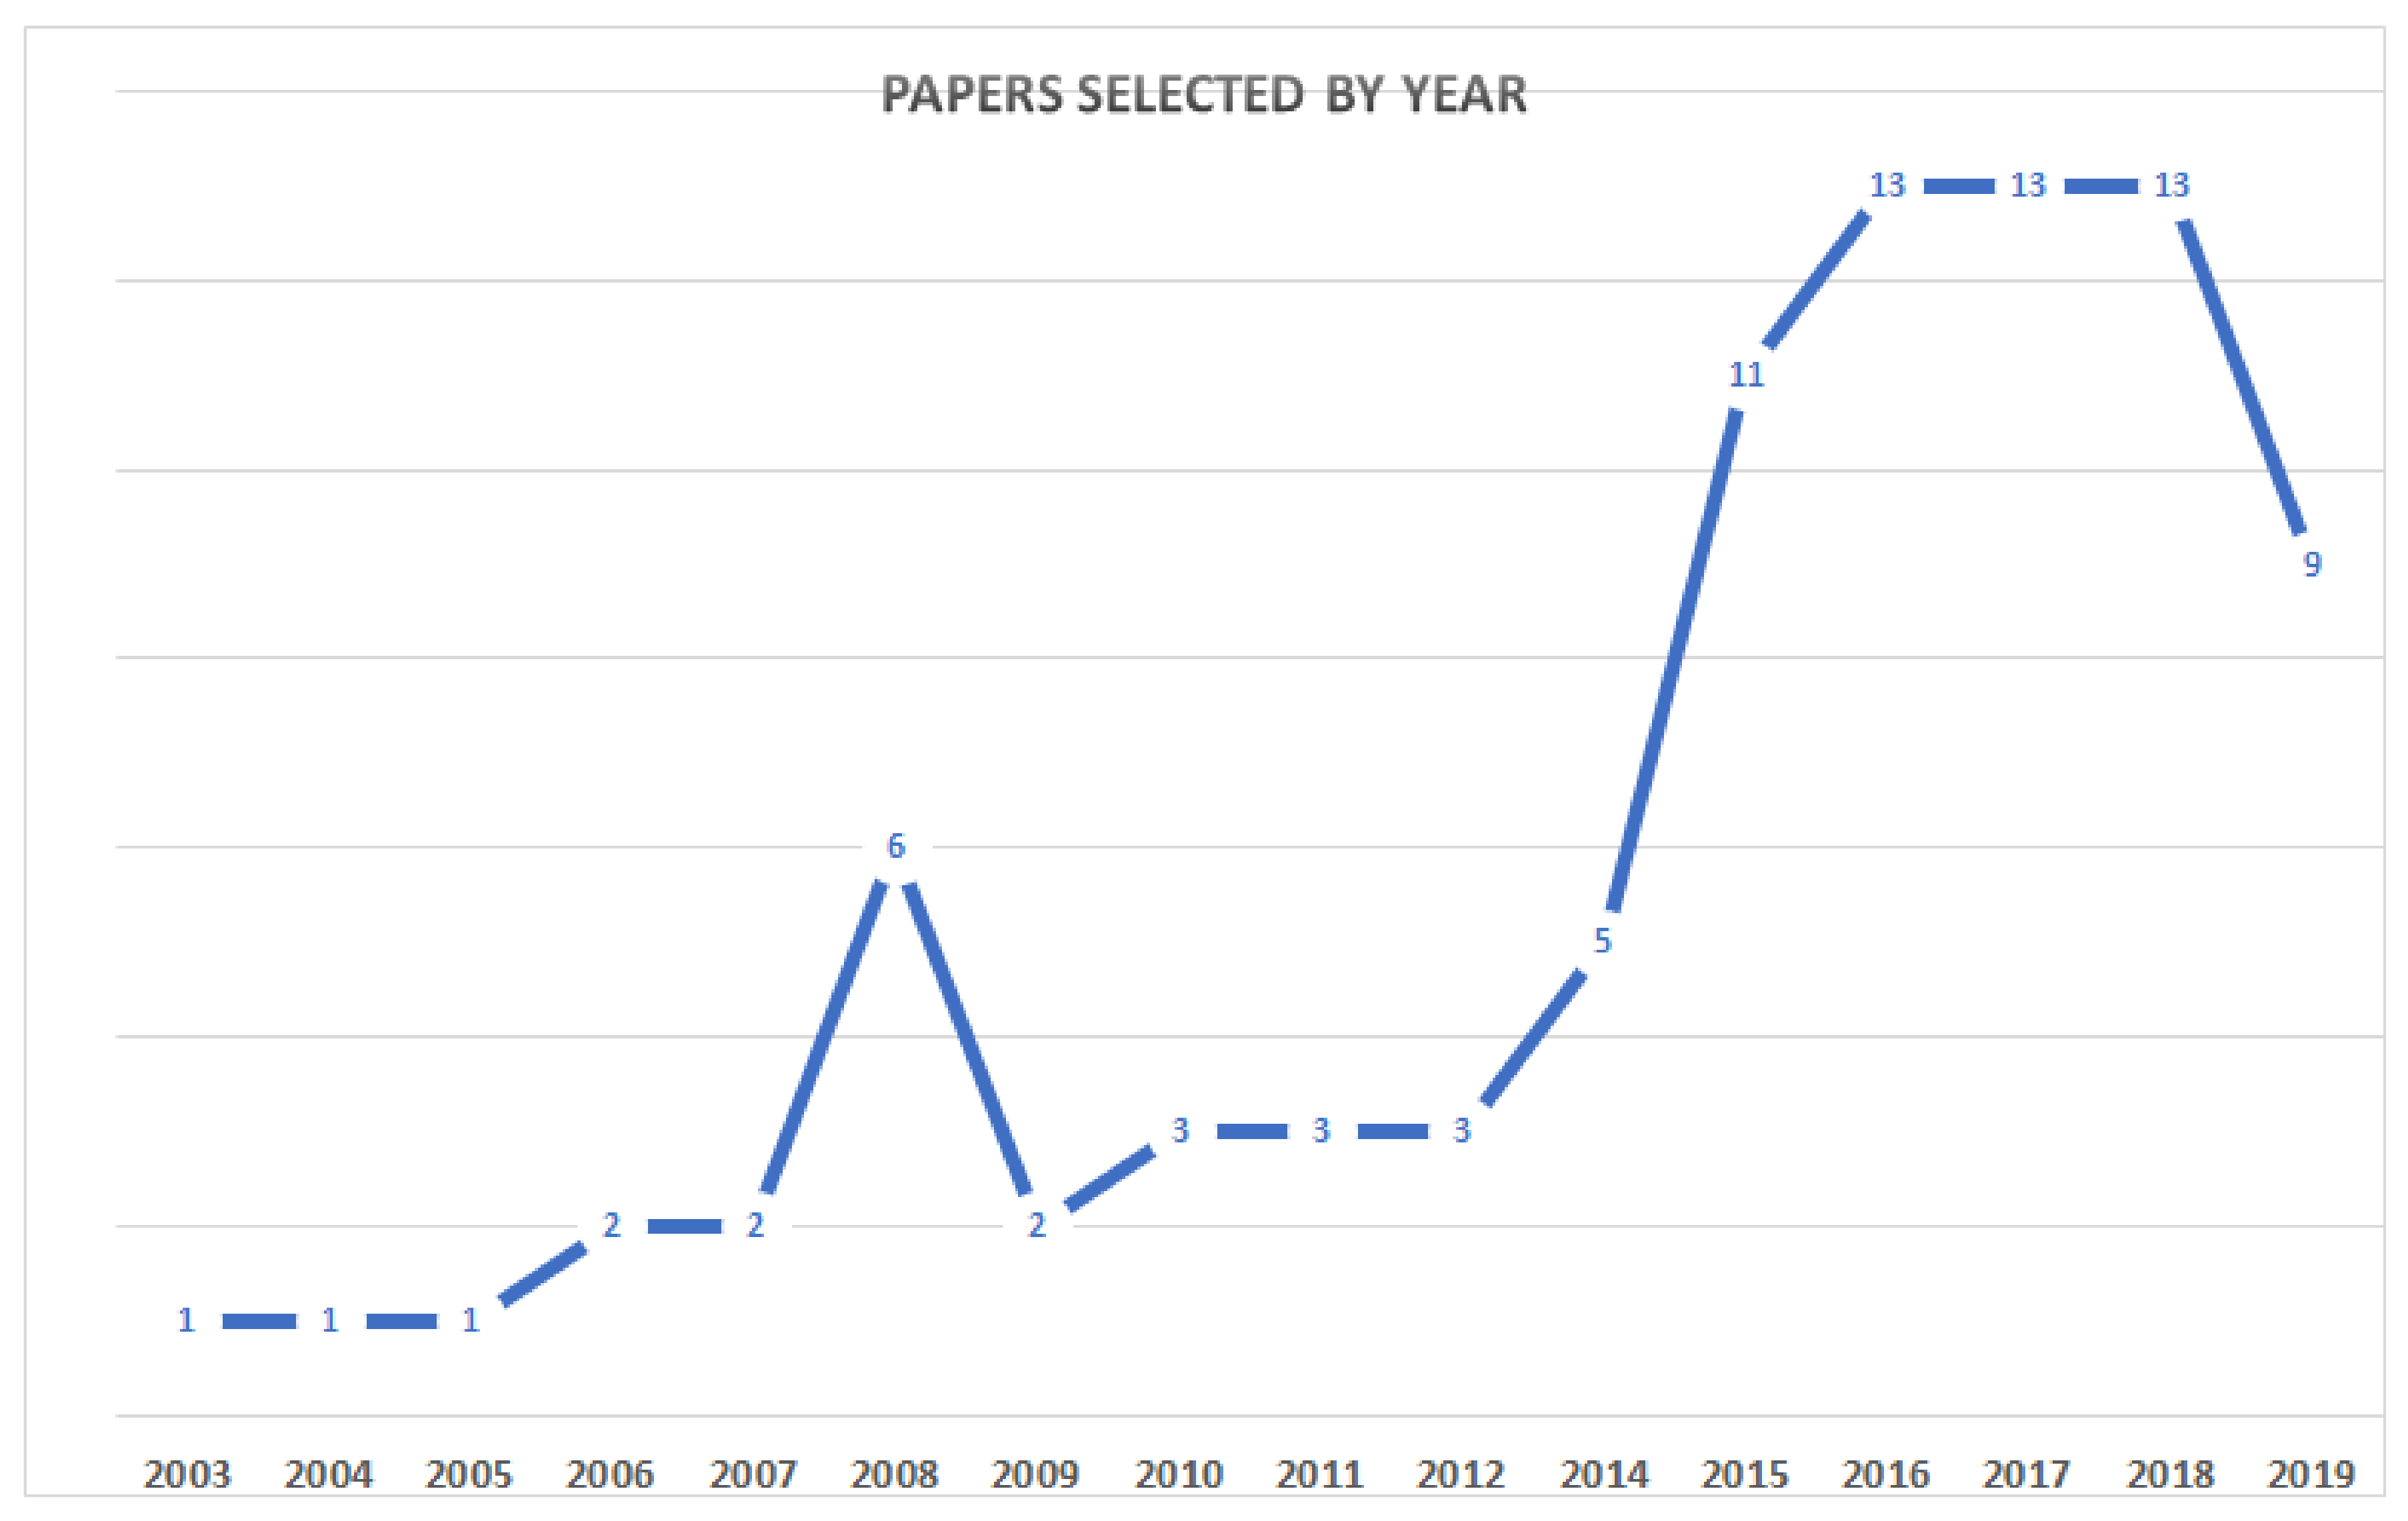
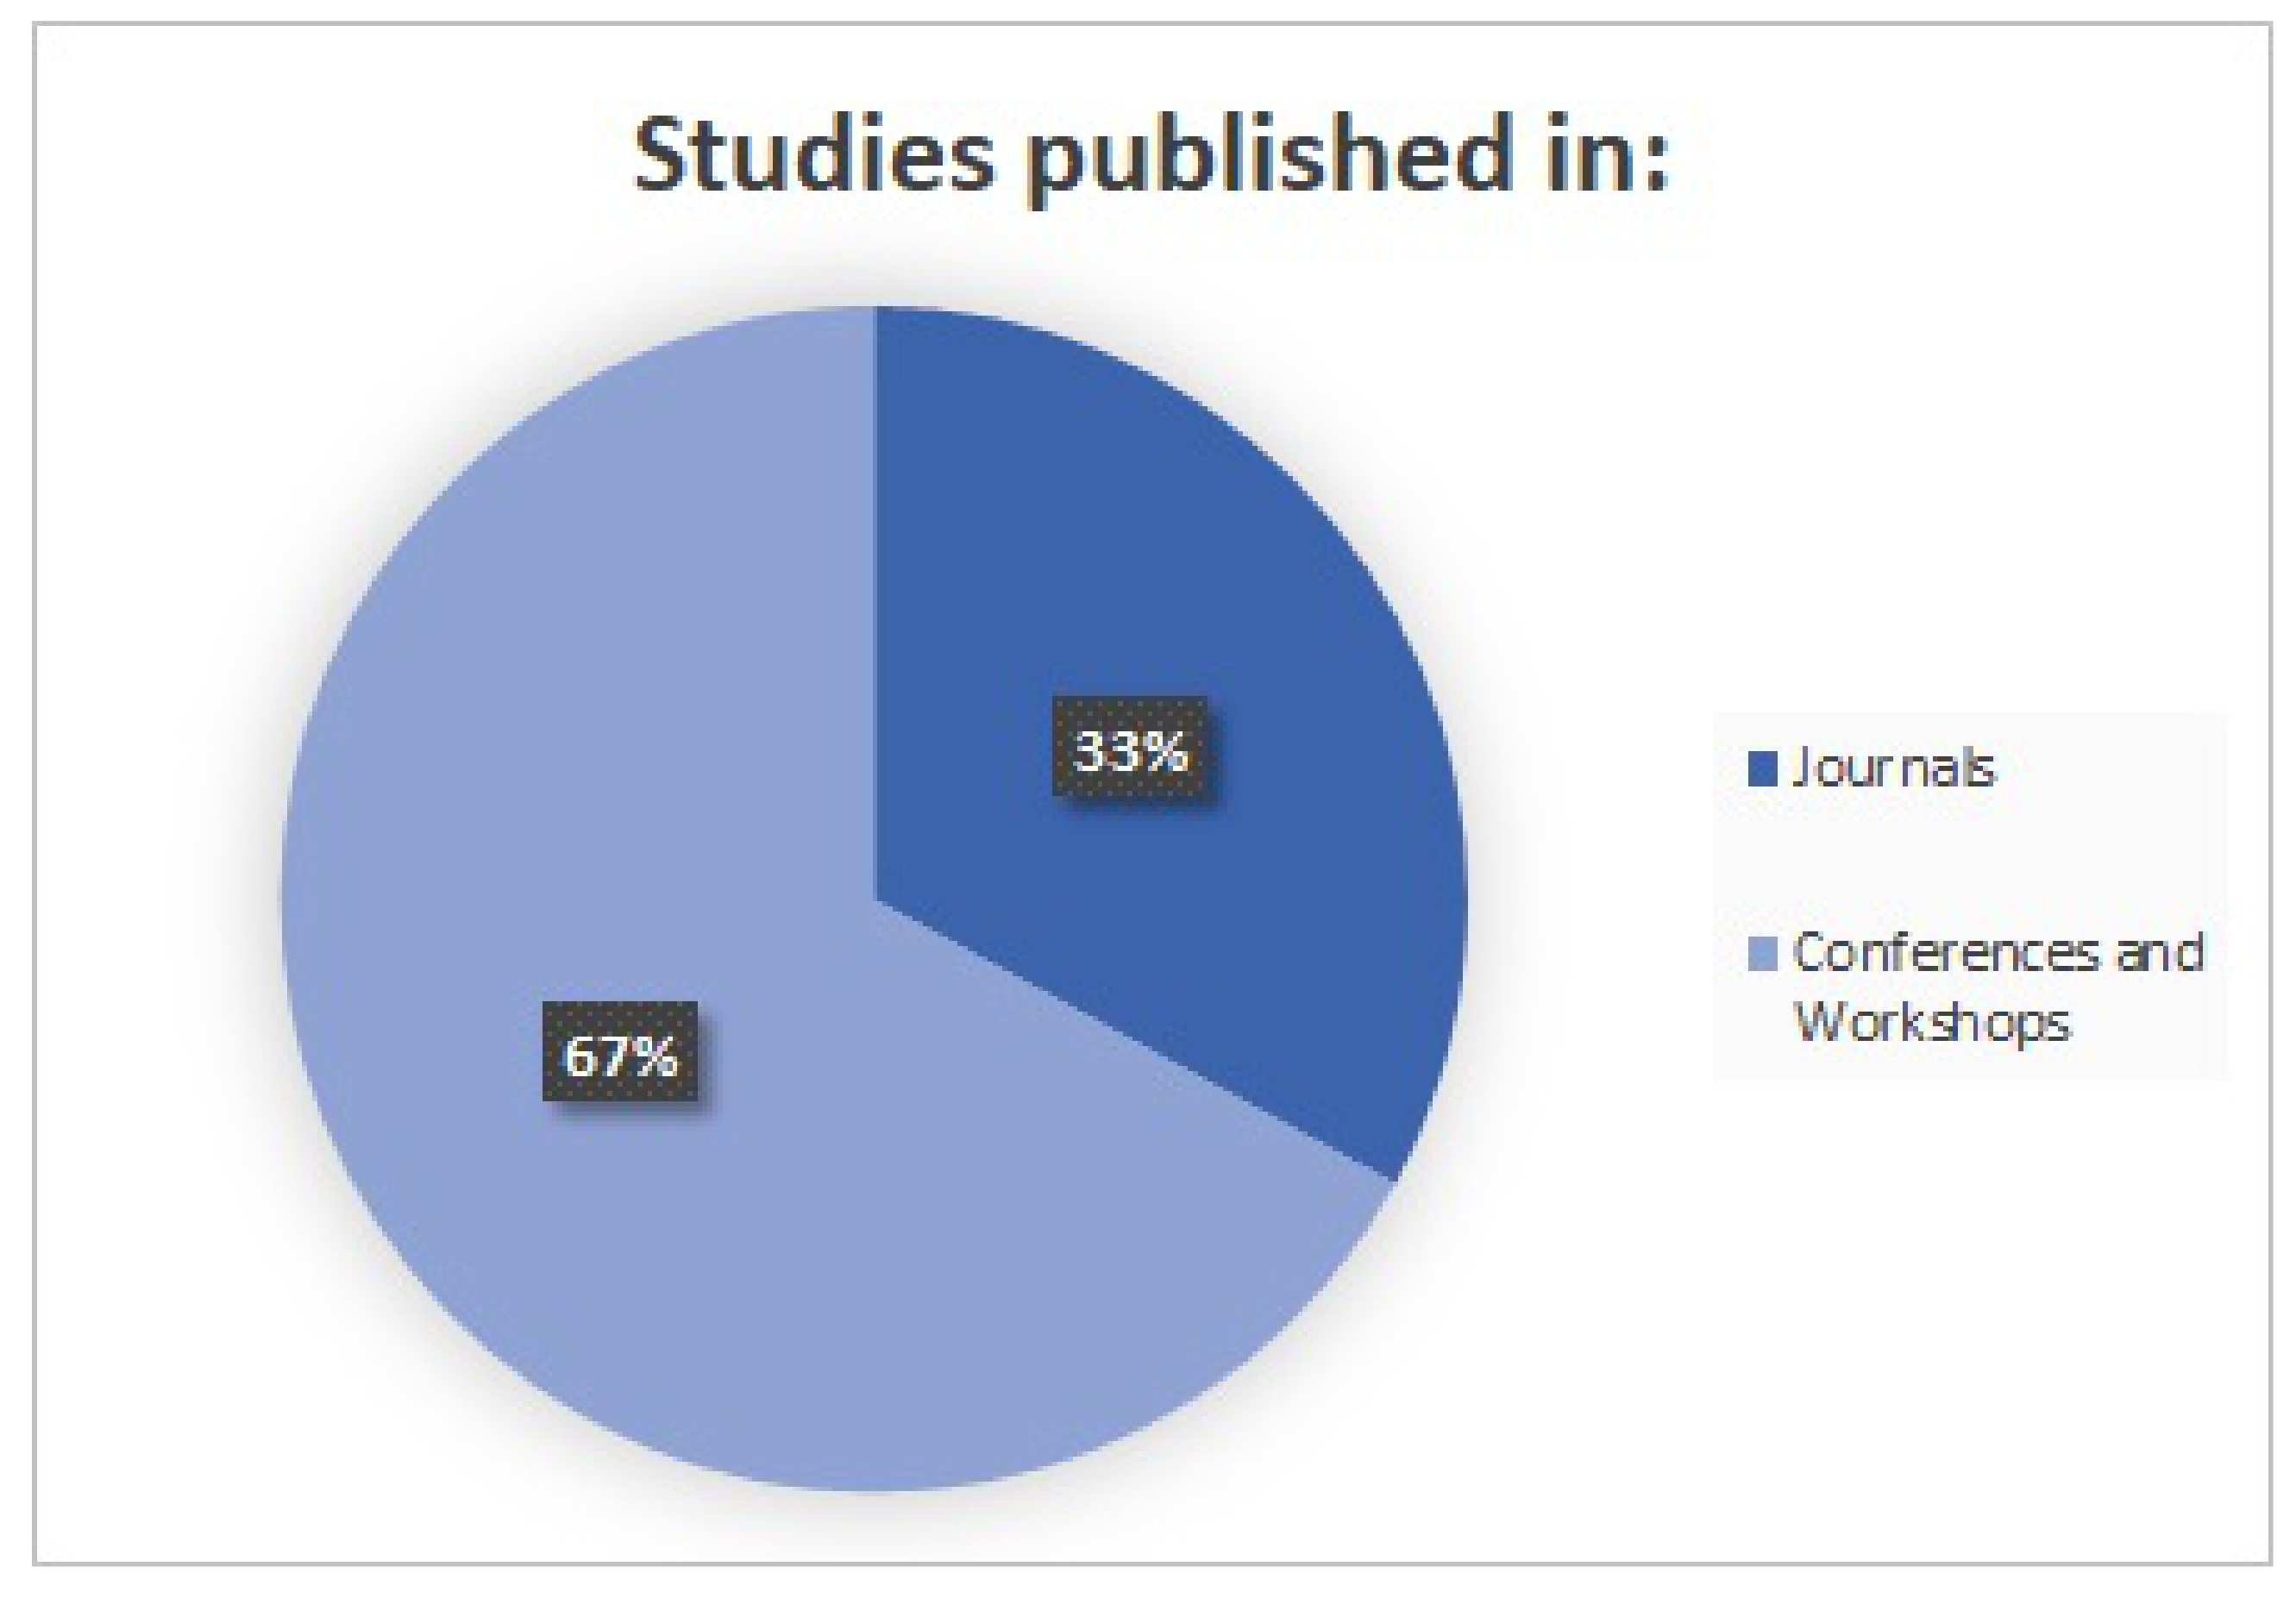
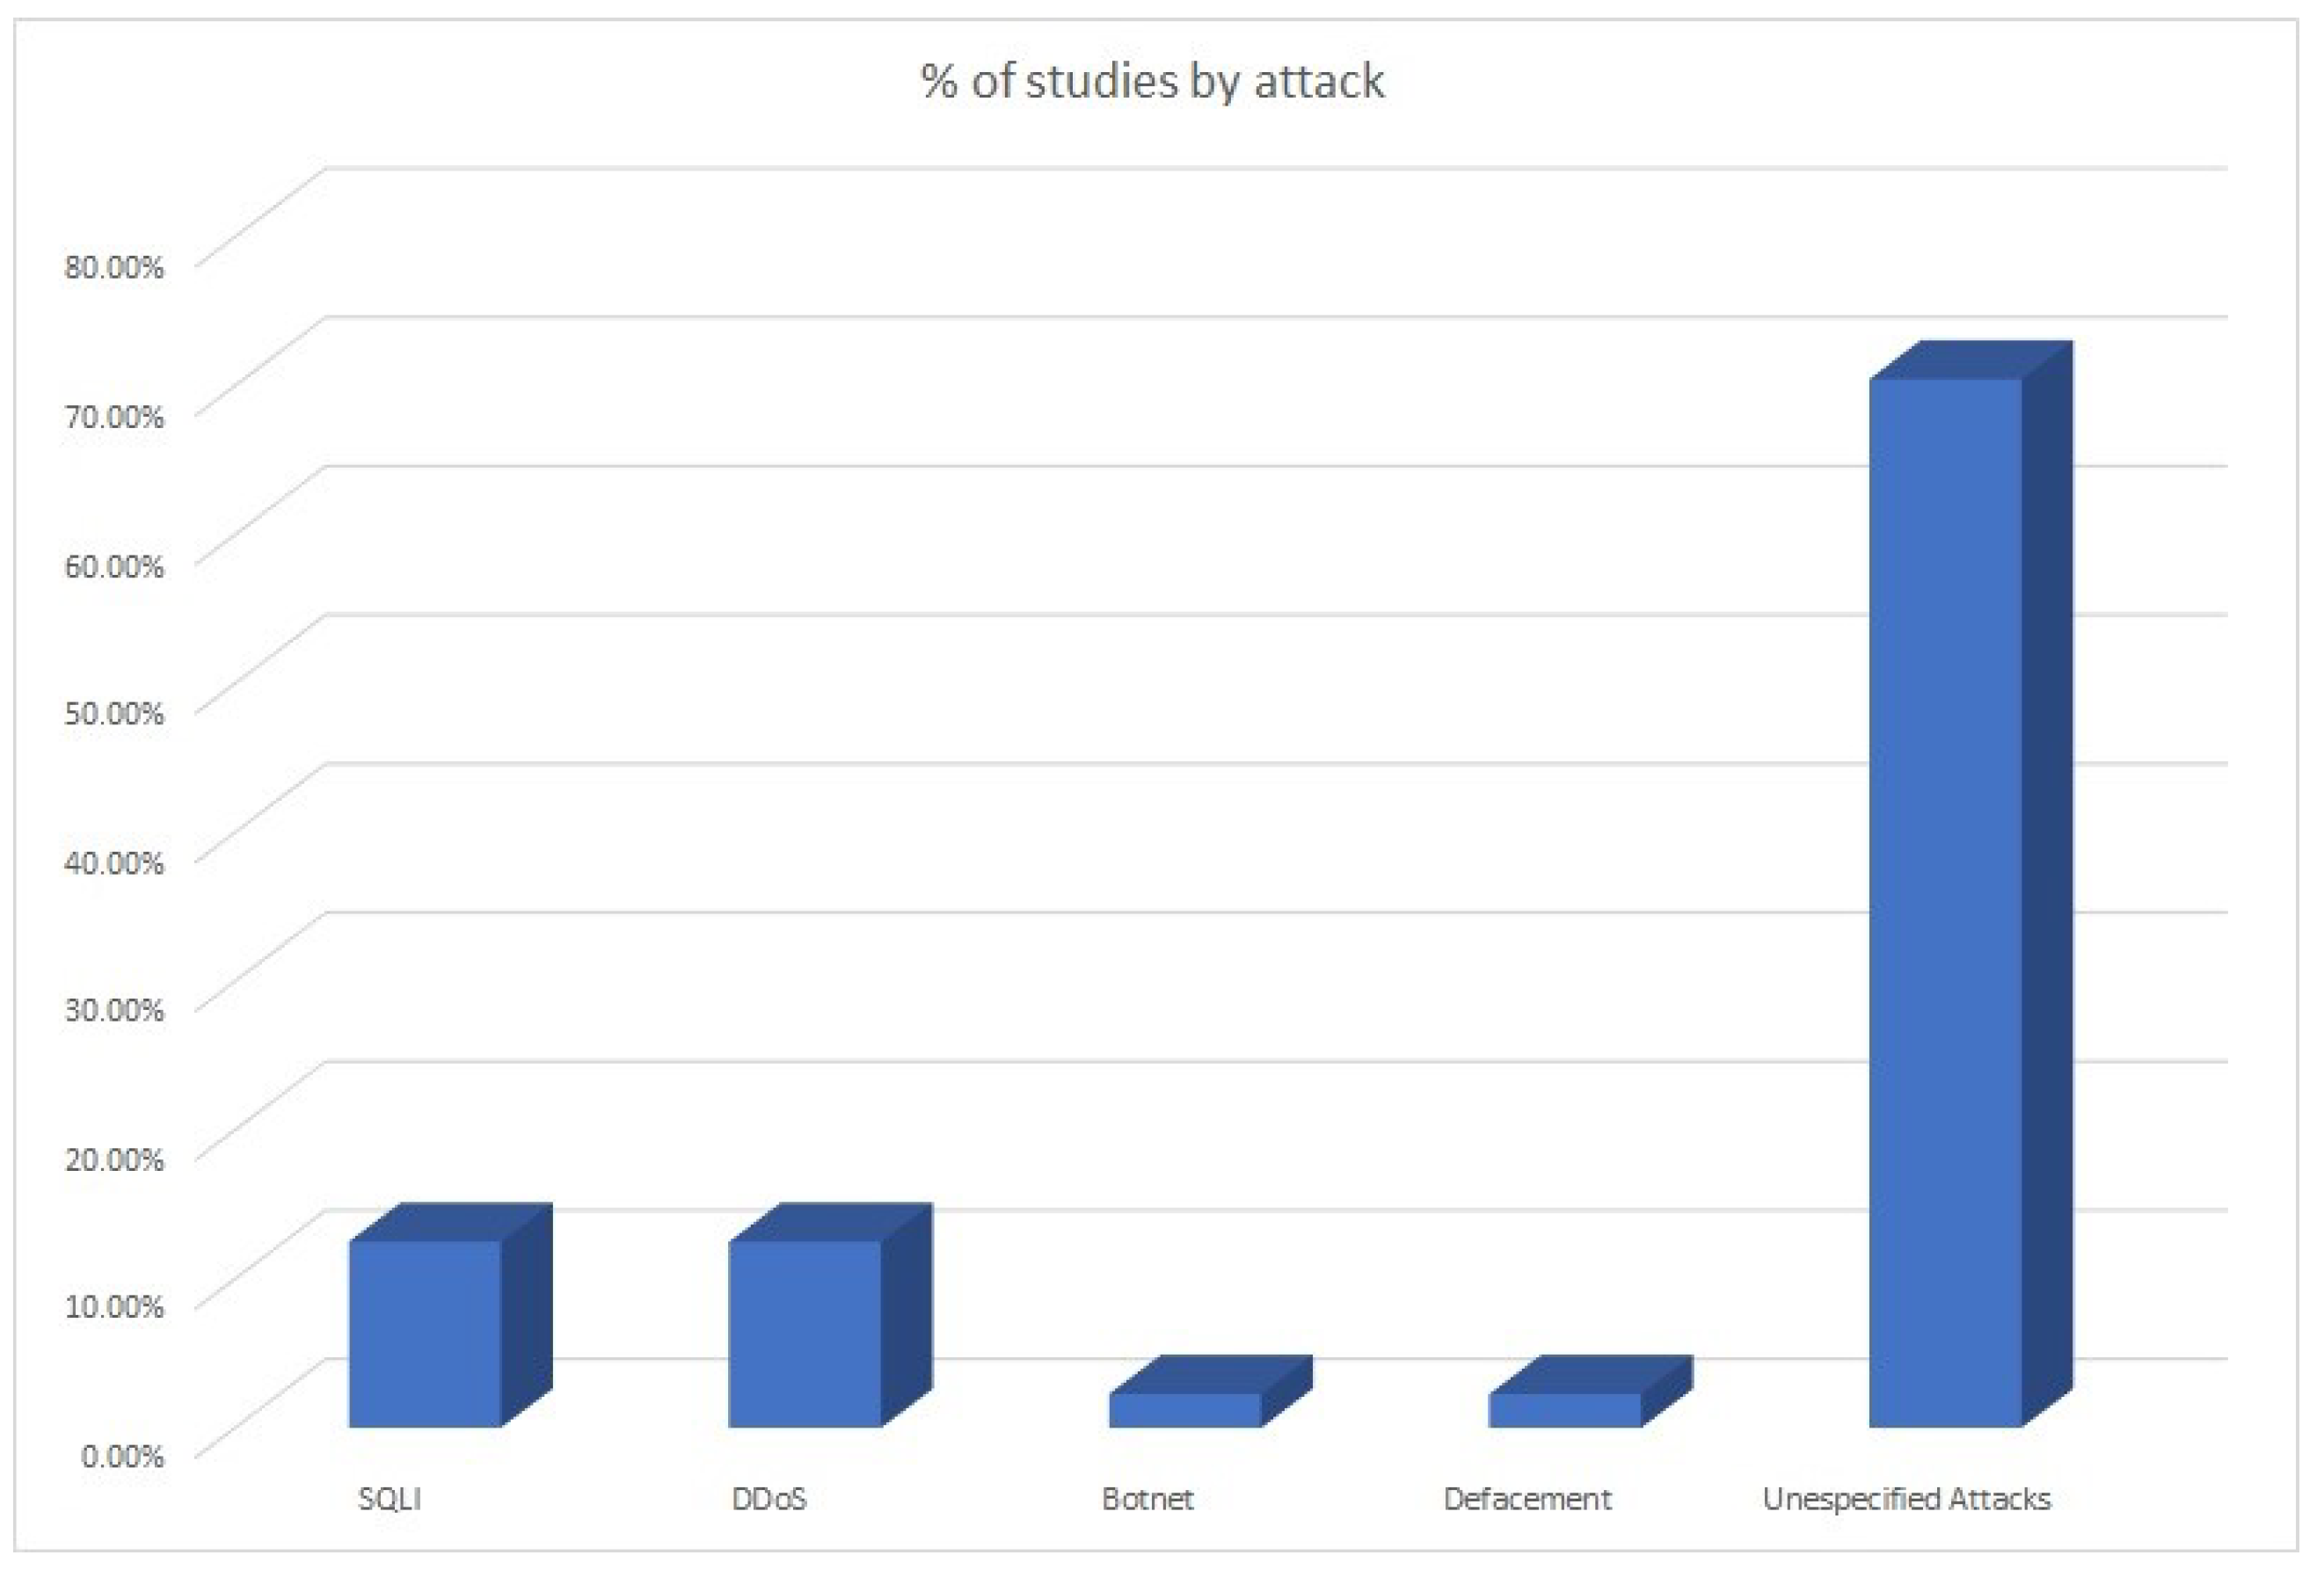
| Research Question | Details |
|---|---|
| (1) What is the current state of web anomaly detection? | |
| What kind of attacks are attempted to be detected or prevented? | An overview of the types of web attacks that most concern the scientific community is achieved. |
| What web anomaly detection methods are used? How often are they cited in specialized literature? | An overview of the status of the different methods and techniques for detecting anomalies in web applications is achieved. The different studies that evaluate and compare the different anomaly detection techniques are explored. |
| Advantages and disadvantages of different methods and techniques | |
| (2) Systematic reviews of anomaly detection in web applications | |
| What studies and research have been done | The different studies are quantified and tabulated by each method or technique |
| Identification of the strengths and lacks of these works | A critical review of the studies provided is made |
| (3) Key areas of interest in the different studies carried out in the detection of anomalies in web applications | |
| Featured areas, number of studies carried out in each area and main findings | An objective view of the number of studies is obtained for each subarea that helps identify key areas for future research |
| Evolution of the number of studies carried out in each area over time | A time-based count shows how the key area has evolved over time |
| Resource | Search Query | Years | Content Type | # Results |
|---|---|---|---|---|
| ieeexplore.ieee.org | In title and abstract: “anomaly detection” AND (web OR network) | 1993–2019 | Conferences, Journals, Early Access Articles, Books | 4063 |
| sciencedirect.com | In title and abstract: “anomaly detection” AND (web OR network) | 1993–2019 | Journals, Books | 528 |
| link.springer.com | In title: “anomaly detection” AND (web OR network) | 1993–2019 | Chapter, Conference Paper, Article | 962 |
| onlinelibrary.wiley.com | In title and abstract: “anomaly detection” AND (web OR network) | 1993–2019 | Journals, Books | 31 |
| acm.org | In abstract: “anomaly detection” AND (web OR network) | 1993–2019 | Articles, Proceedings | 2457 |
| Total Results: | 8041 |
| Year | Selected by Title and Abstract | Selected after Complete Reading | Selected after Quality Questionnaire |
|---|---|---|---|
| 1993 | 0 | 0 | 0 |
| 1994 | 0 | 0 | 0 |
| 1995 | 0 | 0 | 0 |
| 1996 | 0 | 0 | 0 |
| 1997 | 0 | 0 | 0 |
| 1998 | 0 | 0 | 0 |
| 1999 | 0 | 0 | 0 |
| 2000 | 0 | 0 | 0 |
| 2001 | 0 | 0 | 0 |
| 2002 | 0 | 0 | 0 |
| 2003 | 2 | 1 | 1 |
| 2004 | 1 | 1 | 1 |
| 2005 | 2 | 2 | 1 |
| 2006 | 5 | 4 | 2 |
| 2007 | 5 | 3 | 2 |
| 2008 | 11 | 6 | 6 |
| 2009 | 5 | 3 | 2 |
| 2010 | 7 | 4 | 3 |
| 2011 | 4 | 4 | 3 |
| 2012 | 6 | 4 | 3 |
| 2013 | 5 | 1 | 0 |
| 2014 | 14 | 5 | 5 |
| 2015 | 20 | 13 | 11 |
| 2016 | 25 | 14 | 13 |
| 2017 | 26 | 16 | 13 |
| 2018 | 20 | 14 | 13 |
| 2019 | 31 | 11 | 9 |
| Total | 189 | 106 | 88 |
| Year | Conferences | Journals | Total Studies |
|---|---|---|---|
| 2003 | 1 | 0 | 1 |
| 2004 | 0 | 1 | 1 |
| 2005 | 0 | 1 | 1 |
| 2006 | 2 | 0 | 2 |
| 2007 | 2 | 0 | 2 |
| 2008 | 5 | 1 | 6 |
| 2009 | 2 | 0 | 2 |
| 2010 | 3 | 0 | 3 |
| 2011 | 1 | 2 | 3 |
| 2012 | 3 | 0 | 3 |
| 2014 | 4 | 1 | 5 |
| 2015 | 7 | 4 | 11 |
| 2016 | 10 | 3 | 13 |
| 2017 | 11 | 2 | 13 |
| 2018 | 8 | 5 | 13 |
| 2019 | 0 | 9 | 9 |
| Total | 59 | 29 | 88 |
| Attack | Number of Studies | Citations |
|---|---|---|
| DDoS | 11 | [32,33,34,35,36,37,38,39,40,41,42] |
| Injection | 10 | [43,44,45,46,47,48,49,50,51,52] |
| Botnets | 2 | [53,54] |
| Defacement | 2 | [55,56] |
| Other Attacks | 62 | [57,58,59,60,61,62,63,64,65,66,67,68,69,70,71,72,73,74,75,76,77,78,79,80,81,82,83,84,85,86,87,88,89,90,91,92,93,94,95,96,97,98,99,100,101,102,103,104,105,106,107,108,109,110,111,112,113,114,115,116,117,118] |
| Algorithm | Number of Studies | Citations |
|---|---|---|
| K-Means | 7 | [35,60,67,73,74,88,91] |
| Gaussian Mixture Model | 4 | [45,93,94,163] |
| Mahalanobis Distance | 4 | [82,93,102,113] |
| Affinity Propagation | 3 | [58,91,103] |
| DBSCAN | 2 | [32,35] |
| Convolutional Autoencoder | 2 | [71,115] |
| Nearest Neighbor based Local Outlier Factor | 2 | [54,56] |
| Expectation Maximization | 2 | [93,163] |
| Single-linkage clustering algorithm | 1 | [35] |
| Fuzzy C-Means | 1 | [35] |
| Self-Organizing Maps (SOM) | 1 | [35] |
| Deep Learning Enabled Subspace Spectral Ensemble Clustering (DEP-SSEC) | 1 | [45] |
| Subspace Spectral Ensemble Clustering (SSEC) | 1 | [45] |
| Min-Max-Tree | 1 | [69] |
| Graph-based segmentation | 1 | [72] |
| Outlier Gaussian Mixture | 1 | [79] |
| Birch | 1 | [88] |
| Mean shift | 1 | [88] |
| Subspace Weighted Ensemble Clustering | 1 | [94] |
| Query based projected clustering | 1 | [106] |
| Infinite Bounded Generalized Gaussian mixture model (InBGG) | 1 | [116] |
| Session Feature Similarity (SFAD) | 1 | [42] |
| Lambda Cut | 1 | [42] |
| Algorithm | Number of Studies | Citations |
|---|---|---|
| Markov Models | 15 | [39,40,48,53,63,66,84,88,98,104,105,107,109,111,116] |
| One-Class Support Vector Machine (OCSVM) | 11 | [45,54,56,63,64,77,81,90,94,103,114] |
| Decision Tree | 9 | [43,47,65,66,70,85,91,101,103] |
| K-Nearest Neighbors (K-NN) | 5 | [56,83,91,103,112] |
| Neural Network | 2 | [86,89] |
| Random Forest | 2 | [75,117] |
| Isolation Forest | 2 | [59,114] |
| Needleman-Wunsch Algorithm | 2 | [72,74] |
| Technique | Type | Number of Studies | Citations |
|---|---|---|---|
| N-Grams | Feature Selection | 12 | [57,59,60,61,69,77,82,90,93,102,113,118] |
| Bag-Of-Words (BOW) | Feature Selection | 2 | [48,115] |
| Filter Based subset Evaluation (FBSE) | Feature Selection | 1 | [75] |
| Uniformed Conditional Dynamic Mutual Information (UCDMIFS) | Feature Selection | 1 | [78] |
| Multifeatures Information Entropy Prediction Model | Feature Selection | 1 | [39] |
| Genetic Algorithm (GA) | Optimization & Searching | 4 | [43,81,85,97] |
| Principal Component Analysis (PCA) | Dimensionality Reduction | 6 | [34,57,60,91,113,118] |
| Random Projection (RP) | Dimensionality Reduction | 1 | [57] |
| Diffusion Map (DM) | Dimensionality Reduction | 1 | [57] |
| Sample Entropy | Dimensionality Reduction | 1 | [60] |
| Dataset | Number of Studies | Citations |
|---|---|---|
| CSIC 2010 | 13 | [43,59,64,65,72,74,80,85,86,87,93,114,117] |
| KDD-Cup 99 | 8 | [58,78,80,81,91,97,106,116] |
| DARPA | 4 | [77,82,100,102] |
| NSL-KDD | 2 | [75,80] |
| UNSW-NB15 | 2 | [75,115] |
| Kyoto 2006 | 2 | [80,116] |
| ISCX | 1 | [116] |
| ECML/PKDD 2007 | 1 | [114] |
| Metric | Number of Studies | Citations |
|---|---|---|
| FPR / FAR | 61 | [32,33,35,36,38,39,40,41,42,43,44,45,46,48,49,50,52,55,56,58,60,62,63,64,65,66,67,69,71,72,74,75,79,81,82,83,85,86,87,91,94,95,96,97,98,99,100,101,102,104,105,107,108,109,110,111,112,113,116,117,118] |
| TPR/Recall/ Sensitivity/DR | 49 | [33,35,36,37,38,39,40,41,42,45,46,47,48,49,50,52,53,60,65,66,67,69,70,71,72,74,75,76,79,80,81,82,83,85,86,87,89,91,93,94,97,98,100,101,102,105,106,107,108,109,110,111,112,113,114,115,117,118] |
| Accuracy | 24 | [35,36,41,47,48,50,53,59,60,64,66,75,80,81,88,89,92,99,100,103,105,113,114,116] |
| F-Score | 12 | [47,59,62,65,71,76,80,89,113,114,115,118] |
| Precision | 11 | [41,43,59,65,66,76,80,89,113,114,115] |
| ROC/AUC | 10 | [34,50,55,71,72,77,83,90,107,115] |
| FNR | 4 | [55,56,95,100] |
| TNR/Specificity | 3 | [59,93,114] |
| CE | 1 | [163] |
| MCC | 1 | [71] |
| Study | TPR | FPR | Precision | Accuracy | Specificity | F-Score | AUC | Dataset |
|---|---|---|---|---|---|---|---|---|
| Nguyen, Nguyen and Vu [77] | 91.42% | DARPA | ||||||
| 99.12% | ||||||||
| 98.31% | ||||||||
| Angiulli, Argento and Furfaro [82] | 100% | 0.59% | DARPA | |||||
| Jamdagni et al. [102] | 100% | 0.087% | DARPA | |||||
| Wang et al. [58] | 98.4% | 1.01% | KDD-Cup 99 | |||||
| Kaur and Bansal [81] | 99.46% | 1.96% | KDD-Cup 99 | |||||
| Li et al. [97] | 99.38% | 3.87% | KDD-Cup 99 | |||||
| Kamarudin et al. [75] | 89.75% | 8.22% | 90.33% | NSL-KDD | ||||
| 99.1% | 0.18% | 99.45% | UNSW - NB15 | |||||
| Moustafa, Misra and Slay [79] | 95.56% | 4.43% | UNSW - NB15 | |||||
| 97.28% | 2.72% | Private Dataset | ||||||
| Alhakami et al. [116] | 16.84% | 83.49% | KDD-Cup 99 | |||||
| 14.24% | 87.41% | Kyoto 2006 | ||||||
| 9.79% | 90.4% | ISCX | ||||||
| Alrawashdeh and Purdy [80] | 96.57% | CSIC 2010 | ||||||
| 98.59% | KDD-Cup 99 | |||||||
| 99.96% | NSL-KDD | |||||||
| 98.4% | Kyoto 2006 | |||||||
| Vartouni, Kashi and Teshnehlab [59] | 88.34% | 80.29% | 88.32% | 88.32% | 84.12% | CSIC 2010 | ||
| Parhizkar and Abadi [64] | 95.9% | 2.82% | 96.54% | CSIC 2010 | ||||
| Betartte et al. [93] | 96.1% | 99.5% | CSIC 2010 | |||||
| Moradi Vartouni, Teshnehlab and Sedighian Kashi [114] | 89.48% | 89.11% | 85.35% | CSIC 2010 | ||||
| 89.75% | 78.25% | 84.93% | ECML/PKDD 2007 | |||||
| Koziz and Choraś [65] | 98.3% | 1.9% | 94.6% | 96.4% | CSIC 2010 | |||
| Choraś and Kozik [72] | 94.46% | 4.5% | CSIC 2010 | |||||
| Kozik et al. [87] | 86.6% | 1.8% | CSIC 2010 | |||||
| 95.6% | 5.8% | |||||||
| 96.9% | 6.8% | |||||||
| 97.7% | 8.1% | |||||||
| Kozik, Choraś and Hołubowicz [43] | 98% | CSIC 2010 + | ||||||
| Kozik, Choraś and Hołubowicz [74] | 92.7% | 6.4% | CSIC 2010 + | |||||
| Kozik and Choraś [85] | 91.5% | 0.7% | CSIC 2010 + | |||||
| Kozik et al. [86] | 94.98% | 0.79% | CSIC 2010 + | |||||
| Kozik and Choraś [117] | 93.5% | 0.5% | CSIC 2010 + |
© 2020 by the authors. Licensee MDPI, Basel, Switzerland. This article is an open access article distributed under the terms and conditions of the Creative Commons Attribution (CC BY) license (http://creativecommons.org/licenses/by/4.0/).
Share and Cite
Sureda Riera, T.; Bermejo Higuera, J.-R.; Bermejo Higuera, J.; Martínez Herraiz, J.-J.; Sicilia Montalvo, J.-A. Prevention and Fighting against Web Attacks through Anomaly Detection Technology. A Systematic Review. Sustainability 2020, 12, 4945. https://doi.org/10.3390/su12124945
Sureda Riera T, Bermejo Higuera J-R, Bermejo Higuera J, Martínez Herraiz J-J, Sicilia Montalvo J-A. Prevention and Fighting against Web Attacks through Anomaly Detection Technology. A Systematic Review. Sustainability. 2020; 12(12):4945. https://doi.org/10.3390/su12124945
Chicago/Turabian StyleSureda Riera, Tomás, Juan-Ramón Bermejo Higuera, Javier Bermejo Higuera, José-Javier Martínez Herraiz, and Juan-Antonio Sicilia Montalvo. 2020. "Prevention and Fighting against Web Attacks through Anomaly Detection Technology. A Systematic Review" Sustainability 12, no. 12: 4945. https://doi.org/10.3390/su12124945