Who Risks and Wins?—Simulated Cost Variance in Sustainable Construction Projects


1
Faculty of Civil and Environmental Engineering and Architecture, UTP University of Science and Technology, al. prof. S. Kaliskiego 7, 85-348 Bydgoszcz, Poland
2
Research Centre on Production Management and Engineering (CIGIP), Universitat Politècnica de València, Pl. Ferrándiz Carbonell, s/n, 03801 Alcoy, Spain
*
Author to whom correspondence should be addressed.
Sustainability 2020, 12(8), 3370; https://doi.org/10.3390/su12083370
Submission received: 24 March 2020
/
Revised: 7 April 2020
/
Accepted: 19 April 2020
/
Published: 21 April 2020
Abstract
:More and more construction projects are closed before they ever start. Among the most significant reasons for project failures is cost risk. Construction companies have many problems with reliable cost management. Rising demands of the key market players insist on making construction projects more sustainable according to the simultaneous improvement of the economic, environmental and social responsiveness dimensions. In order to investigate these problems, a four-phase research methodology has been followed consisting of: (1) literature review to identify research trends and gaps, (2) survey to construction experts to detect their subjective perspectives about risk costs and analyse the corresponding costs structure for the investment in sustainable projects, (3) simulations based on Monte Carlo simulation with an author’s methodology for calculating the cost risk with an additional statistical analysis, (4) ending questionnaire to obtain the final feedback from the experts and the validation of obtained results. A contribution to the development of knowledge about cost risk is the observation that the changing probability distributions of individual cost-generating components may include both economic as well as technological and organizational aspects. Thus, with the proposed approach, often complex, global challenges of sustainable construction projects can be tackled in an accessible way.
1. Introduction
Construction, as one of the most significant and strategic branches of the economy [1], is featured by significant achievements in the field of development of its products—buildings, roads, structures, etc. It also catalyses new discoveries in the field of technology, organization and business organization. On one side, a theoretical base supporting innovations in construction is significantly expanded [2]. However, methods of building show considerable resistance to major changes leading to increased productivity [3] in relation to other important industries (e.g., telecommunications). On the other hand, they are sensitive to numerous improvements in technology enabling the acceleration of project implementation, ensuring lower costs, as well as higher product quality. The construction market is characterized by cyclical fluctuations in time and high competitiveness of entities implementing construction tasks [4].
Generally speaking, risk can be defined as a deviation of the course of events from predictions [5]. Thus, a risk sensitivity of a particular area can be treated as its susceptibility to factors affecting the prediction accuracy.
Risk analysis can be a good starting point for creating certitude of achieving the objectives of a project task. However, knowledge about the decision-makers’ attitude towards risk-taking is indispensable [6] to perform the analysis accurately. Therefore, a review of previous arrangements in costs of sustainable construction projects will show a tendency for the cost variability scale in such projects. On the other hand, there have been no considerations in the area of the cost risk of sustainable projects in construction, i.e., a sense of their accuracy. This article attempts to fill this research gap.
Estimated, and therefore expected, costs of construction investment projects are a significant risk area for this type of activity [7]. Cost risk can be considered from the perspective of individual participants of undertakings. A specification of the reasons for the variability, and consequently unpredictability, of costs of construction projects, with showing their environmental dimension can be useful in estimating the actual construction costs. Sources of cost risk, relating to an investor and a contractor, require special articulation.
The method presented in this paper is a proposal of the contingency of construction costs. It uses random observations of individual cost factors, and at the same time, it examines the structure of total construction costs. However, stress was put only to constructing a building, while another type of projects (especially infrastructure) was neglected. Moreover, due to the fact that there are different methods of cost estimation in different countries, it was decided to limit the analysis to one selected approach to costing calculations.
On the basis of the literature studies [8,9,10] and practical experience of authors, it can be noted that a structure of costs of construction projects is probabilistic, and various probability distributions (e.g., normal, log-normal, triangular) can be assigned to the predictions of the value of individual cost factors as random variables. The literature review suggests the following assumption:
Variability of the technological and organizational conditions in construction works results in deviations from the planned costs of construction. Sustainable construction projects are prone to the risk of costs like other types of undertakings.
However, a scale of the variability is an undiscovered problematic issue. Therefore, the study was motivated by the following research question:
How can we measure the risk of cost estimations in sustainable construction projects?
Besides, one research hypothesis was formulated in order to be verified or refuted as a final result of the study:
A probabilistic approach to cost risk estimation of sustainable construction projects makes possible to determine more reliable decision-making processes conducted by different stakeholders in turbulent conditions.
In this article, the opinion of experts in the construction sector was collected in order to illustrate the cost risk of sustainable construction. Moreover, it was proposed a method of quantitative analyses of cost risk in sustainable construction projects. The result of the simulation, based on the Monte Carlo method, presented in this article is the distribution of probabilities for the total cost of the project in which sustainable development is a priority.
The Monte Carlo simulations have been used, by other academics, to study potential situations for many different scenarios. Currently, however, none of the applications connected with the estimation of construction costs penetrate the structure of sustainable construction costs. Such necessity was noticed in this research. Therefore, the main contributions of this paper are to (1) provide an overview of construction professionals’ perception of cost risk in sustainable projects, and (2) propose a procedure to analyse the risk of costs of construction projects executed under the sustainable development principles with a concurrent knowledge acquisition about the variability of individual cost components based on Monte Carlo simulation method.
The rest of the paper is organized as follows. Section 2 describes the theoretical framework in which this study is based, including sustainable principles in construction projects, costs structure, variance and risk register. Section 3 illustrates the research methodology implemented in this article. Section 4 shows the results derived from the application of the proposed methodology, describing the structure of the costs considered in the Monte Carlo simulation model and presenting the corresponding obtained results which are discussed in Section 5. Finally, conclusions and limitations and further research lines are provided in Section 6 and Section 7, respectively.
2. Theoretical Framework
2.1. Sustainable Construction Projects
Specific features of construction tasks shape the nature of construction projects. These undertakings are usually associated with deep and long-term interference in the natural environment [11]. Not only in the phase of erecting buildings, but also during their maintenance, as well as decommissioning, there are many environmental burdens brought by the execution of construction projects. Significant resources of materials and energy are needed to erect a building and then to keep it in operation.
Selecting the most appropriate construction method is a difficult challenge for construction practitioners during early project stages. According to the literature [12], there are some highly important sustainable performance criteria for this selection: construction time, initial construction costs, constructability, material costs, and lead-times. On the other hand, among crucial barriers to sustainable construction, there are a high initial cost and a lack of knowledge regarding possible solutions for constructing sustainably, and technological difficulties [13].
In order to extend knowledge and support sustainability in construction projects, some systems have been developed for the evaluation of the environmental performance of buildings [14], like the LEED (Leadership in Energy and Environmental Design) or the BREEAM (Building Research Establishment Environmental Assessment Method). These approaches are treated as criteria-based tools [15], however, the whole building life cycle assessment (LCA) can be applied before obtaining such certificates [16]. On the other hand, some researchers [17,18] introduced the implementation of lean construction in sustainable construction projects.
As it seems, the definition of a sustainable construction project is rather fuzzy, multi-threaded and covers many different aspects. However, the leading common feature is a divergence from the traditional perception of project management based on time, cost, scope, and quality in favour of economic, environmental and social impacts of construction projects.
Finally, it should be noted that a construction market is relatively difficult for its participants and is closely related to the general economic situation what becomes apparent especially during global economic crises. Involvement of different specialists and decision-makers in subsequent stages of the construction project causes a need for holistic management to meet expectations and requirements of all these stakeholders, and to lead the project to the final success. Given that stakeholders are a major source of uncertainty, and that the complex processes of sustainable project delivery are often unfamiliar to them, risk management becomes essential [19]. Collaborative nature of projects, so essential for the success of sustainable projects, may incline cost increases. Therefore, construction, as an industry with a high rate of capital intensity and economic variability in time, requires continuous tracking of costs of construction projects and sustainable ones are no exception.
2.2. Cost of Construction Projects
In order to control costs, it is necessary to plan them at first. The choice of the cost estimation method depends on the project phase. In the phase of investment programming, cost estimation is usually based on expert estimates and parametric methods. Calculation of costs by more detailed methods is only possible after defining a scope of the project.
2.2.1. Structure
Construction costs demonstrate sensitivity to schedule risk and estimation errors. An important area of risk is a prediction of construction costs of investment projects, calculated according to accepted procedures. The procedures for estimating the cost of construction works include the costs of labour (of workers and equipment), materials, mark-ups for indirect costs and profit.
A standard calculation procedure, proposed in this article, for the detailed cost estimate (Ce) of construction works, based on the standard costing methodology [20], can be written as follows:
where:
Ce = L + M + E + RIC (L + E) + RP (L + E + IC),
- Ce—cost estimate (monetary units),
- L—labour costs (monetary units),
- M—costs of materials with purchase costs (monetary units),
- E—equipment costs (monetary units),
- RIC—indirect costs rate (%),
- RP—profit rate (%),
- IC—indirect costs, while: IC = RIC (L + E) (monetary units).
The calculation of direct costs associated with the consumption of production resources requires precise determination of the scale of the production (work quantity), production factor standards (productivity, material consumption, equipment output) and their standard prices (labour rate, material unit price, employment cost).
Calculation of the indirect costs rate (in relation to the value of labour and equipment costs) and profit rate in the cost estimate of construction works should be based on an analysis of the internal situation of a construction company. These numbers are market-based and depend on the competitive position of contractors. It should be emphasized that determining the planned costs of implementing construction projects, despite the apparent simplicity, is a task that requires a good recognition of the technological and organizational details of construction processes.
The standard calculation procedure forms a different structure of costs in comparison with other estimation models, used locally like, for example, the one in southern Spain and based on the Andalusia Construction Information Classification System (ACICS) which is formed by basic costs (BC), auxiliary costs (AC), and simple costs (SC) on different levels of aggregation [21].
Nevertheless, a separate problem is the ability to assess risk in relation to the estimated cost of construction projects—in particular—in the structure of individual costs. This knowledge is vital for cost management.
2.2.2. Variance
The risk concept always appears when the accuracy of predictions is considered. Generally, it can be described as a deviation of the expected course of events. Risk, seen as potential event variability, refers to the probability of departing from the assumed situation and its consequences. It is the result of the unpredictability of future events—the occurrence of deviations from planned states in the future. Risk should, therefore, be associated primarily with a measure of variance in previously planned values. However, it is usually defined as the potential for realisation of unwanted, negative consequences of an event [22].
The complicated configuration of technical, organizational, economic and social problems in construction investment projects implies a diverse nature of the risk in achieving the project goal. Predicting threats and planned responses to prevent the consequences are necessary along with monitoring the effects of these actions, which constitutes the risk management.
The divergence of predictions and reality in a construction project can be seen in its individual perspectives. It may become apparent in the area of the project scope, quality of construction works as well as the time of task completion and its costs.
Cost risk is related to the difficulty in estimating costs, e.g., demolition works of facilities of a former industrial plant. The uncertainty of input items to a bill of quantities, namely, quantities of bill items, usage of resources and their prices are quantified as two moments. The cumulative distribution function for project cost approximated from its two moments is used to determine the contingency allocation based on the desired probability of success [23]. Usually, probabilistic cost contingency demonstrates that contingency varies with the project type, size, and duration [24].
In making investment decisions, costs related to the building throughout its life cycle should be taken into account [25]. Such an attitude has become the basis for the development of the Life Cycle Costing (LCC) methodology. A standard approach to decide which alternative is better in terms of LCC is the selection of one with the lowest net present value of costs [26].
2.2.3. Risk Register
A feasibility study plays a very important role in the construction project cycle because it is a document necessary for the investor to help in making decisions on the project. The essence of this document is to check how much funds will be needed, whether the project is sustainable (will it cover operating costs in the future?), or are there any restrictions (organizational, legal, etc.)? The feasibility study helps in reducing the risk of investors’ failure, minimizing capital expenditure and maximizing profits.
Analysing the goals of the feasibility study, it can be concluded that thanks to this document, the investor can properly manage the project by determining the best possible scenarios of the investment in economic, financial, technological, social, environmental and organizational terms.
The most important step is to conduct a risk analysis in terms of various factors that may pose a threat to the implementation and operation of the project.
The sensitivity and risk analysis in the project feasibility study should include:
- problems of legal feasibility of the project,
- sensitivity to changes in investment costs, including variances in prices,
- problems of errors in construction documentation.
Identification of risk factors in a feasibility study is generally based on an analysis of the threats that occur during the whole project. They are factors that may lead to:
- definite withdrawal from the project,
- time overruns,
- poor quality of construction works,
- cost overruns,
- lost of grant awards.
A responsible project manager is aware of all these possibilities and prevents them by putting response plans based on more efficient management including the cost risk management.
3. Methodology
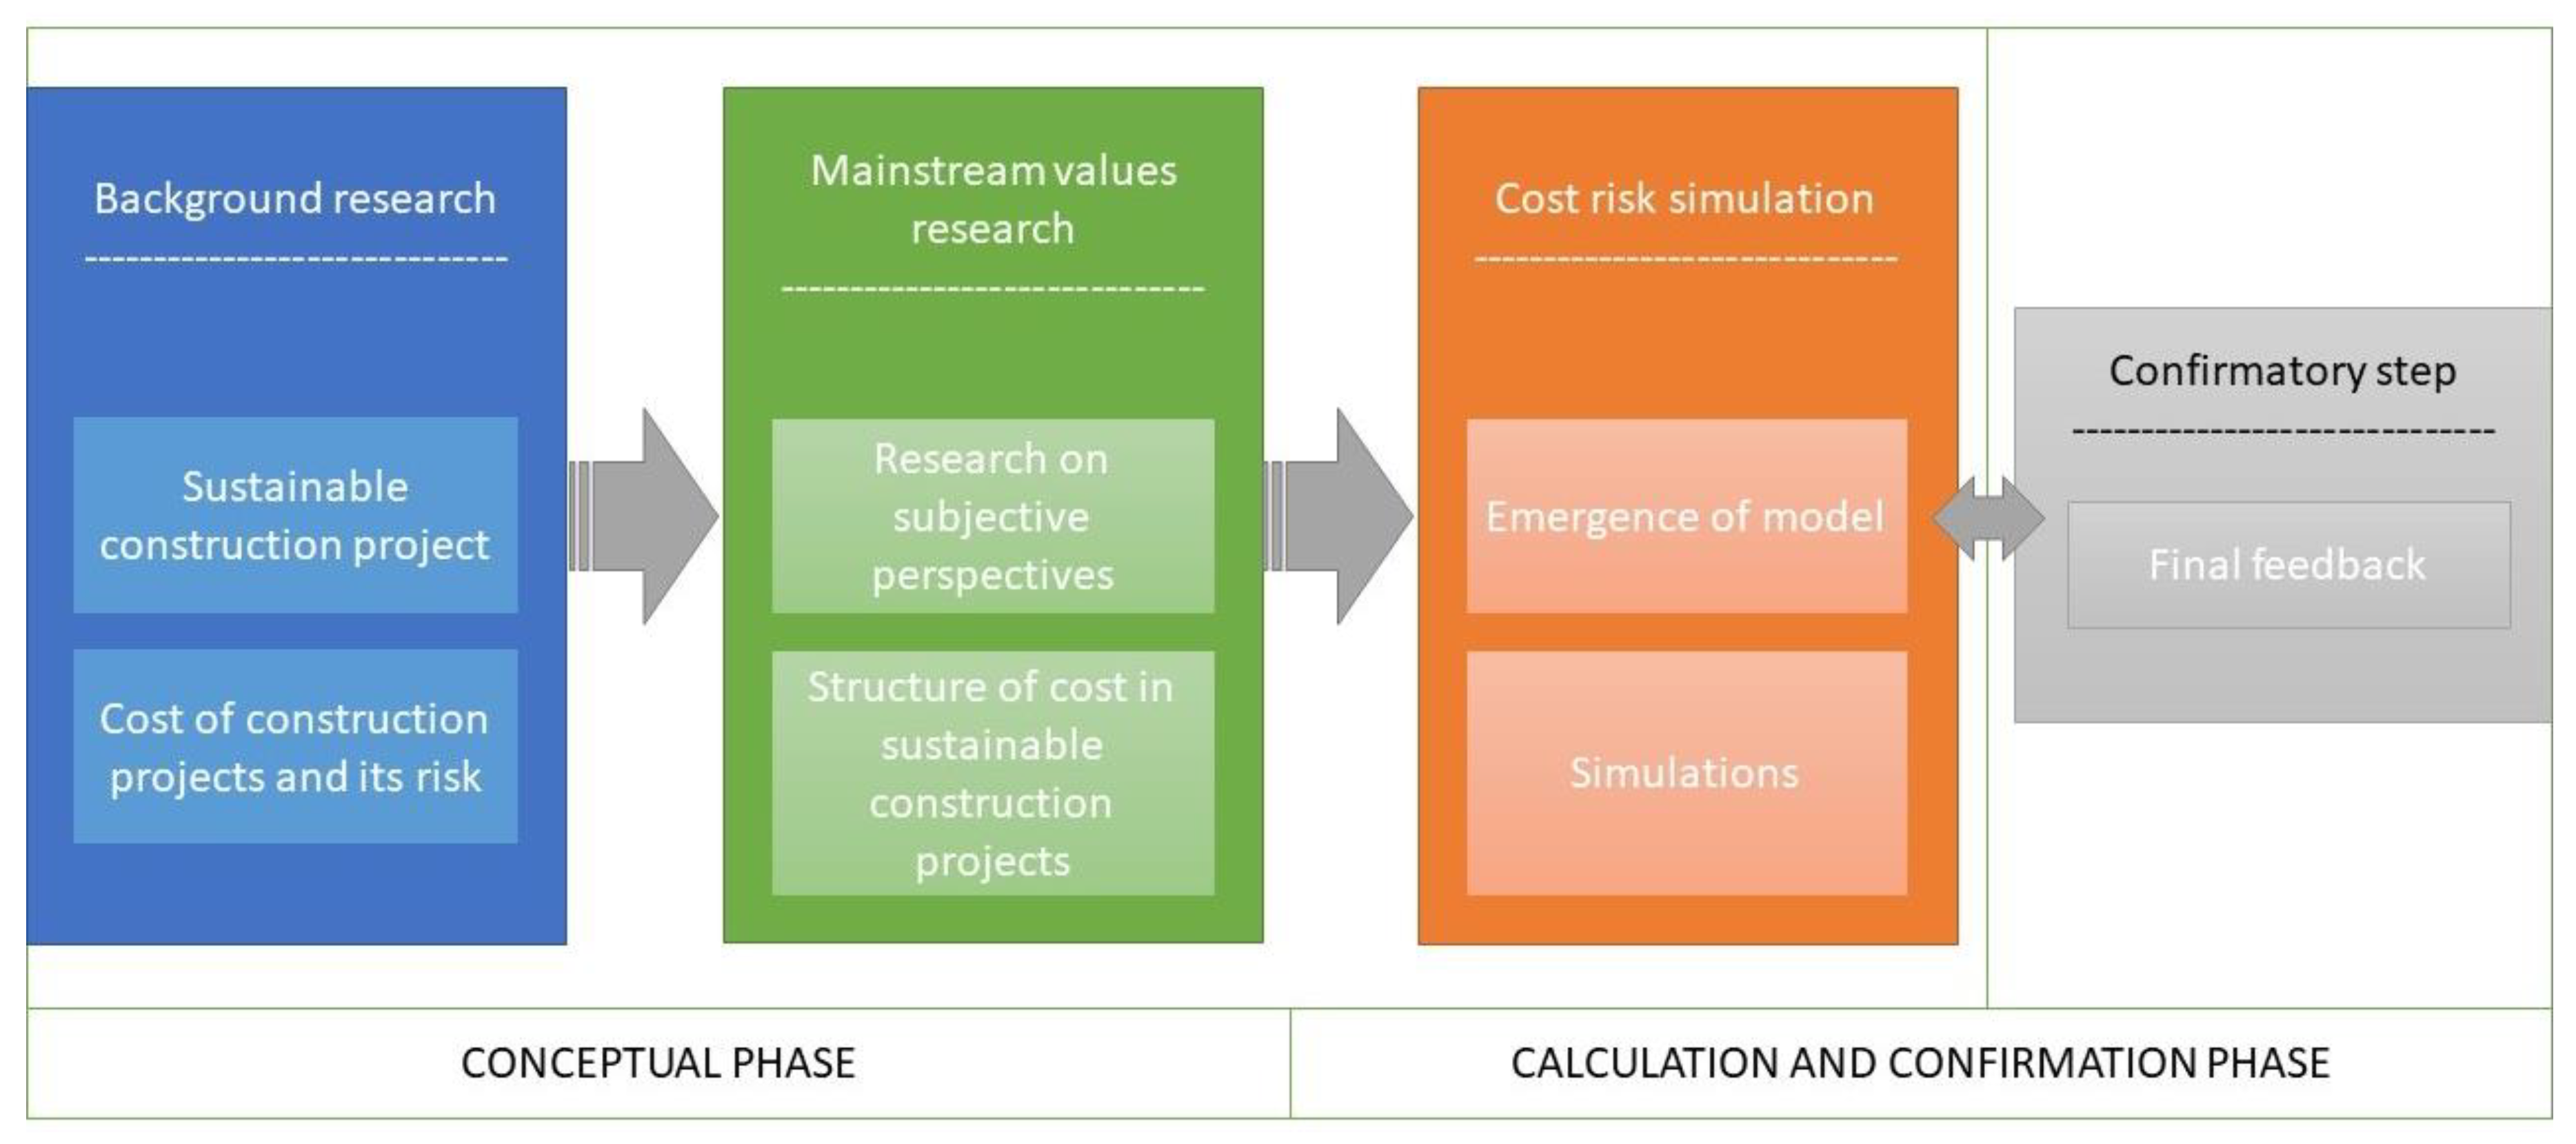
The research was conducted from October 2019 to April 2020. As a research topic has a very innovative nature, and the research is in an embryonic stage, it was decided to concentrate on three steps of investigation followed by the confirmatory step.
Firstly, a literature review was performed in order to check the state of the art. The background research revealed a presumptive gap of knowledge in terms of the cost risk analysis in sustainable construction projects.
Secondly, a need for getting opinions of experts involved in sustainable construction projects aroused the unrestrained curiosity. Therefore, initial research on subjective perspectives was conducted in November 2019 among 33 experts of the construction market from northern Poland. This stage was named mainstream values research to underline main subjective opinions on the research matter. Although the sample size of the survey is not large, it is similar to numerous previous studies in the domain of sustainable construction projects [27,28,29,30]. Moreover, 33 responses represent the experiences of 33 different companies, which could be a representative image to illustrate the real situation of risk costs management in sustainable building projects in Poland.
In the end, a new model of cost risk simulation emerged. Replicability of the research is conditioned by treating the cost risk in the same way as it was proposed in the article. A method of the simulations looks inside the structure of cost estimations of the sustainable construction project. A received value of cost risk explains to what extent it is probable that the deterministic calculation is underestimated. Somehow, it measures the certitude of estimation and from this point of view, it can be an interesting solution for all parties involved in sustainable construction projects. The specificity of the proposed three-step model and details of the method will be explained later in Section 4.4, whereas final feedback coming from the confirmatory step will be described in Section 4.5. The final feedback was taken after a closing questionnaire among 30 random experts of the construction projects to obtain the opinion on the proposed hypothesis and to validate the obtained results.
To compute the cost risk simulation model, the Monte Carlo method was used. It supports mathematical modelling of a variety of complex processes. This approach, developed and used for the first time by Stanisław Ulam [31], can also be used in business, with particular emphasis on project risk management, mainly for a time [32,33,34] and cost [32] objectives. According to Ulam, the computation process can be associated with the “physical” production of models of combinatorial situations in mathematical problems. Increasingly, this method is gaining recognition among researchers dealing with the topic of cost risk of construction projects [35,36] for which the combinatory circumstances are connected with different sorts of cost estimation confronted with real conditions of the execution of construction projects.
The COMAR software was run to simulate probabilistic values and perform simulations using the Monte Carlo framework. The application of the algorithm was previously explained in the literature [37,38]. It enables simulating the cost risk on the basis of input variables.
To better illustrate the essence of this study, a graphical summary of the selected research model is presented in Figure 1.
In further part, there were presented the results of research developed on the basis of the methodology adopted above.
4. Results
Planning project with full success is almost impossible. Usually, during the project implementation, for various reasons, changes in the initial plans are necessary. Size of these changes determines the complexity of the project management and the level of risk.
4.1. Literature Review
Risk management is a mature area traditionally present in different productive areas as enterprise, information technology, infrastructure or construction projects, among others. Especially, regarding construction projects, several literature reviews have been published in the last years in international journals [39,40,41,42,43]. However, none of these articles address the sustainable dimension of construction projects nor they explicitly address risk management associated with their costs. In this sense, firstly, a systematic literature review was conducted in order to identify relevant scientific contributions in the risk cost management discipline, which are secondly analysed with the aim of detecting the main gaps in the literature and most representative trends.
The procedure followed to deal with the literature review is similar to the steps proposed in [43,44,45]. The search for papers which consider integrated production and transport routing planning decisions was performed using the SciVerse Scopus database. The following search criteria were applied to the article title, abstract and keywords fields of this web search engine: “construction projects”, cost, risks and sustainable/sustainability. After this process, a group of 85 references is obtained, which is filtered considering only construction projects for buildings (rejecting papers about megaprojects of construction infrastructures such as railways, nuclear plants, etc.) dealing with risk costs, among others.
This group of selected references has been analysed according to some of the classification criteria considered by [43], adding a supplementary item regarding the country of application for each reference (if applicable), such as:
- Research focus:
- ○
- Risk identification (RI)
- ○
- Risk assessment/analysis (RA)
- ○
- Risk evaluation (RE)
- ○
- Risk response (RR)
- ○
- Risk monitoring and control (RM)
- Source of information:
- ○
- Review (RV)
- ○
- Case study (CS)
- ○
- Survey/interview (SI)
- Research output:
- ○
- General insights and descriptions (GI)
- ○
- Statistical results (ST)
- ○
- Theoretical model (TM)
- ○
- Mathematical model (MM)
- ○
- Experimental/prototype model (EM)
Firstly, it is worth noting the reduced number of references obtained after the filtering process. However, the size of the generated group is similar to that identified by [43] in terms of risk management related to costs in construction projects in their review article. The resulting group of papers was analysed according to this framework and classified by one of these subcategories as showed in Table 1. The main research focus is the identification of risk costs conditioning factors and the analysis and/or assessment of risk issues in sustainable construction projects. On the other hand, the most popular methodology considered as a source of information is the development of interviews or questionnaires answered by experts, and to a lesser extent the literature review procedure.
Regarding the results obtained, statistical methods and mathematical models emerge as the main research techniques to support the advances presented. These statistical approaches are mainly oriented to assess the relevance of the answers derived from surveys and questionnaires while mathematical models are more focused on calculations or forecasting of possible levels of risk costs. However, mathematical approaches, such as Monte Carlo simulation, has only been applied by Chou and Le [52], although, as indicated by Irlayici and Tezel [43], it is one of the most popular procedures to risk evaluation. Finally, Poland and the UK stand out as countries where more than the applications presented are applied.
4.2. Survey
To illustrate the cost risk of sustainable construction projects in the opinion of experts of the construction sector, can be useful the results of a survey entitled “Opinion on construction investment projects implemented in accordance with the principles of sustainable development”, conducted among 33 experts of the construction market, carried out in November 2019.
4.2.1. Research Details
The questionnaire was addressed to the experts through a link. A target was established on the basis of the public expert database. Due to limitations of the initial research, experts were selected from northern Poland. A structure of the surveyed professionals is shown in Figure 2 and Figure 3.
The experts were supposed to answer four questions in the first part and in-depth extra questions in the second one.
4.2.2. Findings
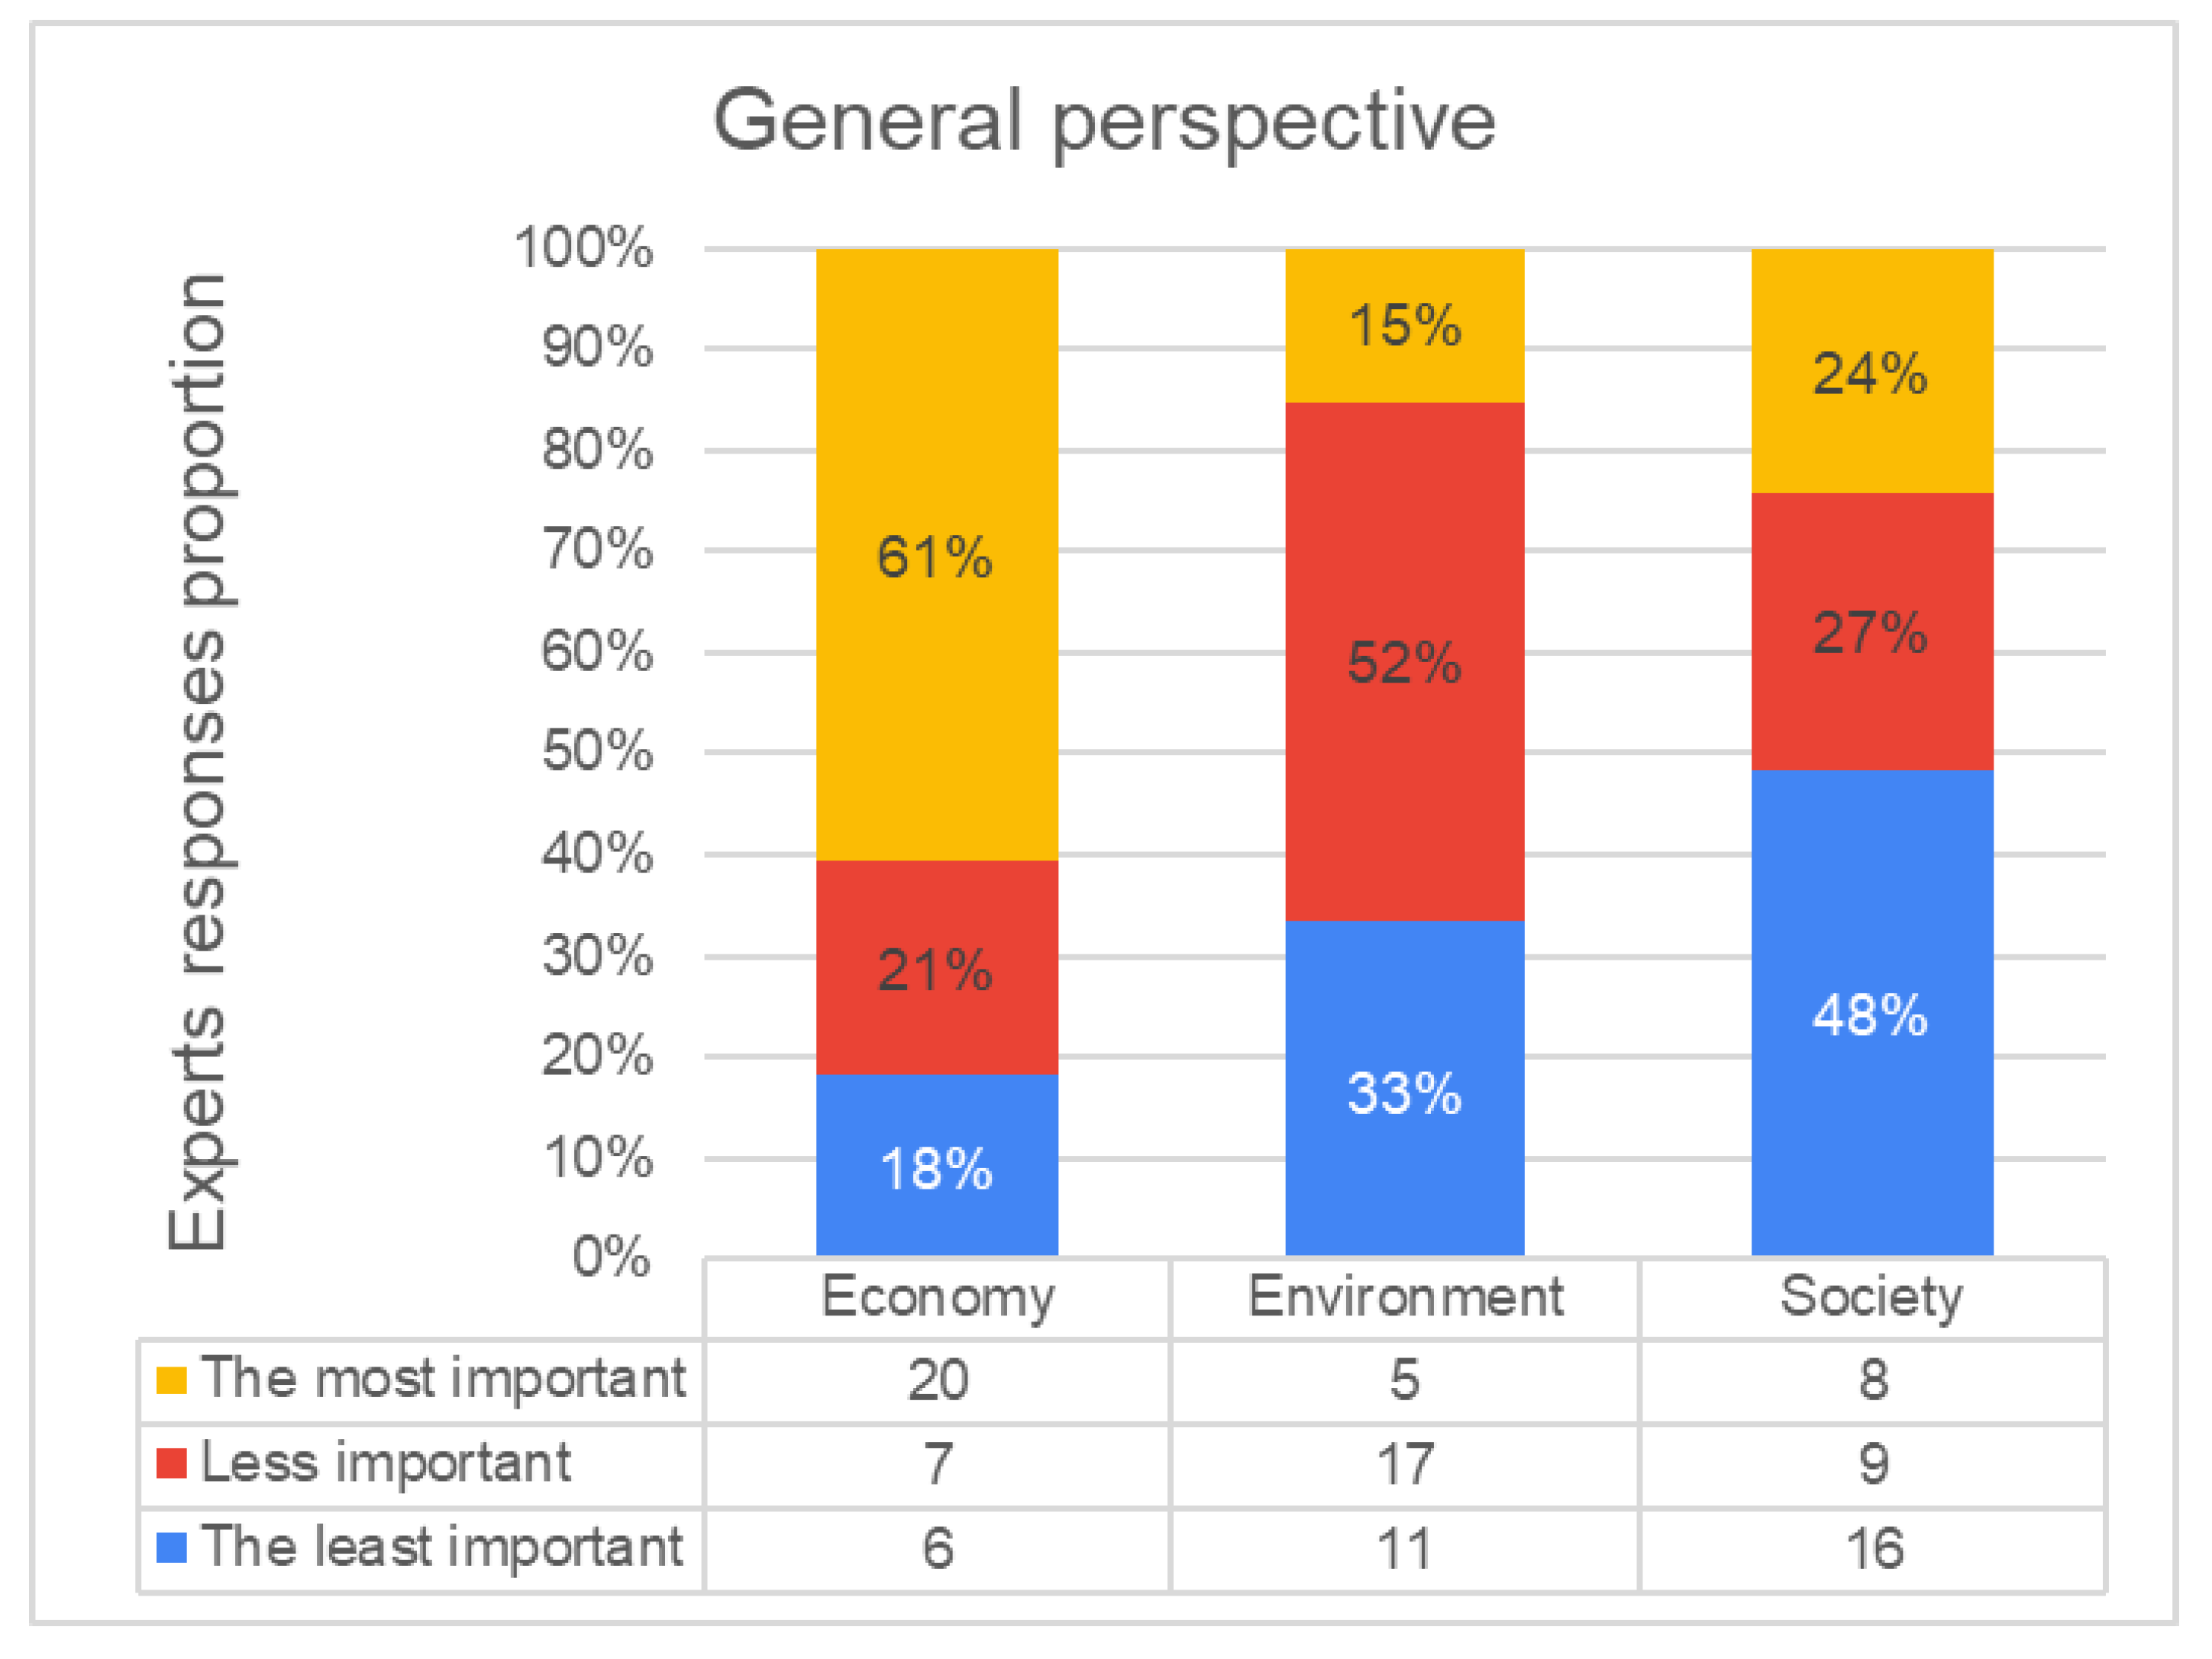
The opening question was about the hierarchy of importance of the following dimensions of business activity: economic, environmental, and social. A general perspective is shown in Figure 4.
The respondents feel like economic dimension is the most important factor in business activity, whereas the most neglected one is the social aspect.
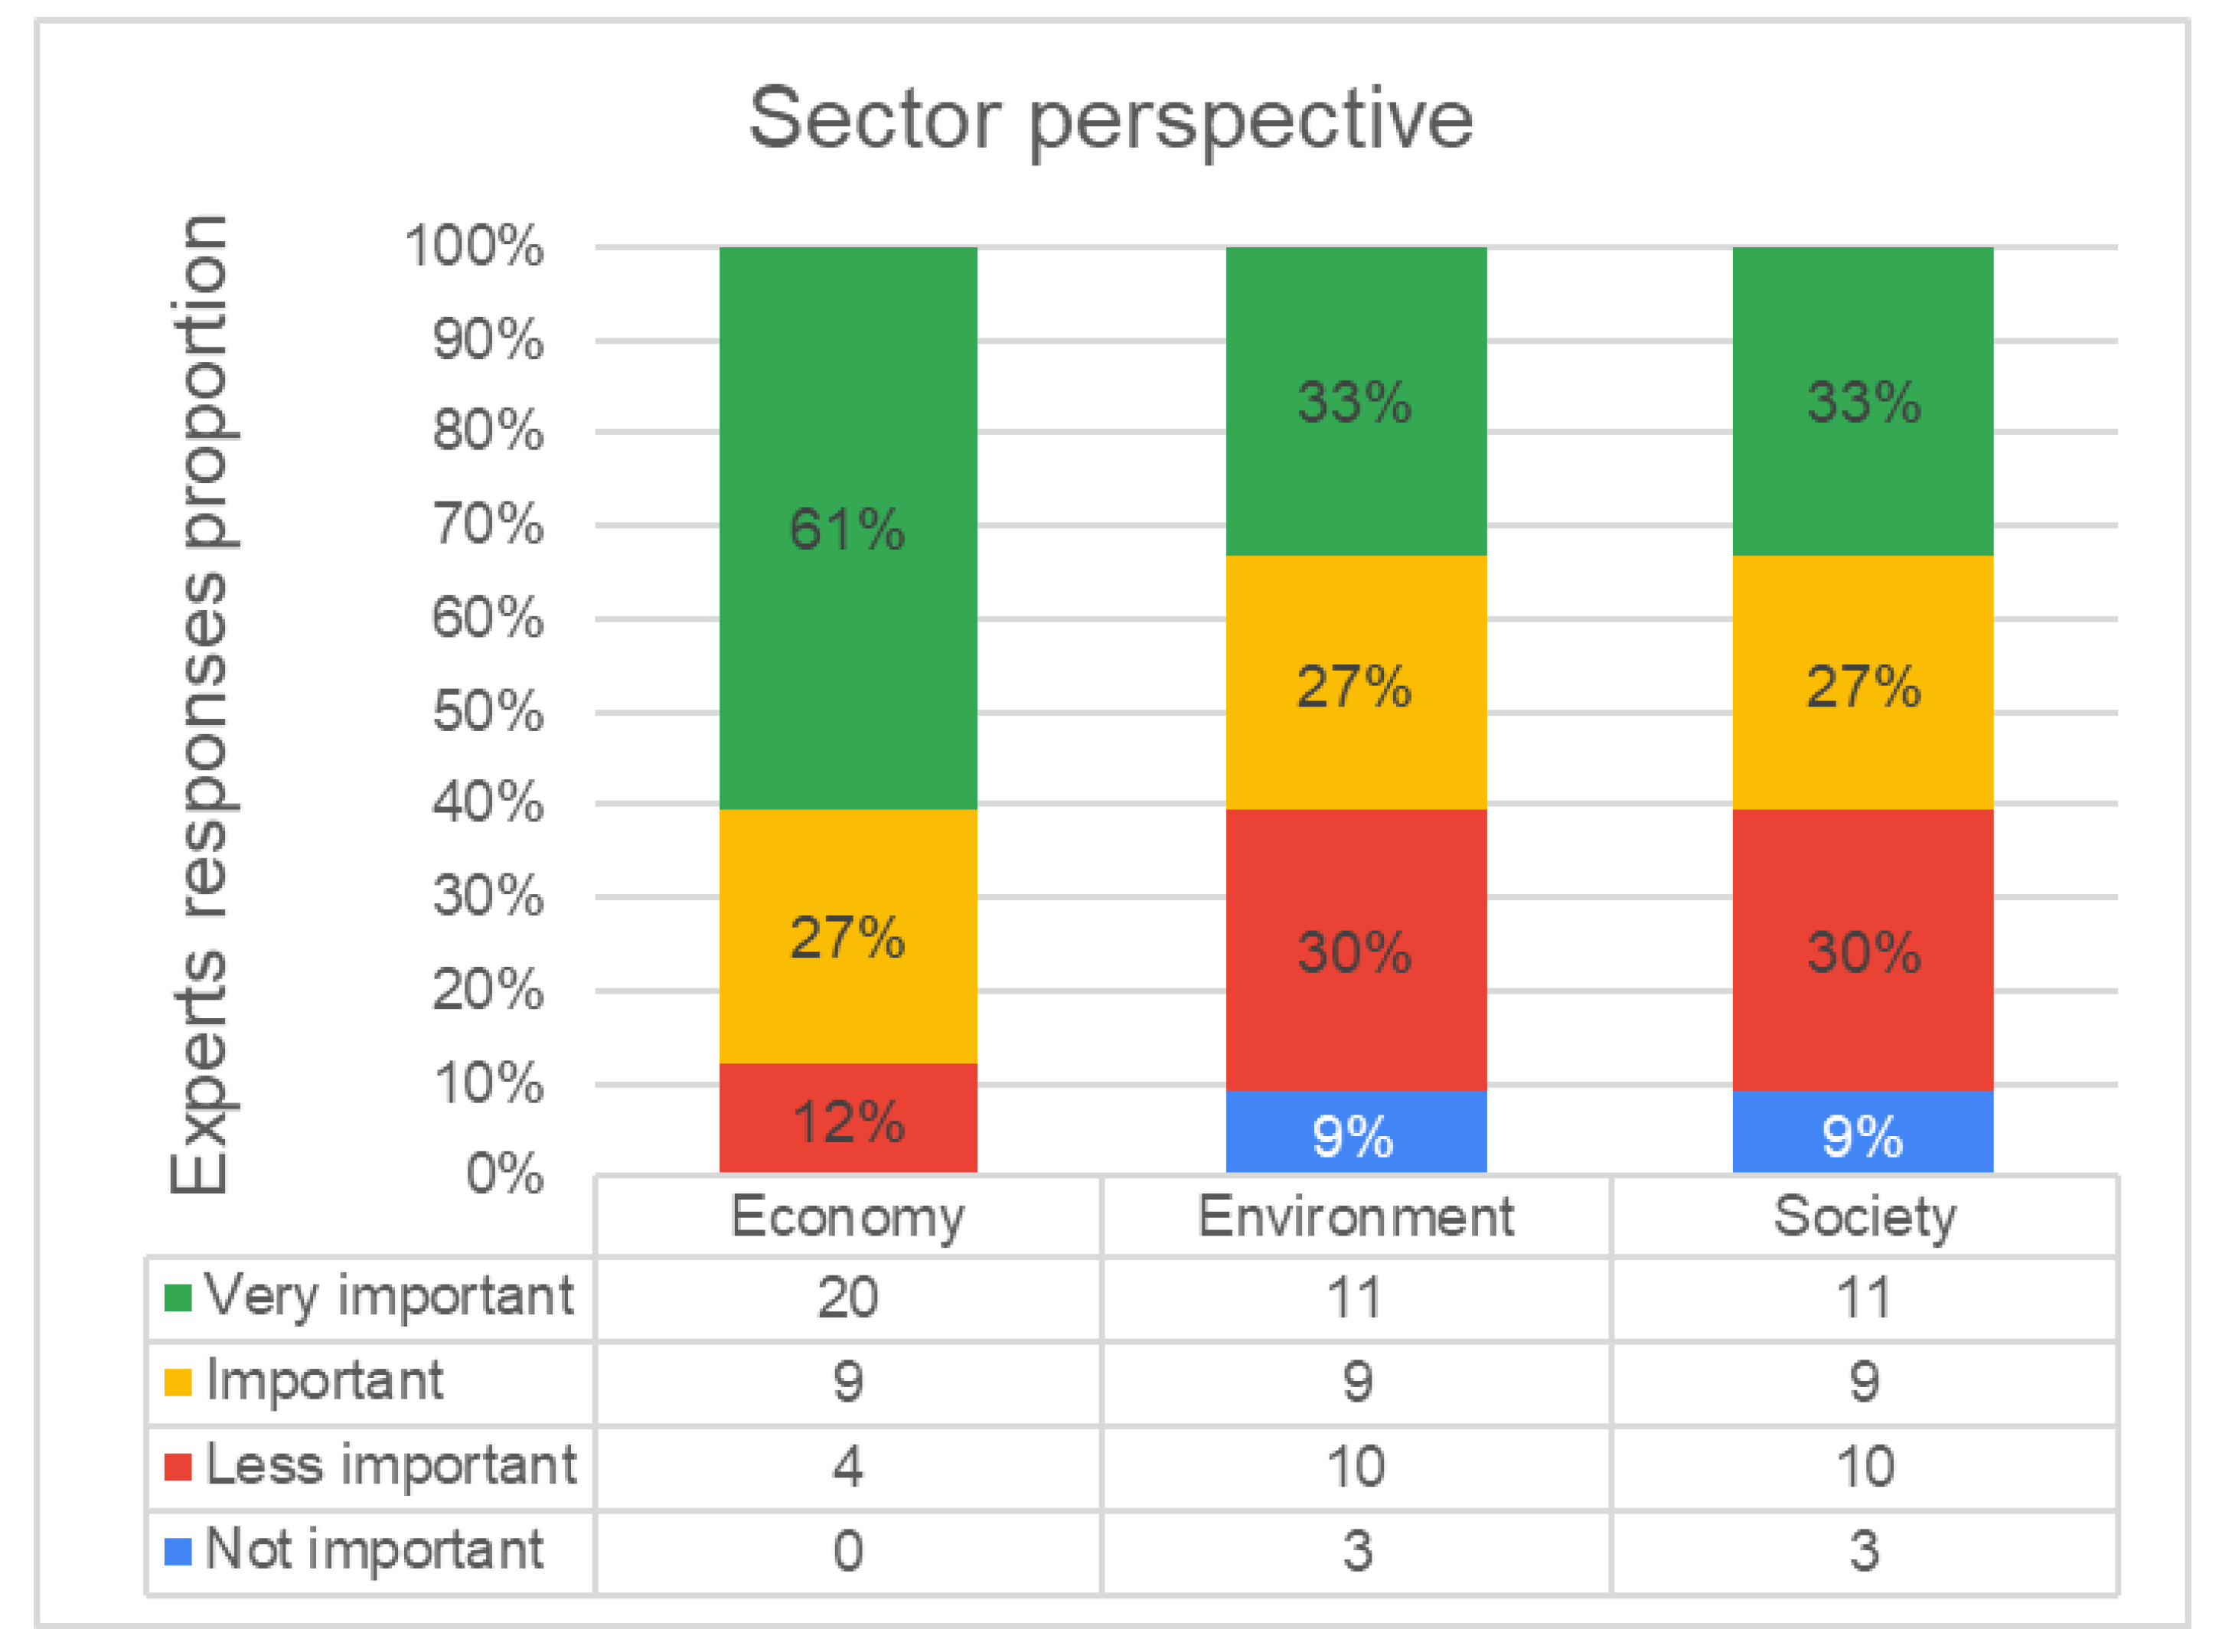
The second question was concentrated on the hierarchy of importance of the three dimensions limited to a construction sector—in general (Figure 5).
According to the experts, a sectoral perspective is characterized by the economic factor, treated as the most important one, while the other two options are represented similarly
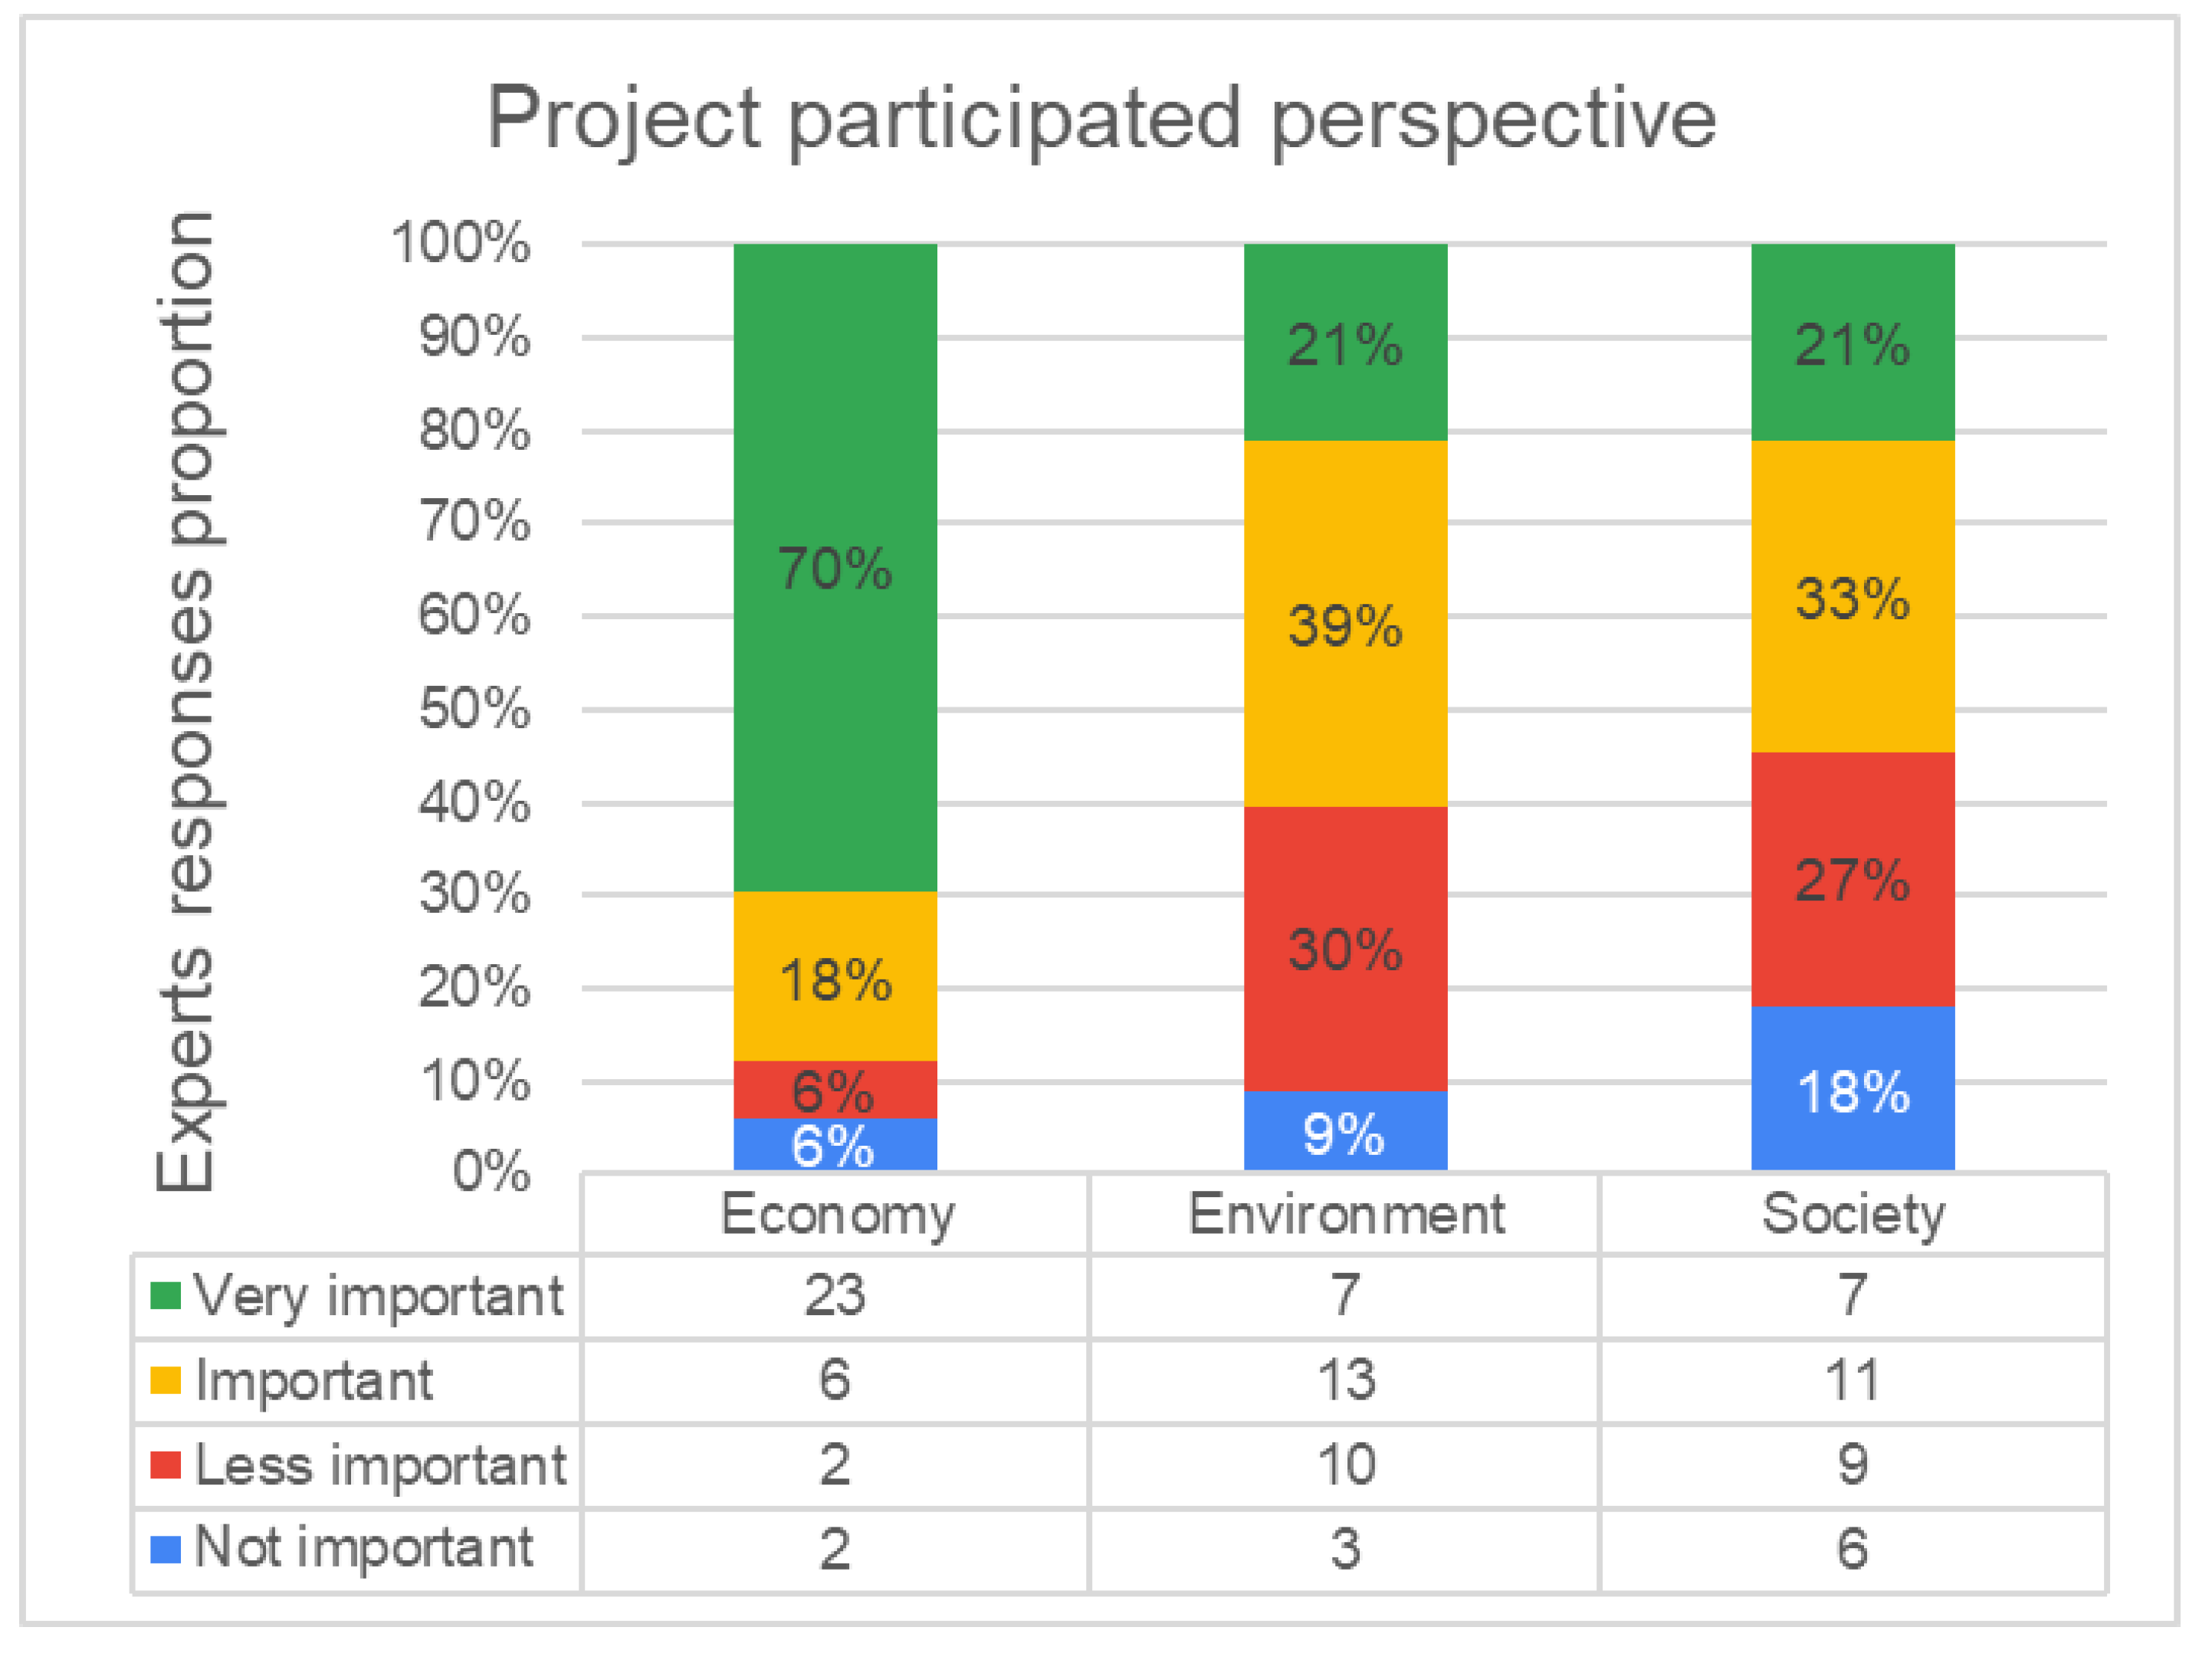
The third question paid attention to the hierarchy of importance too, however, this time experts were supposed to share their own experience from construction projects participated in during the last 5 years (Figure 6).
The answers bring indisputable dominance of the economic factor in the decision-making process of construction projects, however, this time the experts admit that the environmental care was treated as important more frequently than social aspects.
All in all, the above answers underline a consistent tendency to expose economic values as the most important factors in the execution of construction projects. Moreover, social aspects are neglected, or at least underestimated.
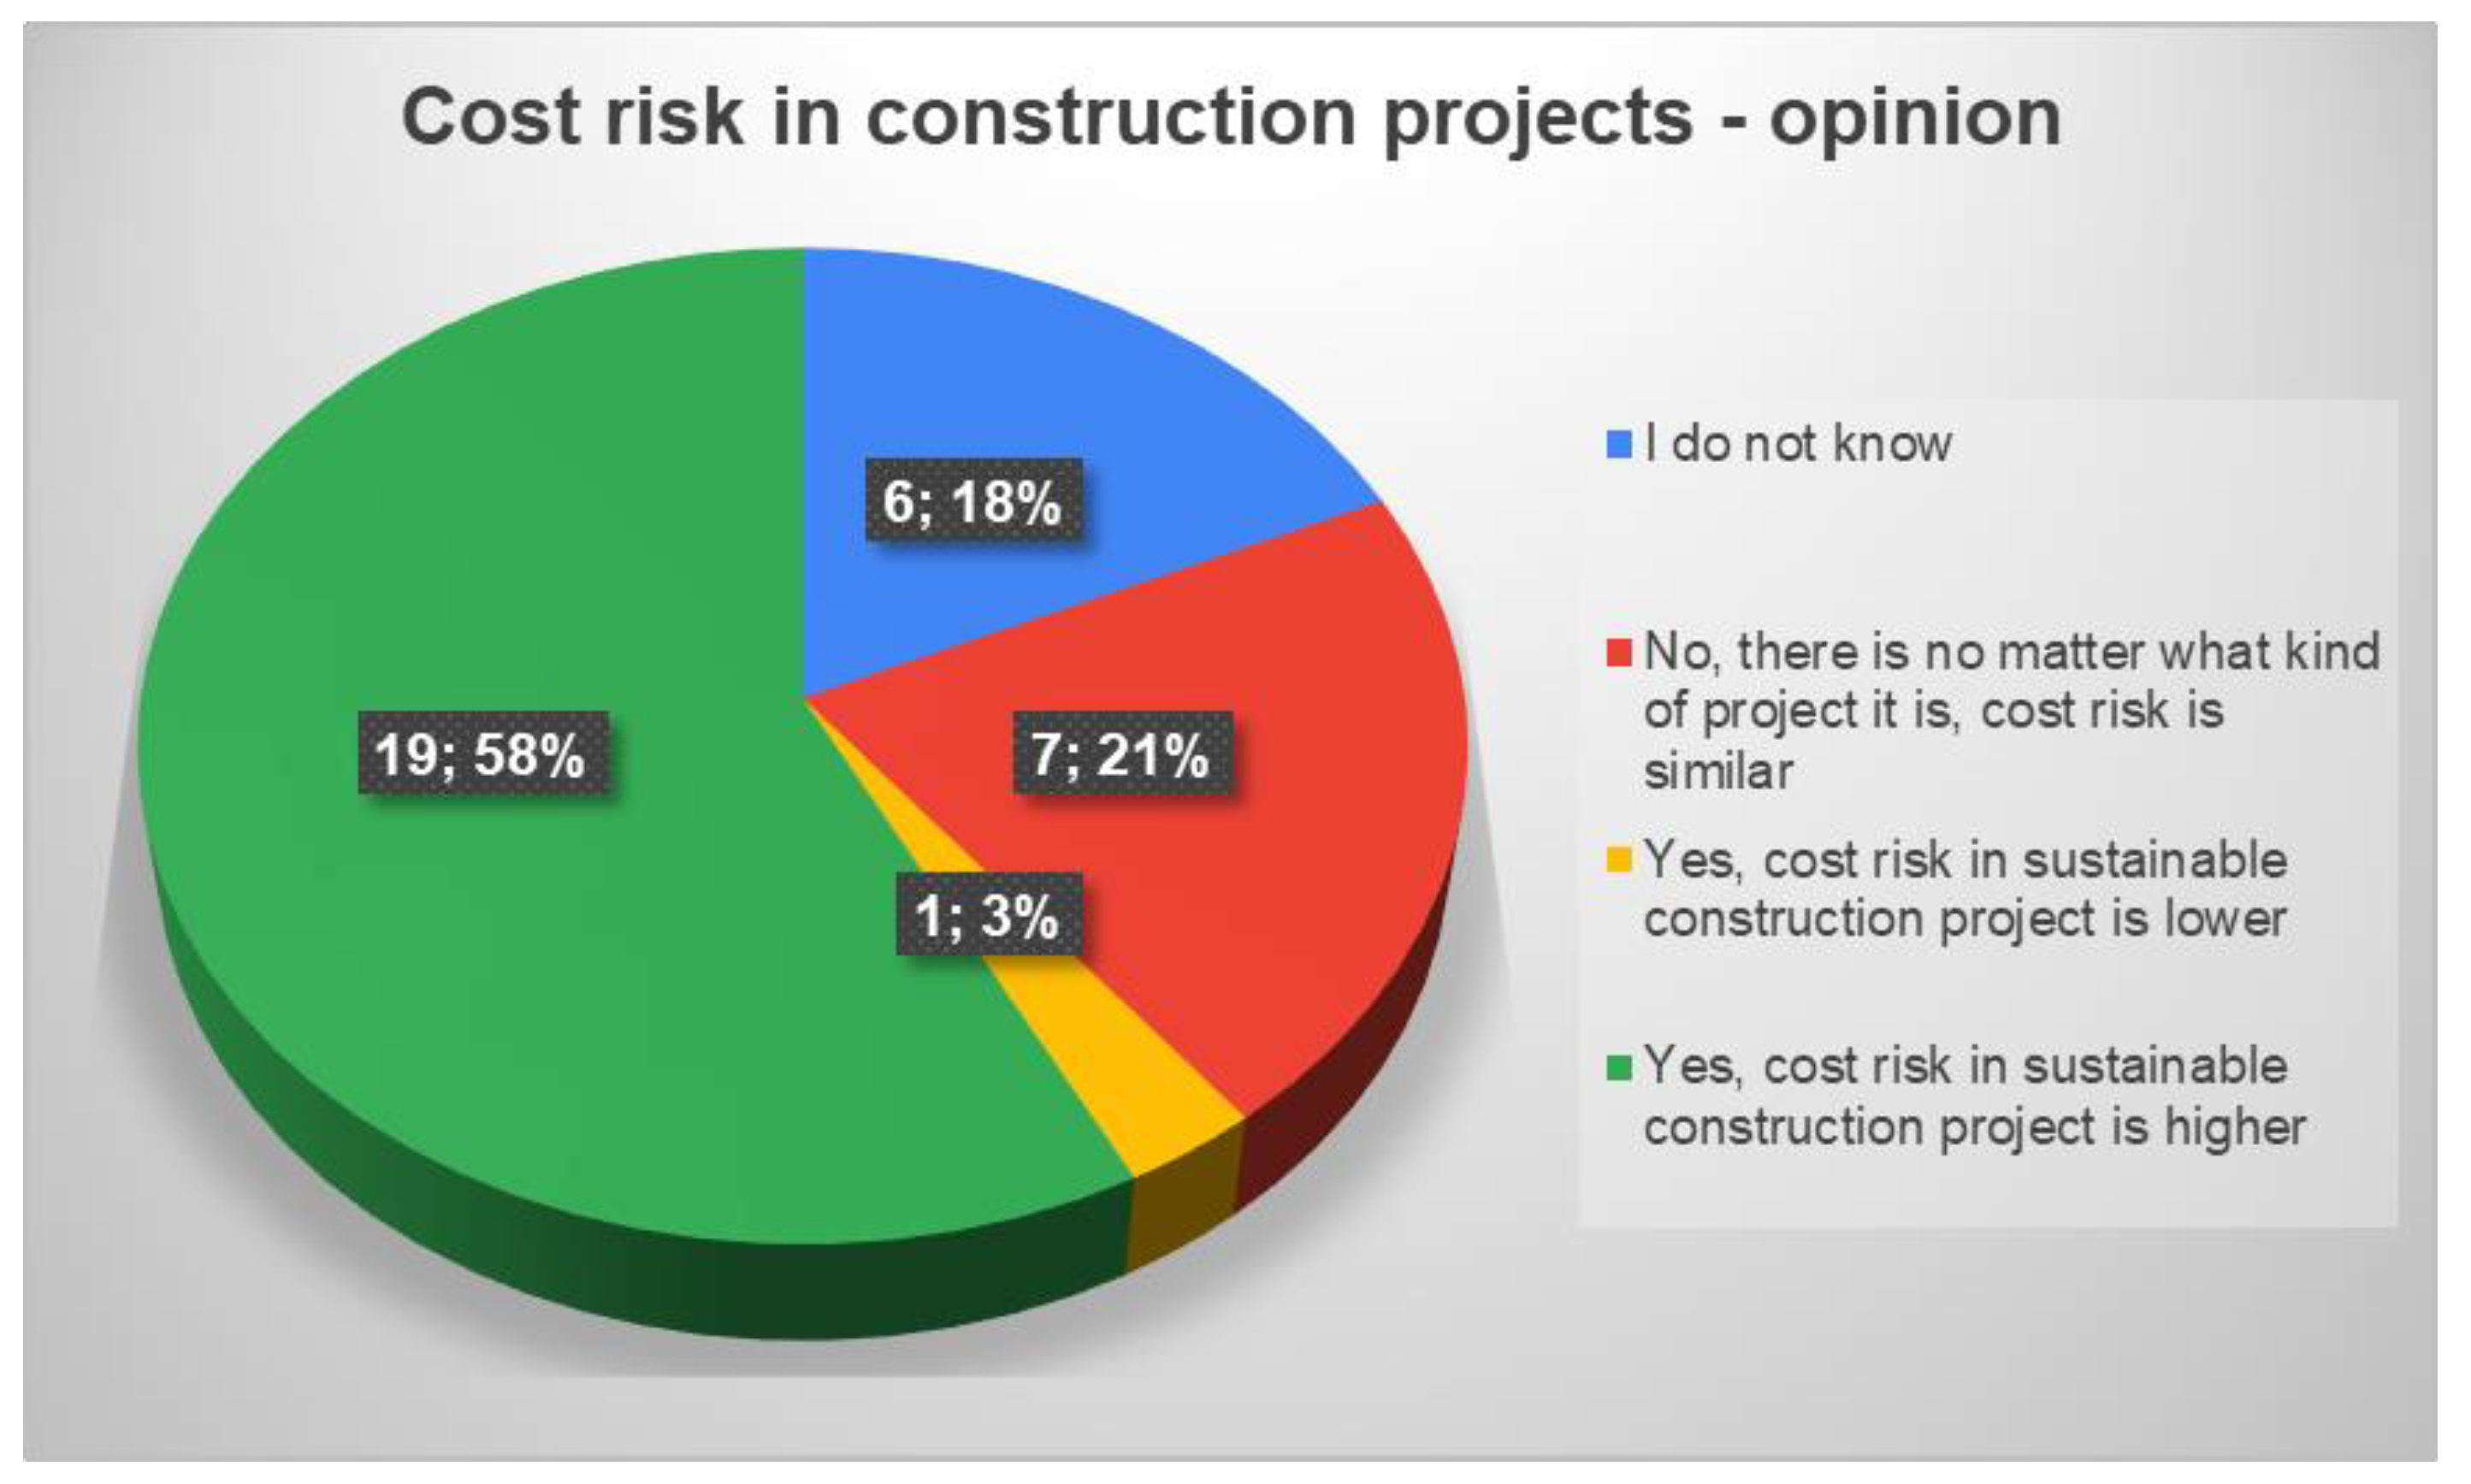
The last question from the first part was about the estimation of the cost risk in construction project implemented in accordance with the principles of sustainable development, compared with others where this factor is not a priority (Figure 7).
It reveals that the majority of experts (19 of 33) involved in the survey treat cost risk in sustainable construction projects as higher than in conventional construction projects.
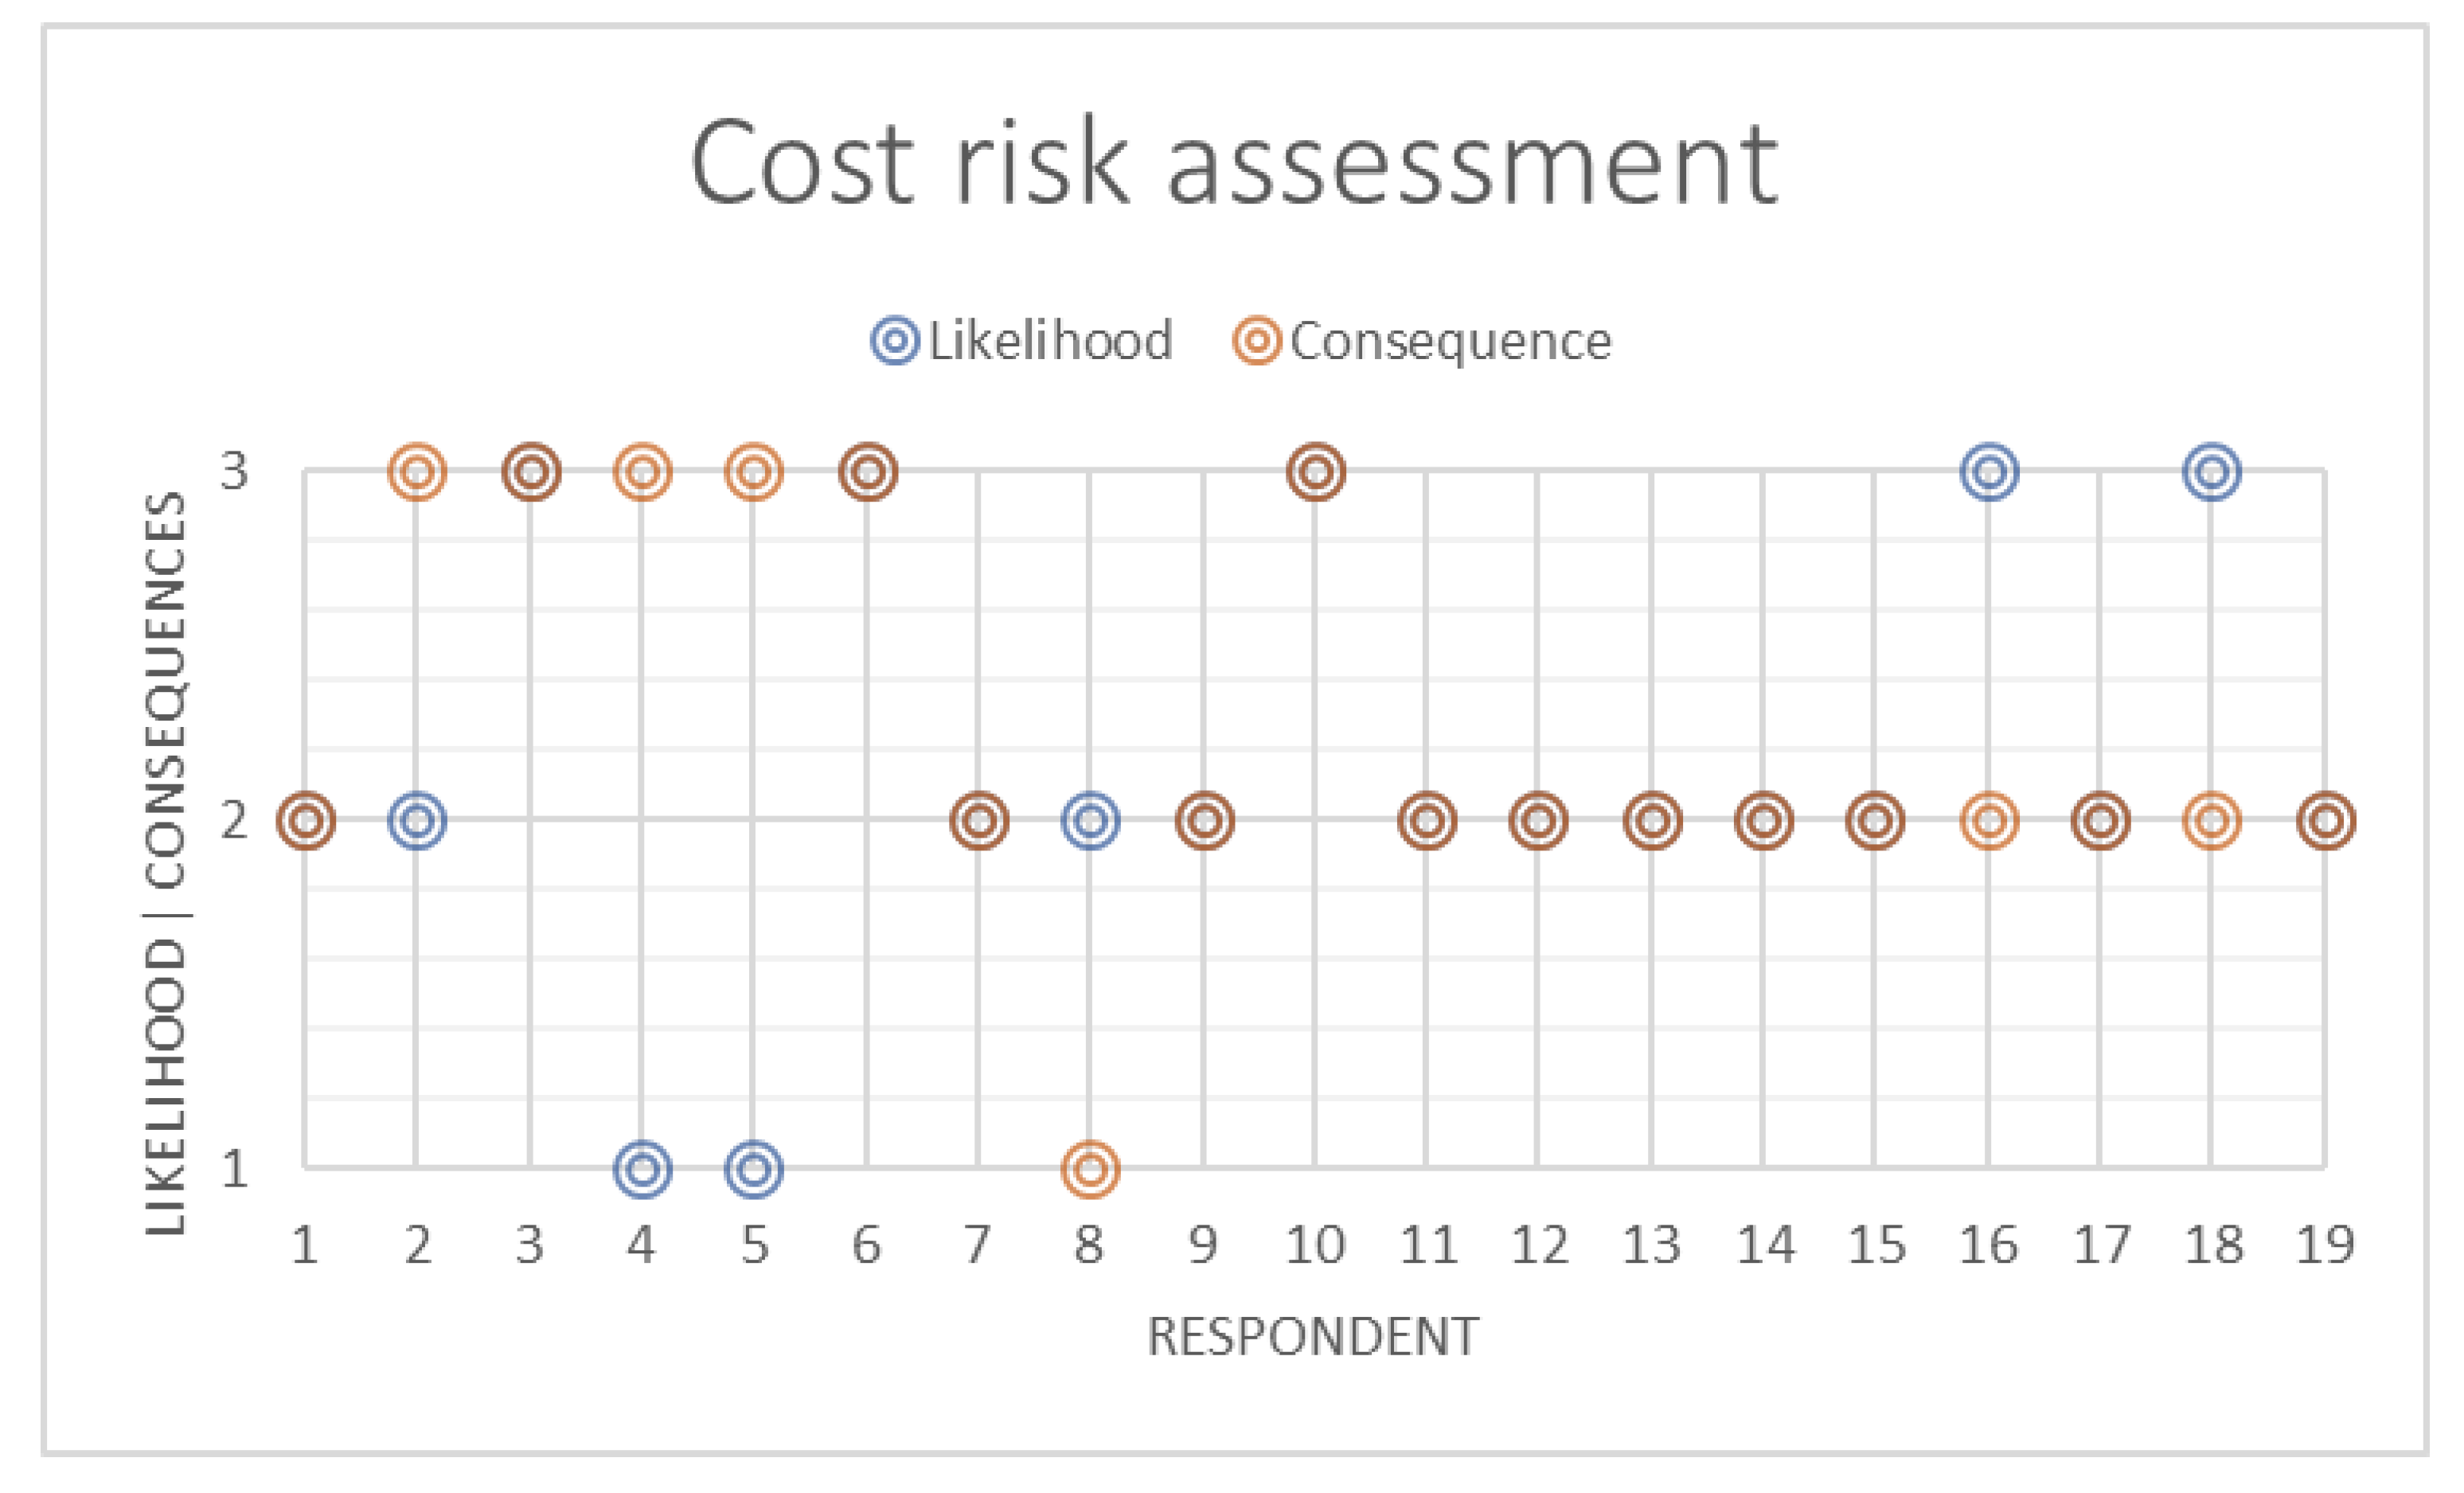
Therefore, they were asked to estimate the risk in terms of likelihood and severity. Among respondents who feel like cost risk in sustainable projects is higher than in the conventional projects, the majority (around 63%) maintain that the likelihood is medium (between 33 and 66%—that means “2” in the scale of Figure 8), and around 26% of them that the likelihood is high (66-100%—“3” in the same scale). Almost 11% of the experts believe that the likelihood is rather low (0-33%—“1” in the scale).
On the other hand, consequences are estimated as moderate (“2”) by 63% of the respondents, and almost 32% treat them as critical (“3”). Only 5% of the experts give “1”—negligible consequences Particular answers are presented in the following diagram.
It reveals that the majority of experts involved in the survey treat the cost risk in sustainable construction projects as higher than in other construction projects. These findings should be a hint for the future considerations of cost risk management strategies in construction projects.
4.3. Desk Research
The study of 136 cost calculations allowed to trace the average structure of costs forecasted by the designer, as well as to capture this structure depending on the type of the project (sustainable vs. conventional).
4.3.1. Research Details
Total 116 cost calculations of house projects from Poland and 20 from Spain were analysed on the basis of three public databases:
- www.e-domy.pl (40),
- www.domywstylu.pl (76),
- www.proyectosdecasas.es (20).
This research was carried out in 2019. It was assumed that the price level was adequate for the period. All databases include ready-to-use calculations however each of them presents slightly different parameters. In the first database, there were costs of the raw construction, costs of installations, costs of the interior. The calculations provided on the website were estimated costs, determined on the basis of average, nationwide (Polish) net prices of building materials and labour, published by Sekocenbud (a publisher of prices). In the second one, there were costs of foundations, costs of walls and roof, costs of windows and door. And finally, in the third source, there were found total costs of construction. The two first databases enabled to distinguish house designs between energy-saving and non-energy-saving. However, the one from Spain included different types of construction technology so all designs could be divided into two groups: sustainable (of wooden technology) and others (of traditional technology).
In all cases, it was possible to calculate two important parameters: construction cost/area (monetary units/square metre) and construction cost/volume (monetary units/cubic metre).
4.3.2. Findings
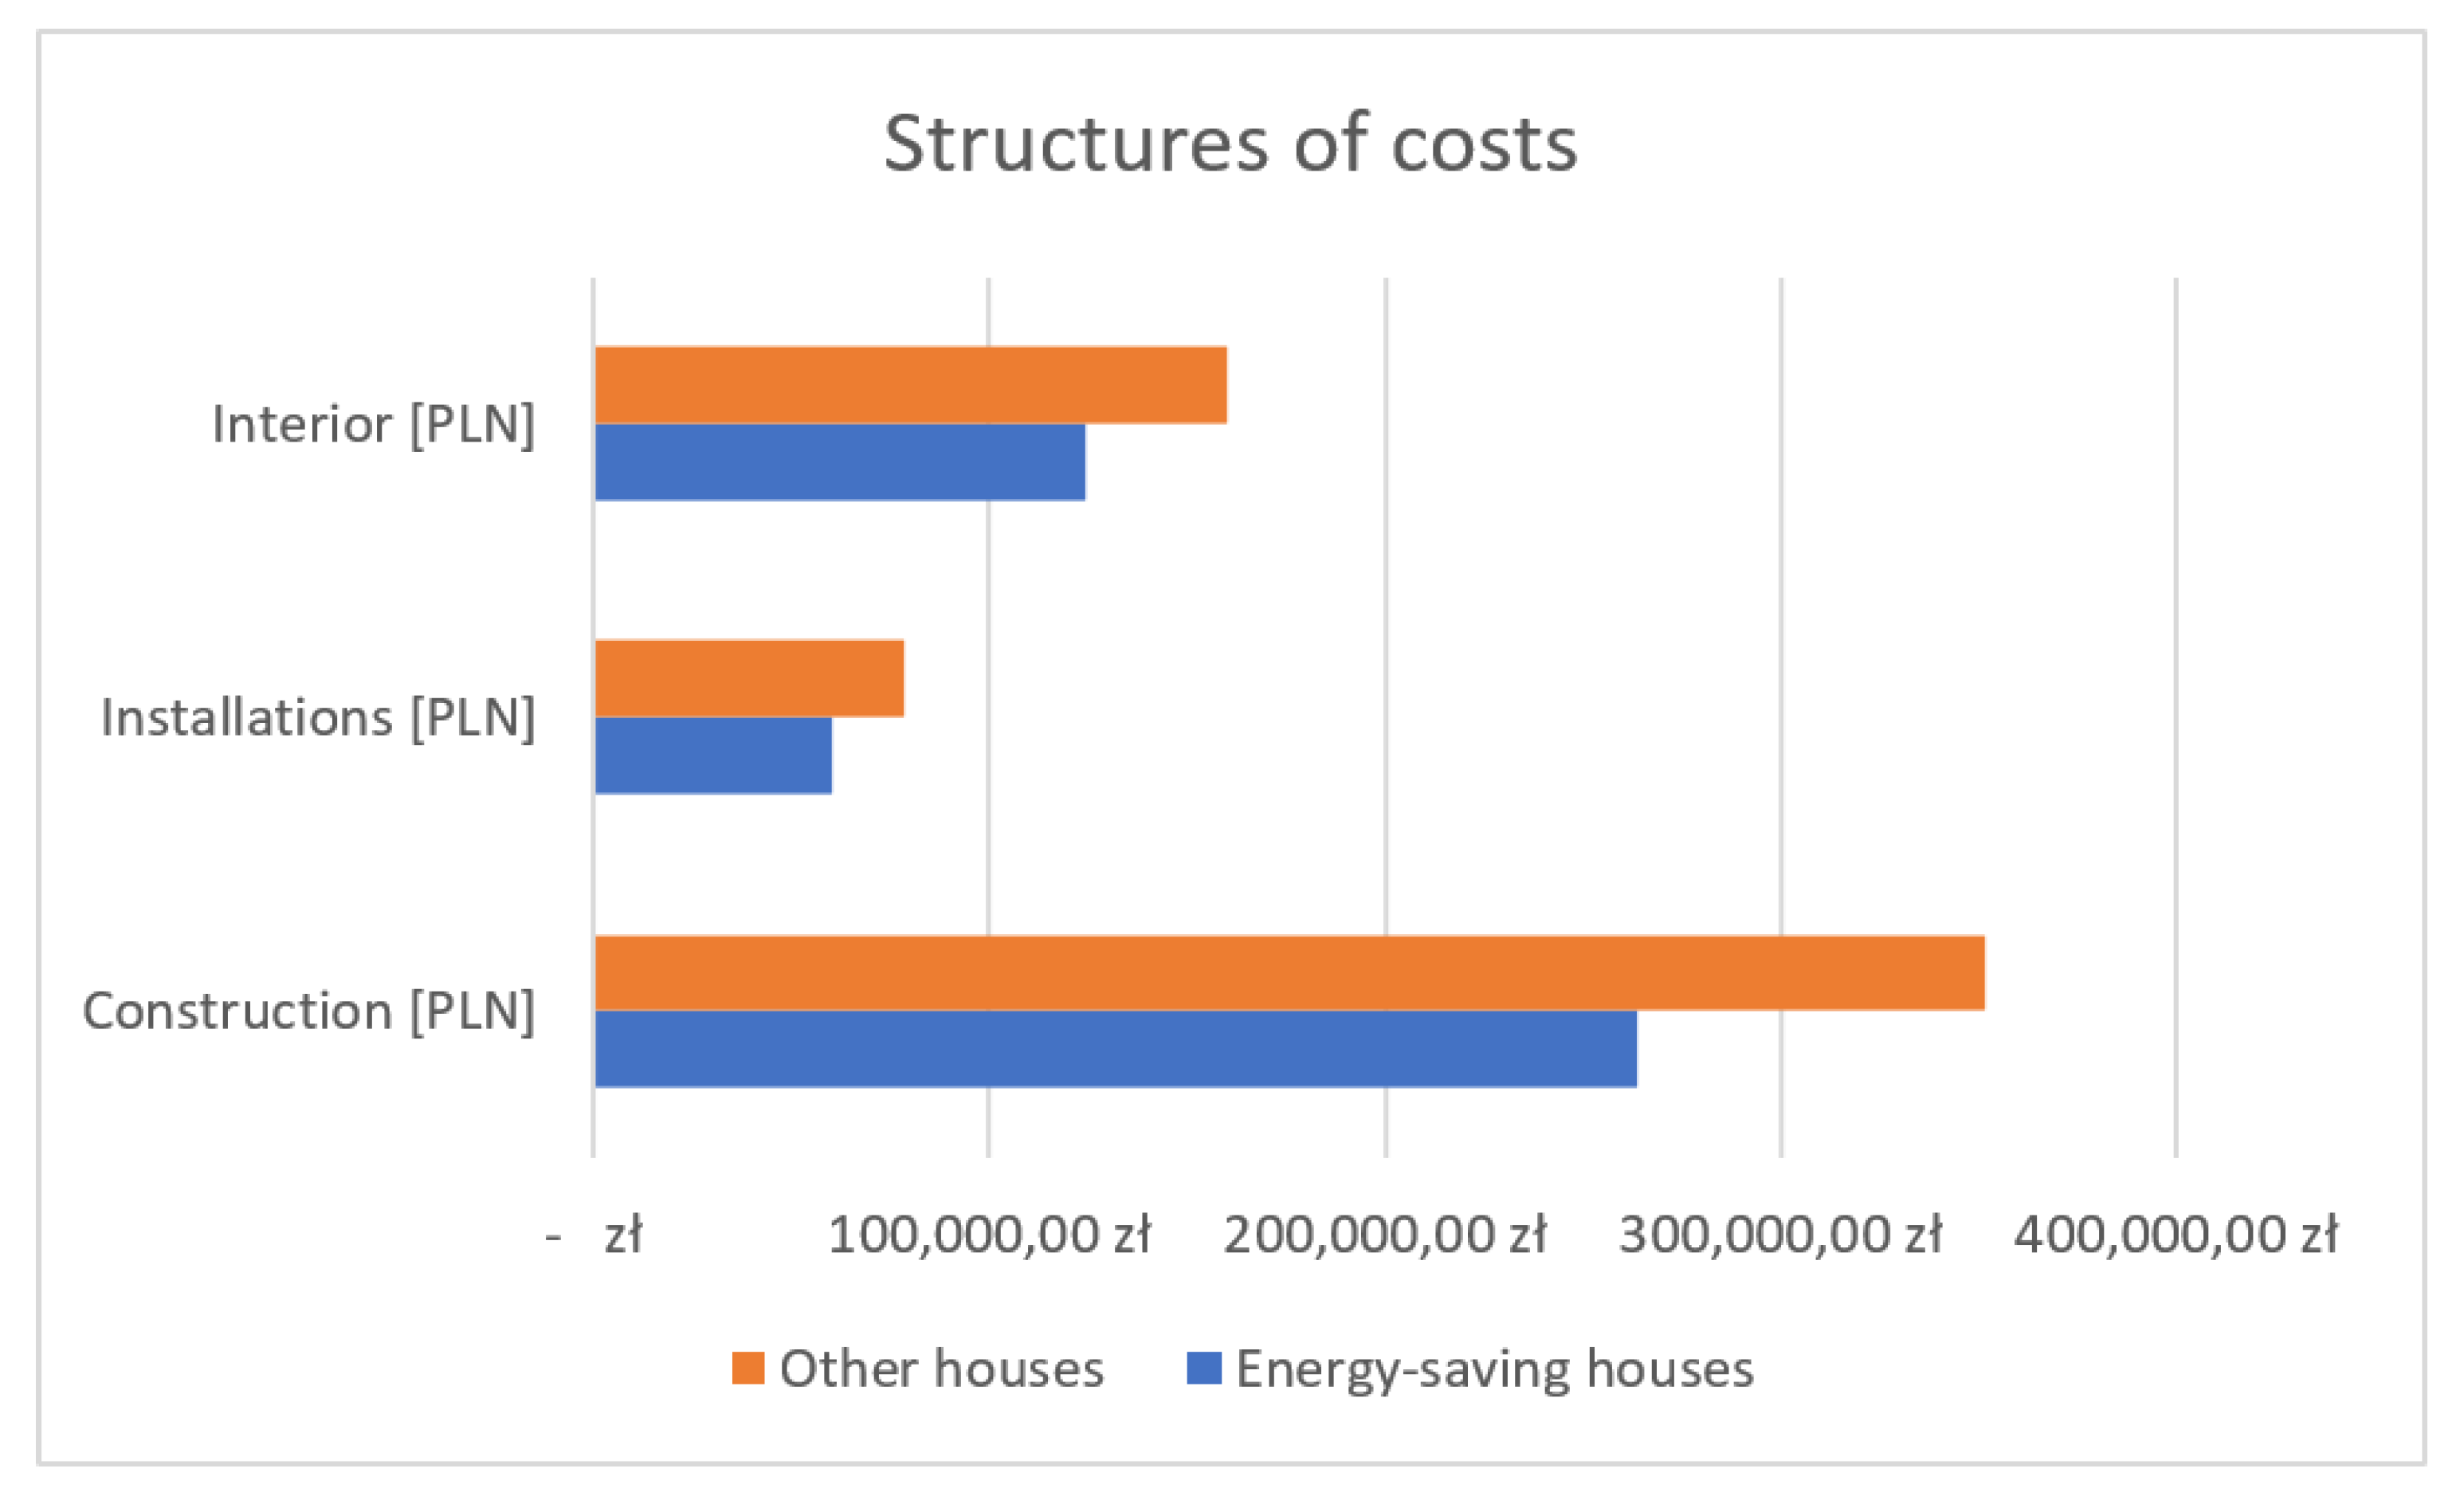
In Figure 9, cost structures of analysed 40 house designs from the first database were presented.
The presented results reveal a similar arrangement of individual items in the total cost of construction. The cost of raw construction plays a dominant role. The ratio of installation costs is quite surprising. However, this is probably due to the fact that the cost of internal installations was estimated on the basis of average indicators, proportionally to the net area of the building (energy-saving houses were usually smaller), not according to detailed estimates.
Against the above findings, other scientific research results seem interesting too. For the forty calculations, the unit cost of energy-efficient buildings and others was respectively: 1773 PLN/m2 and 1650 PLN/m2.
Figure 10 concentrates on other aspects. The costs of walls and roof are the most significant, which is no surprise, however, on the basis of the 76 cost calculations, energy-saving houses seem more expensive in terms of their main parts. Moreover, according to these estimates, the unit cost of energy-efficient buildings was: 1569 PLN/m2 and 1490 PLN/m2 for the rest.
The third database was used to calculate the unit cost of sustainable (mainly wooden) buildings in comparison to traditional technology. The latter is cheaper and costs 1169 EUR/m2, whereas houses, which construction is made of natural products, can be constructed for around 1255 EUR/m2.
The above remarks show that the construction of energy-saving or sustainable houses may be more expensive than traditional construction. The question remains the same: what is the level to which the construction cost may be higher than the conventional mode for investors willing to allocate money in the expectation of some benefits in the future?
4.4. Cost Risk Simulation Model
Probabilistic prediction of construction costs is to support investment decisions by stakeholders related to financing construction projects as well as contractors for construction works.
The method presented in the paper makes possible to calculate costs of individual projects on the basis of their expected course. However, considerations about the track should be based on previous experience.
4.4.1. Inputs
The developed method, described in this study, consists of three phases.
In the first phase, statistical descriptions of various construction projects are prepared in the perspective of construction costs, useful during simulation of construction costs. Statistical data regarding the value of cost of materials, labour and equipment costs, as well as percentages of indirect cost rate and profit rate, allow determining the types of distribution of these quantities as random variables.
The probability distributions of input variables and their statistical properties can be determined on the basis of previous experiences regarding the evolution of these variables, or they can be adapted according to subjective judgment based on knowledge and experience. In this research, the expert-based method was adopted.
The second phase involves preparing a deterministic cost estimate for the analysed construction project.
4.4.2. Simulation Framework
In the third phase, a simulation model is launched, enabling construction cost simulations. A reporting tool generates construction costs with the probability of achieving them.
The Monte Carlo simulations method is used. It includes the following steps:
- Stage l: construction of the model,
- Stage 2: definition of input stochastic variables, and probability distributions,
- Stage 3: generating random numbers for each input variable, according to its probability distribution,
- Stage 4: iterative calculation of the model,
- Stage 5: statistical analysis of simulation results.
The calculation of the probabilistic cost of the construction project was based on the formula 1 described previously.
An equation of the cost estimate value can be transformed into:
where:
- —probabilistic labour costs [monetary units],
- —probabilistic costs of materials with purchase costs [monetary units],
- —probabilistic equipment costs [monetary units],
- —probabilistic indirect costs rate [%],
- —probabilistic profit rate [%].
The probability distributions adopted for each random variable enable the generation of corresponding simulated random numbers.
The iterative values of input variables generated in subsequent steps are put into the formula for calculating the estimated value (according to formula 2). The simulated cost value () varies on a different level during each subsequent iteration, because a new calculation is carried out each time.
Cost estimates obtained in the course of calculations during a defined number of iterations create a random variable f.
The simulation results have dual nature and allow calculating the level of:
- risk of estimating the deterministic construction costs treated as the probability of the simulated cost estimates (achieved in subsequent iterative steps) being higher than the deterministic value,
- reliability of estimating the deterministic construction costs, treated as the probability of the simulated cost estimates being lower than the deterministic value.
4.4.3. Outputs
For the purpose of this study, the COMAR software was used. It enables simulating the cost risk on the basis of the probability distributions of the input variables. To present the usefulness of this method, the following values of individual factors of construction costs were adopted from design named E-178 (source: www.e-domy.pl) and decomposed as follows [66]:
- labour: 44 422 PLN,
- materials: 193 553 PLN,
- equipment: 19 038 PLN,
- indirect costs ratio: 70%
- profit ratio: 14,7%.
The above values were introduced to the COMAR software.
Triangular distributions with minimum, maximum and mean values were adopted for individual parameters established by the experts:
- labour: triangular distribution (40 000 PLN, 44 422 PLN, 55 000 PLN),
- materials: triangular distribution (174 000 PLN, 193 553 PLN, 233 000 PLN),
- equipment: triangular distribution (17 000 PLN, 19 038 PLN, 23 000 PLN),
- indirect cost ratio: triangular distribution (69%, 70%, 71%),
- profit ratio: triangular distribution (14.5%; 14.7%; 15.0%).
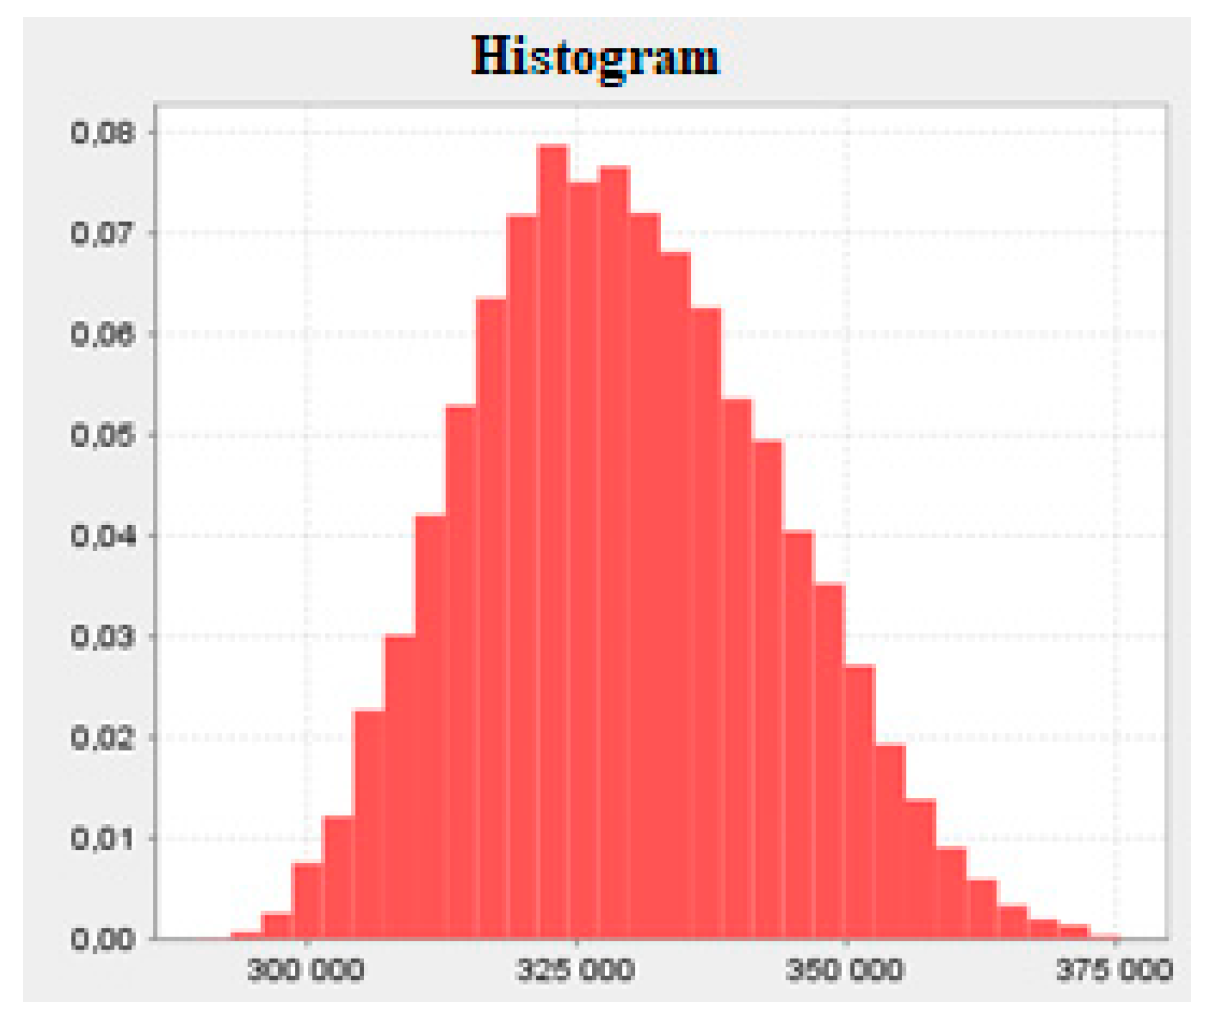
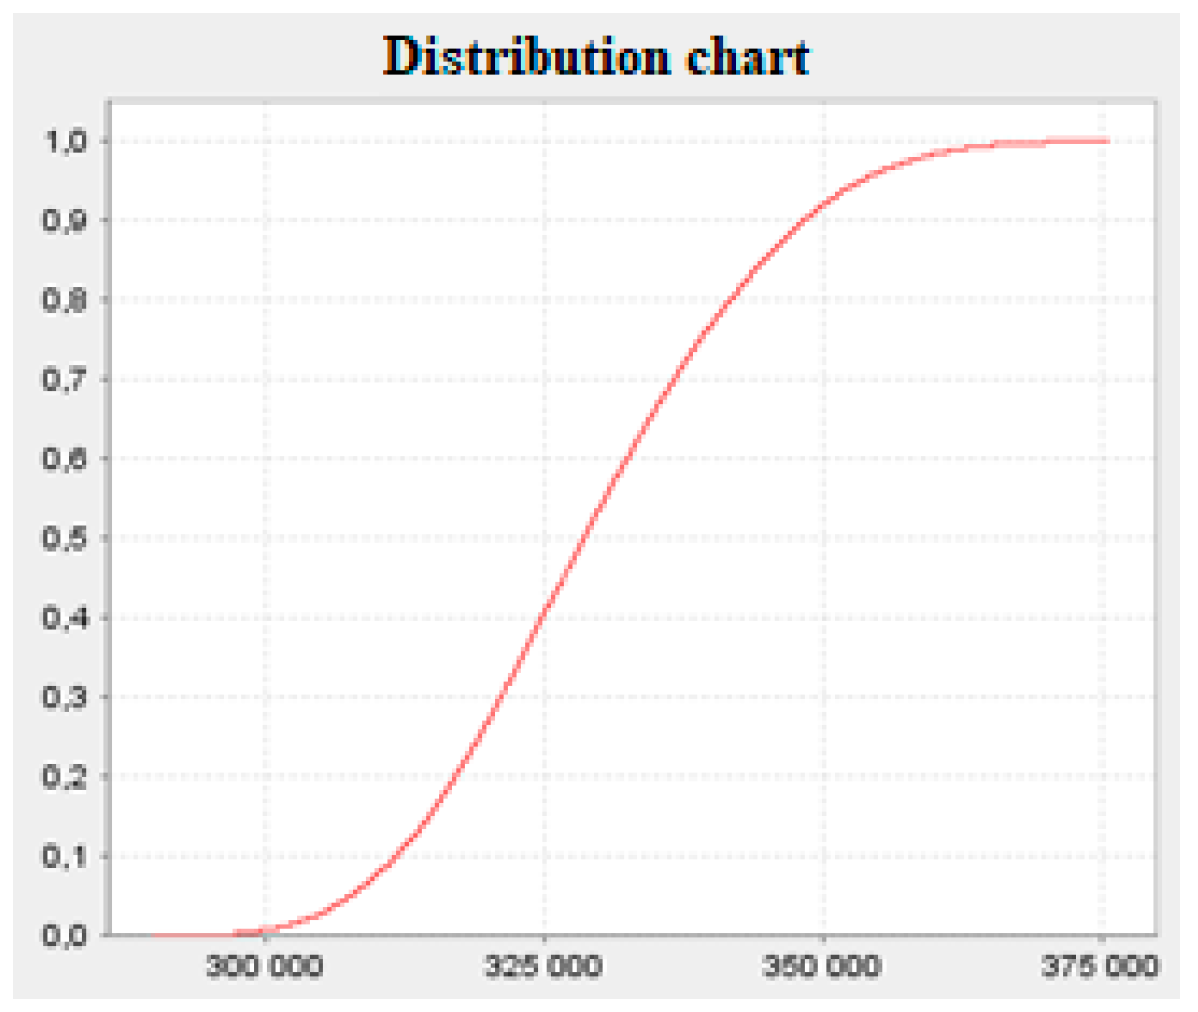
The program performed 30,000 iterations (justification is given in Appendix A), and as a result of them, a histogram of the costs of the project and the distribution chart was constructed. They are shown below (Figure 11 and Figure 12).
The results of the simulation confirm the belief about a high-risk level (79.3%) of estimating the costs of construction projects—thus only 20.7% of reliability of this estimation.
In addition to outputting probabilistic values, the program is also a calculator of construction costs in a deterministic approach. For the assumptions made above, the costs of constructing a building that meets the sustainable development assumptions are 317 293,65 PLN (according to Equation (1)).
4.4.4. Statistical Analysis of Simulation Results
On the basis of 90 performed simulations, some basic statistics were computed in order to examine risk values for normality. There is no need to test all simulated total costs for normality because they are always related to input distributions and depend on them. As a first step, one can treat calculating mean, variance, standard deviation and other descriptive statistics. The results are presented in Table 2.
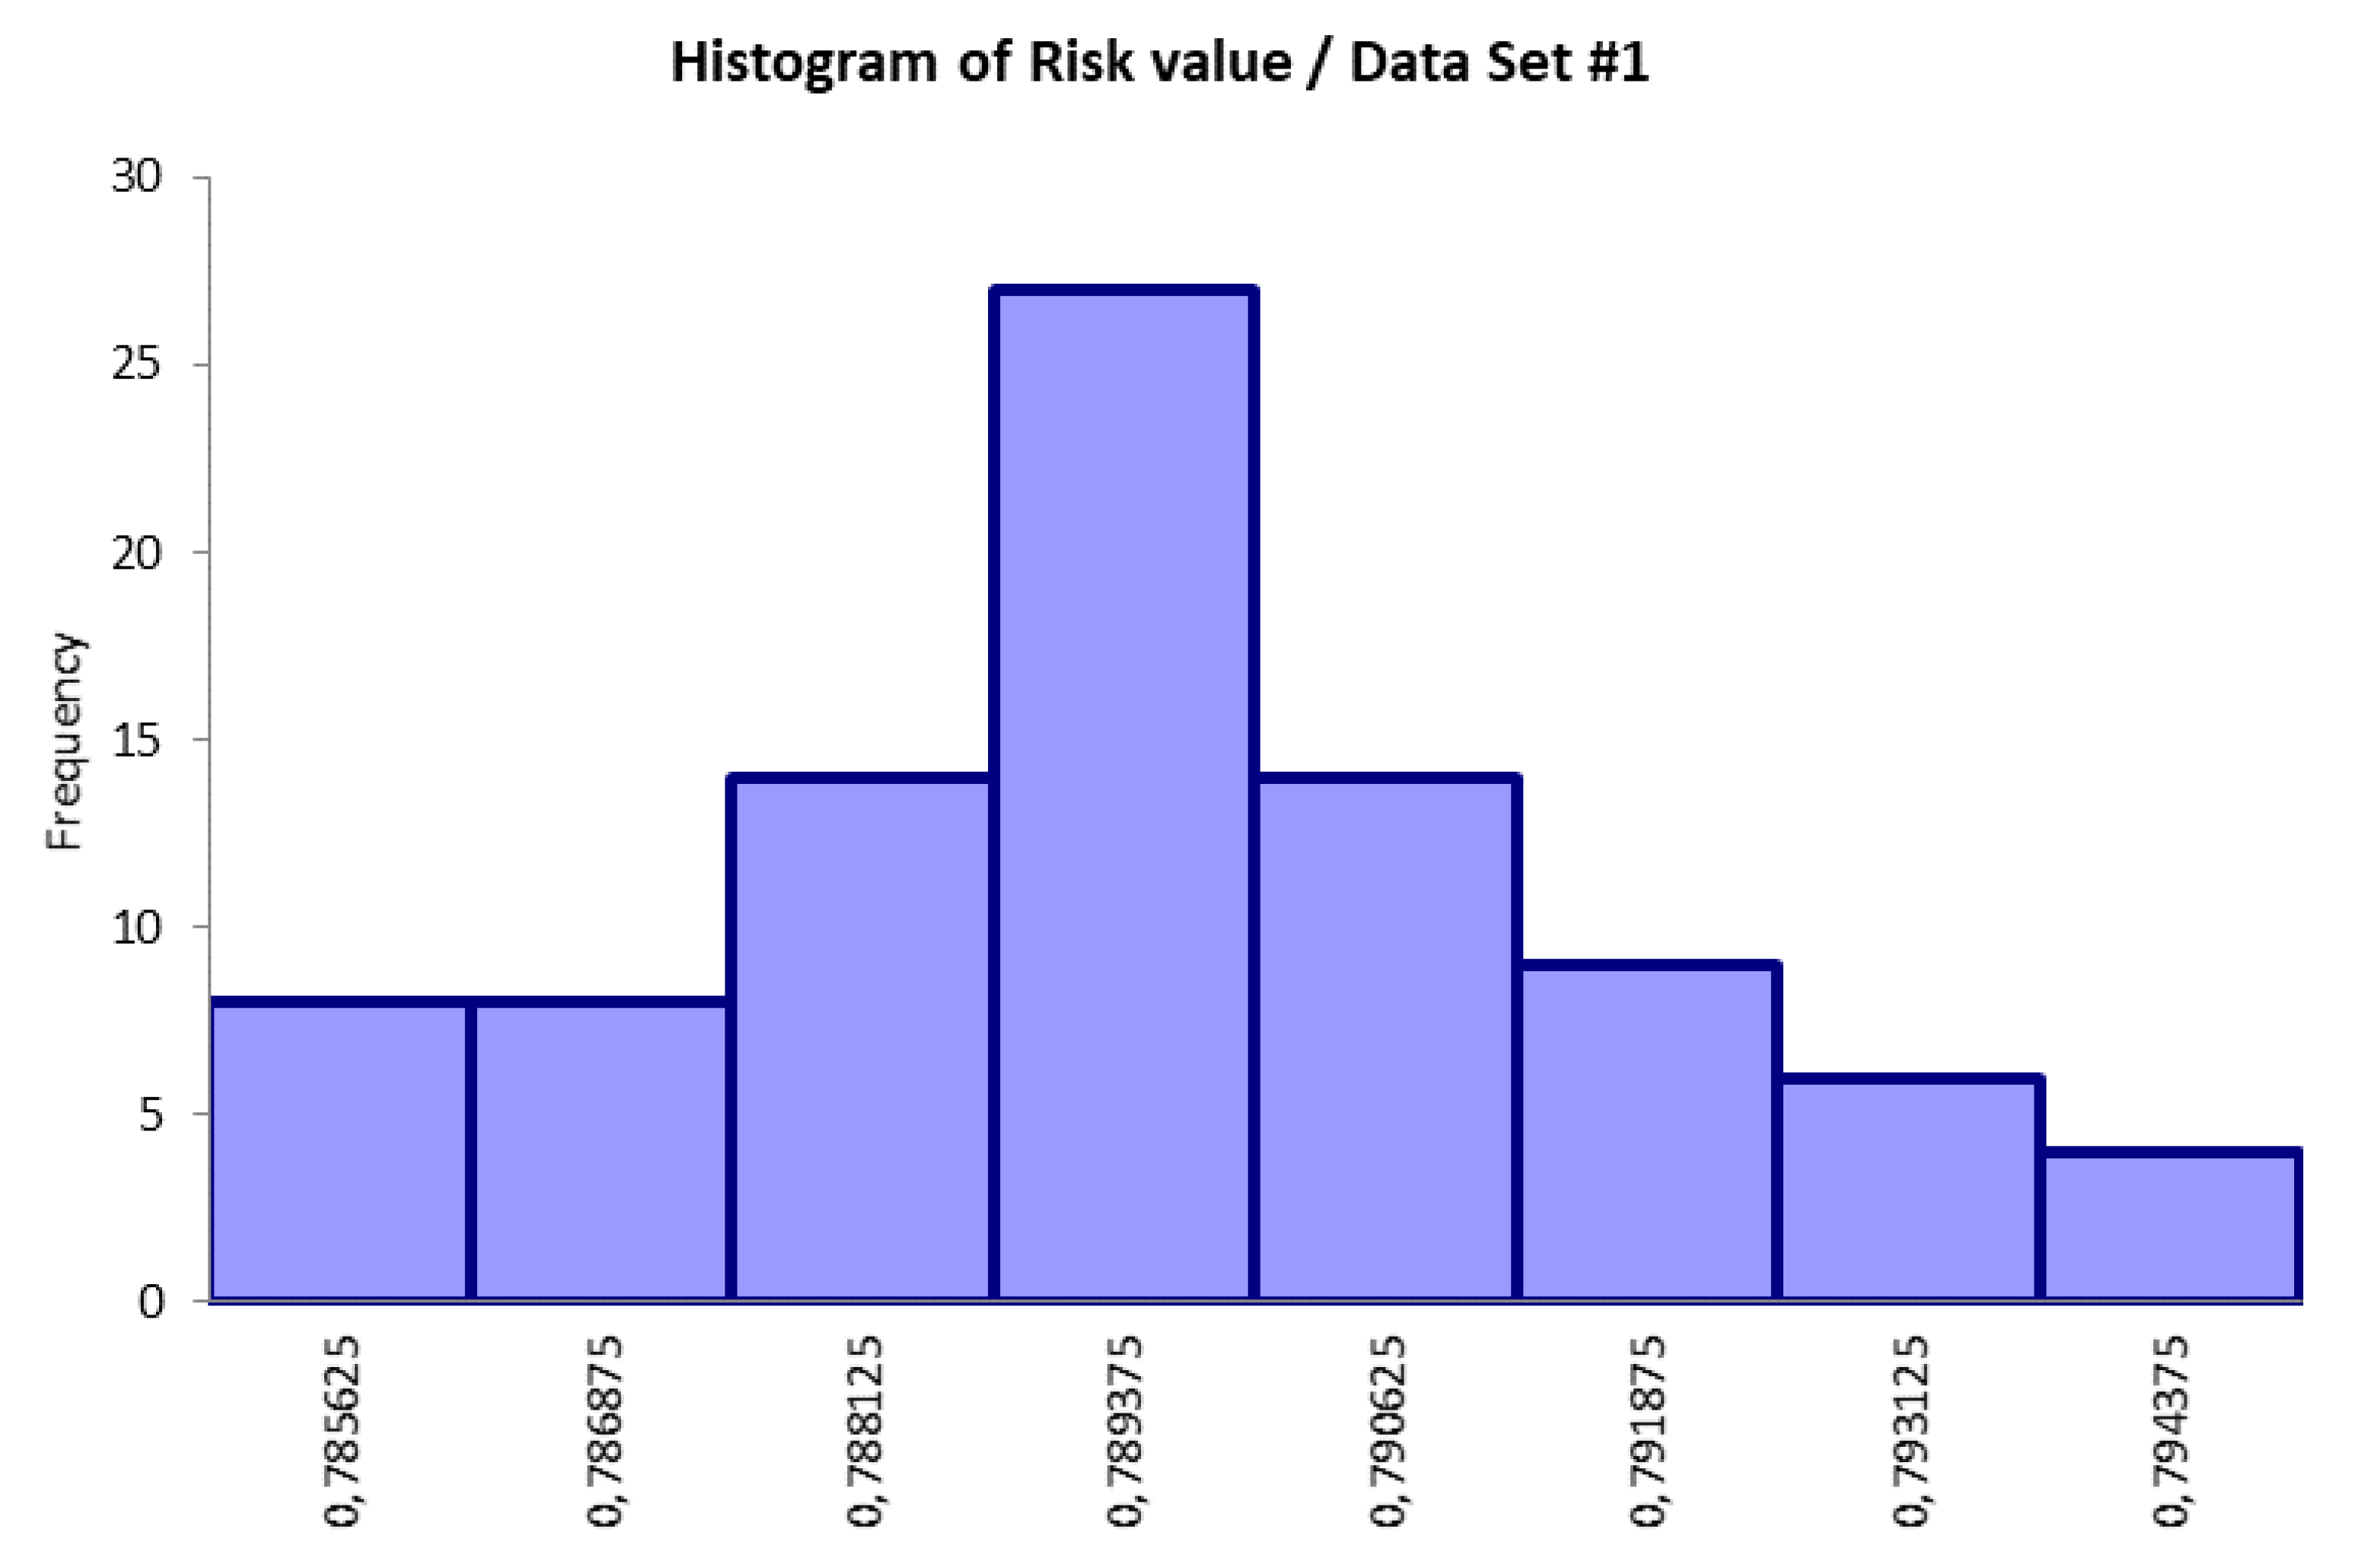
Initial observations do not judge the type of the distribution and do not impact on the normality test in any way. So then, a histogram was plotted. Table 3 shows a distribution of observations in particular bins—and Figure 13—its graphical representation.
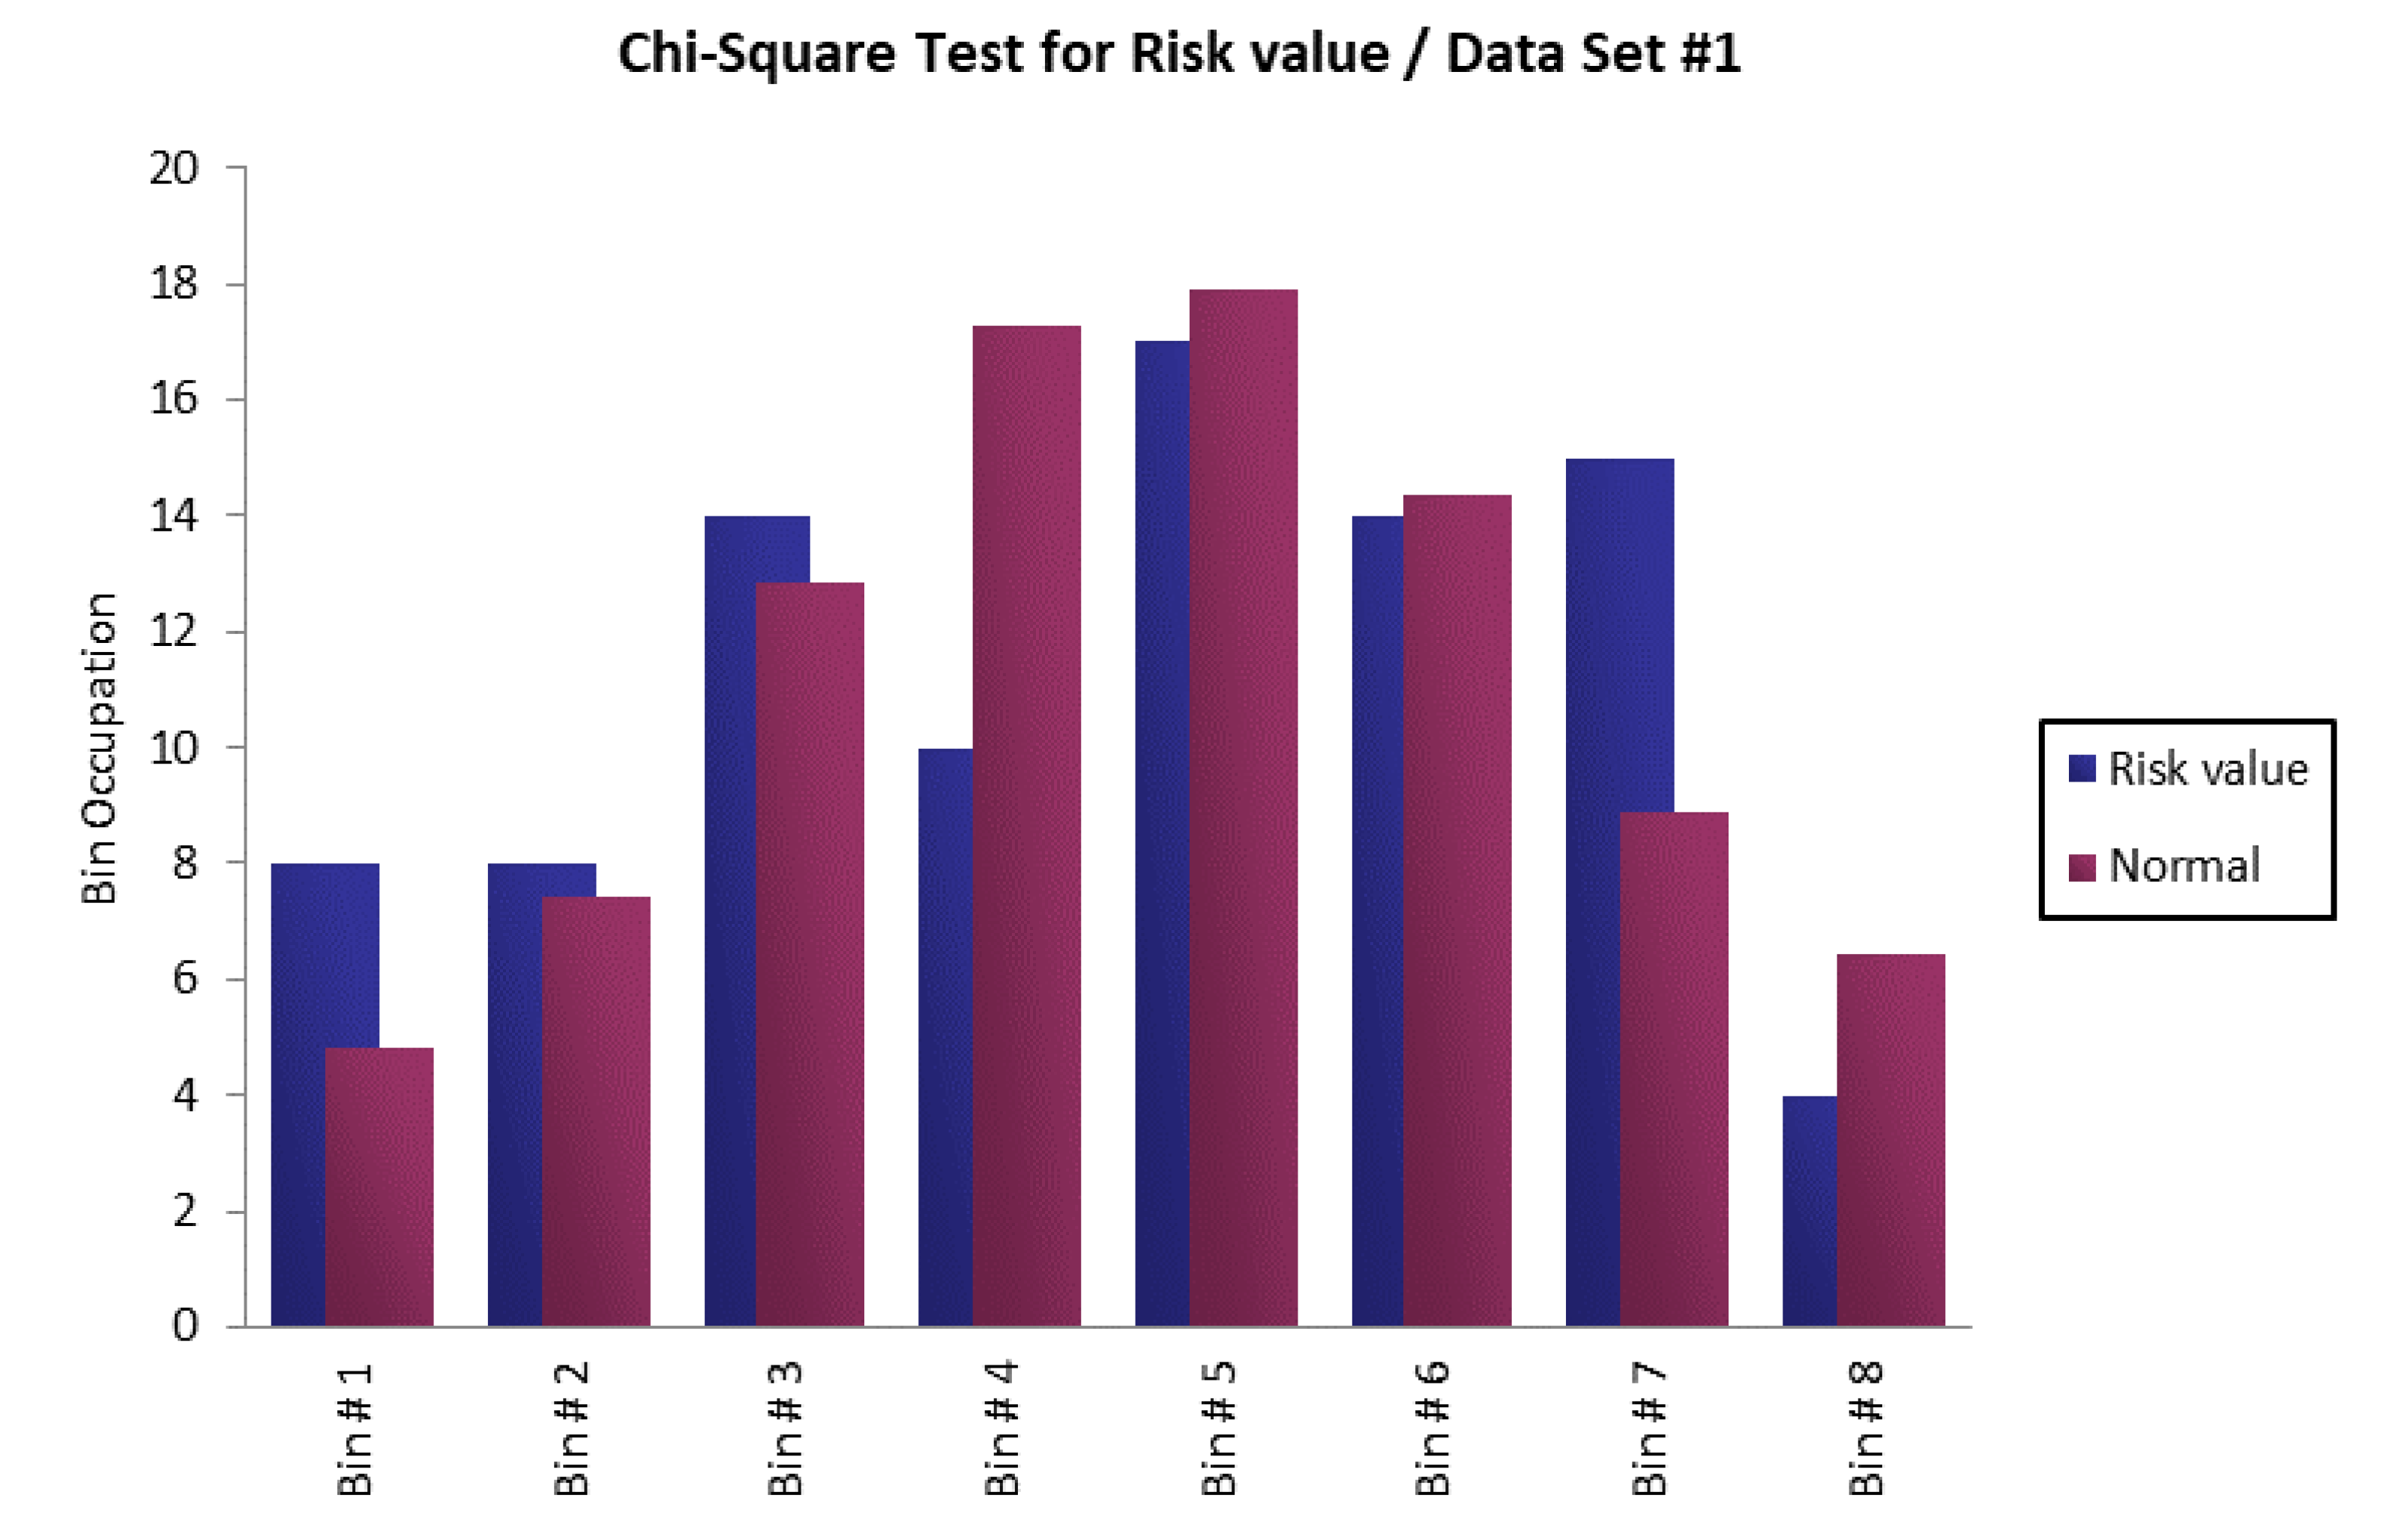
The shape of the distribution, plotted as the histogram presented above, suggests fitting the practical distribution to the normal theoretical distribution. However, further analysis is needed to decide on this issue. Therefore, one well spread method was used to do so: Chi-Square test for normality. It is frequently used to decide if a set of data generated fits a normal distribution. In this case, the null hypothesis is that the data were indeed computed in accordance with a normal distribution, whereas the alternative is that they were generated from other distributions. The results of the Chi-Square test of data from Appendix B are presented below as a histogram (Figure 14) and a matrix (Table 4).
It can be noted that the null hypothesis is that the data are normally distributed, so a high p-value (around 1.0) directly means a perfect fit. In this case, p-Value is low (0.063). It means that it is very unlikely that all the results obtained in 90 simulations fit the theoretical model—a normal distribution. However, the factor can indicate the non-normality whereas a large data set can sometimes bring some significant disorders. In this case, it was decided that the distribution of practical data cannot be treated as similar to normal distribution although it manifests some of its certain characteristics: a median value stands close to the mean and the dominant.
4.4.5. Discovering Other Outcomes
A certitude of estimation is crucial for both the investor and the contractor of sustainable construction projects, that is two of the most significant stakeholders. They should be interested in measuring the level of cost risk in order to predict the potential increase in costs of construction.
Table 5 presents the results of 20 new simulations that were created on the basis of changing parametrically the maximum and minimum values (in different variants) of the triangular probability distribution for costs of materials. This component of the total cost is the most crucial because it represents the largest share in the cost structure (61%). It can be noted that the lowest risk of estimation is observed when minimum and maximum values of the cost of materials decrease at the same time.
In turn, the next part (Table 6) presents the results of two further simulations showing how will impact all three factors (L, M, E)—in terms of their minimum and maximum probabilistic values for triangular distributions—on the value of risk and reliability of cost estimation.
It is worth pointing out that the modification of all probability distributions of the main cost factors (labour, materials, equipment) significantly affects the cost estimation certainty. Simulation 27 illustrates a case in which almost certainly the initially estimated construction costs of the sustainable project are underestimated.
More variants of simulations can be found in Appendix C. They represent changing parametrically the maximum and minimum values of the triangular probability distribution for costs of labour and equipment. In the current economic conditions, when both parties to the contract are interested in delivering quickly the subject of the contract, and on the other hand, labour market problems are visible, there is a need to modernize construction processes. Therefore machines, automatic equipment, and even robots replace people in a growing number of tasks. At the same time, the share of equipment costs increases in place of labour costs. Hence, there seems to be an interesting perspective to analyse the variability of probability distributions for these two components of the total construction cost.
4.5. Final Feedback
The presented research methodology was supplemented with the confrontation of the proposed assumptions, as well as the results obtained during the three-step scientific process with the opinion of random 30 experts dealing with construction projects. One-third of the sample answered on behalf of investors, another 10 people expressed the opinions of building contractors and the remaining—subcontractors. Through direct contacts, they were explained the research framework and the study outcomes obtained. They were also asked on two issues:
- was the initial hypothesis (about the need to consider the costs of sustainable construction projects in a probabilistic approach, enabling making more reliable decisions) right? Possible short replies were: “Yes”/”No”/”I don’t know”.
- what are the detailed suggestions of individual stakeholders of construction projects on the topic? The respondents were limited to express 2-3 sentences.
As a result of this short closing poll, 27 out of 30 people positively responded to the formulated research hypothesis in the context of the research results (answer “Yes”). Only three experts refused to give a specific opinion (“Yes” or “No”), explaining the lack of expertise on the issue so their opinion was qualified as “I don’t know”.
Taking into account the second area of the final feedback (suggested recommendations), various points of view of main stakeholders of construction projects were included. The key postulates have been grouped and simplified into the following statements:
- investor’s perspective—the investor is interested in the distribution of prices related to the execution of sustainable construction projects so that he can select offers from building contractors within the limits of the risk level of the accuracy of predicting these prices—therefore a probabilistic approach is necessary for estimating costs.
- contractor’s perspective—in the course of preparing the offer proposals (e.g., in the public procurement process), they want to be aware of the level of risk assigned to specific levels of proposed prices for construction services,
- subcontractor’s perspective—undertaking subcontracting cooperation is usually a consequence of the cost calculation in relation to the section of construction works for which the risk level may differ from the risk level of the entire project. Estimating the number of costs and level of risk requires an original probabilistic approach for each task segment.
As can be seen, the final feedback not only substantiated the adopted research hypothesis but also provided some interesting reflections from experts.
5. Discussion
In the literature, one can find several articles dealing with the topic of cost overruns in construction projects. It is difficult to point out the true advocate of this issue, but undoubtedly one of the greatest merits in the development of this area of knowledge can be attributed to Bent Flyvbjerg and his research team [67,68,69,70,71]. Some contemporary researchers concentrate on the construction costs only [72], whereas others deal with other stages of the project too (e.g., operation costs) or whole life cycle of construction projects [73]. However, a small number of articles relate to the cost risk of sustainable construction projects. For example, Li et al. [74] revealed that an increase in sustainable development standards of buildings would increase life cycle costs (+21.5%) and construction costs (+27.6%). It can be stated that no research was found that would relate to cost risk understood as the probability of accurate estimation of the costs of such projects.
The presented simulator can be useful for different parties of the construction projects—investors who are interested in preparing a reliable budget, contractors who are involved in the execution phase and wonder how much they should demand in the tender process to win a contract award on one hand, and not lose money on that on the other hand, and subcontractors whose economic position relies on the safe profit margin.
The model of simulation allows us to visualize costs as a function of the probability of estimation accuracy.
According to preliminary background research [8,9,10], it can be noted that a structure of costs of construction projects should be treated as probabilistic as individual cost factors are random variables. Variability of the technological and organizational conditions in construction works results in numerous deviations from the planned costs of construction. The construction projects that are executed with principles of sustainable development are prone to the risk of costs like other types of undertakings. The study discovers how can we measure the risk of cost estimations in sustainable construction projects. Moreover, as it was pre-assumed, a probabilistic approach to cost risk estimation of sustainable construction projects makes possible to determine more reliable decision-making processes conducted by different stakeholders in turbulent conditions.
In this article, the opinion of experts in the construction sector was collected in order to illustrate the cost risk of sustainable construction. The Monte Carlo simulations, as a comparably simple tool, can be used to study potential situations for many different scenarios, including particular components of the structure of costs of sustainable construction projects. So far, none of the applications connected with the estimation of construction costs penetrated the structure of sustainable construction costs. Thanks to this work a variability of individual cost components can give an insight on the certitude of cost estimation.
In addition, according to the experts from final feedback report, a probabilistic simulation analysis of the costs of sustainable construction projects based on construction costs is certainly an important element of the cost analysis of these projects. The amount of the costs of sustainable construction projects must correspond to the economic and environmental efficiency of the projects, which is ensured by the close relationship of cost estimation which takes into account usually external resources. These resources should not be treated in a deterministic way because the level of their costs is shaped in markets of a heterogeneous structure.
On the other hand, it is worth noting that the project outcomes usually appear in the subsequent stages of the life cycle–after the execution phase. A similar attitude was signalised before in the literature [75,76] while assessing the sustainability of constructions. Therefore, it is proposed to extend the study to simulate the behaviour of sustainable construction projects throughout the whole life cycle, often implemented in international implementation conditions [77,78].
6. Conclusions
The analysis of costs of construction projects is, in the decision-making process, necessary for all participants of construction investment projects: for investors (sponsors) of projects, contractors of construction works, project managers, clients. The construction market is characterized by cyclical variability as a function of time and high competitiveness of entities implementing construction tasks. It is important to show the role of specific cost factors in the cost of the project. The cost structure of a construction project is relatively constant for given types of construction investment projects. However, the construction of energy-saving or sustainable houses may be more expensive than traditional construction. It seems that one barrier of sustainability in construction projects is higher cost. The kind of projects is most often characterized by advanced technology at both the implementation and operation stages. Therefore, the costs of such innovative solutions may turn out to be difficult to evaluate by those who are responsible for cost estimations. It is also necessary to reduce the risk of cost to make such projects more attractive for investors.
Variability of the technological and organizational conditions in construction works results in deviations from the planned costs of construction. Sustainable construction projects are prone to risk of costs like other types of undertakings, or even more due to their undiscovered nature.
A quantitative risk assessment of sustainable construction costs makes it possible to determine the contingency of costs. If we take a calculated risk level and multiply it by the construction cost value we receive the value at risk—an important factor which can be added to the budget and treated as a total amount of money needed to cover all unexpected outcomes aiming at reducing the cost risk to a minimum. An analytical approach based on probability distributions of each involved cost in sustainable construction projects can support the risk management process of the different stakeholders involved generating more reliable decision-making processes as confirmed in our study by a final confirmatory survey presented in Section 4.5.
Constant monitoring of the development costs of construction projects avoids irregularities and detects “cost-o-genic” changes occurring in the project. Knowledge about the cost structure makes it easier to control the costs of sustainable construction projects.
Finally, it must be said that there is an indisputable dominance of the economic factor in the decision-making process of construction projects. A consistent tendency to expose economic values, as the most important factors in the execution of construction projects, was clear in the research. Among the representatives of the construction industry, there is a belief that environmental issues are not as much important as the economic matters, whereas the social aspects are neglected, or at least underestimated. This situation should change drastically if we really want future generations to have the opportunity to make their dreams come true, including those related to construction projects.
These and related issues may become very useful, especially in the period after the global crisis caused by a coronavirus and COVID-19 threat. Decision-makers in the impending economically difficult period will certainly want to see cost estimate more accurate, and on the other hand, sustainable constructions, limiting environmental damages and other negative externalities, may be the only rescue protecting humanity from final destruction. In this sense, other research studies [79,80] dealt with the effect of another international severe crisis (e.g., 2008 financial crisis) on construction firms, and could be valid references as a starting point for assessing the impact of COVID-19 on sustainable construction projects and the associated risks involved.
The answer to the question of whether it is worth risking is not easy. Verifying how much it pays off and if it leads to the final success is even more difficult. However, maybe it is better to trust an intuition of the researchers and begin to perceive the variability of costs of sustainable construction projects in terms of a game based on constantly changing rules? And what if the contribution of this article is the key to success that a reader is looking for?
7. Limitations and Future Research Lines
The aim of the article was to start a discussion on a cost variance and its implications for sustainable construction projects. In theory, there are many gaps connected with this issue that must be filled, especially nowadays, when sustainable construction projects are getting more and more popular. From this point of view, the matter is of great value to all key players in the construction sector as well as the academics dealing with cost risk management and sustainability.
Whereas the presented model is solid and explains briefly how to treat the cost risk of sustainable construction projects, there are still several problems that should be solved in future research:
- The research on the cost risk covers only one selected class of construction projects—housing, and deals with only one selected phase of the project life cycle—construction phase. It seems interesting and useful to discover other types of undertakings, including civil engineering projects in their whole life cycle perspective.
- The survey developed with questionnaires has been conducted only with Polish professionals belonging to engineering projects sector and costs data has been extracted from construction public databases from Poland and Spain. A transnational study with experts from other European countries, as well as from other continents could figure out new implications about risks perception and construction project costs structure in the context of sustainable development objectives.
- It was decided to limit the analysis to one selected approach to costing calculations. The attention of the reader should be paid to the specific calculation model presented in Equation (1). In the future, it may be inevitable to use other concepts of the cost estimation.
- There might exist some other correlations between cost factors than resulted from Equation (1) (e.g., indirect costs and labour, indirect costs and equipment etc.). How can one capture the new relationships and what would happen if implemented to the proposed model?
The study, presented in this manuscript, used a Monte Carlo simulation approach. The main contribution of this paper is the emergence of the simulation model of cost risk which is present in construction projects implemented with principles of sustainable development. It gives reliable perspectives for the improvement of decision-making in the execution of such undertakings. The results can be useful for different stakeholders representing sometimes other perspectives of the same construction investment project, especially investors, contractors, subcontractors, etc.
Author Contributions
Authors declare a symmetric contribution to the article (50–50) in all aspects: conceptualization, data curation, formal analysis, funding acquisition, investigation, methodology, project administration, resources, software, supervision, validation, visualization, writing—original draft, writing—review and editing. All authors have read and agreed to the published version of the manuscript.
Funding
Statutory research at the UTP University of Science and Technology, Bydgoszcz, Poland.
Acknowledgments
We thank the UTP University of Science and Technology, Bydgoszcz (Poland) and its Faculty of Civil and Environmental Engineering and Architecture for proving funds for the publication of the manuscript.
Conflicts of Interest
The authors declare no conflict of interest.
Appendix A
This section includes data related to measuring impact of number of iterations on a standard deviation of the simulated risk value. Table A1. includes all simulation results performed after 100, 1000 and 30,000 iterations respectively.

Table A1.
Simulation results—accuracy of the model.
| Simulation | Iterations | Risk Value |
|---|---|---|
| A.01 | 100 | 80.0% |
| A.02 | 100 | 86.0% |
| A.03 | 100 | 78.0% |
| A.04 | 100 | 83.0% |
| A.05 | 100 | 83.0% |
| A.06 | 100 | 78.0% |
| A.07 | 100 | 84.0% |
| A.08 | 100 | 77.0% |
| A.09 | 100 | 74.0% |
| A.10 | 100 | 81.0% |
| A.11 | 1000 | 78.8% |
| A.12 | 1000 | 78.8% |
| A.13 | 1000 | 79.3% |
| A.14 | 1000 | 79.9% |
| A.15 | 1000 | 78.2% |
| A.16 | 1000 | 79.6% |
| A.17 | 1000 | 76.9% |
| A.18 | 1000 | 80.2% |
| A.19 | 1000 | 77.6% |
| A.20 | 1000 | 76.8% |
| A.21 | 30,000 | 78.7% |
| A.22 | 30,000 | 79.2% |
| A.23 | 30,000 | 79.0% |
| A.24 | 30,000 | 79.0% |
| A.25 | 30,000 | 79.0% |
| A.26 | 30,000 | 79.4% |
| A.27 | 30,000 | 79.1% |
| A.28 | 30,000 | 79.0% |
| A.29 | 30,000 | 79.1% |
| A.30 | 30,000 | 79.5% |
Table A2. presents a decreasing standard deviation with an increasing number of iterations.
Table A2.
Simulation results—basic statistics for different numbers of trials.
| Iterations | Mean | Std. Dev. |
|---|---|---|
| 100 | 80.4% | 3.7% |
| 1000 | 78.6% | 1.2% |
| 30000 | 79.1% | 0.2% |
According to [81], Monte Carlo simulation creates a fluctuating convergence process which is quite sensitive to changes coming from the new samples. However, confidence range decreases as the number of samples increases. Therefore, the accuracy level of Monte Carlo simulation can be measured using the coefficient of variance:
It is defined as the standard deviation of the estimate divided by the estimate. According to Equation (A1). the accuracy is 0.3% for 30 000 iterations (trials per run).
Undoubtedly, the increase in the number of iterations improves the accuracy of predictions and it should be assumed that the adopted number of trials is adequate.
Appendix B
In this section, a data for normality tests is given.
Table A3.
90 simulated risk values.
| Simulation | Iterations | Risk Value |
|---|---|---|
| B.01 | 30,000 | 78.7% |
| B.02 | 30,000 | 79.2% |
| B.03 | 30,000 | 79.0% |
| B.04 | 30,000 | 79.0% |
| B.05 | 30,000 | 79.0% |
| B.06 | 30,000 | 79.4% |
| B.07 | 30,000 | 79.1% |
| B.08 | 30,000 | 79.0% |
| B.09 | 30,000 | 79.1% |
| B.10 | 30,000 | 79.5% |
| B.11 | 30,000 | 79.0% |
| B.12 | 30,000 | 78.8% |
| B.13 | 30,000 | 78.8% |
| B.14 | 30,000 | 78.8% |
| B.15 | 30,000 | 79.0% |
| B.16 | 30,000 | 79.0% |
| B.17 | 30,000 | 79.0% |
| B.18 | 30,000 | 78.9% |
| B.19 | 30,000 | 79.2% |
| B.20 | 30,000 | 78.9% |
| B.21 | 30,000 | 78.7% |
| B.22 | 30,000 | 79.0% |
| B.23 | 30,000 | 79.0% |
| B.24 | 30,000 | 79.0% |
| B.25 | 30,000 | 79.1% |
| B.26 | 30,000 | 79.1% |
| B.27 | 30,000 | 79.2% |
| B.28 | 30,000 | 78.6% |
| B.29 | 30,000 | 79.1% |
| B.30 | 30,000 | 79.3% |
| B.31 | 30,000 | 79.3% |
| B.32 | 30,000 | 78.8% |
| B.33 | 30,000 | 79.1% |
| B.34 | 30,000 | 78.8% |
| B.35 | 30,000 | 78.9% |
| B.36 | 30,000 | 79.2% |
| B.37 | 30,000 | 79.1% |
| B.38 | 30,000 | 78.8% |
| B.39 | 30,000 | 79.0% |
| B.40 | 30,000 | 79.2% |
| B.41 | 30,000 | 78.7% |
| B.42 | 30,000 | 78.7% |
| B.43 | 30,000 | 79.4% |
| B.44 | 30,000 | 78.9% |
| B.45 | 30,000 | 78.9% |
| B.46 | 30,000 | 79.2% |
| B.47 | 30,000 | 79.3% |
| B.48 | 30,000 | 78.5% |
| B.49 | 30,000 | 79.2% |
| B.50 | 30,000 | 78.5% |
| B.51 | 30,000 | 79.4% |
| B.52 | 30,000 | 79.3% |
| B.53 | 30,000 | 79.0% |
| B.54 | 30,000 | 79.0% |
| B.55 | 30,000 | 78.9% |
| B.56 | 30,000 | 78.8% |
| B.57 | 30,000 | 78.7% |
| B.58 | 30,000 | 78.9% |
| B.59 | 30,000 | 78.7% |
| B.60 | 30,000 | 78.6% |
| B.61 | 30,000 | 79.1% |
| B.62 | 30,000 | 78.8% |
| B.63 | 30,000 | 79.2% |
| B.64 | 30,000 | 78.7% |
| B.65 | 30,000 | 78.8% |
| B.66 | 30,000 | 78.9% |
| B.67 | 30,000 | 78.6% |
| B.68 | 30,000 | 78.8% |
| B.69 | 30,000 | 79.3% |
| B.70 | 30,000 | 78.8% |
| B.71 | 30,000 | 79.3% |
| B.72 | 30,000 | 78.9% |
| B.73 | 30,000 | 79.1% |
| B.74 | 30,000 | 79.1% |
| B.75 | 30,000 | 78.8% |
| B.76 | 30,000 | 78.6% |
| B.77 | 30,000 | 79.1% |
| B.78 | 30,000 | 79.1% |
| B.79 | 30,000 | 79.0% |
| B.80 | 30,000 | 79.1% |
| B.81 | 30,000 | 78.6% |
| B.82 | 30,000 | 78.9% |
| B.83 | 30,000 | 78.8% |
| B.84 | 30,000 | 78.8% |
| B.85 | 30,000 | 79.0% |
| B.86 | 30,000 | 79.2% |
| B.87 | 30,000 | 79.1% |
| B.88 | 30,000 | 79.0% |
| B.89 | 30,000 | 78.7% |
| B.90 | 30,000 | 78.5% |
Appendix C
In this section, a data representing parametrical changes of the probability distribution for costs of labour and costs of equipment is presented.
Table A4.
Simulated risk values after changes in distributions of labour costs and equipment costs.
| Simulation | 1 | 2 | 3 | 4 | Risk Value | Reliability Value |
|---|---|---|---|---|---|---|
| C.01 | L MIN | L MAX | L MIN value | L MAX value | 71.8% | 28.2% |
| −10% | −10% | 35,557.80 PLN | 50,557,80 PLN | |||
| M MIN | M MAX | M MIN value | M MAX value | |||
| 0% | 0% | 174 000,00 PLN | 233 000.00 PLN | |||
| E MIN | E MAX | E MIN value | E MAX value | |||
| 10% | 10% | 18,903.80 PLN | 24,903.80 PLN | |||
| C.02 | L MIN | L MAX | L MIN value | L MAX value | 85.1% | 14.9% |
| 10% | 10% | 44,422.00 PLN | 59,442.20 PLN | |||
| M MIN | M MAX | M MIN value | M MAX value | |||
| 0% | 0% | 174 000.00 PLN | 233,000.00 PLN | |||
| E MIN | E MAX | E MIN value | E MAX value | |||
| −10% | −10% | 15 096.20 PLN | 21,096.20 PLN | |||
| C.03 | L MIN | L MAX | L MIN value | L MAX value | 82.4% | 17.6% |
| 5% | 5% | 42,221.10 PLN | 57,221.10 PLN | |||
| M MIN | M MAX | M MIN value | M MAX value | |||
| 0% | 0% | 174 000.00 PLN | 233,000.00 PLN | |||
| E MIN | E MAX | E MIN value | E MAX value | |||
| −5% | −5% | 16,048.10 PLN | 22 048.10 PLN | |||
| C.04 | L MIN | L MAX | L MIN value | L MAX value | 75.6% | 24.4% |
| −5% | −5% | 37,778,90 PLN | 52,778.90 PLN | |||
| M MIN | M MAX | M MIN value | M MAX value | |||
| 0% | 0% | 174,000,00 PLN | 233,000.00 PLN | |||
| E MIN | E MAX | E MIN value | E MAX value | |||
| 5% | 5% | 17,951,90 PLN | 23,951.90 PLN | |||
| C.05 | L MIN | L MAX | L MIN value | L MAX value | 67.9% | 32.1% |
| −10% | −10% | 35,557.80 PLN | 50,557.80 PLN | |||
| M MIN | M MAX | M MIN value | M MAX value | |||
| 0% | 0% | 174,000.00 PLN | 233,000.00 PLN | |||
| E MIN | E MAX | E MIN value | E MAX value | |||
| 5% | 5% | 17,951.90 PLN | 23,951.90 PLN | |||
| C.06 | L MIN | L MAX | L MIN value | L MAX value | 79.8% | 20.2% |
| 5% | 5% | 42,221.10 PLN | 57,221.10 PLN | |||
| M MIN | M MAX | M MIN value | M MAX value | |||
| 0% | 0% | 174,000.00 PLN | 233,000.00 PLN | |||
| E MIN | E MAX | E MIN value | E MAX value | |||
| −10% | −10% | 15.096.20 PLN | 21,096.20 PLN | |||
| C.07 | L MIN | L MAX | L MIN value | L MAX value | 65.7% | 34.3% |
| −5% | −5% | 37,778.90 PLN | 52,778.90 PLN | |||
| M MIN | M MAX | M MIN value | M MAX value | |||
| 0% | 0% | 174,000.00 PLN | 233,000.00 PLN | |||
| E MIN | E MAX | E MIN value | E MAX value | |||
| −10% | −10% | 15,096.20 PLN | 21,096.20 PLN | |||
| C.08 | L MIN | L MAX | L MIN value | L MAX value | 61.0% | 39.0% |
| −10% | −10% | 35,557.80 PLN | 50,557.80 PLN | |||
| M MIN | M MAX | M MIN value | M MAX value | |||
| 0% | 0% | 174,000.00 PLN | 233,000.00 PLN | |||
| E MIN | E MAX | E MIN value | E MAX value | |||
| −5% | −5% | 16,048.10 PLN | 22,048.10 PLN | |||
| C.09 | L MIN | L MAX | L MIN value | L MAX value | 88.8% | 11.2% |
| 5% | 5% | 42,221.10 PLN | 57,221.10 PLN | |||
| M MIN | M MAX | M MIN value | M MAX value | |||
| 0% | 0% | 174,000.00 PLN | 233,000.00 PLN | |||
| E MIN | E MAX | E MIN value | E MAX value | |||
| 10% | 10% | 18,903.80 PLN | 24,903.80 PLN | |||
| C.10 | L MIN | L MAX | L MIN value | L MAX value | 91.4% | 8.6% |
| 10% | 10% | 44,422.00 PLN | 59,442.20 PLN | |||
| M MIN | M MAX | M MIN value | M MAX value | |||
| 0% | 0% | 174,000.00 PLN | 233,000.00 PLN | |||
| E MIN | E MAX | E MIN value | E MAX value | |||
| 5% | 5% | 17,951.90 PLN | 23,951.90 PLN | |||
| C.11 | L MIN | L MAX | L MIN value | L MAX value | 72.6% | 27.4% |
| −10% | −5% | 35,557.80 PLN | 52,778.90 PLN | |||
| M MIN | M MAX | M MIN value | M MAX value | |||
| 0% | 0% | 174,000.00 PLN | 233,000.00 PLN | |||
| E MIN | E MAX | E MIN value | E MAX value | |||
| 10% | 5% | 18,903.80 PLN | 23,951.90 PLN | |||
| C.12 | L MIN | L MAX | L MIN value | L MAX value | 84.3% | 15.7% |
| 10% | 5% | 44,422.00 PLN | 57,221.10 PLN | |||
| M MIN | M MAX | M MIN value | M MAX value | |||
| 0% | 0% | 174,000.00 PLN | 233,000.00 PLN | |||
| E MIN | E MAX | E MIN value | E MAX value | |||
| −10% | −5% | 15,096.20 PLN | 22,048.10 PLN | |||
| C.13 | L MIN | L MAX | L MIN value | L MAX value | 73.4% | 26.6% |
| −5% | −10% | 37,778.90 PLN | 50,557.80 PLN | |||
| M MIN | M MAX | M MIN value | M MAX value | |||
| 0% | 0% | 174,000,00 PLN | 233,000.00 PLN | |||
| E MIN | E MAX | E MIN value | E MAX value | |||
| 5% | 10% | 17,951,90 PLN | 24,903.80 PLN | |||
| C.14 | L MIN | L MAX | L MIN value | L MAX value | 82.8% | 17.2% |
| 5% | 10% | 42,221.10 PLN | 59,442.20 PLN | |||
| M MIN | M MAX | M MIN value | M MAX value | |||
| 0% | 0% | 174,000.00 PLN | 233,000.00 PLN | |||
| E MIN | E MAX | E MIN value | E MAX value | |||
| −5% | −10% | 16,048.10 PLN | 21,096.20 PLN |
References
- Wong, J.M.; Ng, S.T.; Chan, A.P. Strategic planning for the sustainable development of the construction industry in Hong Kong. Habitat Int. 2010, 34, 256–263. [Google Scholar] [CrossRef]
- Sobotka, A. Innovative solutions in engineering of construction projects. Procedia Eng. 2017, 208, 160–165. [Google Scholar] [CrossRef]
- Spisakova, M.; Kozlovska, M. Options of Customization in Industrialized Methods of Construction in Terms of Construction 4.0; Springer Science and Business Media LLC: Berlin, Germany, 2019; pp. 444–451. [Google Scholar]
- Bizon-Górecka, J.; Górecki, J. Process management of the investment-construction project (Procesowe zarzadzanie projektem inwestycyjno-budowlanym). Pr. Nauk. Inst. Bud. Politech. Wroc. 2008, 91, 7–16. [Google Scholar]
- Silva, A.; Fernandes, A. Probabilistic approach for predicting life cycle costs and performance of bridges. In Advances in Bridge Maintenance, Safety Management, and Life-Cycle Performance; CRC Press: Cleveland, OH, USA, 2006; pp. 927–928. [Google Scholar]
- Kaplinski, O. Risk Management of Construction Works by Means of the Utility Theory: A Case Study. Procedia Eng. 2013, 57, 533–539. [Google Scholar] [CrossRef] [Green Version]
- Diekmann, J.E.; Featherman, W.D. Assessing Cost Uncertainty: Lessons from Environmental Restoration Projects. J. Constr. Eng. Manag. 1998, 124, 445–451. [Google Scholar] [CrossRef]
- Špačková, O.; Novotná, E.; Šejnoha, M.; Šejnoha, J. Probabilistic models for tunnel construction risk assessment. Adv. Eng. Softw. 2013, 62, 72–84. [Google Scholar] [CrossRef]
- Wang, W.-C.; Wang, S.-H.; Tsui, Y.-K.; Hsu, C.-H. A factor-based probabilistic cost model to support bid-price estimation. Expert Syst. Appl. 2012, 39, 5358–5366. [Google Scholar] [CrossRef]
- Touran, A.; Bolster, P.J. Integration of financial and construction risks: A simulation approach. Transp. Res. Rec. 1994, 1450, 15–22. [Google Scholar]
- Alwan, Z.; Jones, P.; Holgate, P. Strategic sustainable development in the UK construction industry, through the framework for strategic sustainable development, using Building Information Modelling. J. Clean. Prod. 2017, 140, 349–358. [Google Scholar] [CrossRef]
- Chen, Y.; Okudan, G.E.; Riley, D.R. Sustainable performance criteria for construction method selection in concrete buildings. Autom. Constr. 2010, 19, 235–244. [Google Scholar] [CrossRef]
- Opoku, D.-G.J.; Ayarkwa, J.; Agyekum, K. Barriers to environmental sustainability of construction projects. Smart Sustain. Built Environ. 2019, 8, 292–306. [Google Scholar] [CrossRef]
- Freire-Guerrero, A.; Alba-Rodríguez, M.D.; Marrero, M. A budget for the ecological footprint of buildings is possible: A case study using the dwelling construction cost database of Andalusia. Sustain. Cities Soc. 2019, 51, 101737. [Google Scholar] [CrossRef]
- Cheng, W.; Sodagar, B.; Sun, F.; Brebbia, C.; Galiano-Garrigos, A. Comparative analysis of environmental performance of an office building using BREEAM and GBL. Int. J. Sustain. Dev. Plan. 2017, 12, 528–540. [Google Scholar] [CrossRef] [Green Version]
- Vigovskaya, A.; Aleksandrova, O.; Bulgakov, B. Life Cycle Assessment (LCA) of a LEED certified building. In IOP Conference Series: Materials Science and Engineering; IOP Publishing: Bristol, UK, 2018; Volume 365, p. 022007. [Google Scholar]
- Bin Wang, G.; He, G.Y.; Bian, L. Sustainable Construction Project under Lean Construction Theory. Adv. Mater. Res. 2011, 250, 3345–3349. [Google Scholar] [CrossRef]
- Zhong, Z.Y.; Chen, Y.G. Principles of Sustainable Construction Project Management Based on Lean Construction. Adv. Mater. Res. 2011, 225, 766–770. [Google Scholar] [CrossRef]
- Rafindadi, A.D.; Mikić, M.; Kovacic, I.; Cekic, Z. Global Perception of Sustainable Construction Project Risks. Procedia Soc. Behav. Sci. 2014, 119, 456–465. [Google Scholar] [CrossRef] [Green Version]
- Chitkara, K.K. Construction Project Management, 3rd ed.; McGraw-Hill Education: New Delhi, India, 2014; ISBN 978-93-392-0545-4. [Google Scholar]
- Solís-Guzmán, J.; Camacho, C.R.; Alba-Rodríguez, M.D.; Martínez-Rocamora, A. Carbon Footprint Estimation Tool for Residential Buildings for Non-Specialized Users: OERCO2 Project. Sustainability 2018, 10, 1359. [Google Scholar] [CrossRef] [Green Version]
- Baldry, D. The evaluation of risk management in public sector capital projects. Int. J. Proj. Manag. 1998, 16, 35–41. [Google Scholar] [CrossRef]
- Ranasinghe, M. Contingency allocation and management for building projects. Constr. Manag. Econ. 1994, 12, 233–243. [Google Scholar] [CrossRef]
- Choudhry, R.M.; Rafiq, S.; Ahmed, A.; Ahmed, T. Estimating Probabilistic Cost and Time Contingency for Residential Building Projects. In Proceedings of the International Conference on Civil, Structural and Transportation Engineering, Niagara Falls, Canada, 10–12 June 2018; pp. 134–141. [Google Scholar]
- Plebankiewicz, E.; Zima, K.; Wieczorek, D. Life Cycle Cost Modelling of Buildings with Consideration of the Risk. Arch. Civ. Eng. 2016, 62, 149–166. [Google Scholar] [CrossRef] [Green Version]
- Heralova, R.S. Life Cycle Cost Optimization Within Decision Making on Alternative Designs of Public Buildings. Procedia Eng. 2014, 85, 454–463. [Google Scholar] [CrossRef] [Green Version]
- Tunji-Olayeni, P.F.; Afolabi, A.O.; Olowookere, E.I.; Okpalamoka, O.I.; Oluwatobi, A.O. Implications of occupational hazards on attainment of the Sustainable Development Goals in the Nigerian Construction Industry. In IOP Conference Series: Materials Science and Engineering; IOP Publishing: Bristol, UK, 2019; Volume 640, pp. 1–7. [Google Scholar]
- Hwang, B.-G.; Shan, M.; Phua, H.; Chi, S. An Exploratory Analysis of Risks in Green Residential Building Construction Projects: The Case of Singapore. Sustainability 2017, 9, 1116. [Google Scholar] [CrossRef] [Green Version]
- Lee, J.K.; Han, S.H.; Jang, W.; Jung, W. “Win-win strategy” for sustainable relationship between general contractors and subcontractors in international construction projects. KSCE J. Civ. Eng. 2017, 22, 428–439. [Google Scholar] [CrossRef]
- Ardeshir, A.; Maknoon, R.; Rekab Islamizadeh, M.; Jahantab, Z. Safety risk assessment effective on occupational health in high-rise building construction projects with fuzzy approach. Iran Occup. Heal. 2014, 11, 82–95. [Google Scholar]
- Ulam, S.M. A Collection of Mathematical Problems; Interscience Publishers: New York, NY, USA, 1960. [Google Scholar]
- Artto, K.A.; Lehtonen, J.-M.; Saranen, J. Managing projects front-end: Incorporating a strategic early view to project management with simulation. Int. J. Proj. Manag. 2001, 19, 255–264. [Google Scholar] [CrossRef]
- Walȩdzik, K.; Mańdziuk, J. Applying hybrid Monte Carlo Tree Search methods to Risk-Aware Project Scheduling Problem. Inf. Sci. 2018, 450–468. [Google Scholar] [CrossRef]
- Van Slyke, R.M. Letter to the Editor—Monte Carlo Methods and the PERT Problem. Oper. Res. 1963, 11, 839–860. [Google Scholar] [CrossRef] [Green Version]
- Chau, K.W. Monte Carlo simulation of construction costs using subjective data. Constr. Manag. Econ. 1995, 13, 369–383. [Google Scholar] [CrossRef]
- Combining risks in estimating. Constr. Manag. Econ. 1986, 4, 75–79. [CrossRef]
- Górecki, J.; Płoszaj, E. Cost risk of construction of small hydroelectric power plants. MATEC Web Conf. 2019, 262, 07004. [Google Scholar] [CrossRef]
- Górecki, J. Koszty budowy w perspektywie zmienności czynników kosztotwórczych (Construction costs in a perspective of variability of cost factors). Przegląd Bud. 2013, 2, 45–50. [Google Scholar]
- Zhang, H.Y.; Yang, G.B. Review of Study on Risk Management for the Construction Project. Adv. Mater. Res. 2011, 243, 6404–6409. [Google Scholar] [CrossRef]
- Bahamid, R.A.; Doh, S.I. A review of risk management process in construction projects of developing countries. In IOP Conference Series: Materials Science and Engineering; IOP Publishing: Bristol, UK, 2017; Volume 271, p. 12042. [Google Scholar]
- Xia, N.; Zou, P.; Griffin, M.; Wang, X.; Zhong, R. Towards integrating construction risk management and stakeholder management: A systematic literature review and future research agendas. Int. J. Proj. Manag. 2018, 36, 701–715. [Google Scholar] [CrossRef]
- Siraj, N.B.; Fayek, A.R. Risk Identification and Common Risks in Construction: Literature Review and Content Analysis. J. Constr. Eng. Manag. 2019, 145, 03119004. [Google Scholar] [CrossRef]
- Cakmak, P.I.; Tezel, E. A Guide for Risk Management in Construction Projects: Present Knowledge and Future Directions. In Risk Management in Construction Projects; IntechOpen: London, UK, 2019. [Google Scholar]
- Diaz-Madroñero, M.; Mula, J.; Peidro, D. A review of discrete-time optimization models for tactical production planning. Int. J. Prod. Res. 2014, 52, 5171–5205. [Google Scholar] [CrossRef]
- Diaz-Madroñero, M.; Peidro, D.; Mula, J. A review of tactical optimization models for integrated production and transport routing planning decisions. Comput. Ind. Eng. 2015, 88, 518–535. [Google Scholar] [CrossRef]
- Li, B.; Akintoye, A.; Edwards, P.; Hardcastle, C. Perceptions of positive and negative factors influencing the attractiveness of PPP/PFI procurement for construction projects in the UK. Eng. Constr. Arch. Manag. 2005, 12, 125–148. [Google Scholar] [CrossRef]
- Zou, P.; Zhang, G.; Wang, J. Understanding the key risks in construction projects in China. Int. J. Proj. Manag. 2007, 25, 601–614. [Google Scholar] [CrossRef]
- Corbett, P.; Edwards, N. Partnering for a greener future. In Construction for a Sustainable Environment; CRC Press: Boca Raton, FL, USA, 2010; pp. 319–328. [Google Scholar]
- Azis, A.A.A.; Memon, A.H.; Rahman, I.A.; Nagapan, S.; Latif, Q.B.A.I. Challenges faced by construction industry in accomplishing sustainablity goals. In Proceedings of the 2012 IEEE Symposium on Business, Engineering and Industrial Applications, Bandung, Indonesia, 23–26 September 2012; pp. 630–634. [Google Scholar]
- Mohamed, F.D. Integrating Risk Assessment in Planning for Sustainable Infrastructure Projects. ICSDEC 2012 2012, 350–358. [Google Scholar]
- Taylan, O.; Bafail, A.O.; Abdulaal, R.M.; Kabli, M.R. Construction projects selection and risk assessment by fuzzy AHP and fuzzy TOPSIS methodologies. Appl. Soft Comput. 2014, 17, 105–116. [Google Scholar] [CrossRef]
- Chou, J.-S.; Le, T.-S. Probabilistic multiobjective optimization of sustainable engineering design. KSCE J. Civ. Eng. 2014, 18, 853–864. [Google Scholar] [CrossRef]
- Dziadosz, A.; Tomczyk, A.; Kapliński, O. Financial Risk Estimation in Construction Contracts. Procedia Eng. 2015, 122, 120–128. [Google Scholar] [CrossRef] [Green Version]
- Lee, S.; Kim, K. Collar Option Model for Managing the Cost Overrun Caused by Change Orders. Sustainability 2015, 7, 10649–10663. [Google Scholar] [CrossRef] [Green Version]
- Thangavel, N.; Manikandan, V.M. Ascertaining key risks in the construction projects. Int. J. Econ. Res. 2015, 12, 331–346. [Google Scholar]
- Kankhva, V. Methodic Approaches to Cost Evaluation of Innovation Projects in Underground Development. Procedia Eng. 2016, 165, 1305–1309. [Google Scholar] [CrossRef]
- Badi, S.M.; Pryke, S. Assessing the impact of risk allocation on sustainable energy innovation (SEI). Int. J. Manag. Proj. Bus. 2016, 9, 259–281. [Google Scholar] [CrossRef] [Green Version]
- Ayub, B.; Thaheem, M.J.; Din, Z.U. Dynamic Management of Cost Contingency: Impact of KPIs and Risk Perception. Procedia Eng. 2016, 145, 82–87. [Google Scholar] [CrossRef] [Green Version]
- Krechowicz, M. Effective Risk Management in Innovative Projects: A Case Study of the Construction of Energy-efficient, Sustainable Building of the Laboratory of Intelligent Building in Cracow. In IOP Conference Series: Materials Science and Engineering; IOP Publishing: Bristol, UK, 2017; Volume 245, p. 62006. [Google Scholar]
- Řeháček, P.; Bazsova, B. Risk management methods in construction projects. In Proceedings of the 30th International Business Information Management Association Conference (IBIMA)-Vision 2020: Sustainable Economic Development, Innovation Management, and Global Growth, Madrid, Spain, 8–9 November 2017; Volume 2017, pp. 3060–3069. [Google Scholar]
- Devi, A.C.; Ananthanarayanan, K. Factors influencing cost over-run in Indian construction projects. In MATEC Web of Conferences; EDP Sciences: Les Ulis, France, 2017; Volume 120, p. 2023. [Google Scholar]
- Kifokeris, D.; Xenidis, Y.; De, D.; Saturnino, J.; Bakker, J.; Frangopol, D.M.; Van Breugel, K. Towards the combination of risk analysis, constructability and sustainability for the lifecycle management of construction projects. In Life-Cycle of Engineering Systems; Informa UK Limited: London, UK, 2016; pp. 1492–1499. [Google Scholar]
- Ali, Z.; Zhu, F.; Hussain, S. Risk Assessment of Ex-Post Transaction Cost in Construction Projects Using Structural Equation Modeling. Sustainability 2018, 10, 4017. [Google Scholar] [CrossRef] [Green Version]
- Baudrit, C.; Taillandier, F.; Tran, T.T.P.; Breysse, D. Uncertainty Processing and Risk Monitoring in Construction Projects Using Hierarchical Probabilistic Relational Models. Comput. Civ. Infrastruct. Eng. 2018, 34, 97–115. [Google Scholar] [CrossRef]
- Bizon-Gorecka, J.; Gorecki, J. Risk Management in Construction Project: Taking Sustainability into Account. In IOP Conference Series: Materials Science and Engineering; IOP Publishing: Bristol, UK, 2019; Volume 471, p. 112069. [Google Scholar]
- Górecki, J. Cost structure analysis in the construction investment projects. Tech. Trans. Civ. Eng. 2010, 107, 111–118. [Google Scholar]
- Flyvbjerg, B.; Ansar, A.; Budzier, A.; Buhl, S.; Cantarelli, C.; Garbuio, M.; Glenting, C.; Holm, M.S.; Lovallo, D.; Lunn, D.; et al. Five things you should know about cost overrun. Transp. Res. Part A Policy Pr. 2018, 118, 174–190. [Google Scholar] [CrossRef]
- Cantarelli, C.; Van Wee, B.; Molin, E.; Flyvbjerg, B. Different cost performance: Different determinants? Transp. Policy 2012, 22, 88–95. [Google Scholar] [CrossRef] [Green Version]
- Cantarelli, C.; Molin, E.; Van Wee, B.; Flyvbjerg, B. Characteristics of cost overruns for Dutch transport infrastructure projects and the importance of the decision to build and project phases. Transp. Policy 2012, 22, 49–56. [Google Scholar] [CrossRef] [Green Version]
- Skamris, M.K.; Flyvbjerg, B. Inaccuracy of traffic forecasts and cost estimates on large transport projects. Transp. Policy 1997, 4, 141–146. [Google Scholar] [CrossRef]
- Flyvbjerg, B.; Holm, M.K.S.; Buhl, S.L. How common and how large are cost overruns in transport infrastructure projects? Transp. Rev. 2003, 23, 71–88. [Google Scholar] [CrossRef]
- Plebankiewicz, E. Model of Predicting Cost Overrun in Construction Projects. Sustainability 2018, 10, 4387. [Google Scholar] [CrossRef] [Green Version]
- Cavalieri, M.; Cristaudo, R.; Guccio, C. On the magnitude of cost overruns throughout the project life-cycle: An assessment for the Italian transport infrastructure projects. Transp. Policy 2019, 79, 21–36. [Google Scholar] [CrossRef]
- Li, S.; Lu, Y.; Kua, H.W.; Chang, R. The economics of green buildings: A life cycle cost analysis of non-residential buildings in tropic climates. J. Clean. Prod. 2020, 252, 119771. [Google Scholar] [CrossRef]
- Švajlenka, J.; Kozlovská, M. Evaluation of the efficiency and sustainability of timber-based construction. J. Clean. Prod. 2020, 259, 120835. [Google Scholar] [CrossRef]
- Švajlenka, J.; Kozlovská, M.; Pošiváková, T. Analysis of Selected Building Constructions Used in Industrial Construction in Terms of Sustainability Benefits. Sustainability 2018, 10, 4394. [Google Scholar] [CrossRef] [Green Version]
- Lei, Z.; Tang, W.; Duffield, C.; Zhang, L.; Hui, F.K.P.; You, R. Qualitative Analysis of the Occupational Health and Safety Performance of Chinese International Construction Projects. Sustainability 2018, 10, 4344. [Google Scholar] [CrossRef] [Green Version]
- Yang, Y.; Tang, W.; Shen, W.; Wang, T. Enhancing Risk Management by Partnering in International EPC Projects: Perspective from Evolutionary Game in Chinese Construction Companies. Sustainability 2019, 11, 5332. [Google Scholar] [CrossRef] [Green Version]
- Kapelko, M.; Lansink, A.O.; Stefanou, S. Assessing dynamic inefficiency of the Spanish construction sector pre- and post-financial crisis. Eur. J. Oper. Res. 2014, 237, 349–357. [Google Scholar] [CrossRef]
- Sfakianaki, E.; Iliadis, T.; Zafeiris, E. Crisis management under an economic recession in construction: The Greek case. Int. J. Manag. Decis. Mak. 2015, 14, 373. [Google Scholar] [CrossRef]
- Li, W. Risk Assessment of Power Systems: Models, Methods, and Applications, 2nd ed.; Li, W., Ed.; Wiley-IEEE Press: Hoboken, NJ, USA, 2014; ISBN 9781118849972. [Google Scholar]
Figure 1.
Graphical representation of the proposed method aiming at cost risk simulation of sustainable construction projects.
Figure 1.
Graphical representation of the proposed method aiming at cost risk simulation of sustainable construction projects.

Figure 2.
Demographics of the survey—experience.

Figure 3.
Demographics of the survey—leading role.

Figure 4.
Hierarchy of importance—a general perspective.

Figure 5.
Hierarchy of importance—construction sector.

Figure 6.
Hierarchy of importance—construction project participated.

Figure 7.
Cost risk in sustainable construction projects vs. “conventional” construction projects.

Figure 8.
Cost risk assessment in sustainable construction projects.

Figure 9.
Cost structures of analysed house designs in the first database.

Figure 10.
Cost structures of analysed house designs in the second database.

Figure 11.
Histogram of simulated costs.

Figure 12.
Distribution chart of simulated costs function.

Figure 13.
Histogram of 90 simulations of risk values.

Figure 14.
Graphical representation of the comparison of practical and theoretical values—histogram.
Figure 14.
Graphical representation of the comparison of practical and theoretical values—histogram.

Table 1.
Summary of comprehensive literature review.
| Reference | Research Focus | Source of Information | Research Output | Country | ||||||||||||
|---|---|---|---|---|---|---|---|---|---|---|---|---|---|---|---|---|
| RI | RA | RE | RR | RM | RV | CS | SI | GI | ST | TM | MM | EM | ||||
| Li et al. [46] | ● | ● | ● | UK | ||||||||||||
| Zou et al. [47] | ● | ● | ● | China | ||||||||||||
| Corbett and Edwards [48] | ● | ● | ● | UK | ||||||||||||
| Azis et al. [49] | ● | ● | ● | Malaysia | ||||||||||||
| Mohamed [50] | ● | ● | ● | USA | ||||||||||||
| Taylan et al. [51] | ● | ● | ● | Saudi Arabia | ||||||||||||
| Chou and Le [52] | ● | ● | ● | Vietnam | ||||||||||||
| Dziadosz et al. [53] | ● | ● | ● | Poland | ||||||||||||
| Lee and Kim [54] | ● | ● | ● | South Korea | ||||||||||||
| Thangavel and Manikandan [55] | ● | ● | India | |||||||||||||
| Kankhva [56] | ● | ● | ● | Russia | ||||||||||||
| Badi and Pryke [57] | ● | ● | ● | UK | ||||||||||||
| Ayub et al. [58] | ● | ● | ● | ● | N/A (1) | |||||||||||
| Hwang et al. [28] | ● | ● | ● | ● | Singapore | |||||||||||
| Krechowicz [59] | ● | ● | ● | Poland | ||||||||||||
| Řeháček and Bazsova [60] | ● | ● | ● | Czech Republic | ||||||||||||
| Cindrela Devi and Ananthanarayanan [61] | ● | ● | ● | ● | India | |||||||||||
| Kifokeris and Xenidis [62] | ● | ● | ● | N/A (1) | ||||||||||||
| Lee et al. [29] | ● | ● | ● | ● | South Korea | |||||||||||
| Ali et al. [63] | ● | ● | ● | Pakistan | ||||||||||||
| Baudrit et al. [64] | ● | ● | ● | France | ||||||||||||
| Bizon-Gorecka and Gorecki [65] | ● | ● | ● | Poland | ||||||||||||
(1) N/A—not available.
Table 2.
Simulation results—basic statistics.
| Measure Name | Value |
|---|---|
| Mean | 0.789666667 |
| Variance | 5.16854 × 10⁻⁶ |
| Std. Dev. | 0.002273442 |
| Skewness | −0.004563782 |
| Kurtosis | 2.487824517 |
| Median | 0.79 |
Table 3.
Histogram—calculations.
| Bin ID | Bin Min | Bin Max | Bin Midpoint | Freq. | Rel. Freq. | Prb. Density |
|---|---|---|---|---|---|---|
| Bin #1 | 0.785 | 0.78625 | 0.785625 | 8 | 0.088888889 | 71.11111111 |
| Bin #2 | 0.78625 | 0.7875 | 0.786875 | 8 | 0.088888889 | 71.11111111 |
| Bin #3 | 0.7875 | 0.78875 | 0.788125 | 14 | 0.155555556 | 124.4444444 |
| Bin #4 | 0.78875 | 0.79 | 0.789375 | 27 | 0.3 | 240 |
| Bin #5 | 0.79 | 0.79125 | 0.790625 | 14 | 0.155555556 | 124.4444444 |
| Bin #6 | 0.79125 | 0.7925 | 0.791875 | 9 | 0.1 | 80 |
| Bin #7 | 0.7925 | 0.79375 | 0.793125 | 6 | 0.066666667 | 53.33333333 |
| Bin #8 | 0.79375 | 0.795 | 0.794375 | 4 | 0.044444444 | 35.55555556 |
Table 4.
Chi-Square test for normality—basic results.
| Measure Name | Value |
|---|---|
| Chi-Square Stat. | 10.46887622 |
| p-Value | 0.062989006 |
Table 5.
Simulation results of risk and reliability values impacted by changing costs of materials.
| Simulation Number | M MIN Change | M MAX Change | M MIN Value | M MAX Value | (1) | (2) |
|---|---|---|---|---|---|---|
| 1 | −10% | −10% | 154,644.70 PLN | 213 644.70 PLN | 49.9% | 50.1% |
| 2 | −5% | −5% | 164,322.35 PLN | 223 322.35 PLN | 64.7% | 35.3% |
| 3 | 0% | 0% | 174,000.00 PLN | 233,000.00 PLN | 79.3% | 20.7% |
| 4 | 5% | 5% | 183,677.65 PLN | 242,677.65 PLN | 90.5% | 9.5% |
| 5 | 10% | 10% | 193,355.30 PLN | 252,355.30 PLN | 97.6% | 2.4% |
| 6 | −10% | 10% | 154,644.70 PLN | 252,355.30 PLN | 69.3% | 30.7% |
| 7 | −5% | 5% | 164,322.35 PLN | 242,677.65 PLN | 72.7% | 27.3% |
| 8 | 0% | 0% | 174,000.00 PLN | 233,000.00 PLN | 79.3% | 20.7% |
| 9 | 5% | −5% | 183,677.65 PLN | 223,322.35 PLN | 86.7% | 13.3% |
| 10 | 10% | −10% | 193,355.30 PLN | 213,644.70 PLN | 93.7% | 6.3% |
| 11 | 10% | −10% | 193,355.30 PLN | 213,644.70 PLN | 93.7% | 6.3% |
| 12 | 5% | 5% | 183,677.65 PLN | 242,677.65 PLN | 86.7% | 13.3% |
| 13 | 0% | 0% | 174,000.00 PLN | 233,000.00 PLN | 79.3% | 20.7% |
| 14 | −5% | 5% | 164,322.35 PLN | 242,677.65 PLN | 72.7% | 27.3% |
| 15 | −10% | 10% | 154,644.70 PLN | 252,355.30 PLN | 69.3% | 30.7% |
| 16 | 0% | −10% | 174,000.00 PLN | 213,644.70 PLN | 68.9% | 31.1% |
| 17 | 0% | −5% | 174,000.00 PLN | 223,322.35 PLN | 74.8% | 25.2% |
| 18 | 0% | 0% | 174,000.00 PLN | 233,000.00 PLN | 79.3% | 20.7% |
| 19 | 0% | 5% | 174,000.00 PLN | 242,677.65 PLN | 81.9% | 18.1% |
| 20 | 0% | 10% | 174,000.00 PLN | 252,355.30 PLN | 84.3% | 15.7% |
| 21 | −10% | 0% | 154,644.70 PLN | 233,000.00 PLN | 61.5% | 38.5% |
| 22 | −5% | 0% | 164,322.35 PLN | 233,000.00 PLN | 69.8% | 30.2% |
| 23 | 0% | 0% | 174,000.00 PLN | 233,000.00 PLN | 79.3% | 20.7% |
| 24 | 5% | 0% | 183,677.65 PLN | 233,000.00 PLN | 89.0% | 11.0% |
| 25 | 10% | 0% | 193,355.30 PLN | 233,000.00 PLN | 96.6% | 3.4% |
(1) Risk value, (2) Reliability value.
Table 6.
Simulation results of risk and reliability values impacted by changing cost factors (L, M, E).
Table 6.
Simulation results of risk and reliability values impacted by changing cost factors (L, M, E).
| Simulation Number | 1 | 2 | 3 | 4 | (1) | (2) |
|---|---|---|---|---|---|---|
| 26 | L MIN | L MAX | L MIN value | L MAX value | 27.4% | 72.6% |
| −10% | −10% | 35 557.80 PLN | 50 557.80 PLN | |||
| M MIN | M MAX | M MIN value | M MAX value | |||
| −10% | −10% | 154,644.70 PLN | 213 644.70 PLN | |||
| E MIN | E MAX | E MIN value | E MAX value | |||
| −10% | −10% | 15,096.20 PLN | 21 096.20 PLN | |||
| 27 | L MIN | L MAX | L MIN value | L MAX value | 100.0% | 0.0% |
| 10% | 10% | 44,422.00 PLN | 59 442.20 PLN | |||
| M MIN | M MAX | M MIN value | M MAX value | |||
| 10% | 10% | 193,355.30 PLN | 252 355.30 PLN | |||
| E MIN | E MAX | E MIN value | E MAX value | |||
| 10% | 10% | 18,903.80 PLN | 24 903.80 PLN |
(1) Risk value, (2) Reliability value.
© 2020 by the authors. Licensee MDPI, Basel, Switzerland. This article is an open access article distributed under the terms and conditions of the Creative Commons Attribution (CC BY) license (http://creativecommons.org/licenses/by/4.0/).
Share and Cite
MDPI and ACS Style
Górecki, J.; Díaz-Madroñero, M. Who Risks and Wins?—Simulated Cost Variance in Sustainable Construction Projects. Sustainability 2020, 12, 3370. https://doi.org/10.3390/su12083370
AMA Style
Górecki J, Díaz-Madroñero M. Who Risks and Wins?—Simulated Cost Variance in Sustainable Construction Projects. Sustainability. 2020; 12(8):3370. https://doi.org/10.3390/su12083370
Chicago/Turabian StyleGórecki, Jarosław, and Manuel Díaz-Madroñero. 2020. "Who Risks and Wins?—Simulated Cost Variance in Sustainable Construction Projects" Sustainability 12, no. 8: 3370. https://doi.org/10.3390/su12083370
Note that from the first issue of 2016, this journal uses article numbers instead of page numbers. See further details here.