Design and Sensitivity Analysis of Hybrid Photovoltaic-Fuel-Cell-Battery System to Supply a Small Community at Saudi NEOM City


1
Electrical Engineering Department, College of Engineering at Wadi Aldawaser, Prince Sattam Bin Abdulaziz University, Al-Kharj 11911, Saudi Arabia
2
Electrical Engineering Department, Faculty of Engineering, Minia University, Minia 61517, Egypt
3
Systems Engineering Department, King Fahd University of Petroleum & Minerals, Dhahran 31261, Saudi Arabia
*
Authors to whom correspondence should be addressed.
Sustainability 2020, 12(8), 3341; https://doi.org/10.3390/su12083341
Submission received: 17 March 2020
/
Revised: 11 April 2020
/
Accepted: 17 April 2020
/
Published: 20 April 2020
(This article belongs to the Special Issue Smart Renewable Hybrid Energy Systems and Near Zero Energy Districts for Sustainable Urban Development)
Abstract
:This research paper aimed to design and present a sensitivity analysis of a hybrid photovoltaic-fuel-cell-battery (PV/FC/B) system to supply a small community for the recently planned grand city NEOM in Saudi Arabia. The location of the city of NEOM is characterized by a high average level of solar irradiance. The average daily horizontal solar radiation is around 5.85 kWh/m2. A detailed feasibility and techno-economic evaluation of a PV/FC/B hybrid energy system were done to supply a daily load demand of 500 kWh (peak-35 kW). The PV array was the main source to meet the load demand. During the surplus periods, the battery was charged using extra energy and powered the electrolyzer for hydrogen production. The produced hydrogen was stored for later use. During the deficit periods, the FC and/or battery supported the PV array to meet the load demand. Two benchmarks, the cost of energy (COE) and net present cost (NPC), were used to identify the best size of the PV/FC/B system. Variation of the tilt angle of the PV array and the derating factor were considered to determine the effect of the performance of the PV/FC/B system’s COE and NPC. The main findings confirmed that a 200 kW PV array, 40 kW FC, 96 batteries, 50 kW converter, 110 kW electrolyzer, and 50 kg hydrogen tank was the best option to supply the load demand. The values of total NPC and COE were $500,823 and $0.126/kWh. The annual excess energy was very sensitive to the declination angle of the PV array. The minimum annual excess energy was achieved at an angle of 30 degrees. It decreased by 75.7% and by 60.6% compared to a horizontal surface and 50 degrees of declination, respectively. To prove the viability of the proposed system, a comparison with grid extension along with a diesel generation system was carried out.
1. Introduction
Electricity demand is increasing very fast because of the increasing rate of energy consumption, the growth rate of the population, and industrial development. The major part of electricity generation is based on conventional sources such as coal, natural gas, and petroleum oil [1]. The use of conventional sources for electricity generation contributes greenhouse gasses, which led to more environmental issues in recent years. Alternatively, the awareness of renewable energy sources and its usages were significantly increased in the last two decades in most of the countries [2]. Solar and wind energies are the leading renewable energy sources among various types and better alternatives to conventional energy sources. These two energy sources received more attention in stand-alone as well as grid-connected power systems [3]. Renewable energy sources provide energy that is environmentally friendly and free from the overall emission of greenhouse gasses. Further, energy generation using renewable sources minimizes fossil fuel consumption, which is essential for the upcoming generations. Solar- and wind-energy-based power generation are the cost-effective choices among the renewable energy sources to supply power to remote communities compared to the grid supply [4,5]. Unfortunately, the wind source alone may not be technically feasible in low wind speed areas [6]. Solar is considered to be better when compared to wind energy to provide power in remote areas due to low maintenance requirements [7,8,9]. However, solar irradiance is seasonal, and meeting power demand throughout the year may be difficult sometimes. A hybrid energy system, including different energy sources with an energy storage element (i.e., capacitors, hydrogen, batteries) are a better choice in a stand-alone system [10,11]. The energy storage element is also prepared for stable and continuous power supply, which is usually part of renewable energy power generation [12].
In recent years, the research on various aspects of the hybrid energy system has been carried out, and constructive results were obtained. In reference [13], a photovoltaic-fuel-cell-battery-based hybrid system was studied with an optimized model that guarantees reliable operation with a minimum running cost. A hybrid wind/PV micro-grid system was designed to minimize the annualized cost, loss of load, and loss of energy using the particle swarm optimization algorithm [14]. A hybrid system design, which includes PV/diesel/battery, was proposed with continuous and ON/OFF operation modes [15]. In this study, the fuel consumption by the diesel generator and non-linearity of the load variation was taken into consideration. The techno-economic feasibility of a hybrid energy system model was studied in reference [16]. The hybrid system included a diesel generator, biogas generator, wind turbines, PV modules, and a battery. The study was carried out using the HOMER software [17]. The results of this study confirmed that the designed model was found to be a better option to provide electricity to a remote community economically and to reduce CO2 emissions. The feasibility of implementing a stand-alone PV system to provide electricity to a specific island was investigated in reference [18] based on the interest rate, load size, and diesel price. A detailed survey of the HOMER software tool for the design of hybrid energy systems was given in reference [19]. Belmili et al. [20] recommended the loss of power supply probability algorithm for the sizing of a hybrid system using PV/wind. Ma et al. [21] confirmed that a PV/wind/battery-based hybrid energy system would be a better alternative to an existing diesel generator system based on the economic point of view. The lead-acid battery is considered as a storage media in various hybrid energy systems [22,23,24,25]. Moreover, the stand-alone hybrid power system is considered an important option for providing electric power to remote communities all over the world.
Optimal sizing of stand-alone hybrid power generation systems is an important part of the system design, which helps to make a cost-effective and reliable system. Suppose, if the system is oversized, it can support an additional load, but the system will not be efficient by considering economic factors. On the other hand, if the system is undersized, then it will be better from the economic point of view, but it will not perform efficiently at load. Thus, optimal sizing is essential to balance the various factors and improve the overall system efficiency. There are different types of optimization methods that are recommended by various studies to determine the size of the stand-alone hybrid systems optimally. Among the various optimization methods, the genetic algorithm [26,27], particle swarm optimization [28], tabu search [29], and mixed integer nonlinear programming [30] are the most used for hybrid systems optimization. In hybrid system size optimization, the minimum system cost is the most common and important objective; some other objectives like environmental and technical requirements are also incorporated in the optimization. There are some research studies in which multi-objective functions such as cost, environmental, and technical factors are also considered in the design part [31,32].
The main objective of this paper is to present an optimal design, sensitivity analysis, and detailed feasibility and techno-economic evaluation of a hybrid photovoltaic-fuel-cell-battery (PV/FC/B) system to supply a small community in the city of NEOM (Saudi Arabia). A PV system was used as a key energy source to feed the load demand. During the surplus times, the extra electrical energy was used to recharge the battery and feed the electrolyzer for hydrogen production. The produced hydrogen was stored for later use. During the deficit times, the FC and/or battery supported the PV system to supply the required demand. HOMER software was used for modeling and optimization of the PV/FC/B system. Two benchmarks, the net present cost (NPC) and the cost of energy (COE), were considered to identify the best size of the PV/FC/B system. Variation of the tilt angle of the PV array and the derating factor were considered to measure the effect on the PV/FC/B system’s COE and NPC. Also, a comparison with a grid extension and diesel generation system was done to demonstrate the effectiveness and economics of the proposed system.
Finally, the outcome of the current research will help the policymakers at the local, regional, and national levels in Saudi Arabia and in the region in developing and integrating effective policy strategies to quickly achieve strong penetration of a renewable energy system. This will help the policymakers to explore the use of renewable-energy-powered remote areas as a key enabler for continuous economic growth, market opportunities, and the development of sustainable electrical energy.
2. Location of the Case Study and Load Demand
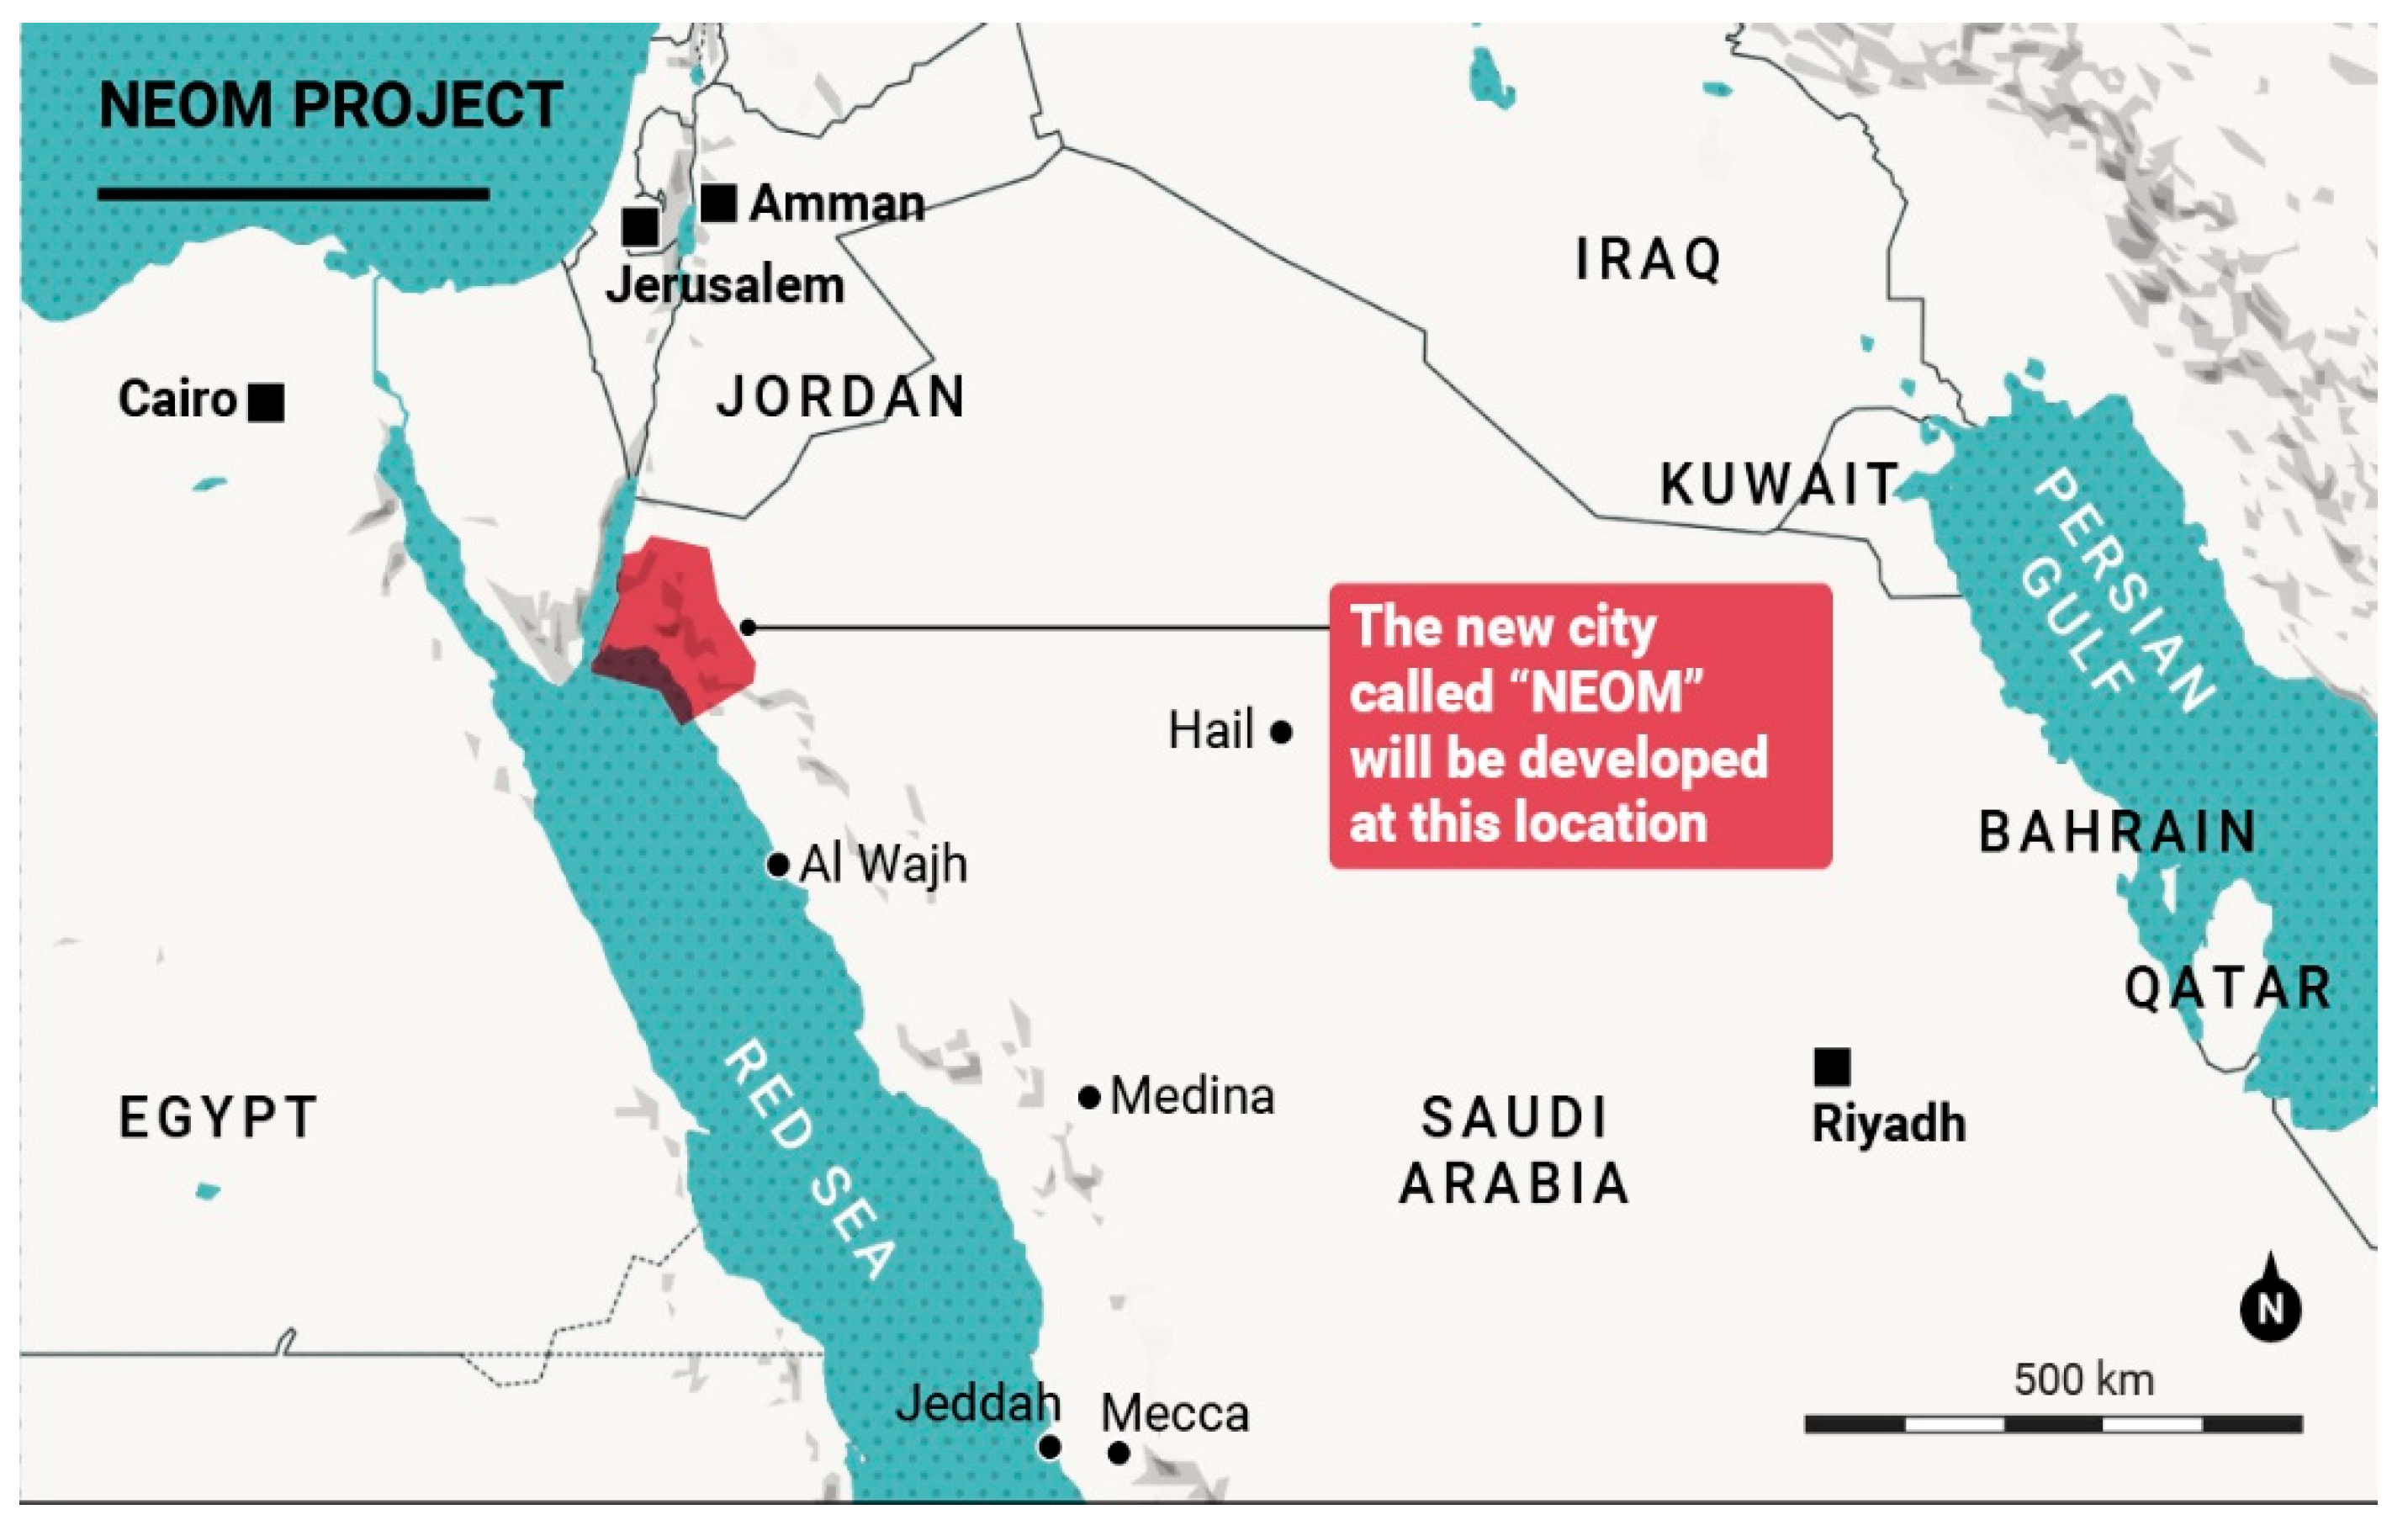
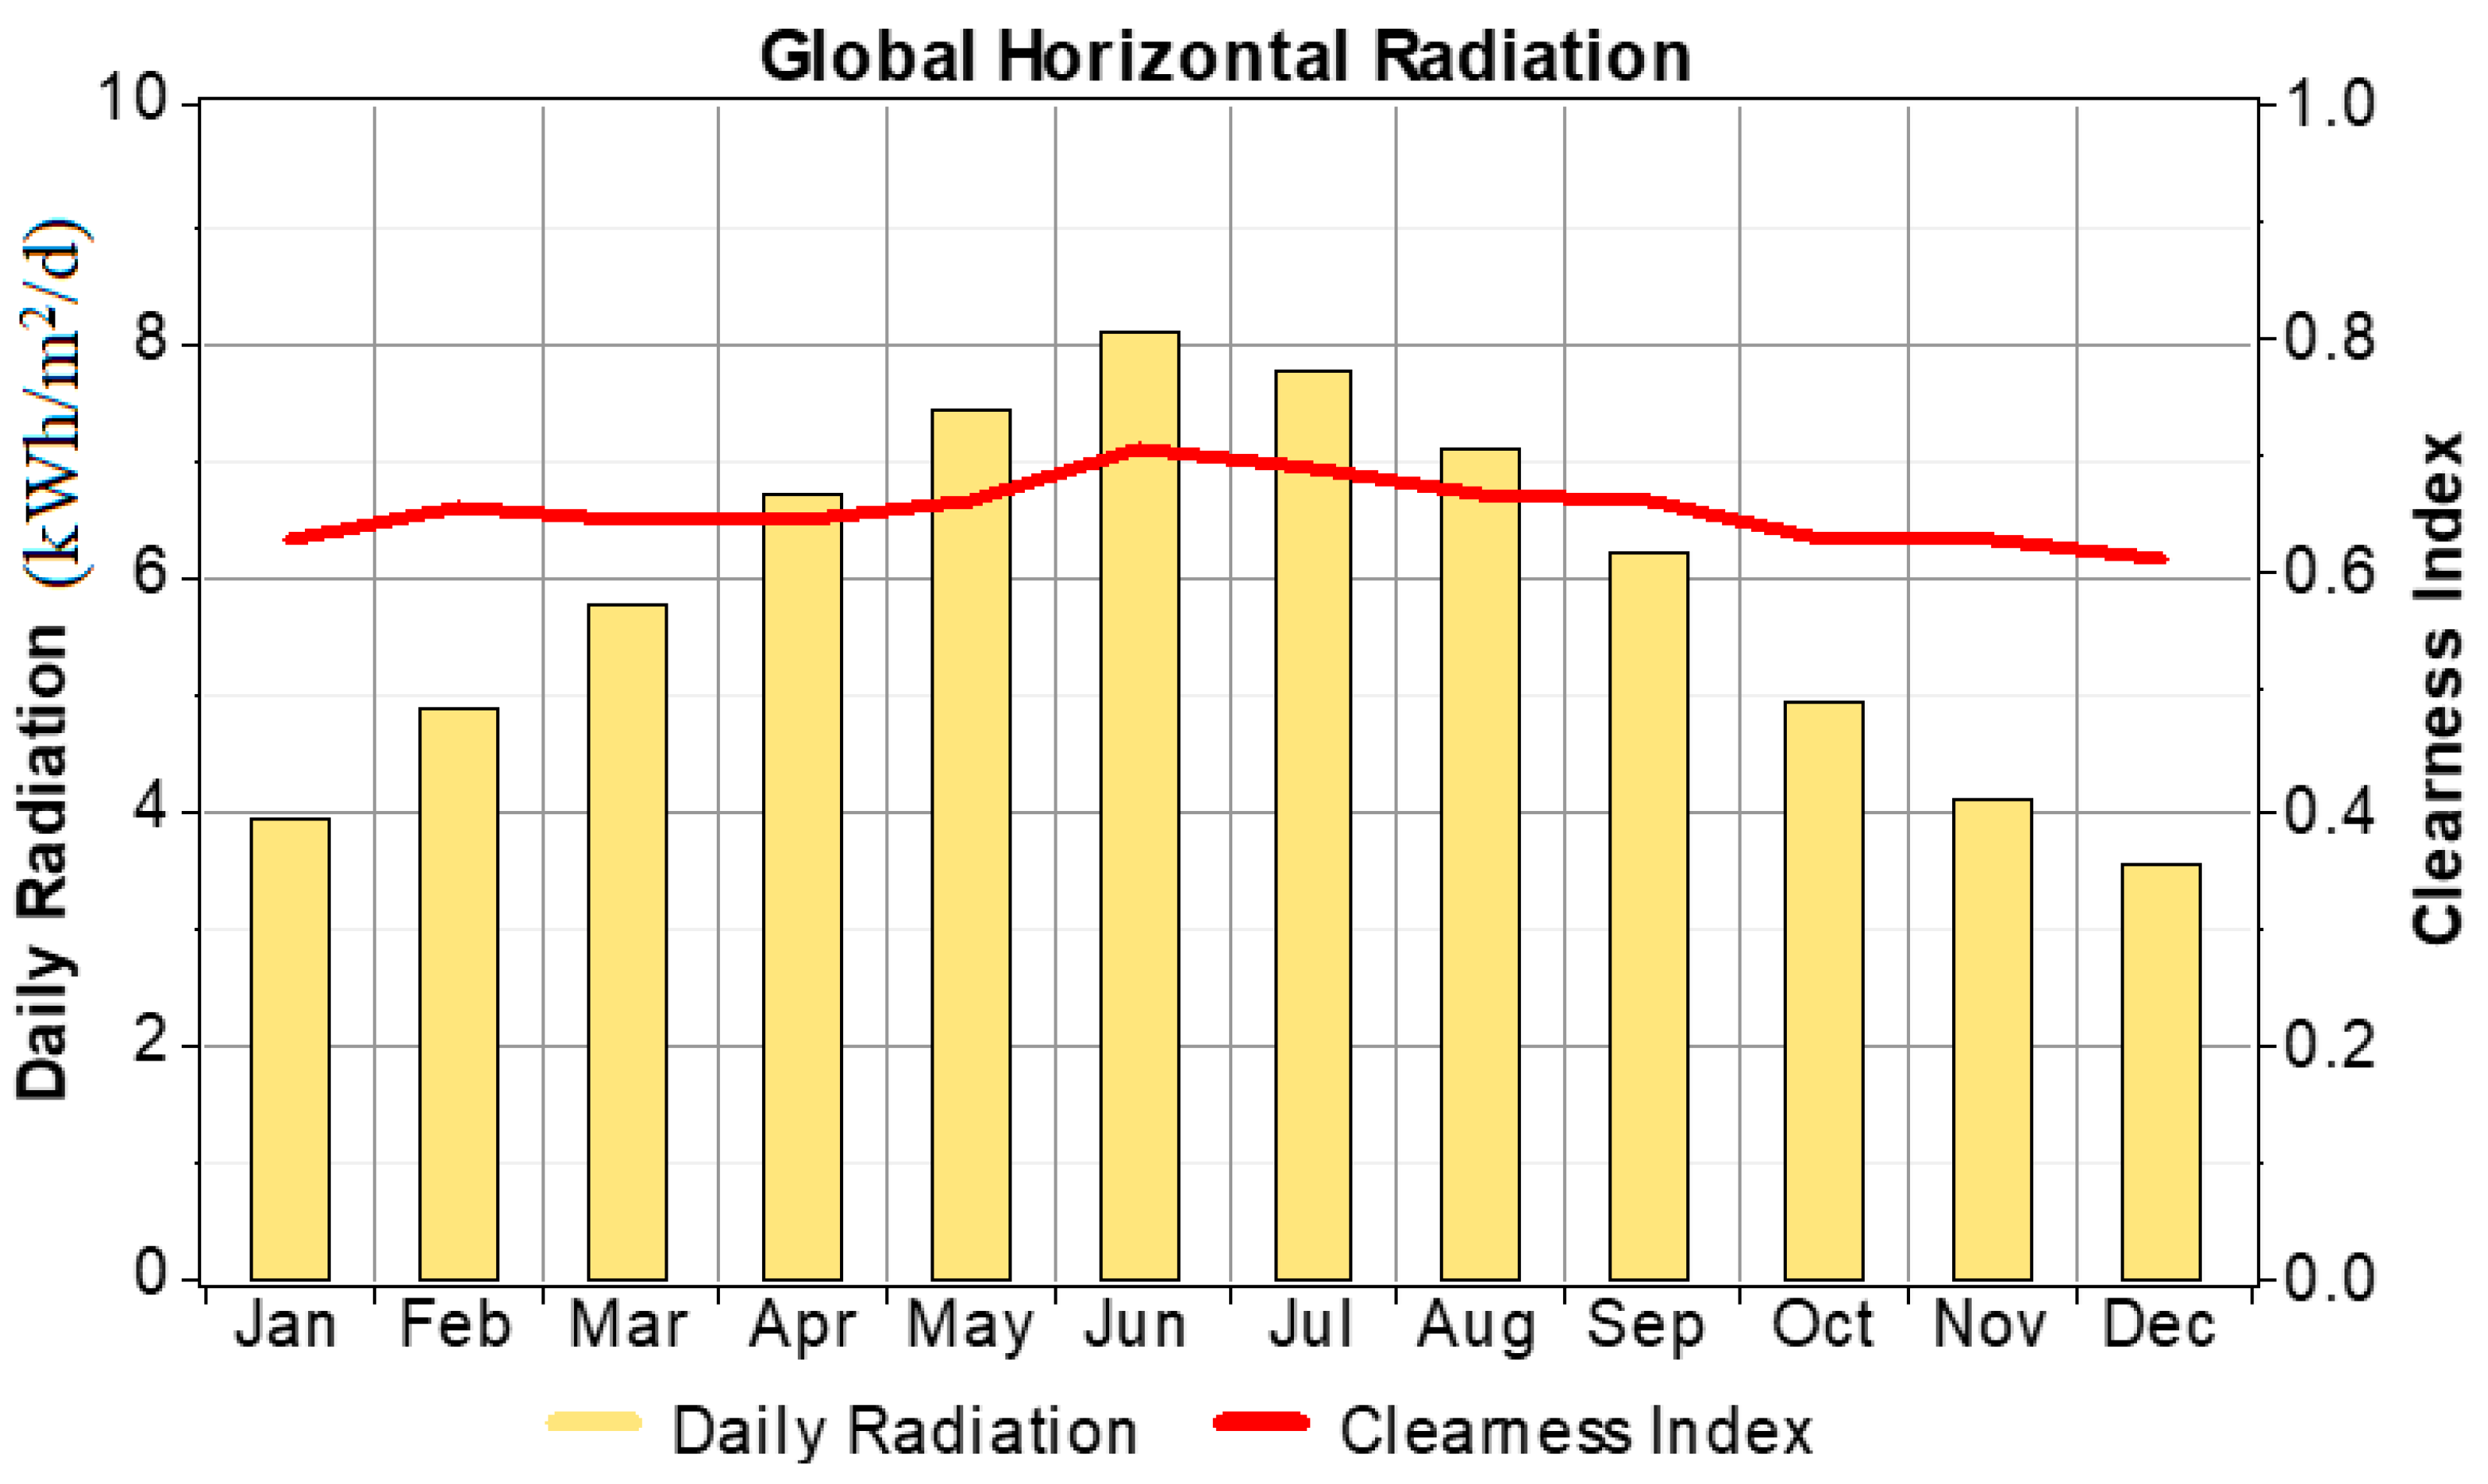
A small community in the city of NEOM (Saudi Arabia) was chosen as a case study. It is situated at the latitude of 29° N and longitude of 35° E, as shown in Figure 1. NEOM is located far away from the nearest utility grid connection point. The location of NEOM is characterized by a high average level of solar irradiance. The average daily horizontal solar radiation is around 5.85 kWh/m2. The mean daily solar radiation and clearance index during the year are shown in Figure 2 [33]. The highest daily irradiance value of 8.085 kWh/m2/d is collected in June. Whereas, the least daily irradiance of 3.542 kWh/m2/d is received in December. Figure 3 displays the profile of load demand. The daily load demand is 500 kWh, with a peak of 35 kW. The average peak and load factors are 20.8 kW and 0.296 respectively.
3. Description of Different Components of the System
3.1. Photovoltaic Array
The performance characteristics of the PV array significantly vary due to the different environmental conditions and operating conditions [35,36]. The PV array output power varies depending on the solar irradiation level and ambient temperature [37]. The temperature coefficient of the PV array affects the annual output energy. In this context, the PV array output power can be calculated on an hourly basis by using Equation (1) [38].
where CPV is the PV array rated capacity (kW), DPV is the derating factor (%), Is is solar irradiation at normal test conditions (kW/m2), IT is the solar irradiation incident on PV array in kW/m2, αp is the temperature coefficient of power Ts is the temperature of the PV cell under normal test conditions (°C), Tc is the temperature of the PV cell in °C.
where UL is the co-efficient of heat transfer to the surroundings, τα is the effective transmittance–absorptance of the PV array, ηPV is the panel efficiency, and Ta is the ambient temperature.
The above equation can be rewritten as
In the above equation, the value of can be obtained using the manufacturer specification based on the nominal operating cell temperature (NOCT). Equation (3) can be rewritten as
Therefore, the final PV cell temperature can be obtained from the following expression, whereby HOMER, the value of (τα) is considered 0.9,
For the case study, during the simulation process, the following parameters are considered: polycrystalline solar cell type [39]; the size of PV ranges from 150 kW to 400 kW; the capital cost is $1000/kW and equal to the replacement cost. Annual O&M cost is $5; the lifetime is 25 years; Derating factor is varied from 50 to 90; the slope of PV array is varied from 0.0 degree to 80.0 degrees; temperature coefficient of power is −0.477%/°C; the nominal operating cell temperature is 46 °C; the efficiency at stand red test condition is 14.76%.
In this study, the effects of the variation of the derating factor and PV tilt angle on the cost of energy were considered. The PV derating factor represents a scaling factor that applies to PV system power output to account for reduced output in practical case compared to the conditions under which the PV panel was rated. Such factor is employed for accounting soiling of PV modules, wiring losses, partial shading, aging, and so on. Therefore, it is very important to study the effect of the derating factor on the cost of energy.
Regarding the variation of PV array tilt angle, it is very common that the best tilt angle is the latitude angle of geographical location when the PV system is connected grid. The grid will receive the surplus of energy from PV system. However, the situation sometimes different in case of stand-alone system because this mainly depends on the load profile across the year. In case of stand-alone system, the main target is to supply the load with minimum cost of energy and minimum excess of energy. Large excess energy means the system is oversized. For example, in stand-alone PV system that used to pump water in Egypt [40], it is proved that PV modules were not recommended to be tilted by the site’s latitude angle. This case never achieves the maximum power in summer seasons compared with the other cases. Accordingly, with stand-alone systems, it is good to evaluate the effect of PV array tilt angle variation on the cost of energy and excess energy.
3.2. Fuel Cell
In this study, the proton exchange membrane FC was considered [41]. Based on the energy conversion law and molar conversion principle, the semi-empirical model of the FC was established. The energy balance equation of the FC stack was derived by considering six main components, namely the energy input gases Ein, the energy output gases Eout, input fuel energy from electrochemical reactions Efuel, the electrical energy Eelec, the energy removed by coolant water Ecl, and the heat loss to the surroundings Eloss [42,43]. The energy balance equation is expressed as follows;
where Ms is the mass of the FC stack, Cs is the specific heat of the FC stack. Based on the electrochemical reaction, the sum fuel energy can be expressed as
where ΔH is the enthalpy of hydrogen, NH2,ar is considered the molar flow rate of the reacted hydrogen in the anode, which is expressed as
where F is the Faraday’s constant, n is the cell number, and Is is the fuel cell stack current. Based on Equation (6), the gases input energy is calculated as
where Nw,ai and Nw,ci are the input water vapor molar flow rates into the stack from anode and cathode, respectively. the molar flow rate of the input air in the cathode, Tai denotes the temperature of the input gas from the anode, Tci denotes the temperature of the input gas from the cathode, T0 represents the ambient temperature (25 °C). The input water vapor molar flow rates from anode and cathode are also influenced by gas pressure and gas flow rate from anode and cathode [44].
where Ps denotes the saturated partial pressure of water vapor. By using the input and output gas flow rates, the energy of the output gases can be calculated as [45]
where Ts,out represents the outlet temperature of the FC stack. The flow rates of the vapor molar out of the stack under saturation condition are expressed as
The water generated in the cathode can be expressed as
Based on Equation (9), the electrical energy of the fuel cell stack is estimated as follows
The heat absorbed by the coolant can be estimated as
where Wcl is the volume flow rate of the coolant, and ρw is the density of the water. The heat loss of the fuel cell stack is expressed as
where hs is the heat transfer coefficient between FC stack and the air, and S is the stack superficial area.
For the case study, the following parameters for FC are used: the size of FC is varied from 30 kW to 60 kW; the capital and replacement cost are $500/kW; the hourly O&M is 0.02%; the lifetime is 40,000 operating hours [46].
3.3. Electrolyzer
The electrolyzer system (I-V) characteristics curve is the most important factor of the electrolyzer performance, which is based on the water temperature, the input current, and its internal resistance. The I-V equation has a Nernst voltage VNernst, an ohmic potential VOhmic, and an activation overvoltage VAct, which equated as
The above equation can be re-written as
where T denotes the temperature (k) of electrolyzer cell, R denotes the normalized gas constant (8.314 × 10⁻³ Kj/K.mol), αa and αc are the coefficients of charge transfer at the anode and the cathode sides, iαa and iαc are exchange current density related to the anode and the cathode sides, and F denotes Faraday’s constant (96,485 mol/C), Nele is the number of series cells of electrolyzer, σ is the cell thickness (µm), Iele is the current of electrolyzer.
For the case study, the following parameters for electrolyzer are considered: the size of the electrolyzer is varied from 50 kW to 150 kW; the capital and replacement costs are $300/kW; the lifetime is 25 years; the efficiency is 85%.
3.4. Hydrogen Tank
The hydrogen tank stores the produced hydrogen by the electrolyzer during the surplus periods [47]. For the case study, the following parameters for the tank are considered: the size of the tank is varied from 10 kg to 100 kg; the capital is $200/kg; the lifetime is 25 years.
3.5. Battery
The battery bank is one of the vital storage elements in the hybrid renewable energy system which is used to store and discharge the dc electricity effectively to meet out the load demand. The battery model includes the key properties of the battery such as nominal voltage, round-trip efficiency, capacity curve, minimum state of charge, and lifetime curve. HOMER also tracks all these properties of the battery using various techniques and provides useful information to achieve a high degree of efficiency in the energy storage. The lifetime of the battery bank in years can be estimated based on the following expression
where NBatt represents the total number of batteries in the battery bank, QLt represents the lifetime throughput of a single battery in the battery bank (kWh), Qthpt represents the annual throughput of the battery bank, and LBatt,f represents the float life of the battery. In the case of battery bank, no cost related to operating battery bank, therefore the fixed cost of energy is considered to be zero. For the case of the marginal cost of energy, the total wear cost and the energy cost of the battery are considered. The battery wear cost can be estimated using the following expression
where Crp represents the battery bank replacement cost and ηrt represents the round-trip efficiency. The battery energy cost for each hour of simulation is calculated by dividing the total year-to-date cost of battery bank charging by the total year-to-date amount of energy supplied to the battery bank.
For the case study, the following parameters for battery are considered: the battery type is Trojan L165P; the nominal voltage is 6 volt; the nominal capacity is 360 Ah (2.16 kWh); the lifetime throughput is 1075 kWh; batteries per string are 32; the number of strings is varied from 1 to 6 strings; the capital and replacement costs of battery are $175 [47]; the annual O&M cost is $5.
3.6. Converter
The converter is required for PV/FC/B system in which dc components serve an ac load. For the case study, the following parameters for converter are used: the size of the converter varies from 20 kW to 100 kW; the capital and replacement costs are $500/kW; the lifetime is 15 years; the efficiency is 90%.
4. Assessment Criterion
In order to identify the best size of the PV/FC/B system, two assessment criteria, the net present cost and cost of energy, are used. The NPC was estimated by considering the initial cost, replacement cost, O&M cost, and salvage throughout the lifespan of the project. The following expression can be used to estimate NPC [47]:
where t denotes project lifespan, Ctotal: total yearly cost, i denotes annual interest rate (%), and CRF is capital recovery factor. The annual interest rate can be calculated by the following relation:
where denotes the nominal interest rate and f is yearly inflation rate. The CRF can be expressed as follows:
where n denotes lifespan of the project (25 years).
The COE can be calculated by the following relation [40]:
where Etotal denotes yearly produced electrical energy (kWh), Cann_total denotes the annual costs system.
5. Results and Discussion
This section presents the detailed feasibility and techno-economic evaluation of PV/FC/B to supply daily load demand of 500 kWh with a maximum value of 35 kW. Variation of the tilt angle of the PV array and the derating factor were considered to evaluate the performance of the PV/FC/B system. The obtained results showed that 200 kW PV array, 40 kW FC, 96 batteries, 50 kW converter, 110 kW electrolyzer, and 50 kg hydrogen tank was the best option to supply the load demand. The values of the NPC and COE were $500,823 and $0.126/kWh, respectively. The optimal size and related costs with varying the tilt angle of the PV array and the PV derating factor (%) are displayed in Table 1. The derating factor of 90% is used when varying the tilt angle of the PV array and the PV derating factor the tilt angle is kept constant (30 degrees).
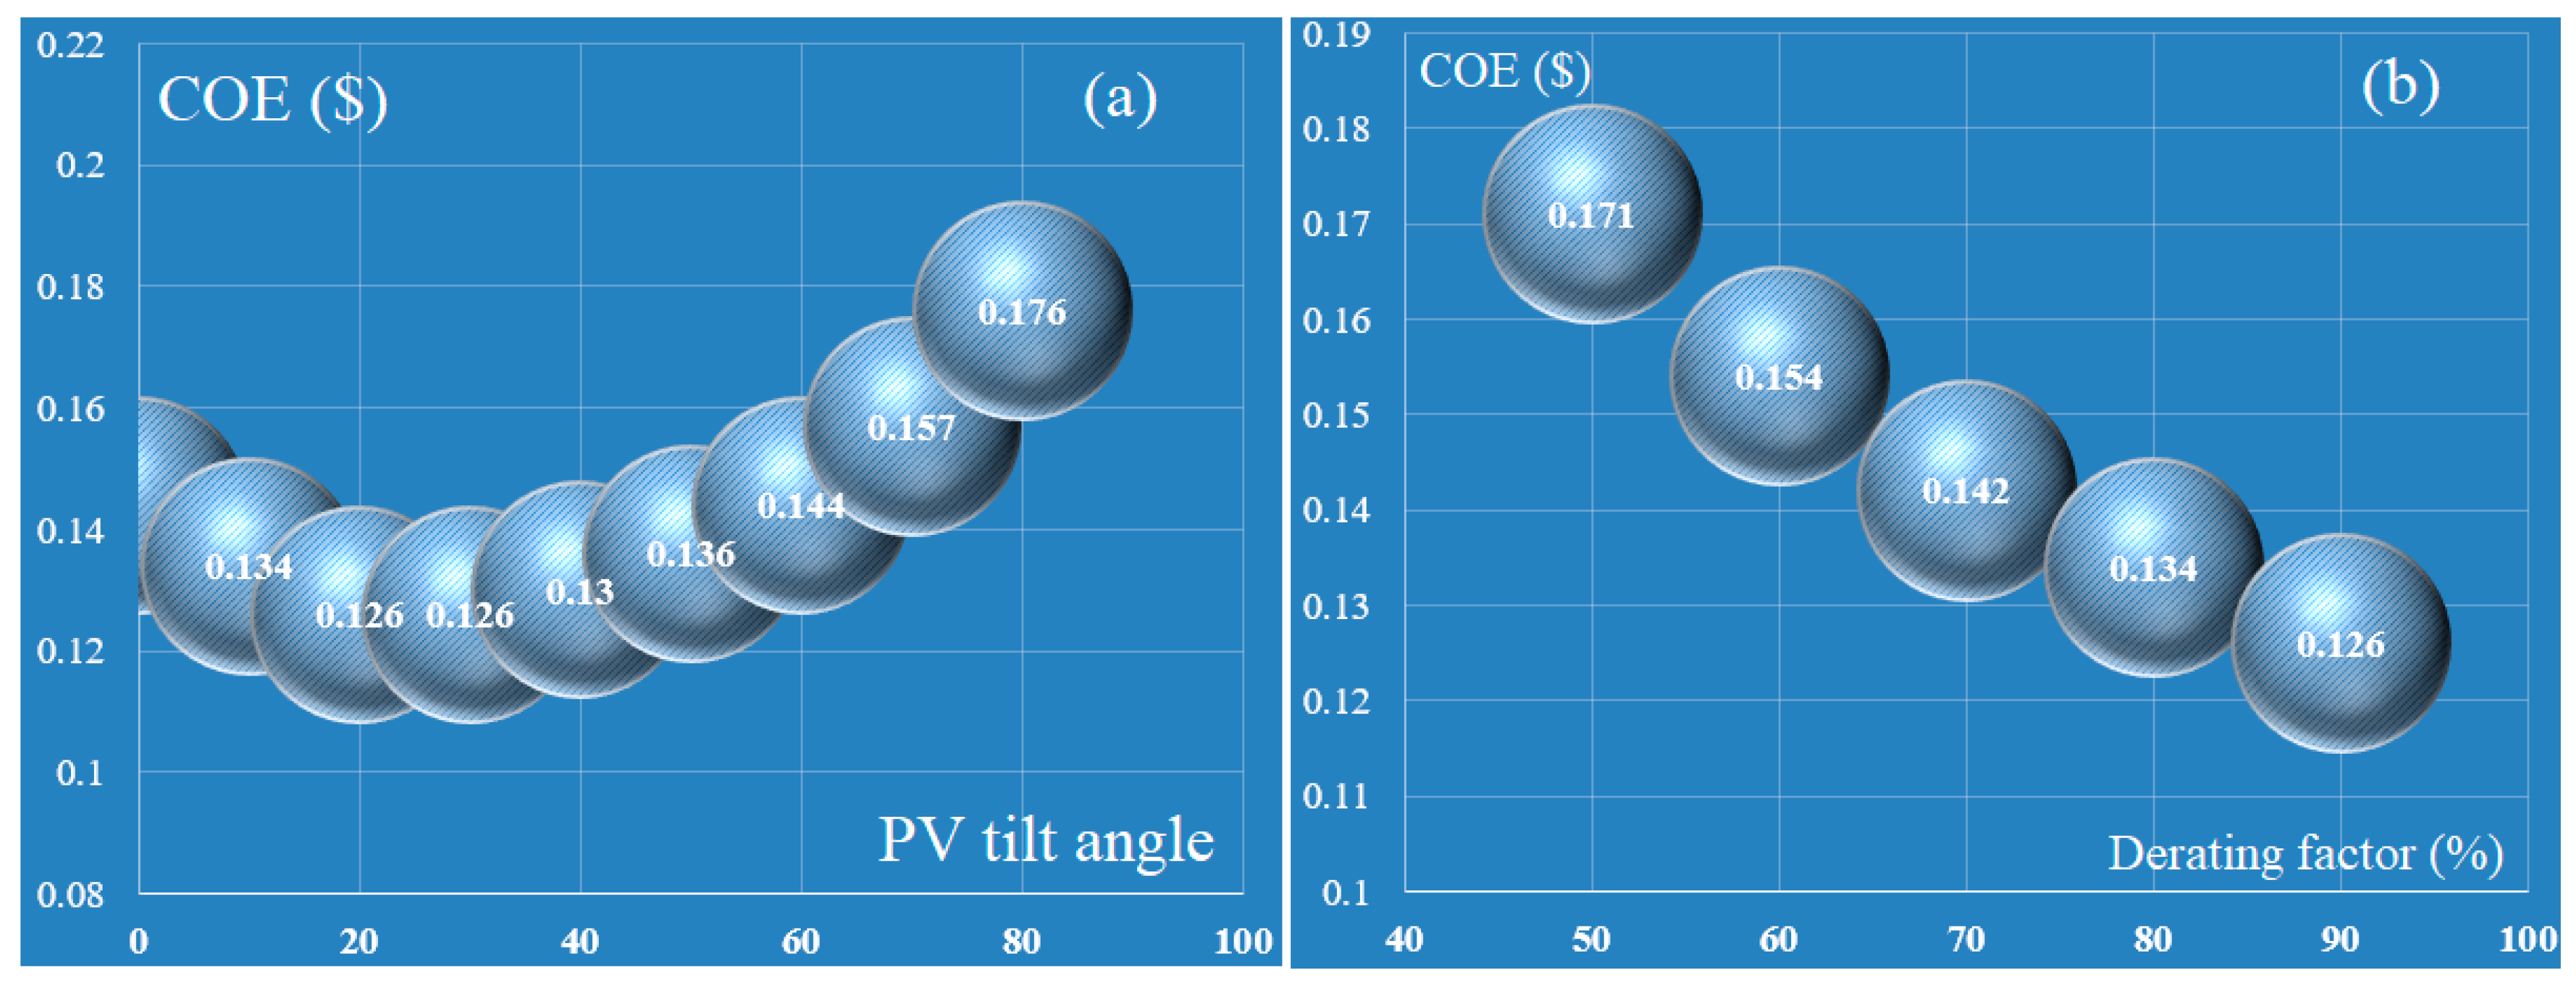
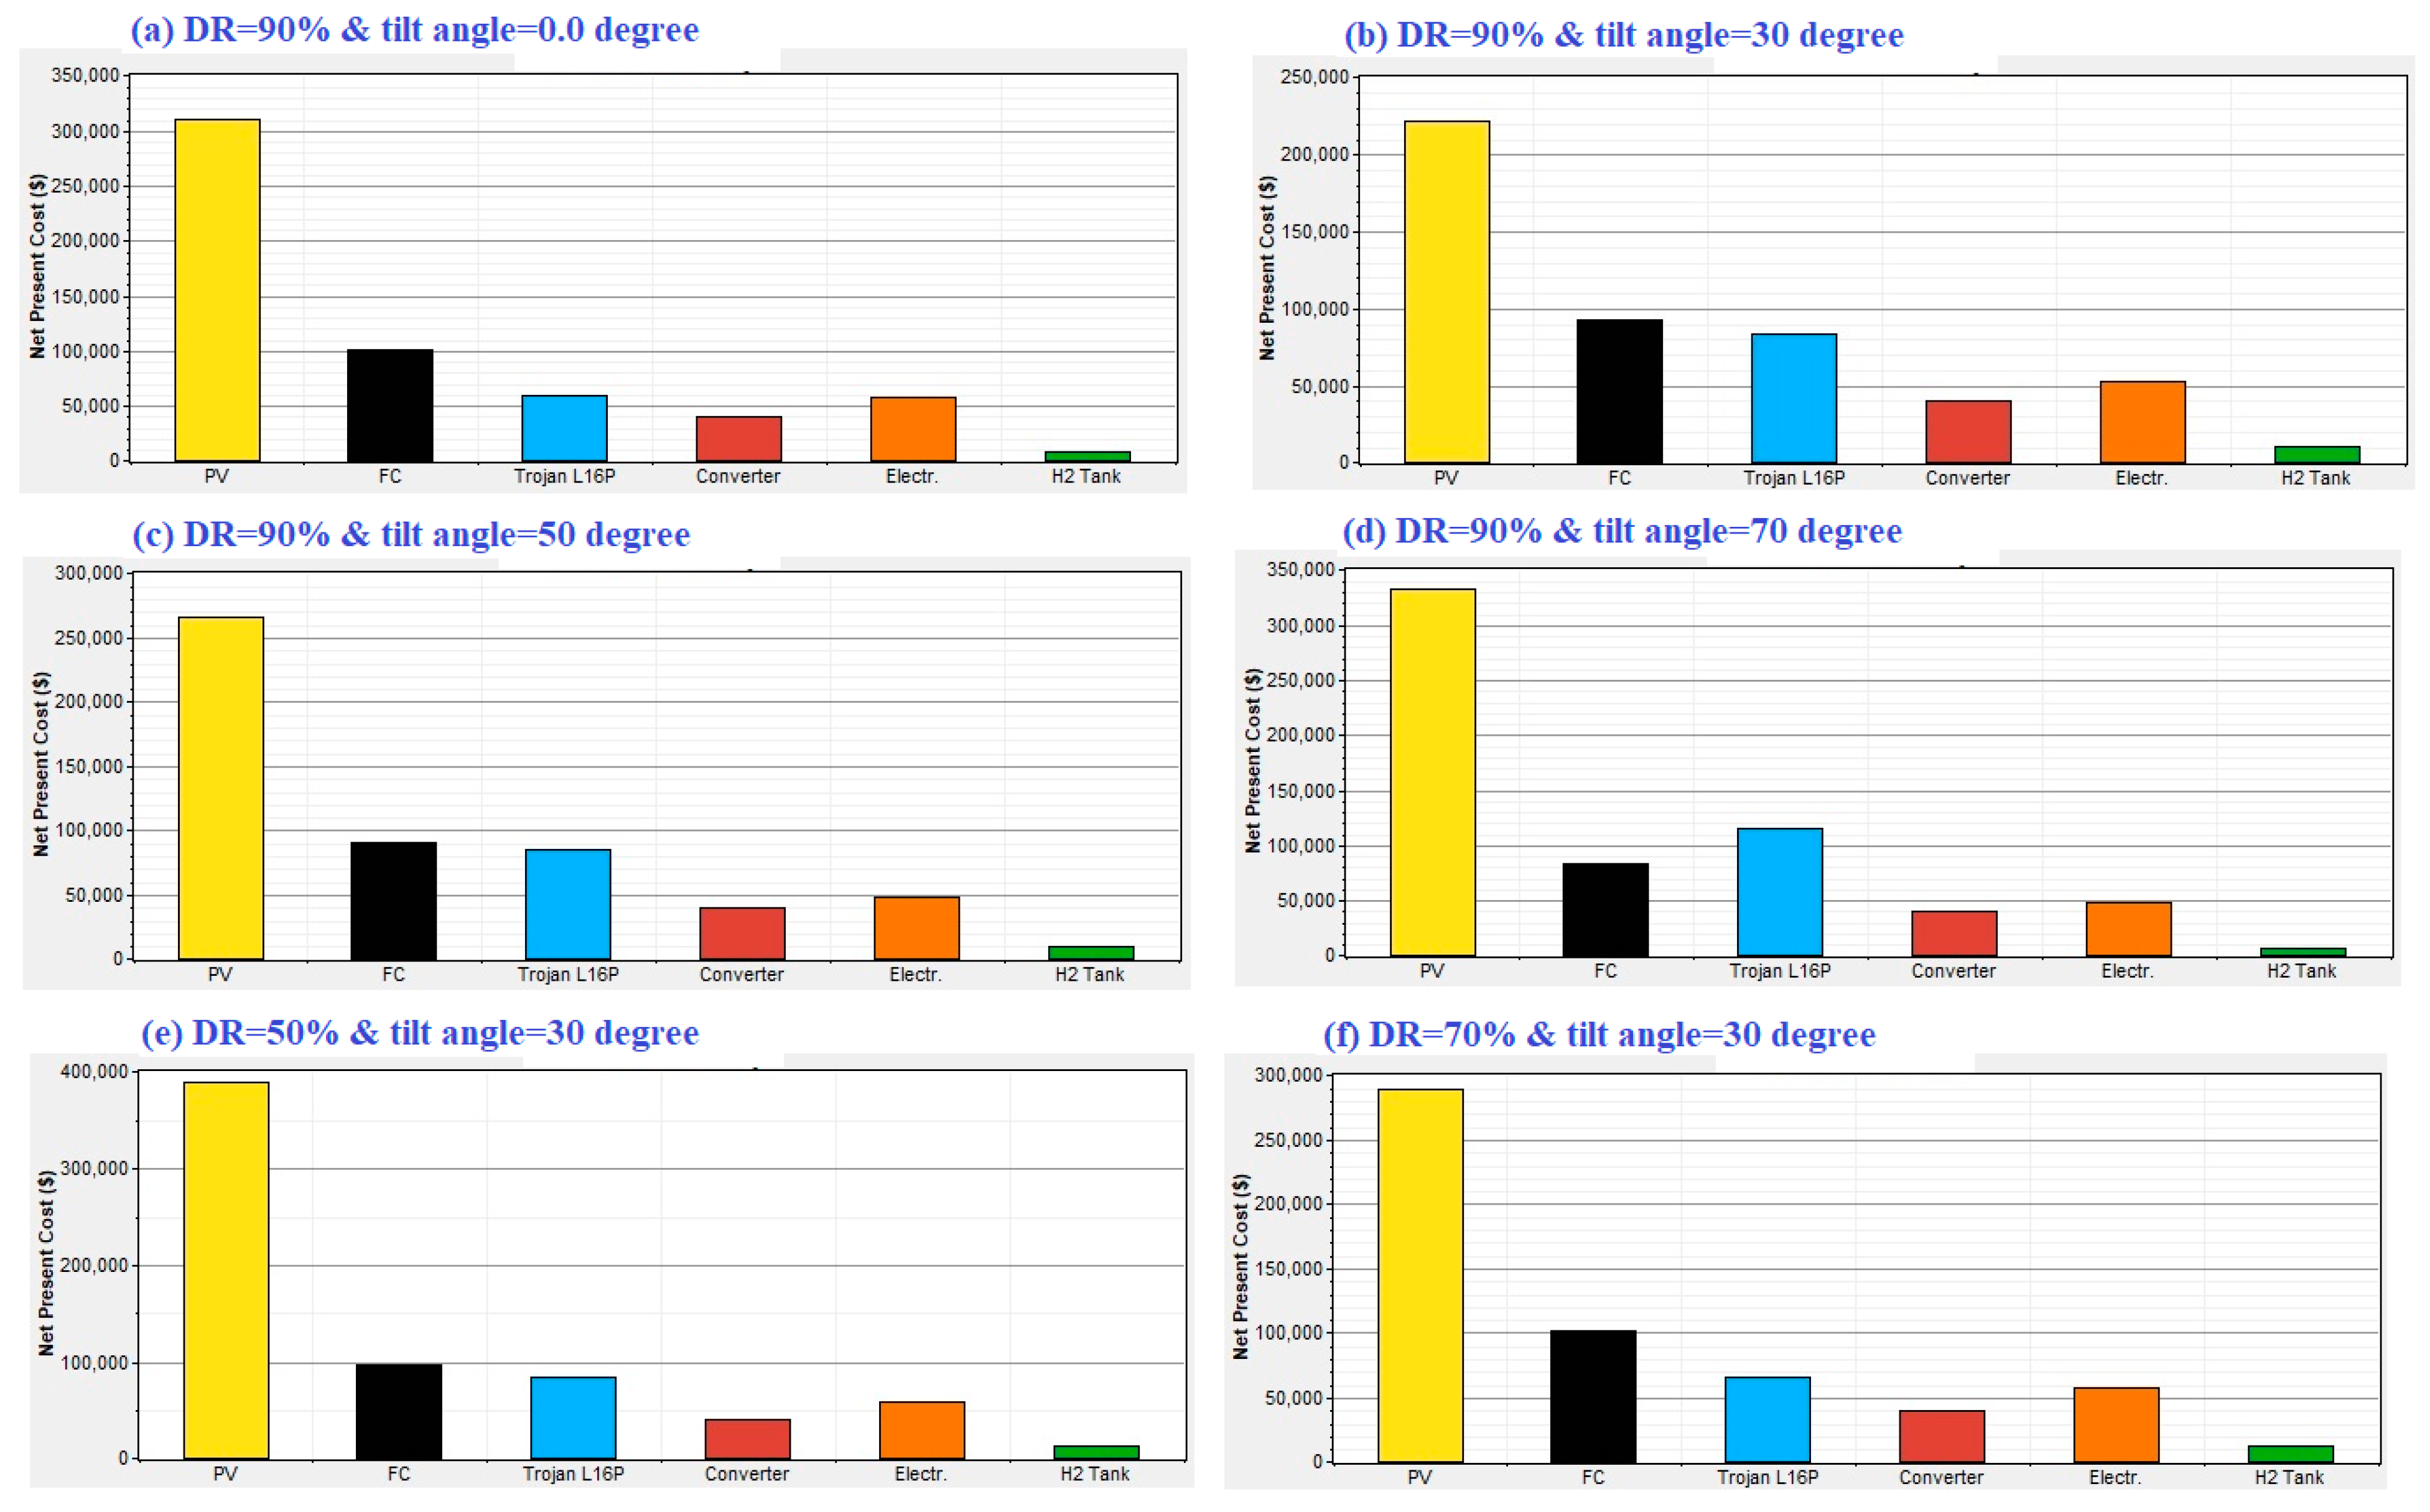
The effects of varying the tilt angle of the PV array and the derating factor on the cost of energy are shown in Figure 4. It can be concluded that maximum and minimum COE values were 0.176 $/kWh and 0.126 $/kWh, respectively, for 80 degrees and 30 degrees. Also, the COE decreased from 0.171 $/kWh to 0.126 $/kWh with increasing the derating factor, as shown in Figure 4b. Table 2 displays the detailed related costs of different components of the PV/FC/B system with a varying tilt angle of the PV array and derating factor. The total NPC for different system components is shown in Figure 5.
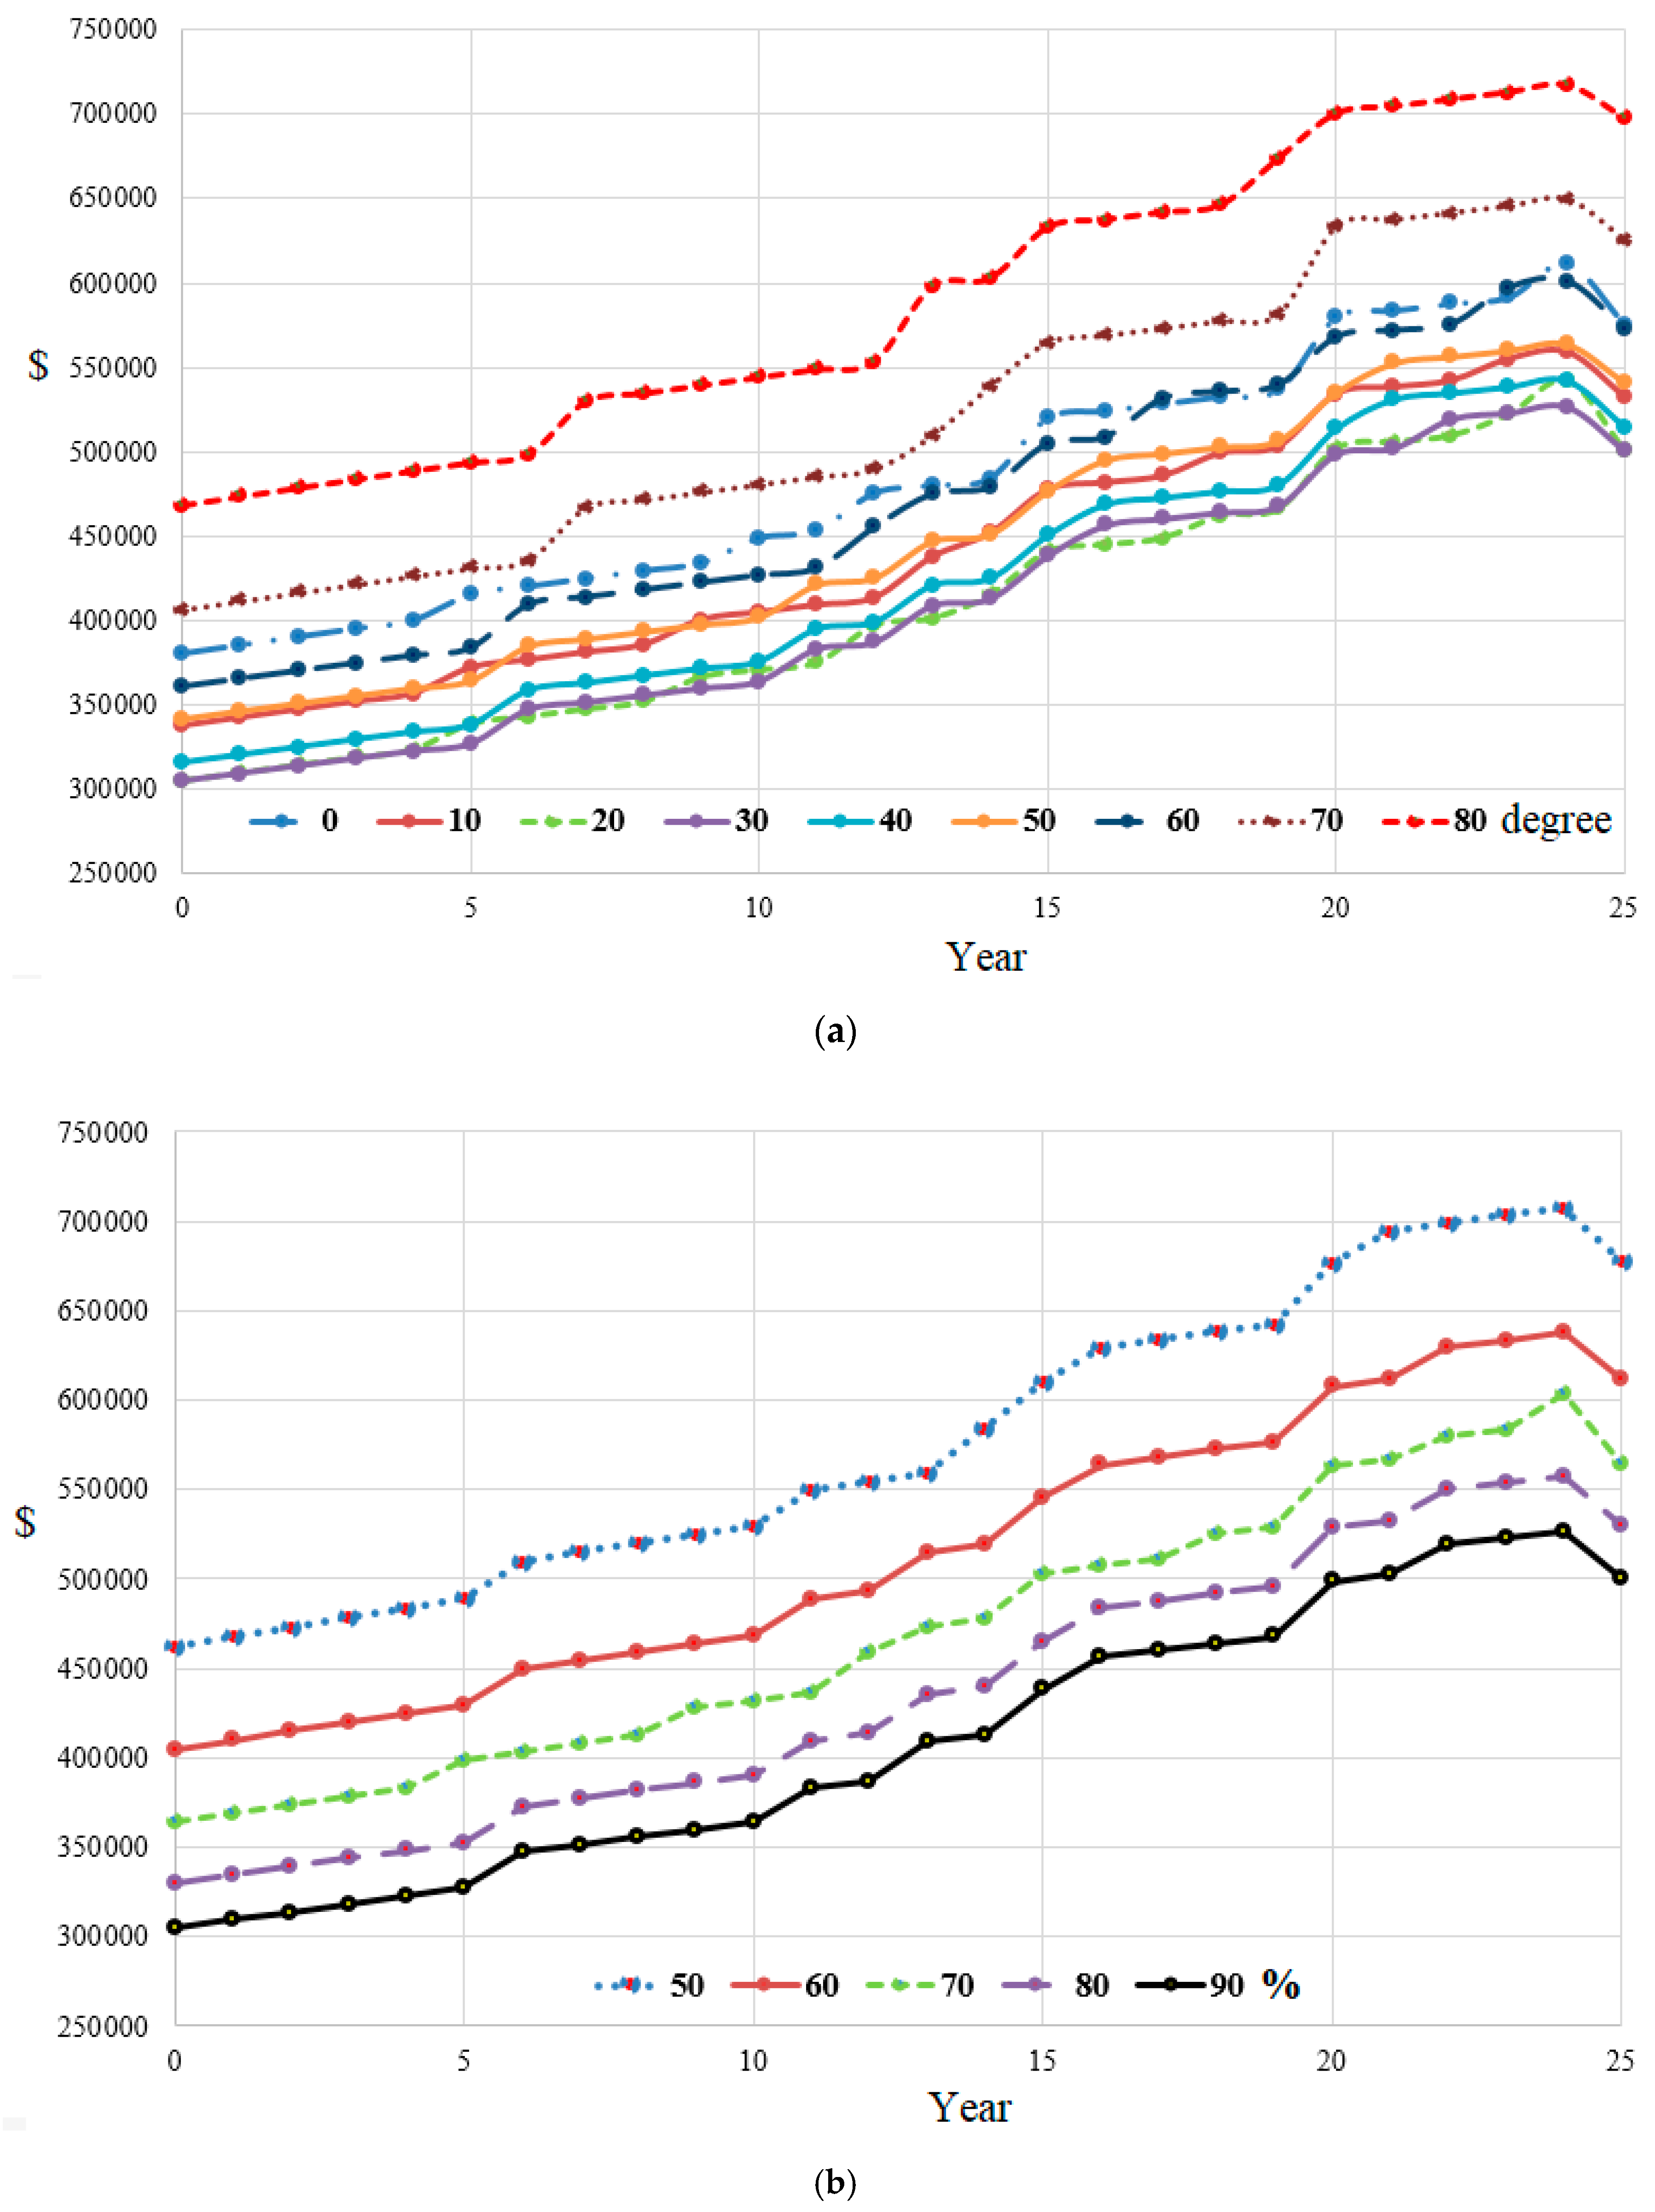
The discounted cash flows related to the PV/FC/B system with varying tilt angles of the PV array and derating factor are demonstrated in Figure 6. As illustrated in Figure 6a, the lowermost capital cost was attained with a tilt angle of 30 degrees thanks to the small required number of PV panels. The capital cost values were $380,200, $341,800, and $468,500, respectively, for horizontal, 50 degrees, and 80 degrees of declination. The total NPC of PV/FC/B decreased sharply from $677,895 to $500,823 with increasing the derating factor, as illustrated in Figure 6b.
Under the condition of using the best size of the PV/FC/B system, the total yearly generated energy was 478,681 kWh. A majority—82% (392,281 kWh)—of the total produced energy was delivered by the PV system, and the remainder (86,400 kWh) was powered by FC. With this configuration, the total yearly energy consumption was 420,726 kWh. The ac load demand consumed around 43% (179,986 kWh) of the total consumed energy, while the other portion, 57% (240,740 kWh), was used to feed the electrolyzer for the generation of hydrogen. The annual surplus energy was almost 34,776 kWh (7.27%). This surplus could be used for lighting and other not considered loads, whereas the annual unmet load and capacity shortage were 2514 kWh and 3777 kWh, respectively. From Table 3, the annual excess energy is very sensitive to the declination angle of the PV array. The minimum annual excess energy was achieved at an angle of 30 degrees. It decreased by 75.7% and by 60.6% compared to a horizontal surface and 50 degrees of declination. Table 4 illustrates the detailed performance of different components of PV/FC/B systems.
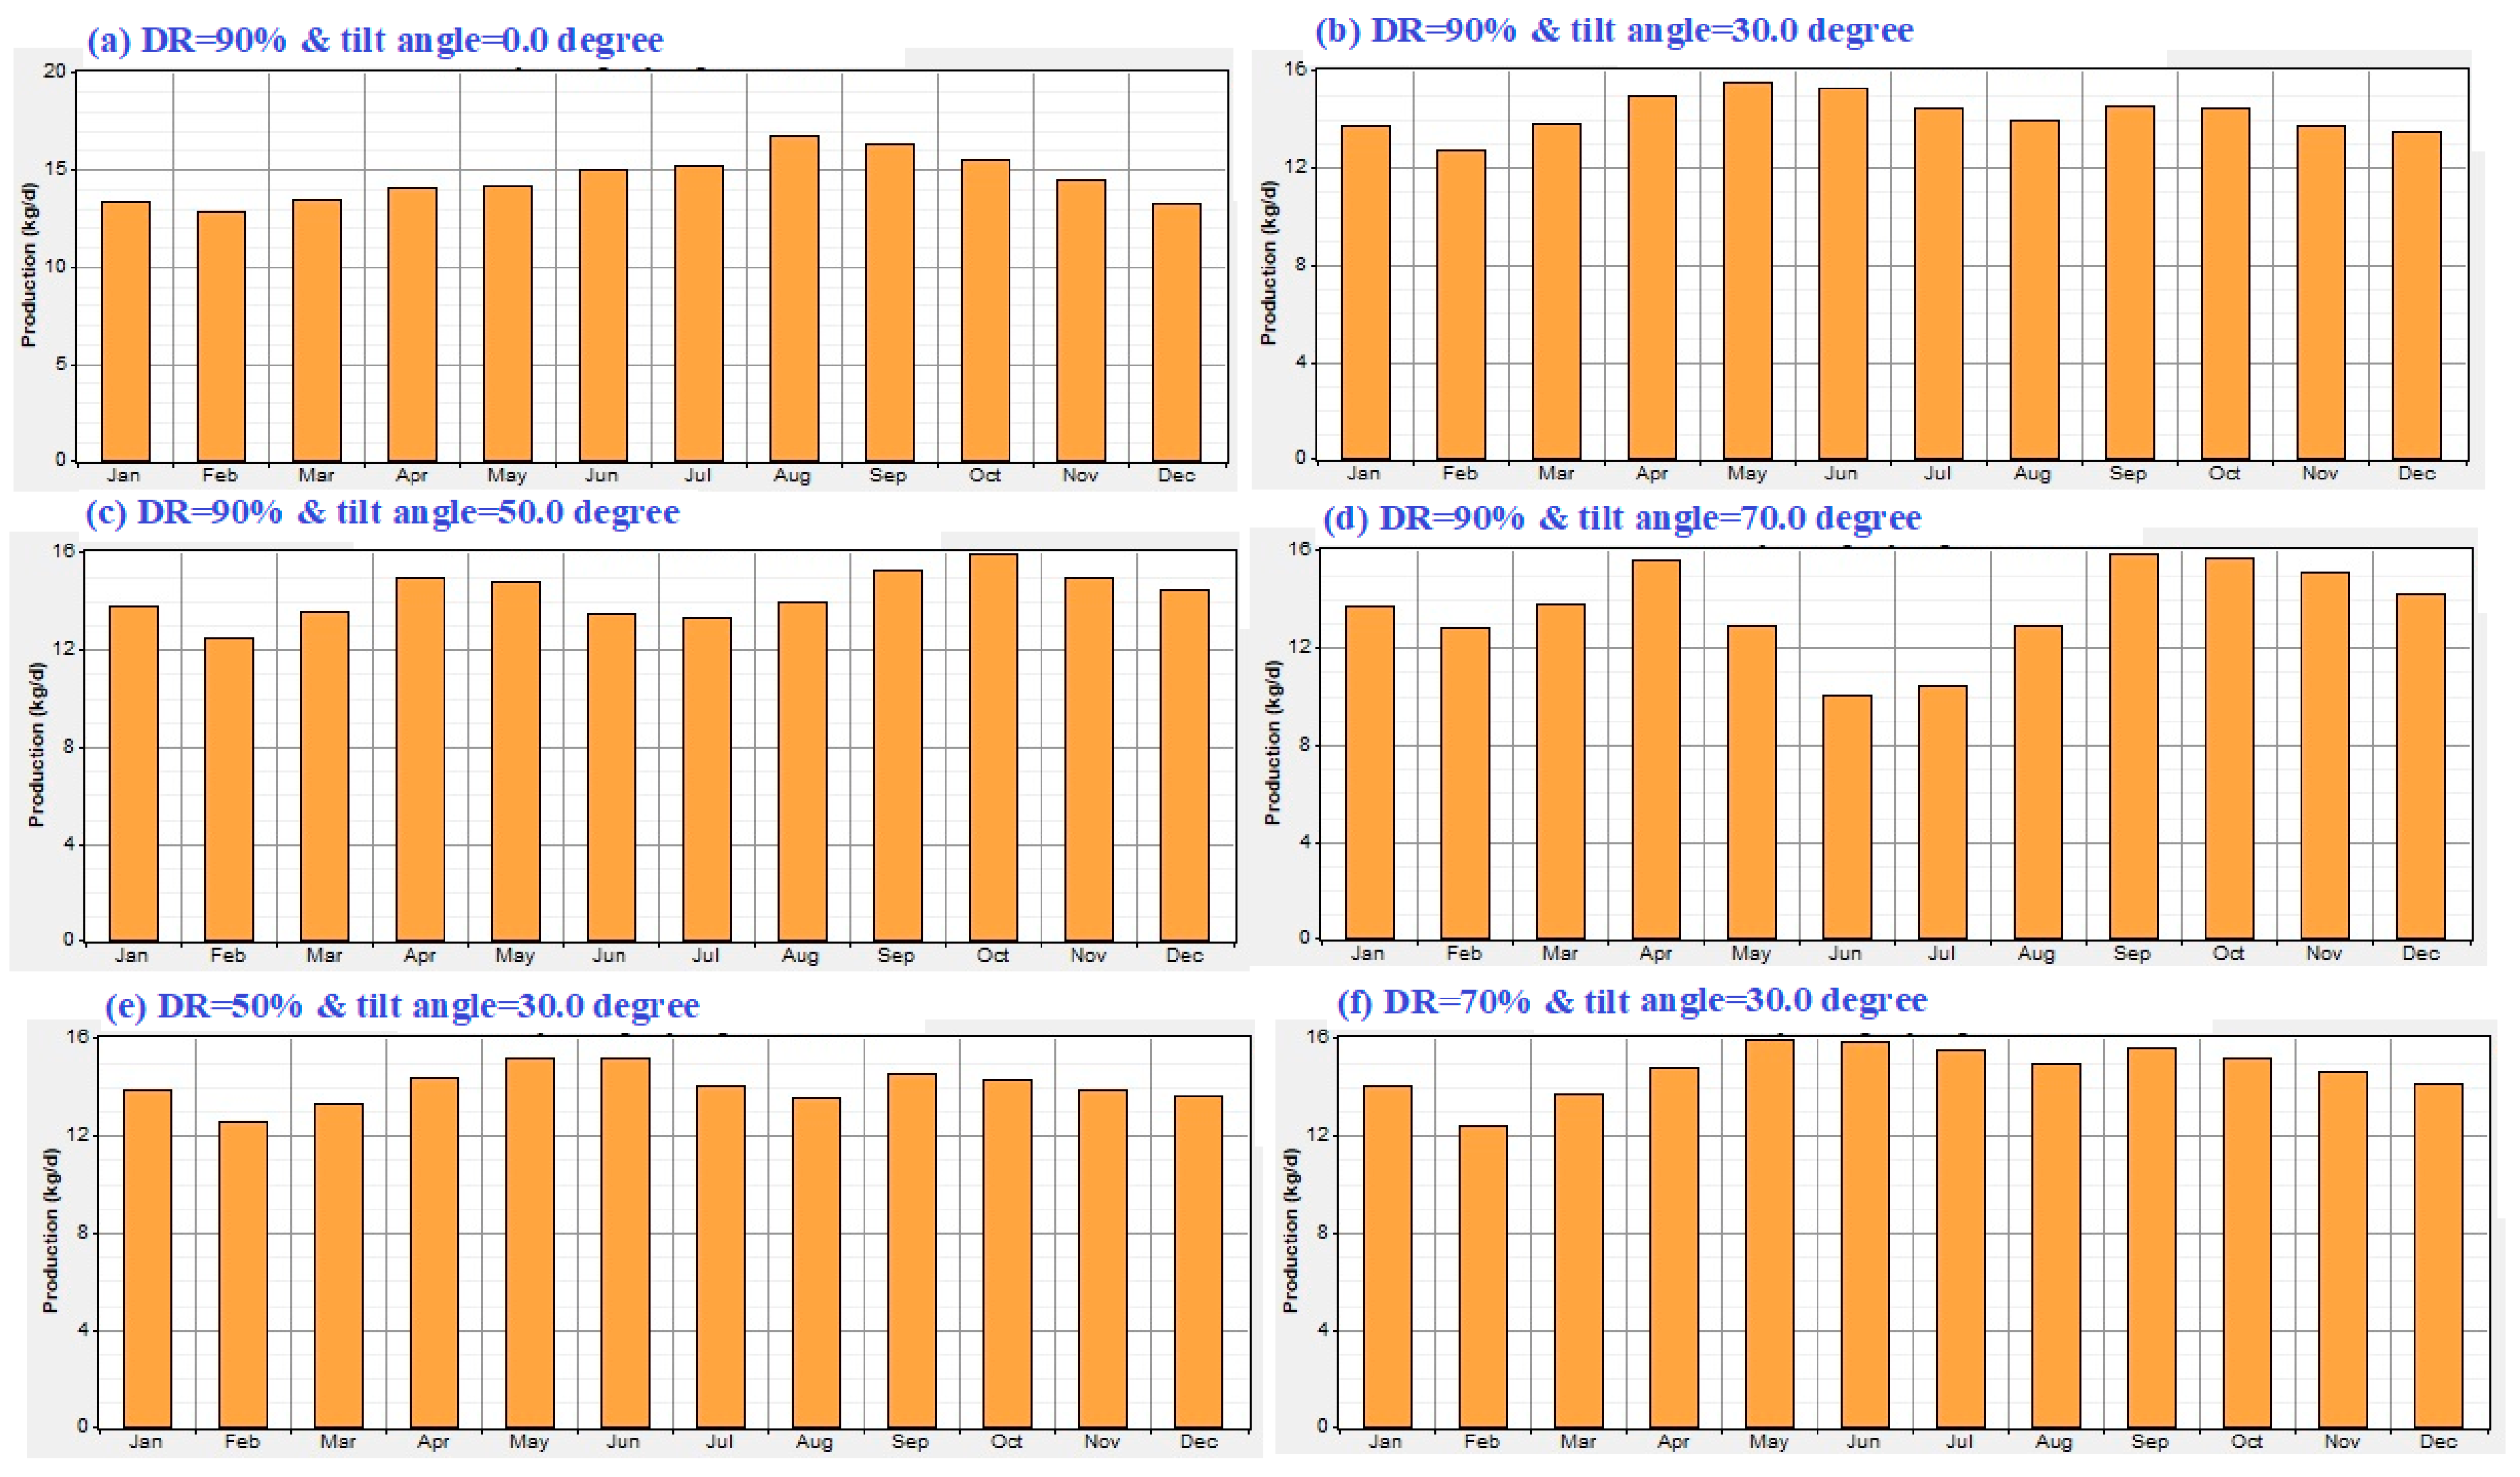
The rated capacities of the PV system were 280 kW, 200 kW, and 240 kW respectively for horizontal, 30 degrees, and 50 degrees of declination of PV array. Consequently, the average daily PV generated power were 58 kW, 45 kW, and 51 kW, respectively, for horizontal, 30 degrees, and 50 degrees of declination of PV array. The average daily generated power by PV for every month with varying the tilt angle of PV array and the derating factor is shown in Figure 7. While for the FC, the average daily FC generated power were 25.9 kW, 27.3 kW, and 27.9 kW, respectively, horizontal, 30 degrees, and 50 degrees of declination of PV array. For the optimal case, May and June had the maximum rate of energy production by FC.
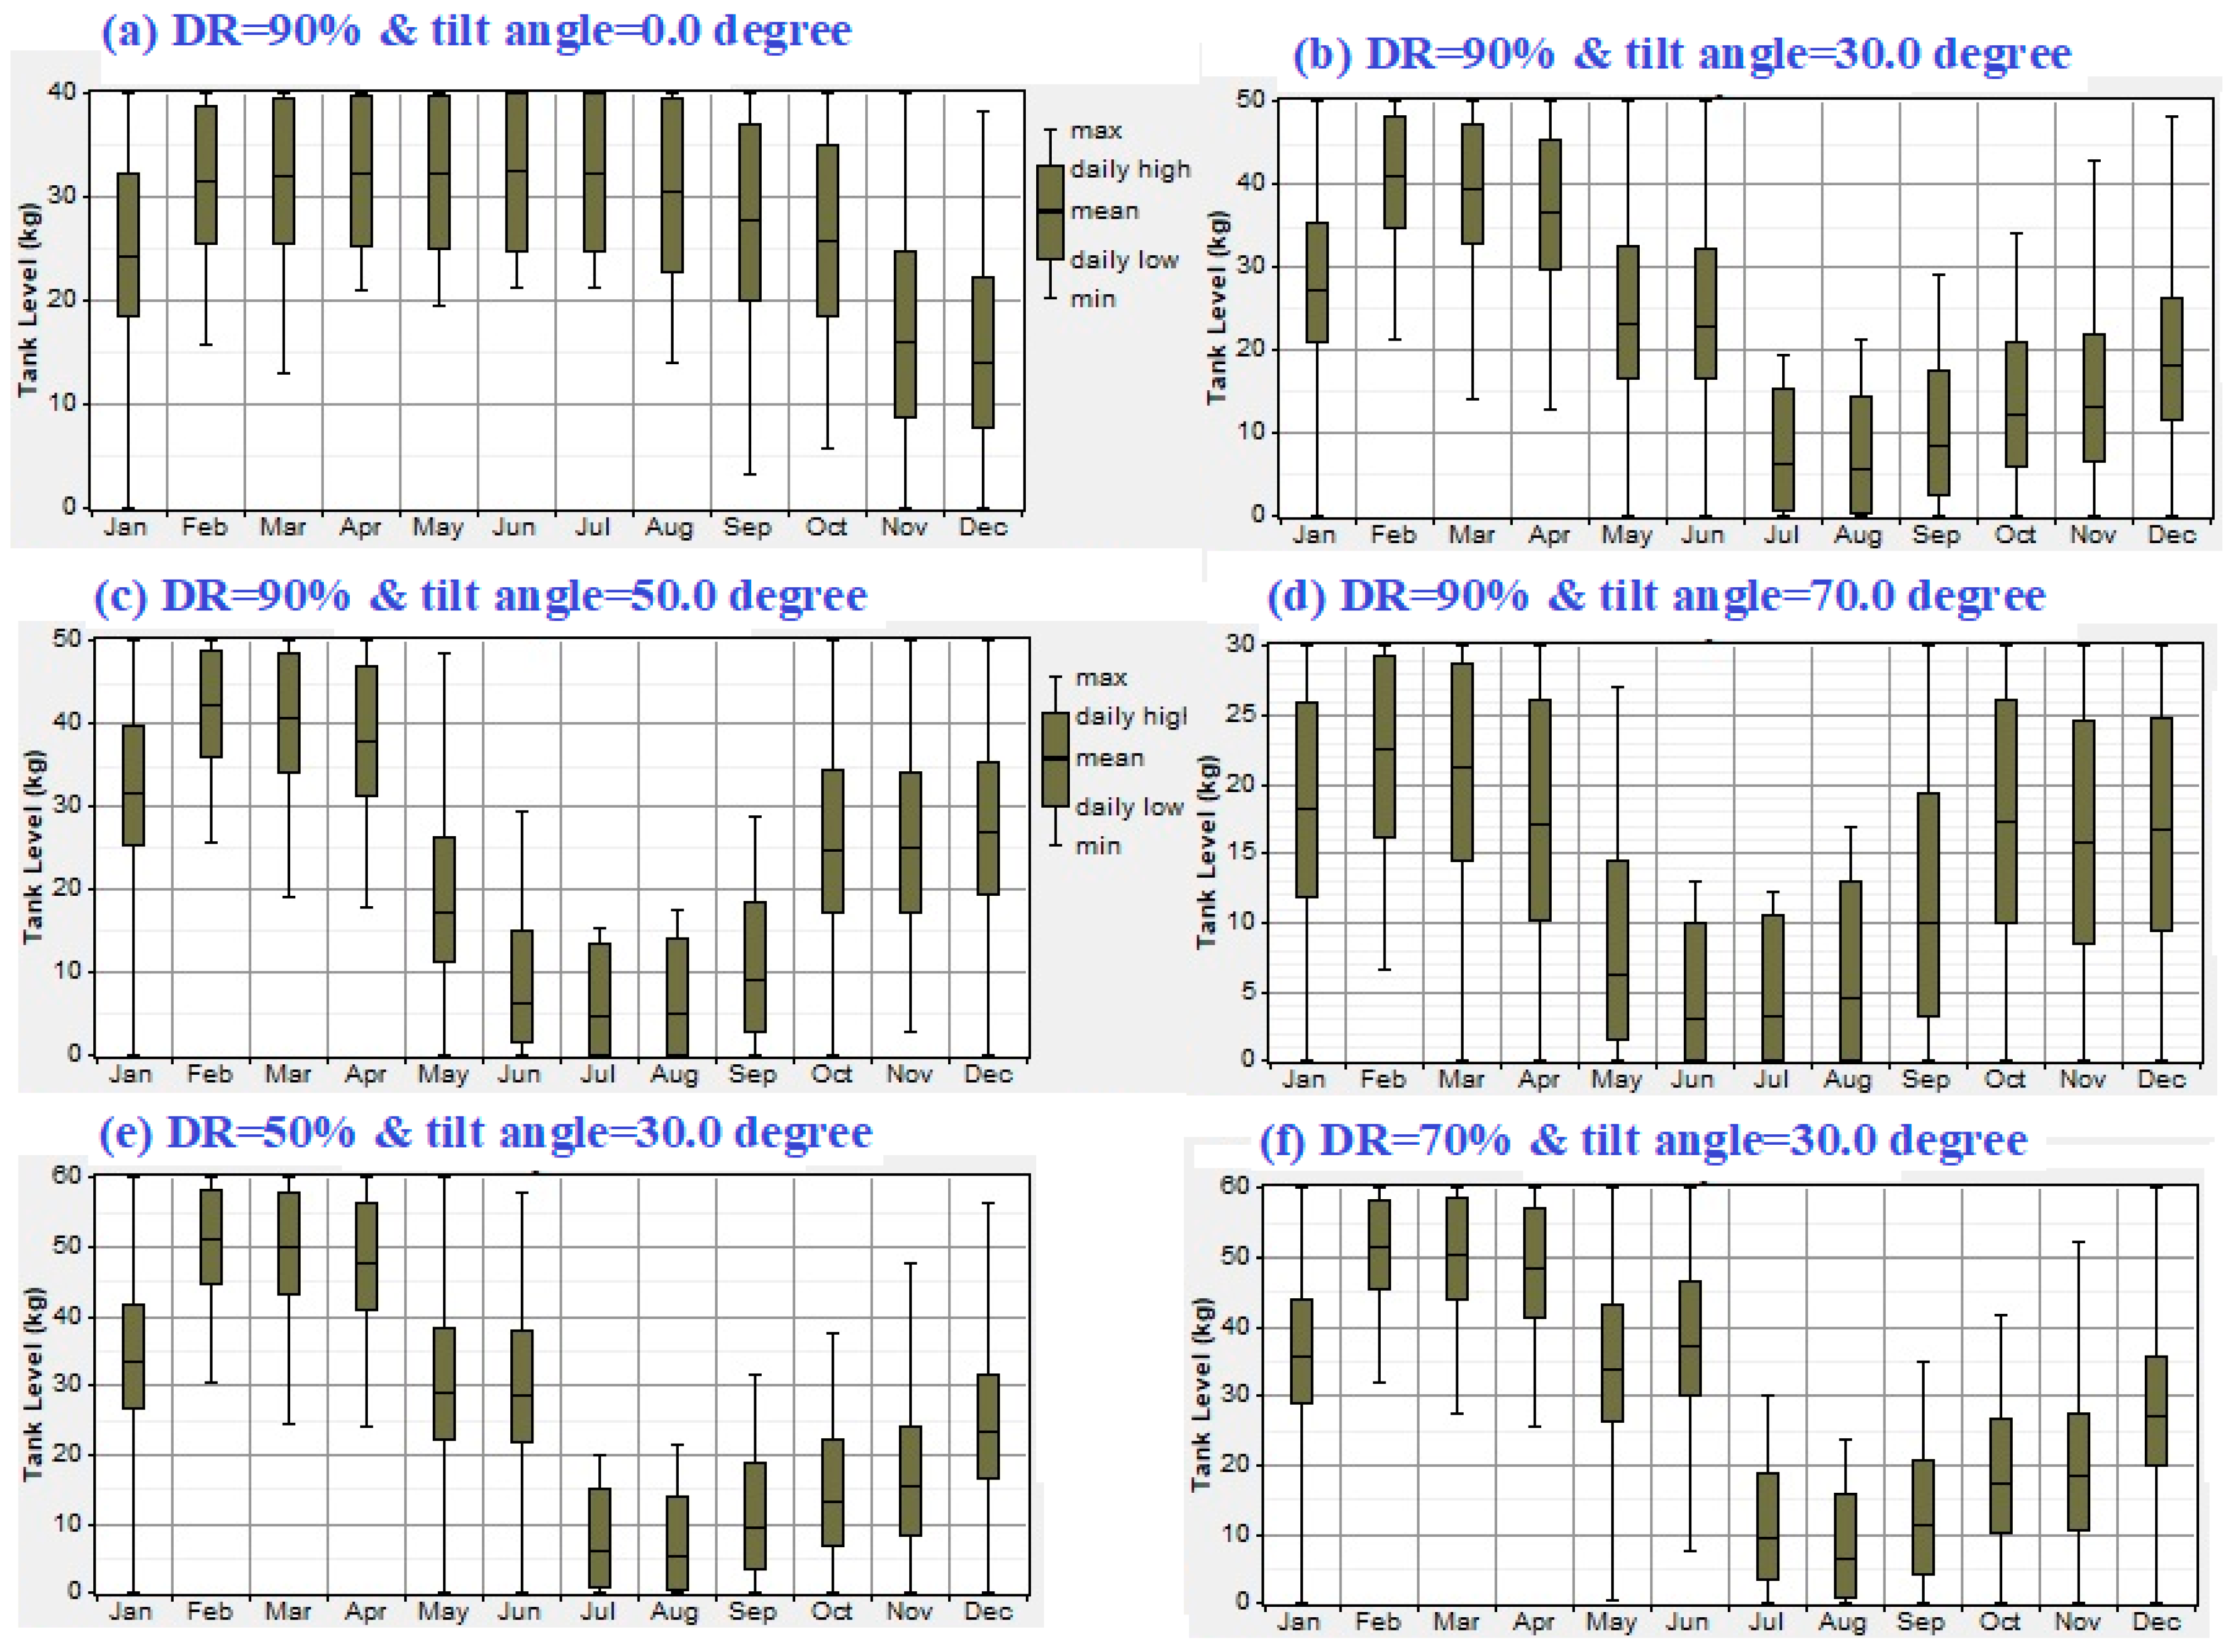
The mean produced hydrogen per month is presented in Figure 8. The annually produced hydrogen were 5300 kg, 5188 kg, and 5203 kg, respectively, for horizontal, 30 degrees, and 50 degrees of declination of PV array. The minimum levelized cost of hydrogen was $4.38/kg. It was achieved with the optimal case with a PV tilt angle of 30 degrees. The statistics of hydrogen tank per month are shown in Figure 9.
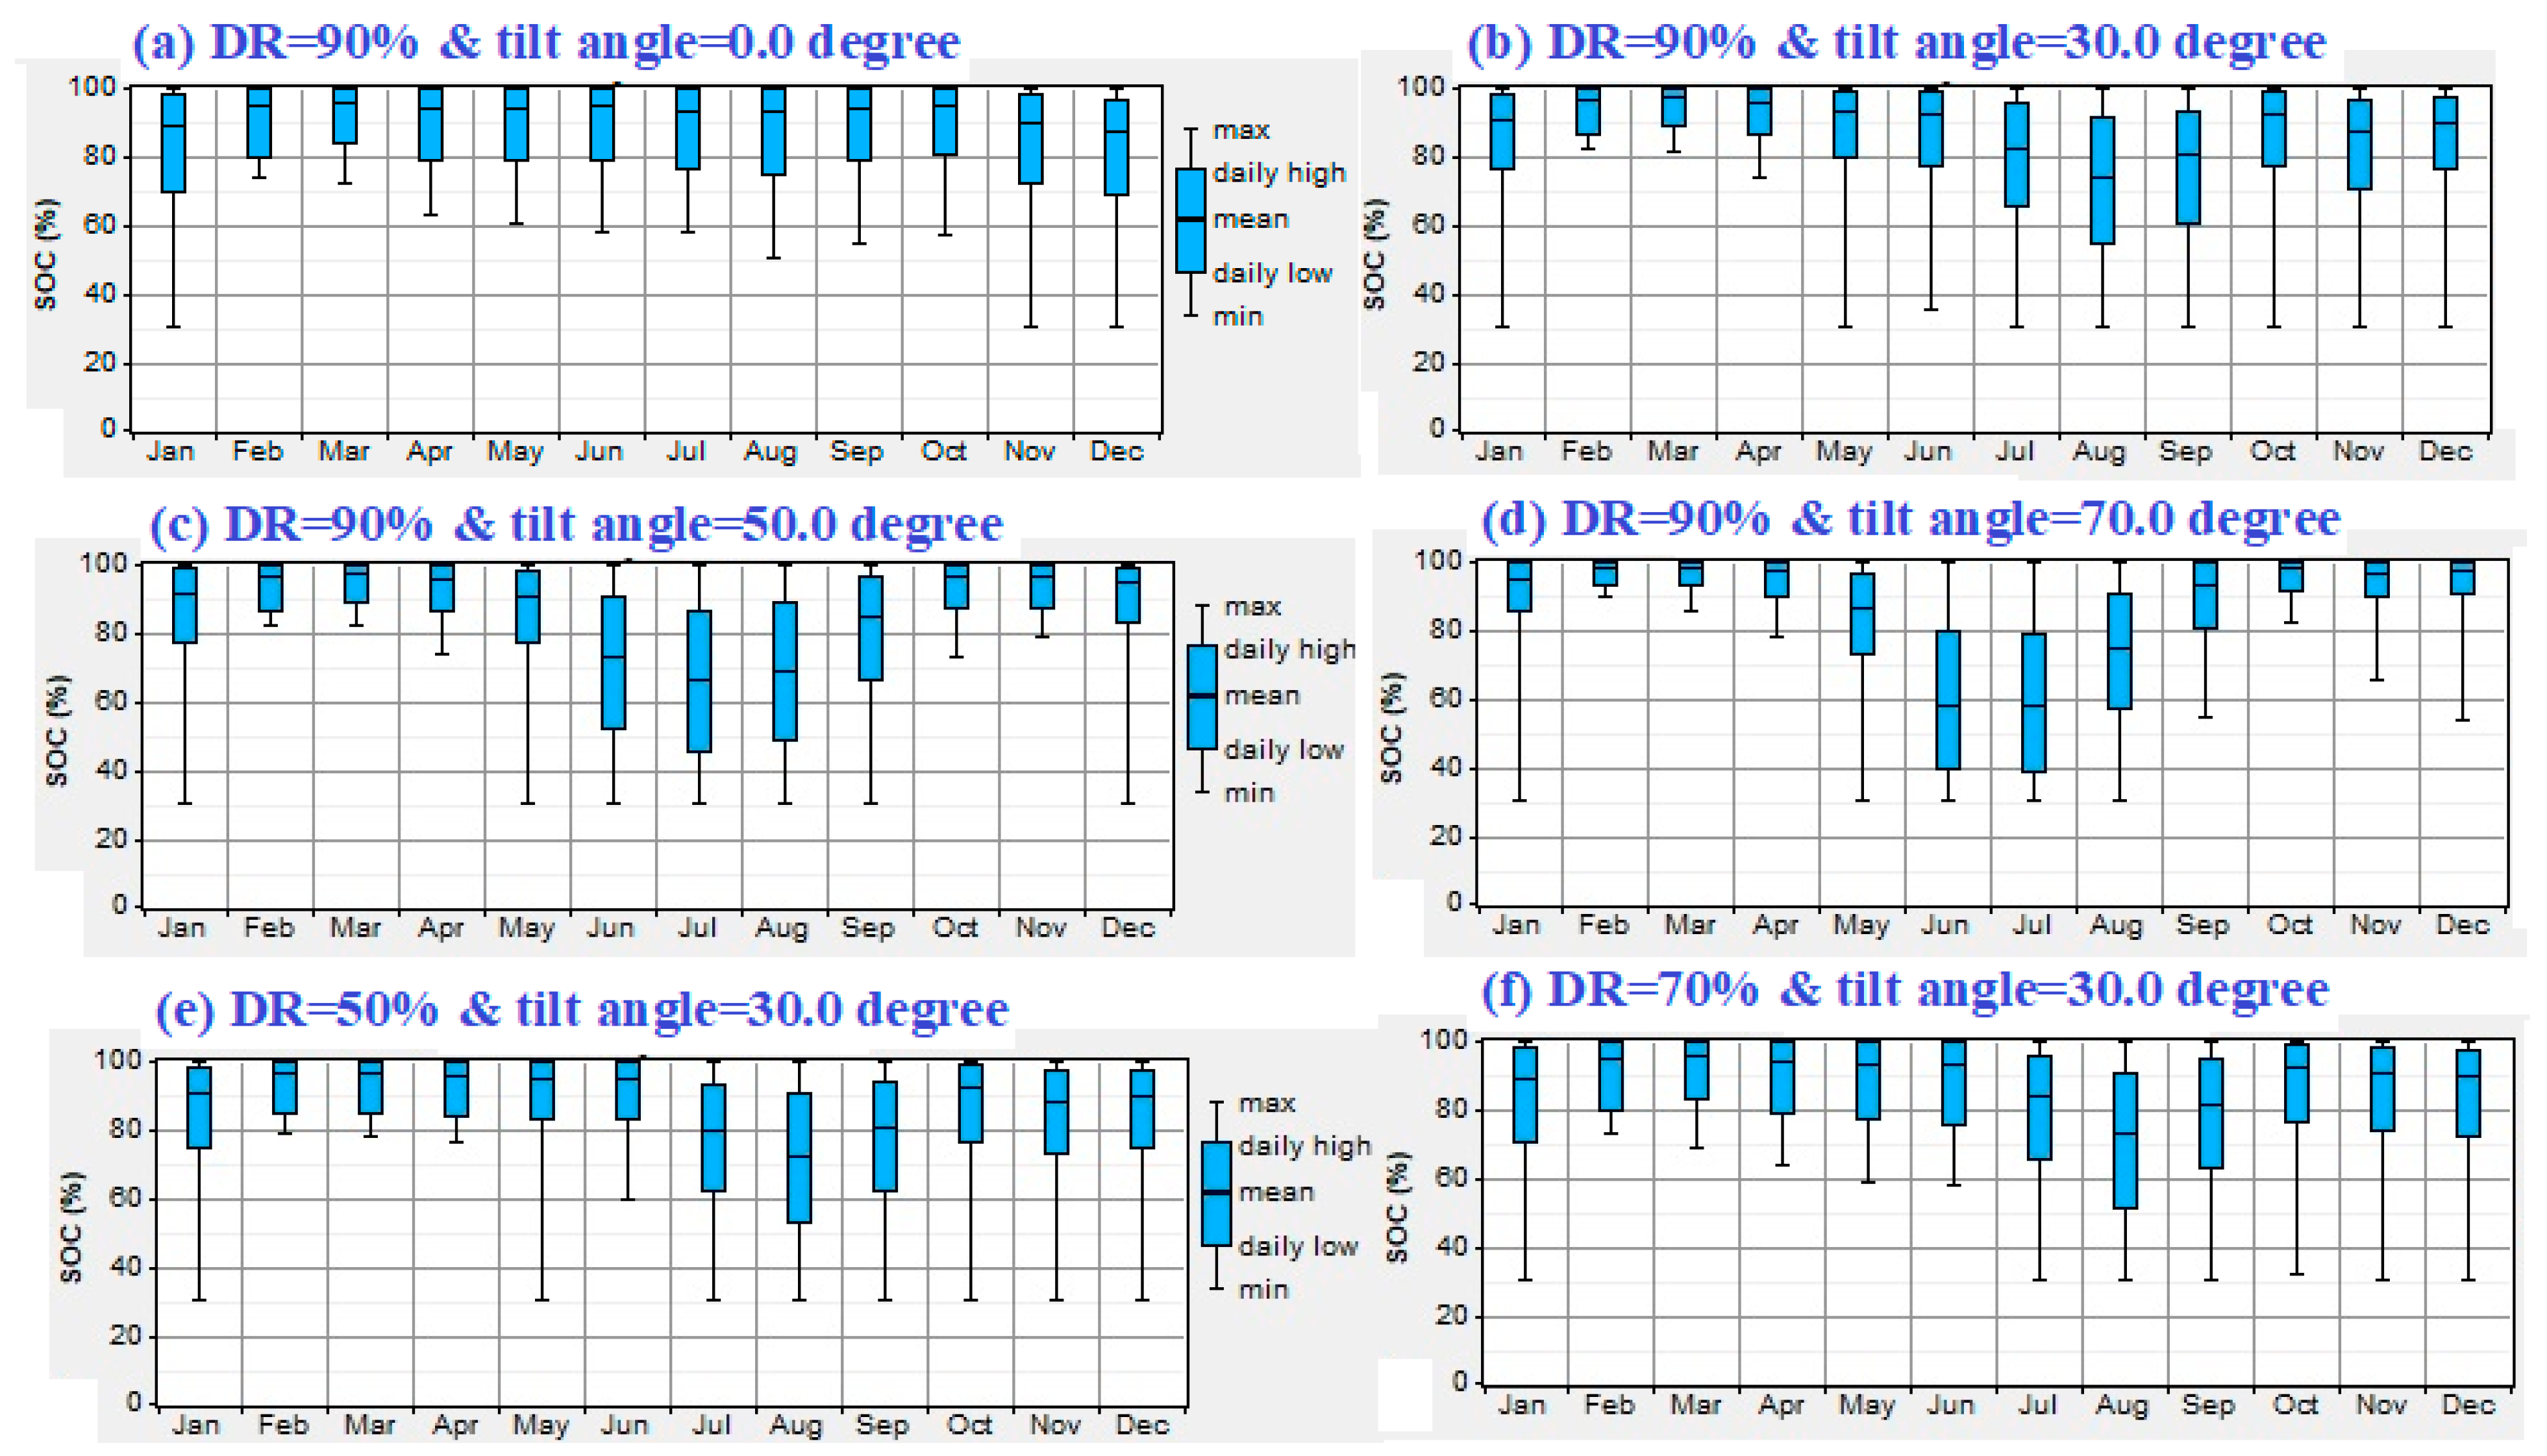
The nominal capacities of the battery were 138 kWh and 207 kWh respectively for horizontal and 30 degrees of declination of PV array. The values of the expected life of the battery were 4.9 years, 5.28 years, and 5.11 years respectively, for horizontal, 30 degrees, and 50 degrees of declination of PV array. The monthly statistics of battery SOC (Stat of charge) are shown in Figure 10.
6. Comparison with Grid Extension and Diesel System
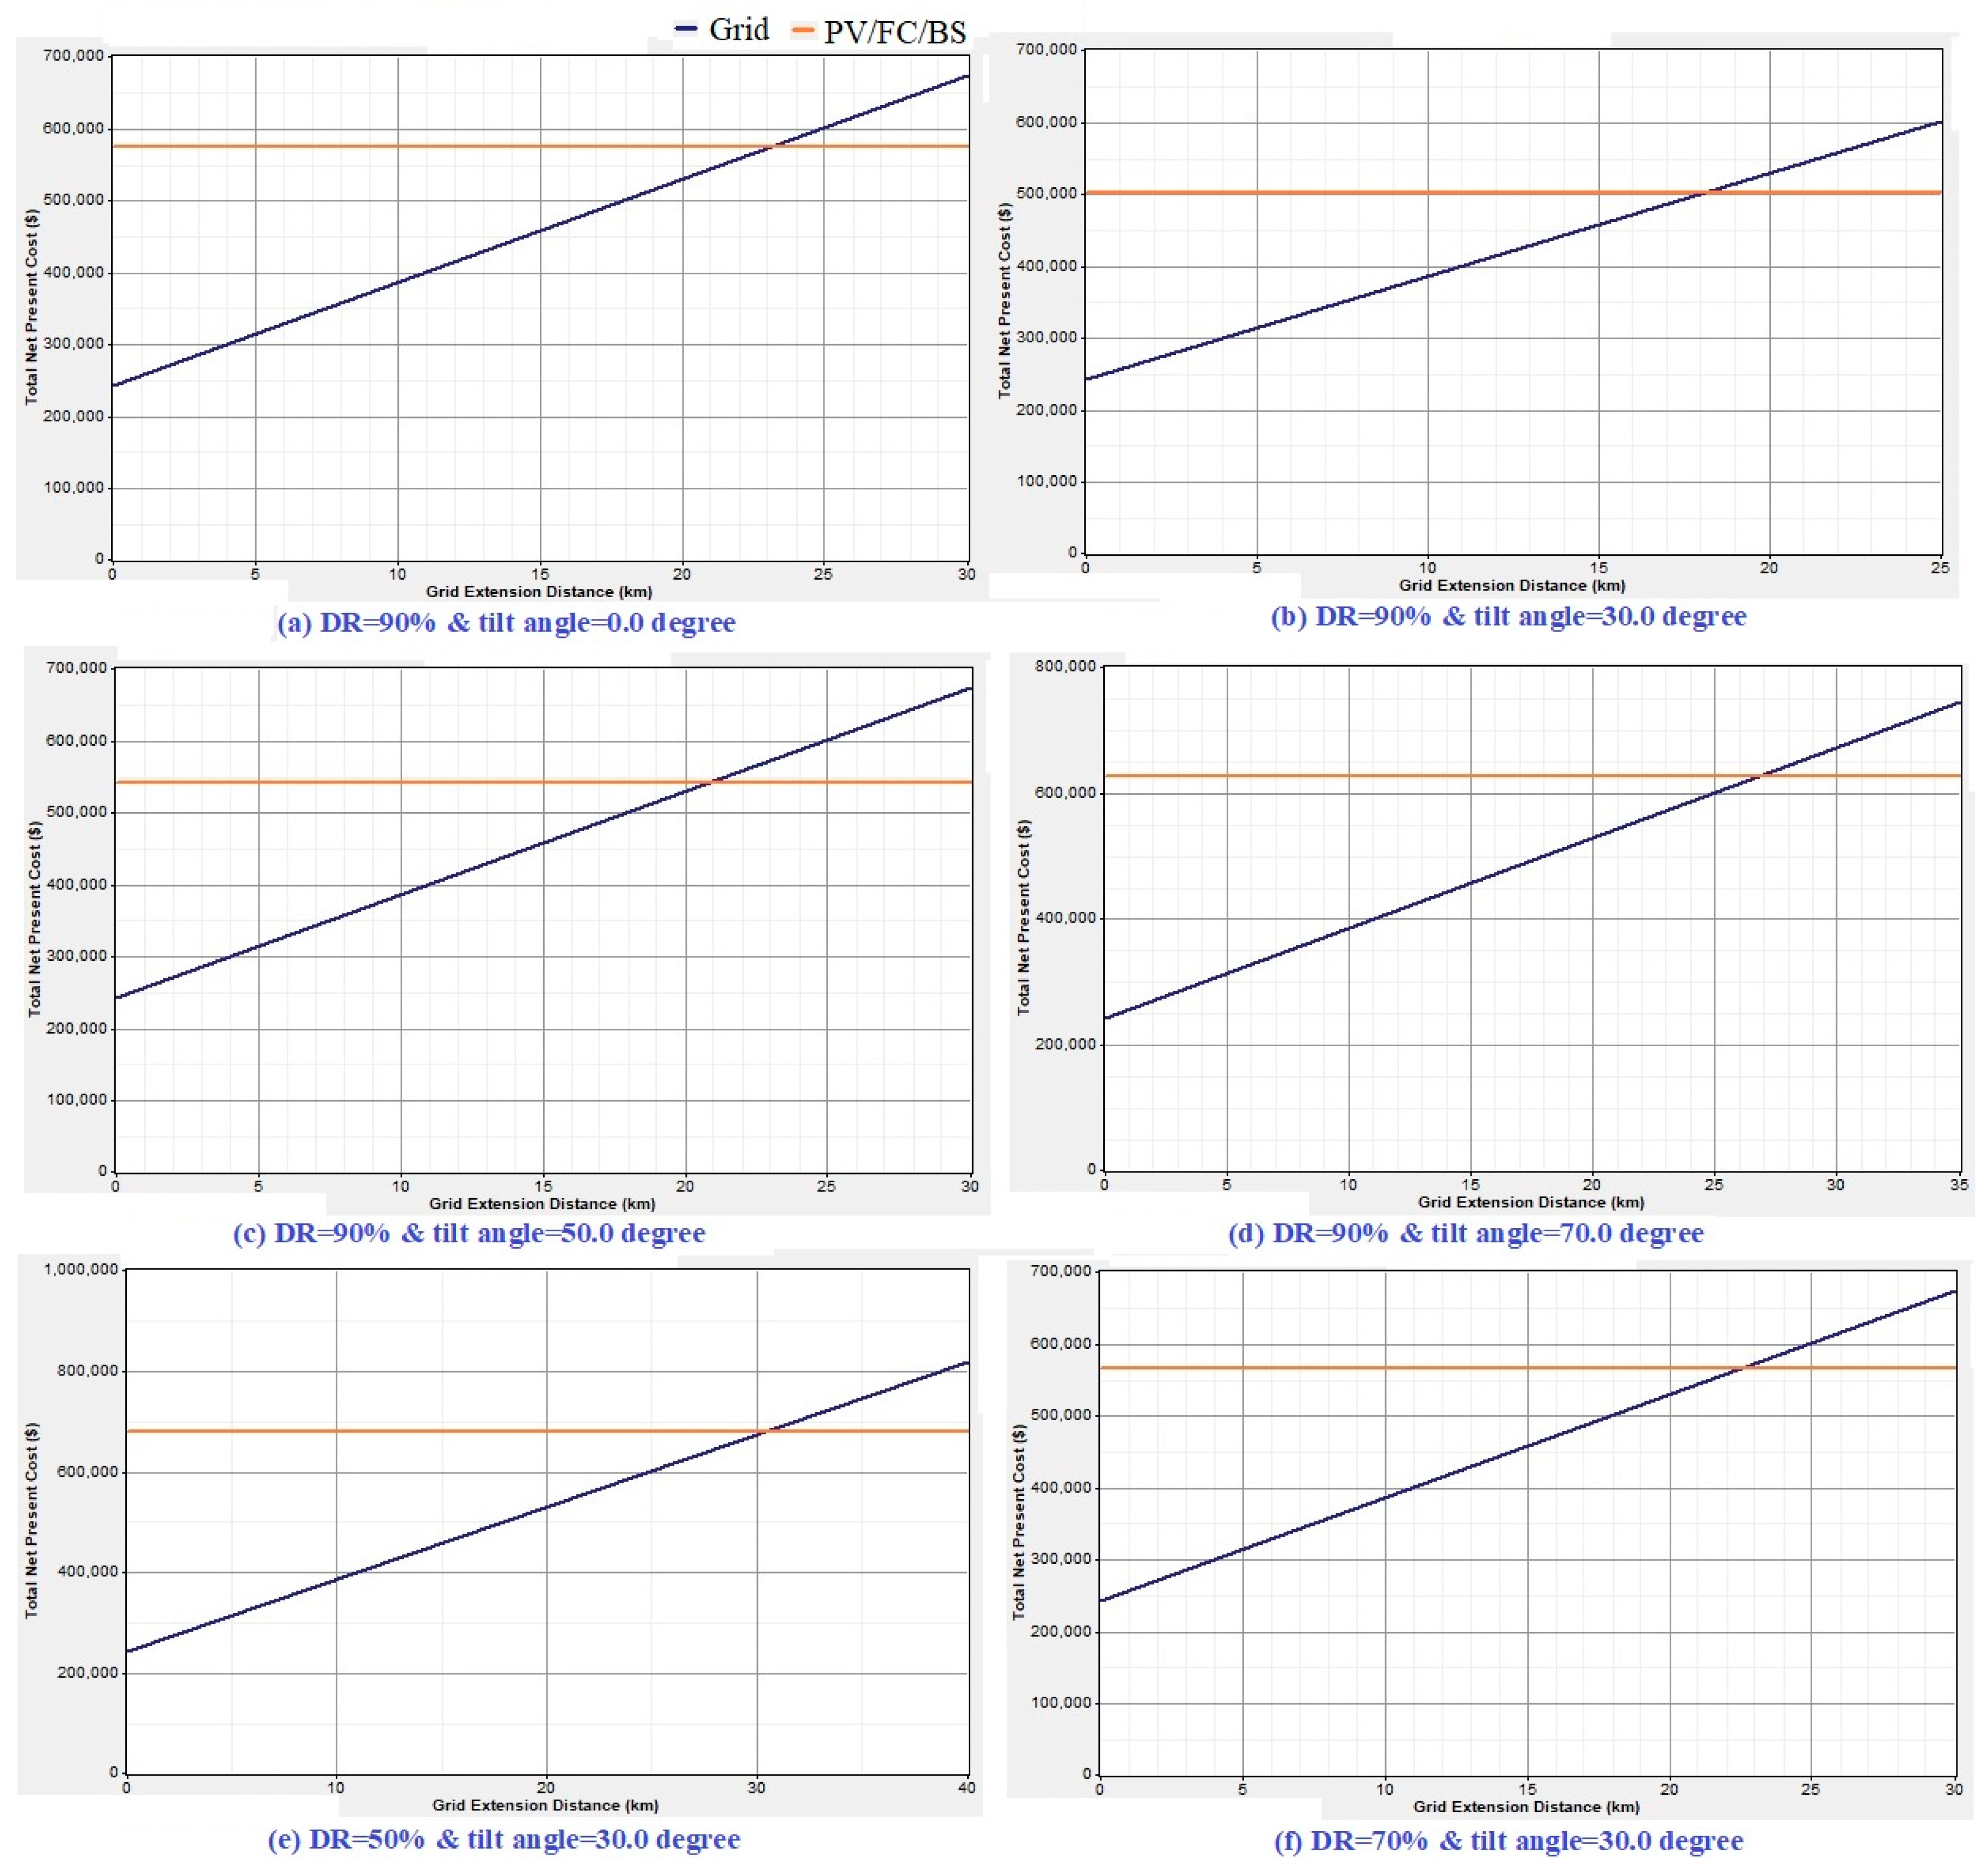
To prove the viability of the PV/FC/B system, a comparison with a utility grid (UG) extension along with a diesel system has been done. The initial cost of a grid connection and yearly maintenance cost were $10,000/km and $200/year/km, respectively. The energy consumption tariff, according to the Saudi Electricity Company, was $0.06/kWh [48]. Figure 11 illustrates a comparison among the NPC of PV/FC/B with different conditions and NPC of the grid. The UG extension is more cost-effective than stand-alone systems for sites when the distance between UG and stand-alone systems is smaller than break-even grid extension distance (BGED). BGED is the distance from the grid that makes the total NPC of extending UG equal to the NPC of the stand-alone system. Figure 10 demonstrates that the PV/FC/B system is better than the utility extension up to a distance of 30 km. This confirmed that a PV/FC/B system is suitable for NEOM, which is located far away from the nearest point of the grid.
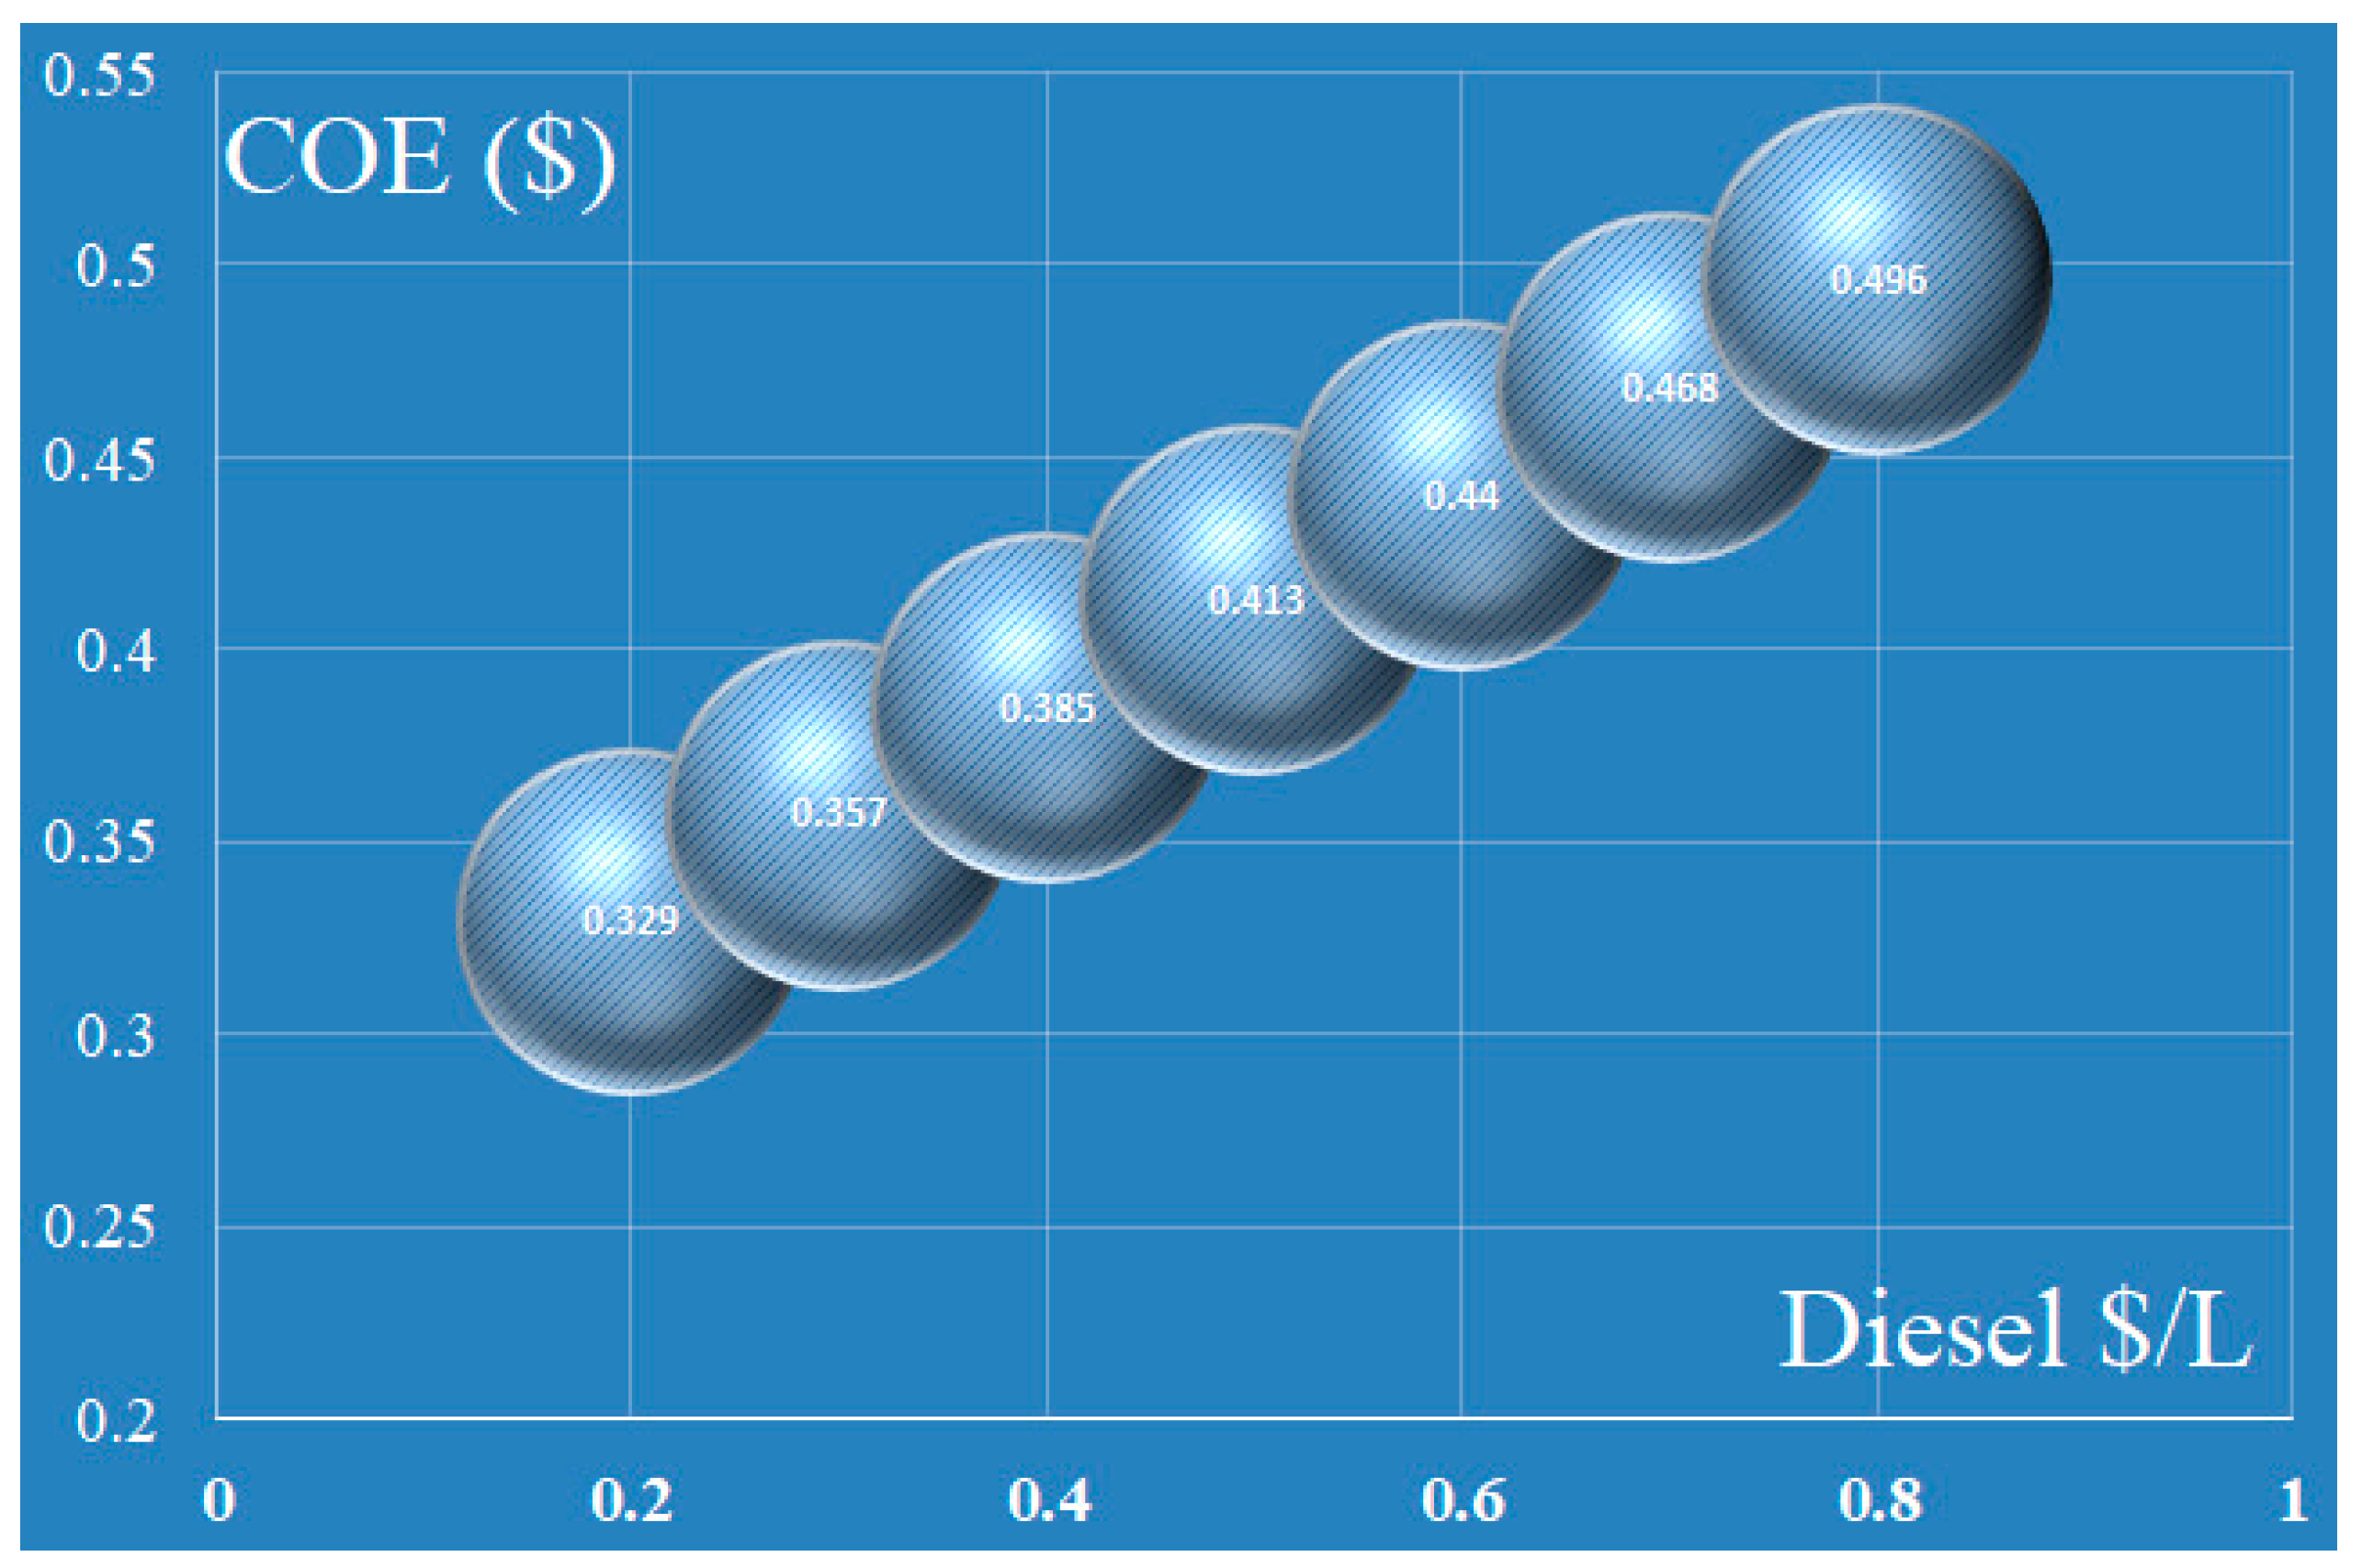
The initial and replacement cost of the diesel generator (DG) was assumed to be $230/kW. In contrast, the operation and maintenance cost was considered to be $0.1/h based on an operation lifetime of 15,000 h [49]. The diesel price in Saudi Arabia was $0.4/l. However, this value can be increased in remote regions because of the high transport fee. The optimization results confirmed that the best size of the diesel generator was 50 kW based on the diesel price of 0.4 $/l. The COE and NPC for the DG were only $0.385/kWh and $154,1572, respectively. Figure 12 displays the influence of diesel price on both COE and total NPC. One can see that both NPC and COE considerably increased with increasing diesel prices where COE varied from $0.329/kWh to $0.496/kWh, and NPC varied from $1,319,032 to $1,986,653 with the growth of diesel price from 0.2$/L to 0.8$/L. This means that using PV/FC/B would decrease energy costs by around 67.3% and save more than one million dollars. Also, the PV/FC/B system could significantly reduce greenhouse gas emissions, particularly carbon dioxide (CO2). The yearly avoided CO2 would be approximately 133,047 kg.
7. Conclusions
The current research paper presented a feasibility study of a PV/FC/B system. Such a system was employed to supply a small community of 500 kW/day in the city of NEOM (Saudi Arabia). The results were compared to identify the best size of the system based on the minimum total net present cost and cost of energy. HOMER software was employed to optimize the performance of PV/FC/B. The main finding results showed that 200 kW PV array, 40 kW FC, 96 batteries, 50 kW converter, 110 kW electrolyzer, and 50 kg hydrogen tank was the best option to supply the load demand. The values of total NPC and COE were $500,823 and 0.126/kWh. Considering the grid extension and also diesel generation system, installing PV/FC/B is cost-effective compared with them. The COE and NPC for the DG were $0.385/kWh and $1,541,572, respectively. This means that using a PV/FC/B system decreased energy costs by around 67.3% and saved more than one million dollars. Also, a PV/FC/B system could significantly reduce greenhouse gas emissions, particularly carbon dioxide (CO2). The yearly avoided CO2 was approximately 133,047 kg.
In the future, a complete mathematical model of a PV/FC/B system will be created in MATLAB and then a modern optimization technique will be used to determine the optimal size of the system.
Author Contributions
Conceptualization, H.R.; Formal analysis, H.R.; Investigation, N.K.; Methodology, H.R. and N.K.; Software, H.R. and M.A.-D.; Validation, M.A.-D.; Writing—original draft, H.R. and N.K.; Writing—review & editing, H.R. and M.A.-D. All authors have read and agreed to the published version of the manuscript.
Funding
This research received no external funding.
Conflicts of Interest
The authors declare no conflict of interest.
References
- Akram, U.; Khalid, M.; Shafiq, S. Optimal sizing of a wind/solar/battery hybrid grid-connected microgrid system. IET Renew. Power Gener. 2018, 12, 72–80. [Google Scholar] [CrossRef]
- Ramli, M.; Hiendro, A.; Twaha, S. Economic analysis of PV/diesel hybrid system with flywheel energy storage. Renew. Energy 2015, 78, 398–405. [Google Scholar] [CrossRef]
- Mamaghani, A.H.; Escandon, S.A.A.; Najafi, B.; Shirazi, A.; Rinaldi, F. Techno-economic feasibility of photovoltaic, wind, diesel and hybrid electrification systems for off-grid rural electrification in Colombia. Renew. Energy 2016, 97, 293–305. [Google Scholar] [CrossRef]
- Qoaider, L.; Steinbrecht, D. Photovoltaic systems: A cost competitive option to supply energy to off-grid agricultural communities in arid regions. Appl. Energy 2010, 87, 427–435. [Google Scholar] [CrossRef]
- Kanase-Patil, A.; Saini, R.; Sharma, M. Sizing of integrated renewable energy system based on load profiles and reliability index for the state of Uttarakhand in India. Renew. Energy 2011, 36, 2809–2821. [Google Scholar] [CrossRef]
- Marčiukaitis, M.; Katinas, V.; Kavaliauskas, A. Wind power usage and prediction prospects in Lithuania. Renew. Sustain. Energy Rev. 2008, 12, 265–277. [Google Scholar] [CrossRef]
- Tyagi, V.; Selvaraj, J.A.; Rahim, N.A.; Rahim, N. Progress in solar PV technology: Research and achievement. Renew. Sustain. Energy Rev. 2013, 20, 443–461. [Google Scholar] [CrossRef]
- Parida, B.; Iniyan, S.; Goic, R. A review of solar photovoltaic technologies. Renew. Sustain. Energy Rev. 2011, 15, 1625–1636. [Google Scholar] [CrossRef]
- Hoque, S.N.; Das, B.K. Analysis of Cost, Energy and Emission of Solar Home Systems in Bangladesh. Int. J. Renew. Energy Res. (IJRER) 2013, 3, 347–352. [Google Scholar]
- Courtecuisse, V.; Sprooten, J.; Robyns, B.; Petit, M.; François, B.; Deuse, J. A methodology to design a fuzzy logic based supervision of Hybrid Renewable Energy Systems. Math. Comput. Simul. 2010, 81, 208–224. [Google Scholar] [CrossRef]
- Clarke, D.P.; Al-Abdeli, Y.; Kothapalli, G. Multi-objective optimisation of renewable hybrid energy systems with desalination. Energy 2015, 88, 457–468. [Google Scholar] [CrossRef]
- Vazquez, S.; Lukic, S.M.; Galvan, E.; Franquelo, L.G.; Carrasco, J.M. Energy Storage Systems for Transport and Grid Applications. IEEE Trans. Ind. Electron. 2010, 57, 3881–3895. [Google Scholar] [CrossRef] [Green Version]
- Ren, H.; Wu, Q.; Gao, W.; Zhou, W. Optimal operation of a grid-connected hybrid PV/fuel cell/battery energy system for residential applications. Energy 2016, 113, 702–712. [Google Scholar] [CrossRef]
- Baghaee, H.; Mirsalim, M.; Gharehpetian, G.B.; Talebi, H.A. Reliability/cost-based multi-objective Pareto optimal design of stand-alone wind/PV/FC generation microgrid system. Energy 2016, 115, 1022–1041. [Google Scholar] [CrossRef]
- Kusakana, K. Operation cost minimization of photovoltaic–diesel–battery hybrid systems. Energy 2015, 85, 645–653. [Google Scholar] [CrossRef]
- Das, B.K.; Hoque, N.; Mandal, S.; Pal, T.K.; Raihan, A. A techno-economic feasibility of a stand-alone hybrid power generation for remote area application in Bangladesh. Energy 2017, 134, 775–788. [Google Scholar] [CrossRef]
- Available online: https://www.homerenergy.com/products/pro/index.html (accessed on 20 January 2020).
- Lau, K.; Tan, C.; Yatim, A. Photovoltaic systems for Malaysian islands: Effects of interest rates, diesel prices and load sizes. Energy 2015, 83, 204–216. [Google Scholar] [CrossRef]
- Bahramara, S.; Moghaddam, M.P.; Haghifam, M. Optimal planning of hybrid renewable energy systems using HOMER: A review. Renew. Sustain. Energy Rev. 2016, 62, 609–620. [Google Scholar] [CrossRef]
- Belmili, H.; Haddadi, M.; Bacha, S.; Almi, M.F.; Bendib, B. Sizing stand-alone photovoltaic–wind hybrid system: Techno-economic analysis and optimization. Renew. Sustain. Energy Rev. 2014, 30, 821–832. [Google Scholar] [CrossRef]
- Ma, T.; Yang, H.; Lu, L. A feasibility study of a stand-alone hybrid solar–wind–battery system for a remote island. Appl. Energy 2014, 121, 149–158. [Google Scholar] [CrossRef]
- Kumar, S.; Manoharan, P. Economic analysis of hybrid power systems (PV/diesel) in different climatic zones of Tamil Nadu. Energy Convers. Manag. 2014, 80, 469–476. [Google Scholar] [CrossRef]
- Shaahid, S.M.; El-Amin, I. Techno-economic evaluation of off-grid hybrid photovoltaic–diesel–battery power systems for rural electrification in Saudi Arabia—A way forward for sustainable development. Renew. Sustain. Energy Rev. 2009, 13, 625–633. [Google Scholar] [CrossRef]
- Rehman, S.; Al-Hadhrami, L.M. Study of a solar PV–diesel–battery hybrid power system for a remotely located population near Rafha, Saudi Arabia. Energy 2010, 35, 4986–4995. [Google Scholar] [CrossRef]
- Saheb-Koussa, D.; Haddadi, M.; Belhamel, M. Economic and technical study of a hybrid system (wind–photovoltaic–diesel) for rural electrification in Algeria. Appl. Energy 2009, 86, 1024–1030. [Google Scholar] [CrossRef]
- Senjyu, T.; Hayashi, D.; Urasaki, N.; Funabashi, T. Optimum Configuration for Renewable Generating Systems in Residence Using Genetic Algorithm. IEEE Trans. Energy Convers. 2006, 21, 459–466. [Google Scholar] [CrossRef]
- Hong, Y.-Y.; Lian, R.-C. Optimal Sizing of Hybrid Wind/PV/Diesel Generation in a Stand-Alone Power System Using Markov-Based Genetic Algorithm. IEEE Trans. Power Deliv. 2012, 27, 640–647. [Google Scholar] [CrossRef]
- Sanchez, V.; Ramirez, J.M.; Arriaga, G. Optimal sizing of a hybrid renewable system. In Proceedings of the 2010 IEEE International Conference on Industrial Technology; Institute of Electrical and Electronics Engineers (IEEE): Vina del Mar, Chile, 2010; pp. 949–954. [Google Scholar]
- Katsigiannis, Y.; Georgilakis, P.S.; Karapidakis, E.S. Hybrid Simulated Annealing–Tabu Search Method for Optimal Sizing of Autonomous Power Systems With Renewables. IEEE Trans. Sustain. Energy 2012, 3, 330–338. [Google Scholar] [CrossRef]
- Atwa, Y.; El-Saadany, E.F.; Salama, M.; Seethapathy, R. Optimal Renewable Resources Mix for Distribution System Energy Loss Minimization. IEEE Trans. Power Syst. 2010, 25, 360–370. [Google Scholar] [CrossRef]
- Wang, L.; Singh, C. Multicriteria Design of Hybrid Power Generation Systems Based on a Modified Particle Swarm Optimization Algorithm. IEEE Trans. Energy Convers. 2009, 24, 163–172. [Google Scholar] [CrossRef]
- Katsigiannis, Y.A.; Georgilakis, P.S.; Karapidakis, E.S. Multi-objective genetic algorithm solution to the optimum economic and environmental performance problem of small autonomous hybrid power system with renewable. IET Renew Power Gener. 2010, 4, 404–419. [Google Scholar] [CrossRef]
- Cullen, N.J.; Conway, J.P. A 22 month record of surface meteorology and energy balance from the ablation zone of Brewster Glacier, New Zealand. J. Glaciol. 2015, 61, 931–946. [Google Scholar] [CrossRef] [Green Version]
- Available online: www.google.com/maps (accessed on 15 February 2020).
- Mohamed, M.A.; Diab, A.A.Z.; Rezk, H. Partial shading mitigation of PV systems via different meta-heuristic techniques. Renew. Energy 2019, 130, 1159–1175. [Google Scholar] [CrossRef]
- Abdalla, O.; Rezk, H.; Ahmed, E.M. Wind driven optimization algorithm based global MPPT for PV system under non-uniform solar irradiance. Sol. Energy 2019, 180, 429–444. [Google Scholar] [CrossRef]
- Radziemska, E.; Klugmann, E. Thermally affected parameters of the current–voltage characteristics of silicon photocell. Energy Convers. Manag. 2002, 43, 1889–1900. [Google Scholar] [CrossRef]
- Khalid, F.; Dincer, I.; Rosen, M.A. Thermo-conomic analysis of a solar-biomass integrated multigeneration system for a community. Appl. Therm. Eng. 2017, 120, 645–653. [Google Scholar] [CrossRef]
- Available online: https://www.enfsolar.com/directory/panel/11602/ecosolargy (accessed on 25 January 2020).
- Rezk, H. A comprehensive sizing methodology for stand-alone battery-less photovoltaic water pumping system under the Egyptian climate. Cogent Eng. 2016, 3, 1242110. [Google Scholar] [CrossRef]
- Available online: https://www.fuelcellenergy.com (accessed on 13 January 2020).
- Deshmukh, M.; Deshmukh, S. Modeling of hybrid renewable energy systems. Renew. Sustain. Energy Rev. 2008, 12, 235–249. [Google Scholar] [CrossRef]
- Liso, V.; Nielsen, M.; Kær, S.K.; Mortensen, H.H. Thermal modeling and temperature control of a PEM fuel cell system for forklift applications. Int. J. Hydrog. Energy 2014, 39, 8410–8420. [Google Scholar] [CrossRef]
- Hu, P.; Cao, G.-Y.; Zhu, X.-J.; Hu, M. Coolant circuit modeling and temperature fuzzy control of proton exchange membrane fuel cells. Int. J. Hydrog. Energy 2010, 35, 9110–9123. [Google Scholar] [CrossRef]
- Rezk, H.; Sayed, E.T.; Al-Dhaifallah, M.; Obaid, M.; El-Sayed, A.H.M.; Abdelkareem, M.A.; Olabi, A. Fuel cell as an effective energy storage in reverse osmosis desalination plant powered by photovoltaic system. Energy 2019, 175, 423–433. [Google Scholar] [CrossRef] [Green Version]
- Rezk, H.; Dousoky, G.M. Technical and economic analysis of different configurations of stand-alone hybrid renewable power systems–A case study. Renew. Sustain. Energy Rev. 2016, 62, 941–953. [Google Scholar] [CrossRef]
- Rezk, H.; Abdelkareem, M.A.; Ghenai, C. Performance evaluation and optimal design of stand-alone solar PV-battery system for irrigation in isolated regions: A case study in Al Minya (Egypt). Sustain. Energy Technol. Assessments 2019, 36, 100556. [Google Scholar] [CrossRef]
- Rezk, H.; Shoyama, M. Techno-economic optimum sizing of stand-alone photovoltaic/fuel cell renewable system for irrigation water pumping applications. In Proceedings of the 2014 IEEE International Conference on Power and Energy (PECon); Institute of Electrical and Electronics Engineers (IEEE): Kuching, Malaysia, 2014; Volume 1, pp. 182–186. [Google Scholar]
- Available online: https://www.se.com.sa/ar-sa/Customers/Pages/TariffRates.aspx (accessed on 12 January 2020).
Figure 1.
Position of NEOM city [34].
Figure 1.
Position of NEOM city [34].

Figure 2.
Mean daily solar radiation level and clearance index during the year.

Figure 3.
Load demand (a) daily profile; (b) seasonal profile.

Figure 4.
The effect of varying the tilt angle of the PV array and the derating factor on the cost of energy (a) PV tilt angle (b) derating factor.
Figure 4.
The effect of varying the tilt angle of the PV array and the derating factor on the cost of energy (a) PV tilt angle (b) derating factor.

Figure 5.
The total NPC for different system components with varying tilt angles of PV array and derating factor.
Figure 5.
The total NPC for different system components with varying tilt angles of PV array and derating factor.

Figure 6.
The discounted cash flows of PV/FC/B system with varying (a) the tilt angle of PV array; (b) derating factor.
Figure 6.
The discounted cash flows of PV/FC/B system with varying (a) the tilt angle of PV array; (b) derating factor.

Figure 7.
Mean produced electrical power.

Figure 8.
Mean produced hydrogen per month.

Figure 9.
Statistics of hydrogen tank per month.

Figure 10.
Statistics of battery SOC per month.

Figure 11.
Break-even grid extension distance for different systems.

Figure 12.
Variation of COE with diesel price.


Table 1.
Optimal size of photovoltaic-fuel-cell-battery (PV/FC/B) system and related costs with varying the tilt angle of PV array and the PV derating factor (%).
Table 1.
Optimal size of photovoltaic-fuel-cell-battery (PV/FC/B) system and related costs with varying the tilt angle of PV array and the PV derating factor (%).
| PV (kW) | FC (kW) | No. of Batteries | Conv. (kW) | Elect. (kW) | H2 Tank (Kg) | Initial Cost ($) | Operating Cost ($/yr) | NPC ($) | COE ($/kWh) | |
|---|---|---|---|---|---|---|---|---|---|---|
| PV slop degree | ||||||||||
| 0.0 | 280 | 40 | 64 | 50 | 120 | 40 | 380,200 | 8866 | 575,450 | 0.144 |
| 10.0 | 240 | 45 | 64 | 50 | 110 | 30 | 337,700 | 8831 | 532,193 | 0.134 |
| 20.0 | 200 | 40 | 64 | 50 | 130 | 50 | 305,800 | 8865 | 500,446 | 0.126 |
| 30.0 | 200 | 40 | 96 | 50 | 110 | 50 | 315,800 | 8901 | 500,823 | 0.126 |
| 40.0 | 210 | 40 | 96 | 50 | 120 | 40 | 341,800 | 9037 | 514,827 | 0.130 |
| 50.0 | 240 | 40 | 96 | 50 | 100 | 50 | 360,800 | 9039 | 540,427 | 0.136 |
| 60.0 | 260 | 35 | 128 | 50 | 100 | 30 | 360,900 | 9596 | 572,236 | 0.144 |
| 70.0 | 300 | 35 | 160 | 50 | 100 | 30 | 406,500 | 9936 | 625,324 | 0.157 |
| 80.0 | 360 | 35 | 160 | 60 | 90 | 30 | 468,500 | 10,393 | 697,388 | 0.176 |
| Derating factor (%) | ||||||||||
| 50.0 | 350 | 45 | 96 | 50 | 120 | 60 | 462,300 | 9789 | 667,895 | 0.171 |
| 60.0 | 300 | 40 | 96 | 50 | 110 | 50 | 404,800 | 9401 | 611,835 | 0.154 |
| 70.0 | 260 | 40 | 64 | 50 | 120 | 60 | 364,200 | 9111 | 564,849 | 0.142 |
| 80.0 | 220 | 40 | 96 | 50 | 120 | 60 | 329,800 | 9083 | 529,841 | 0.134 |
| 90.0 | 200 | 40 | 96 | 50 | 110 | 50 | 304,800 | 8901 | 500,823 | 0.126 |
Abbreviations: NPC—net present cost, COE—cost of energy.
Table 2.
Related costs of different components for PV/FC/B system with variating the tilt angle of PV array and the derating factor.
Table 2.
Related costs of different components for PV/FC/B system with variating the tilt angle of PV array and the derating factor.
| Capital ($) | Replacement ($) | O&M ($) | Salvage ($) | Total ($) | |
|---|---|---|---|---|---|
| PV slope degree | |||||
| 0.0 degree and DR = 90% | |||||
| PV array | 280,000 | 0 | 30,832 | 0 | 310,832 |
| FC | 20,000 | 33,624 | 59,991 | −13,597 | 100,018 |
| B | 11,200 | 48,495 | 7047 | −7842 | 58,900 |
| Converter | 25,000 | 21,534 | 0 | −6498 | 40,036 |
| Electrolyzer | 36,000 | 29,504 | 13,214 | −21,054 | 57,664 |
| H2 Tank | 8000 | 0 | 0 | 0 | 8000 |
| System | 380,200 | 133,157 | 111,085 | −48,991 | 575,450 |
| 30.0 degree and DR = 90% | |||||
| PV array | 200,000 | 0 | 22,023 | 0 | 222,023 |
| FC | 20,000 | 17,634 | 55,692 | −380 | 92,946 |
| B | 16,800 | 59,034 | 10,571 | −3445 | 82,960 |
| Converter | 25,000 | 21,534 | 0 | −6498 | 40,036 |
| Electrolyzer | 33,000 | 27,045 | 12,113 | −19,299 | 52,858 |
| H2 Tank | 10,000 | 0 | 0 | 0 | 10,000 |
| System | 304,800 | 125,246 | 100,399 | −29,623 | 500,823 |
| 50.0 degree and DR = 90% | |||||
| PV array | 240,000 | 0 | 26,428 | 0 | 266,428 |
| FC | 20,000 | 17,587 | 54,529 | −1023 | 91,092 |
| B | 16,800 | 59,276 | 10,571 | −1398 | 85,249 |
| Converter | 25,000 | 21,534 | 0 | −6498 | 40,036 |
| Electrolyzer | 30,000 | 24,586 | 11,012 | −17,545 | 48,053 |
| H2 Tank | 10,000 | 0 | 0 | 0 | 10,000 |
| System | 341,800 | 122,982 | 102,540 | −26,464 | 540,858 |
| 30.0 degree and DR = 70% | |||||
| PV array | 350,000 | 0 | 38,541 | 0 | 388,541 |
| FC | 22,500 | 19,607 | 57,322 | −3377 | 96,052 |
| B | 16,800 | 59,103 | 10,571 | −2871 | 83,603 |
| Converter | 25,000 | 21,534 | 0 | −6498 | 40,036 |
| Electrolyzer | 36,000 | 29,504 | 13,214 | −21,054 | 57,664 |
| H2 Tank | 12,000 | 0 | 0 | 0 | 12,000 |
| System | 462,300 | 129,748 | 119,647 | −33,800 | 677,895 |
| 30.0 degree and DR = 50% | |||||
| PV array | 260,000 | 0 | 28,630 | 0 | 288,630 |
| FC | 20,000 | 33,663 | 60,396 | −13,373 | 100,686 |
| BS | 11,200 | 49,330 | 7047 | −1744 | 65,833 |
| Converter | 25,000 | 21,534 | 0 | −6498 | 40,036 |
| Electrolyzer | 36,000 | 29,504 | 13,214 | −21,054 | 57,664 |
| H2 Tank | 12,000 | 0 | 0 | 0 | 12,000 |
| System | 364,200 | 134,030 | 109,288 | −42,669 | 564,849 |
Table 3.
Electrical energy production and consumption.
| Item | Component | PV Array Title Angle | |||
|---|---|---|---|---|---|
| 0.0 Degree | 30.0 Degree | 50.0 Degree | 70.0 Degree | ||
| Electrical production (kWh/yr) | PV | 504,558 (85%) | 392,281 (82%) | 446,833 (84%) | 484,940 (85%) |
| FC | 88,331 (15%) | 86,400 (18%) | 86,264 (16%) | 82,361 (15%) | |
| Total | 592,889 (100%) | 478,681 (100%) | 533,097 (100%) | 567,301 (100%) | |
| Consumption energy (kWh/yr) | ac Load | 181,324 (42%) | 179,986 (43%) | 180,078 (43%) | 180,320 (44%) |
| Electrolyzer | 245,947 (58%) | 240,740 (57%) | 241,435 (57%) | 229,801 (56%) | |
| Total | 427,271 (100%) | 420,726 (100%) | 421,513 (100%) | 410,121 (100%) | |
| Excess electricity | (kWh/yr) | 143,187 (24.2%) | 34,776 (7.27%) | 88,288 (16.6%) | 132,873 (23.4%) |
| Unmet load | (kWh/yr) | 1176 (0.6%) | 2514 (1.38%) | 2422 (1.3%) | 2180 (1.2%) |
| Capacity shortage | (kWh/yr) | 2176 (1.2%) | 3777 (2.07%) | 3758 (2.1%) | 3682 (2%) |
| Electrical production (kWh/yr) | Derating factor | ||||
| 50 | 60 | 70 | 80 | ||
| PV | 381,384 (82%) | 392,281 (82%) | 396,640 (82%) | 383,564 (82%) | |
| FC | 85,206 (18%) | 86,400 (18%) | 89,286 (18%) | 86,694 (18%) | |
| Total | 466,591 (100%) | 478,681 (100%) | 485,926 (100%) | 470,258 (100%) | |
| Consumption energy (kWh/yr) | ac Load | 180,071 (43%) | 179,986 (43%) | 180,048 (42%) | 180,001 (43%) |
| Electrolyzer | 237,821 (57%) | 240,740 (57%) | 249,503 (58%) | 241,817 (57%) | |
| Total | 417,892 (100%) | 420,726 (100%) | 429,551 (100%) | 421,818 (100%) | |
| Excess electricity | (kWh/yr) | 25,481 (5.46%) | 34,776 (7.27%) | 33,773 (6.95) | 25,271 (5.37%) |
| Unmet load | (kWh/yr) | 2429 (1.33%) | 2514 (1.38%) | 2452 (1.34%) | 2499 (1.37%) |
| Capacity shortage | (kWh/yr) | 3701 (2.03%) | 3777 (2.07%) | 3724 (2.04%) | 3776 (2.07%) |
Table 4.
The detailed performance of different components of the system for some selected cases.
| Quantity | Units | 0.0 degree | 30.0 degree | 50.0 degree | DR = 50% | DR = 70% |
|---|---|---|---|---|---|---|
| PV array | ||||||
| Rated capacity | KW | 280 | 200 | 240 | 350 | 260 |
| Mean output | kW | 58 | 45 | 51 | 44 | 45 |
| Daily mean output | kWh | 1382 | 1072 | 1224 | 1045 | 1087 |
| Capacity factor | % | 20.6 | 22.4 | 21.3 | 12.4 | 17.4 |
| Total production | KWh/yr | 504,558 | 392,281 | 446,833 | 381,384 | 396,640 |
| PV penetration | % | 276 | 215 | 245 | 209 | 217 |
| Hours of operation | h/yr | 4382 | 4382 | 4382 | 4382 | 4382 |
| Levelized cost | $/kWh | 0.028 | 0.0257 | 0.0271 | 0.0463 | 0.033 |
| Fuel cell | ||||||
| Hours of operation | h/yr | 3405 | 3161 | 3095 | 2892 | 3428 |
| Number of starts | Starts/yr | 740 | 699 | 696 | 663 | 734 |
| Operation life | yr | 11.7 | 12.7 | 12.9 | 13.8 | 11.7 |
| Capacity factor | % | 25.2 | 24.7 | 24.6 | 21.6 | 25.5 |
| Total production | KWh/yr | 88,331 | 86,400 | 86,264 | 85,206 | 89,286 |
| Mean electrical output | kW | 25.9 | 27.3 | 27.9 | 29.5 | 26.0 |
| Min. electrical output | kW | 0.4 | 0.4 | 0.4 | 0.45 | 0.4 |
| Max. electrical output | kW | 40 | 40 | 40 | 45 | 40 |
| Hydrogen consumption | Kg/yr | 5300 | 5184 | 5176 | 5112 | 5357 |
| Specific fuel consumption | Kg/kWh | 0.06 | 0.06 | 0.06 | 0.06 | 0.06 |
| Fuel electrical input | KWh/yr | 176,661 | 172,799 | 172,527 | 170,412 | 178,571 |
| Mean electrical efficiency | % | 50 | 50 | 50 | 50 | 50 |
| Battery storage | ||||||
| Number of batteries | 64 | 96 | 96 | 96 | 64 | |
| Nominal capacity | kWh | 138 | 207 | 207 | 207 | 138 |
| Usable nominal capacity | kWh | 96.8 | 145 | 145 | 145 | 96.8 |
| autonomy | h | 3.81 | 5.71 | 5.71 | 5.71 | 3.81 |
| Lifetime throughput | kWh | 68,800 | 103,200 | 103,200 | 10,320 | 68,800 |
| Energy in | KWh/yr | 15,229 | 21,210 | 21,909 | 21,406 | 17,314 |
| Energy output | KWh/yr | 12,945 | 18,028 | 18,623 | 18,195 | 14,717 |
| Losses | KWh/yr | 2284 | 3181 | 3286 | 3211 | 2597 |
| Expected life | yr | 4.9 | 5.28 | 5.11 | 5.23 | 4.31 |
| Hydrogen | ||||||
| Total production | kg/yr | 5300 | 5188 | 5203 | 5125 | 5377 |
| Levelized cost | $/kg | 4.93 | 4.38 | 4.72 | 6.01 | 4.77 |
| Hydrogen tank autonomy | h | 52.6 | 65.6 | 65.6 | 78.8 | 78.8 |
© 2020 by the authors. Licensee MDPI, Basel, Switzerland. This article is an open access article distributed under the terms and conditions of the Creative Commons Attribution (CC BY) license (http://creativecommons.org/licenses/by/4.0/).
Share and Cite
MDPI and ACS Style
Rezk, H.; Kanagaraj, N.; Al-Dhaifallah, M. Design and Sensitivity Analysis of Hybrid Photovoltaic-Fuel-Cell-Battery System to Supply a Small Community at Saudi NEOM City. Sustainability 2020, 12, 3341. https://doi.org/10.3390/su12083341
AMA Style
Rezk H, Kanagaraj N, Al-Dhaifallah M. Design and Sensitivity Analysis of Hybrid Photovoltaic-Fuel-Cell-Battery System to Supply a Small Community at Saudi NEOM City. Sustainability. 2020; 12(8):3341. https://doi.org/10.3390/su12083341
Chicago/Turabian StyleRezk, Hegazy, N. Kanagaraj, and Mujahed Al-Dhaifallah. 2020. "Design and Sensitivity Analysis of Hybrid Photovoltaic-Fuel-Cell-Battery System to Supply a Small Community at Saudi NEOM City" Sustainability 12, no. 8: 3341. https://doi.org/10.3390/su12083341
Note that from the first issue of 2016, this journal uses article numbers instead of page numbers. See further details here.