Chemical Denitrification with Mg0 Particles in Column Systems


Laboratory of Environmental Sanitary Engineering, Department of Environmental Engineering, University of Calabria, 87036 Rende (CS), Italy
*
Author to whom correspondence should be addressed.
Sustainability 2020, 12(7), 2984; https://doi.org/10.3390/su12072984
Submission received: 27 February 2020
/
Revised: 2 April 2020
/
Accepted: 4 April 2020
/
Published: 8 April 2020
(This article belongs to the Special Issue Innovations in Technologies for Nutrients Removal and Recovery From Water and Wastewater)
Abstract
:The removal of nitrate from aqueous environments through zero-valent metallic elements is an attractive technique that has gained increasing interest in recent years. In comparison to other metallic elements, zero-valent magnesium (ZVM) has numerous beneficial aspects. Nevertheless, the use of Mg0 particles for nitrate reduction in column systems has not been investigated yet. To overcome the lack of research, in the present study, a wide experimental activity was carried out to develop a chemical denitrification process through ZVM in batch column equipment. Several tests were executed to evaluate the effects of recirculation hydraulic velocity, pH, Mg0 amount, N-NO3− initial concentration and temperature on the process performance. The results show that the process efficiency is positively influenced by the recirculation velocity increase. In particular, the optimal condition was detected with a value of 1 m/min. The process pH was identified as the main operating parameter. At pH 3, abatements higher than 86.6% were reached for every initial nitrate concentration tested. In these conditions, nitrogen gas was detected as the main reaction product. The pH increase up to values of 5 and 7 caused a drastic denitrification decline with observed efficiencies below 26%. At pH 3, the ratio (RMN) between Mg0 and initial nitrate amount also plays a key role in the treatment performance. A characteristic value of about RMN = 0.333 gMg0/mgN-NO3− was found with which it is possible to reach the maximum reaction rate. Unexpectedly, the process was negatively affected by the increase in temperature from 20 to 40 °C. At 20 °C, the material showed satisfactory denitrification efficiencies in subsequent reuse cycles. With the optimal RMN ratio, removals up to 90% were detected by reusing the reactive material three times. By means of a kinetic analysis, a mathematical law able to describe the nitrate abatement curves was defined. Moreover, the relation between the observed kinetic constant and the operating parameters was recognized. Finally, the reaction pathways were proposed and the corrosion reaction products formed during the treatment were identified.
1. Introduction
Nitrate is one of the most widespread contaminants in surface water and groundwater, due to its high solubility and extensive use in many activities [1]. Nitrogen compounds are released into the environment by several sources, such as chemical fertilizers, pesticides, animal wastes, digestates and municipal and industrial wastewater [1,2,3,4,5,6]. Elevated concentrations of nitrate in water can lead to environmental and health issues. An excess of nitrate can cause eutrophication of water bodies, while drinking contaminated water may cause diseases such as “blue baby syndrome” in infants and stomach cancer in adults [4].
Conventional treatments such as adsorption, ion exchange, reverse osmosis and biological denitrification have been applied to remove nitrate. However, the physico-chemical techniques are quite expensive because of the necessity of periodic media regeneration and the production of wastes to be disposed [7,8,9]. Biological denitrification is suitable for wastewater with sufficiently high nitrate concentration. However, this treatment requires a source of organic matter and generates a biological sludge, which must be further stabilized. Moreover, the residues of bacterial activities and the possible presence of not completely deteriorated organic material make biological processes hardly usable in the treatment of drinking water [10].
Chemical denitrification using zero-valent metals, such as Fe0 and Al0, has attained considerable attention in recent years [10,11]. Inter alia, zero-valent iron (ZVI) has been widely exploited for the removal of nitrate from water [11,12,13,14,15,16]. The use of this metal holds various benefits because Fe0 is abundant, cheap and easily available [17,18,19,20,21,22]. Nevertheless, drawbacks such as great reactive amount requirement, long reaction time and rapid passivation of Fe0 surface have been detected [4]. To overcome these downsides of Fe0, different studies are currently focused on the use of bimetallic systems, nanoparticles, ultrasound assisted processes, pretreatment with acids, etc. [23,24,25,26,27,28,29]. The low efficiency and high pH required, around 10–11.5, are important problems linked to the use of aluminum powder [10]. Moreover, the release in water of notable quantities of dissolved ions (Fe2+, Al3+) during the processes with Fe0 and Al0 causes environmental and health concerns [4]. Neurodegenerative diseases, in particular, may be favoured by excess iron and aluminum [30,31]
Therefore, there is a necessity to identify cheap, plentiful, easily available, non-toxic reactive materials, which can achieve the removal of contaminants in a wide range of operating conditions. In this regard, zero-valent magnesium (ZVM), thanks to its various profitable characteristics, can be considered a valid reactive material in water decontamination [4,32,33,34,35,36,37]. ZVM is an eco-friendly metal and has a greater reduction potential (−2.363 V) than Fe0 (−0.44 V) and Al0 (−1.676 V) [4]. Moreover, magnesium’s surface is less subject to passivation than ZVI [4,32,33]. This advantage of Mg0 over Fe0 is attributable to the higher solubility of magnesium compounds (e.g., ksp of Mg(OH)2 7.08 × 10⁻¹² and ksp of Fe(OH)2 7.943 × 10⁻¹⁶ at 25 °C), which limits the deposition of the reaction products on the external surface thus increasing material reactivity [4,32,33]. Finally, these products (Mg2+ ions) are naturally abundant in waters and safe for both ecosystems and human health [32,33].
Despite the benefits linked to the use of ZVM, the application of this metal in the treatment of contaminated water and wastewater has been scarcely analyzed until now. Some works exploited bimetallic systems (Mg0 coupled with various metal catalysts) to treat recalcitrant organic compounds [34], while Lee et al. investigated the reactions of zero-valent magnesium with water and the reduction of Cr(VI) mediated by ZVM under neutral pH conditions [32,33].
Very little research has focused on the use of ZVM as reagent for chemical denitrification [4,35,36,37]. These papers studied nitrate removal from water using Mg0 through laboratory scale equipment by treating standard solutions. The process performance and the reaction kinetics were analyzed by Kumar et al. [4] and Siciliano et al. [37]. Ileri et al. applied ultrasound to promote the activation of zero-valent magnesium [35] while Mirabi et al. used a hybrid system with zero-valent magnesium powder and activated carbon [36]. These few works, however, exploited zero-valent magnesium as suspended particles in mixed systems [4,35,36,37].
To the best of our knowledge, there are no published works regarding the utilization of this metal for nitrate removal in packed column systems, the process conditions of which, due to the different configurations, are substantially different with respect to the stirred reactors. Column systems are very interesting, being suitable for many applications in water treatment plants and because they have some advantages compared to the reactors with suspended particles. In particular, the solid/liquid separation step, which, in a stirred reactor, needs to remove the reactive material from liquid phase, is useless in a column system. Moreover, column systems can be used to effectively reproduce the working conditions of permeable reactive barriers (PRB) for groundwater remediation [28].
The lack of studies on the use of ZVM in column systems makes it strictly necessary to investigate this type of application. The present work was conducted to overcome the absence of knowledge on nitrate removal through fixed Mg0 particles, providing new information for the development of this technology. In this regard, a wide experimental investigation was conducted using a batch column laboratory plant to analyze the denitrification mechanisms with zero-valent magnesium at different operating conditions. Several tests were carried out to evaluate the concurrent effects of hydraulic recirculation velocity (v), pH, magnesium amount, initial nitrate concentration (Ni) and temperature (T) on the process efficiency. Moreover, further tests were conducted to assess the possibility of reusing the reactive material in subsequent treatment cycles. The trends of the reaction products (NH4+, NO2−, N2 and Mg2+) were also investigated. Furthermore, the reaction kinetics were identified, and a mathematical model able to accurately simulate the nitrate removal curves was developed. Finally, the reaction pathways were proposed and the modifications of ZVM, after the reaction with nitrate were identified.
2. Materials and Methods
2.1. Reagents
Chemicals of analytical grade were exploited to carry out the experiments. Commercial microscopic Mg0, purchased from Sigma Aldrich (St Louis, Missouri, MO, USA), was used as reactive material. The zero-valent magnesium was stored in an airtight container to prevent its oxidation by air. The ZVM particles were analyzed in terms of dimension, specific surface area, morphology, microstructure and composition. The reactive material was used in the tests without any pre-treatment or refinement. In order to analyze the effect of initial N-NO3− amount on the process performance, standard solutions were prepared and treated during the experiments. Potassium nitrate (KNO3) was used to prepare nitrate standard solutions. Hydrochloric acid (37%) and Sodium Hydroxide (1 M) were employed for pH adjustment during the tests. KNO3, HCl and NaOH were supplied by Carlo Erba (Milan, Italy). All solutions were prepared using double-distilled water.
2.2. Batch Denitrification Column Tests
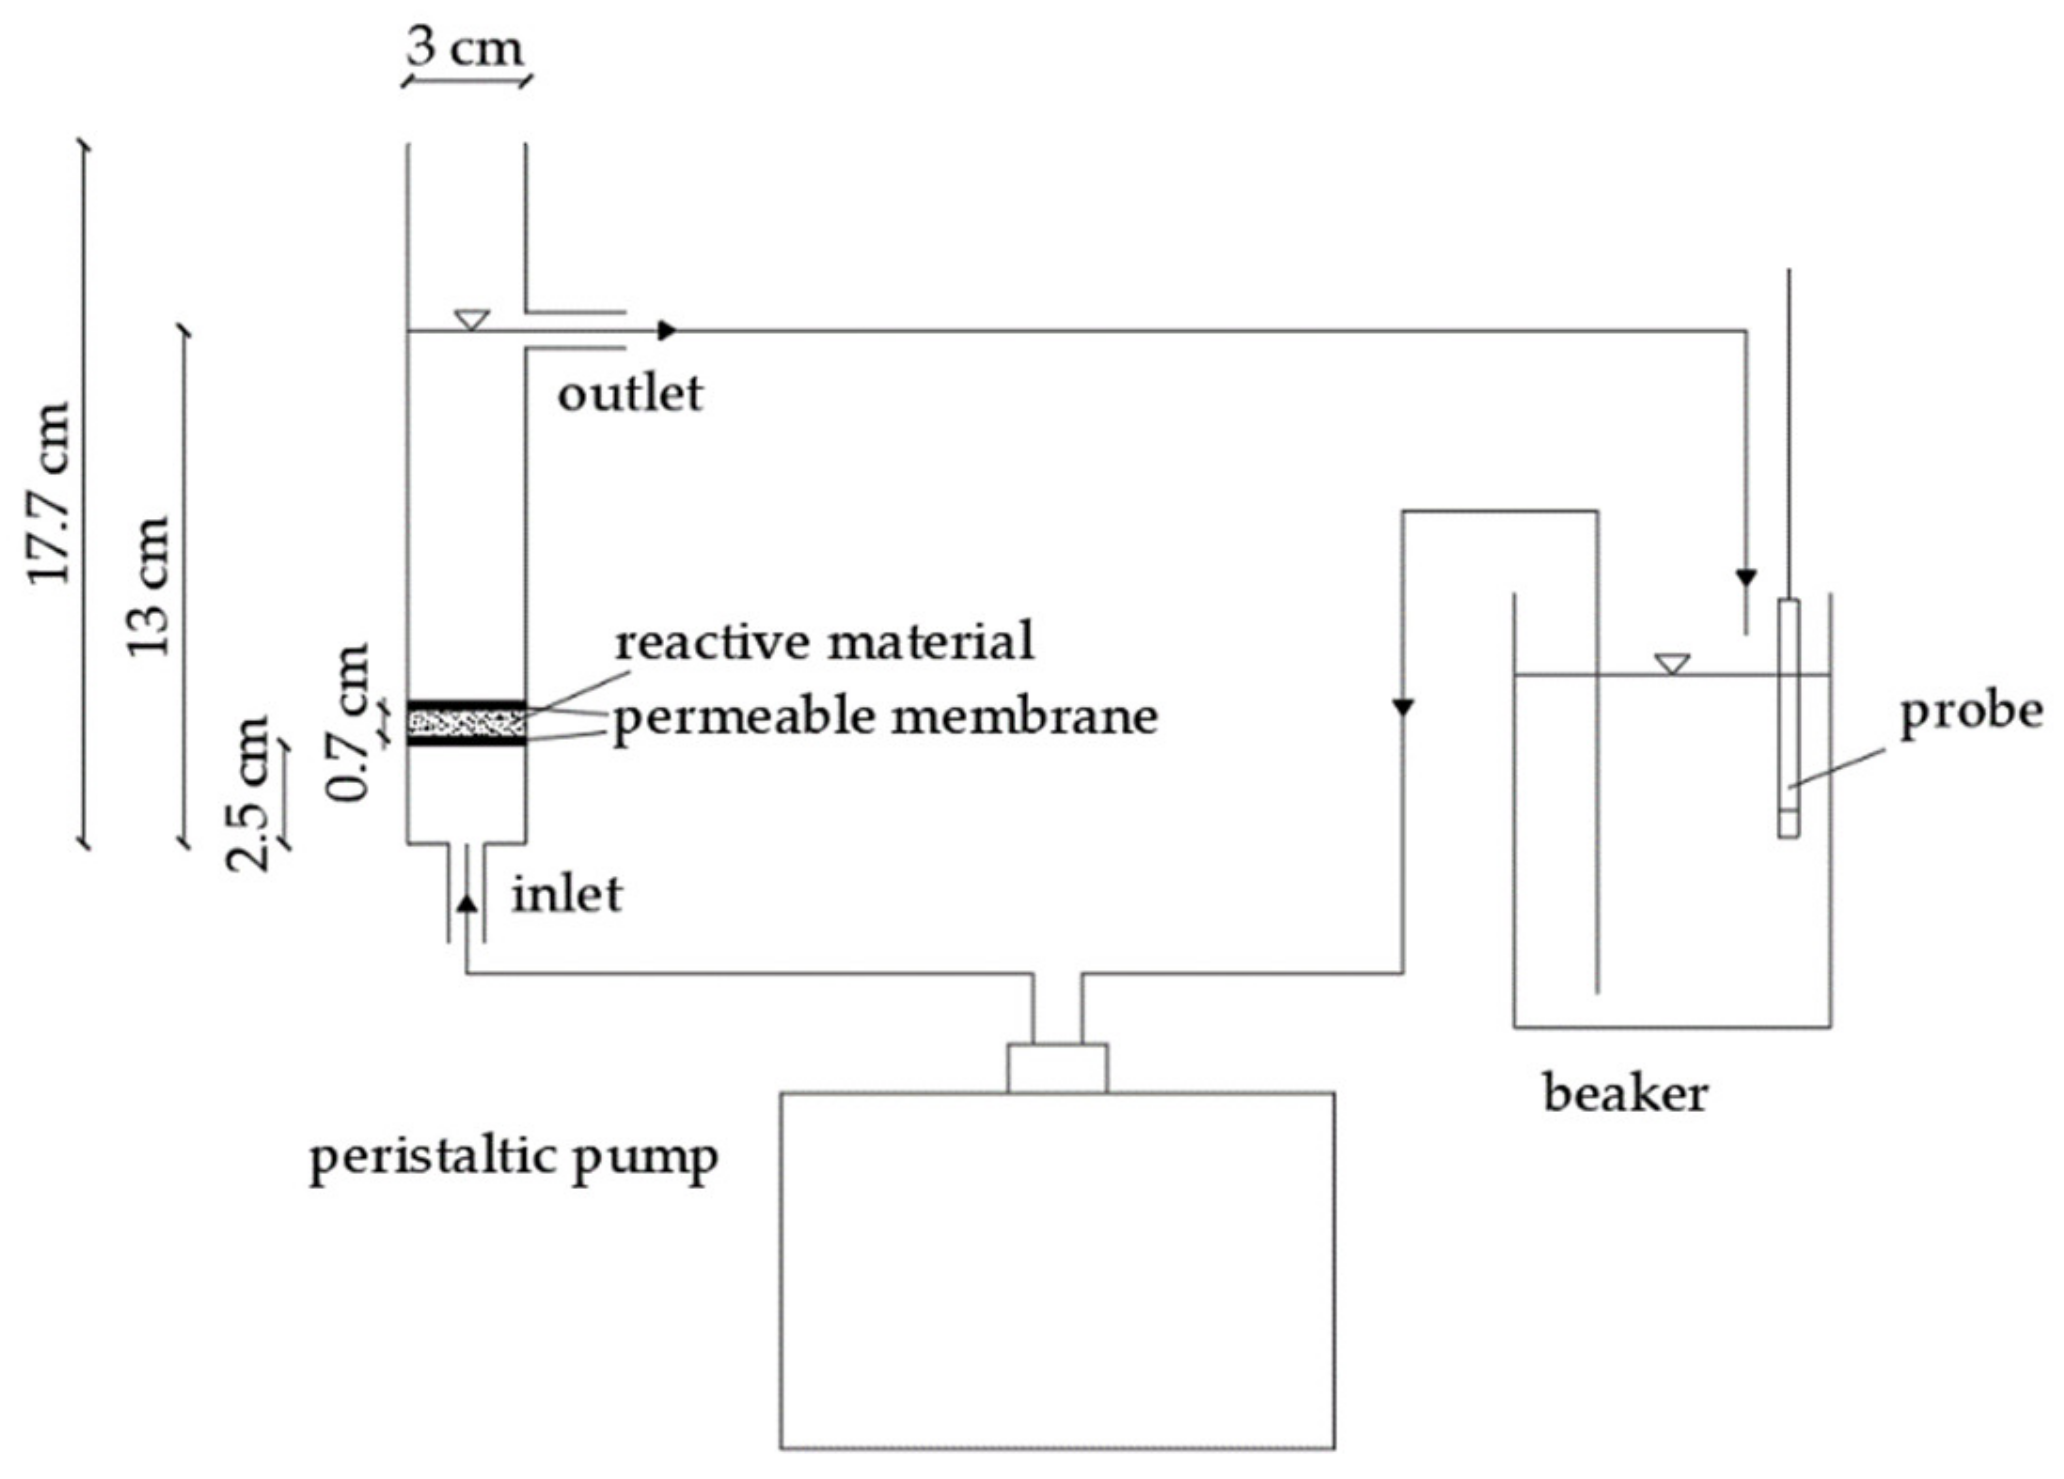
The experiments aimed to identify the concomitant effects of fluid recirculation velocity, pH, ratio between ZVM and initial nitrate amount (RMN) and temperature on the nitrate removal process. All the experiments were conducted by using a Mg0 dose of 2 g. The thickness of reactive material in the column was about 0.7 cm and the porosity was around 0.33 (Figure 1). Firstly, a set of tests was conducted to identify the optimal velocity of recirculation fluid (v). In this regard, four tests were carried out with hydraulic flowrates of 50, 100, 150 and 200 mL/min, which correspond to velocities through the reactive material (v) of 0.33, 0.66, 1 and 1.33 m/min. These velocities were set in order to ensure a very quick recirculation and an adequate homogeneity of the nitrate solution. For each applied velocity, by considering the amounts of the reactive material and the volume of the treating solution, the time per pass through the reactive material was lower than 1.5 s. This assures that the reactor behaves like a time differential reactor. This first set of tests was conducted at pH 3 and using standard solutions with initial N-NO3− concentration Ni = 20 mgN-NO3−/L. The values of the ZVM amount, initial concentration of N-NO3− and pH used for the first set of experiments were established on the basis of the results of our previous work conducted in a completely mixed reactor with suspended Mg0 particles [37]. All the successive experiments were carried out with the optimal velocity identified through the first set. A second set of experiments was performed to analyze the effects of pH and initial nitrate concentration (Ni) on the process efficiency. With this aim, twenty-one tests were conducted at pH 3, 5 and 7 by treating solutions characterized by Ni values of 10, 20, 40, 60, 80, 100 and 140 mgN-NO3−/L. All these tests were carried out at room temperature (20 ± 2 °C). Afterwards, the influence of temperature on nitrate removal was evaluated. In this regard, six tests were conducted adjusting the temperature of reaction mixture at 30 ± 2 and 40 ± 2 °C. For both these temperatures, the experiments were carried out at pH 3, 5 and 7 by treating solutions with Ni = 20 mgN-NO3−/L. Finally, the possibility of reusing the material after the reaction with the nitrate solution was assessed. With this aim, a cycle of six subsequent tests was executed at pH 3 by treating standard solutions with initial nitrate concentrations of 20 mgN-NO3−/L. The first experiment of the cycle was conducted with fresh magnesium powder; while, the following tests were performed exploiting the residual material.
The tests were conducted using a small laboratory pilot plant which included a Plexiglas column made for the purpose of this study. The column had an internal diameter of 2.4 cm, an external diameter of 3 cm and a total height of 17.7 cm (Figure 1). The cross section resulted of about 4.52 cm2. The device had a hole on the bottom for the inlet flow and another one, at a height of approximately 13 cm, for the outlet flow. The magnesium powder was fixed in the column between two permeable membranes.
In each test, a beaker of 0.4 L was filled with 300 mL of nitrate standard solution thus, the solution pH was set to the planned value. The nitrate solution was recirculated from the beaker through the column, in up flow mode, using a peristaltic pump. During the tests, the pH and the temperature were continuously monitored by means of a multiparametric probe placed inside the beaker. The solution pH was held to the established value by adding HCl. The temperature of the nitrate solution was kept constant using a heating plate, the operation of which was controlled by means of a multiparametric probe. No action was taken to eliminate the oxygen dissolved in the reaction solutions. Samples of 10 mL were periodically withdrawn and immediately filtered; afterwards the solution was characterized in terms of nitrogen compounds (N-NO3−, N-NO2− and N-NH4+) and dissolved magnesium ions (Mg2+). Moreover, after the treatment, morphology, microstructure and composition of the residual reactive material were analyzed by means of scanning electron microscopy/wavelength dispersive spectroscopy (SEM-WDS) and X-ray diffraction (XRD).
2.3. Analytical Methods and Presentation of Results
Temperature and pH were monitored using a bench analyzer (Hanna Instruments, HI 9024-Woonsocket, Rhode Island, RI, USA). On samples withdrawn during the experiments, the concentrations of the nitrogen compounds and magnesium ions were measured according to APHA methods [38]. Nitrogen forms were measured through colorimetric methods using a UV-visible spectrophotometer (ThermoFisher, Genesys 10 UV-Vis, Waltham, Massachusetts, MA, USA). In particular, nitrate nitrogen (N-NO3−) was estimated by the ultraviolet spectrophotometric method at a wavelength of 220 nm (APHA method n.4500-NO3−.B), ammonium nitrogen (N-NH4+) was measured by the phenate method at 690 nm wavelength (APHA method n.4500-NH3.B) and nitrous nitrogen (N-NO2−) was calculated by the sulfanilamide method at a wavelength of 543 nm (APHA method n.4500-NO2−.B). It was not possible to measure the gaseous species produced during the experiments due to the open column system used in this work. Therefore, the missing nitrogen in the solution (ΔN; mgN/L), which was converted into gaseous form, was calculated as the difference between the initial nitrate concentration and the sum of N-NO2−, N-NH4+ and residual N-NO3−, in agreement with the procedures adopted by Kumar et al. [4] and Ileri et al. [35]. The Mg2+ amount was determined through atomic absorption spectrometry (GBC, 933 plus-Hampshire, Illinois, IL, USA), (APHA method 3500-Mg.B).
The sizes of Mg0 particles were estimated by means of a particle dimensions analyzer (Malvern Mastersize 3000-Malvern, Worcestershire, UK). The Brunauer–Emmett–Teller (BET) N2 adsorption method was used to measure the specific surface area of ZVM particles (ThermoFisher, Sorptomatic 1990-Waltham, Massachusetts, MA, USA). X-ray diffraction (GNR, APD 2000 pro-Novara, Italy), scanning electron microscopy and wavelength-dispersive spectroscopy (JEOL, JXA-8230-Peabody, Massachusetts, MA, USA) were applied to analyze the reactive materials before and after the reaction with NO3− solutions.
Each analysis was carried out in triplicate and the mean value was assumed. The values of the relative standard deviation were always lower than 10%.
3. Results and Discussion
3.1. Characteristics of the Zero-Valent Magnesium
The zero-valent magnesium particles (purity 99%, density 1.74 g/mL) exploited in the present study had dimensions between 60 and 510 μm, with the greater part of them characterized by a size in the range 200–300 μm [37]. The shape was pseudo-spherical and irregular and the outer surface was slightly coarse. The value of specific surface area (A) was 0.0204 m2/g [37].
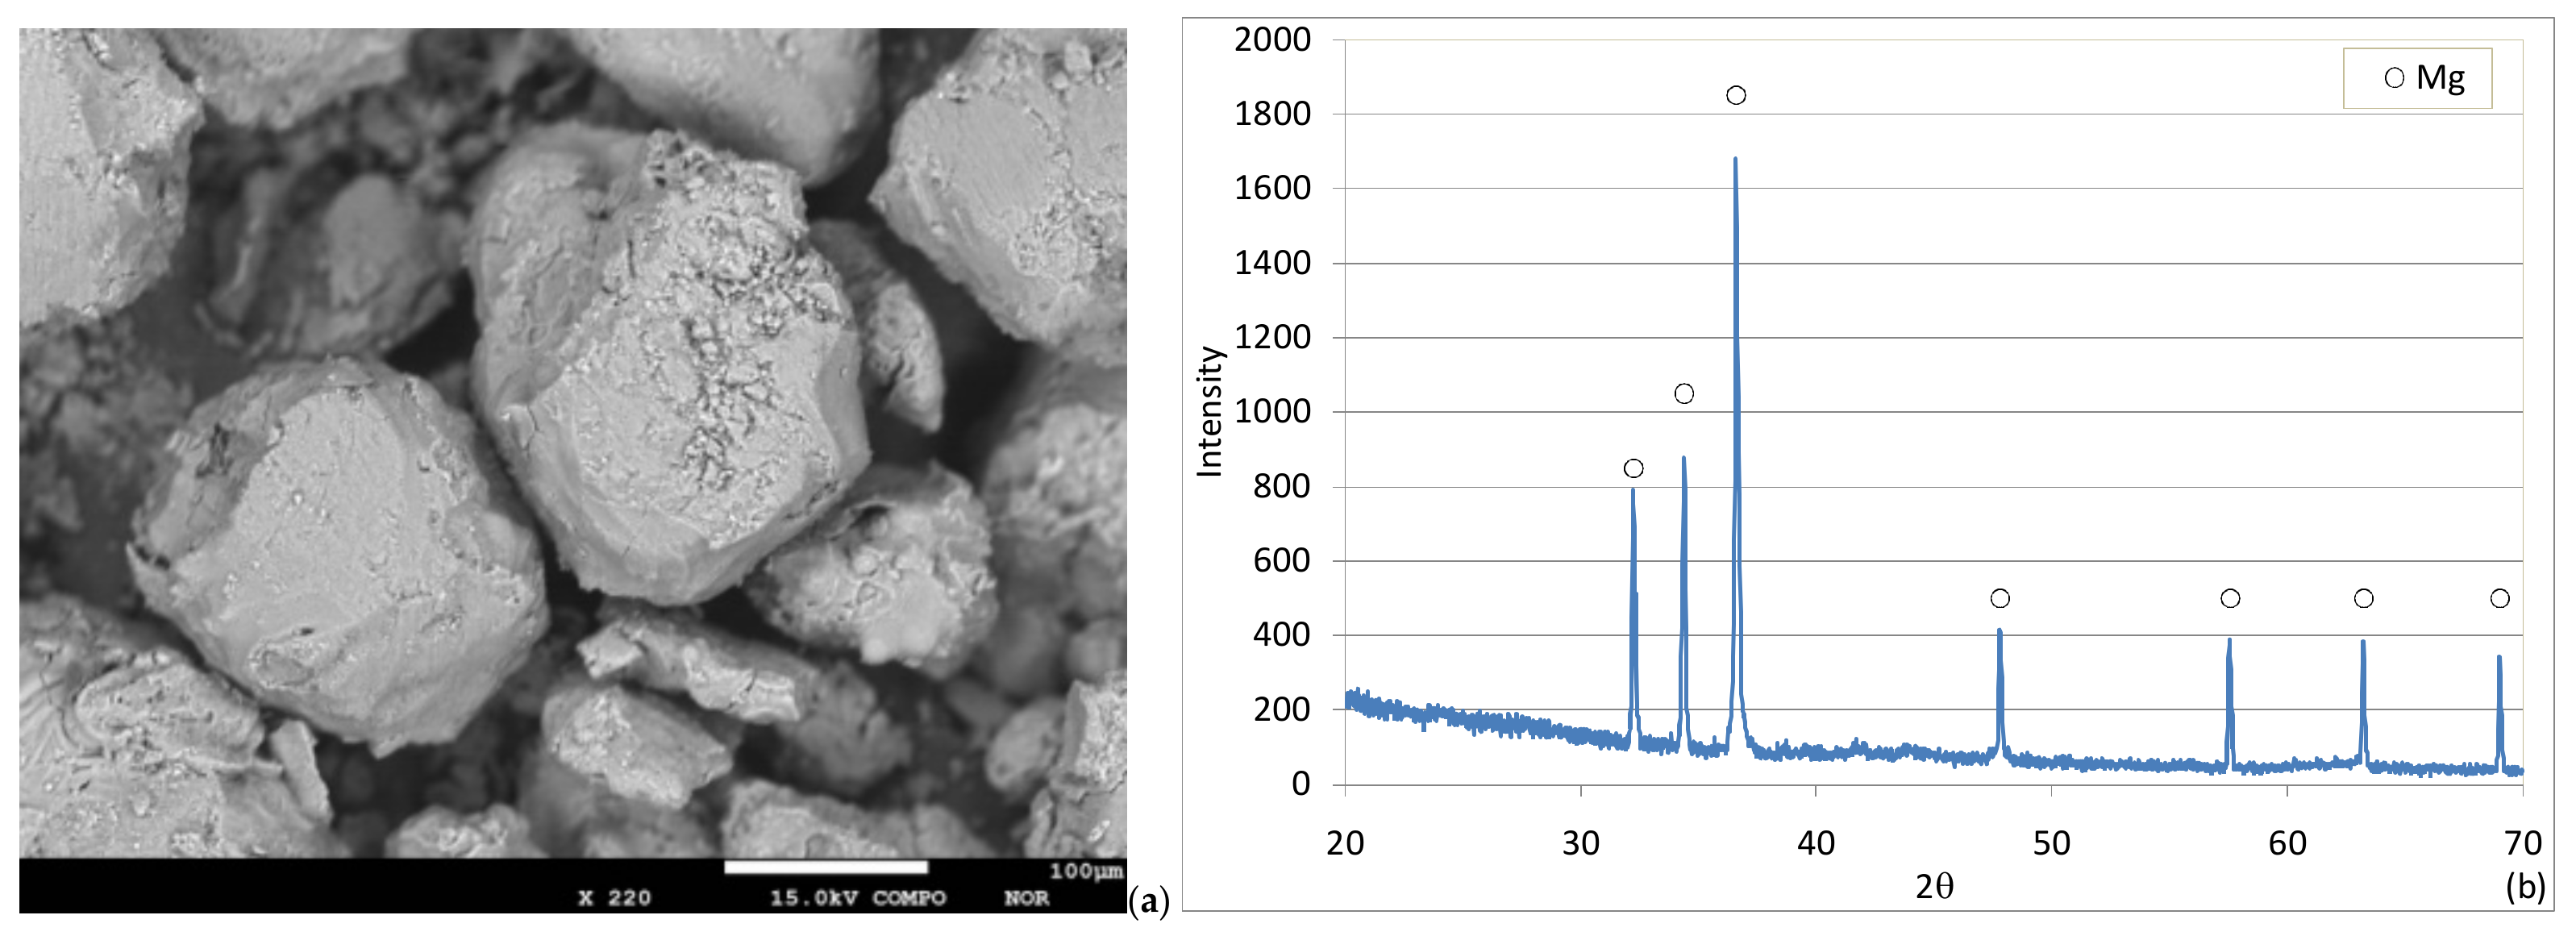
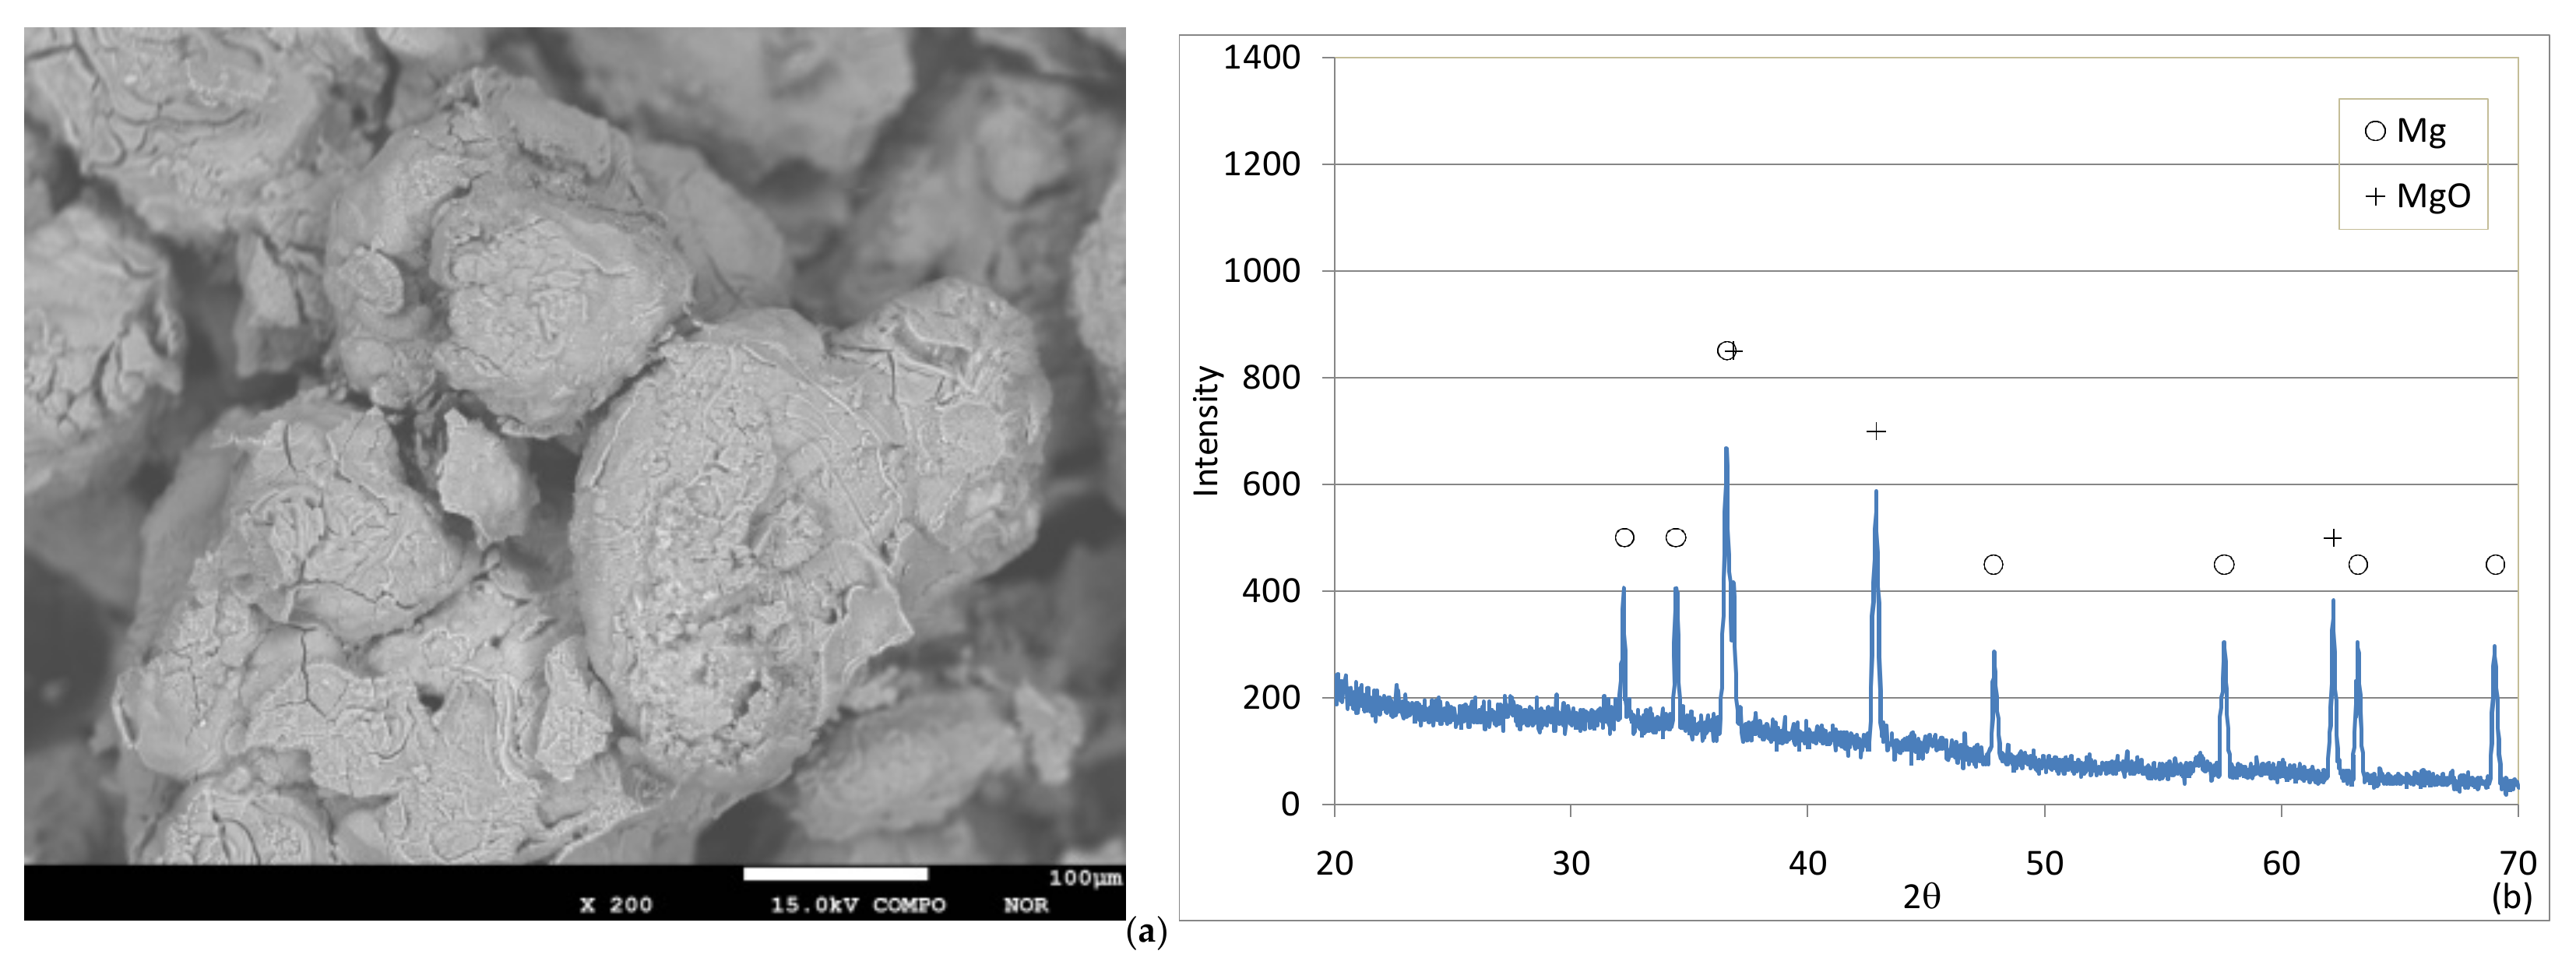
The SEM image and the XRD spectrum of the fresh ZVM particles are reported in Figure 2. The detected diffractogram shows the characteristic peaks of Mg0 with no noticeable trace of other elements (Figure 2b). The WDS analysis also proved that the reactive material consisted almost totally of Mg0 (99.1%), with a very low amount of oxygen (0.6%) and other elements (0.3%). The strict correspondence of the detected diffractogram with the standard of Mg0 (Figure 2b) and the extremely low amount of oxygen measured through the WDS analysis confirmed that the reactive material was not oxidized before its application in the experiments.
3.2. Tests with Different Hydraulic Recirculation Velocities
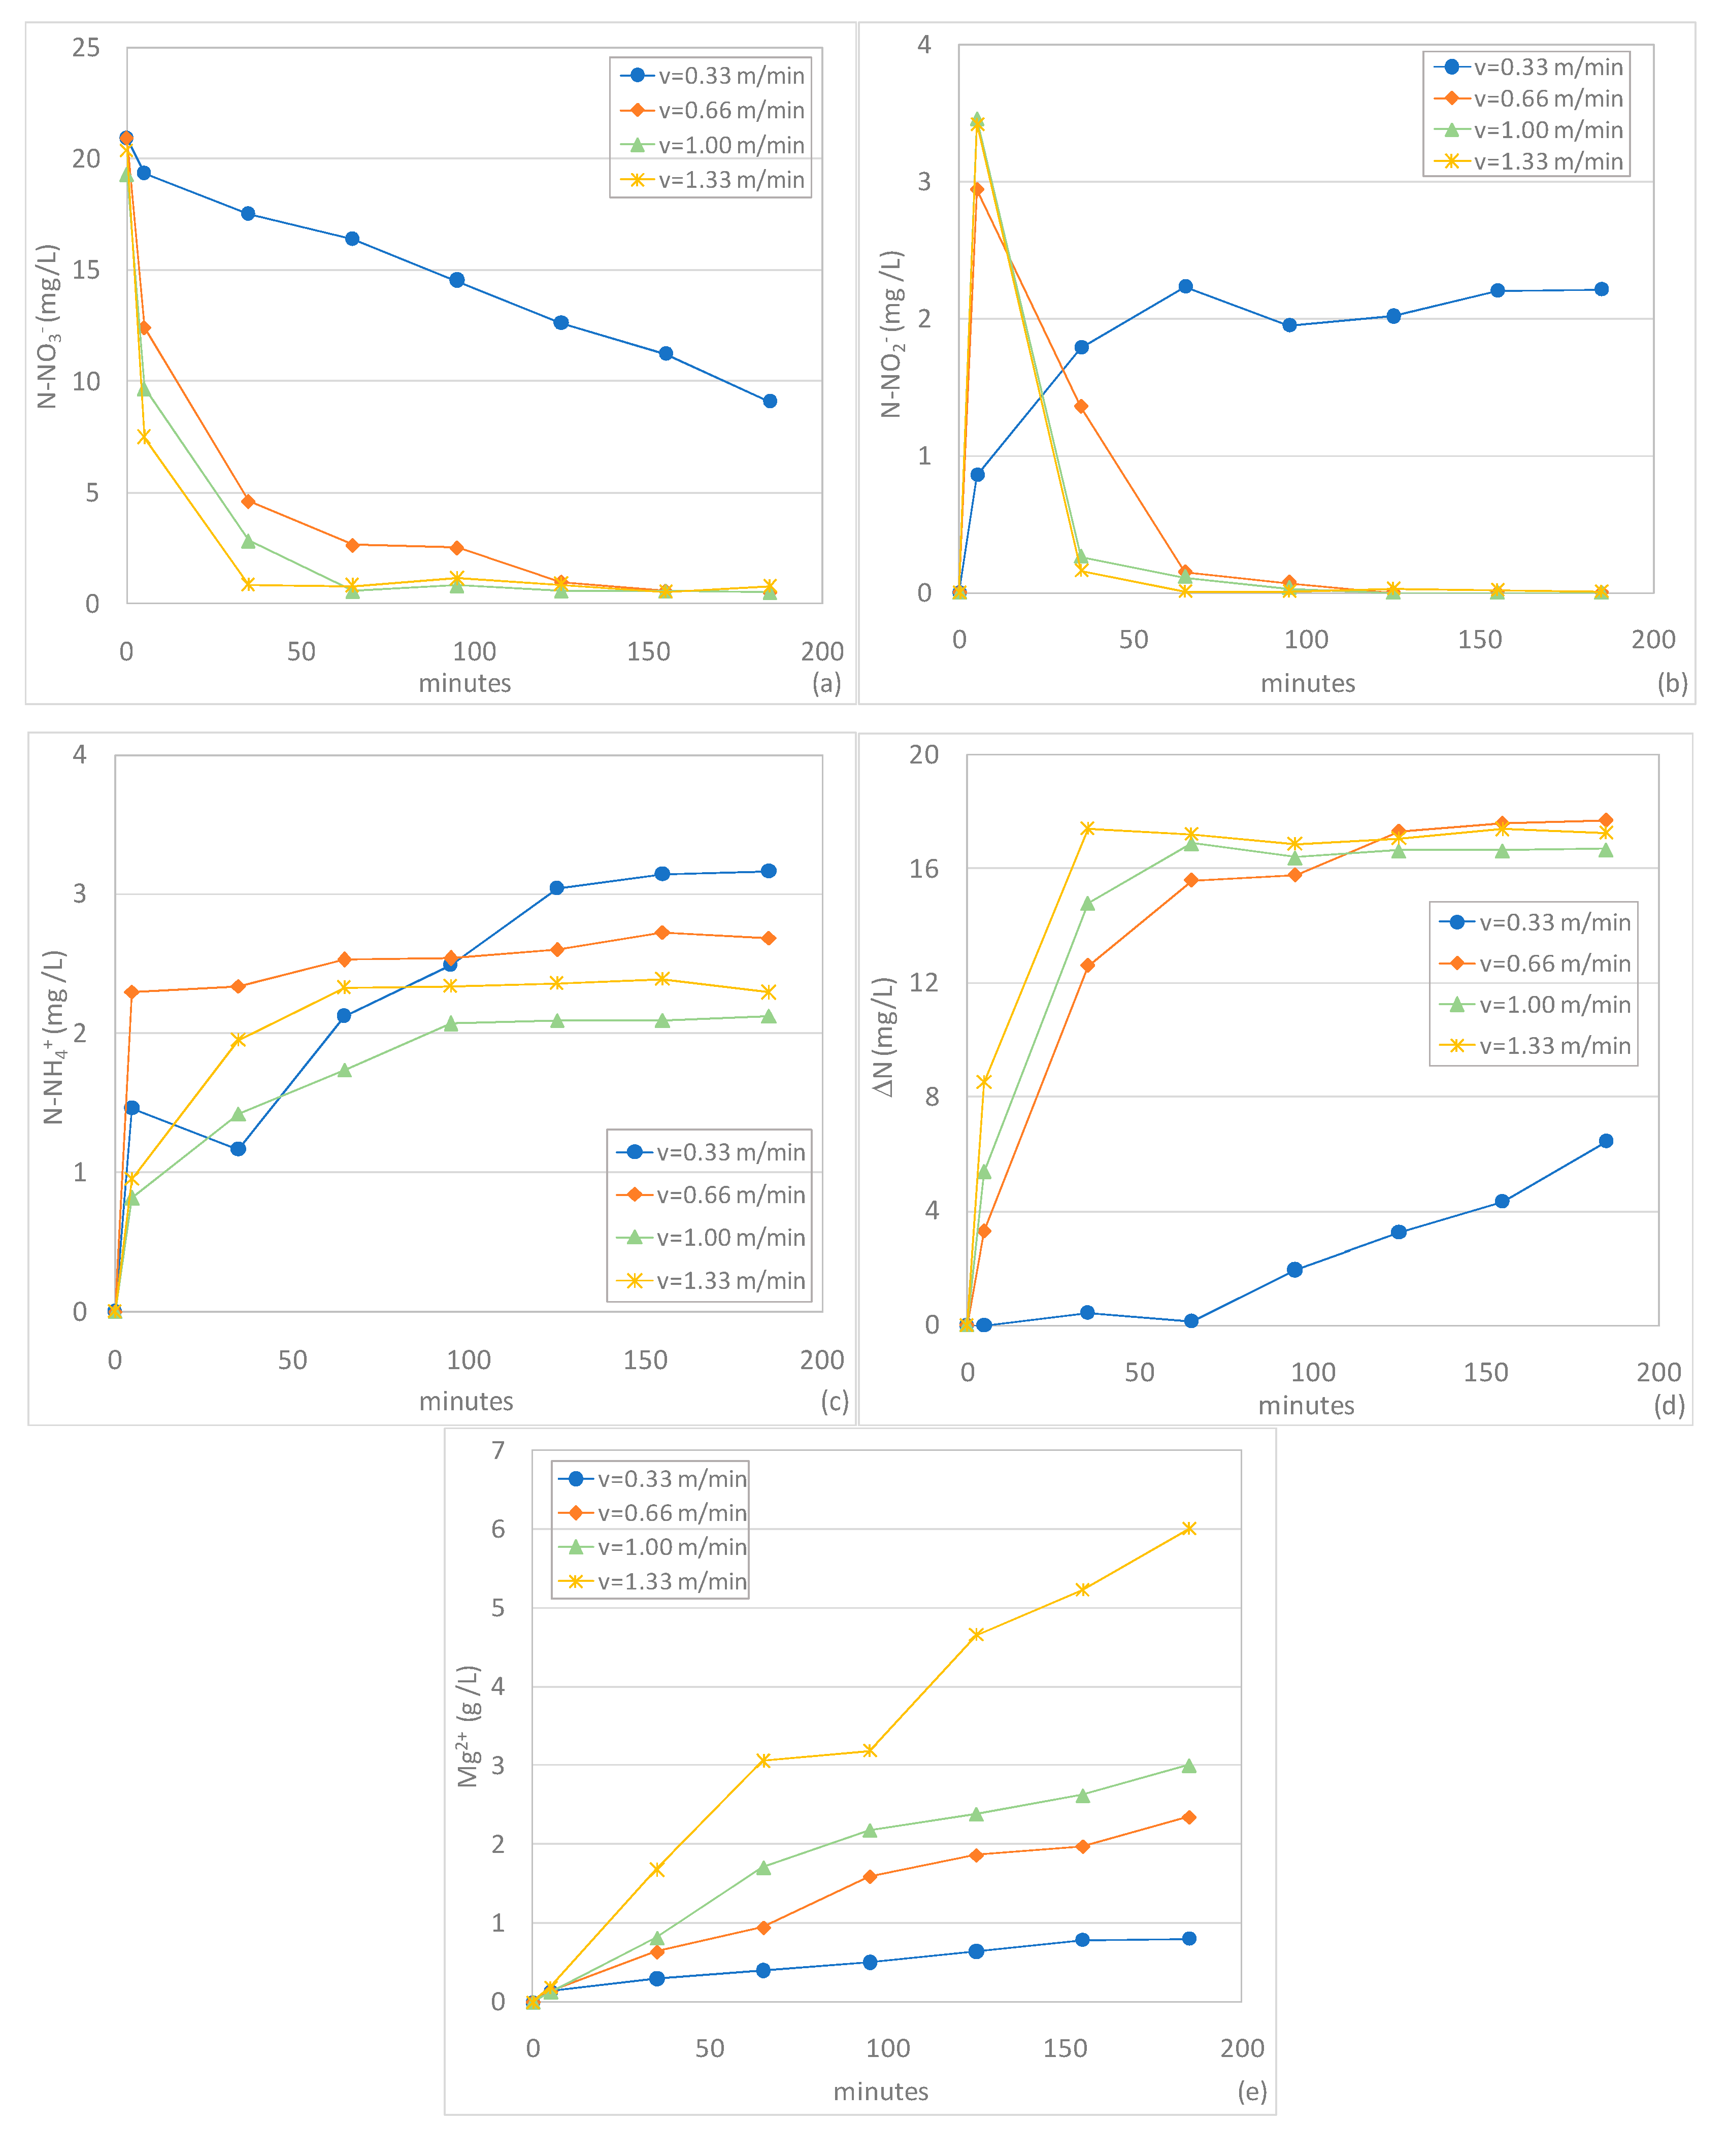
The first set of tests aimed to evaluate the impact of recirculation velocity on the nitrate reduction process. Four tests with velocities through the column (v) of 0.33, 0.66, 1 and 1.33 m/min were carried out. Each experiment was conducted at pH 3 with a Mg0 dose of 2 g by treating a solution characterized by N-NO3− concentration of 20 mg N-NO3−/L. A slow nitrate reduction and an overall removal yield of about 56% were monitored in the test conducted with v = 0.33 m/min (Figure 3a). The reaction rate notably grew with the recirculation velocity and an almost complete removal was reached after an hour and 30 min in the tests with v = 1 m/min and v = 1.33 m/min, respectively (Figure 3a). These results clearly indicate that the overall reaction rate is notably affected by the recirculation velocity through the column. The raise in denitrification performance is probably related to higher mixing phenomena caused by a rapid flow passing through the reactive material. In batch column systems, the intensity of recirculating flux promotes the exposure between nitrate solution and reactive material and, thus, the overall reaction rate. Nevertheless, an excessive velocity of the hydraulic flow could cause the instability of the packed bed. During the test with the maximum velocity of 1.33 m/min, which showed the highest reaction rate, an aliquot of the reactive material was fluidized and transported by the stream in the beaker containing the recirculating solution. At the end of the treatment, these particles were recovered from the beaker, dried and weighed. An overall quantity of 62 mg was detected, which accounts for about 3% of the initial Mg0 amount put in the column. This loss of material cannot be neglected and it would increase by applying even higher velocity. Such a condition, obviously, is not tolerable in column systems. Therefore, taking into account this drawback, among the values tested in this study, the velocity of 1 m/min was considered as the more suitable for the treatment.
This velocity allows nitrate abatements of about 97%, higher than those reported by Ileri et al., who registered a removal yield close to 90% within an hour using ultrasound-activated zero-valent magnesium [35].
The higher reactivity observed at elevated velocities is also confirmed by the profiles of dissolved magnesium ions monitored over the treatment. As shown in Figure 3e, the Mg2+ concentration grew more quickly with the greater velocities, which underlines a more intensive interaction between reactive material and pollutant. However, in the test conducted with v = 1.33 m/min, the Mg2+ concentration reached a level double that observed using v = 1 m/min. To this much greater Mg0 consumption does not match an equally high increase in N-NO3− removal. This means that a greater amount of magnesium powder is consumed in an ineffective way working at 1.33 m/min. Indeed, in addition to the reaction with NO3−, zero-valent magnesium is also solubilized by interaction with water. It is conceivable that this last mechanism is largely promoted by the flow intensity through the column. The much higher release of magnesium ions in water is a negative aspect, even if the magnesium does not pose environmental or health concerns. Furthermore, as a consequence of greater Mg0 consumption, a lower amount of reactive material would be recovered at the end of treatment and, therefore, its reuse for subsequent treatment cycles would be limited. These aspects confirm that the velocity of 1 m/min is more advantageous for chemical denitrification because it allows a good performance with a minor consumption of the reactive material and a lower release of magnesium ions in water. In addition to N-NO3− and Mg2+ ions, the formation of other reaction products was monitored during the tests. The main compounds generated through the chemical denitrification with ZVM particles are nitrous nitrogen (N-NO2−), ammoniacal nitrogen (N-NH4+) and gaseous nitrogen (N2), as stated in previous works [4,35,37]. Clearly, gaseous nitrogen is the more beneficial reaction product being a gas insoluble in water that rapidly volatilizes in atmosphere. The trends of these products notably vary in response to operating conditions applied [37].
Nitrous nitrogen (N-NO2−) represents an intermediate product which is formed from nitrate and it can be converted itself to reduced forms of nitrogen. The curves obtained in the tests conducted with velocity of 0.66, 1 and 1.33 m/min show an initial growing phase, up to a maximum value of N-NO2−, and a subsequent decrease to concentrations near to zero (Figure 3b). On the contrary, using a velocity of 0.33 m/min, an asymptotic growing profile, up to a threshold value close to 2.2 mgN-NO2−/L, was detected (Figure 3b). This residual concentration is, obviously, a negative aspect, because the nitrous nitrogen is more toxic than nitric nitrogen. Therefore, the detected results confirm that low hydraulic recirculation velocities worsen the performance of chemical denitrification causing incomplete transformations with residual concentrations of undesirable products. Instead, proper values of flow through the column permit high reaction rates and a complete consumption of nitrite produced from nitrate reduction. The faster transformations of nitrous nitrogen were observed with velocities of 1 and 1.33 m/min, reaching whole abatements of nitrite in about 60 min (Figure 3b). The substantial coincidence of N-NO2− curves obtained with these velocities demonstrates that it is not advantageous to increase the flow velocity beyond a value of 1 m/min. The trend detected with this velocity is in line with that we detected using a completely mixed system which was able to ensure nitrite concentration near to 0 within 60 min [37]. Moreover, the performances reached in the present study were higher with respect to the statements of other authors. In fact, Ileri et al. reported parabolic shape nitrite curves which reached values below 1 mg/L in more than two hours using a magnesium dose of 5 g/L and an ultrasound power above 90 W [35].
Through the chemical denitrification process, ammoniacal nitrogen can be formed from nitrate and nitrite reduction [37]. The ammonium concentrations (N-NH4+) detected during the experiments showed increasing curves up to asymptotic values (Figure 3c), in agreement with the results observed in previous works [7,12,23,35]. The final concentration was quite low in each experiment (Figure 3c). Nevertheless, using a velocity of v = 0.33 m/min, despite the lowest observed nitrate abatement, the maximum production of ammonium, of about 3.15 mgN-NH4+/L, was found. This is a further negative aspect of treatment with low recirculation velocity because it leads to higher residual concentrations of nitrogen in the form of ammonium and reduces the conversion into nitrogen gas. Instead, the increase in flow through the column minimizes the reduction of nitrate into N-NH4+. In fact, with the higher velocities, even though the nitrate concentrations were almost totally reduced, the final concentrations of ammonium were lower than that those observed in the test with v = 0.33 m/min.
Because the production of free NH3 can be neglected, given the acidic process pH, the low ammonium concentrations suggest the formation mainly of nitrogen gas (N2), which coincides with the actual quantity of nitrogen removed (ΔN) from the solution [4,35]. The quantity of ΔN was rather small during the treatment with the lowest applied velocity, while it grew, attaining a similar asymptotic value of about 17 mgN/L, in the tests at higher flow velocities (Figure 3d). This means that with a proper recirculation velocity, almost 85% of the initial nitrate amount is converted in N2 and, thus, is actually removed from the solution. This feature makes the use of ZVM very profitable because the formation of undesirable compounds (NO2− and NH4+) is restricted. Contrary to the results detected in this study, N-NH4+ was the main end product of chemical denitrification processes conducted by means of zero-valent iron [13,15,16,21]. In particular, Cheng et al. [13] and Huang et al. [16] obtained a 100% conversion of nitrate into ammonium exploiting microscopic iron. Therefore, the use Fe0 for nitrate reduction makes it necessary to have a post-treatment aimed to remove the NH4+ produced during the denitrification [8,9]. This necessity could be avoided by exploiting ZVM as a reactive material because; as mentioned above, the nitric nitrogen is reduced mostly into nitrogen gas. Such an aspect undoubtedly promotes the use of Mg0 in comparison to other zero-valent metals.
3.3. Tests Conducted at Different pH and Initial N-NO3− Concentrations
Once the optimal flow velocity was identified (1 m/min), further experiments were conducted in order to investigate the effects of initial N-NO3− concentration and process pH. This second set of tests was carried out at pH values of 3, 5 and 7 by treating nitrate solutions with initial concentrations between 10 and 140 mgN-NO3−/L.
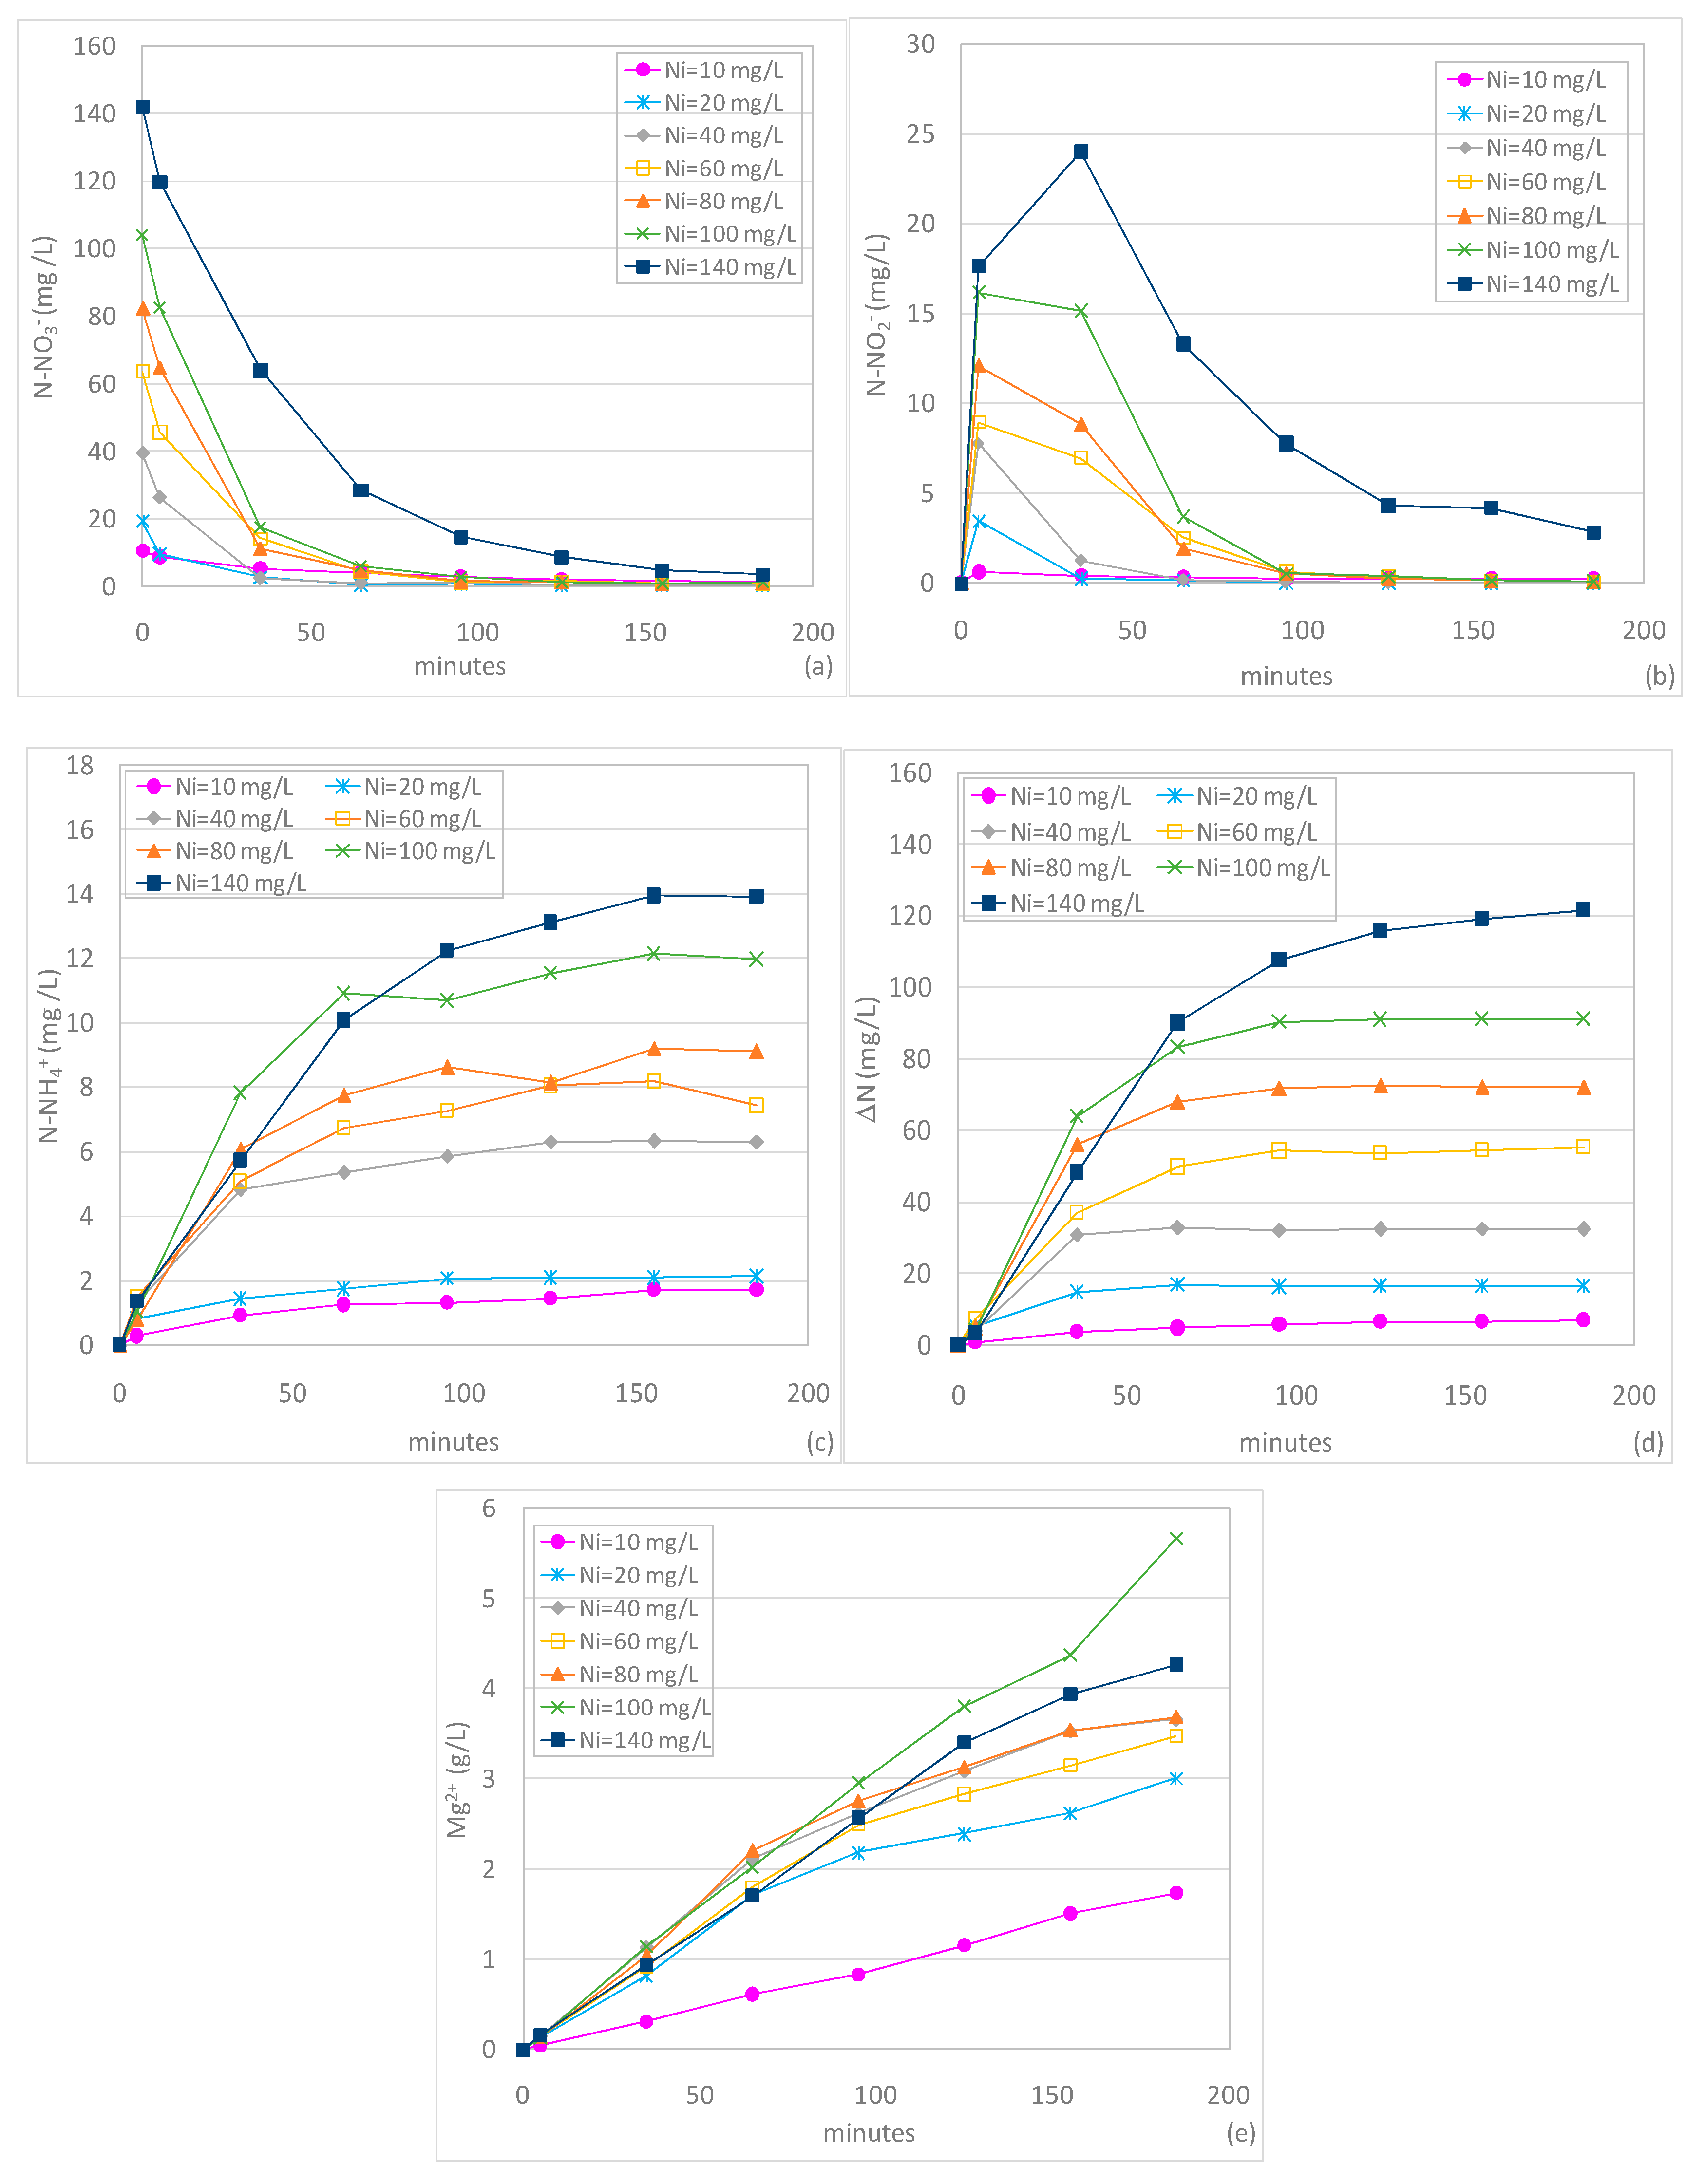
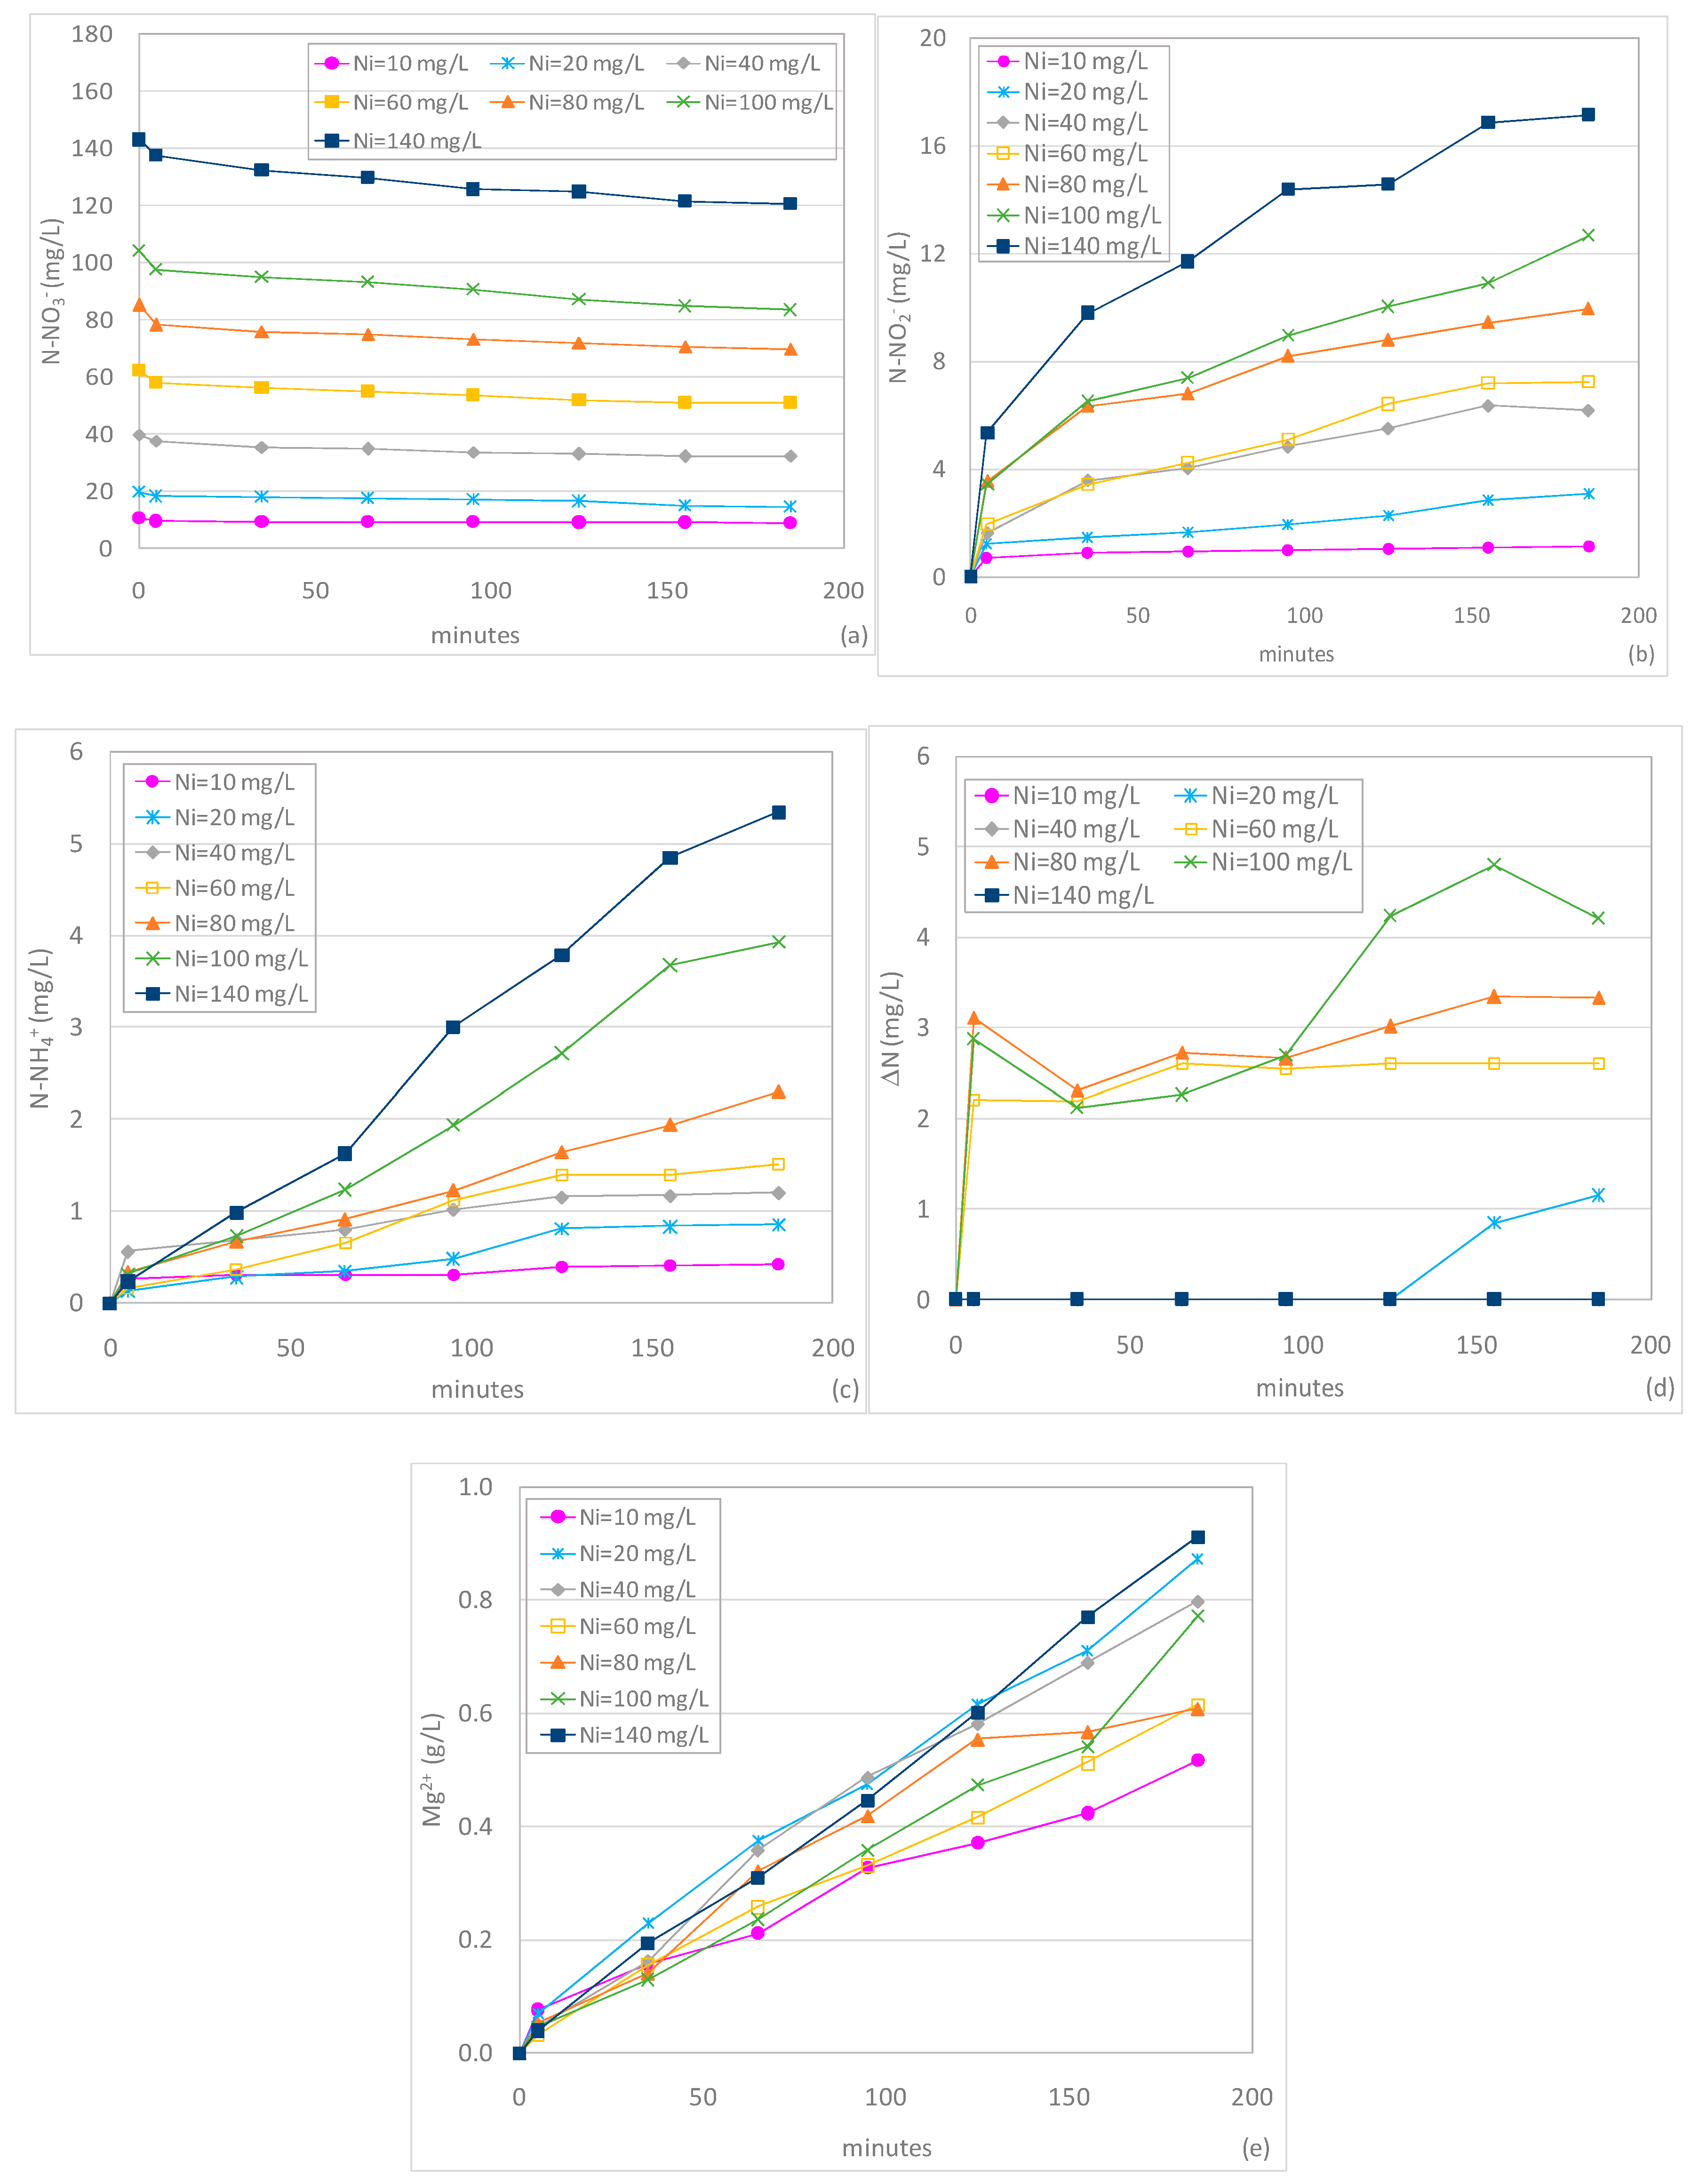
The tests conducted at pH 3 showed always satisfactory removal yields (Figure 4a). However, the worst abatement was detected by treating the solution with the lowest initial N-NO3− concentration of 10 mgN-NO3−/L. In this test, a nitrate removal equal to 86.6% was reached at the end of treatment (Figure 4a). The minor process performance, compared to those observed in the other experiments, occurred despite the high ratio between the reactive material and the N-NO3− amount (RMN) equal to 0.666 gMg0/mg N-NO3−. On the basis of this evidence, it can be assumed that a small initial N-NO3− concentration slows down the reaction rate even in the presence of a high amount of reactive material. Indeed, by treating water characterized by limited N-NO3− quantities, it is conceivable that magnesium reacts mainly with water and oxygen, which leads to the decline of denitrification. These findings confirm what we found by using a suspended batch system for nitrate removal with ZVM powder [37].
The process efficiency was notably higher in the test conducted on a solution with Ni = 20 mg N-NO3−/L, which corresponds to an RMN ratio of 0.333 gMg0/mgN-NO3−. However, beyond the value of 20 mgN-NO3−/L, the increase in initial concentration caused a general reduction in the reaction rate that was more marked by treating solutions with nitrate amounts higher than 60 mgN-NO3−/L. These statements do not agree with the findings of previous works which observed better nitrate removal with the increase in the solution’s concentration [4]. The differences with our findings can be attributable to the different amount of magnesium used for experiments execution. Indeed, the results of this work indicate that the reaction rates and the period necessary to obtain a given yield are affected by the amount of ZVM with respect to the initial N-NO3− quantity in the treating solution. In particular, with RMN = 0.333 gMg0/mgN-NO3− it is possible to achieve the highest nitrate removal of about 98% in an hour. The performance of the process got worse by rising or diminishing this RMN value which, therefore, can be assumed as the most advantageous for NO3− reduction at pH 3. By considering the specific surface area of ZVM particles (A=0.0204m2/g) and by expressing the N-NO3− amount in terms of moles, the value RMN = 0.333gMg0/mgN-NO3− becomes equal to 95.1 m2/mol. This ratio is lower than the value reported in previous works that exploited Fe0 particles. Huang et al. identified a Fe0/N-NO3− value of 120 m2/mol to reach a complete nitrate removal in a reaction time of about an hour [11]. Thus, the results obtained through our experiments denote the good performance of Mg0 in the column systems for chemical denitrification. Other studies, conducted using Mg0, reported Mg/N-NO3− ratios lower than the value assessed in this work. Kumar et al. estimated a value of 19 m2/mol to achieve a denitrification efficiency of about 80% [4]. However, it must be noted that the above ratio refers to a process yield notably lower than those considered in our evaluation. Moreover, the operating modalities applied by Kumar et al. [4], such as a lower pH (pH 2) and strong mixing conditions, were more advantageous compared to those used during our tests. These conditions can promote the nitrate reduction but make the process more complex and expensive.
Similarly to the results previously shown, the trends of N-NO2− concentration first showed initial growing phases, due to the formation of nitrite from nitrate, and subsequent decreasing behaviors, as a consequence of nitrite conversion into ammonium and nitrogen gas (Figure 4b).The duration of the production phase was very short for each test with the exception of experiments conducted with higher initial N-NO3− concentrations and lower RMN ratios. These tests also show the slower decreasing phases as a consequence of smaller reaction rates. Nevertheless, only in the test conducted with Ni = 140 mgN-NO3−/L, was nitrite found in an appreciable residual level, equal to 2.8 mgN-NO2−/L, while the other experiments showed a final N-NO2− concentration close to zero (Figure 4b). These results are better than those we observed with a completely mixed system, which showed residual concentrations of nitrite higher than about 4.5 mgN-NO2−/L when solutions with initial concentrations beyond 60 mgN-NO3−/L were treated [37]. This comparison confirms the good performance of the column systems in the chemical denitrification.
The ammonium concentration always showed asymptotic increasing trends (Figure 4c). It is interesting to note that the final value reached in the test with Ni = 20 mgN-NO3−/L is almost equal to that monitored when the solution with 10 mgN-NO3−/L was treated. This indicates that a much higher amount of initial N-NO3− was converted into N2, instead of N-NH4+, by using a RMN = 0.333 gMg0/mgN-NO3− (Ni = 20 mgN-NO3−/L) (Figure 3c). Such a result further confirms the minor process efficiency in the treatment of low concentrated solutions. However, the percentage of nitric nitrogen reduced to N-NH4+ was always quite low and between 10% and 16%. We detected a higher fraction of ammonium, up to 26%, in a conventional suspended system [37]. The moderate ammonium production in the present work, as previously discussed, is a positive aspect of treatment with Mg0 particles as compared to Fe0 processes, during which ammonium was identified as the major end product [7,13,15,16,21]. In this study, instead, the main final product of the treatment was nitrogen gas (N2). As shown in Figure 4d, the removed nitrogen (∆N), which corresponds to the produced N2, exhibited cumulative trends characterized by asymptotic values that proportionally grew with the initial nitrate concentration. In particular, except for the test with Ni = 10 mg N-NO3−/L, in which 68.2% of influent nitrate was converted into N2, more than 82% of nitrate was transformed into nitrogen gas in the other tests (Figure 4d).
The concentration of dissolved magnesium, as to be expected, showed an increasing curve for each Ni value (Figure 4e). It must be noticed that the Mg2+ ions grew even beyond the point at which the nitrate removal was completed. Such a feature can be explained by considering that, after the denitrification completion, the magnesium solubilization continued through the reaction of reactive material with water and oxygen. The levels of Mg2+ were smaller compared to those we detected with suspended Mg0 particles [37]. Therefore, the column system reduces the release of magnesium ions in the treating solution.
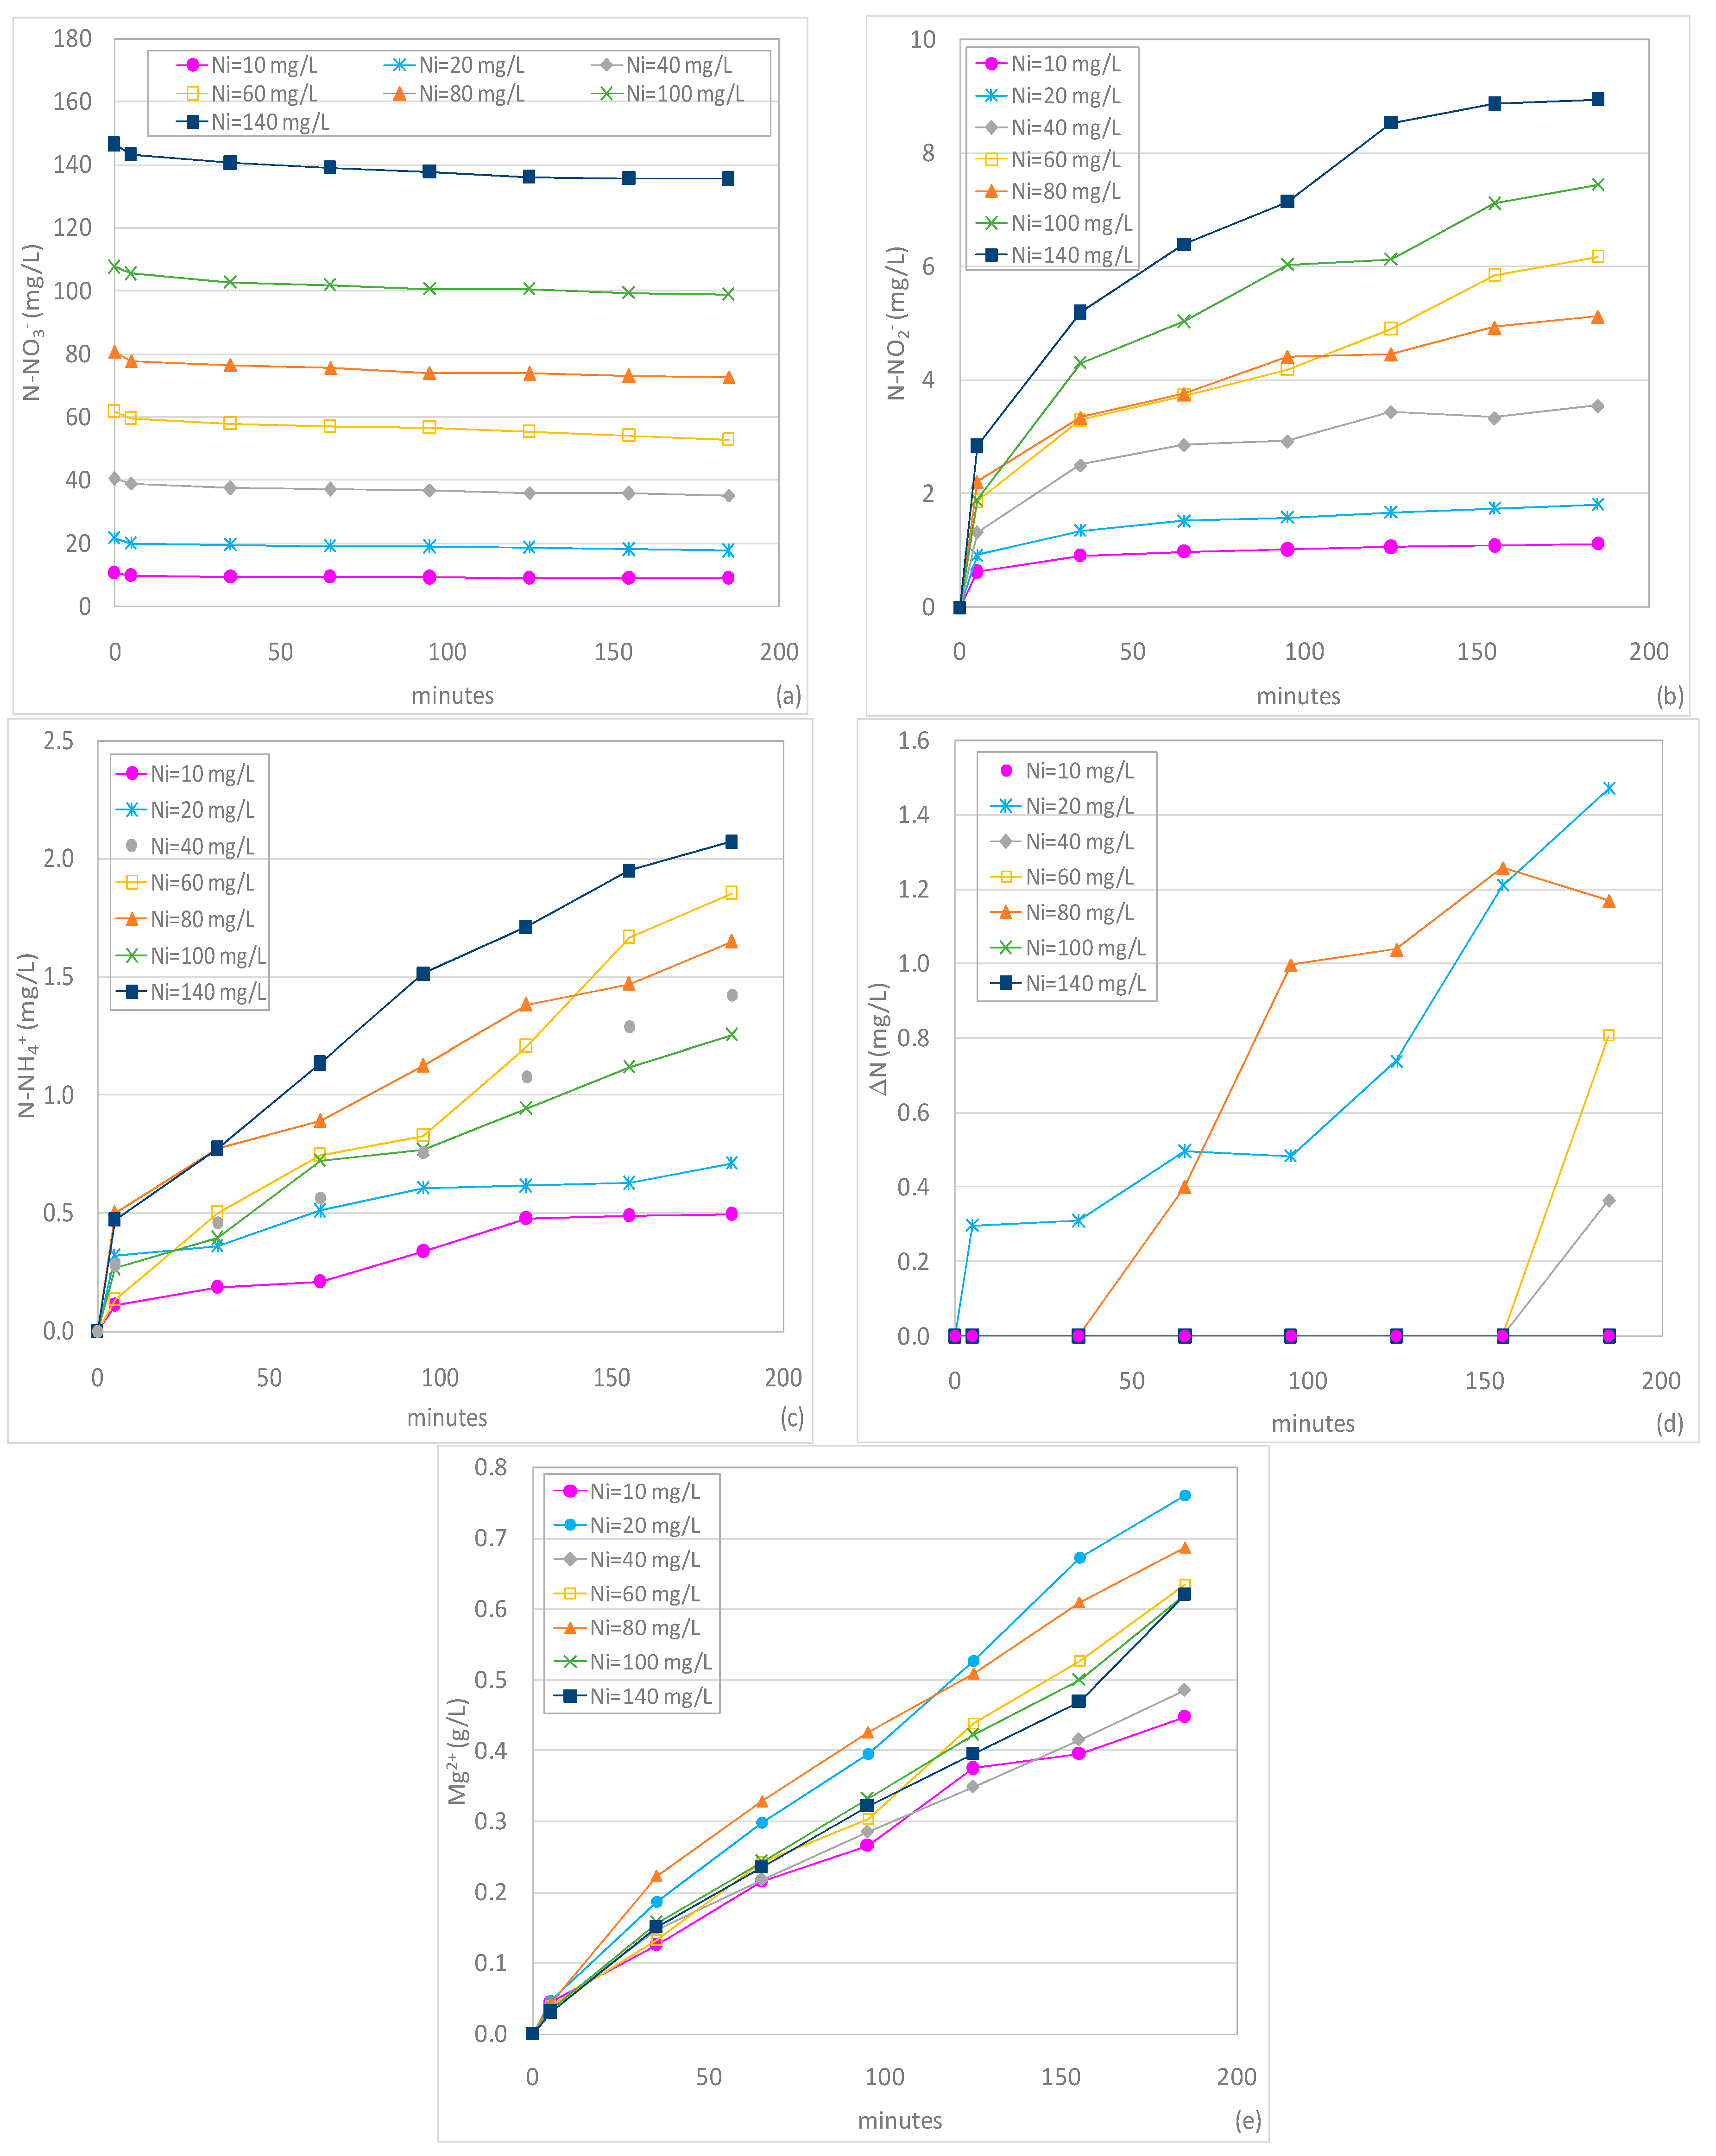
In order to investigate the effect of pH on the nitrate reduction process, further tests were conducted at pH 5 and 7. The results of experiments conducted at pH 5 show a tremendous decline of nitrate removal rates with respect to the trends observed at the lower pH. As shown in Figure 5a, high final concentrations were always detected, and the removal yields were between 15% and 26%. This behavior is representative of slow reaction rates, which were confirmed by the curves of Mg2+ concentration (Figure 5e). Indeed, the solubilization of di-valent magnesium ions was notably smaller compared to that previously discussed. The process worsening was due to the protons necessity for nitrate removal, which determines the slowdown of reaction rates with the increase in pH. Previous works reported the performance deterioration of chemical denitrification with Mg0 in response to pH growth [4,36,37]. However, the effect observed in the present study was more pronounced in comparison to that found in studies that exploited completely mixed systems. This can be attributable to a higher passivation of reactive material in a packed column due to the formation of insoluble compounds with the increase in pH. Indeed, the stronger mixing effect that occurs in a suspended system leads to a minor coating of the reactive material; instead, in a column system, the reactive material being fixed, the coating phenomena are more intense. Therefore, it can be argued that pH is a limiting factor for chemical denitrification and the operational conditions of the column system make the effect of this parameter more pronounced.
The worsening of process efficiency is confirmed by N-NO2− curves which show only the initial growing phase without the consumption trend (Figure 5b). This led to quite high N-NO2− concentrations at the end of the treatment, which grew with the initial nitrate amount. As only nitrate was reduced and no nitrite was consumed, the concentrations of ammonium were lower than those found in the tests at pH 3 (Figure 5c). In particular, the N-NH4+ concentrations slowly grew until the end of the treatment, without reaching asymptotic values. This further underlines that the denitrification process was incomplete at pH 5. Clearly, the N2 productions were insignificant as the nitrate removal yields were extremely low (Figure 5d). Therefore, using a column system, the chemical denitrification with Mg0 is not favorable at a moderate acidic pH value because only small amounts of nitrate can be reduced, mainly to nitrous nitrogen, without an actual removal of nitrogen species from the solution.
The discussed results were confirmed by the tests conducted at pH 7, which showed a further worsening of the process performances. In fact, nitrate removal yields lower than 20% were detected (Figure 6a).
As already monitored at pH 5, growing trends of nitrite were observed (Figure 6b). As the nitrate reduction yields further decreased, the N-NO2− concentrations were smaller than those observed at pH 5 (Figure 6b). The ammoniacal nitrogen also showed slower increasing curves as compared to the trends monitored during the tests at lower pH (Figure 6c). Due to the poor denitrification performance, negligible amounts of nitrogen gas were detected (Figure 6d) and the concentrations of Mg2+ were smaller with respect to those monitored with other pH values (Figure 6e).
3.4. Tests Conducted at Different Temperatures
With the aim to evaluate the effect of temperature on the nitrate removal process, further experiments were conducted by setting the solution temperature at 30 and 40 °C. These tests were performed for each pH value investigated (pH 3, 5 and 7) with a hydraulic recirculation velocity of 1 m/min and a RMN ratio of 0.333 gMg0/mg N-NO3− (Ni = 20mgN-NO3−/L).
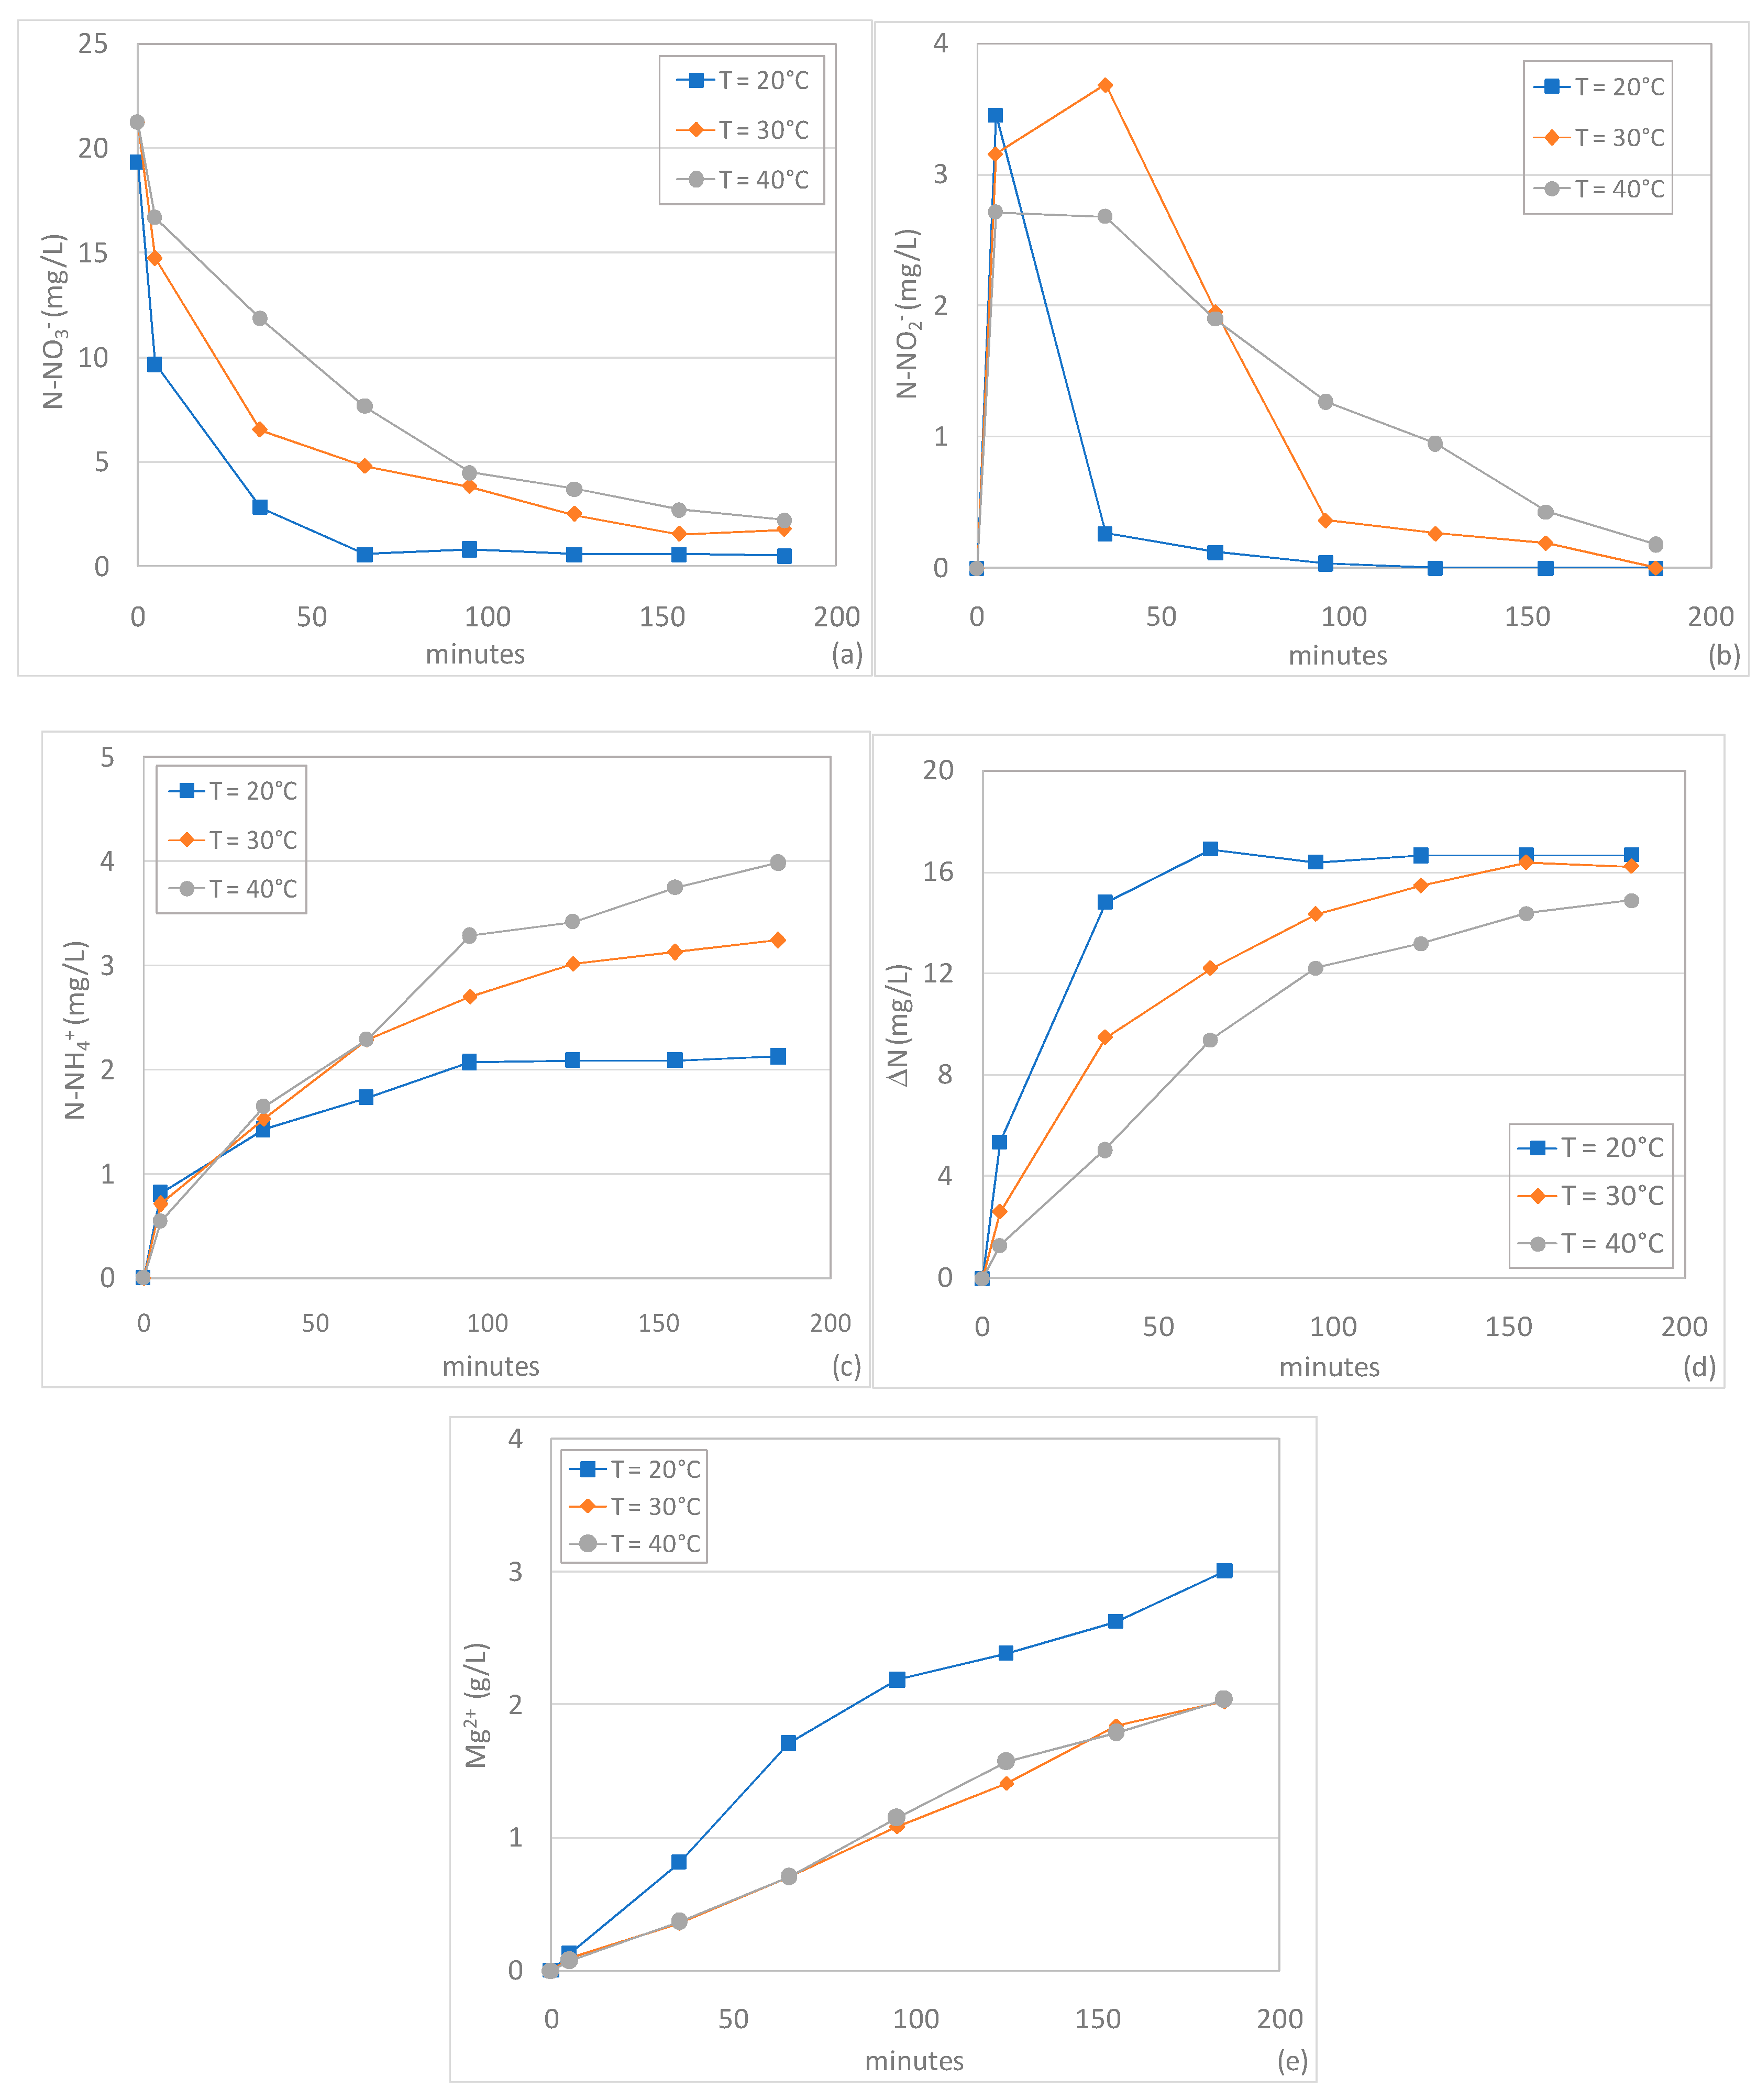
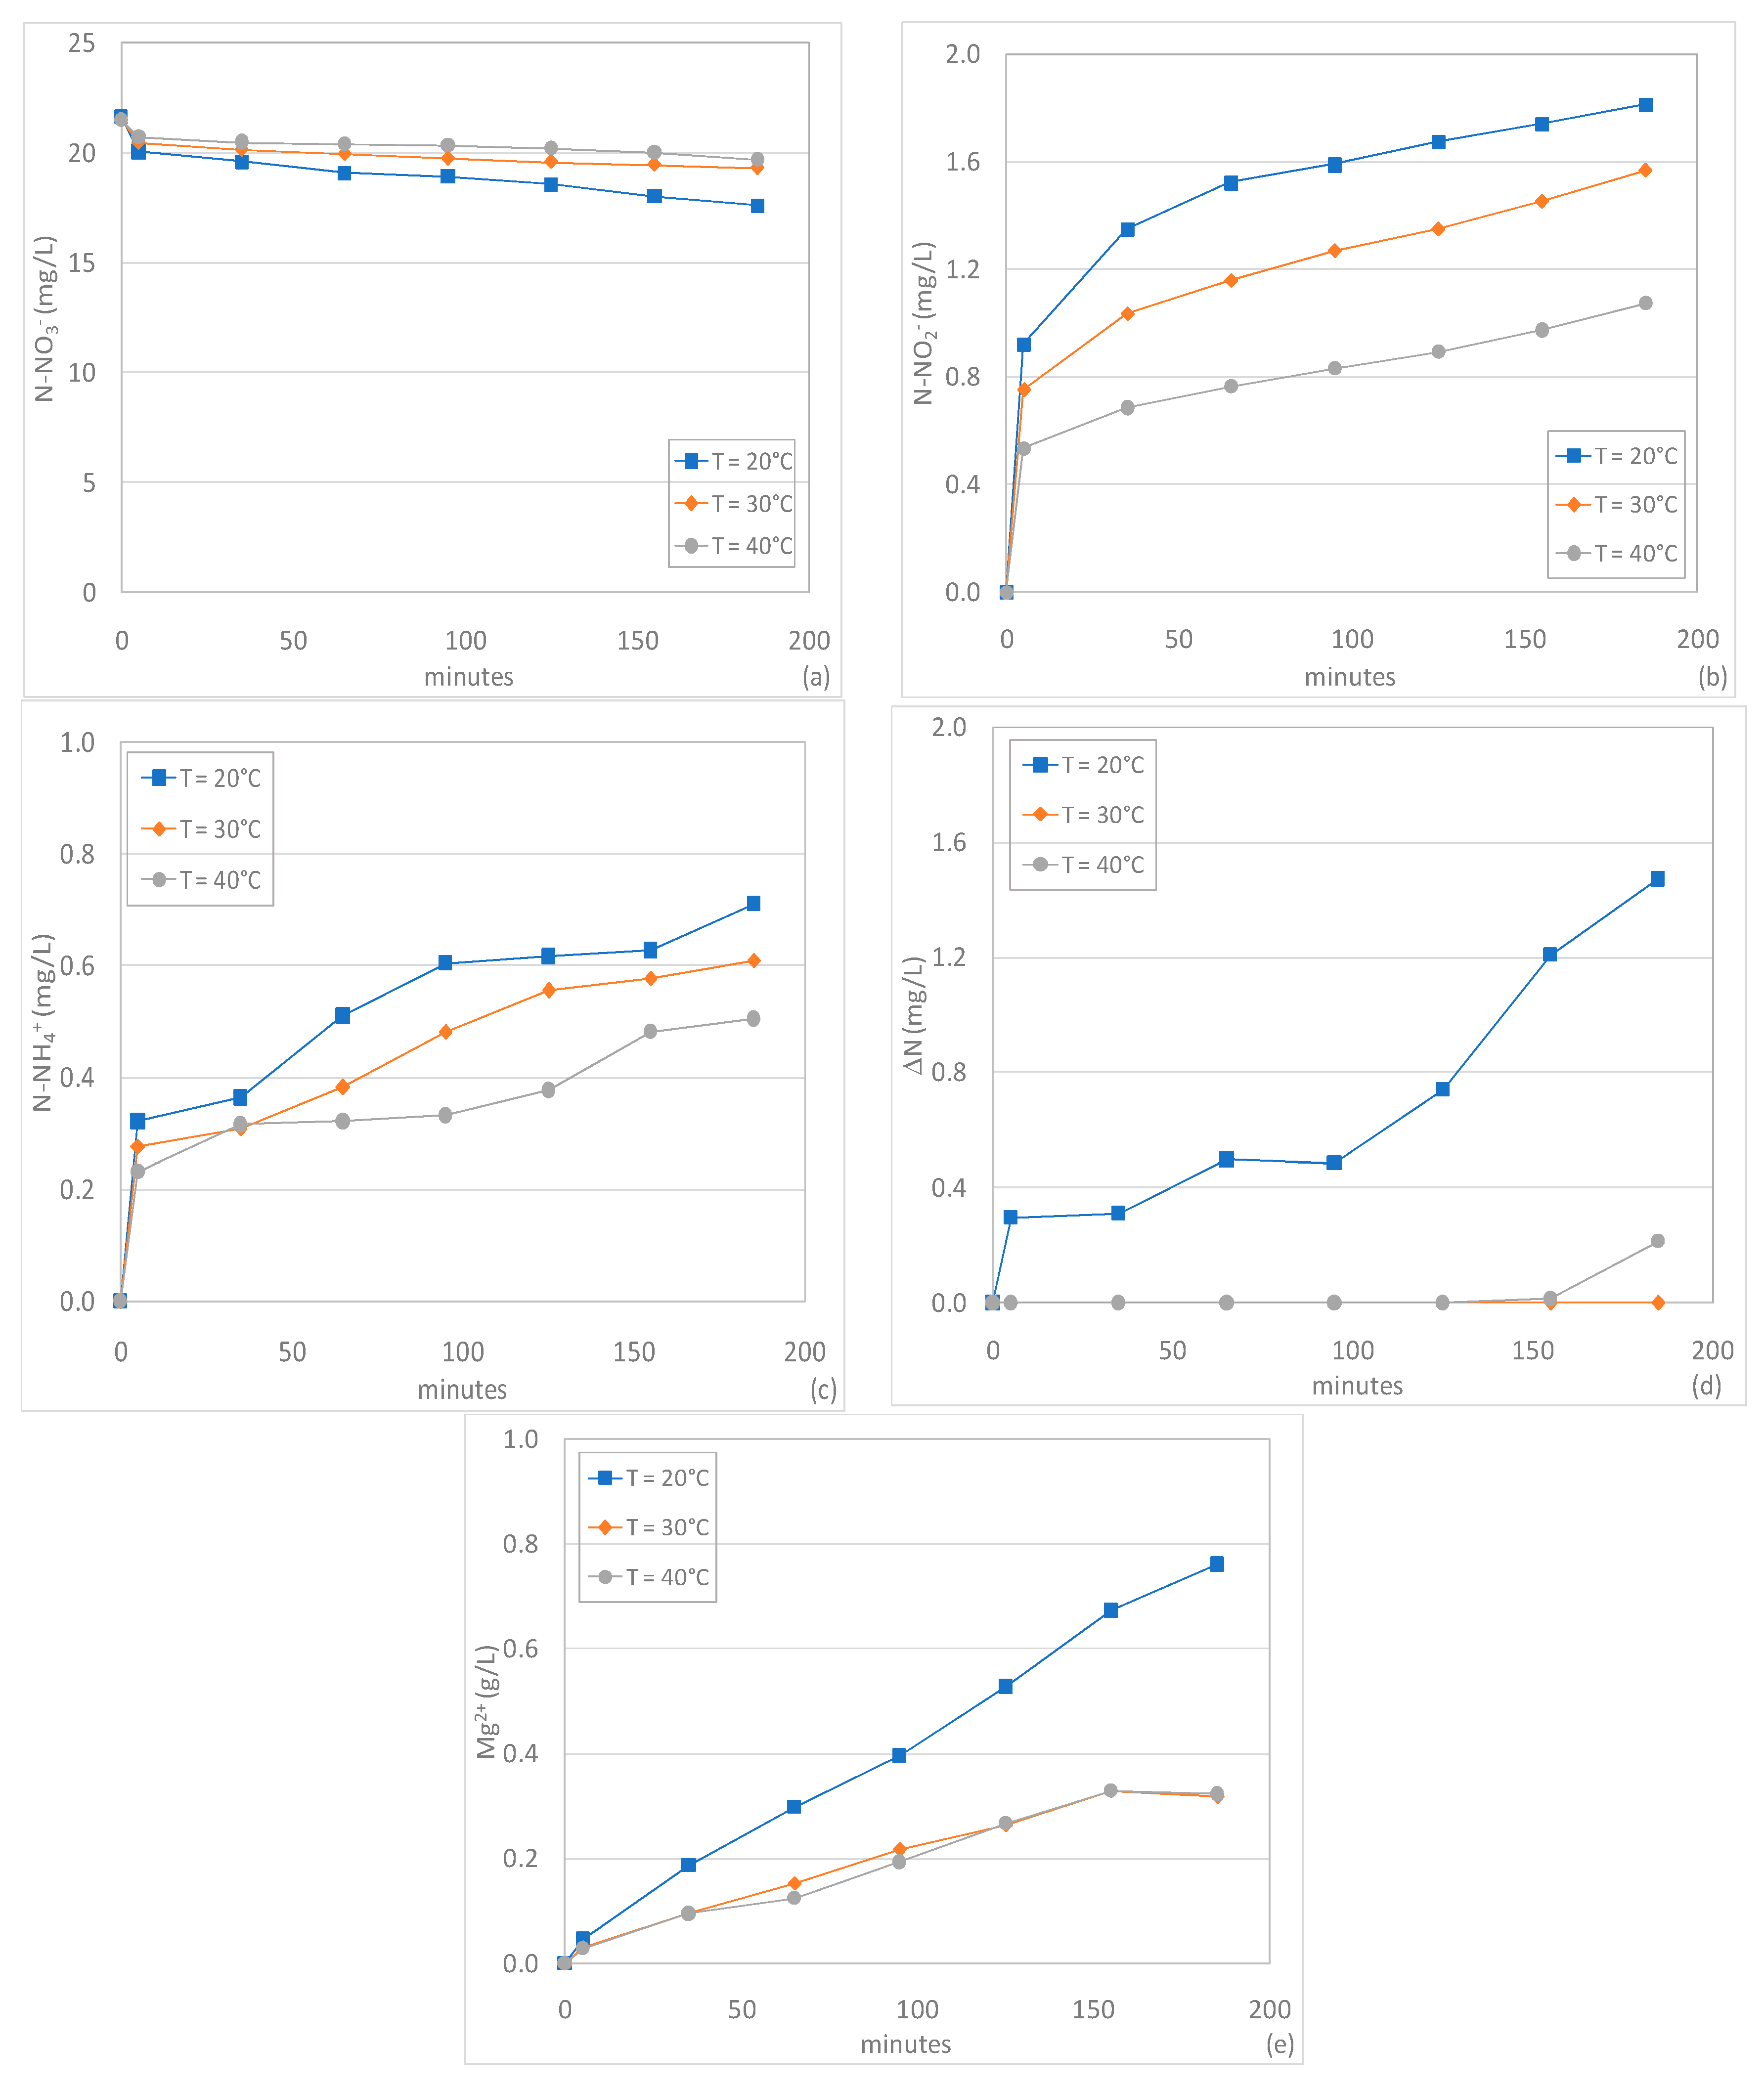
Unexpectedly, the detected results show a clear reduction of denitrification rate with the increase of temperature from 20 to 30 and 40 °C (Figure 7a). As previously discussed, at 20 °C, a rapid decrease in concentration was observed and an almost complete nitrate removal was reached in about an hour; on the contrary, at 30 and 40 °C the final N-NO3− value did not decrease below 1.5 and 2.2 mgN-NO3−/L, respectively (Figure 7a). These statements are in contrast with the results of Kumar et al., who found an increase of observed kinetic constant from 0.108 to 0.271 min −1 with the rise of temperature in the range of 10 to 50 °C [4]. Instead, Luk et al. reported a mild reduction of nitrate removal yield at temperature higher than 25 °C using Al0 as a reactive material [10]. A demonstrated justification for this behavior was not found by the authors [10]. Actually, nitrate removal through zero-valent reactive materials is a complex process which includes mechanisms that are differently influenced by temperature. In particular, it is conceivable that the transfer and adsorption of nitrate on the metal surface occur, then the reactions between Mg0 and nitrogen species take place [7]. Temperature accelerates the chemical reactions, but instead, it would be expected that superficial adsorption decreases with the increase in temperature [39]. This last mechanism, according to our results, seems to be the limiting step of the process and, therefore, temperature becomes an unfavorable factor for the nitrate removal process with ZVM. Other authors stated the great influence of the adsorption of contaminants on the metal surface on the overall processes efficiency [7]. It is presumable that this effect it is more marked in a column system because the interaction between pollutant and reactive material is less favorable compared to a reactor with suspended reactive material.
The process performance decline with the increase in temperature was also underlined by the curves of N-NO2− concentration. Compared to the test conducted at 20 °C a higher extension of N-NO2− production phases and slower decreasing trends were observed at 30 and 40 °C (Figure 7b). In particular, at these temperatures, the nitrite consumption was completed only after 185 min (Figure 7b). With the increase in temperature, greater productions of ammonium were observed in comparison to the test at room condition (Figure 7c). Nevertheless, nitrogen gas was always the main reaction product, even if the production rate slowed down with the temperature growth (Figure 7d). At the end of treatment, the percentage of initial nitrate concentration converted to N2 was about 76% and 70% at 30 and 40 °C, respectively (Figure 7d). Beyond 20 °C, a lower Mg2+ solubilization occurred; however, similar trends were observed in the tests at 30 and 40 °C (Figure 7e). These statements further confirm the loss in the overall reactivity of Mg0 at values higher than room temperature.
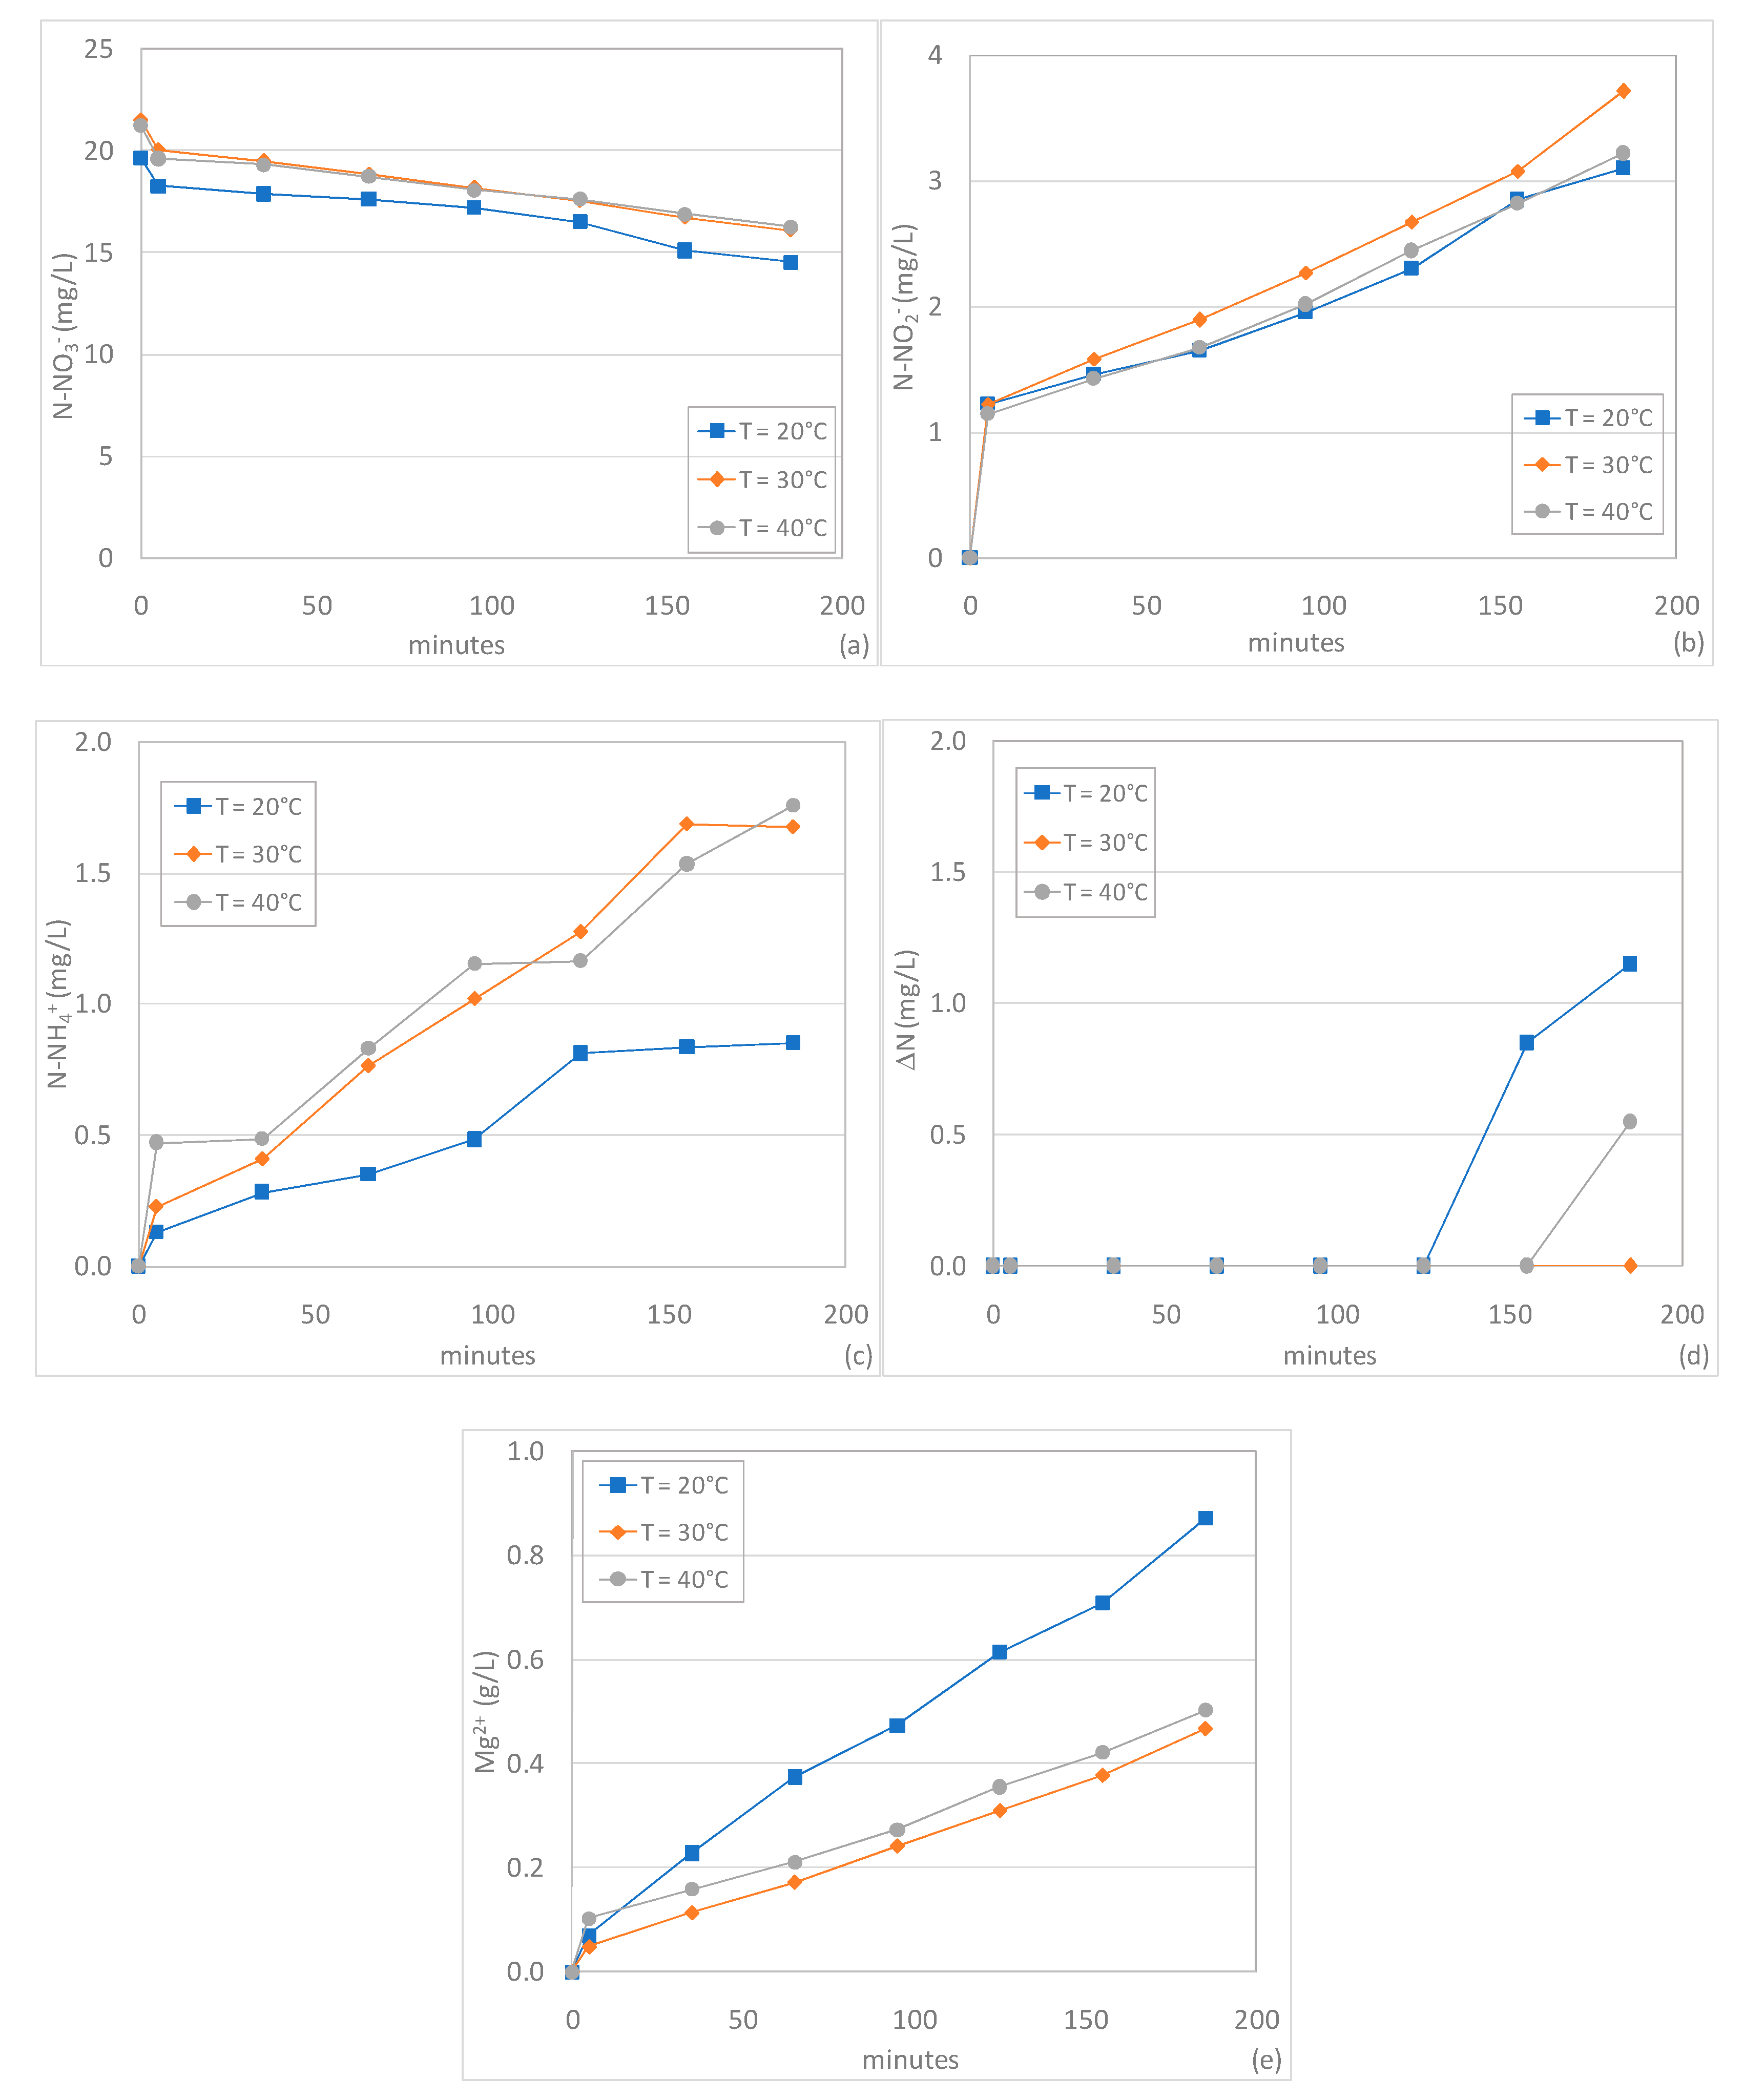
The temperature growth did not lead to any process improvement even at pH values higher than 3. With pH of 5 and 7, the nitrate removals remained unsatisfactory by increasing the process temperature beyond 20 °C (Figure 8a). In particular, at pH 5, the tests conducted at 30 and 40 °C showed comparable trends and removal yields between 23% and 25% (Figure 8a).
With these temperatures, the final N-NO2− concentrations were similar to that observed at 20 °C (Figure 8b), while higher levels of ammonium were reached (Figure 7c). The productions of nitrogen gas were completely negligible (Figure 8c). The decline in magnesium solubilization (Figure 8e) confirmed the adverse influence of temperature increase on the overall material reactivity.
This negative effect was further observed at neutral pH. In fact, in both tests carried out with temperatures of 30 and 40 °C, the nitrate abatement was lower than 10% (Figure 9a). The poor efficiency was underlined also by the reduction in nitrite and ammonium productions, in comparison to those observed at 20 °C (Figure 9b,c). As expected, no N2 generation was monitored (Figure 9d). Finally, a notable reduction of reactive material dissolution occurred by increasing the temperature beyond the room value (Figure 9e).
3.5. Tests Conducted by Reusing the Material
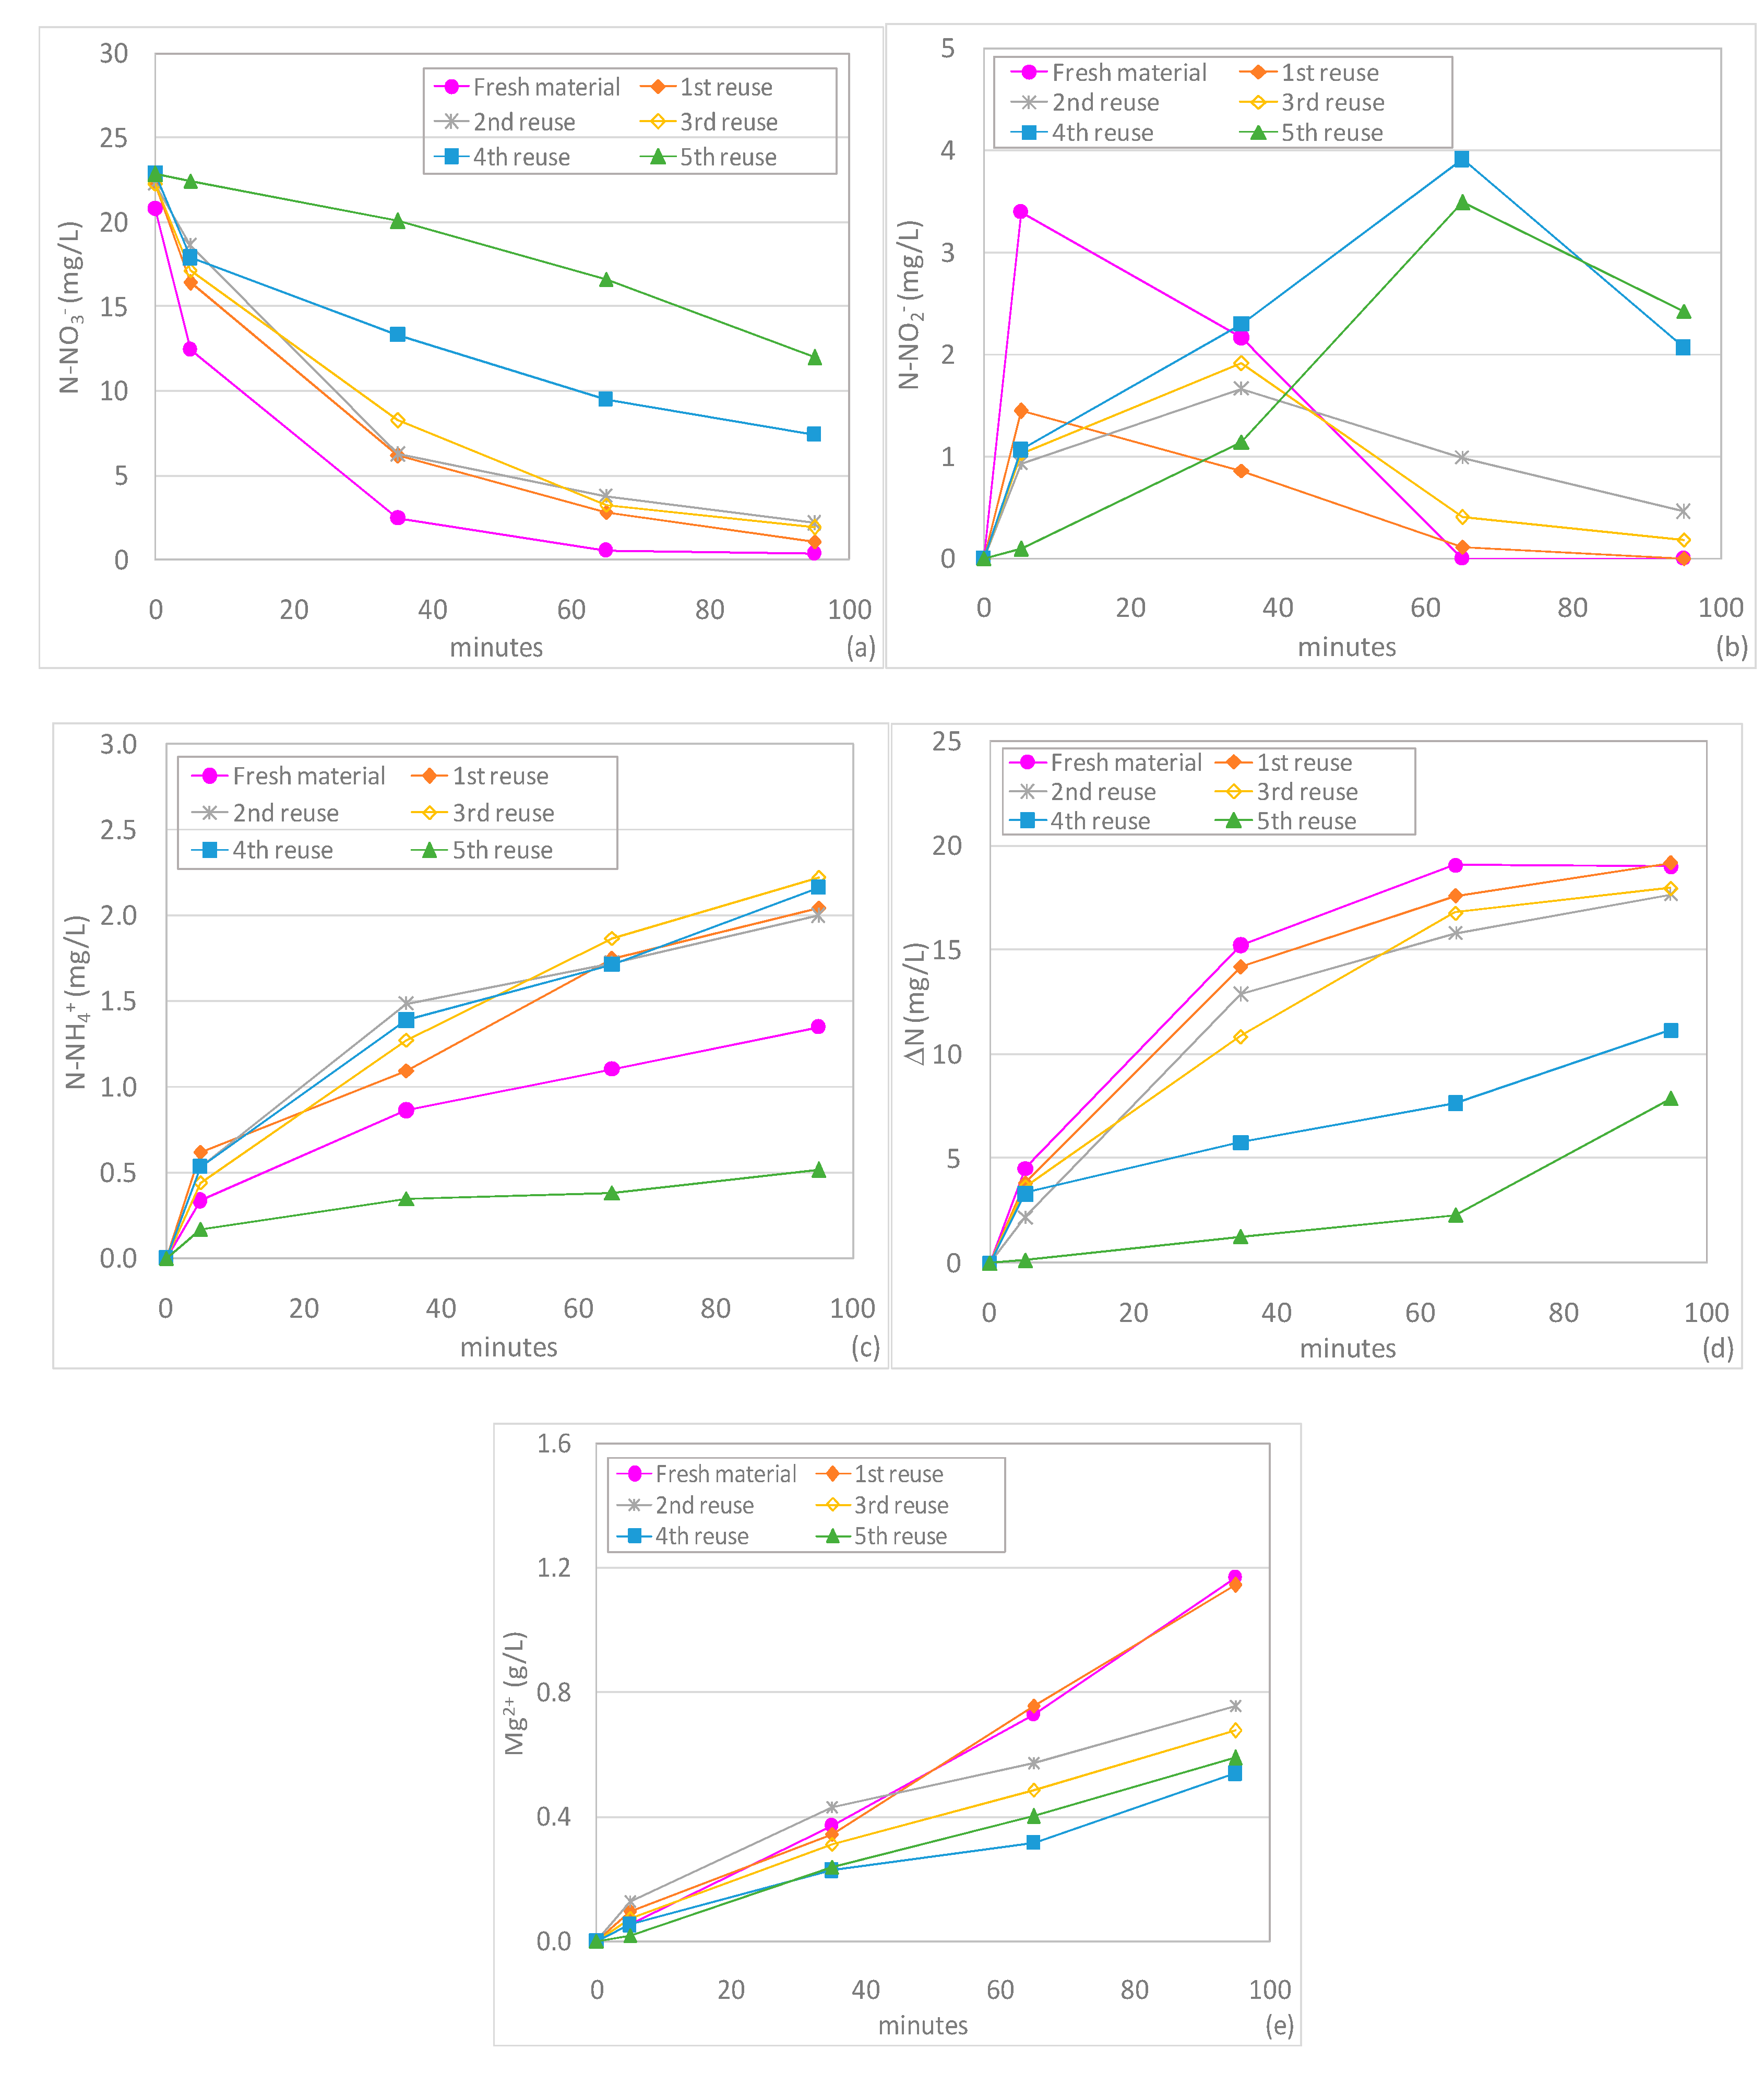
In order to reduce the chemical consumption and to avoid waste of material, the possibility of reusing magnesium powder in subsequent treatment cycles was evaluated. This set of tests was conducted at pH 3, with v = 1 m/min and by treating solutions with Ni = 20 mgN-NO3−/L. The initial test was conducted by using 2 g of fresh magnesium powder, while the subsequent experiments were carried out by reusing the reactive material recovered from the previous tests to treat new nitrate standard solutions. As reported in previous sections, the nitrate concentration was almost zero in about an hour in test conducted with the fresh reactive material (Figure 10a). By reusing the magnesium powder for the first time, an abatement yield of about 95% was reached in 95 min (Figure 10a). The process performance was very satisfactory up to the third reusing cycle with N-NO3− decreasing trends that were similar to that observed during the first reuse. During the next tests, an evident decline of process performances was observed (Figure 10a).
Nonetheless, the achieved efficiencies were higher than those reported by Ileri et al., who observed abatement yields only of 17% by reusing the reactive material four times in an ultrasound assisted system [35]. The differences with the results of this study are in part attributable to the different operating conditions, such as the process pH. However, the good performances detected in our experiments are probably also due to the column configuration, which allowed us to recover most of the amount of magnesium, by reducing the waste of reactive material. Using fresh reactive material, the treatment in column causes a lower Mg0 dissolution compared to a suspended system [37] and, therefore, it permits the recovery of a high amount of reactive material that can be exploited for several subsequent treatment cycles.
The good process performance by reusing the magnesium powder in the column system, was confirmed by N-NO2− trends that showed very low residual nitrite concentrations up to the third reuse (Figure 10b)
The level of the final ammoniacal nitrogen was quite low as well in the cycles that showed high nitrate reduction (Figure 10c). Indeed, most of the nitrate amount was reduced to N2 up to the third reuse when the conversion percentage was still about 81% (Figure 10d). The nitrogen gas production decreased in the last two experiments (Figure 10d) due to the reduction in the performance of chemical denitrification.
The trends of Mg2+ concentration are similar in the tests with fresh magnesium powder and during the first reuse (Figure 10e). As expected, the magnesium solubilization decreased in the subsequent cycles and, at the end of treatment, Mg2+ concentrations between 540 and 760 mgMg2+/L were detected (Figure 10e). As previously mentioned, magnesium ions are non-toxic for the environment and do not pose health risks. Indeed, the European Directives donot establish a limit for their concentration in water and groundwater or for the discharge of wastewater [40,41]. However, the levels of Mg2+ reached during the treatment cycles impart hardness to water and a post treatment (chemical precipitation, ions exchange, etc.) could be necessary if a low level of hardness is required.
All things considered, the detected results suggest that by exploiting a column system, it is possible to reuse the reactive material with just a low decrease in performance up to the third cycle, beyond which the efficiency worsening becomes more pronounced.
3.6. Kinetic Analysis of Nitrate Reduction
With the aim to further analyze the nitrate reduction by means of Mg0 particles, a specific kinetic study was conducted. Because the set of experiments conducted at pH 5 and 7 showed negligible performance, the kinetic analysis was focused on results obtained by setting the process pH to 3. Several kinetic laws were used to interpolate the experimental trends and the best fitting was obtained with a pseudo-first order expression [37]:
where N is the N-NO3− concentration, Ns is the N-NO3− at the stationary conditions and Kobs is the observed kinetic constant for nitrate reduction. By solving the above Equation (1), the following relation can be easily obtained:
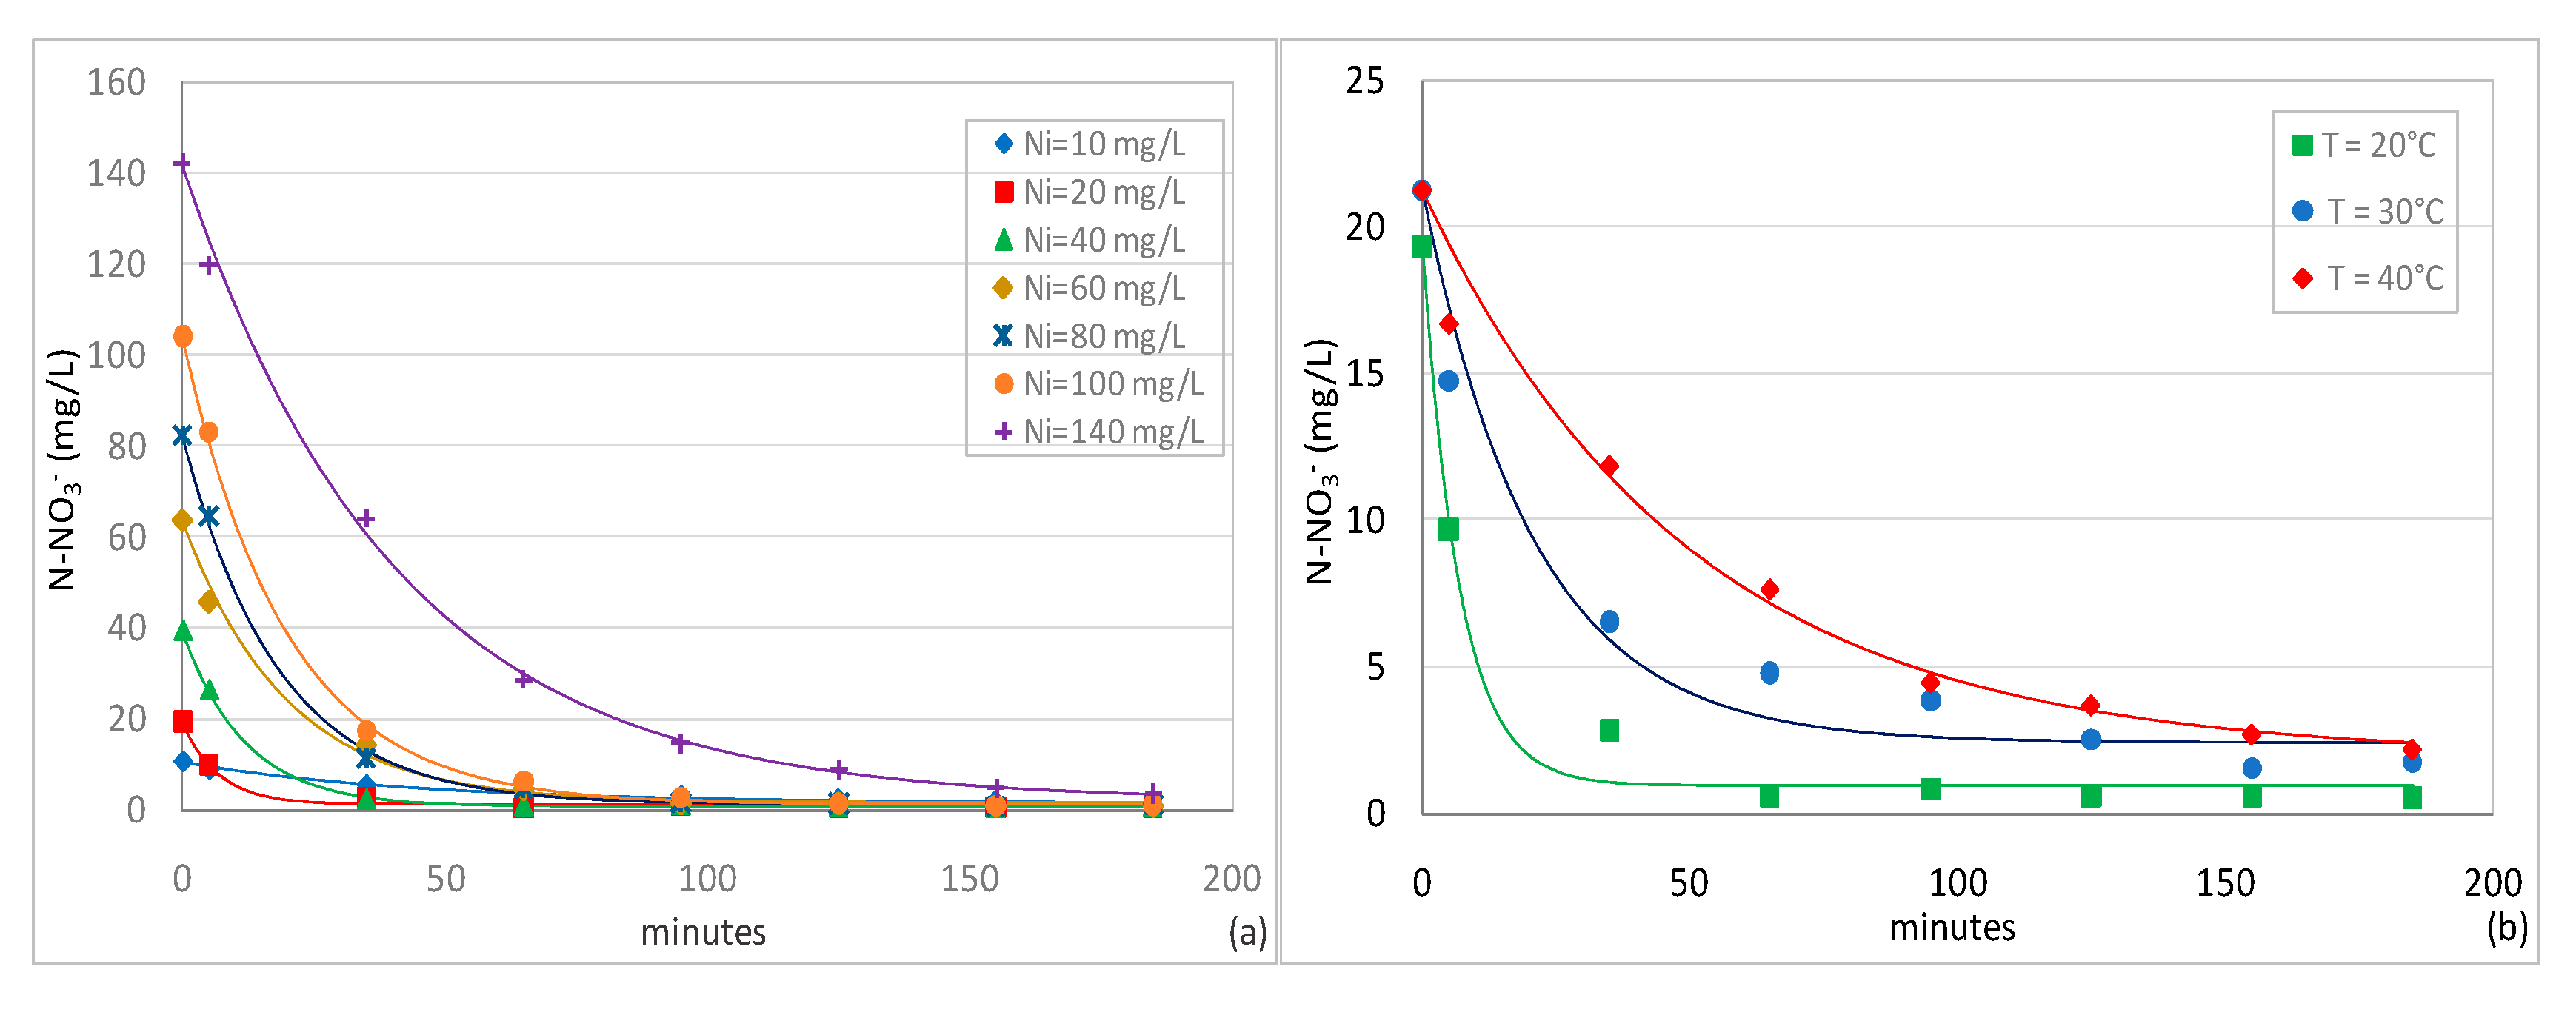
where Ni is the initial N-NO3− concentration in the standard solution. The match generally detected between the experimental results and theoretical predictions is a good validation of the proposed kinetic model (Figure 11).
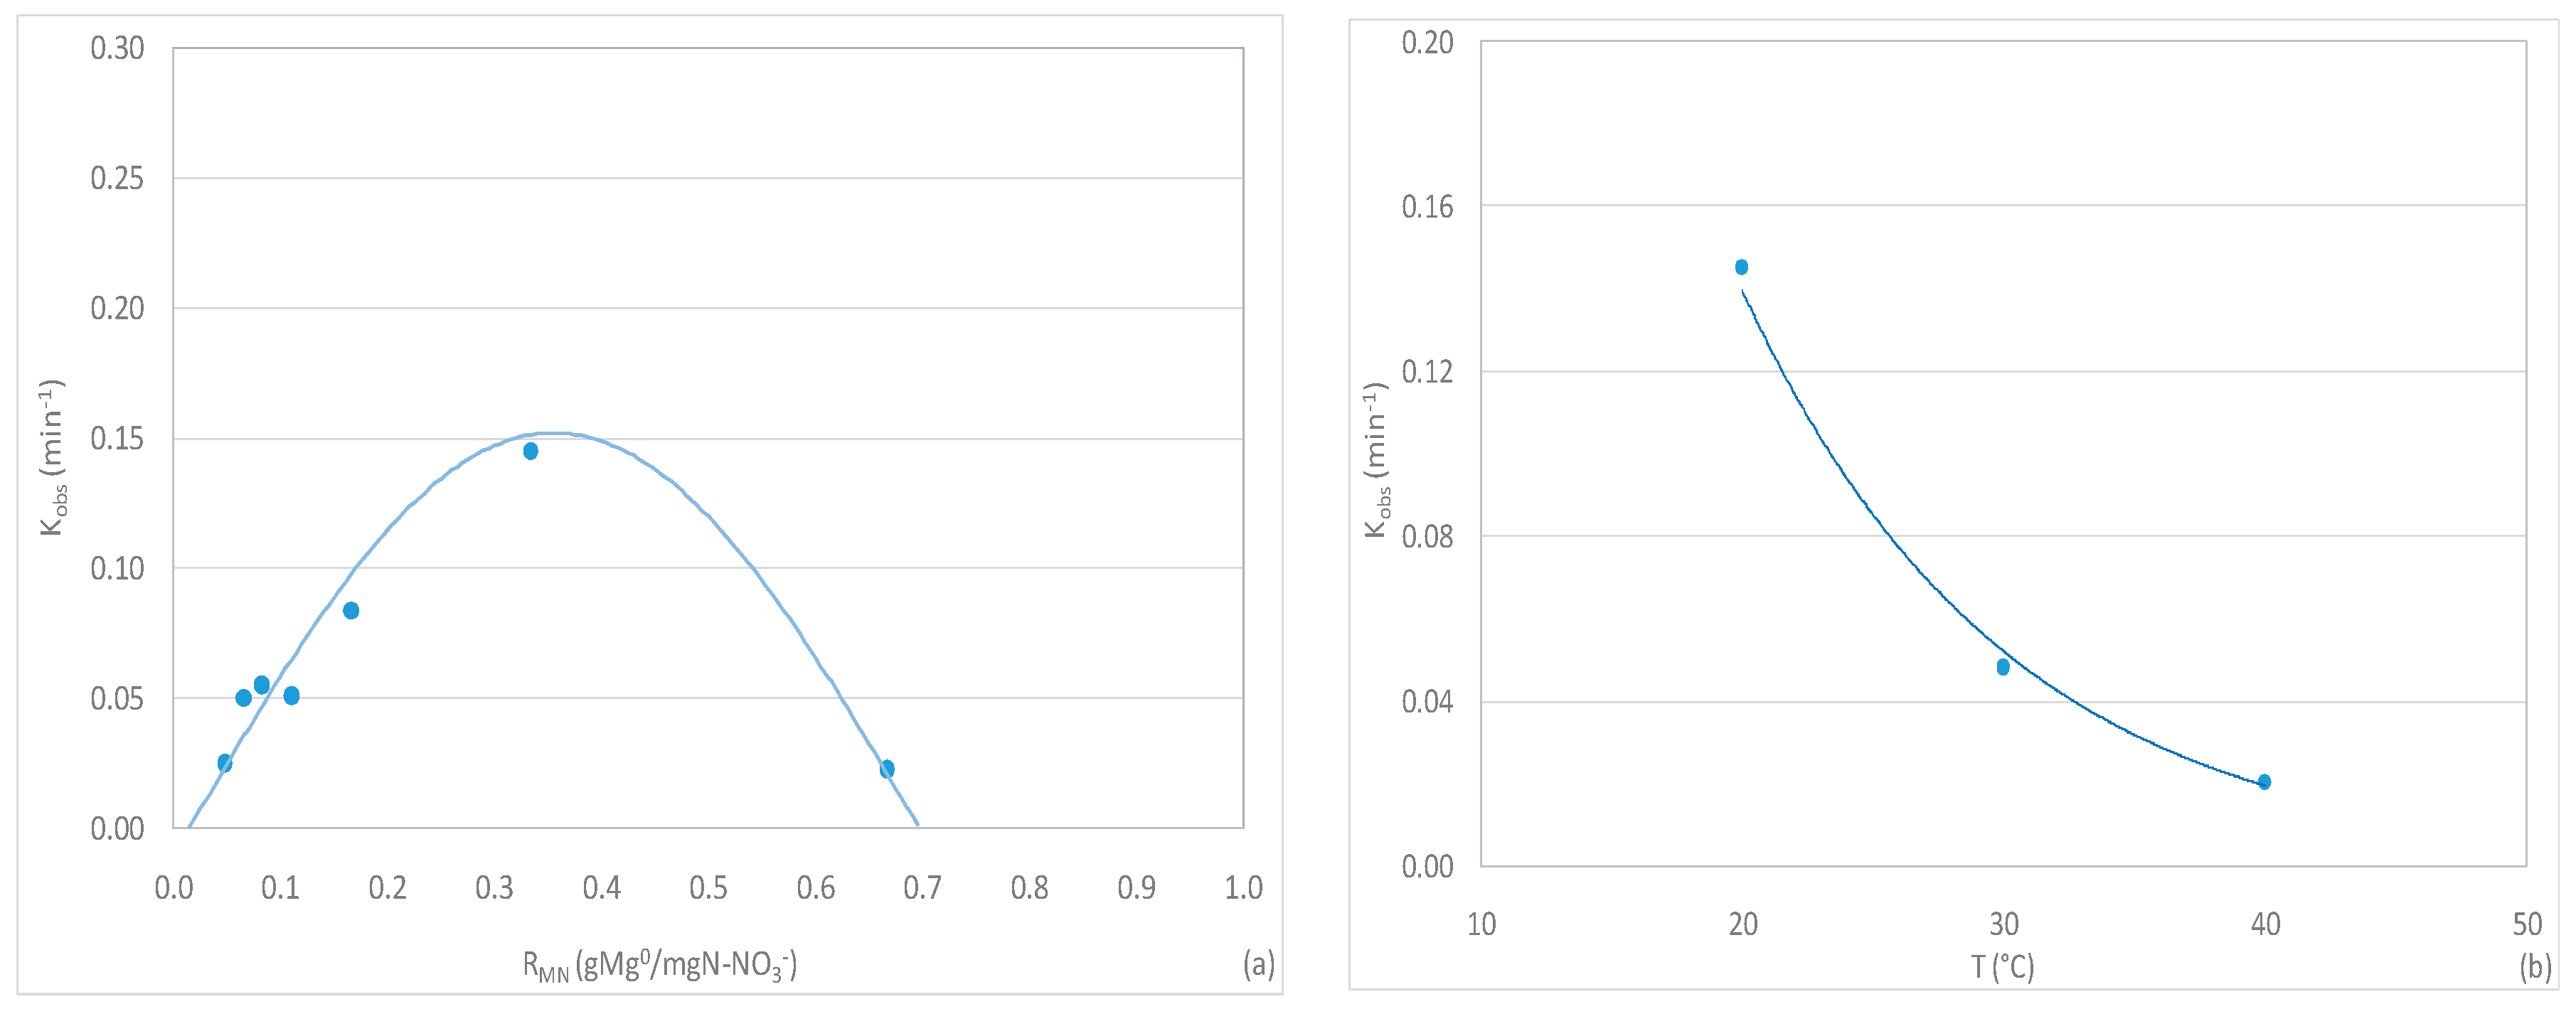
By analyzing the data detected through the experimental curves’ interpolation (Table 1), it was observed that the kinetic constant (Kobs) assumes a characteristic dome profile in response to RMN variation (Figure 12a). In particular, Kobs rapidly grows with the RMN ratio up to a maximum value and then a marked decrease occurs. This reduction, as previously discussed, could be justified by considering that when high amount of Mg0 are used to treat solutions with low concentrations of N-NO3−, the ZVM probably reacts mainly with water and oxygen causing an appreciable deterioration in denitrification. Therefore, very high values of RMN ratio can notably reduce the reactions rates.
Two values of RMN for which the kinetic constant becomes negligible can be extrapolated (Figure 12a). The first point (R1) represents the RMN ratio beyond which the denitrification through ZVM particles can take place. This value is very low and it confirms the high power of Mg0 in the reduction of nitrate. The second point (R2) instead represents a condition of an excessive amount of reactive material with respect to the level of pollutant. Therefore, it can be considered that the kinetic constant assumes effectivevalues for RMN between R1 and R2. The trend of Kobs as a function of RMN ratio (Figure 12a) can be expressed by the following law:
where K’obs is the maximum value of kinetic constant, estimated at about 0.152 min−1. This value is in line with the results obtained by Kumar et al. in a batch suspended system [4]. The threshold values R1 and R2 were 0.0145 gMg0/mgN-NO3− and 0.697 gMg/mgN-NO3−, respectively. Moreover, the RMN ratio to which the maximum kinetic constant (K’obs) corresponds was equal to 0.355 gMg/mgN-NO3−. This value was very close to the ratio of 0.333 gMg/mgN-NO3− considered in the experiments.
In addition to the dependence of reaction rate on the RMN ratio, the kinetic analysis made the effect of temperature explicit.
By referring to a RMN value of 0.333 gMg/mgN-NO3−, the interpolation of curves obtained by increasing the process temperature gave lower Kobs values (Table 2). In particular, the kinetic constant showed a decreasing exponential trend as a function of temperature (Figure 12b):
where the parameters C1 and C2 were 1.006 min−1 and 0.0987 °C−1, respectively. The above expression can be easily converted in the common form:
where θ = 0.906 is the temperature factor. This value, being lower than 1, makes clear the adverse effect of temperature increase on the overall denitrification rate in a column system. On the contrary, other studies identified a positive influence of temperature on nitrate reduction in the process with suspended Mg0 particles. As previously discussed, the behavior observed in the present work seems to indicate that the mechanism of superficial adsorption of nitrate on the ZVM surface, which should decrease with the increase in temperature [39], represents the limiting phase of the whole process. This mechanism is likely to have a greater impact in a column with fixed reactive material compared to a completely stirred system in which the suspended reactive material can interact more easily with the pollutant.
3.7. Reaction Mechanisms and Characteristics of Exhausted Material
On the basis of experimental results, the potential reaction pathways were elaborated. The NO3− reduction takes place according to several reactions that can simultaneously occur and involve different chemical species. In aqueous solutions the metallic magnesium is oxidized by H2O, O2 and H+ according the following reactions [32,37]:
These transformations are promoted by acidic conditions. In agreement with these reactions, our results showed a much greater Mg0 solubilization at low pH. Clearly, in the presence of NO3− ions, many other transformations occur. According to the experimental curves, during the first minutes the nitric nitrogen is mainly converted to nitrous nitrogen. Moreover, depending on the operating conditions, the generation of ammoniacal nitrogen and the direct production of N2 were also observed. These mechanisms agree with the following reactions [4,37]:
The consumption of H+ in the above transformations explains the marked effect of acidic pH on process efficiency. In addition to previous mechanisms, the NO3− could be further reduced through the reaction with H2 which is generated in reactions 6 and 7 [36]:
The curves observed during our experiments show that the nitrous nitrogen can also be progressively reduced. This suggests that the ZVM can reduce N-NO2− ions to N-NH4+ and/or to N2. According to these statements, the following mechanisms can be supposed:
Moreover, the nitrite could also react with ammonium forming nitrogen gas [37]:
Due to the different types of reactions that occur during the treatment, the zero-valent magnesium particles undergo substantial alterations. The characteristics of materials after the denitrification process were examined using scanning electron microscopy (SEM), wavelength dispersive spectroscopy (WDS) and X-Ray diffractometry (XRD). The Mg0 particles retrieved from the test conducted at pH 3 and with Ni = 20 mg N-NO3−/L were characterized. At the end of treatment, the metallic glaze of material disappeared, and the external surface became more fractured (Figure 13a). These changes are imputable to the interaction of ZVM with the nitrogen species and the acidic solution. Moreover, the reactive material partially assumed a white color. This modification indicates the presence of some reaction products. The characterization through WDS detected mainly magnesium and oxygen and a very small amount of nitrogen on the outer surface. Specifically, the fractions of main elements were Mg= 56.1% and O= 41.6% and N=1.8%. These results suggest that the nitrogen removed from the solution was transformed into the gaseous form, while only a limited amount of pollutant remained adsorbed on the reactive material. Moreover, the percentages of elements indicate mainly the formation of MgO as a reaction product. The presence of this compound was confirmed through the diffractogram of the exhausted material (Figure 13b). Indeed, the characteristic peaks of magnesium oxide were observed and the peaks of Mg0 were less pronounced compared to those of fresh material. The results of the present study are in agreement with those of other authors that identified only the presence of MgO as a reaction product of chemical denitrification conducted in acidic conditions [4]. The formation of other compounds, such as magnesium hydroxide, is probably prevented by the low pH values applied in the tests [4]. The presence of Mg(OH)2 was detected in works carried out without pH control because basic conditions were reached at the end of the process [35].
4. Conclusions
The present study aimed to analyze the nitrate removal process by means of ZVM in a column system. Through the conducted experiments the effects of recirculation hydraulic velocity, pH, RMN ratio (gMg0/mgN-NO3−) and temperature were identified. Moreover, the possibility of reusing the reactive material in subsequent treatment cycles was evaluated.
The experimental results show that the increase of recirculation flux velocity through the column positively affects the nitrate removal. The optimal condition was detected with a value of about 1 m/min.The process performances were favored by low pH values and very satisfactory efficiencies were observed at pH 3. With this pH, the nitrate removal was notably influenced by the RMN ratio and the value RMN = 0.333 gMg0/mgN-NO3− was identified as the most favorable. The main reaction product was N2, while low amounts of N-NO2− and N-NH4+ were monitored.
A dramatic deterioration of nitrate removal occurred by increasing the process at pH 5 and 7. With these values, high levels of nitrite and ammonium were detected at the end of treatment, while the productions of N2 were negligible.
The temperature increase from 20 to 40 °C also caused a decline in denitrification efficiency that was more marked at pH 3. The experimental results suggest the possibility to efficiently reuse the reactive material in subsequent treatment cycles at pH 3 and 20 °C. This is a meaningful advantage of chemical denitrification in a column system because it allows reducing the waste of reactive material.
Through a detailed kinetic analysis, a pseudo first order law was identified from which a mathematical equation able to accurately describe the nitrate abatement curves was obtained. The observed kinetic constant showed a dome trend with respect to RMN and an exponential decreasing behavior in response to temperature increase. Furthermore, the reactions pathways were proposed. The exhausted ZVM showed the presence of MgO and only very low amounts of other compounds.
In conclusion, the results obtained in this study support the applicability of chemical denitrification by means of Mg0 in column systems. Nonetheless, additional investigations must be conducted to evaluate the ability of the system at a larger scale and in the treatment of real groundwater or wastewater, which contain other ions in addition to nitrate. Moreover, the possibility of employing buffer solutions to control the process pH and reduce the consumption of acids should be examined. In addition, in order to minimize the costs of treatment, the use of waste magnesium particles must be tested, such as those resulting from the automotive, electronic device, weapon and aerospace industries, which use large amounts of zero-valent magnesium. Indeed, the utilization of pure metallic Mg0, the industrial price of which is difficult to estimate, could make the process expensive, even though it can be reused in subsequent treatment cycles.
Author Contributions
Conceptualization, A.S.; Methodology, A.S. and G.M.C; Formal Analysis, G.M.C. and C.L.; Data Curation, A.S. and G.M.C.; Writing—Review and Editing, A.S. and G.M.C.All authors have read and agreed to the published version of the manuscript.
Funding
This research received no external funding
Conflicts of Interest
The authors declare no conflicts of interest.
References
- Bhatnagar, A.; Sillanpää, M. A review of emerging adsorbents for nitrate removal from water. Chem. Eng. J. 2011, 168, 493–504. [Google Scholar] [CrossRef]
- Siciliano, A.; Limonti, C.; Mehariya, S.; Molino, M.; Calabrò, V. Biofuel production and phosphorus recovery through an integrated treatment of agro-indudtrial waste. Sustainability 2019, 11, 52. [Google Scholar] [CrossRef] [Green Version]
- Siciliano, A.; Stillitano, M.A.; Limonti, C.; Marchio, F. Ammonium removal from landfill leachate by means of multiple recycling of struvite residues obtained through acid decomposition. Appl. Sci. 2016, 6, 375. [Google Scholar] [CrossRef] [Green Version]
- Kumar, M.; Chakraborty, S. Chemical denitrification of water by zero-valent magnesium powder. J. Hazard. Mater. 2006, B135, 112–121. [Google Scholar] [CrossRef] [PubMed]
- Siciliano, A.; Stillitano, M.A.; De Rosa, S. Increase of the anaerobic biodegradability of olive mill wastewaters through a pre-treatment with hydrogen peroxide in alkaline conditions. Desalin. Water Treat. 2015, 55, 1735–1746. [Google Scholar] [CrossRef]
- Siciliano, A.; Stillitano, M.A.; Limonti, C. Energetic valorization of wet olive mill wastes through a suitable integrated treatment: H2O2 with lime and anaerobic digestion. Sustainability 2016, 8, 1150. [Google Scholar] [CrossRef] [Green Version]
- Hwang, Y.-H.; Kim, D.-G.; Shin, H.-S. Mechanism study of nitrate reduction by nano zero valent iron. J. Hazard. Mater. 2011, 185, 1513–1521. [Google Scholar] [CrossRef]
- Siciliano, A.; De Rosa, S. Experimental formulation of a kinetic model describing the nitrification process in biological aerated filters filled with plastic elements. Environ. Technol. 2015, 36, 293–301. [Google Scholar] [CrossRef]
- Siciliano, A.; De Rosa, S. An experimental model of COD abatement in MBBR based on biofilm growth dynamic and on substrates’ removal kinetics. Environ. Technol. 2016, 37, 2058–2071. [Google Scholar] [CrossRef]
- Luk, G.K.; Au-Yeung, W.C. Experimental investigation on the chemical reduction of nitrate from groundwater. Adv. Environ. Res. 2002, 6, 441–453. [Google Scholar] [CrossRef]
- Huang, C.-P.; Wang, H.-W.; Chiu, P.C. Nitrate reduction by metallic iron. Water Res. 1998, 32, 2257–2264. [Google Scholar] [CrossRef]
- Ruangchainikom, C.; Liao, C.-H.; Anotai, J.; Lee, M.-T. Effects of water characteristics on nitrate reduction by the Fe0/CO2 process. Chemosphere 2006, 63, 335–343. [Google Scholar] [CrossRef] [PubMed]
- Cheng, F.; Muftikian, R.; Fernando, Q.; Korte, N. Reduction of nitrate to ammonia by zero-valent iron. Chemosphere 1997, 35, 2689–2695. [Google Scholar] [CrossRef]
- Rodríguez-Maroto, J.M.; García-Herruzo, F.; García-Rubio, A.; Gómez-Lahoz, C.; Vereda-Alonso, C. Kinetics of the chemical reduction of nitrate by zero-valent iron. Chemosphere 2009, 74, 804–809. [Google Scholar] [CrossRef] [PubMed]
- Choe, S.; Liljestrand, H.M.; Khim, J. Nitrate reduction by zero-valent iron under different pH regimes. Appl. Geochem. 2004, 19, 335–342. [Google Scholar] [CrossRef]
- Huang, Y.H.; Zhang, T.C. Effects of low pH on nitrate reduction by iron powder. Water Res. 2004, 38, 2631–2642. [Google Scholar] [CrossRef]
- Luo, H.; Jin, S.; Fallgren, P.H.; Colberg, P.J.S.; Johnson, P.A. Prevention of iron passivation and enhancement of nitrate reduction by electron supplementation. Chem. Eng. J. 2010, 160, 185–189. [Google Scholar] [CrossRef]
- Huang, Y.H.; Zhang, T.C. Effects of dissolved oxygen on formation of corrosion products and concomitant oxygen and nitrate reduction in zero-valent iron systems with or without aqueous Fe2+. Water Res. 2005, 39, 1751–1760. [Google Scholar] [CrossRef]
- Noubactep, C.; Caré, S. On nanoscale metallic iron for groundwater remediation. J. Hazard. Mater. 2010, 182, 923–927. [Google Scholar] [CrossRef] [Green Version]
- Yang, G.C.C.; Lee, H.L. Chemical reduction of nitrate by nanosized iron:Kinetics and pathways. Water Res. 2005, 39, 884–894. [Google Scholar] [CrossRef]
- Siciliano, A. Use of nanoscale zero-valent iron (NZVI) particles for chemical denitrification under different operating conditions. Metals 2015, 5, 1507–1519. [Google Scholar] [CrossRef] [Green Version]
- Kassaee, M.Z.; Motamedi, E.; Mikhak, A.; Rahnemaie, R. Nitrate removal from water using iron nanoparticles produced by arc discharge vs. Reduction. Chem. Eng. J. 2011, 166, 490–495. [Google Scholar] [CrossRef]
- Liou, Y.H.; Lo, S.-L.; Lin, C.-J.; Kuan, W.H.; Weng, S.C. Chemical reduction of an unbuffered nitrate solution using catalyzed and uncatalyzednanoscale iron particles. J. Hazard. Mater. 2005, B127, 102–110. [Google Scholar] [CrossRef] [PubMed]
- Tsai, Y.-J.; Chou, F.-C.; Cheng, T.-C. Coupled acidification and ultrasound with iron enhances nitrate reduction. J. Hazard. Mater. 2009, 163, 743–747. [Google Scholar] [CrossRef] [PubMed]
- Siciliano, A. Removal of Cr(VI) from water using a new reactive material: Magnesium Oxide supported nanoscale zero-valent iron. Materials 2016, 9, 666. [Google Scholar] [CrossRef] [PubMed] [Green Version]
- Siciliano, A.; Limonti, C. Nanoscopic zero-valent iron supported on MgO for lead removal from waters. Water 2018, 10, 404. [Google Scholar] [CrossRef] [Green Version]
- Liou, Y.H.; Lo, S.H.; Lin, C.J.; Hu, C.Y.; Kuan, W.H.; Weng, S.C. Methods for accelerating nitrate reduction using zerovalent iron atnear-neutral pH: Effects ofH2-reducing pretreatment andcopper deposition. Environ. Sci. Technol. 2005, 39, 9643–9648. [Google Scholar] [CrossRef]
- Mossa Hosseini, S.; Ataie-Ashtiani, B.; Kholghi, M. Nitrate reduction by nano-Fe/Cu particles in packed column. Desalination 2011, 276, 214–221. [Google Scholar] [CrossRef]
- Chang Ahn, S.; Oh, S.-Y.; Cha, D.K. Enhanced reduction of nitrate by zero-valent iron at elevated temperatures. J. Hazard. Mater. 2008, 156, 17–22. [Google Scholar]
- Akinrinade, I.D.; Ogundele, O.M.; Memudu, A.E.; Adefule, A.K.; Kalejaiye, E.D. Degeneration of neuronal cells: A product of fluoride and aluminium assault to the prefrontal cortex. J. Cell Anim. Biol. 2013, 7, 63–66. [Google Scholar]
- Brewer, G.J. Risks of Copper and Iron Toxicity during Aging in Humans. Chem. Res. Toxicol. 2010, 23, 319–326. [Google Scholar] [CrossRef] [PubMed]
- Lee, G.; Park, J. Reaction of zero-valent magnesium with water: Potential applications in environmental remediation. Geochim. Cosmochim. Acta 2013, 102, 162–174. [Google Scholar] [CrossRef]
- Lee, G.; Park, J.; Harvey, O.R. Reduction of Chromium (VI) mediated by zero-valent magnesium under neutral pH conditions. Water Res. 2013, 47, 1136–1146. [Google Scholar] [CrossRef]
- Engelmann, M.D.; Doyle, J.G.; Cheng, F. The complete dechlorination of DDT by magnesium/palladium bimetallic particles. Chemosphere 2001, 43, 195–198. [Google Scholar] [CrossRef]
- Ileri, B.; Ayyildiz, O.; Apaydin, O. Ultrasound-assisted activation of zero-valent magnesium for nitrate denitrification: Identification of reaction by-products and pathways. J. Hazard. Mater. 2015, 292, 1–8. [Google Scholar] [CrossRef]
- Mirabi, M.; Ghaderi, E.; Sadabad, H.R. Nitrate reduction using hybrid system consisting of zero valent magnesium powder/activated carbon (Mg0/AC) from water. Process Saf. Environ. Prot. 2017, 111, 627–634. [Google Scholar] [CrossRef]
- Siciliano, A.; Curcio, G.M.; Limonti, C. Experimental analysis and modeling of nitrate removal through zero-valent magnesium particles. Water 2019, 11, 1276. [Google Scholar] [CrossRef] [Green Version]
- APHA. Standard Methods for the Examination of Water and Wastewater, 18th ed.; American Public Health Association: Washington, DC, USA, 1992. [Google Scholar]
- Kim, S.A.; Kamala-Kannan, S.; Lee, K.-J.; Park, Y.-J.; Shea, P.J.; Lee, W.-H.; Kim, H.-M.; Oha, B.-T. Removal of Pb(II) from aqueous solution by a zeolite–nanoscale zero-valent iron composite. Chem. Eng. J. 2013, 217, 54–60. [Google Scholar] [CrossRef] [Green Version]
- Council of the European Communities. Directive 91/271/EEC, No L 135/40, 30/05/1991; Official Journal of the European Communities. Available online: https://eur-lex.europa.eu/legal-content/EN/TXT/PDF/?uri=CELEX:31991L0271&from=EN (accessed on 28 March 2020).
- Council of the European Union. Directive 98/83/EC, No L 330/32, 05/12/1998; Official Journal of the European Communities. Available online: https://eur-lex.europa.eu/LexUriServ/LexUriServ.do?uri=OJ:L:1998:330:0032:0054:EN:PDF. (accessed on 28 March 2020).
Figure 1.
Scheme of the column system used for the experiments.

Figure 2.
SEM image (a) and XRD diffractogram (b) of fresh Mg0 particles.

Figure 3.
Concentrations of N-NO3− (a), N-NO2− (b), N-NH4+ (c), ΔN (d) and Mg2+ (e) during the tests carried out at pH 3, T = 20 °C, with Ni = 20 mg N-NO3−/L by changing the hydraulic recirculation velocity (v).
Figure 3.
Concentrations of N-NO3− (a), N-NO2− (b), N-NH4+ (c), ΔN (d) and Mg2+ (e) during the tests carried out at pH 3, T = 20 °C, with Ni = 20 mg N-NO3−/L by changing the hydraulic recirculation velocity (v).

Figure 4.
Concentrations of N-NO3− (a), N-NO2− (b), N-NH4+ (c), ΔN (d) and Mg2+ (e) during the tests carried out at pH 3, T = 20 °C, with v = 1 m/min by varying the initial N-NO3− concentration (Ni).
Figure 4.
Concentrations of N-NO3− (a), N-NO2− (b), N-NH4+ (c), ΔN (d) and Mg2+ (e) during the tests carried out at pH 3, T = 20 °C, with v = 1 m/min by varying the initial N-NO3− concentration (Ni).

Figure 5.
Concentrations of N-NO3− (a), N-NO2− (b), N-NH4+ (c), ΔN (d) and Mg2+ (e) during the tests carried out at pH 5, T = 20 °C, with v = 1 m/min by varying the initial N-NO3− concentration (Ni).
Figure 5.
Concentrations of N-NO3− (a), N-NO2− (b), N-NH4+ (c), ΔN (d) and Mg2+ (e) during the tests carried out at pH 5, T = 20 °C, with v = 1 m/min by varying the initial N-NO3− concentration (Ni).

Figure 6.
Concentrations of N-NO3− (a), N-NO2− (b), N-NH4+ (c), ΔN (d) and Mg2+ (e) during the tests carried out at pH 7, T = 20 °C, with v = 1 m/min by varying the initial N-NO3− concentration (Ni).
Figure 6.
Concentrations of N-NO3− (a), N-NO2− (b), N-NH4+ (c), ΔN (d) and Mg2+ (e) during the tests carried out at pH 7, T = 20 °C, with v = 1 m/min by varying the initial N-NO3− concentration (Ni).

Figure 7.
Concentrations of N-NO3− (a), N-NO2− (b), N-NH4+ (c), ΔN (d) and Mg2+ (e) during the tests carried out at pH 3, with v = 1 m/min, Ni = 20 mg N-NO3−/L by varying the temperature (T).
Figure 7.
Concentrations of N-NO3− (a), N-NO2− (b), N-NH4+ (c), ΔN (d) and Mg2+ (e) during the tests carried out at pH 3, with v = 1 m/min, Ni = 20 mg N-NO3−/L by varying the temperature (T).

Figure 8.
Concentrations of N-NO3− (a), N-NO2− (b), N-NH4+ (c), ΔN (d) and Mg2+ (e) during the tests carried out at pH 5, with a v = 1 m/min, Ni = 20 mgN-NO3−/L by varying the temperature (T).
Figure 8.
Concentrations of N-NO3− (a), N-NO2− (b), N-NH4+ (c), ΔN (d) and Mg2+ (e) during the tests carried out at pH 5, with a v = 1 m/min, Ni = 20 mgN-NO3−/L by varying the temperature (T).

Figure 9.
Concentrationsof N-NO3− (a), N-NO2− (b), N-NH4+ (c), ΔN (d) and Mg2+ (e) during the tests carried out at pH 7, with v = 1 m/min, Ni = 20 mgN-NO3−/L by varying the temperature (T).
Figure 9.
Concentrationsof N-NO3− (a), N-NO2− (b), N-NH4+ (c), ΔN (d) and Mg2+ (e) during the tests carried out at pH 7, with v = 1 m/min, Ni = 20 mgN-NO3−/L by varying the temperature (T).

Figure 10.
Concentrations of N-NO3− (a), N-NO2− (b), N-NH4+ (c), ΔN (d) and Mg2+ (e) during the tests carried out at pH 3, T = 20 °C, with v = 1 m/min by reusing the material to treat solutions with Ni = 20 mg N-NO3−/L.
Figure 10.
Concentrations of N-NO3− (a), N-NO2− (b), N-NH4+ (c), ΔN (d) and Mg2+ (e) during the tests carried out at pH 3, T = 20 °C, with v = 1 m/min by reusing the material to treat solutions with Ni = 20 mg N-NO3−/L.

Figure 11.
Modeling of the experimental curves of N-NO3− concentration obtained during the tests carried out at pH 3, T = 20 °C, with v = 1 m/min, by varying Ni (a); at pH 3, with v = 1 m/min, Ni = 20 mgN-NO3−/L by varying the temperature (T) (b).
Figure 11.
Modeling of the experimental curves of N-NO3− concentration obtained during the tests carried out at pH 3, T = 20 °C, with v = 1 m/min, by varying Ni (a); at pH 3, with v = 1 m/min, Ni = 20 mgN-NO3−/L by varying the temperature (T) (b).

Figure 12.
Kobs as a function of RMN ratio (a) and temperature (b).

Figure 13.
SEM image (a) and XRD diffractogram (b) of exhausted Mg0 particles.


Table 1.
Kinetic parameters obtained through the interpolation of experimental curves at pH 3, T = 20 °C, with v = 1 m/min by varying Ni.
Table 1.
Kinetic parameters obtained through the interpolation of experimental curves at pH 3, T = 20 °C, with v = 1 m/min by varying Ni.
| Ni mgN-NO3−/L | RMN Mg0/mgN-NO3− | Kobs min−1 | NS mgN-NO3−/L | R2 |
|---|---|---|---|---|
| 10 | 0.666 | 0.0222 | 1.625 | 0.985 |
| 20 | 0.333 | 0.1451 | 0.945 | 0.988 |
| 40 | 0.166 | 0.0839 | 0.771 | 0.999 |
| 60 | 0.111 | 0.0508 | 1.588 | 0.994 |
| 80 | 0.083 | 0.0547 | 1.086 | 0.999 |
| 100 | 0.066 | 0.0503 | 1.285 | 0.999 |
| 140 | 0.047 | 0.0247 | 1.941 | 0.997 |
Table 2.
Kinetic parameters obtained through the interpolation of experimental curves at pH 3, with v = 1 m/min, Ni = 20 mgN-NO3−/L (RMN = 0.333 Mg0/mgN-NO3−) by varying the temperature.
Table 2.
Kinetic parameters obtained through the interpolation of experimental curves at pH 3, with v = 1 m/min, Ni = 20 mgN-NO3−/L (RMN = 0.333 Mg0/mgN-NO3−) by varying the temperature.
| T °C | Kobs min−1 | NS mgN-NO3−/L | R2 |
|---|---|---|---|
| 20 | 0.1451 | 0.945 | 0.988 |
| 30 | 0.0481 | 2.390 | 0.986 |
| 40 | 0.0201 | 1.932 | 0.990 |
© 2020 by the authors. Licensee MDPI, Basel, Switzerland. This article is an open access article distributed under the terms and conditions of the Creative Commons Attribution (CC BY) license (http://creativecommons.org/licenses/by/4.0/).
Share and Cite
MDPI and ACS Style
Siciliano, A.; Curcio, G.M.; Limonti, C. Chemical Denitrification with Mg0 Particles in Column Systems. Sustainability 2020, 12, 2984. https://doi.org/10.3390/su12072984
AMA Style
Siciliano A, Curcio GM, Limonti C. Chemical Denitrification with Mg0 Particles in Column Systems. Sustainability. 2020; 12(7):2984. https://doi.org/10.3390/su12072984
Chicago/Turabian StyleSiciliano, Alessio, Giulia Maria Curcio, and Carlo Limonti. 2020. "Chemical Denitrification with Mg0 Particles in Column Systems" Sustainability 12, no. 7: 2984. https://doi.org/10.3390/su12072984
Note that from the first issue of 2016, this journal uses article numbers instead of page numbers. See further details here.