Citizen and Educational Initiatives to Support Sustainable Development Goal 6: Clean Water and Sanitation for All


Abstract
:1. Introduction
2. Materials and Methods
It is clear that public bodies, responsible for the data, [should] update them periodically, filtering and selecting those that can be published and are free of charge, without infringing security laws and complying with European regulations.[23] (p. 15)
2.1. Online Survey
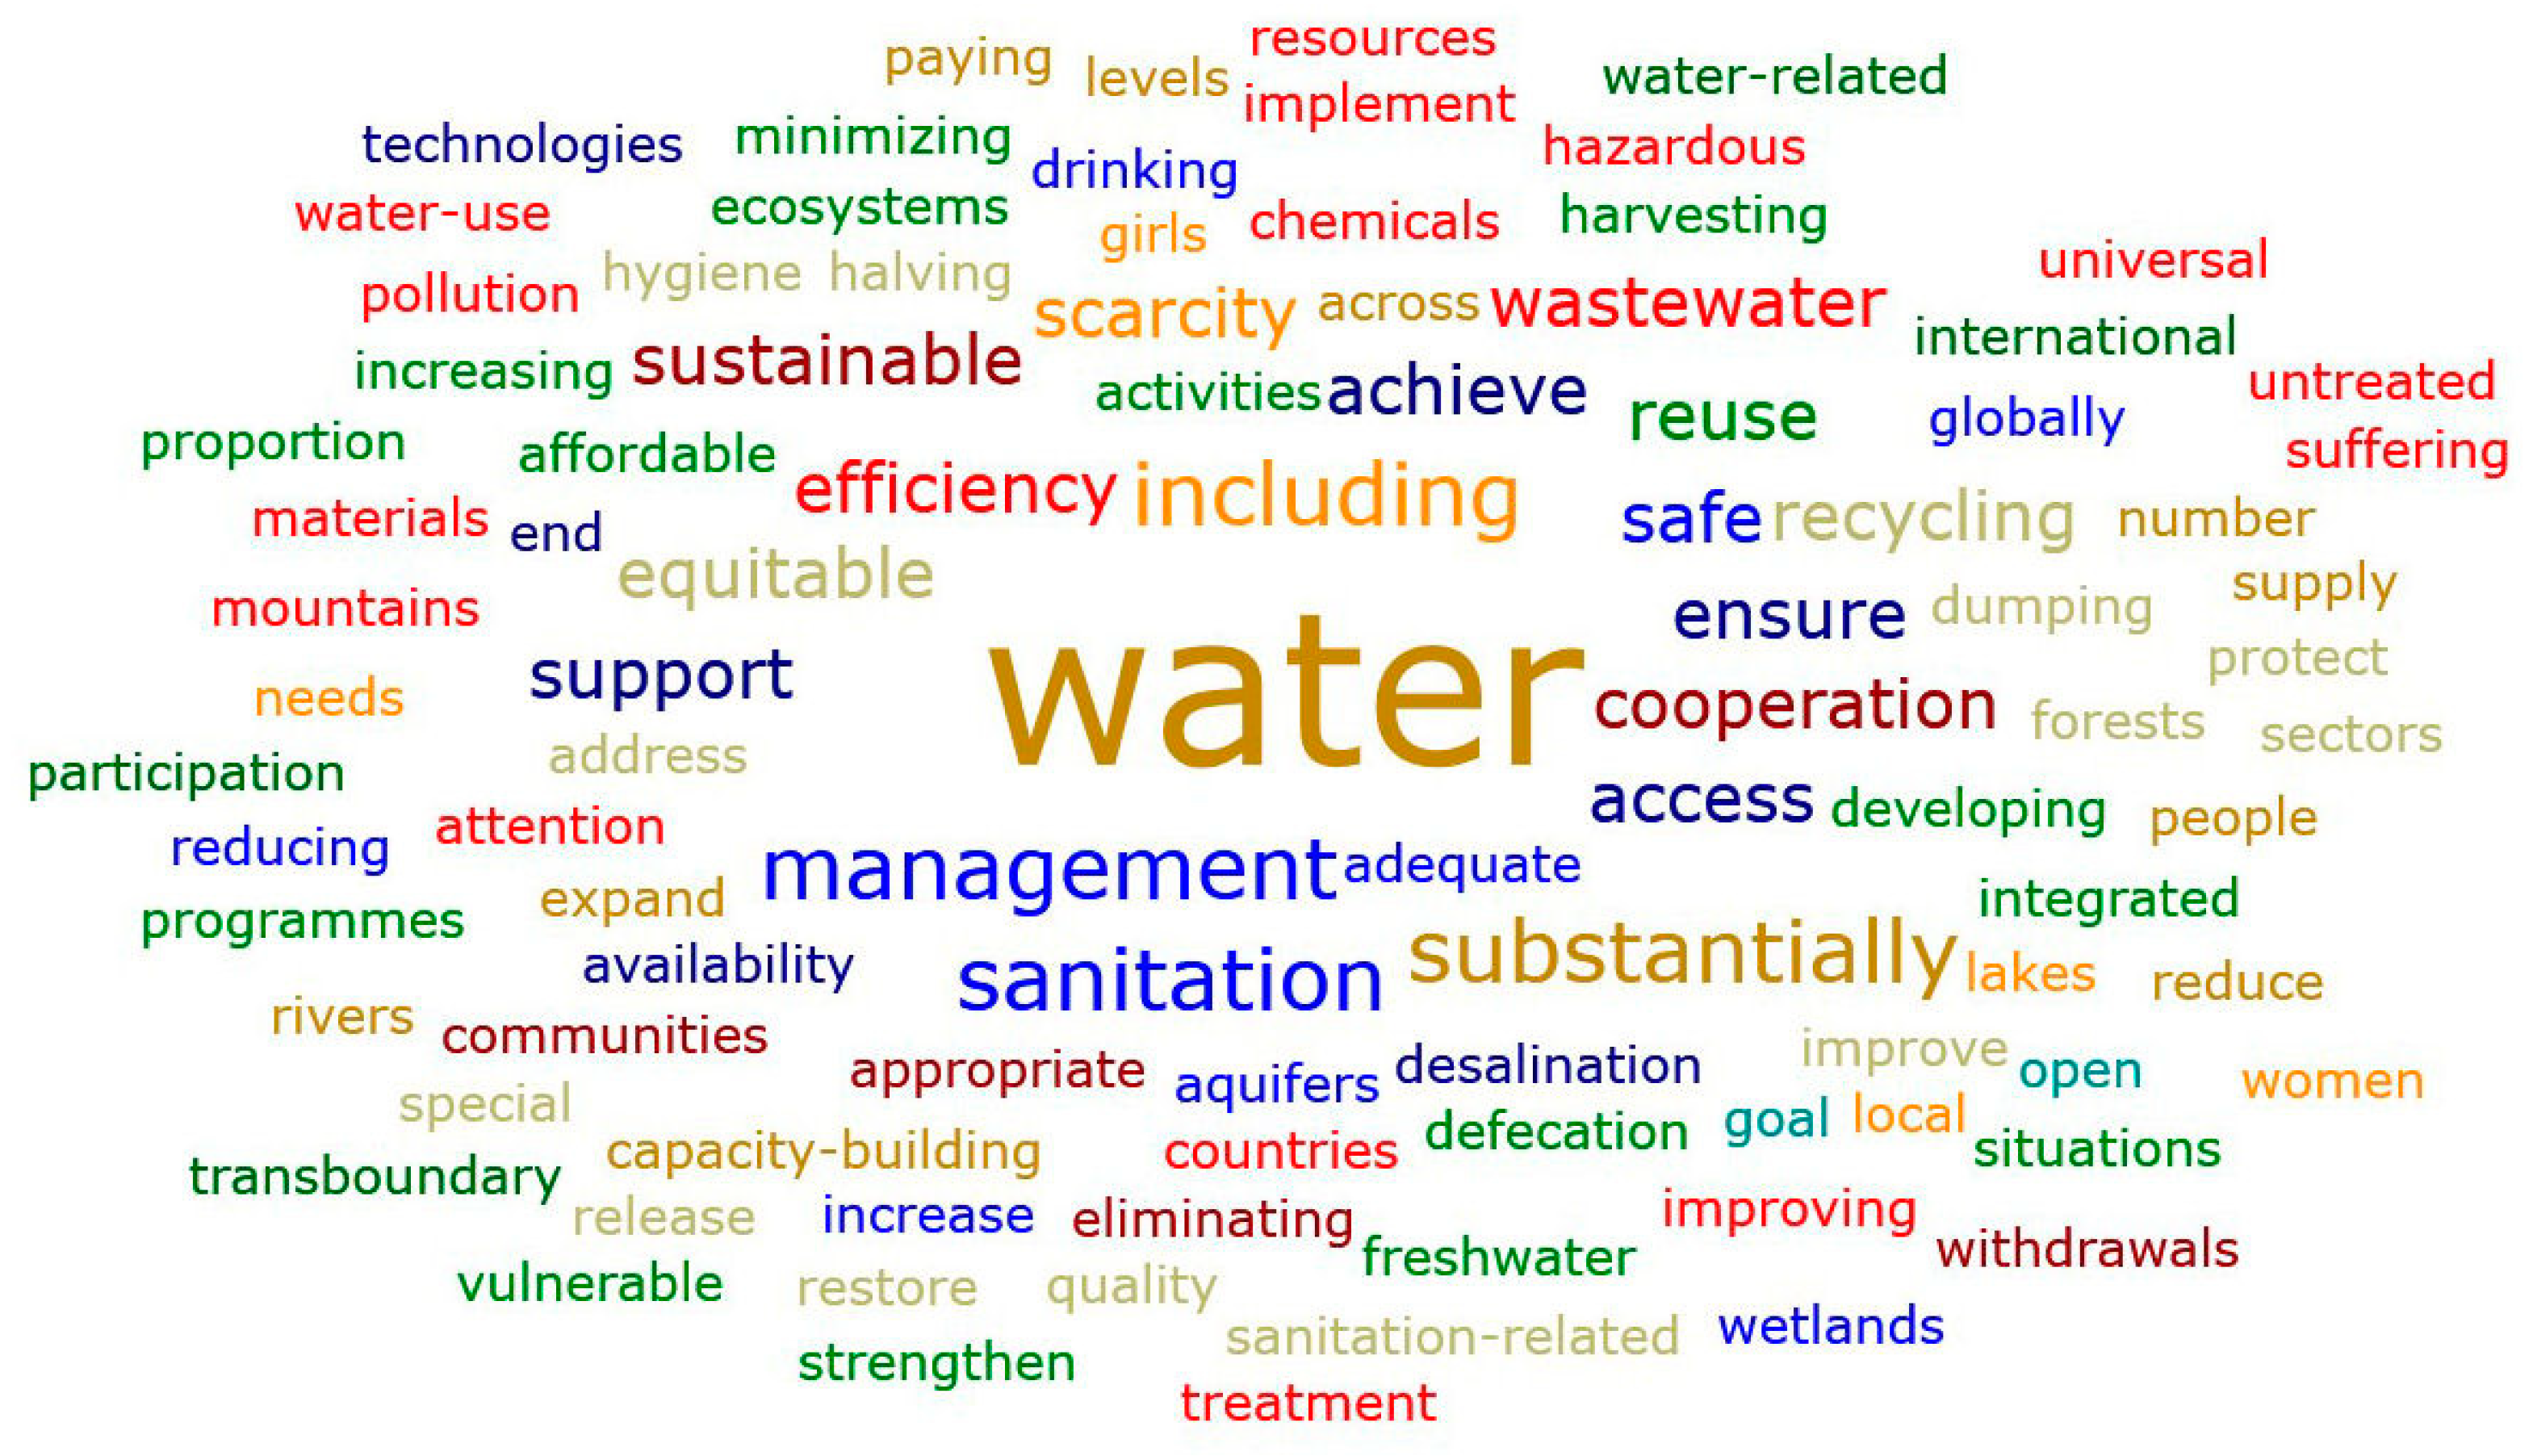
2.2. The Story Map—An Educational Resource to Raise Awareness
3. Results
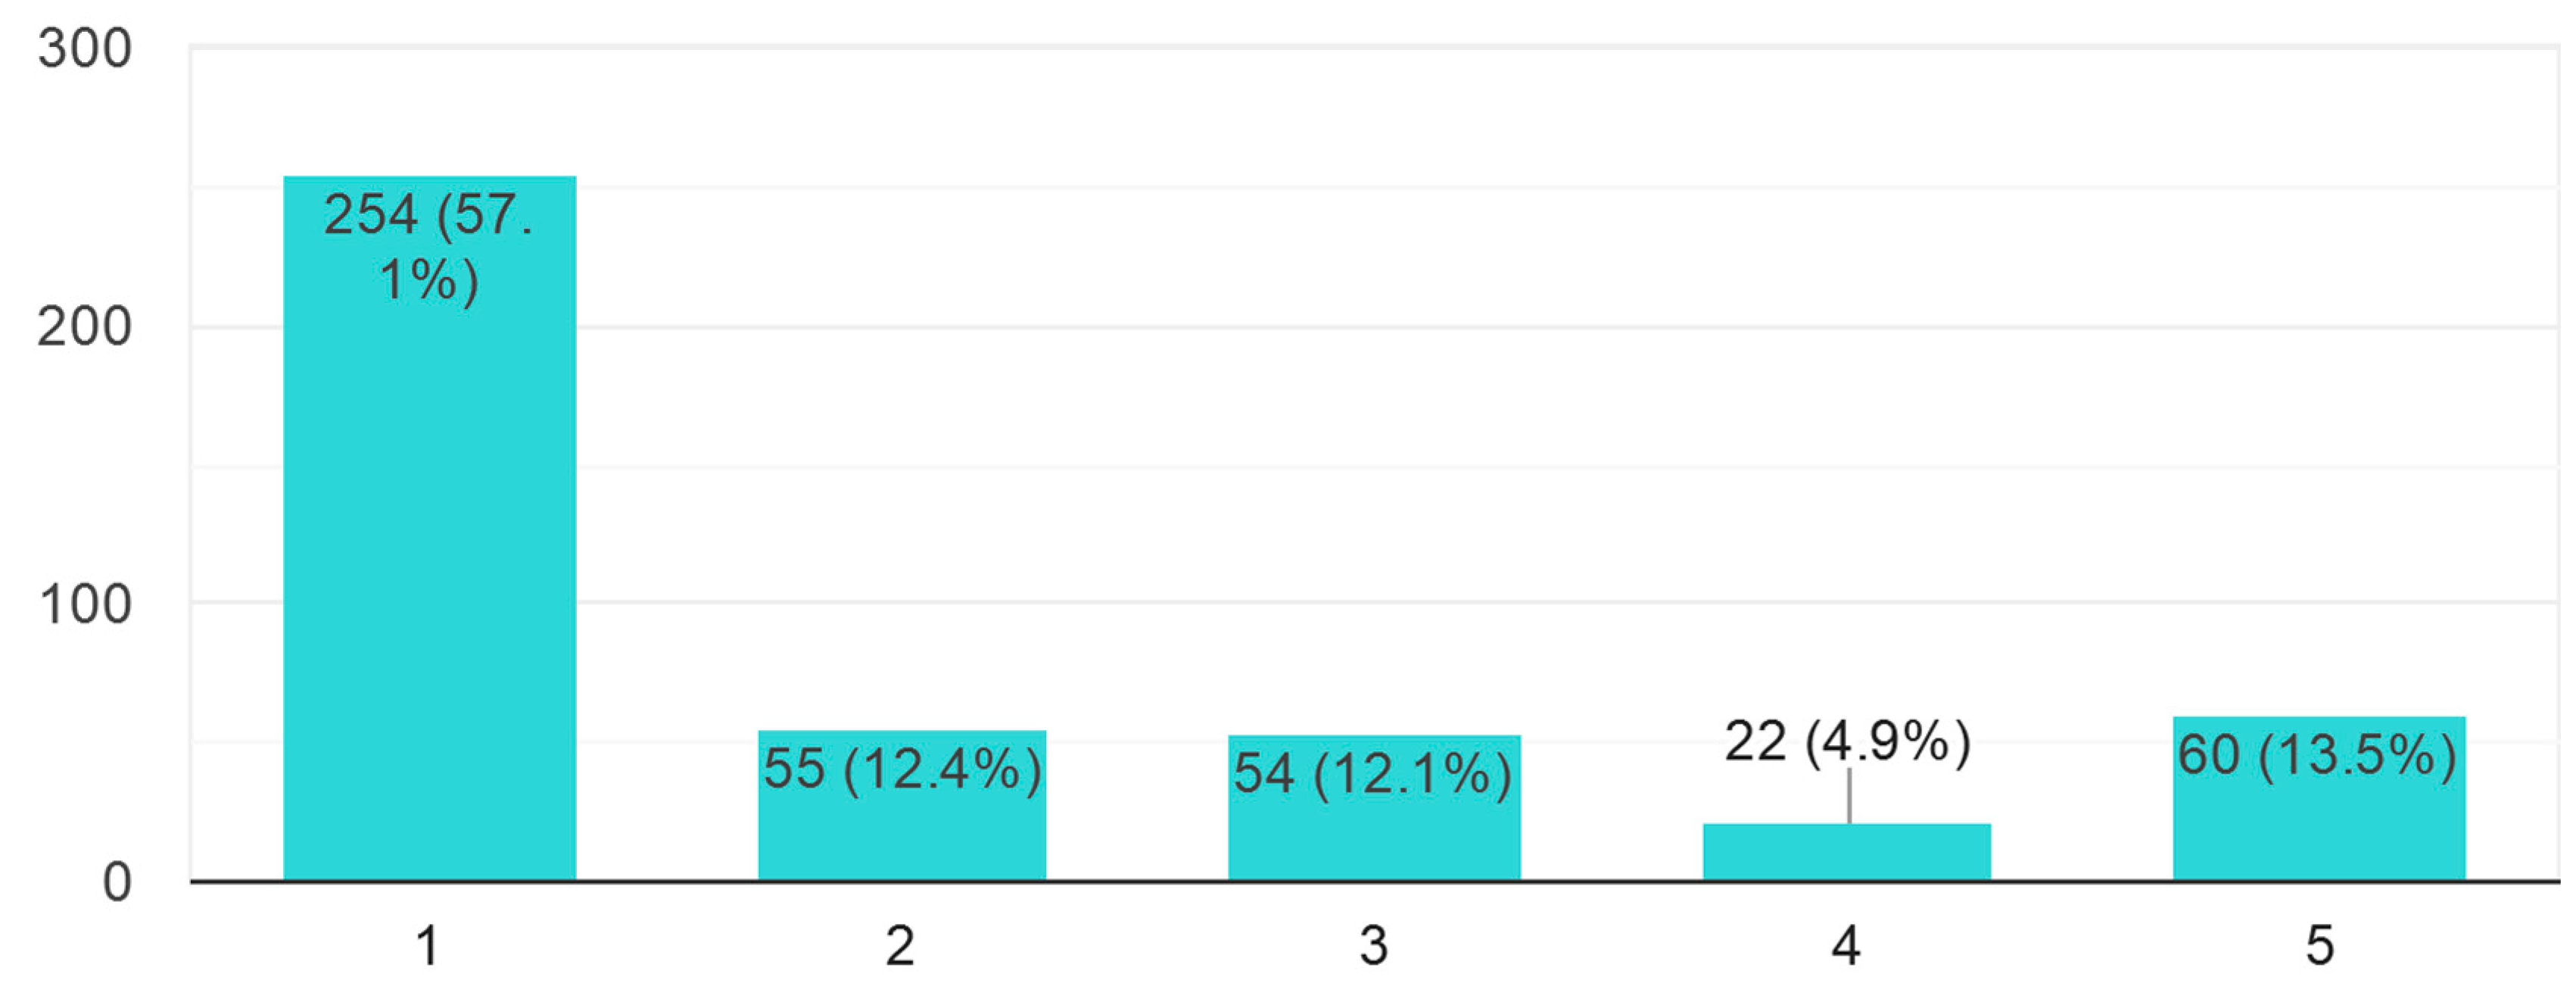
3.1. Spaniards’ Perception of Water Use
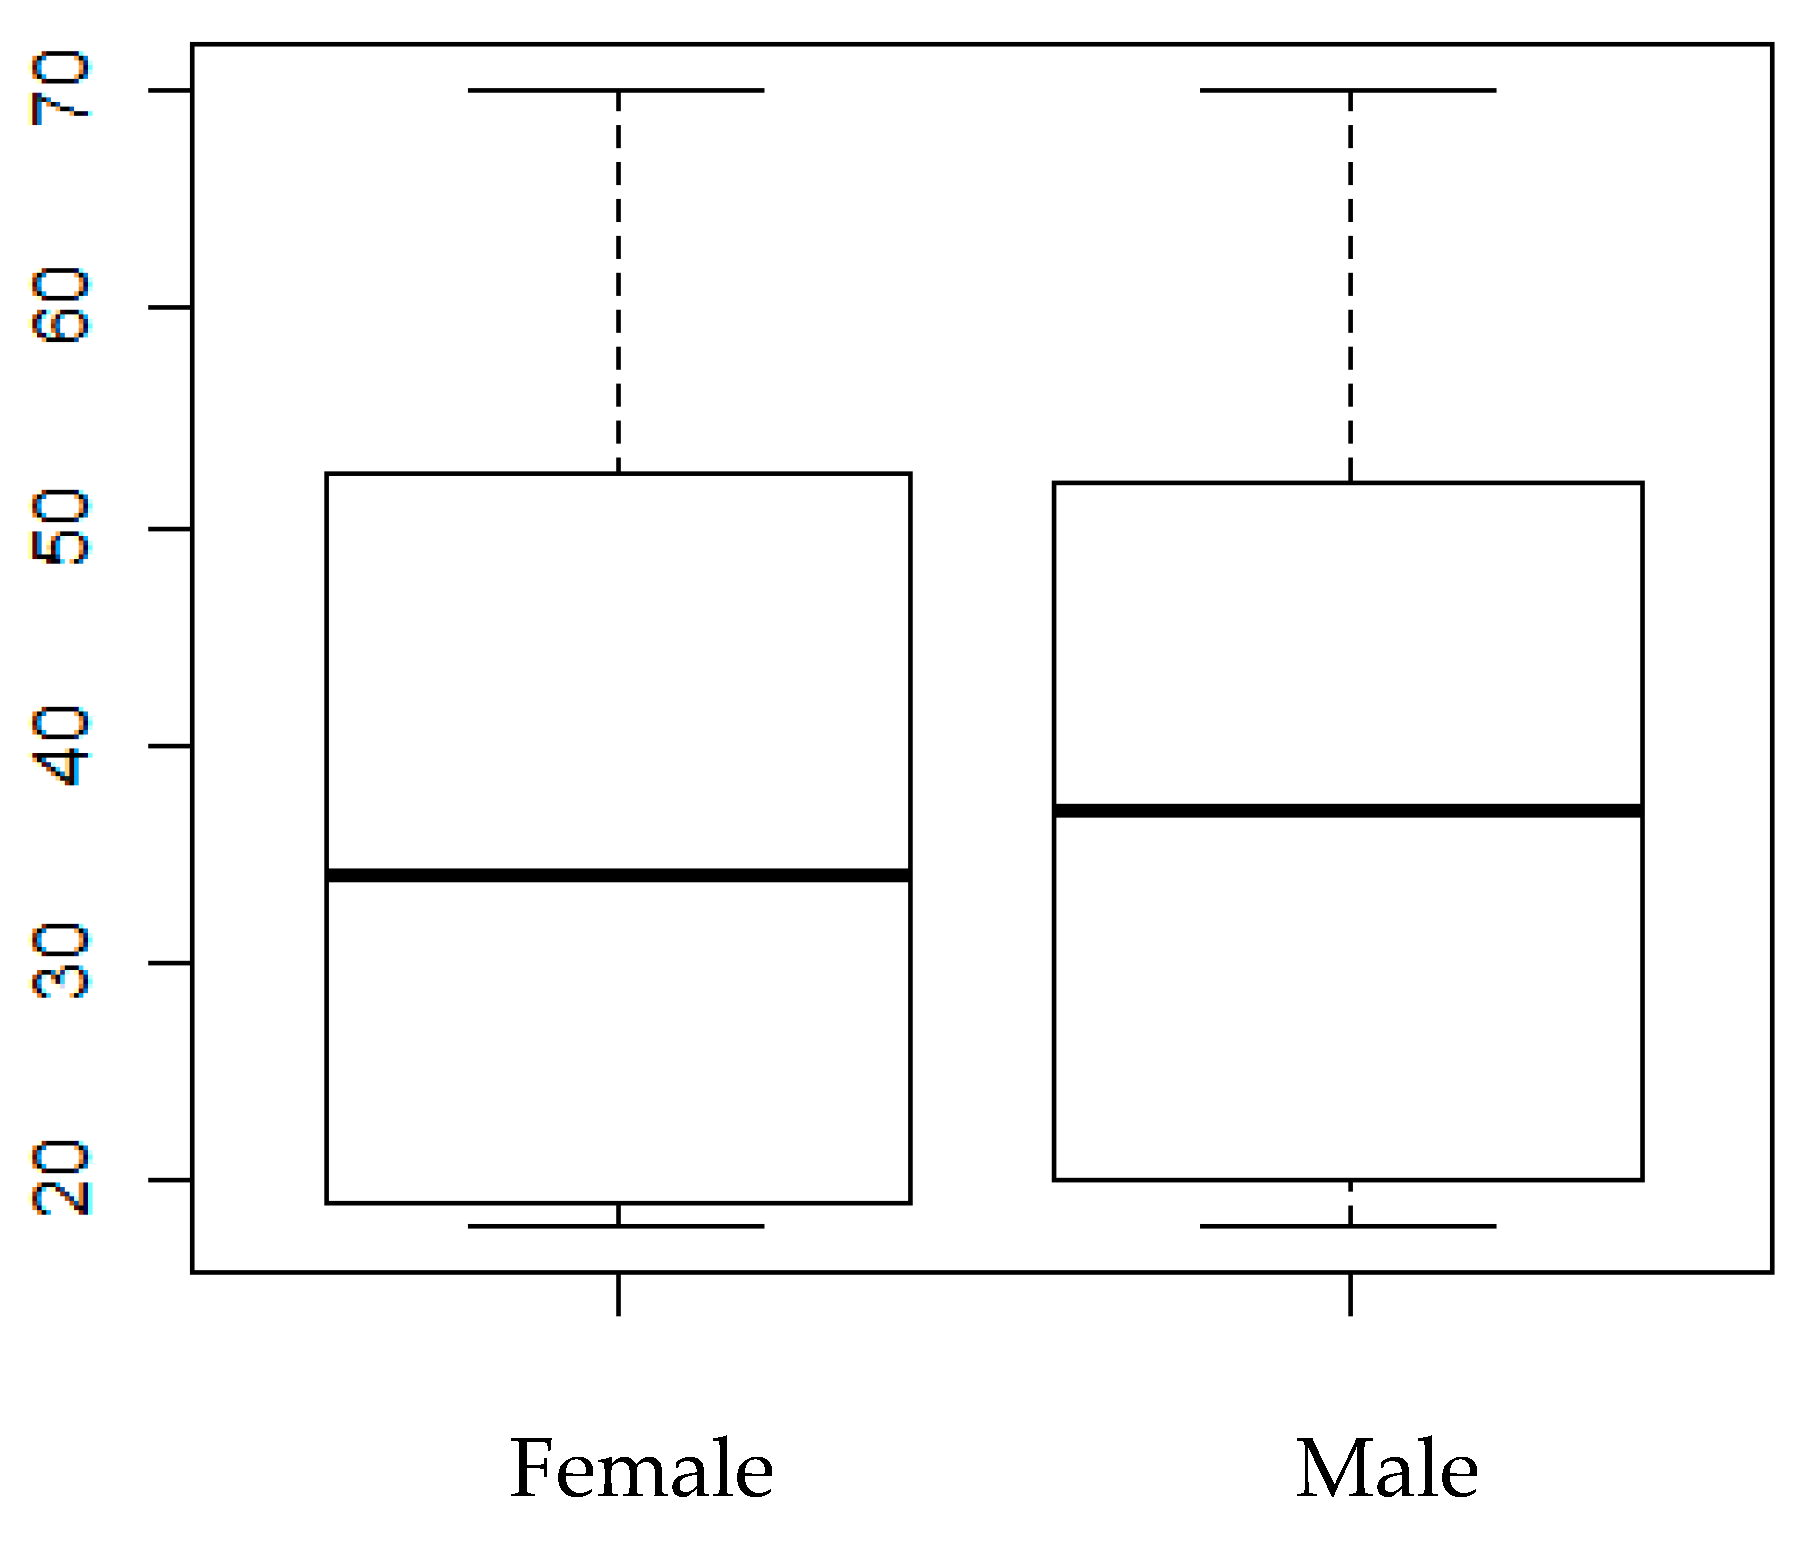
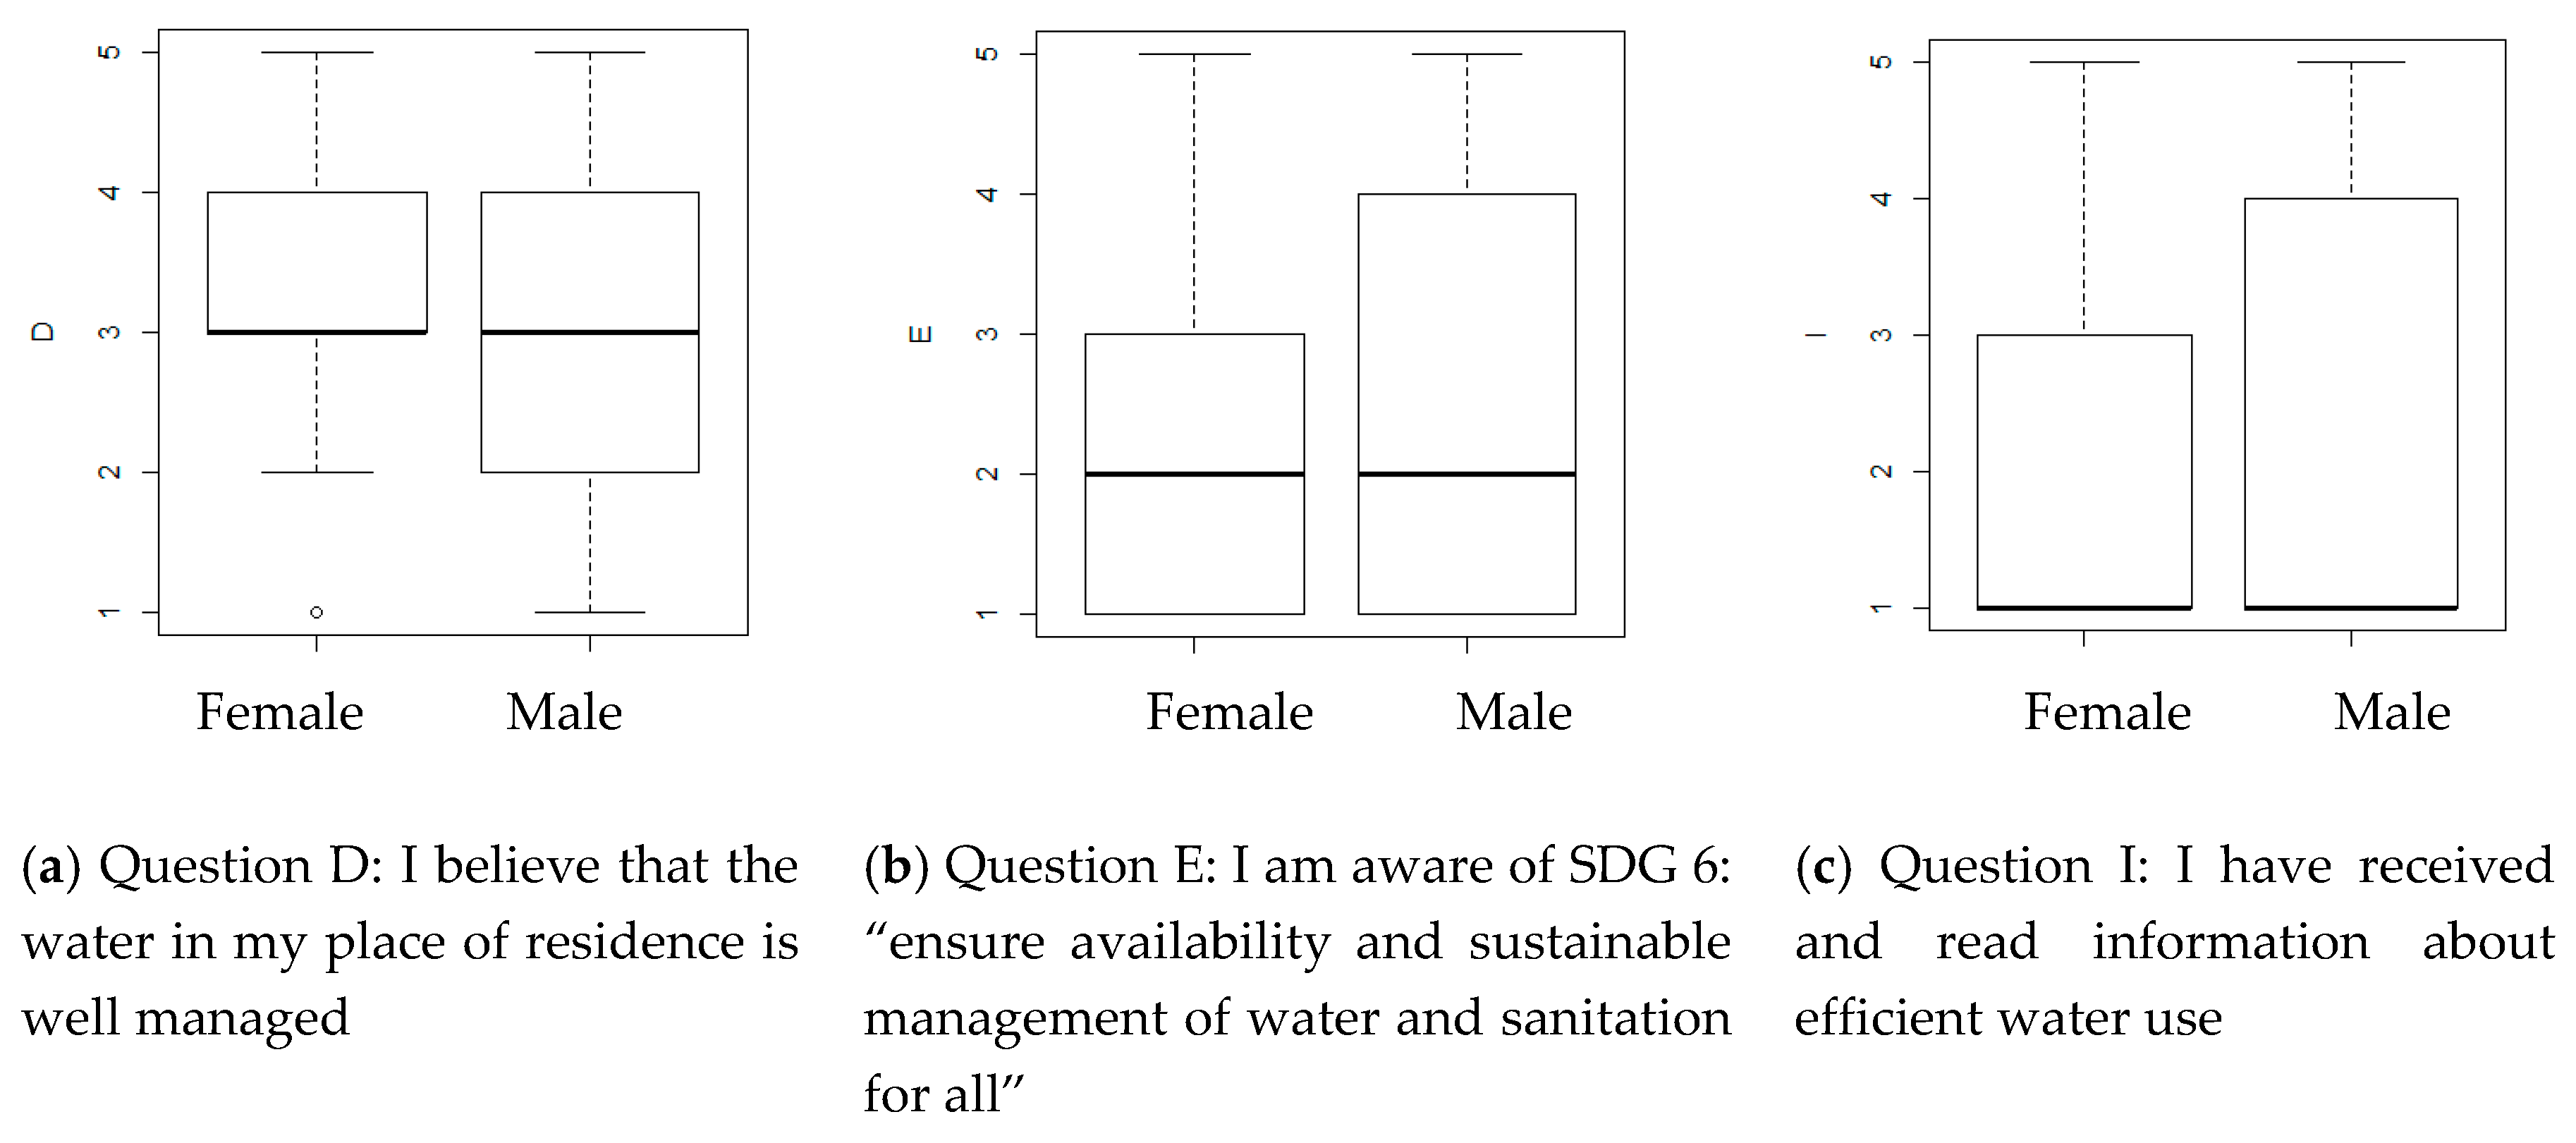
3.1.1. Differences by Gender
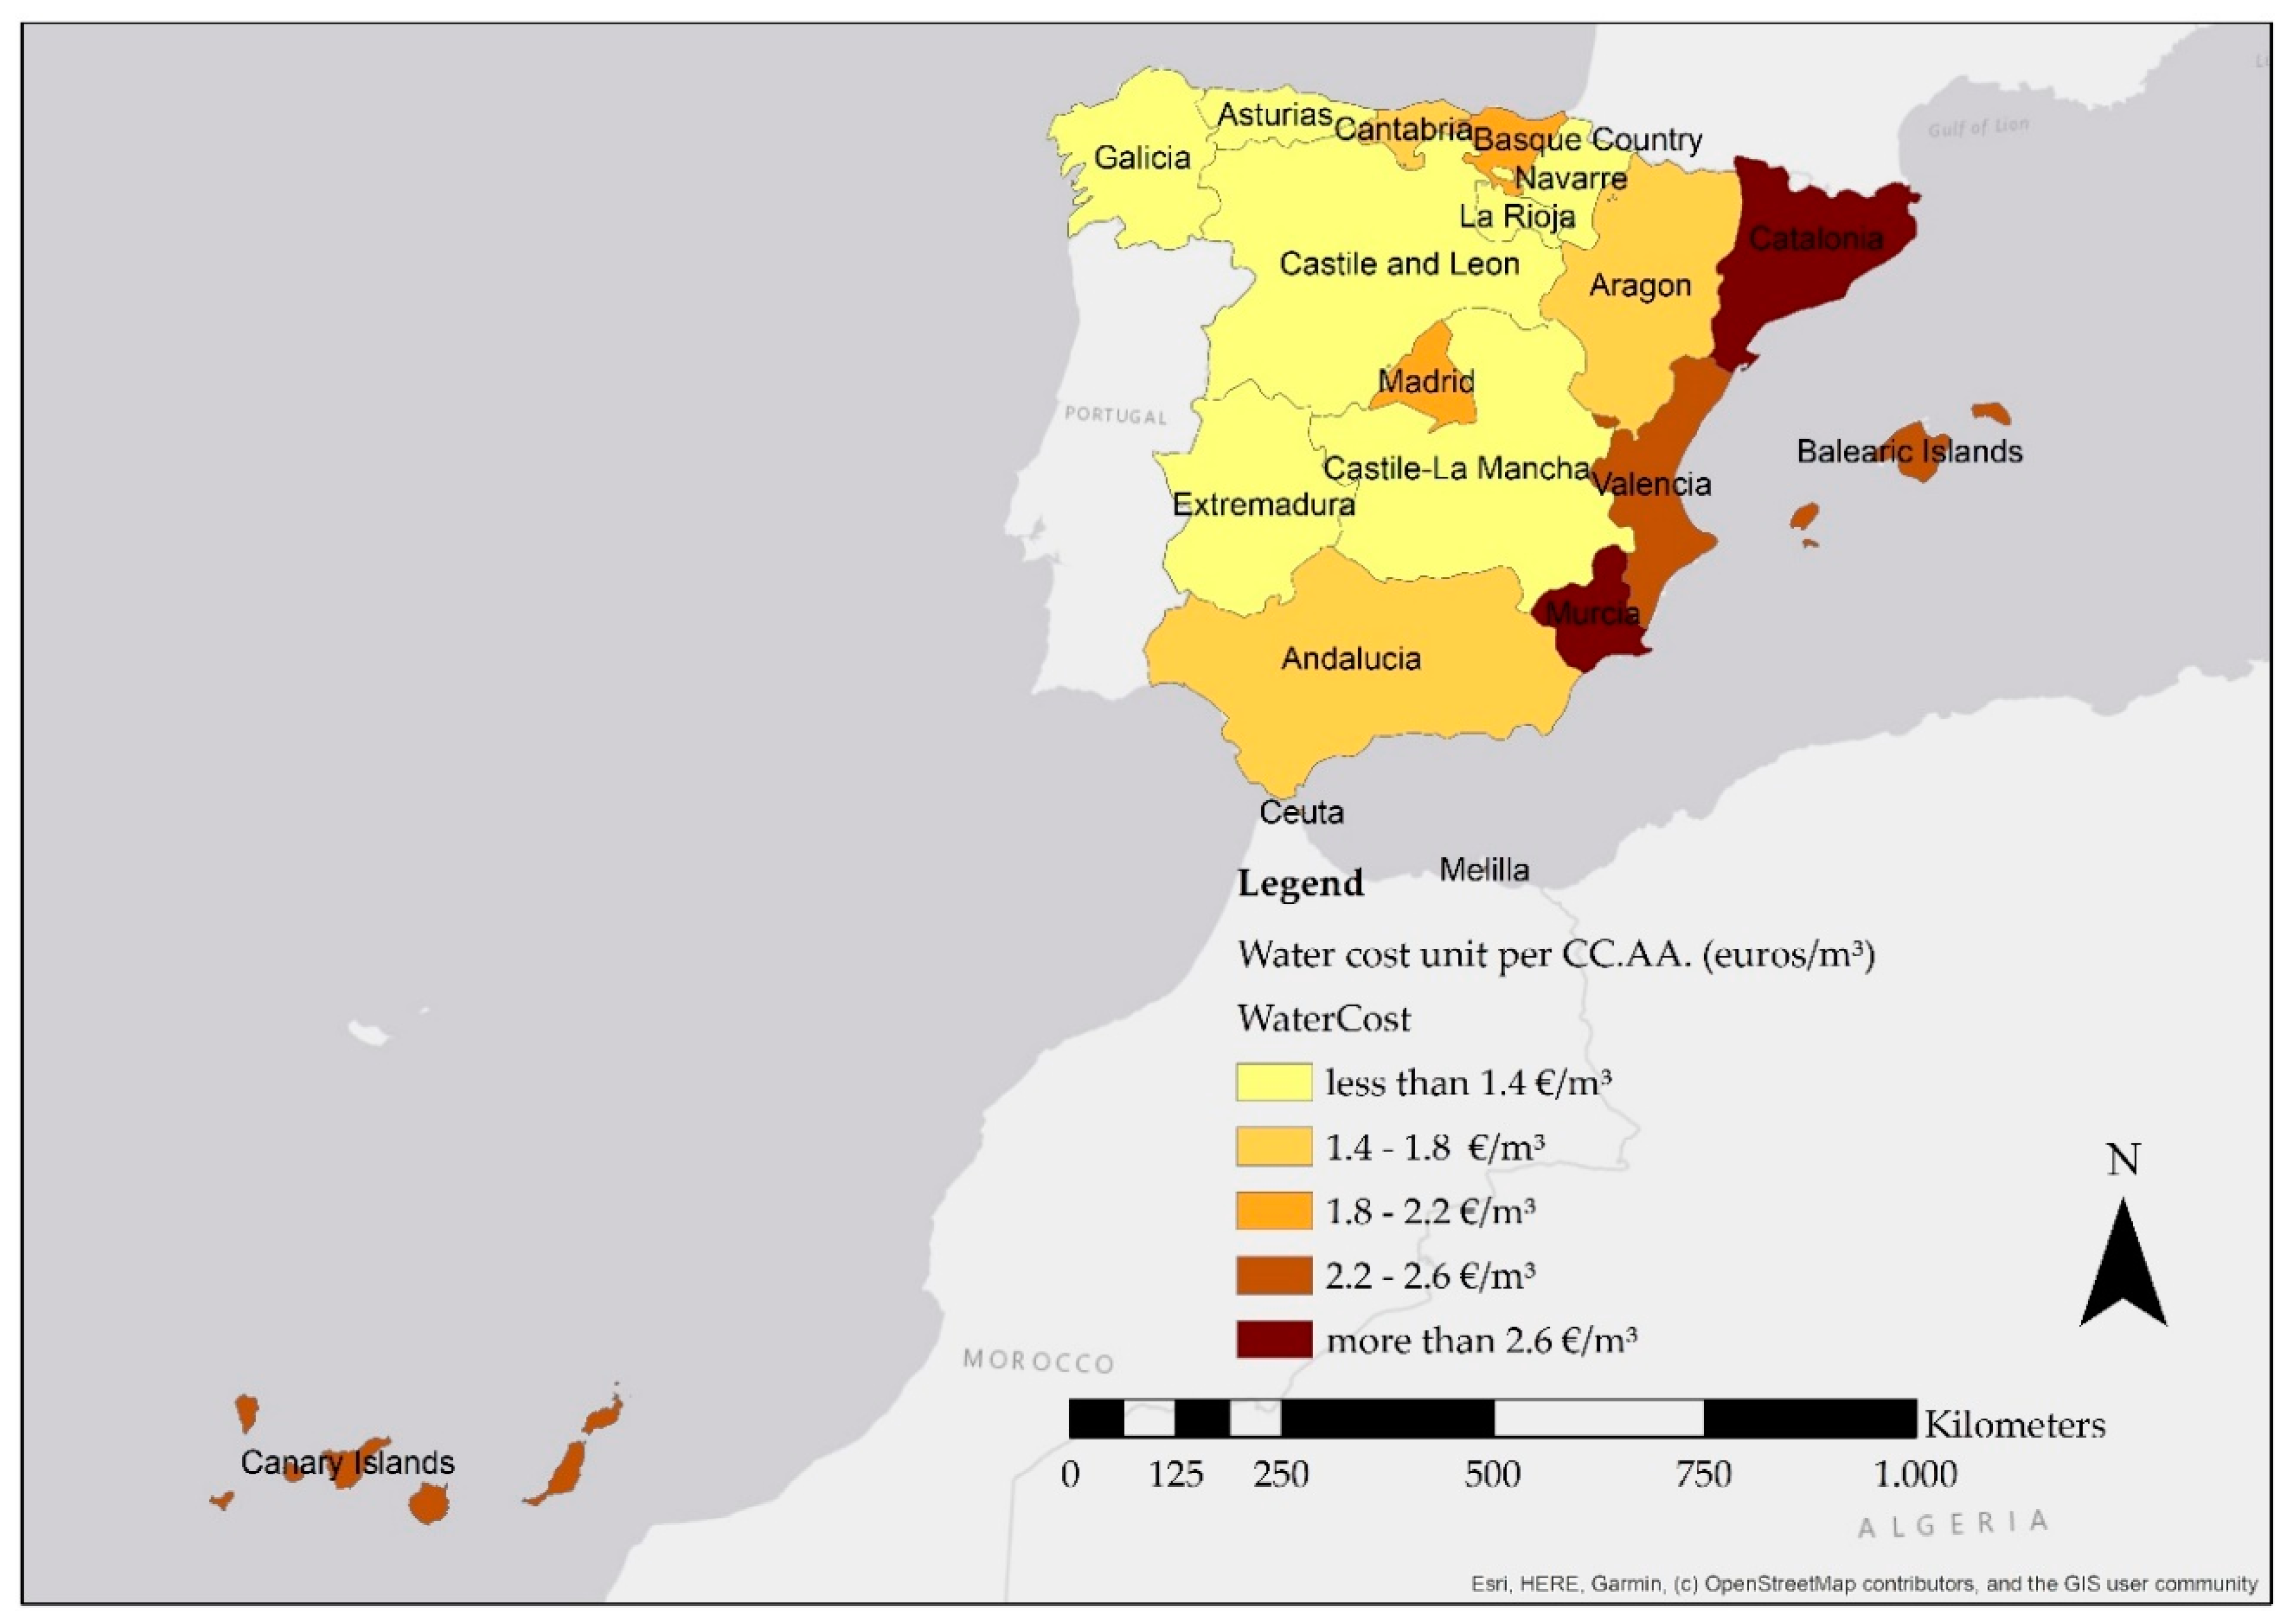
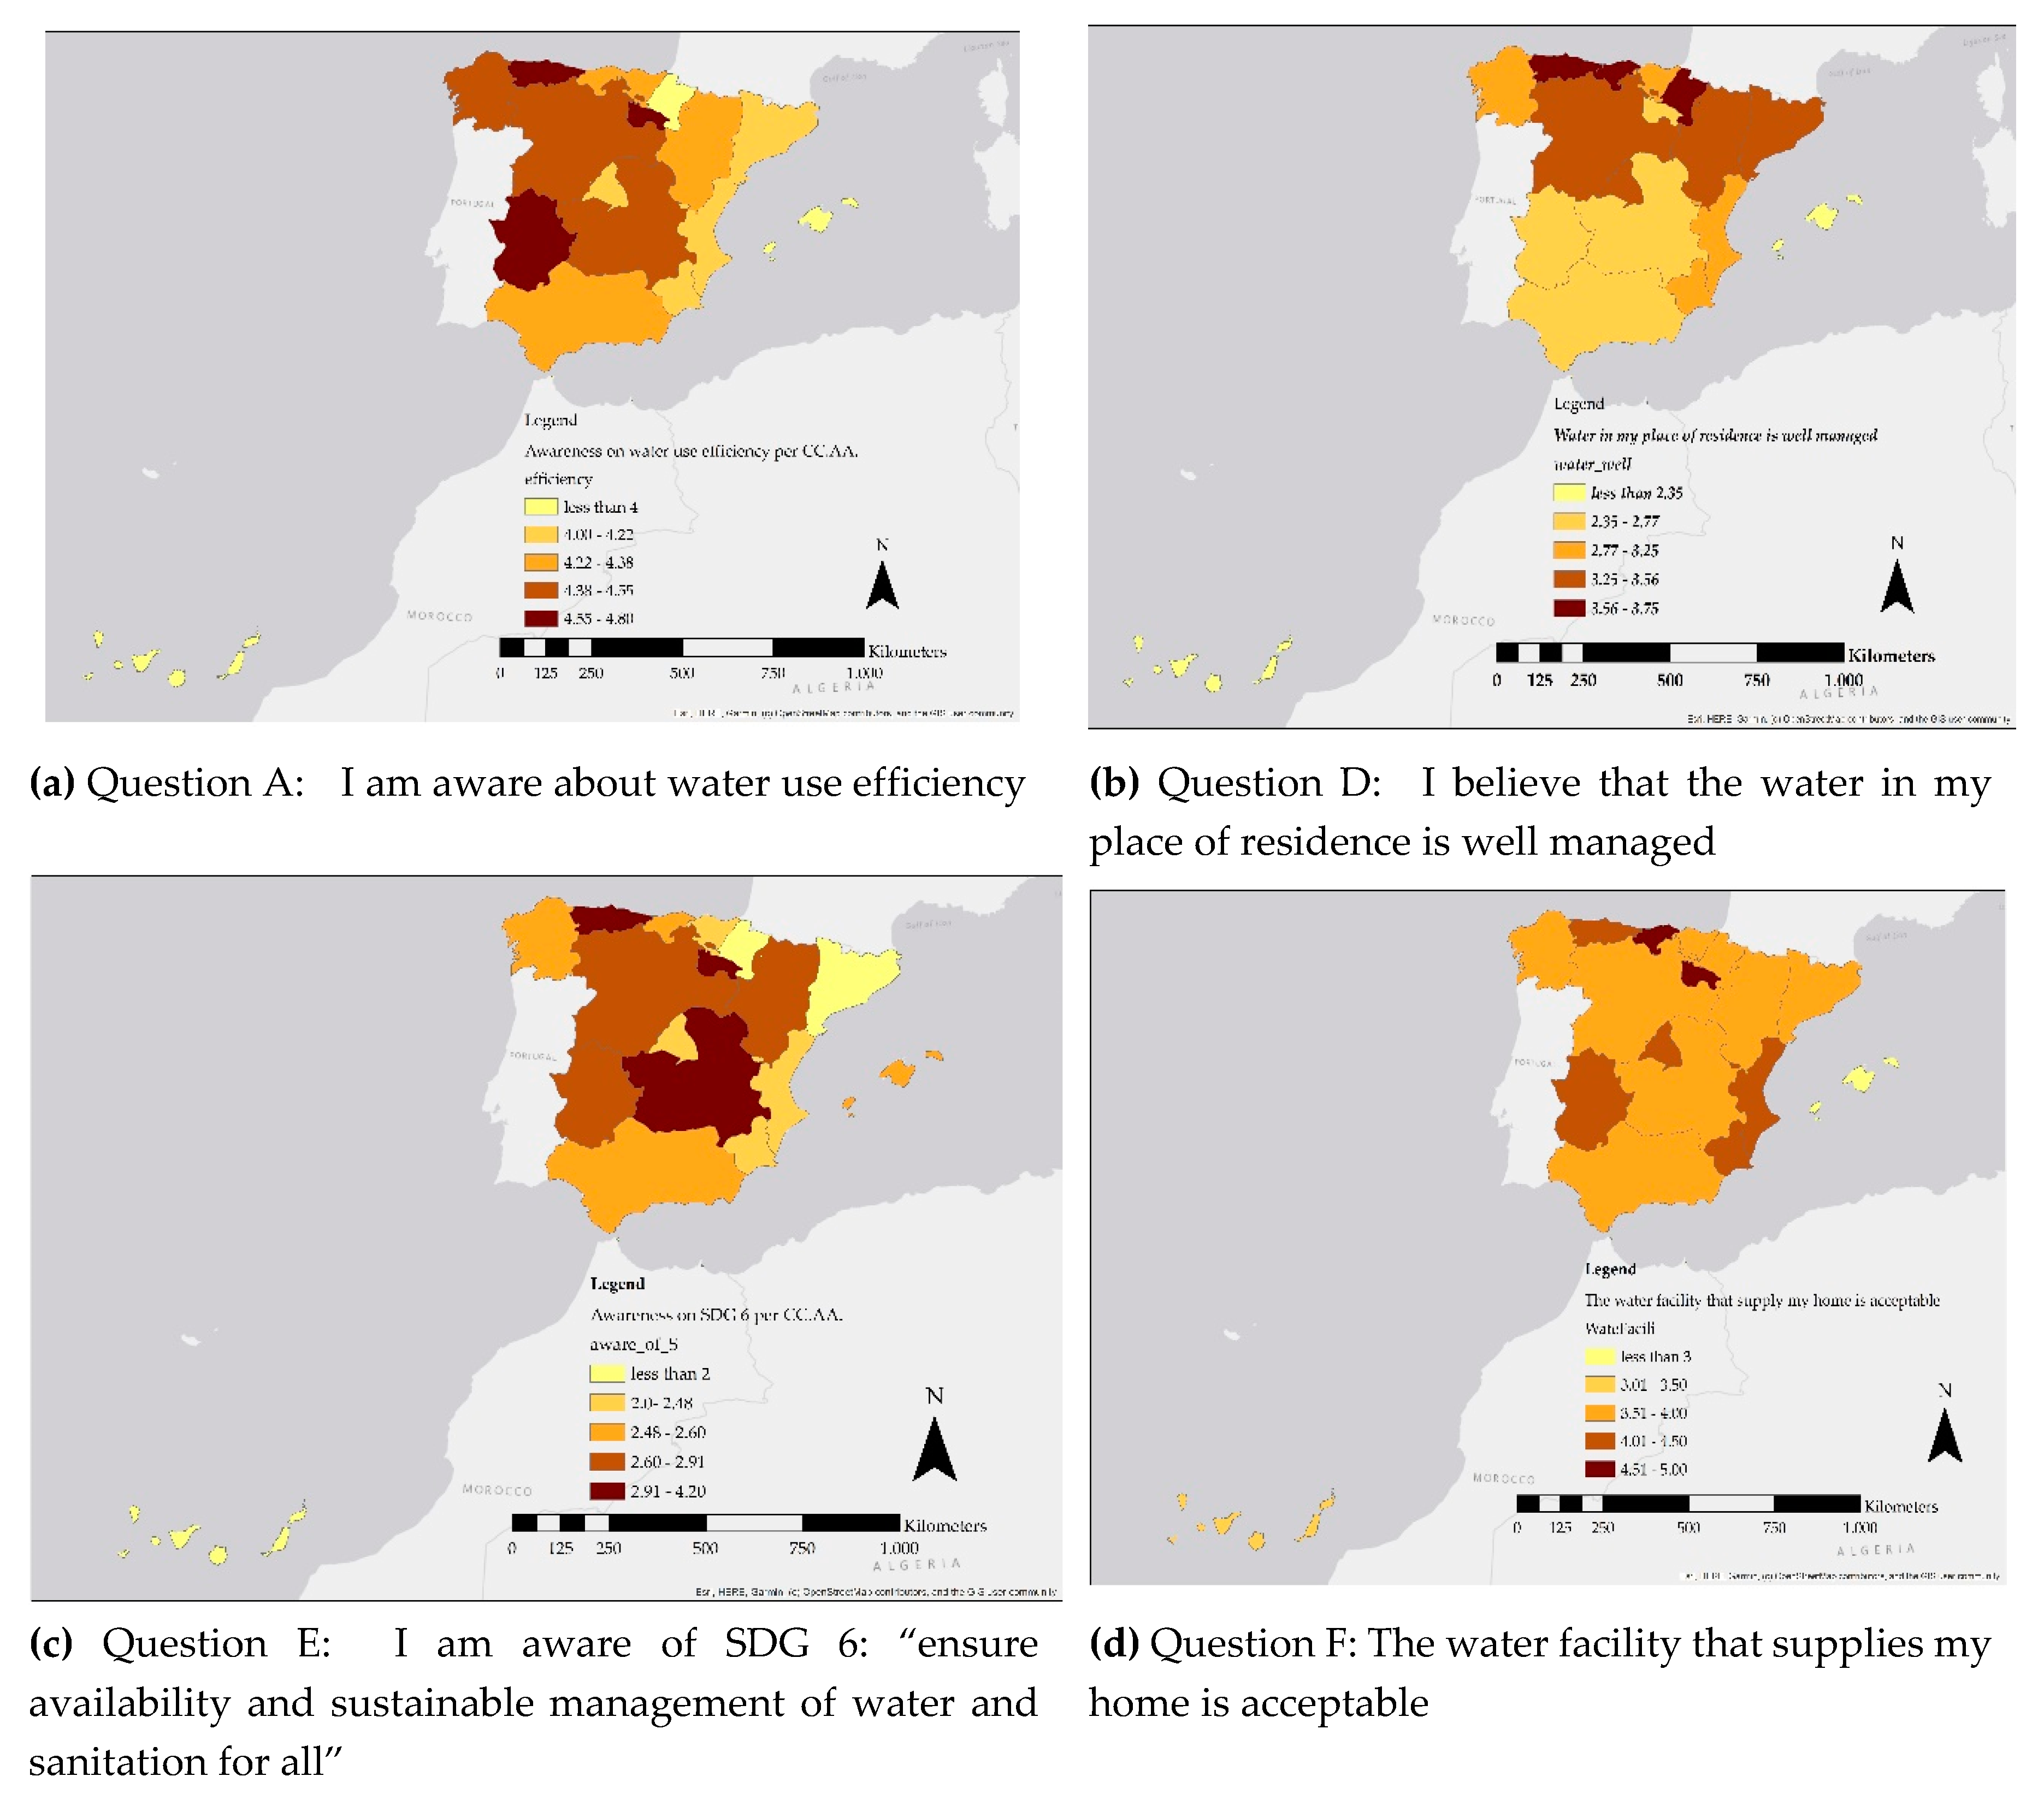
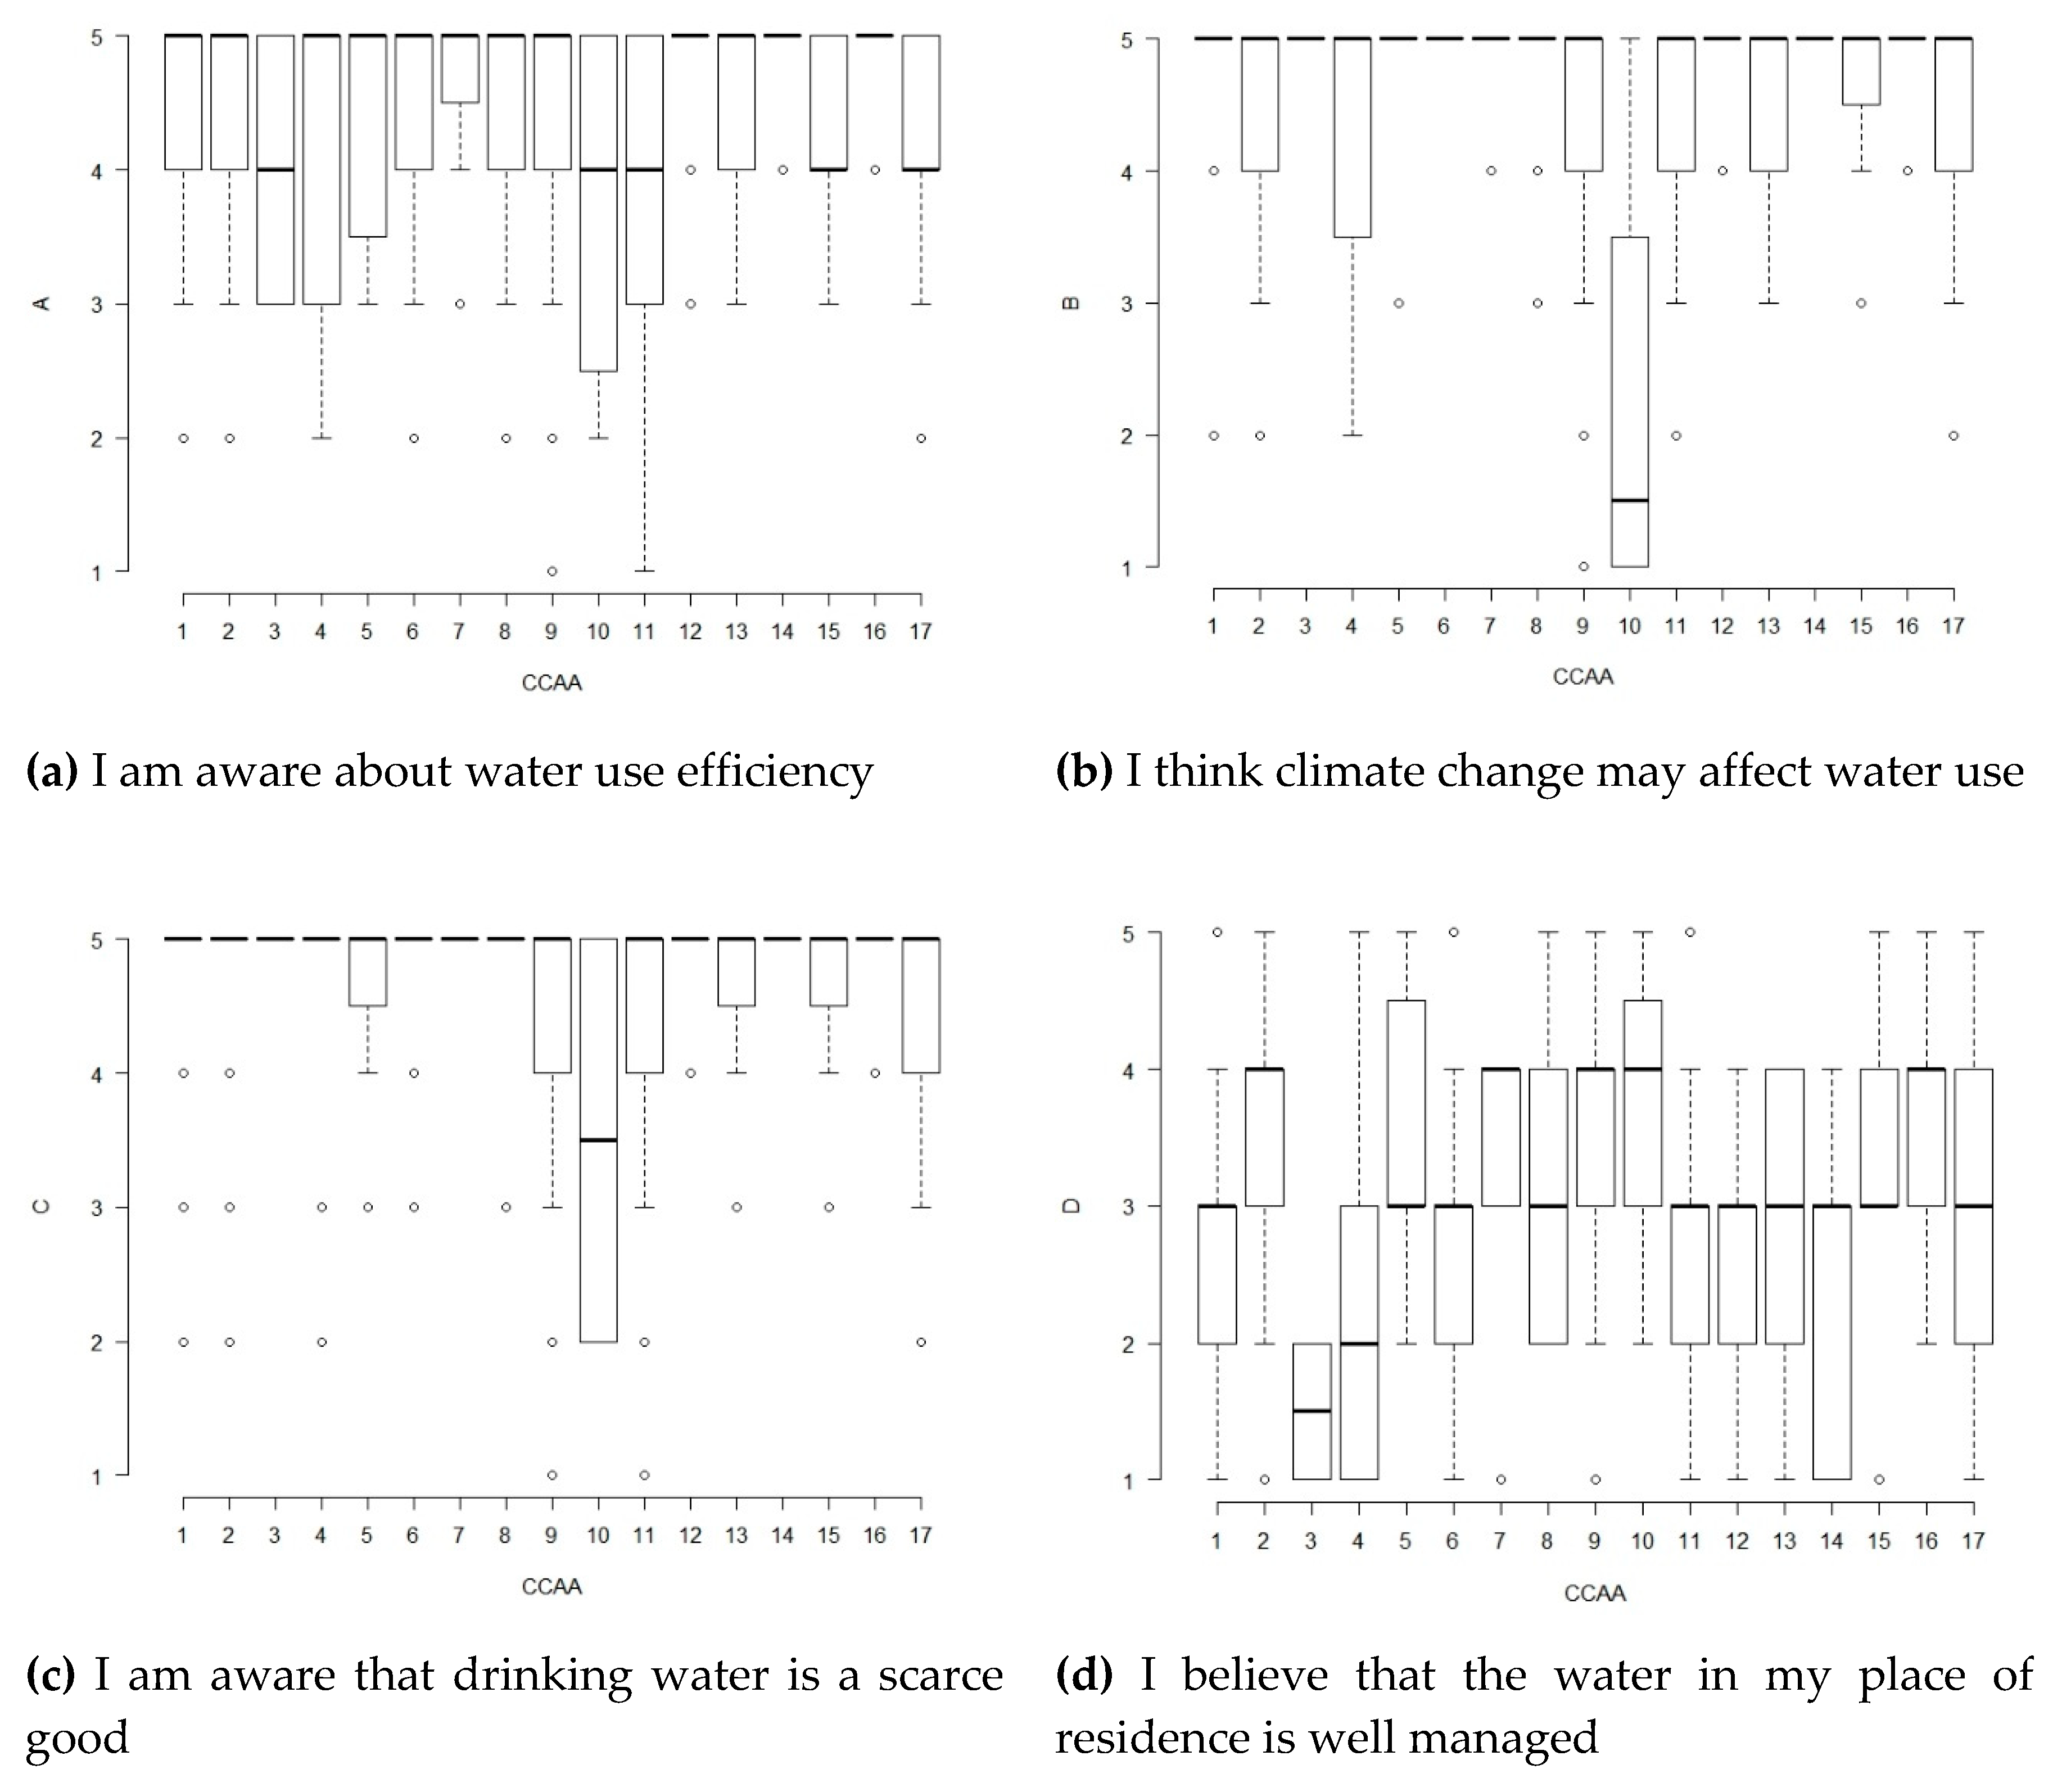
3.1.2. Differences by Autonomous Communities
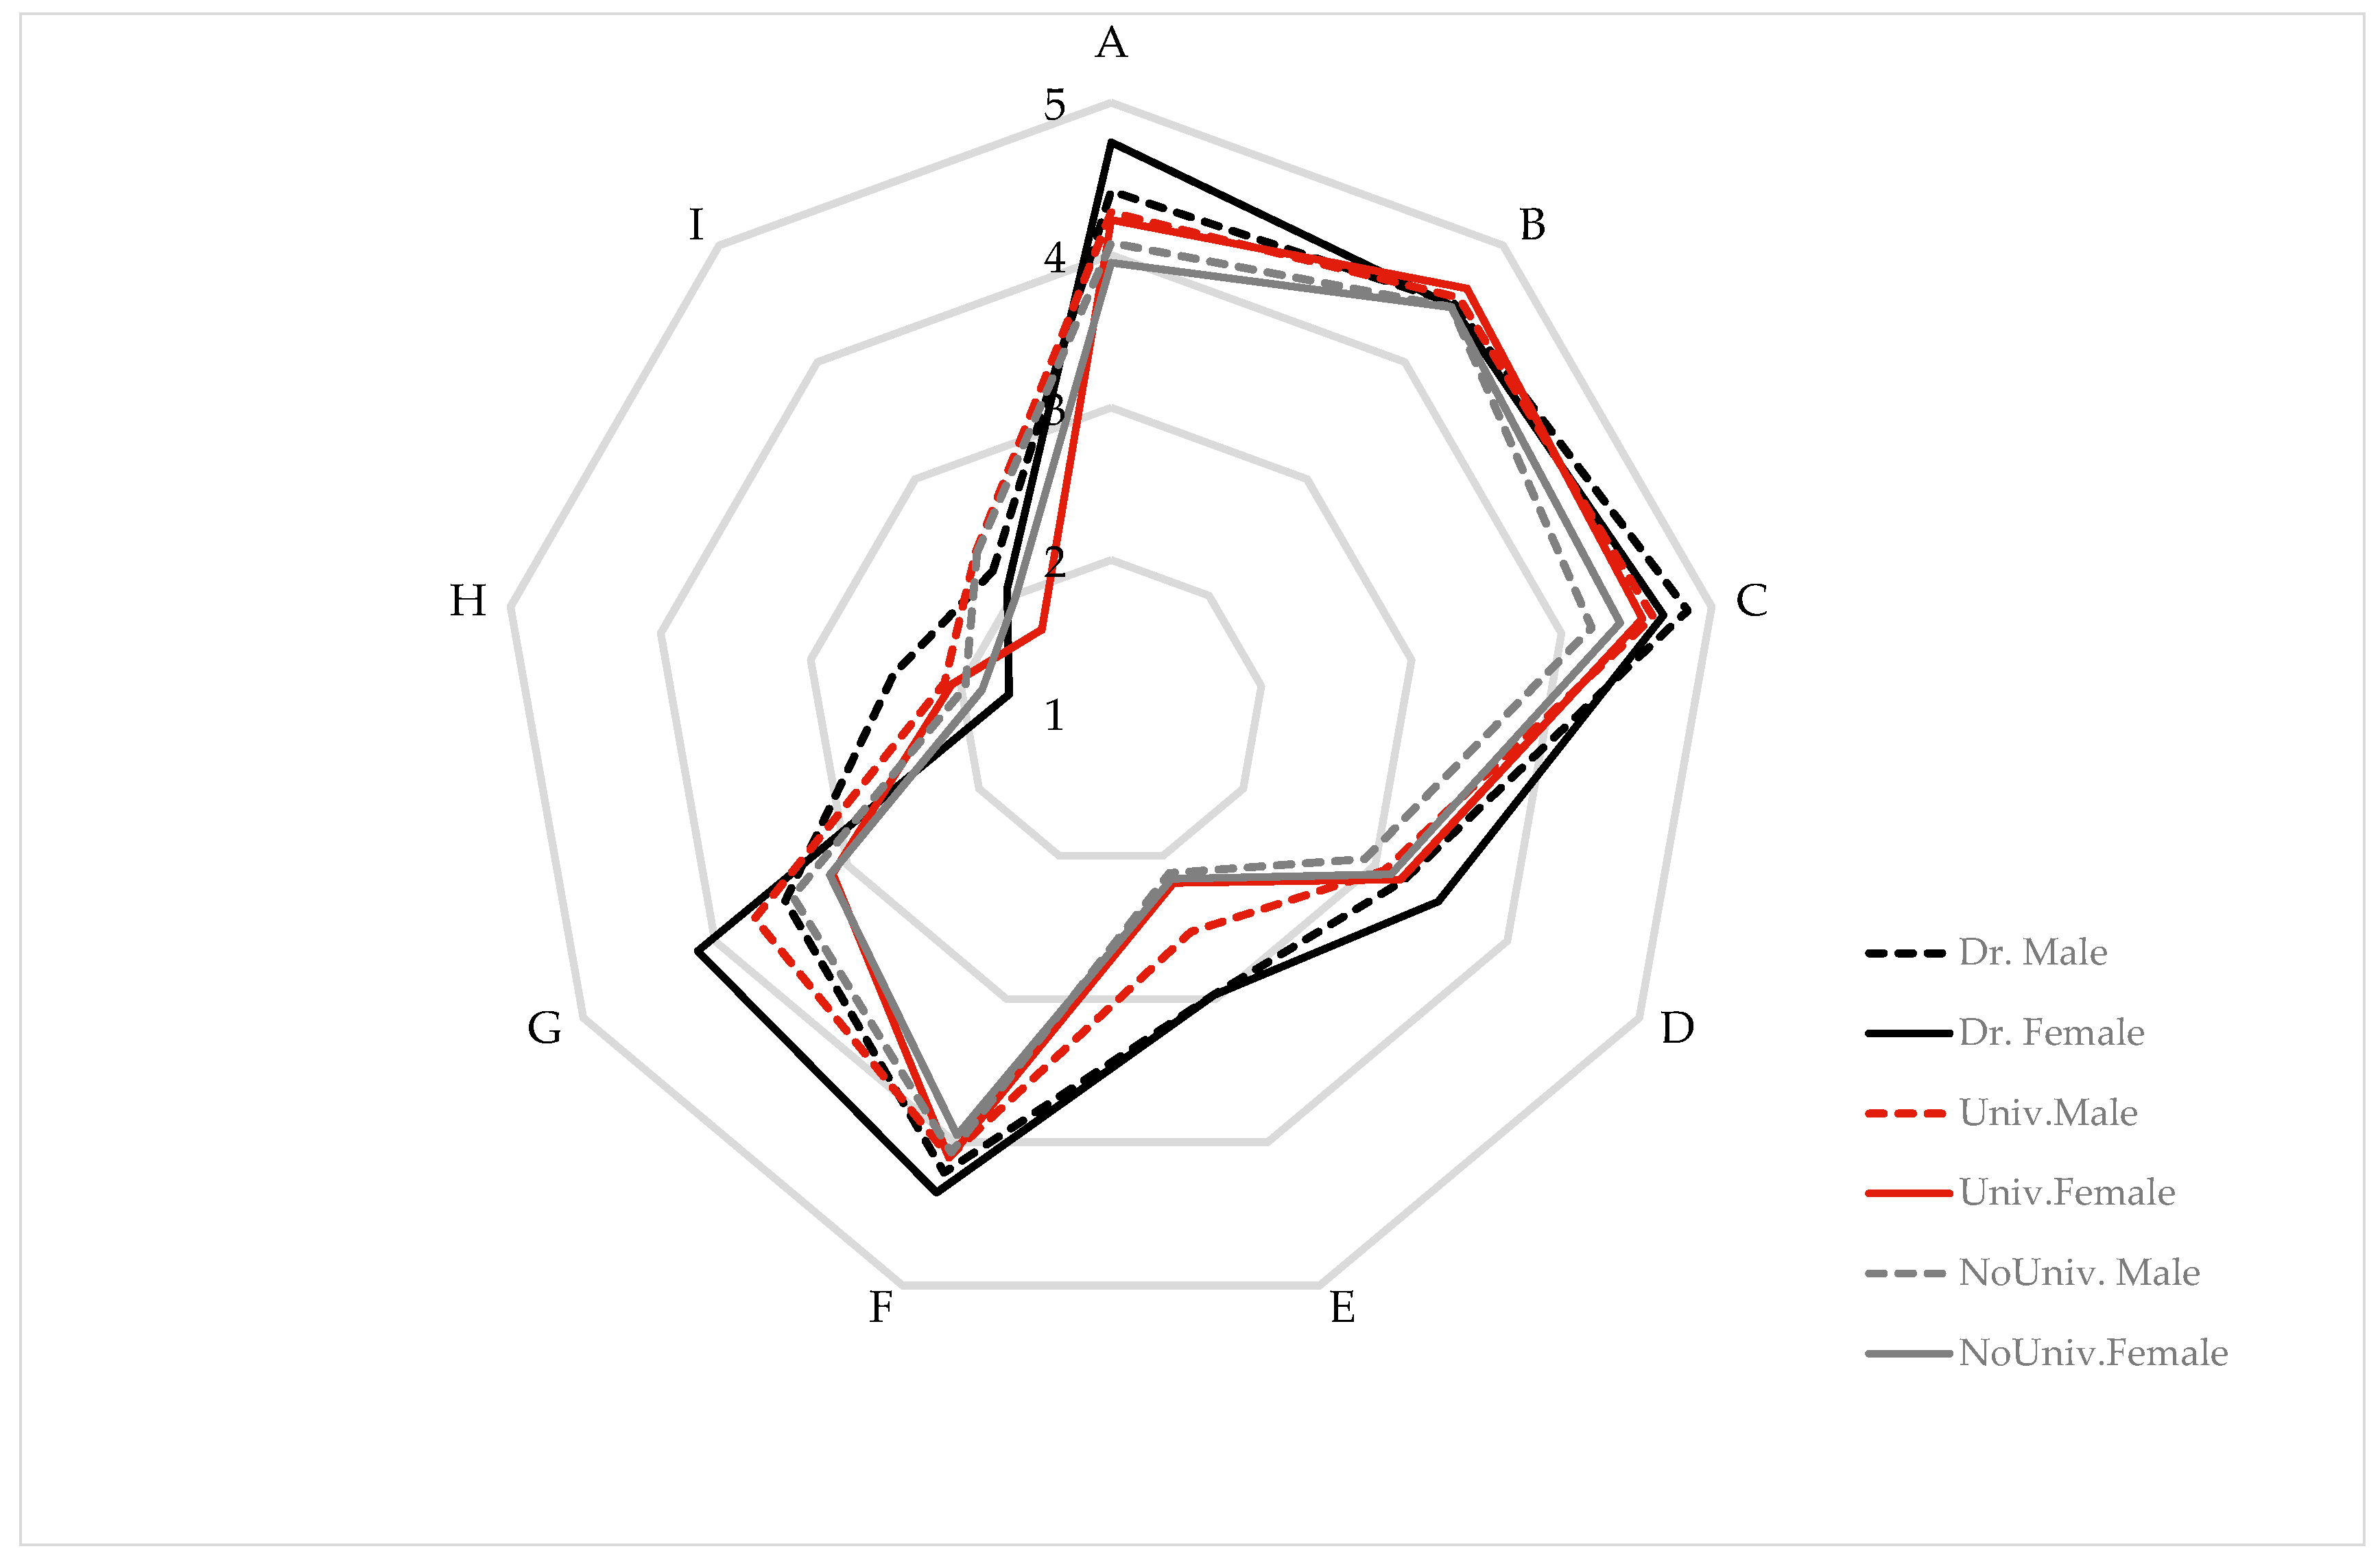
3.1.3. Differences by Level of Education
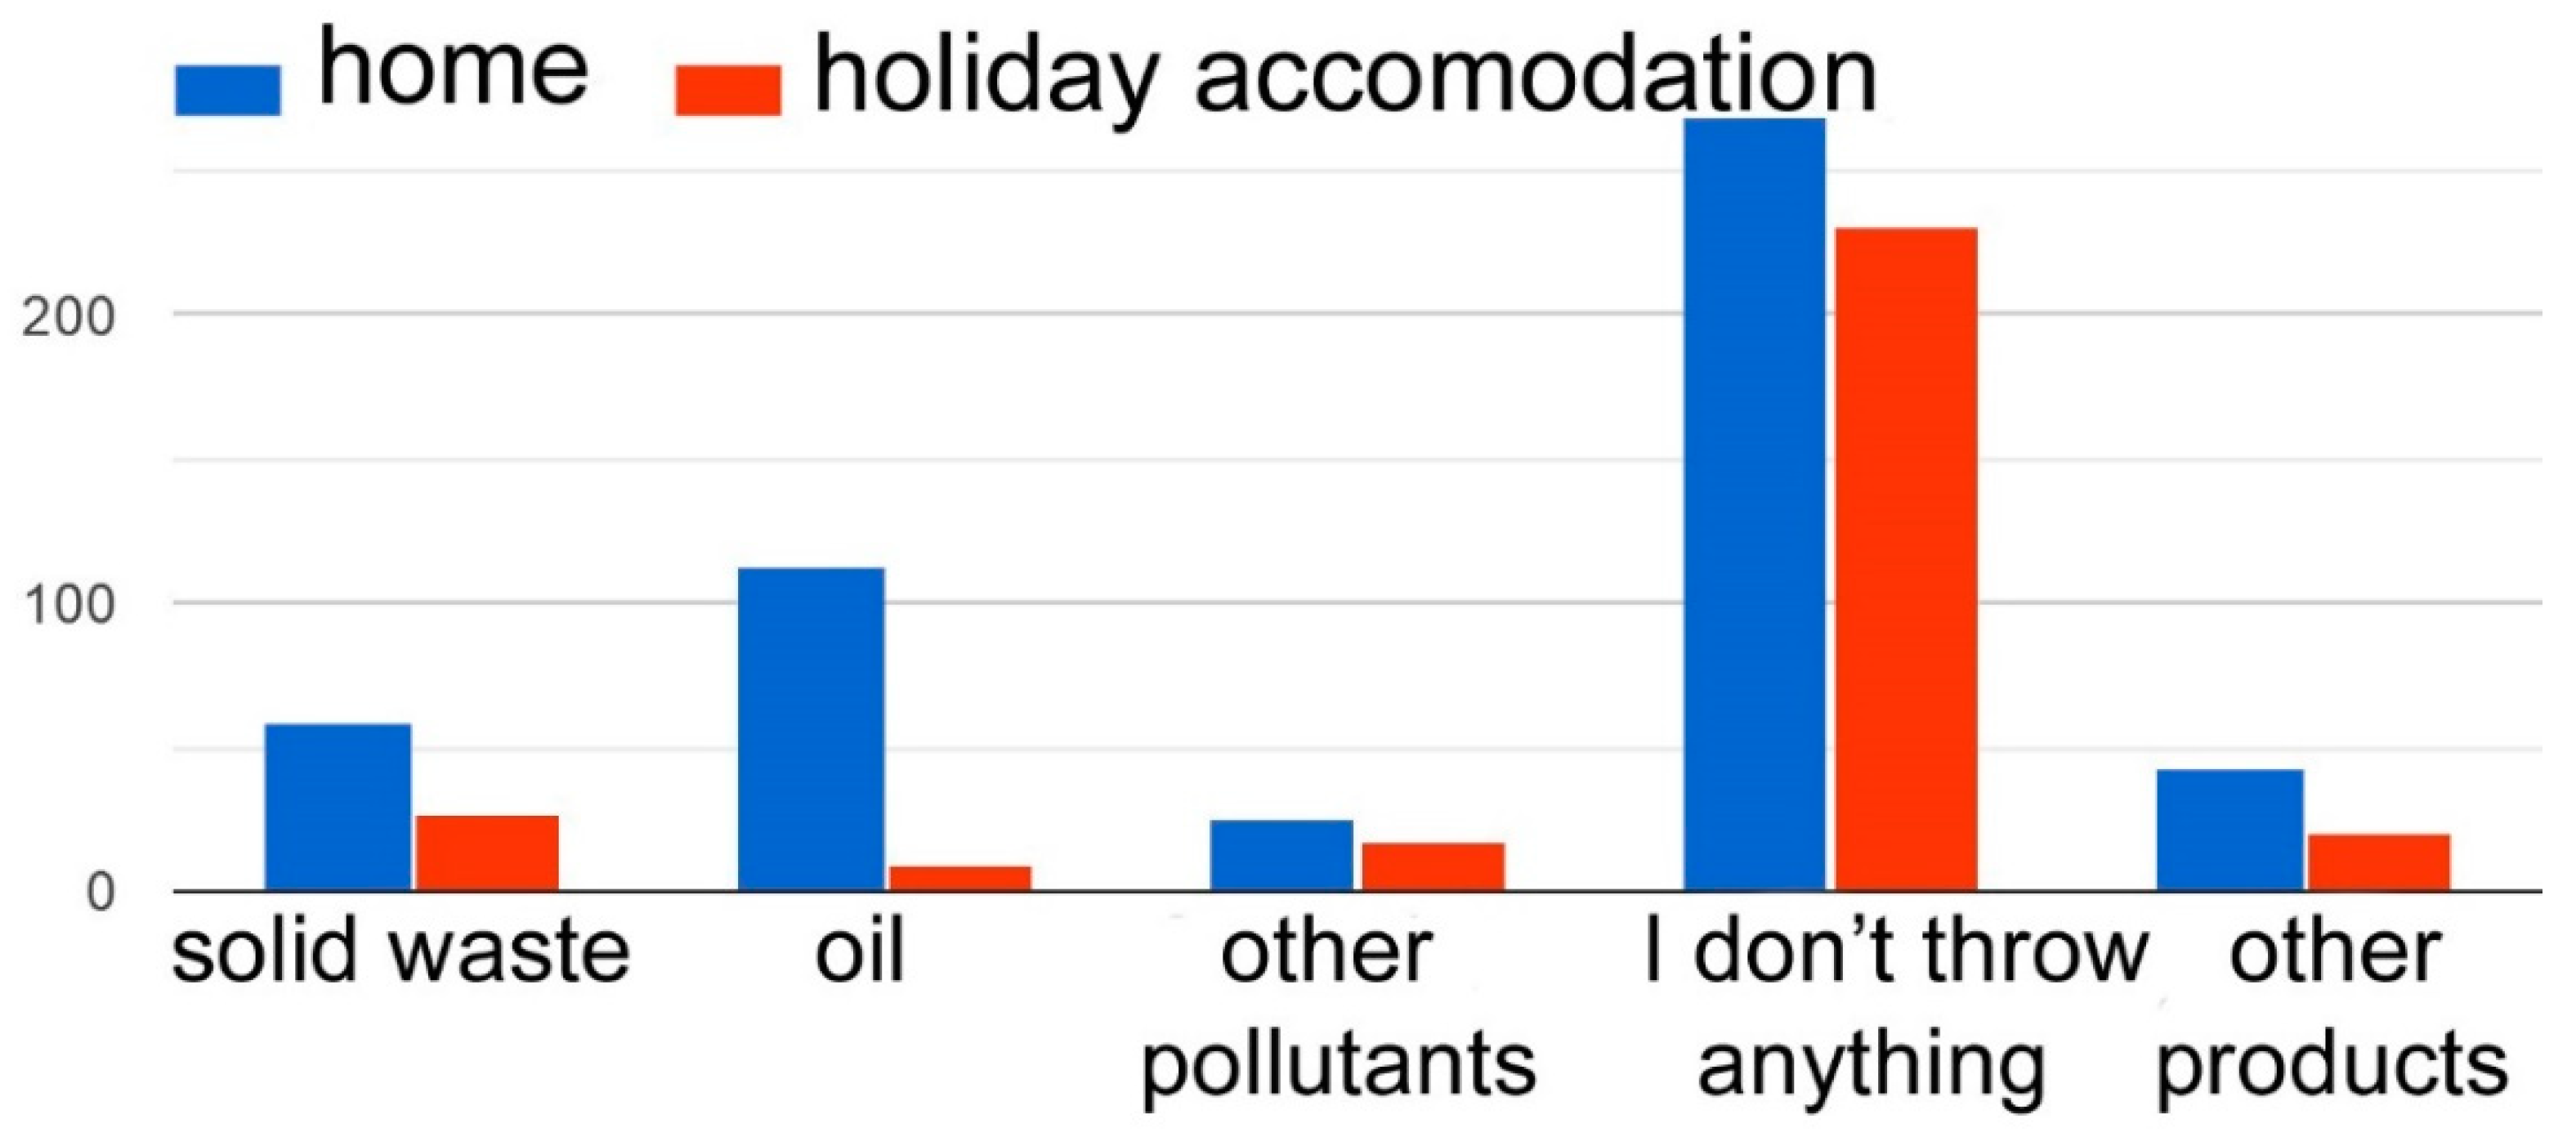
3.2. Some Measures Proposed to Improve Water Efficiency
- Domestic—in the home, the following actions are cited: use less water and do not leave the tap running while brushing your teeth; have a quick shower; place a weight in the tank to reduce the volume of water during filling; be efficient when dishwashing; use short washing machine cycles on eco mode; use tap water rather than bottled water; and reuse water: for example, use dirty shower water for the WC.
- Local advertising campaigns undertaken by town councils of municipalities and/or metropolitan areas: Malaga (EMASA), Barcelona (Moviment per l’Aigua Pública i Democràtica), Valladolid, Saragossa (Water Pollution Tax, ICA), Sustainable Water Management Plan from Mao. Actions: treat and reuse water, study and monitor the efficient use of water.
- Regional: Community of Madrid (Canal de Isabel II, such as the ‘Matilda’ campaign with stickers in the bathrooms of public buildings), Region of Murcia (Sermubeniel SA), calls for tourists’ responsible use of water on touristic locations, such as the Namib government did, the ‘Insular Hydrological Plan of the Canary Islands’, La Palma Renovable, cleaning up of the watersheds by the Government of La Rioja, educational initiatives to raise awareness.
- World institutional initiatives or campaigns run by the United Nations (UN), Food and Agriculture Organization (FAO), GreenPeace, Ecologists in Action, or companies such as iAgua, Estrella Damm (with the song “Another Way of Living”).
- Other awareness campaigns: local, regional and global on TV and other media, schools, posters, on the subway, and public buildings. Monitor consumption and generate recommendations accordingly.
- Monitor more and improve data [34];
- Understand the importance of water for the development of life and human activities;
- Employ evidence (using maps, graphs, and research) about water problems both in the near environment and in a global context;
- Promote small solidarity initiatives in relation to water and the use of smart technologies;
- Trigger a change in attitudes.
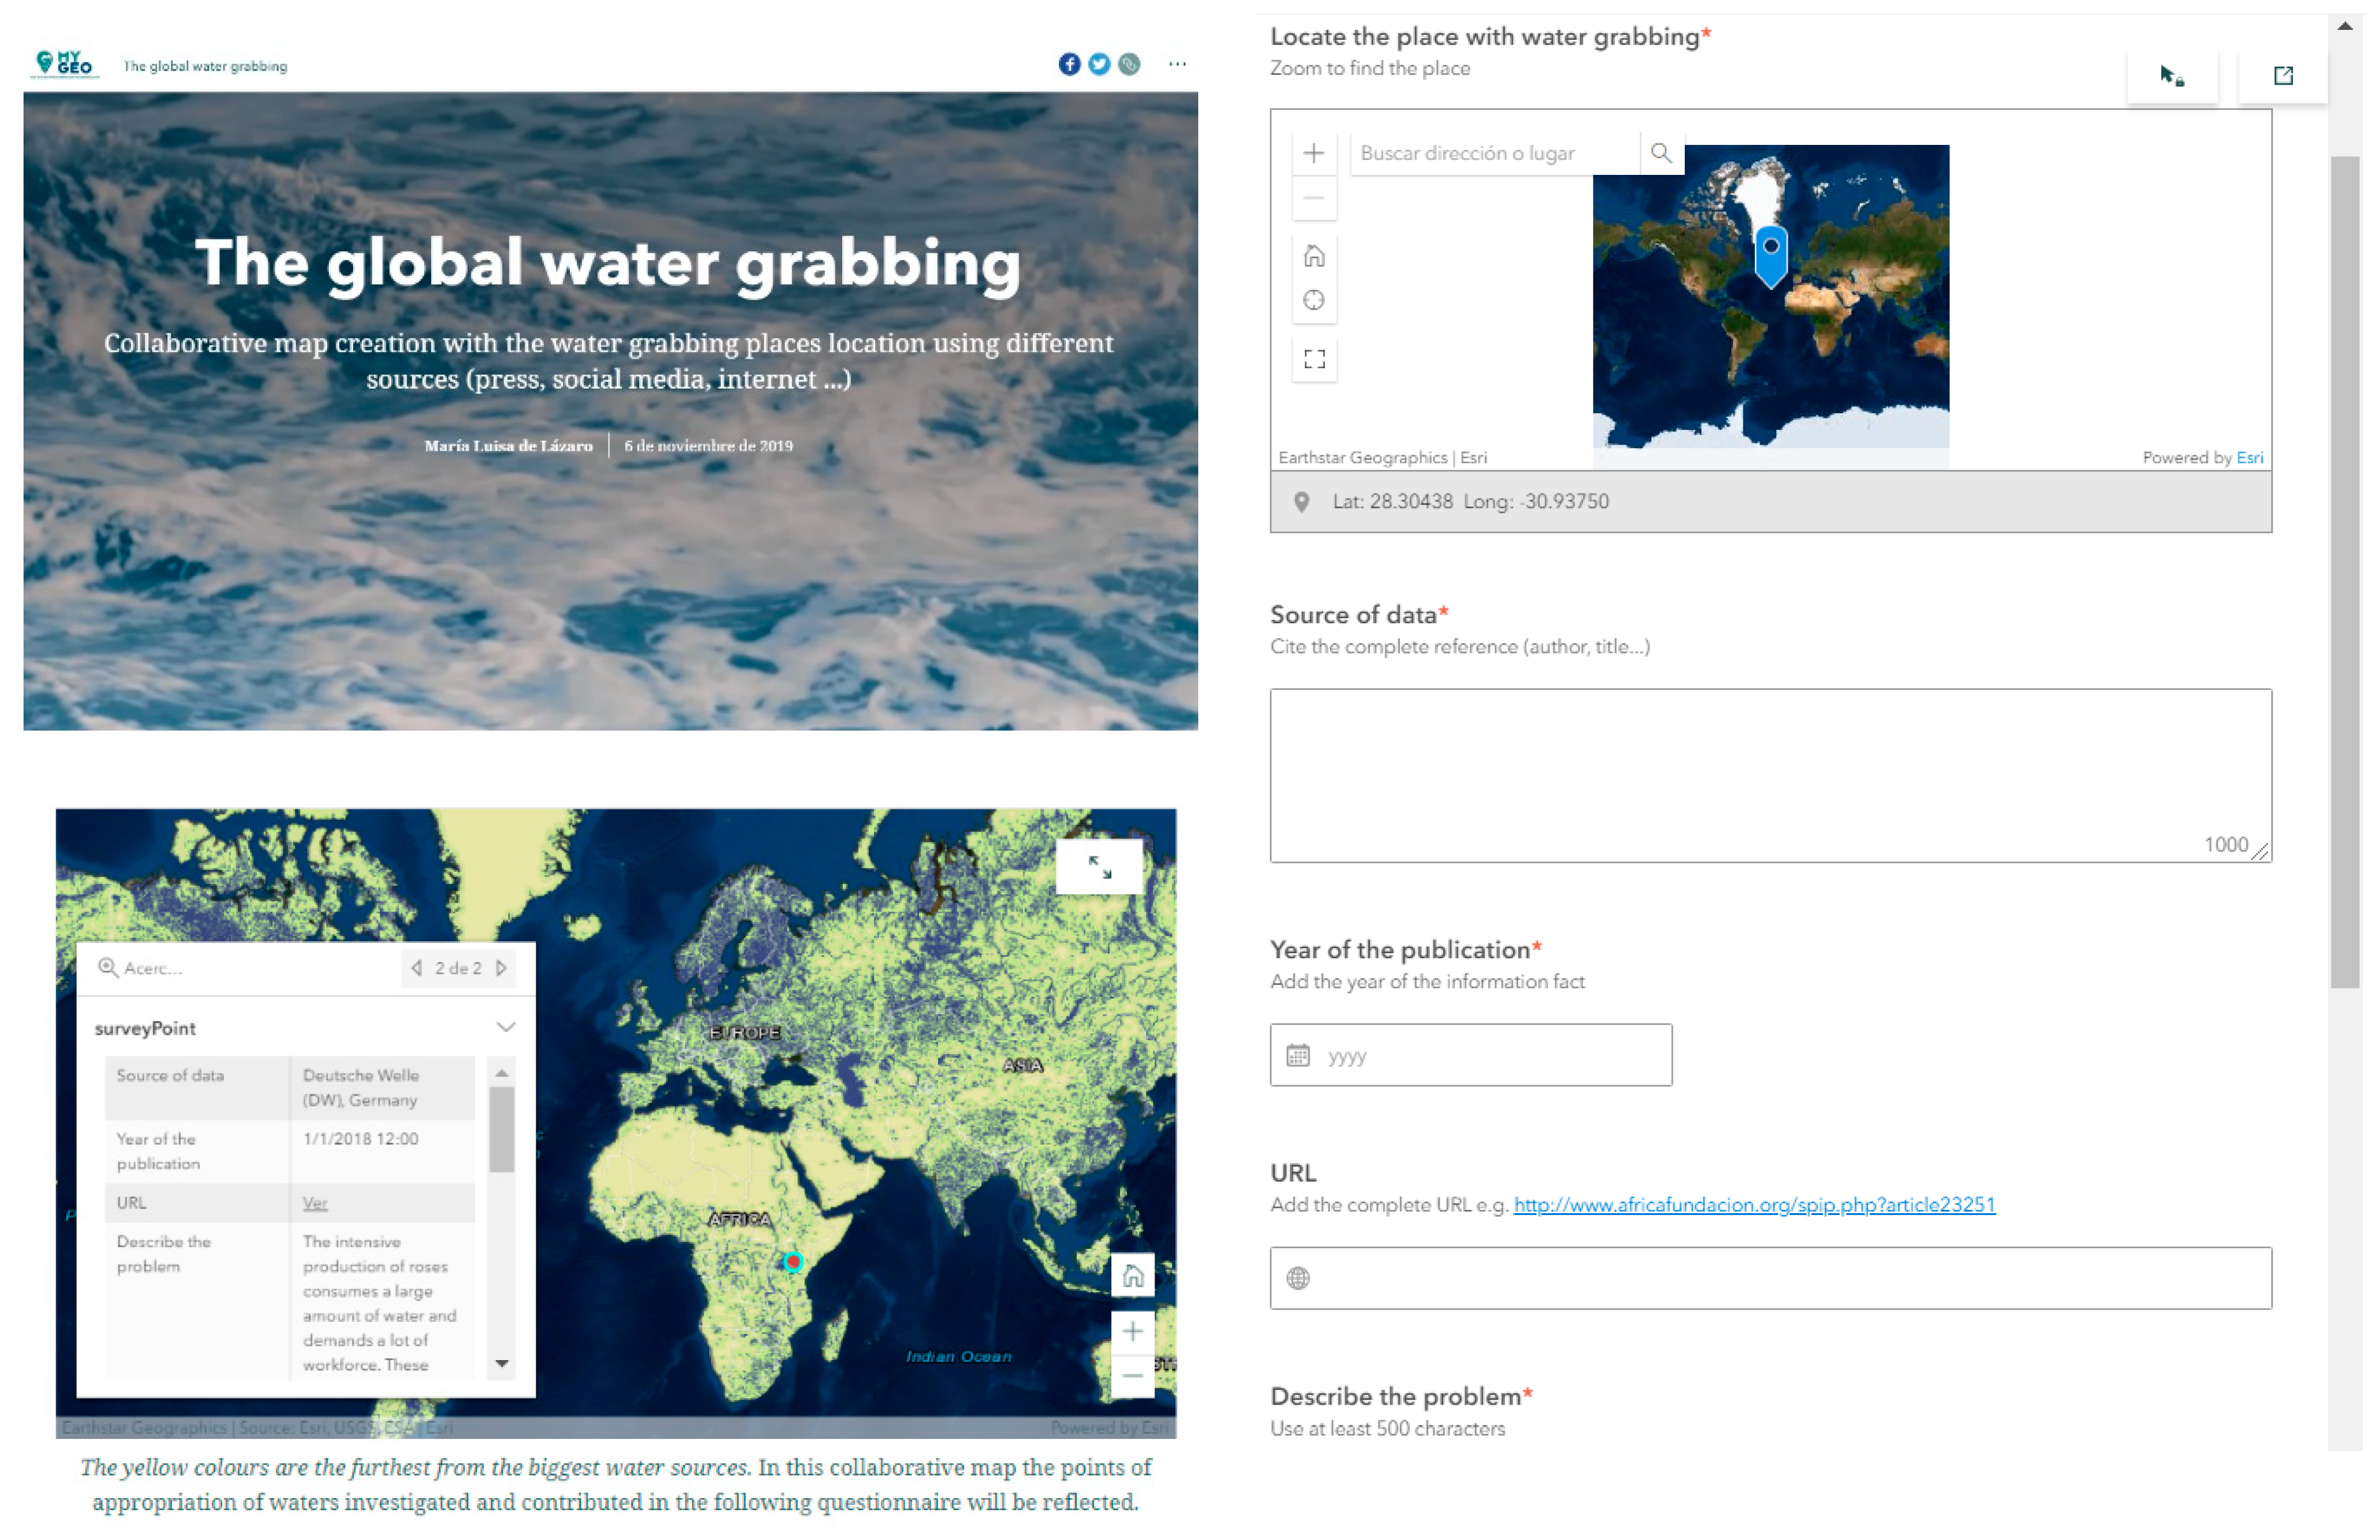
3.3. A Fun Educational Resource: Story Map on Global Water Grabbing or Water Appropiation
4. Discussion
5. Conclusions
Author Contributions
Funding
Acknowledgments
Conflicts of Interest
Appendix A
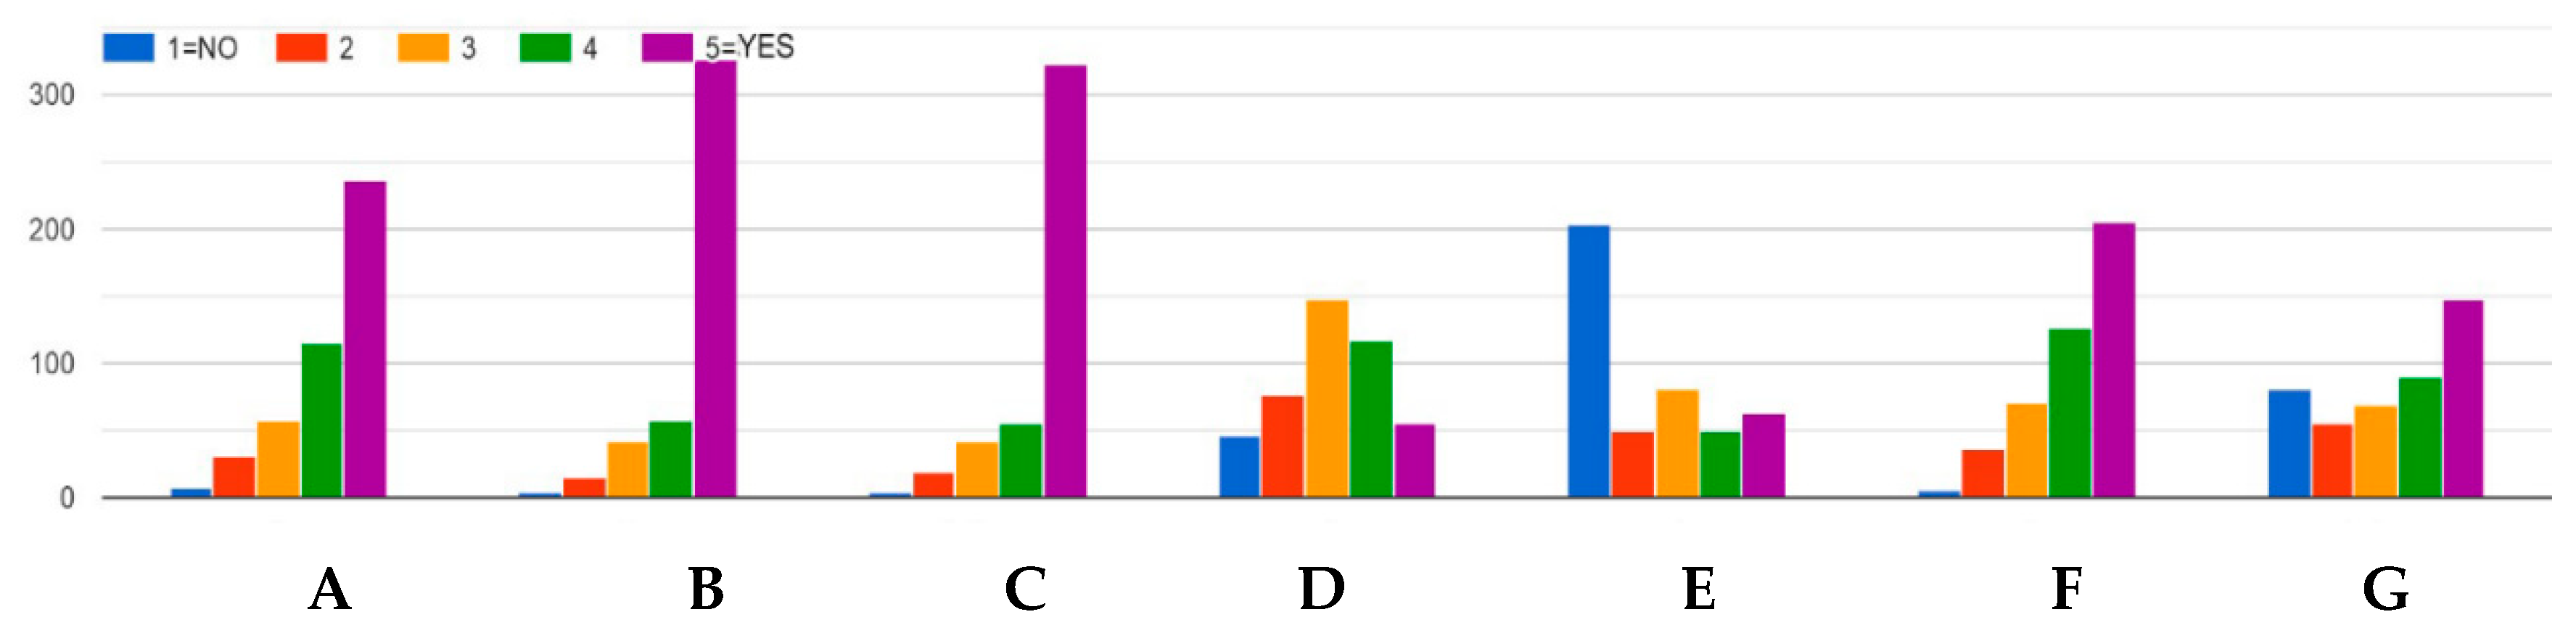
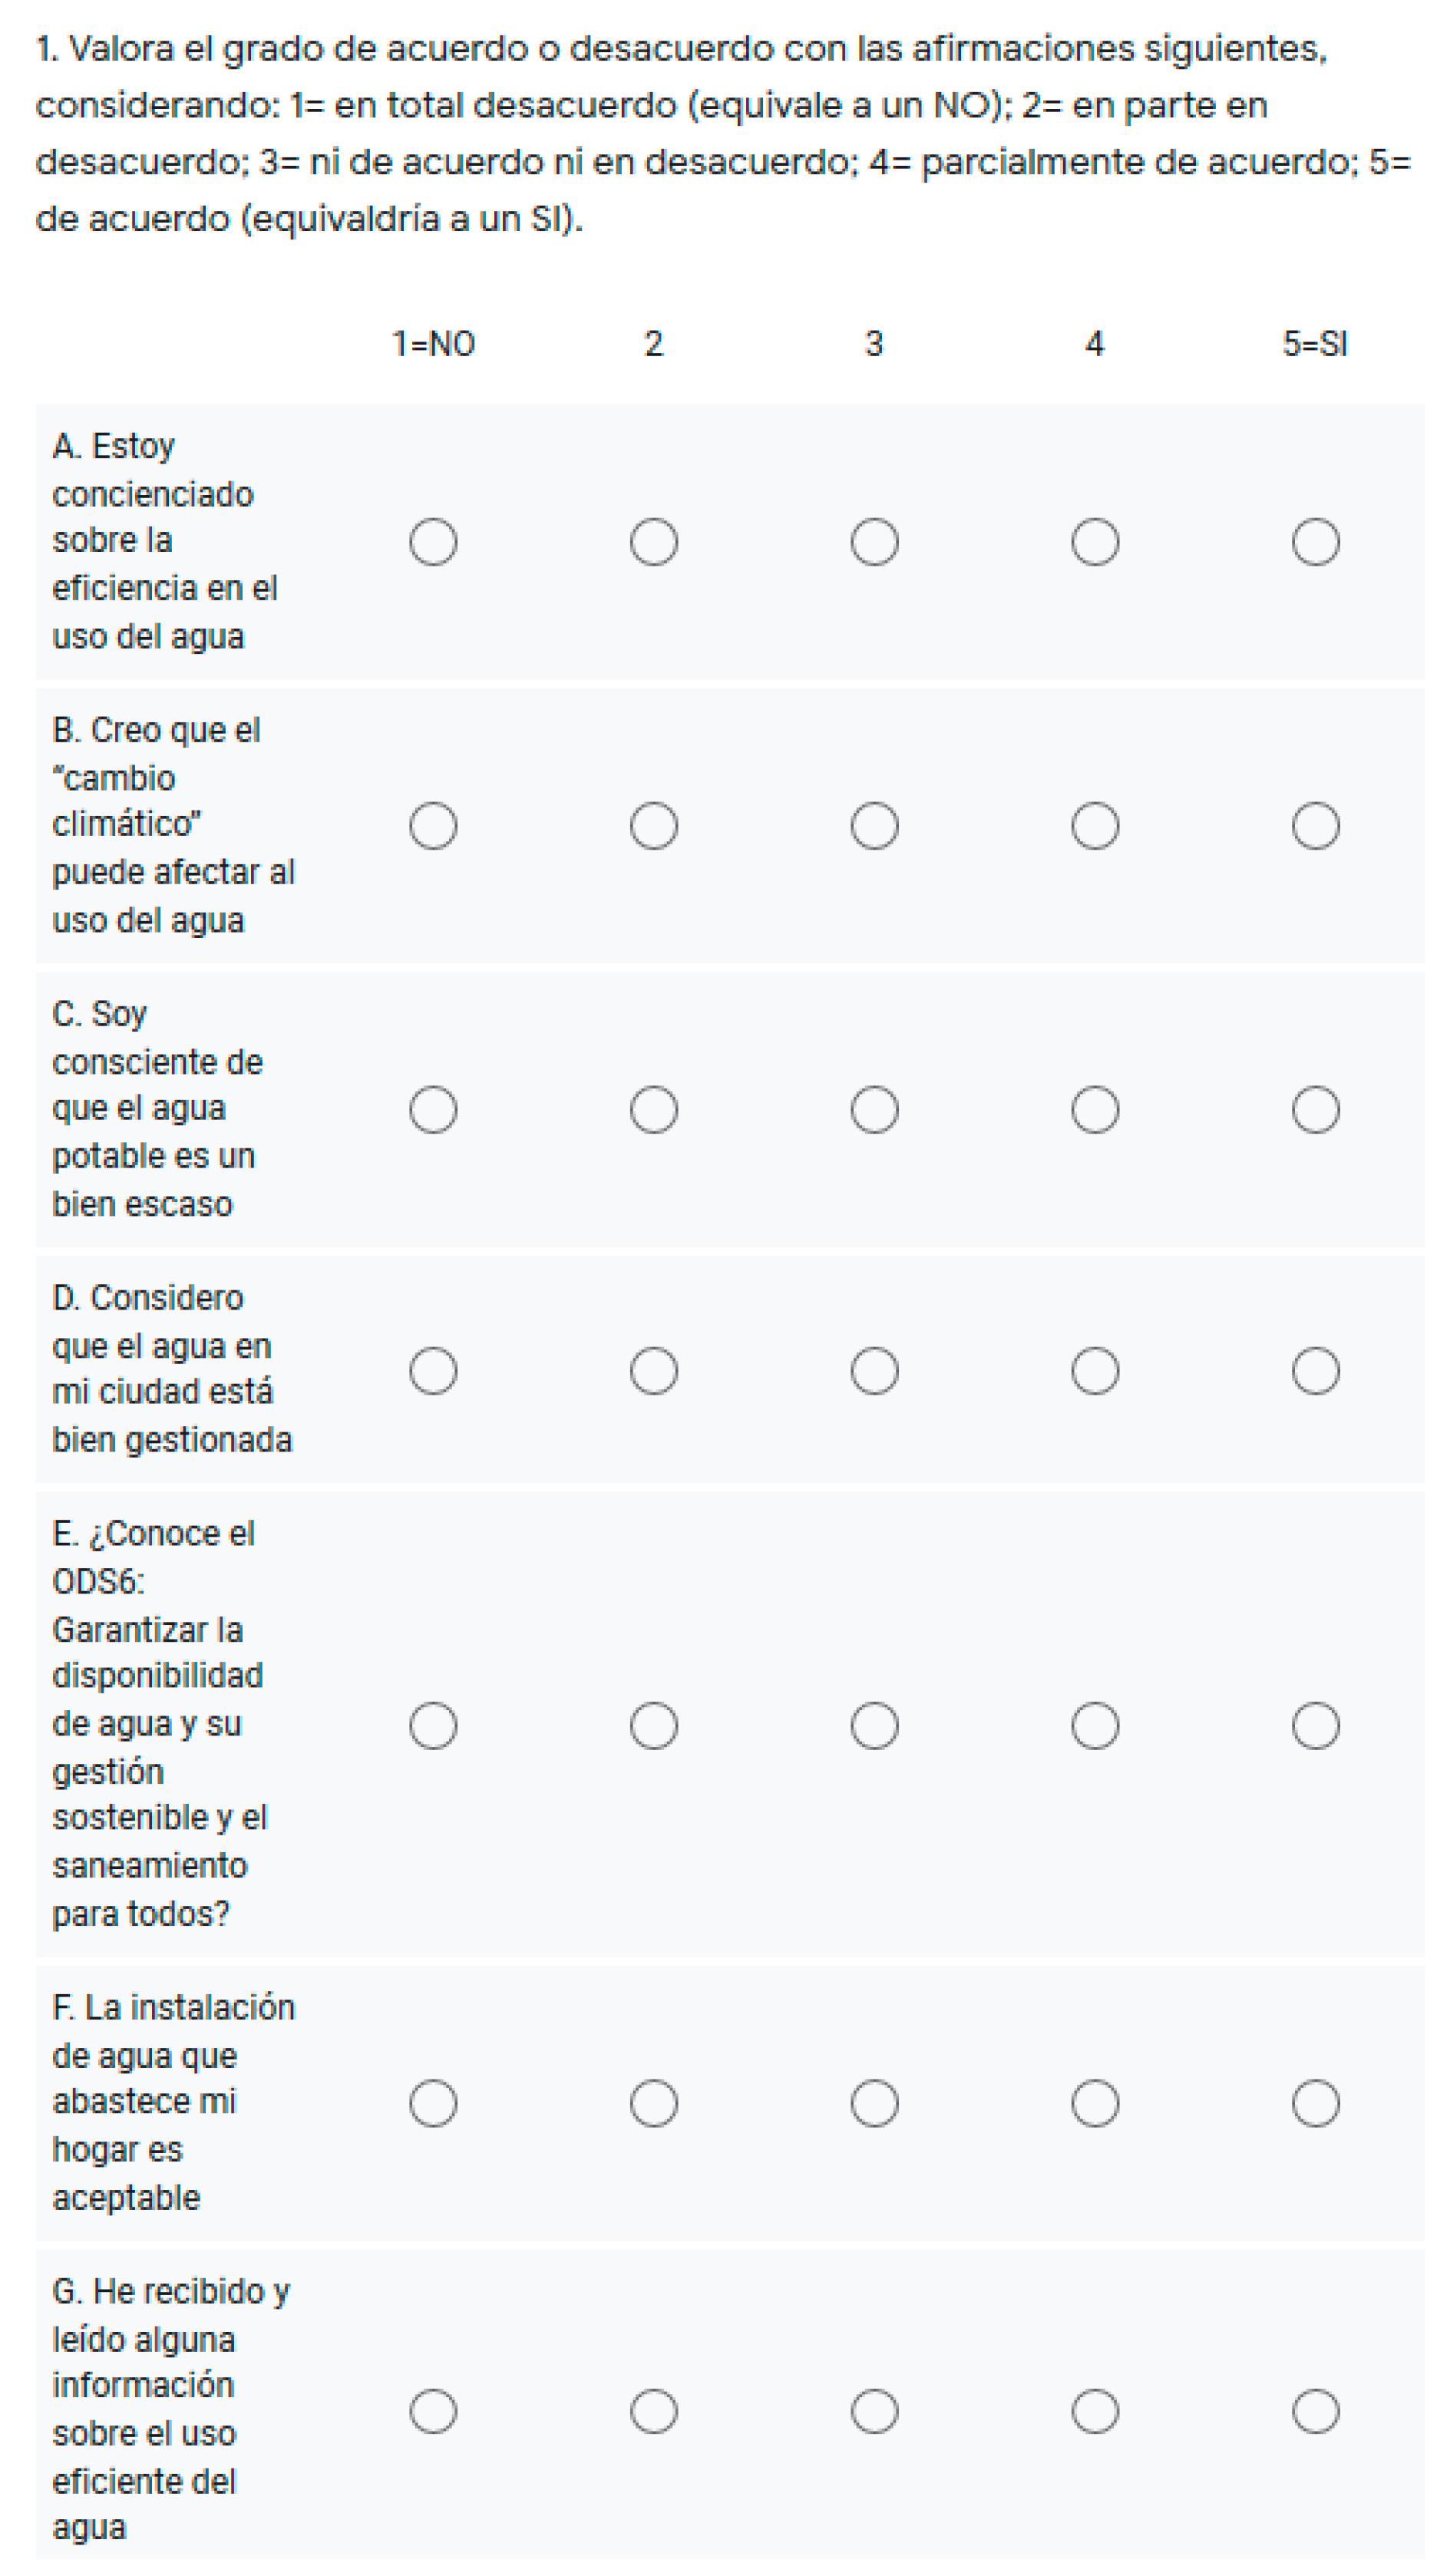
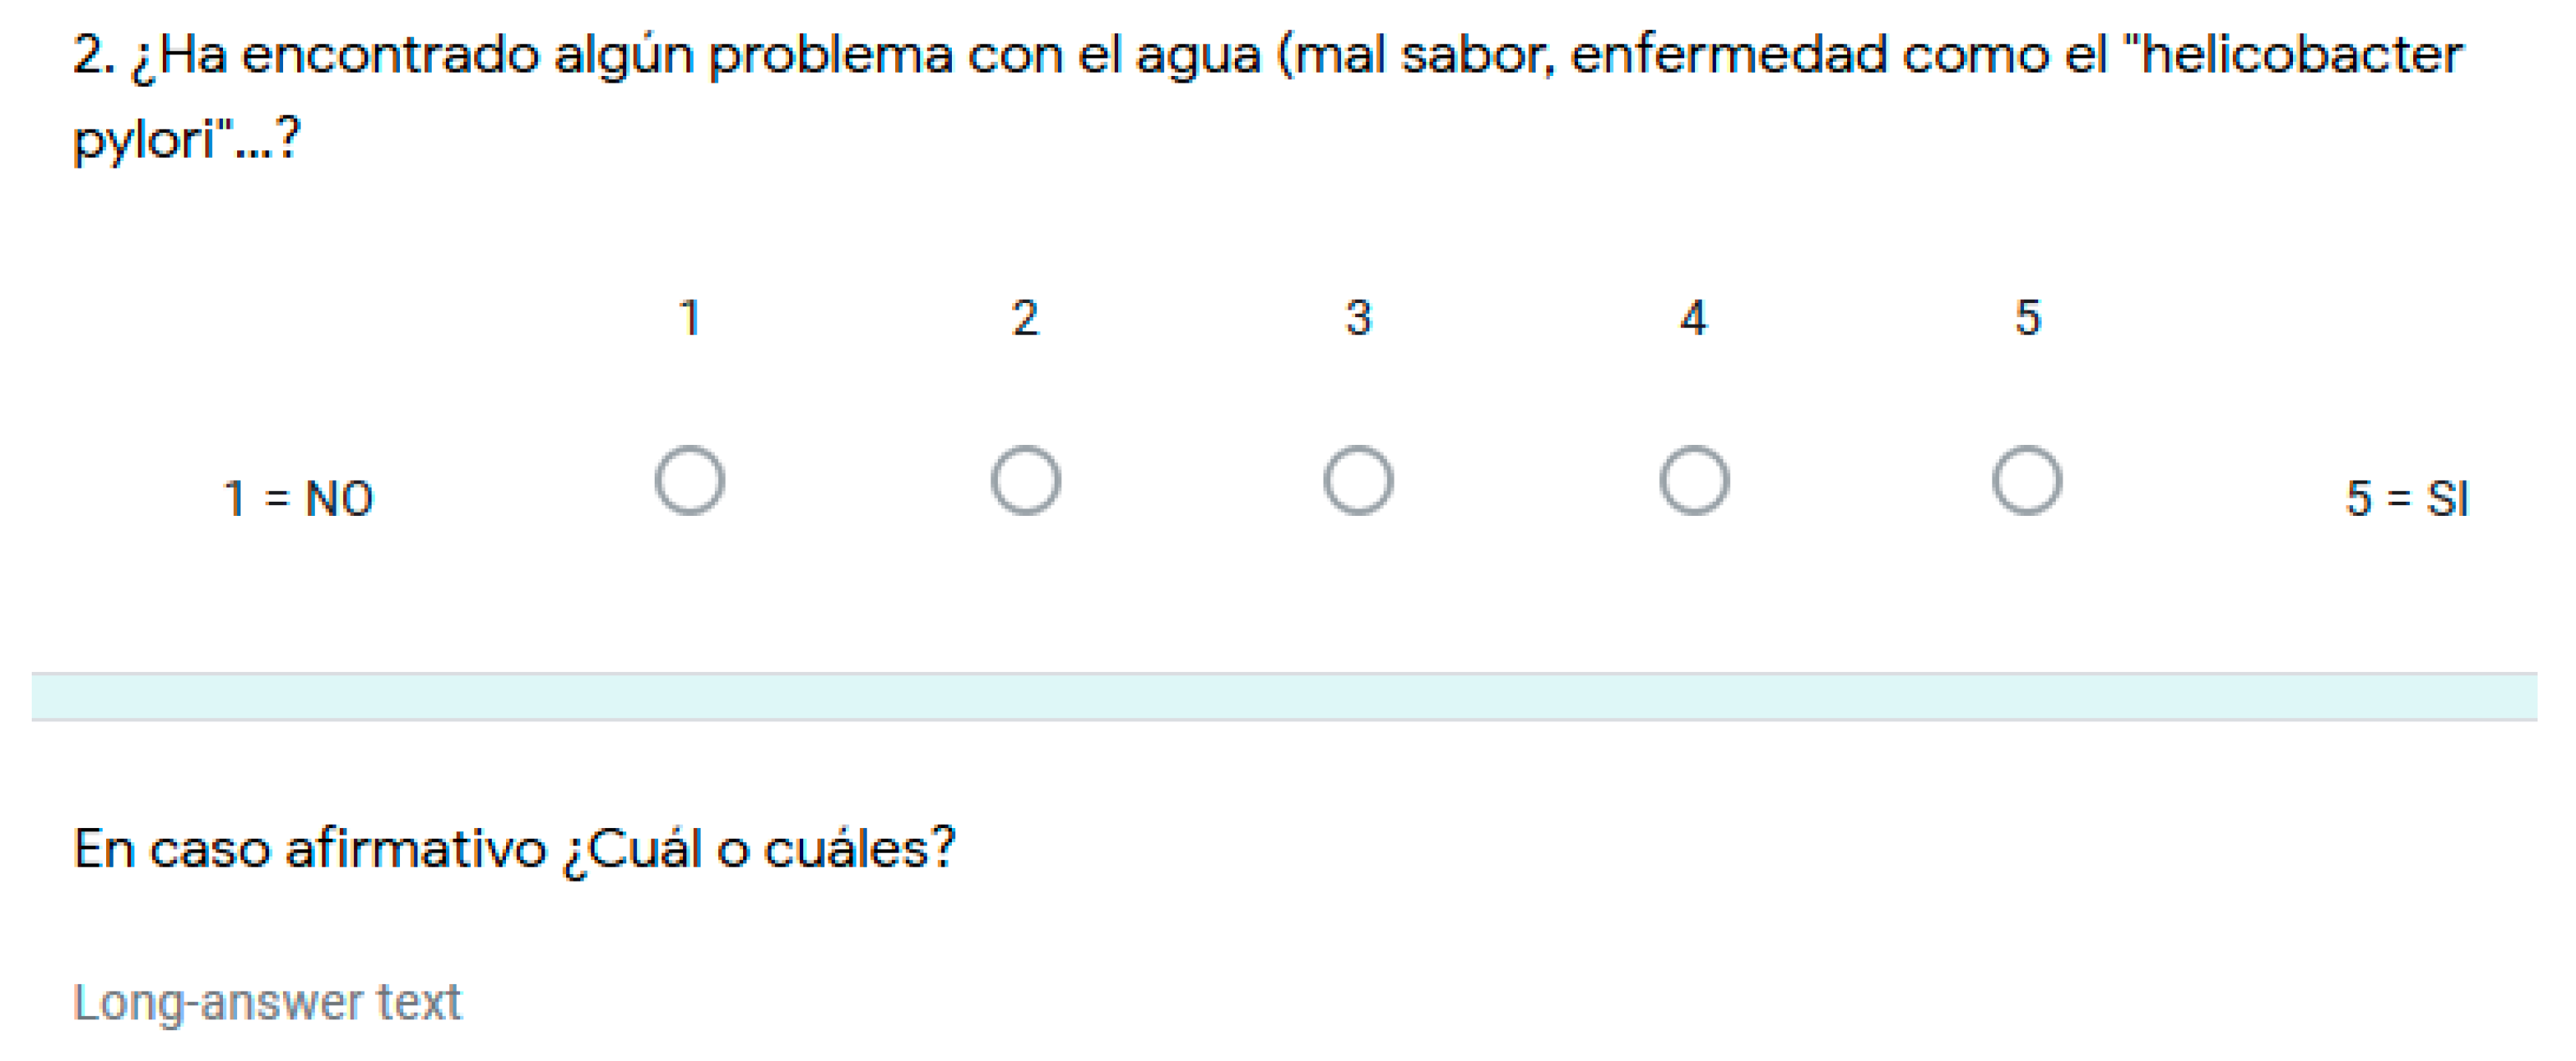
- Choose if you agree or disagree about these items on a scale of 1-5: 1= No, I completely disagree; 2 = I partly disagree; 3 = I am not sure; 4= I partly agree; 5= Yes, I fully agree
- A.
- I am aware about water use efficiency;
- B.
- I think climate change may affect water use;
- C.
- I am aware that drinking water is a scarce good;
- D.
- I believe that the water in my place of residence is well managed;
- E.
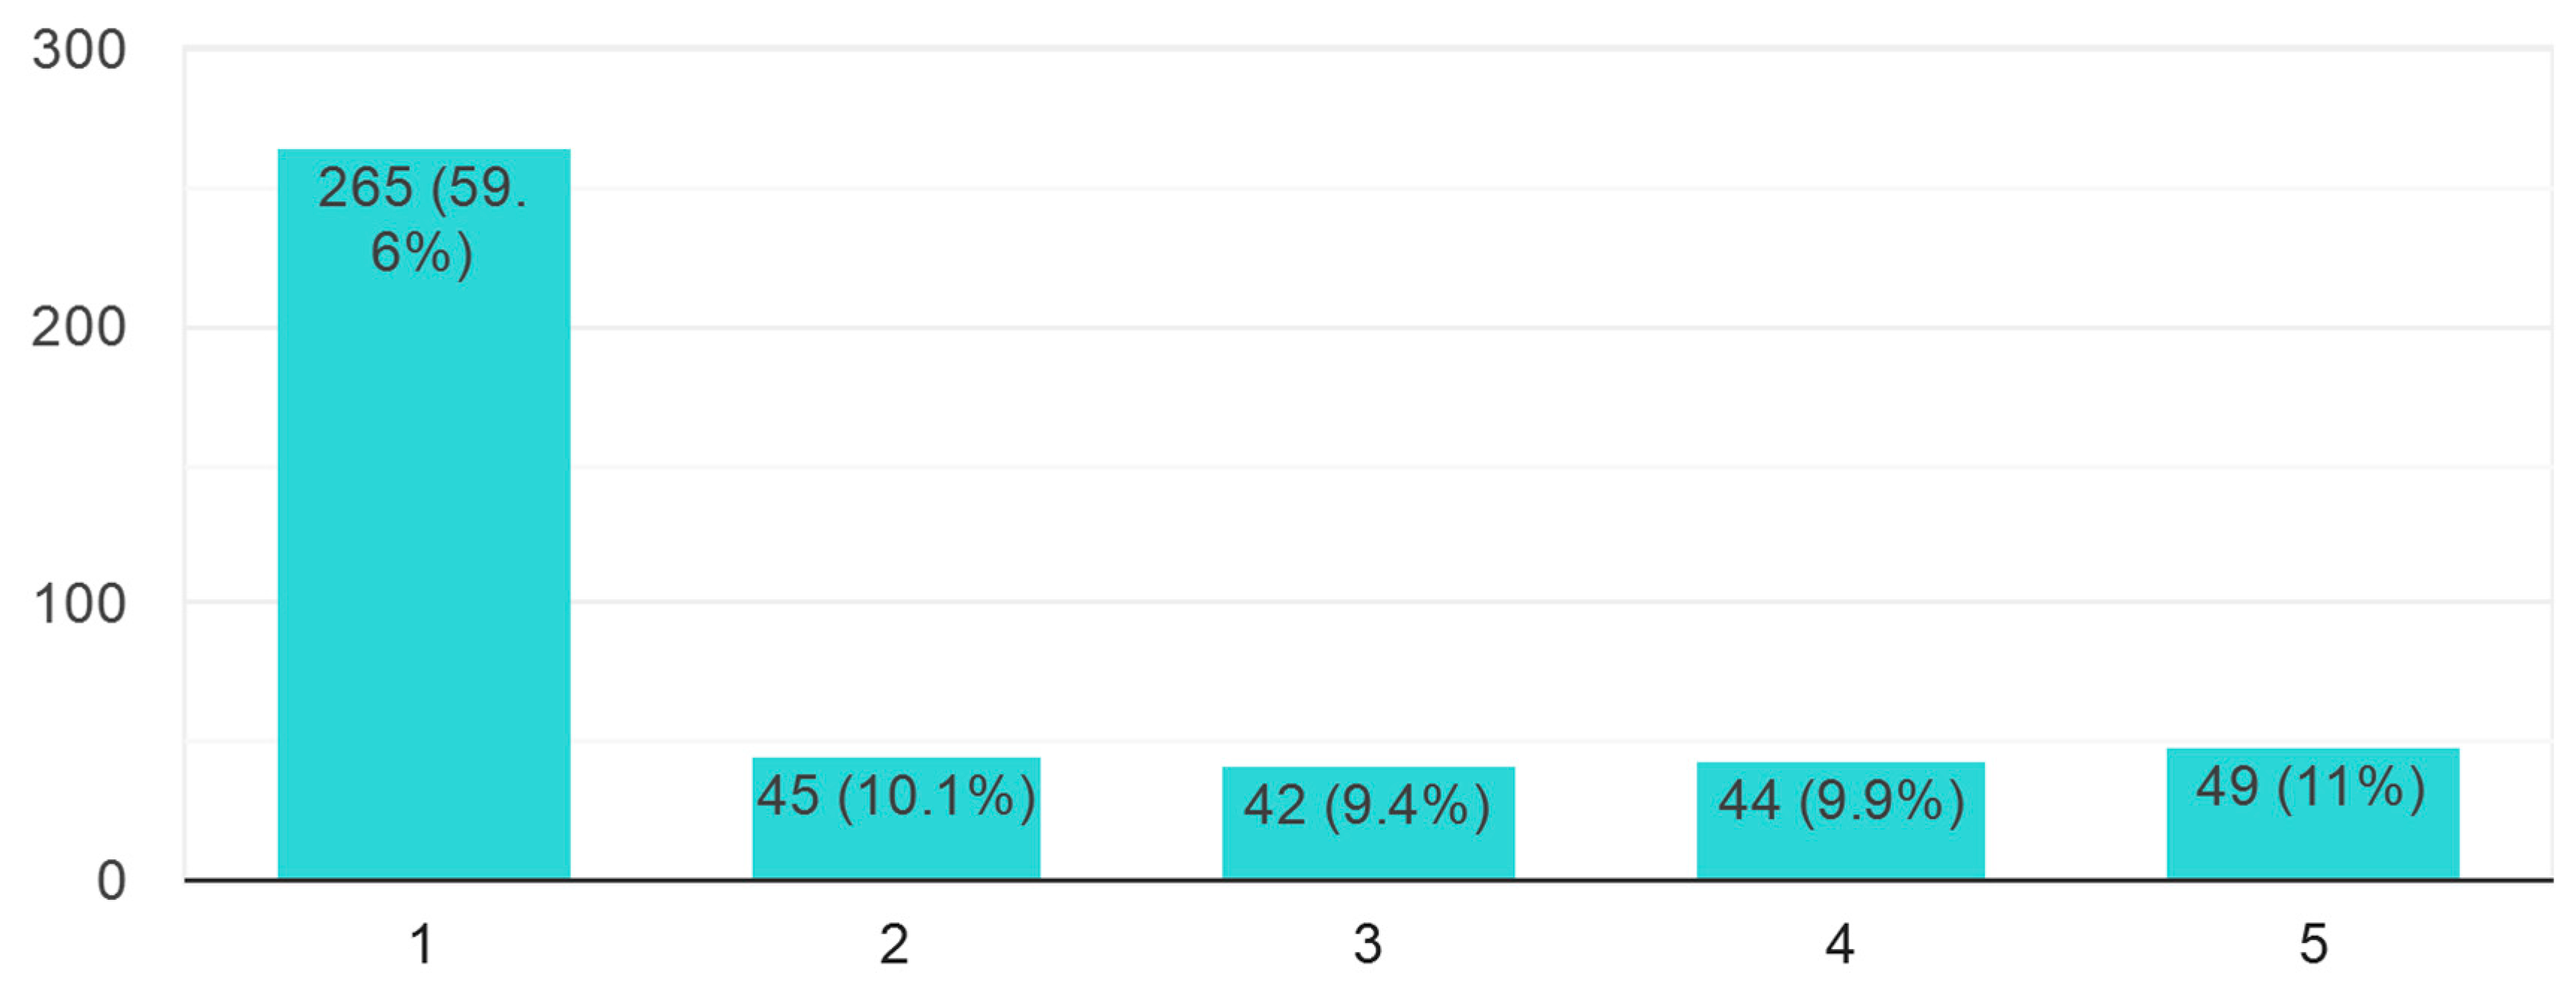
- I am aware of SDG 6: “ensure availability and sustainable management of water and sanitation for all”;
- F.
- The water facility that supplies my home is acceptable;
- G.
- I have received and read information about efficient water use.
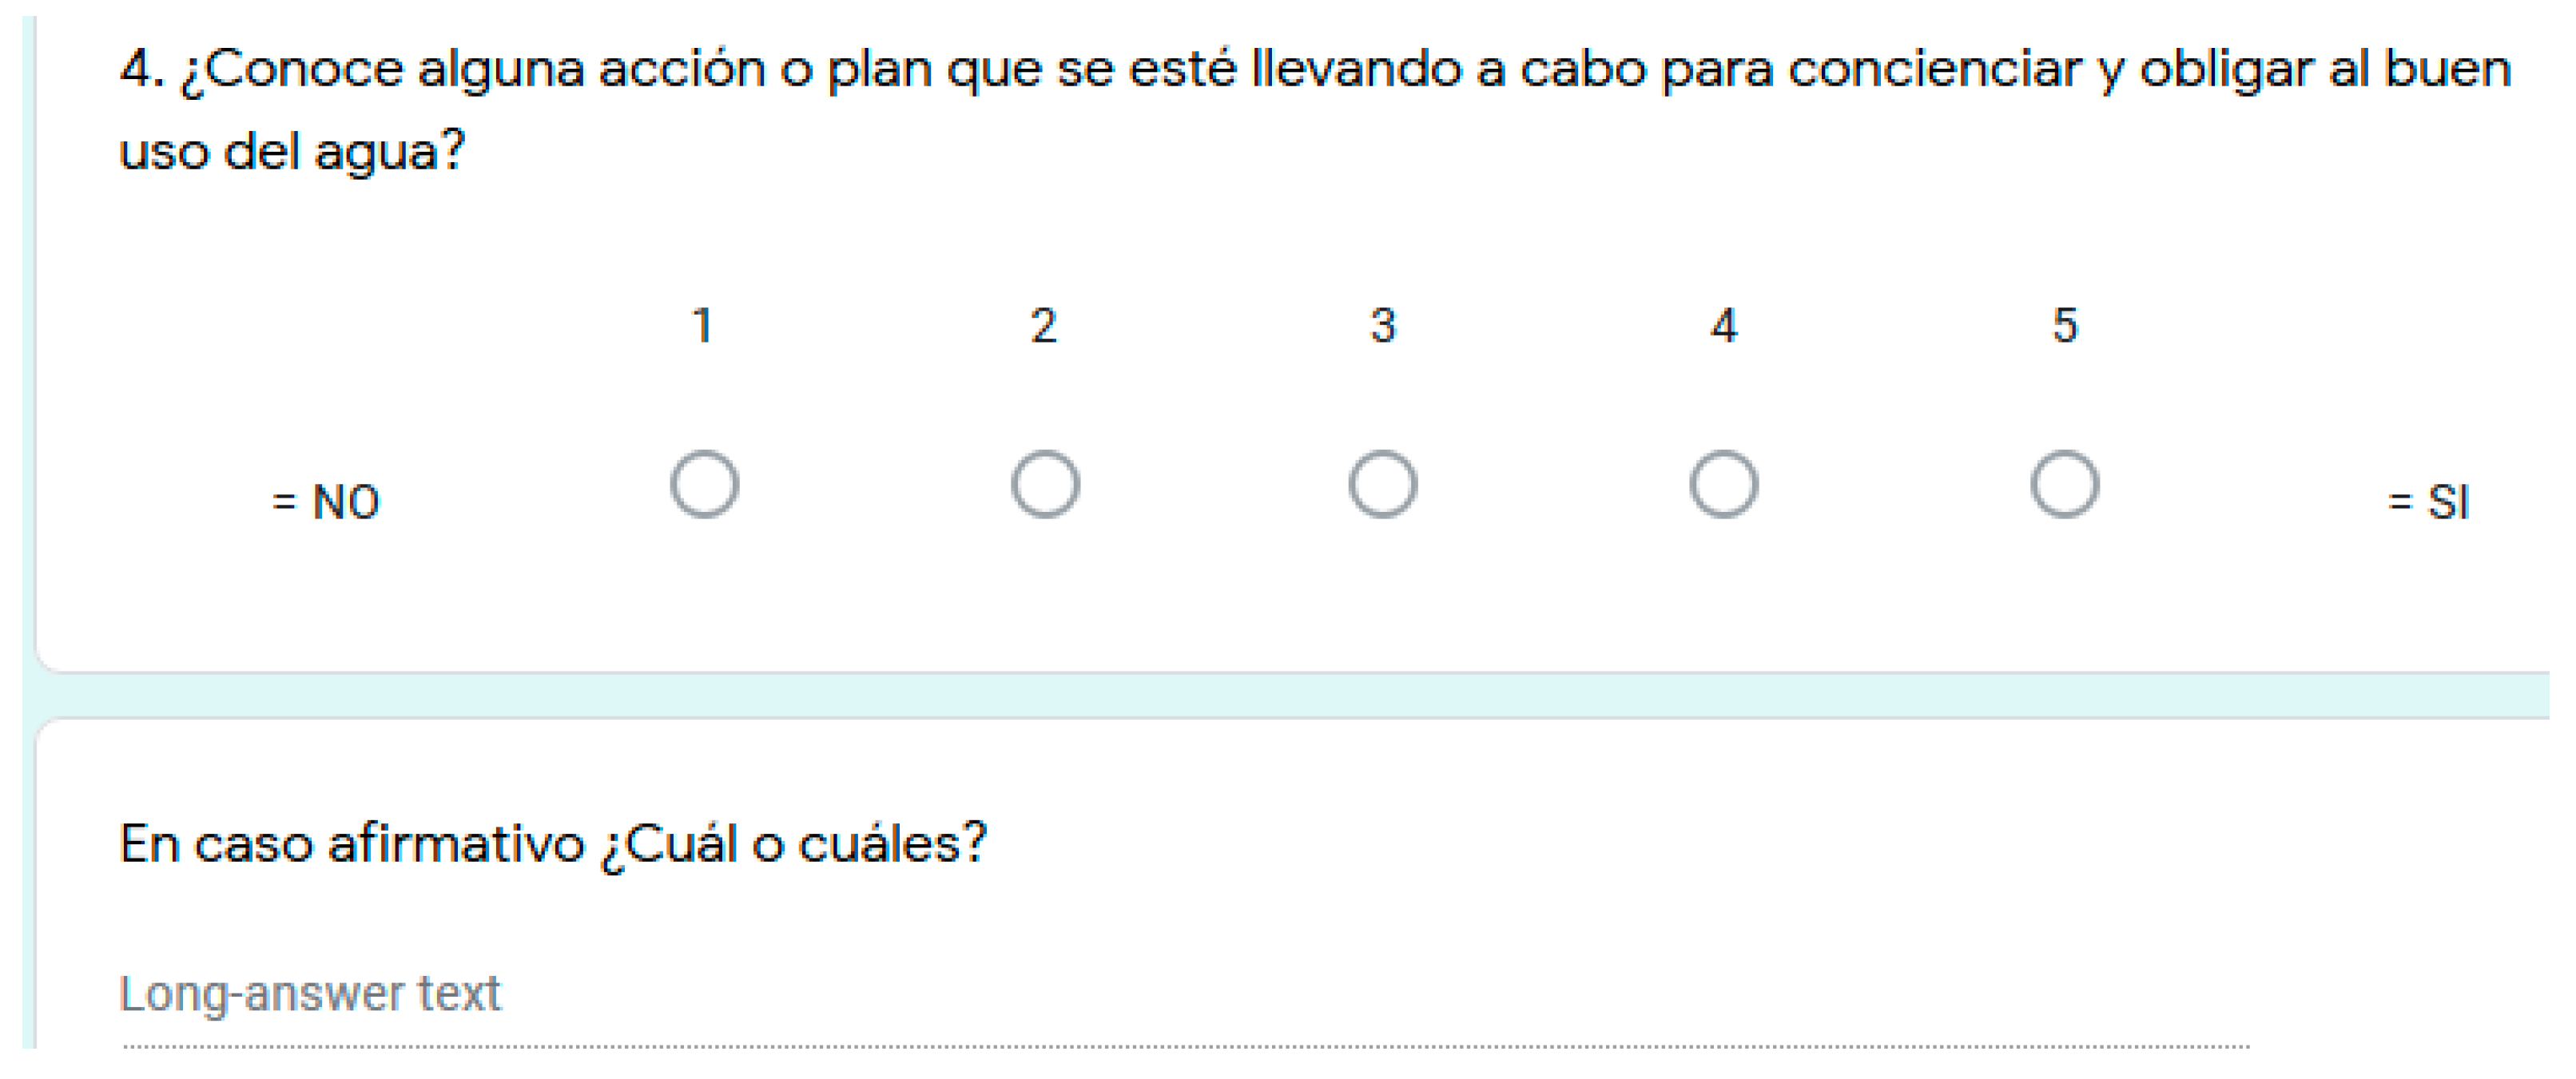
- I am aware of any initiatives to raise awareness and “oblige the good use of water”


References
- UN. Transforming Our World: The 2030 Agenda for Sustainable Development. Resolution Adopted by the General Assembly on 25 September 2015 [without Reference to a Main Committee (A/70/L.1)]. Available online: https://www.un.org/ga/search/view_doc.asp?symbol=A/RES/70/1&Lang=E (accessed on 13 January 2020).
- UN. Resolution Adopted by the General Assembly on 6 July 2017 [without Reference to a Main Committee (A/71/L.75)] 71/313. Work of the Statistical Commission Pertaining to the 2030 Agenda for Sustainable Development. Available online: https://undocs.org/A/RES/71/313 (accessed on 13 January 2020).
- Summary Report Global Workshop for Integrated Monitoring of Sustainable Development Goal 6 on Water and Sanitation. Available online: http://www.unwater.org/publications/summary-report-global-workshop-for-integrated-monitoring-of-sustainable-development-goal-6-on-water-and-sanitation/ (accessed on 13 January 2020).
- United Nations. Sustainable Development Goal 6: Synthesis Report 2018 on Water and Sanitation; United Nations: New York, NY, USA, 2018; Available online: https://www.unglobalcompact.org/docs/publications/SDG6_SR2018.pdf (accessed on 3 March 2020).
- Ortigara, A.; Kay, M.; Uhlenbrook, S. A review of the SDG 6 synthesis report 2018 from an education, training, and research perspective. Water 2018, 10, 1353. [Google Scholar] [CrossRef] [Green Version]
- Encyclical Letter Laudato Si’ of the Holy Father Francis on Care for Our Common Home. Available online: http://www.vatican.va/content/francesco/en/encyclicals/documents/papa-francesco_20150524_enciclica-laudato-si.html (accessed on 13 January 2020).
- Ait Kadi, M. Water for Development and Development for Water: Realizing the Sustainable Development Goals (SDGs) Vision. Aquat. Procedia 2016, 6, 106–110. [Google Scholar] [CrossRef]
- Sadoff, C.W.; Hall, J.W.; Grey, D.; Aerts, J.C.J.H.; Ait-Kadi, M.; Brown, C.; Cox, A.; Dadson, S.; Garrick, D.; Kelman, J.; et al. Securing Water, Sustaining Growth. In Report of the GWP/OECD Task Force on Water Security and Sustainable Growth; University of Oxford: Oxford, UK, 2015. [Google Scholar]
- Murga-Menoyo, M.A.; Bautista-Cerro, M.J. Guía PRADO. Sostenibilizar el Currículo de la Enseñanza Secundaria; UNED: Madrid, Spain, 2019. [Google Scholar] [CrossRef]
- Raszkowski, A.; Bartniczak, B. On the Road to Sustainability: Implementation of the 2030 Agenda Sustainable Development Goals (SDG) in Poland. Sustainability 2019, 11, 366. [Google Scholar] [CrossRef] [Green Version]
- Jama, A.A.; Mourad, K.A. Water Services Sustainability: Institutional Arrangements and Shared responsibilities. Sustainability 2019, 11, 916. [Google Scholar] [CrossRef] [Green Version]
- Villanueva, L.H.; García, M.D.M.H. El agua como derecho humano: Retos y limitaciones. Boletín IEEE 2016, 4, 329–352. [Google Scholar]
- Gosling, S.N.; Arnell, N.W. A global assessment of the impact of climate change on water scarcity. Clim. Chang. 2016, 134, 371–385. [Google Scholar] [CrossRef] [Green Version]
- United Nations. The International Decade for Action on Water for Sustainable Development, 2018–2028. 2018. Available online: https://www.un.org/en/events/waterdecade/ (accessed on 13 January 2020).
- United Nations Synthesis Report on Water and Sanitation. 2018. Available online: https://www.unwater.org/publication_categories/sdg-6-synthesis-report-2018-on-water-and-sanitation/ (accessed on 3 March 2020).
- United Nations Water Annual Report. 2018. Available online: https://www.unwater.org/publications/un-water-annual-report-2018/ (accessed on 3 March 2020).
- Hoekstra, A.Y.; Chapagain, A.K.; Van Oel, P.R. Progress in Water Footprint Assessment: Towards Collective Action in Water Governance. Water 2019, 11, 1070. [Google Scholar] [CrossRef] [Green Version]
- Dean, A.J.; Lindsay, J.; Fielding, K.S.; Smith, L.D. Fostering water sensitive citizenship–Community profiles of engagement in water-related issues. Environ. Sci. Policy 2016, 55, 238–247. [Google Scholar] [CrossRef]
- Guariso, A.; Rogall, T. Rainfall Inequality, Political Power, and Ethnic Conflict in Africa; LICOS Discussion Paper Series No. 391/2017; Faculty of Economics And Business: Leuven, Belgium, 2017; Available online: https://papers.ssrn.com/Sol3/papers.cfm?abstract_id=2961694 (accessed on 3 March 2020).
- Pueyo-Ros, J.; Fraguell, R.M.; Ribas, A. Propuesta metodológica para valorar la calidad escénica de los paisajes del agua y su potencial como recurso turístico. Invest. Geogr. Alicante 2017, 68, 79–94. [Google Scholar] [CrossRef] [Green Version]
- Maurel, J.B. El agua como recurso escaso y sus problemas en la España actual. Estud. Geogr. 2018, 69, 453–493. [Google Scholar]
- Morales Yago, F.J.; Lázaro Torres, M.L.; de Gómez Ruiz, M.L. University students’ perceptions of the inner cities of Murcia and Valencia. Quaest. Geogr. 2018, 37, 75–85. [Google Scholar] [CrossRef] [Green Version]
- Álvarez Otero, J.; De Lázaro, M.L. Las infraestructuras de datos espaciales: Un reto y una oportunidad en la docencia de la Geografía. Bol. Asoc. Geógr. Esp. 2019, 82. [Google Scholar] [CrossRef] [Green Version]
- Instituto Nacional de Estadística (INE) for SDG. Available online: https://www.ine.es/dynt3/ODS/es/objetivo.htm?id=5003 (accessed on 3 March 2020).
- Fritz, S.; See, L.; Carlson, T.; Haklay, M.M.; Oliver, J.L.; Fraisl, D.; Wehn, U. Citizen science and the United Nations Sustainable Development Goals. Nat. Sustain. 2019, 2, 922–930. [Google Scholar] [CrossRef]
- Breuer, A.; Janetschek, H.; Malerba, D. Translating Sustainable Development Goal (SDG) Interdependencies into Policy Advice. Sustainability 2019, 11, 2092. [Google Scholar] [CrossRef] [Green Version]
- Corbeta, P. Metodologia y Técnicas de Investigacion Social; McGrawHill: Madrid, Spain, 2003. [Google Scholar]
- Li, Q. A novel Likert scale based on fuzzy sets theory. Expert Syst. Appl. 2013, 40, 1609–1618. [Google Scholar] [CrossRef]
- INE PIB. Available online: https://www.ine.es/dyngs/INEbase/es/operacion.htm?c=Estadistica_C&cid=1254736167628&menu=ultiDatos&idp=1254735576581 (accessed on 13 January 2020).
- Murga-Menoyo, M. La Formación de la Ciudadanía en el Marco de la Agenda 2030 y la Justicia Ambiental. Proyecto EDU2015-66591-R financiado por el Ministerio de Economía, Industria y Competitividad del Gobierno de España. Rev. Int. Educ. Justicia Soc. RIEJS 2018. [Google Scholar] [CrossRef] [Green Version]
- Gisbert, J.P.; Molina-Infante, J.; Amador, J.; Bermejo, F.; Bujanda, L.; Calvet, X.; Gomollon, F. IV Spanish Consensus Conference on Helicobacter pylori infection treatment. Gastroenterol. Hepatol. (Engl. Ed.) 2016, 39, 697–721. [Google Scholar] [CrossRef]
- Víquez, M.J.; Castillo, A.R.; Zumbado, M.J.B.; San Juan-San, Á.D.S.; Diego-Concepción, S.J.; Rica, C. Prevención del cáncer gástrico y erradicación de Helicobacter pylori. Rev. Médica Sinerg. 2019, 4, e293. [Google Scholar] [CrossRef]
- United Nations Development Programme (UNDP). “Human Development Report 2019” New York. 2019. Available online: http://report.hdr.undp.org/ (accessed on 3 March 2020).
- World Health Organisation. UN-Water Global Analysis and Assessment of Sanitation and Drinking-Water (GLAAS) The Next GLAAS Report will be Published in 2019. Available online: http://www.unwater.org/publication_categories/glaas/ (accessed on 3 March 2020).
- Wilber, H. The Anatomy of a Story. An ArcGIS StoryMaps Cheat Sheet. 2019. Available online: https://storymaps.arcgis.com/stories/a9a3b76c2d3d4b6bb0d822706e31b33c (accessed on 3 March 2020).
- Carroll, A. Nine Steps to Great Storytelling. 2019. Available online: https://storymaps.arcgis.com/stories/429bc4eed5f145109e603c9711a33407 (accessed on 3 March 2020).
- Mehta, L.; Veldwisch, G.J.; Franco, J. Special Issue: ‘Water grabbing? Focus on the (re)appropriation of finite water resources’. Water Altern. 2012, 5, 193–542. [Google Scholar]
- Pérez, A.I.M. Acaparamiento de territorios marinos y costeros: Dos casos de estudio en el Caribe colombiano. Rev. Colomb. Antropol. 2019, 55, 119–152. [Google Scholar] [CrossRef]
- Mena-Vásconez, P.; Vos, J.; Van Ommen, P.; Boelens, R. Flores, Acaparamiento del Agua y Responsabilidad Empresarial Social: Certificación de la producción de rosas y reclamos por la justicia ambiental en el Ecuador. Cuad. Geogr. Univ. València 2018, 101, 189–214. [Google Scholar] [CrossRef]
- Franco, J.; Mehta, L.; Veldwisch, G.J. The Global Politics of Water Grabbing. Third World Q. 2013, 34, 1651–1675. [Google Scholar] [CrossRef]
- Lázaro Torres, M.L. The Global Water Grabbing or Appropriation. Available online: https://storymaps.arcgis.com/stories/6bcdef88a5a34496ba93eef6113dc8c9 (accessed on 13 January 2020).
- Murga-Menoyo, M.Á. Competencias para el desarrollo sostenible: Las capacidades, actitudes y valores meta de la educación en el marco de la Agenda global post-2015. Foro Educ. 2015, 13, 55–83. [Google Scholar] [CrossRef]
- Pulido, M.; Barrena-González, J.; Alfonso-Torreño, A.; Robina-Ramírez, R.; Keesstra, S. The Problem of Water Use in Rural Areas of Southwestern Spain: A Local Perspective. Water 2019, 11, 1311. [Google Scholar] [CrossRef] [Green Version]
- García-Rubio, M.A.; Tortajada, C.; González-Gómez, F. Privatising water utilities and user perception of tap water quality: Evidence from Spanish urban water services. Water Resour. Manag. 2016, 30, 315–329. [Google Scholar] [CrossRef]
- Romano, G.; Masserini, L. Factors affecting customers’ satisfaction with tap water quality: Does privatisation matter in Italy? J. Clean. Prod. 2020, 120593. [Google Scholar] [CrossRef]


| Perception (n = 445) | Mean | Median | Q1 | Q2 |
|---|---|---|---|---|
| I am aware about water use efficiency | 4.22 | 5.00 | 4 | 5 |
| I think climate change may affect water use | 4.54 | 5.00 | 4 | 5 |
| I am aware that drinking water is a scarce good | 4.52 | 5.00 | 4 | 5 |
| I believe that the water in my place of residence is well managed | 3.14 | 3.00 | 2 | 4 |
| I am aware of SDG 6: “ensure availability and sustainable management of water and sanitation for all” | 2.37 | 2.00 | 1 | 4 |
| The water facility that supplies my home is acceptable | 4.10 | 4.00 | 3 | 5 |
| I have received and read information about efficient water use | 3.38 | 4.00 | 2 | 5 |
| I have had any problem with the water (bad taste, or a disease like Helicobacter pylori) | 2.03 | 1.00 | 1 | 3 |
| I am aware of any initiatives to raise awareness and “oblige the good use of water” | 2.054 | 1.00 | 1 | 3 |
| Women (n = 256) | Mean | Standard Deviation | Trim-med | Skew | Kurtosis | Standard Error |
|---|---|---|---|---|---|---|
| I am aware about water use efficiency | 4.20 | 1.00 | 4.37 | −1.17 | 0.61 | 0.06 |
| I think climate change may affect water use | 4.56 | 0.82 | 4.74 | −1.85 | 2.69 | 0.05 |
| I am aware that drinking water is a scarce good | 4.51 | 0.91 | 4.71 | −1.86 | 2.71 | 0.06 |
| I believe that the water in my place of residence is well managed | 3.20 | 1.11 | 3.23 | 0.17 | 0.52 | 0.07 |
| I am aware of SDG 6: “ensure availability and sustainable management of water and sanitation for all” | 2.27 | 1.42 | 2.10 | 0.68 | −0.91 | 0.09 |
| The water facility that supplies my home is acceptable | 4.09 | 1.03 | 4.25 | −0.92 | −0.11 | 0.06 |
| I have received and read information about efficient water use | 3.24 | 1.51 | 3.30 | −0.28 | −1.39 | 0.09 |
| I have had any problem with the water (bad taste, or a disease like Helicobacter pylori) | 1.95 | 1.43 | 1.69 | 1.14 | −0.29 | 0.09 |
| I am aware of any initiatives to raise awareness and “oblige the good use of water” | 1.84 | 1.26 | 1.59 | 1.34 | 0.56 | 0.08 |
| Men (n = 189) | Mean | Standard Deviation | Trim-med | Skew | Kurtosis | Standard Error |
|---|---|---|---|---|---|---|
| I am aware about water use efficiency | 4.25 | 1.02 | 4.43 | −1.25 | 0.64 | 0.07 |
| I think climate change may affect water use | 4.52 | 0.93 | 4.83 | −1.94 | 2.98 | 0.07 |
| I am aware that drinking water is a scarce good | 4.53 | 0.89 | 4.73 | −1.82 | 2.3 | 0.06 |
| I believe that the water in my place of residence is well managed | 3.05 | 1.23 | 3.06 | −0.16 | −0.97 | 0.09 |
| I am aware of SDG 6: “ensure availability and sustainable management of water and sanitation for all” | 2.49 | 1.58 | 2.37 | 0.45 | −1.4 | 0.12 |
| The water facility that supplies my home is acceptable | 4.11 | 1.02 | 4.26 | −0.96 | 0.11 | 0.07 |
| I have received and read information about efficient water use | 3.56 | 1.47 | 3.69 | −0.55 | −1.13 | 0.11 |
| I have had any problem with the water (bad taste, or a disease like Helicobacter pylori) | 2.13 | 1.45 | 1.93 | 0.90 | −0.73 | 0.11 |
| I am aware of any initiatives to raise awareness and “oblige the good use of water” | 2.34 | 1.63 | 2.19 | 0.70 | −1.19 | 0.12 |
| Doctorate (Ph.D) (n = 69) 55% Male/45% Female | University Education (n = 232) 40% Male/60% Female | Non-University Education (n = 144) 41% Male/59% Female | |||||||
|---|---|---|---|---|---|---|---|---|---|
| Items | Mean | Standard Deviation | Median | Mean | Standard Deviation | Median | Mean | Standard Deviation | Median |
| A | 4.57 | 0.92 | 5 | 4.25 | 1.01 | 5 | 4.01 | 1.01 | 4 |
| B | 4.49 | 1.01 | 5 | 4.6 | 0.82 | 5 | 4.47 | 0.88 | 5 |
| C | 4.77 | 0.67 | 5 | 4.57 | 0.88 | 5 | 4.31 | 0.99 | 5 |
| D | 3.33 | 1.18 | 4 | 3.14 | 1.10 | 3 | 3.03 | 1.23 | 3 |
| E | 2.97 | 1.73 | 3 | 2.32 | 1.50 | 2 | 2.15 | 1.28 | 2 |
| F | 4.28 | 0.95 | 5 | 4.11 | 1.02 | 4 | 4 | 1.07 | 4 |
| G | 3.77 | 1.36 | 4 | 3.34 | 1.51 | 4 | 3.24 | 1.52 | 3.5 |
| H | 2.1 | 1.52 | 1 | 2.08 | 1.51 | 1 | 1.9 | 1.29 | 1 |
| I | 2.14 | 1.55 | 1 | 1.97 | 1.41 | 1 | 2.14 | 1.48 | 1 |
| Age | 48.19 | 13.33 | 50 | 39.54 | 15.45 | 39.5 | 29.33 | 16.73 | 19 |
© 2020 by the authors. Licensee MDPI, Basel, Switzerland. This article is an open access article distributed under the terms and conditions of the Creative Commons Attribution (CC BY) license (http://creativecommons.org/licenses/by/4.0/).
Share and Cite
de Lázaro Torres, M.L.; Borderías Uribeondo, P.; Morales Yago, F.J. Citizen and Educational Initiatives to Support Sustainable Development Goal 6: Clean Water and Sanitation for All. Sustainability 2020, 12, 2073. https://doi.org/10.3390/su12052073
de Lázaro Torres ML, Borderías Uribeondo P, Morales Yago FJ. Citizen and Educational Initiatives to Support Sustainable Development Goal 6: Clean Water and Sanitation for All. Sustainability. 2020; 12(5):2073. https://doi.org/10.3390/su12052073
Chicago/Turabian Stylede Lázaro Torres, María Luisa, Pilar Borderías Uribeondo, and Francisco José Morales Yago. 2020. "Citizen and Educational Initiatives to Support Sustainable Development Goal 6: Clean Water and Sanitation for All" Sustainability 12, no. 5: 2073. https://doi.org/10.3390/su12052073