Indoor Vertical Farming in the Urban Nexus Context: Business Growth and Resource Savings


1
Department of Business Development and Technology, Centre for Energy Technologies, Aarhus University, Birk Centerpark 15, 7400 Herning, Denmark
2
Energy Policy and Climate Program, Advanced Academic Programs, Johns Hopkins University, Baltimore, MD 21218, USA
*
Author to whom correspondence should be addressed.
Sustainability 2020, 12(5), 1965; https://doi.org/10.3390/su12051965
Submission received: 7 February 2020
/
Revised: 26 February 2020
/
Accepted: 27 February 2020
/
Published: 4 March 2020
(This article belongs to the Special Issue Competitive Advantage Establishment through Green Entrepreneurship and Sustainable Environmental Management)
Abstract
:In recent years, a new urban environment in the large metropolitan areas, the so-called “megacities”, has emerged. It is estimated that more than five billion people will be located in urban areas by 2030. Many projects have been initiated in the megacities to support the new ecosystem services in providing the most sustainable and efficient food supply solutions, as well as for transporting fresh and clean vegetables. One of the most important focus areas is research on energy sustainability, including how to optimize energy efficiency to meet the needs of citizens and companies. Indoor urban vertical farming (IUVF) is one of the greatest achievements of our time in agriculture, as it is entirely focused on meeting the food needs of people living in urban areas with the lowest environmental and energy costs. IUVF creates a new foundation in the urban food production system, providing opportunities for many other sustainable activities, such as energy and grey water recycling, but beyond all, it helps citizens to have access in fresh and nutritious fruits and vegetables and to become more creative building up their skills regarding sustainable food production. In this study, the internal rate of return (IRR) and the net present value (NPV) indexes were used to compare IUVF and greenhouse (GH) facilities under various financing schemes. Consistent with similar studies, this research also confirms that IUVF is much more profitable for investors, saving significant resources compared to GHs.
1. Introduction
In recent years, the phenomenon of urbanization, i.e., the continuous increase of population in cities and towns, has rapidly increased. Many metropolitan cities require fresh food hotspots to feed their populace. According to Angel et al. (2011) [1], urban land cover will increase globally from 300,000 km2 in 2000 to 770,000 km2 in 2030 and to 1,200,000 km2 in 2050. One of the most revealing examples of urbanization is the case of Lagos in Nigeria, which had about 300,000 inhabitants in 1950, but today, the city has reached 17.5 million inhabitants [2]. Land in urban regions must be made more efficient and better organized to maximize the space usage. The population increase in megacities (cities with more than 10 million people) is an inevitable fact that academia and businesses need to investigate in order to improve the quality of life overall. The growing need for more food has escalated over the last few years, and as a result, it is of vital importance to adopt more sustainable and efficient food production solutions. In the Food and Agriculture Organization (FAO) report (2015) [3], it is stated that the number of agribusinesses must increase up to 70% by 2050 to meet the food demand in megacities. In this context, it is also very important to mention that more sustainable ways of distributing food globally are needed to prevent the massive food waste. In fact, if food waste were a country, it would be the third-largest greenhouse (GH) gas emitter in the world with its four billion tons of food waste annually [4]. The competition between food and energy commodities due to the limited land and water should also be mentioned [5]. More than ever, it is crucial to make biofuels more efficient and limit their use. In addition, greater efforts should be made to achieve the sustainable global goals by using energy sources that are not dependent on food biomass but promote energy efficiency in industries and households. Every day, food travels between 100 and 1500 km from the producer to the consumer, accounting for 5%-15% of the energy used just to bring food to the table [6]. According to research conducted by Blanke (2005) [7], imported fruits demand 27% more energy than those locally grown.
Providing food to urban residents is one of the most complicated procedures in agriculture. A UN report (2018) [8] states that one of the most advantageous farming procedures is organic farming and agroecology. In a study published by George Mason University (2005) [9], it was proven that in African small-scale farms, the yield productivity increased up to 116% using agroecological farming techniques compared to traditional farming. Another solution that can increase food quantity is biodiversity. Li Chengyun (2009) [10] argued that the production yield could be increased from 33.2% to 84.7% by not using monocropping techniques but altering the crop between the years (and the use of legumes). Finally, urban farming is one of the most prosperous ways that food can be provided to urban citizens. Since the population is constantly increasing and the farming areas needed are already equal to the size of South America [11], the most sustainable option is to include urban areas as part of production schemes. Many cities already reuse abandoned properties as urban farms and cultivate their own fresh vegetables to feed their citizens.
1.1. The Danish Reality
Since this research focuses on the Danish market, it is worth looking at Denmark’s ecological footprint. According to OECD statistics, Denmark emitted approximately 51,620 tons of GH gases in 2016 [12]. In fact, according to a WWF report (2014) [13], Denmark’s ecological footprint per capita is the fourth largest in the world after Qatar, Kuwait, and the United Arabs Emirates. In 2014, Gitte Seeberg [14], the secretary general of WWF Denmark, stated in a newspaper that the Danish nation consists of roads, cities, and wheat fields, but one of the main problems is the lack of biodiversity in Denmark. Adding to this, the Danes’ high meat consumption is one of the biggest reasons for its large ecological footprint. Finally, Global Footprint Network has calculated that Denmark has a bio-capacity per person of 4.4 global hectares (gha) and an ecological footprint of 6.7 gha per person. Furthermore, it states that until 2014, the ecological footprint versus the bio-capacity in Denmark was 40,246,094 gha. Clearly, there is an immediate need for food production change, distribution, and consumption in the country.
Research conducted by Tropp (2013) [15] shows that demand for fresh, locally grown food was almost $12 billion in 2014, and was to reach $20 billion by 2019. Commercial GHs are the major sources of fresh, locally grown food for cities. For this reason, the annual growth rate of these businesses reached 8.8% in 2016, and the market’s growth forecast is expected to exceed $29.64 billion by 2020 [16]. GH production is the oldest form of controlled farming, where plants can be cultivated in an isolated environment, which is partly independent of the outdoor weather conditions. GH production is an intensive cultivation method that uses air management techniques as well as cooling and heating processes to produce high crop yields. In recent years, GH growers have started to install artificial lighting and hydroponic cultivation methods that can further increase the yield of crops and reduce their water footprint. There are no detailed literature studies linking the need for indoor urban vertical farming (IUVF) facilities in areas with a lack of solar energy, which is vital for food production (40% average sunshine percentage from April to September and around 20% the rest of the year (weather-and-climate.com)). In 2017, the import value of vegetables and fruits to Denmark amounted to roughly DKK 11.2 billion, which equals a rise of 22.81% over the last 10 years [17]. In other words, Denmark imports between 24,450 and 27,850 tons of fresh fruits and vegetables annually [18]. The country has some of the highest electricity prices in Europe, but at the same time, a very high level of renewable energy (mainly wind energy) connected to the main grid [19]. The combination of IUVF with renewable energy and batteries can lead to a radical decrease of system energy costs.
1.2. Indoor Urban Vertical Farming
IUVF is another way of allowing a fresh, locally grown food production, i.e., the possibility of a year-round crop production. The development of GHs has led to today’s highly sophisticated, controlled agricultural systems. IUVF is the new promising technology that allows us to optimize agricultural production and convert it from traditional farming to an integrated urban network using the most innovative and sustainable technological achievements of our time. In IUVF, plants grow indoors by using hydroponic methods (aeroponic or fogoponic in a few cases) and artificial lighting that simulates solar radiation. A plant factory with artificial lighting (PFAL)—an intensive type of vertical farming—refers to a massive plant production establishment equipped with thermal insulation. Its structure is completely isolated from the outdoor environment [20]. Unlike traditional agriculture, PFALs resemble a “production line” in a warehouse, where cultivation shelves are stacked several meters high to maximize the utilization of the vertical space. PFALs include seeding, transplanting, moving cultivation panels, harvesting, pollinating, weight control, packaging, metal inspection, and panel cleaning. Companies that have implemented this type of technology use different methods, numbers, and applications of the above techniques according to their business plan and strategy. PFALs present many advantages that make them very competitive compared to conventional farming, especially for consumers located in the urban network. The use of pioneering systems in PFALs eliminates the use of fertilizers and pesticides in the green production alhough PFALs consume almost 2% water in comparison with open-field water footprint, as 95% of the water from plant evapotranspiration in this system is compressed in the air conditioning evaporator in the form of liquid water [20]. After this process, water is collected, sterilized, and then returned to the water tank to be reused. The water is enriched with a nutrient solution, and, as a result, the nutrient fluids in the cultivation area can be reused and recycled. Another benefit to be highlighted is that PFALs reduce CO2 emissions, as they are located in urban or suburban areas, virtually eliminating food transportation and thus the carbon footprints of food. The nutritional value of fresh fruits and vegetables diminishes during the shipping process, even at very low refrigerating temperatures. B vitamins are very sensitive to freezing with a loss in the transportation process ranging from 20% to 60% [21]. A Japanese study describes how waste heat from fossil fuel power plants is imported to nearby PFALs, thereby reducing CO2 emissions by 1204 tons per year [22]. Some PFALs avoid electricity peaks during the daytime by switching on lights only at night to utilize surplus electricity [20,23]. The area around industrial factories and mining operations is particularly worrisome with pollution rising significantly to 36.3% [24]. However, in areas with many job and business opportunities that have a developed industry and a denser population, the likelihood of people eating local crops is high.
1.3. Food Waste and Management
Food production must remain sufficiently intensive to meet consumer and food demands. Cultivation methods must be made more efficient and sustainable but without further compromising land use and biodiversity. Farming techniques must be optimized, including waste processes. Globally, 40–50% of fruits and vegetables are wasted or lost during the food supply chain [18]. In Europe, 39% of food resources such as energy, land, and water are wasted in the manufacturing process (by-products, overproduction, and weather conditions) and almost 42% in the households (over-purchasing and disorganization). In Denmark, households waste around 260,000 tons, while the agriculture/food industry wastes 133,000 tons of the total 700,000 tons of food waste each year [25]. In Denmark, fruits and vegetables are still part of the wholesale link in the food supply chain and are separate from the retailers’ and producers’ business strategy [26]. Consolidating businesses in order to reduce food waste is therefore difficult. Furthermore, fruits and vegetables are the largest waste producers in the retail and wholesale markets [27]. According to Ettrup and Bjørn (2002), farming techniques supported by the retail market create 165-562 kg of food waste for every €130,000 in revenue. In a Danish household, fresh vegetables produce 1.42 kg waste per week of which 77.5% is unprocessed vegetables [26]. The development of farming techniques that will perform under a finite and limited resource base is necessary. The use efficiency of our resources to reduce fruit and vegetable waste needs to be optimized.
Already by definition, IUVF has the ability to transform bio-waste into useful by-products that come from crop leaves, damaged fruits and vegetables, stems, and roots. Although PFALs are rapidly developing, they only have a very small share of the overall food market. The high construction start-up costs are directly related to this lack of market exposure. A PFAL with 10 tiers costs on average around $4700 per square meter, and only after 5-7 years can the capital be reclaimed. The initial investment is approximately 15 times higher than a normal GH, making the business entry too expensive (Kozai, 2013). Another reason is profitability. Many PFALs prefer to grow market-oriented crops such as lettuce, herbs, and microgreens. However, PFALs as high-tech companies have high start/up costs, reaching up to 26% (Kozai et al., 2016). New PFAL business are more common in Asian countries such as North Korea, Japan, China, and Singapore. In Japan, 165 PFALs were in operation in 2016 [28], and in China, the forecast shows that the number of PFALs will reach 200 by 2020 [29]. Nevertheless, more and more IUVF facilities are being installed worldwide, with annual growth rate reaching 24.8%, which is expected to grow to $5.8 billion by 2022 [30].
This research analyzes a case study on the profitability and the financial viability of PFALs, creating a nexus between energy, food, and water in urban areas [31]. A techno-economic cash flow analysis of the use of IUVF in the Central Denmark Region (Region Midtjylland) with two different cultivation techniques, GH and IUVF, was evaluated. In both cases, the selected cultivation plant was basil, as this plant responds extremely well in climate-controlled environments, has a short production cycle, and thrives at a high plant density. The purpose was to find the optimal conditions and solutions for using PFALs to influence the Danish population to consume their own produced products and minimize the cost of imported products. The two techniques are compared against the internal rate of return (IRR), the net present value (NPV), and the repayment period of a business plan for a new PFAL. Another objective was to compare the two cultivation methods from a resource-conserving perspective with the aim of developing a case study to act as a guide for private funds, presenting various investments scenarios.
2. Materials and Methods
The location and the size of the GH and IUVF facilities studied were determined. It was decided that the case study should take place in an industrial area in the city of Aarhus, Denmark. The area of Aarhus is about 91 million m2 and is located on the east cost of the Jutland peninsula. The size of the municipal population is approximately 340,000 citizens. This area was chosen because:
- (a)
- Aarhus is the second largest city in Denmark, meaning that a business providing sufficient quantities of fresh fruits and vegetables to the consumers can be a sustainable case.
- (b)
- Aarhus is considered one of the major global hubs in the wind energy market. Indeed, Denmark is one of the most energy self-sufficient countries in the world with a rate of 94% and a 28% share of gross energy consumption deriving from renewable energy and waste [32]. Denmark is among the Nord Pool countries that exchange electricity with Swedish, Norwegian, German, and other power grids in an integrated grid.
- (c)
- The vegetables available in Aarhus supermarkets and grocery stores are of very high quality. Denmark has one of the highest organic market shares in the world. In fact, more than 11% of the Danes buy organic products, of which vegetables and fruits comprise 33% (€1.8 billion) [33]. Customers are familiar with high-quality products, and they are willing to pay more money to buy high-nutrient value and chemical-free products.
We chose not to use Copenhagen as the IUVF location, as it is the most expensive region in Denmark with real estate prices almost 76% higher than in Jutland [34]. In order to create a more objective case, actual data from the Danish market were combined based on previous literature studies. However, since a detailed cost analysis of the various IUVF expenses is presented, some of the numerical data are based on assumptions (all mentioned in the analysis). As previously discussed, the plant used in this research was basil, as it is one of the most frequently cultivated plant species in both IUVF and GH facilities with high product value. Herbs can be a great crop for market growers and are usually more profitable than leafy greens [35,36].
3. Basic Assumptions and Resource Analysis
3.1. Assumptions
- A semi-closed GH was chosen, as this would reduce costs compared to a closed GH. Semi-closed GHs have vents, which can be used to cool, dehumidify, and control pest infestation. Similarly, plants in IUVF facilities grow in a closed loop with horizontal layers (one above the other). This method cannot be applied in GHs, as lower plants will receive limited sunlight radiation due to shading. For this reason, 5000 LED lamps were installed in the IUVF facility at an assumed price of 1.4 €/W3 (approximately 15€/bulb) to simulate the solar radiation [37].
- Assuming that the IUVF facility used a closed-loop production system, the waste could be recycled and reused into useful resources, e.g., fertilizers or biofuels. In such systems, water is constantly circulating in closed loops, with wastewater recycled and reused through installing volcanic rock particles in pipes that, through pumping these rock particles, can extract nutrients and reuse them in the nutrient solution. Using this method, bio-waste can be used to create a plant nutrient solution. According to Adenaeuer (2014) [38], the estimated quantity of nutrients is equal to almost 50% of all the essential nutrients of the plants. Consequently, the estimated nutrient costs can be reduced up to 50%.
- To make it easier to compare the two farming techniques, it was assumed that both plant factories had a cultivation area of 675 m2. However, the IUVF facility had a smaller unit area of floor space (225 m2), since the crops are grown in multiple layers. Based upon real estate leasing standards in the Aarhus area, it was estimated that the rent of the IUVF facility was 31.5€/m2/year and 25.8€/m2/year for the GH.
- No safety measurements against fungi, different types of bacteria, pests, and diseases were assumed for the design of the building. However, necessary measures to prevent and combat diseases in the IUVF facility were needed, but this will be examined further in a future study.
- To achieve this result, we used the same environmental conditions in the cultivation area, including relative humidity, air temperature, and CO2. Dou et al. (2018) [39] recommend 14 mol/m2/day for a 16-hour photoperiod as the optimal daily light integral (DLI) for sweet basil [40]. In the GH facility, the artificial lighting was used only as a supplementary lighting and not as the main light source, which was solar radiation. However, adding artificial lighting would be necessary considering that the number of lighting hours in Denmark is very limited, specifically in winter.
- No calculations were performed on the structural condition of the building. Instead, several estimates were made based on previous literature studies on the building structure and the location of the structural materials of a vertical farm. IUVF facilities are completely isolated from the outdoor environment and have no window openings. For this reason, the ceiling and the walls surrounding them have a better thermal insulation compared to a GH facility. The R-value for both facilities was defined. The R-value expresses how well a building is insulated; the higher the R-value, the better the insulation. We assumed that the IUVF facility was installed in the interior space of a warehouse, and thus an R-value of 13 was used [41], while the GH had an R-value of 0.95, assuming that the coverage material was single-pane glass. It was assumed that the height of the building was the same throughout the building.
- In terms of construction and equipment, it was assumed that the GH has a heating, cooling, and air-conditioning (HVAC) system that operates primarily with solar radiation for heating purposes and with heating natural gas in a semi-closed system and with natural ventilation for cooling and dehumidification purposes. The heating and cooling costs for the GH case very much depended on the latitude and external climate conditions of the facility, and because of the mean of natural gas we did not convert their energy loads using coefficient of performance. As an alternative, it was assumed that the conversion of natural gas to electricity has the same conversion efficiency as heating. For the GH facility, the CO2 level was assumed at 800ppm. For the case of the IUVF that is a closed system, we assumed a forced circulation system of heating, cooling, and air cooling. The interior climate in the IUVF had a limited interaction with the outdoor conditions, making easier and more efficient the energy use for heating, cooling, and lighting purposes. In order to calculate the energetic loads in IUVF, we converted them to electricity using their respective coefficients of performance sourcing from previous literature [42]. It was assumed that the CO2 use of the IUVF remains stable throughout the whole year, 1000ppm daily, to assure that plants have enough CO2 to transform into sugars through photosynthesis and continue their optimal growth. In order to define the total electricity demand of IUVF, we proceeded to energy calculation of heating, latent cooling, and sensible cooling. In addition, to control the humidity and cooling of the farm, ventilation fans powered by electricity were used.
- Finally, it was assumed that the wholesale price of basil was the same for both facilities (7.37 €/kg) and that the distance from the facilities to the consumers was the same. This was assumed due to the floating prices in the real estate; the closer a facility is to the city center, the higher the rental price per m2 [43]. IUVF facilities are located in and around city centers and can provide products that are fresher, more sustainable, and of higher quality. However, the rental price is much higher in urban cities, which is the reason the above assumption was established. Additionally, the number of harvests was different depending on the facilities and the yield per harvest (Table 1). Furthermore, it was assumed that the density of the plants was the same in both facilities.
- It was assumed that the IUVF facility consumes 50% less nutrients than the GH, as minerals are added to the irrigation water and supplied to the plants directly at their roots by the hydroponic system [29]. Since the IUVF facility is based on a closed-loop system, where nutrients are circulated, it is possible to design a circulatory system without nutrient waste in the production line.
3.2. Real Estate
As stated previously, IUVF facilities are located in the urban network. They are installed indoors in a controlled environment without access to natural lighting. For this reason, the use of LED lamps is necessary to imitate solar radiation, which is essential for plant growth. Therefore, 5000 LEDs were installed based on the size of the building and the intensity of light needed for the plants to grow to their full potential.
Calculations for IUVF operation indicate that it requires a full-time employee responsible for harvesting, the application of cultivation techniques, crop management, as well as weeding and chipping of the crops [46]. The possibility of hiring, in the future, a part-time worker for the picking periods or various administrative tasks is also considered. Calculations are based on the average monthly salary in Denmark, and there are two categories: 1) the average monthly salary of agricultural workers (farmers), which is 3600€, and 2) the average monthly salary of engineers, which is 4500€ [47].
Labor costs are one of the largest expenses in IUVF. In Denmark, the average hourly salary of workers with four years of practical experience and the necessary practical qualifications for working tasks in this environment is approximately 18–19 €/h. For tasks requiring less expertise and qualifications, workers from the second salary group (with at least one year of practical work experience) can be hired with a salary cost between 17–18 €/h. In our analysis, two experienced agricultural workers were employed, one working full-time and the other part-time. Most of the numbers of the basic assumptions in this case study are presented in Table 1.
3.3. Yield/Biomass Production
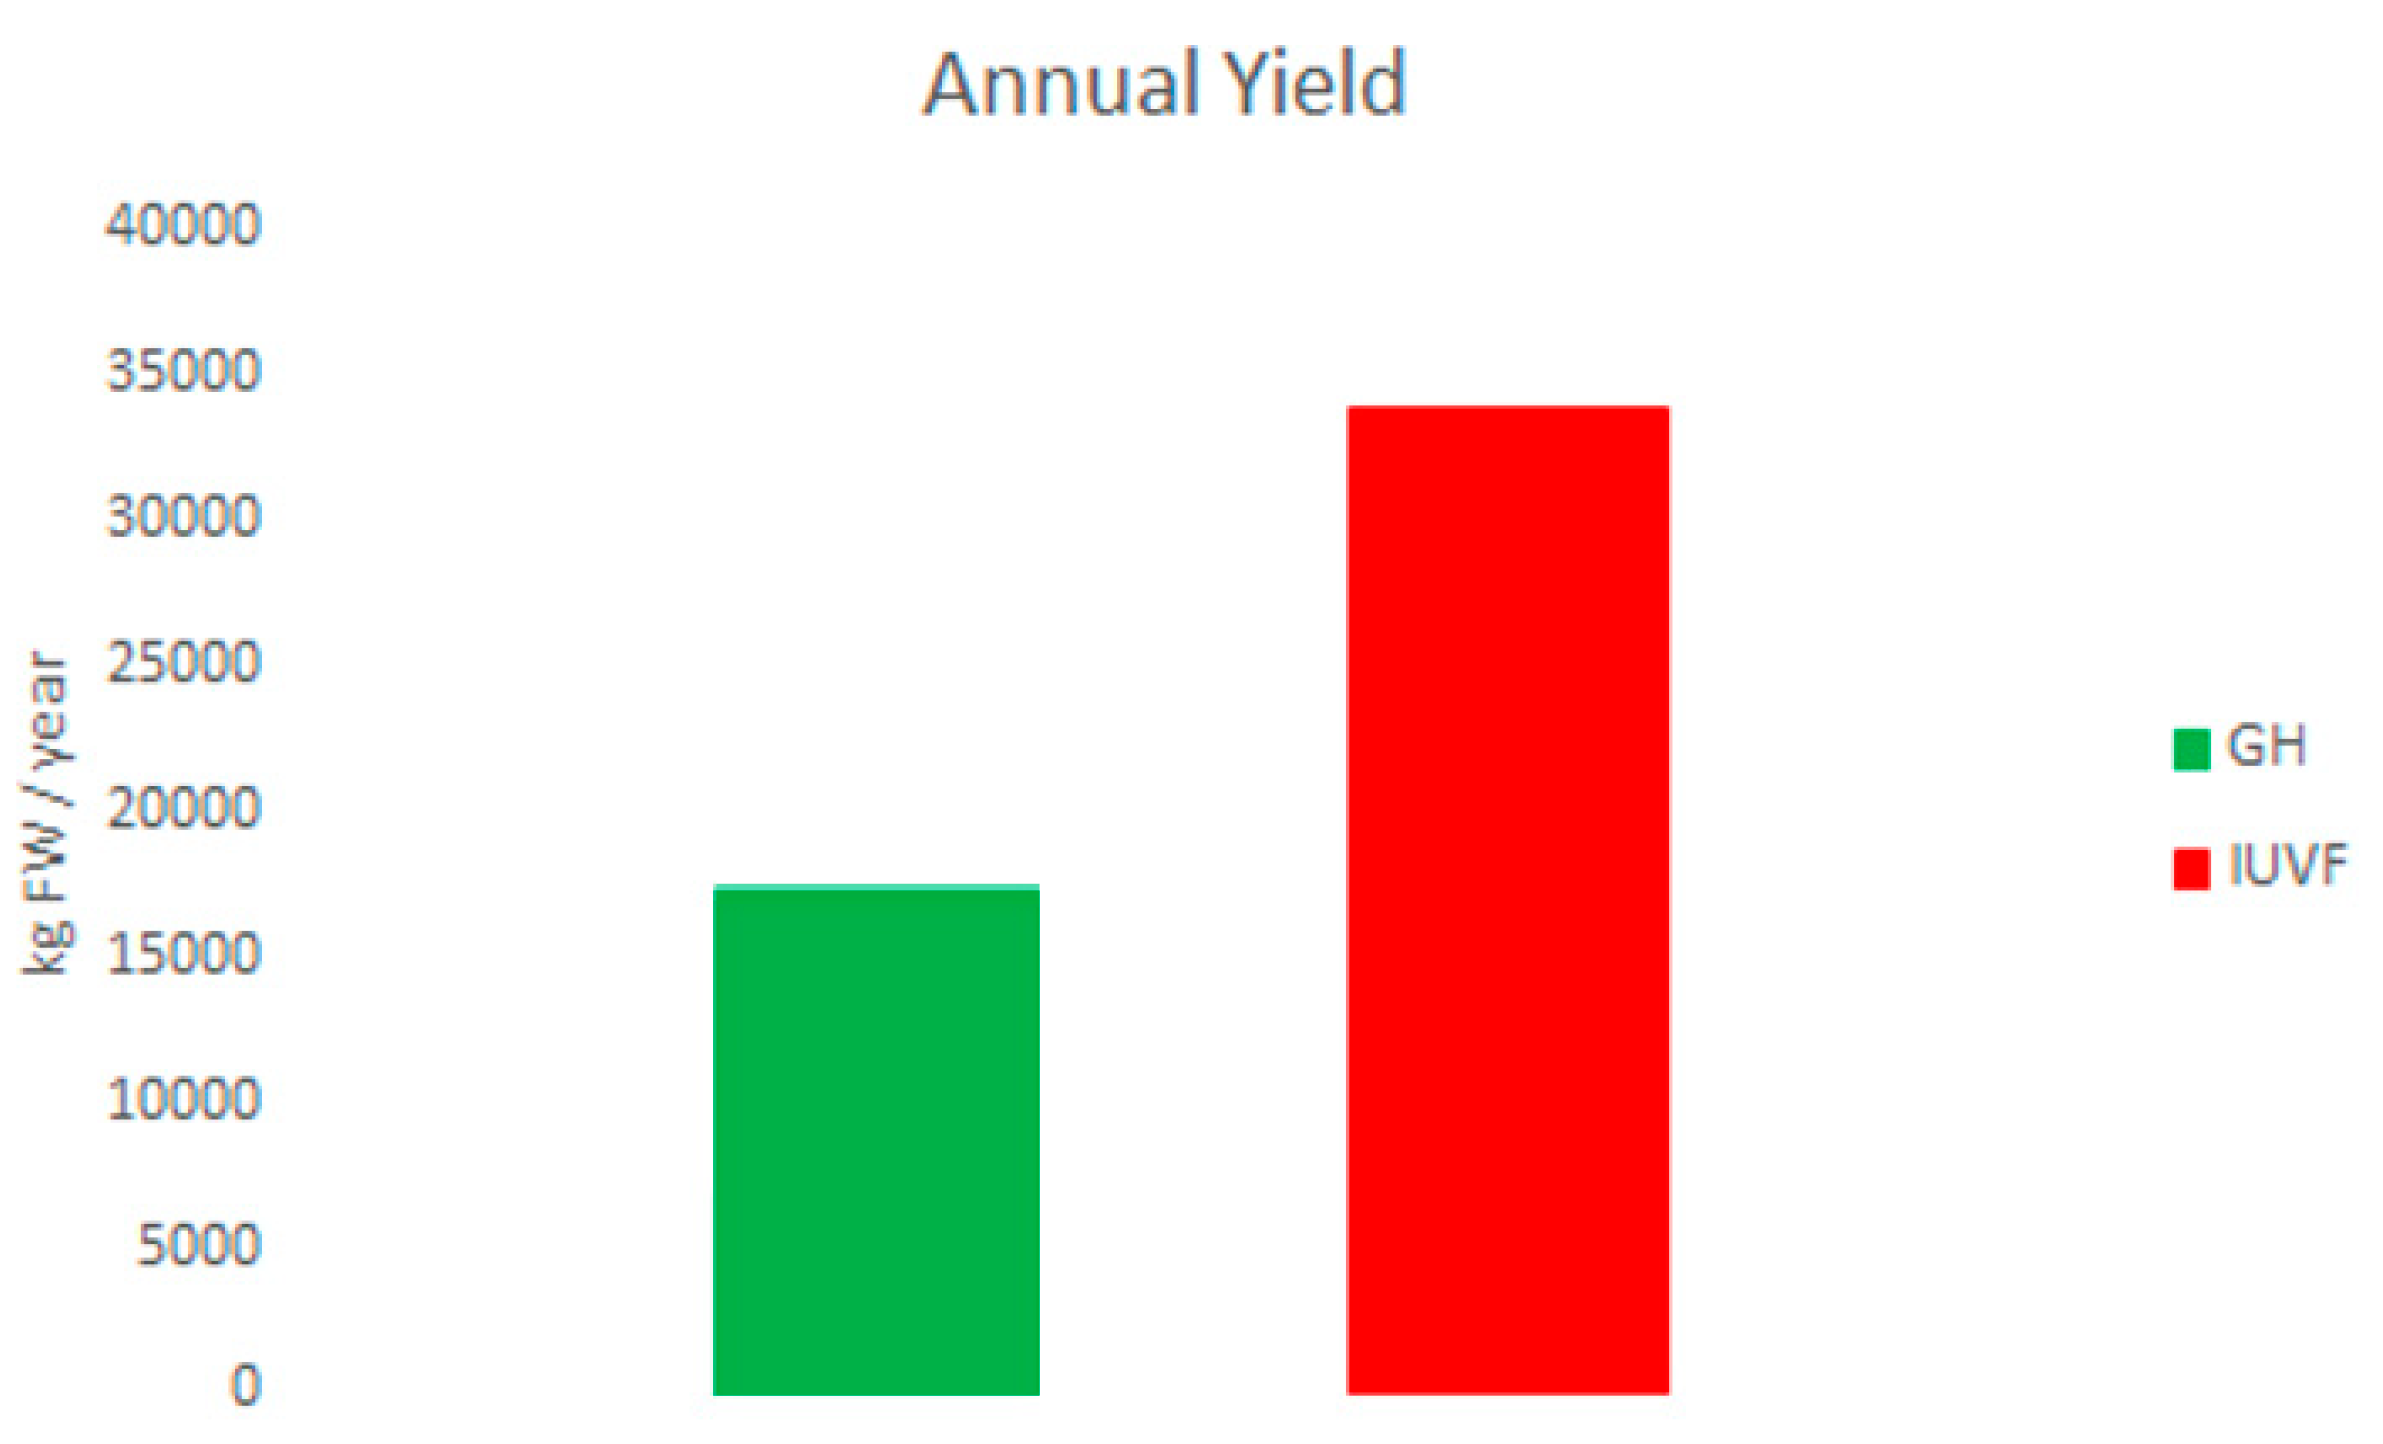
The calculations used for estimating the harvest, yield, and the biomass production of basil for both the GH and IUVF facilities were based on previous literature [42,56,58]. On average, the annual harvest of basil in a GH is 16,875 kg/year, while in an IUVF facility, 33,750 kg of fresh basil are harvested/year. The differences between GH and IUVF for basil yields per year are shown in Figure 1.
To calculate the operational expenditures (OPEX) and the capital expenditures (CAPEX) of an indoor urban vertical farm, equations from previously published literature were utilized [51]. The calculations varied according to the primary plant species used on each farm. The case plant that was examined was basil, which constitutes one of the most frequently selected species in IUVF, as it has the ideal properties for indoor cultivation (high density, low height, and high yield).
3.4. Mobility and Dynamics in OPEX and CAPEX
The key data collected and analyzed initially were DLI for Denmark, the annual outside temperature, the annual indoor temperatures, the indoor cooling and heating, the humidity requirements in the IUVF facility, and the heat generated by LEDs. These data were collected, and their connections and interactions helped define the CAPEX for an IUVF facility and the associated equipment. Additionally, these data determined the OPEX necessary for the optimal function of the facility in order to maximize basil yield.
Table 2 and Table 3 provide the results of the average climate conditions for each month according to each farm facility. Furthermore, they indicate the electricity required for the optimal operation of the IUVF facility to reach the optimal performance of the LEDs, the cooling system, and the ventilation system (fans). The waste heat mainly generated from lighting in winter can be beneficial, for heating purposes. In the summer, however, the excess heat (energy) produced by the LEDs must be either stored and redistributed in the system or removed with the ventilation system. Both tables also indicate that in an IUVF facility, the system’s total electricity demand is around 75,500 kWh/year, while the natural gas (NG) use for heating purposes is around 27,000 m3.
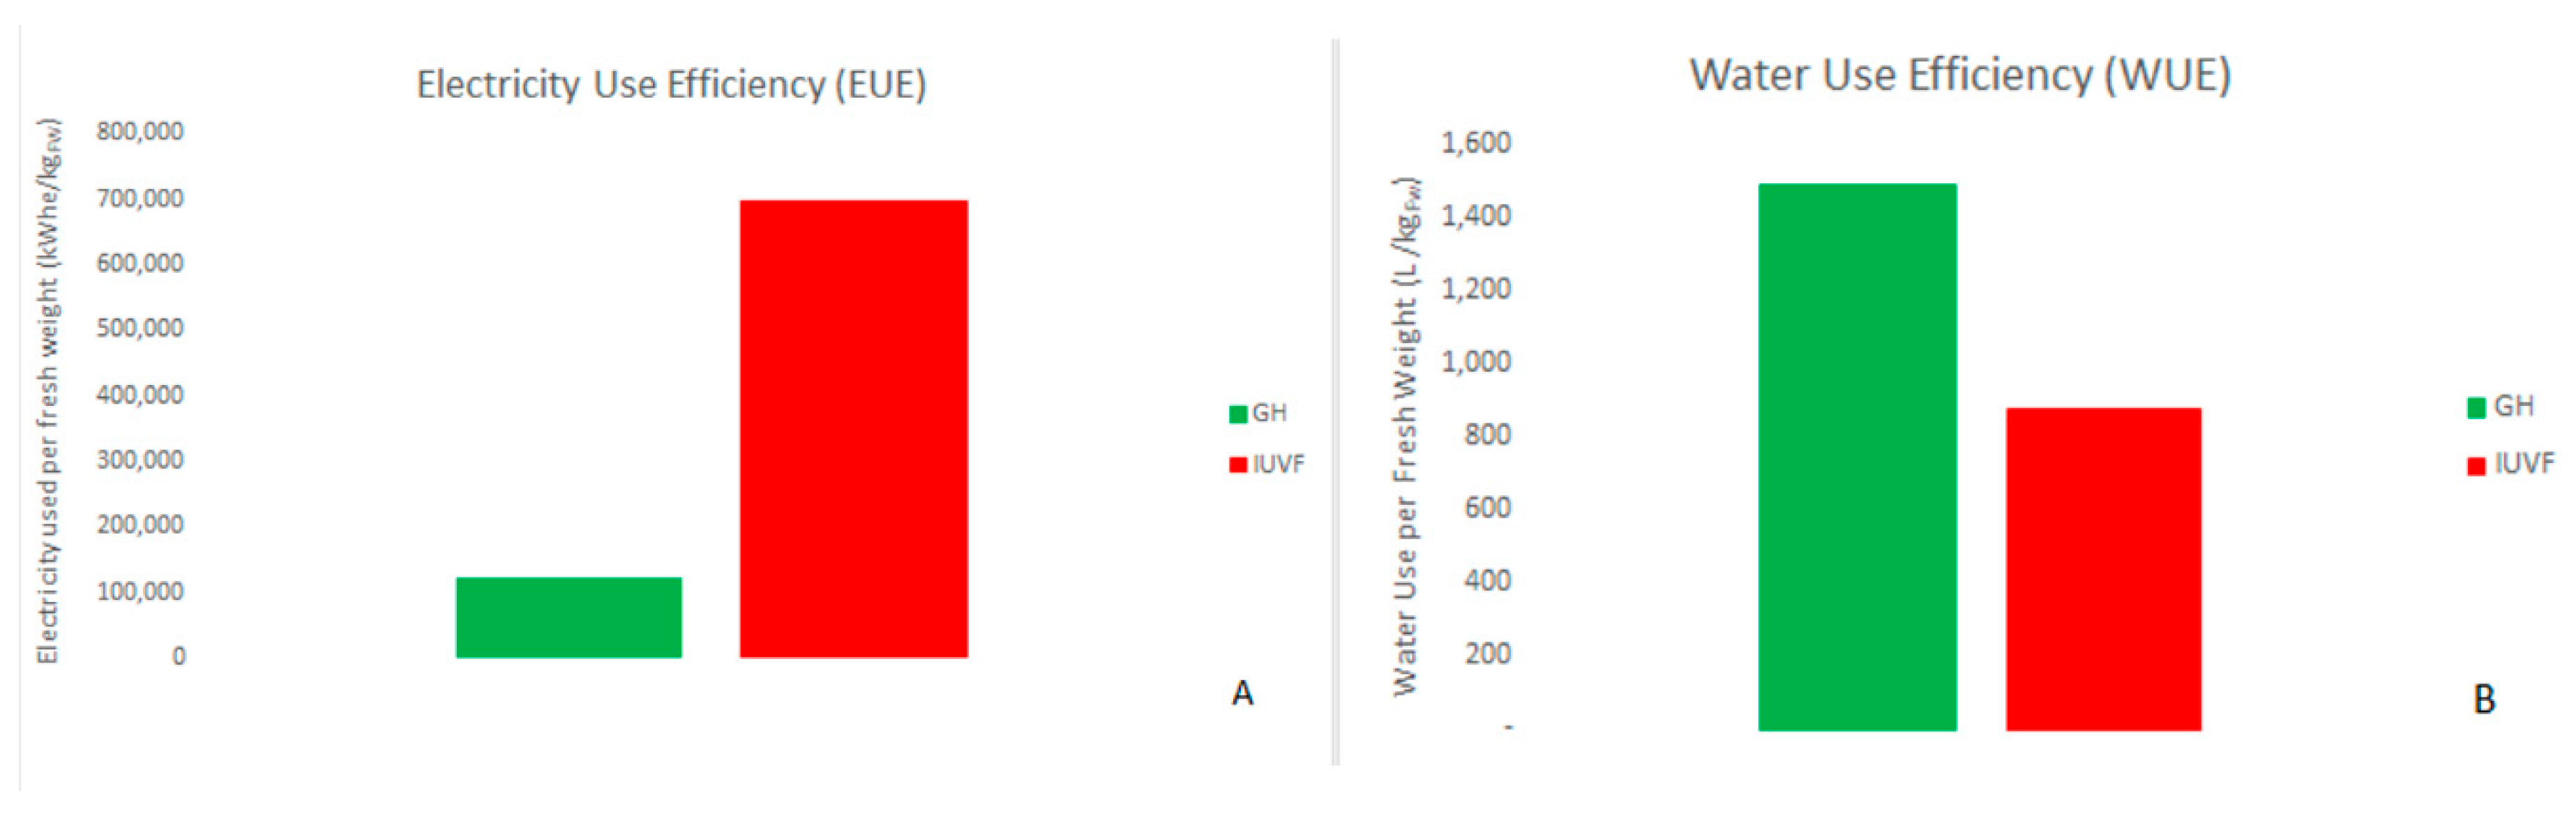
3.5. Resource Use Efficiency
According to the model calculation, IUVF requires greater amounts of electricity to achieve optimal efficiency and biomass production (Table 2 and Table 3). The semi-closed GH facility allows and supports the use of available solar energy. Thus, the GH requires less purchased energy to operate than the IUVF facility; the GH requires 83% more electricity than the IUVF facility.
3.6. CAPEX and OPEX
In Table 4 below, the modeling results for the CAPEX of an indoor urban vertical farm in the Aarhus area are presented. The local rental prices and electricity prices in Denmark have been taken into account. The first column shows the CAPEX cost per grow unit for cultivating basil only, while the second column provides the percentage of each capital expenditure out of the total CAPEX. In Table 4, both examined cases of a greenhouse and subsequently the case of the vertical farm (IUVF) are presented.
One of the major CAPEX related to installing the two vertical farms is the acquisition and wiring of LED lamps. However, the two selected plant species do not have different values, as the desired density and the yield of the plants do not affect the actual installation at the facilities. Table 4 shows that the acquisition and wiring of the LEDs represent 32% of the total CAPEX for the GH, while this number rises up to 65% for the case of the IUVF. Table 5 presents the OPEX for the GH and IUVF basil production.
Table 5 provides the differences in OPEX between GH and IUVF for basil production. In particular, there are significant differences in the quantity of nutrients used at each facility. As mentioned by Birkby (2016) and Xydis et al. (2020) [59,60], IUVF facilities consume less water and nutrients compared to even hydroponic GHs while at the same time increasing the crop growth. In the presented model, it is assumed that an IUVF facility uses 50% less nutrient solution than a semi-closed GH because it operates in a closed-loop cultivation system with virtually no input wastes. In this environment, the plants constantly obtain minerals for their growth. Therefore, growing and harvesting times of plants in IUVF facilities can be increased up to 10 times annually compared to traditional farming, and 2–3 times annually compared to GHs [61].
4. Cash Flow Analysis: Scenarios Proposed
For the basic scenario, it was assumed that we received a loan from a Danish bank, which would cover the CAPEX listed in Table 5. According to analysts in the Danish agricultural market [61], banks and mortgage banks are the most important and vital sources of funding in Denmark. Since there is no government subsidy, the approved loan covering 50% of the total initial investment (the other 50% is equity financing) is only taken into account in the vertical farm basic scenario. The loan was fully amortized over 10 years, following periodic payments into a sinking fund, depending on the market rules. The loan was used to cover the CAPEX for the two farming facilities. The calculations below were made to estimate the gross profit of these facilities.
The operating cash flow (OCF) was calculated by the following equation:
where To is the turnover. In the event that extra private equity or a loan has to be fully repaid (depending on the size of the subsidy) from the total investment cost, IC represents the participation rate. In the examined case, the possibility of receiving a private equity was not examined. The unamortized value (UV) was given by the following equation:
where 0.6 ≤ a ≤ 0.7 (an equity of 60%-70% of the total IC).
According to Xydis (2013) [62], the depreciation rate A can be calculated using the formula:
where 15% represents the declining-balance method of depreciation.
The loan interest rate I is calculated by the following equation:
where i is the interest rate. The calculations are updated annually according to the loan balance. The loan amount needed for the payment of the loan L was calculated, while it was assumed that the interest rate i is given by the equation:
where Do is the monthly loan amount and N equals a 10-year loan repayment period.
From the above equations, the profits before taxes (PBT) were calculated:
where A is the depreciation rate.
The examined scenario includes the Danish Tax Agency’s third and higher taxation category: 74,753 ≤ Income ≤ above with a marginal tax rate of 56.5% (including labor market tax). From these data, the profit after tax (PAT) can be calculated by removing the tax factor on the profits before tax (PBT). As a result, the net cash flow (NCF) was calculated as follows:
Moreover, the final net cash flow (FNCF) equaled:
where NRA is the net repayment amount. Then, the conversion coefficient ratio of the current values (CVcoef) and the cumulative cash flow (for all 20 years) were calculated with the following equation:
where CDR is the capital discount rate and yr indicates the number of years. Finally, the current value of the final cash flow (CVFCF) was given by the formula:
which provides the NPV. Furthermore, the increasing revenues from the project were calculated, and last but not least, the IRR, which is a metric to estimate the viability of the proposed investments, was calculated.
5. Results
The scenarios examined intended to provide comparisons of two farming methods, GH and IUVF facility, for basil production. In all cases, the IUVF facility was the most successful in terms of productivity. In the default case examined, the 50-50 (equity/loan) approach was used. The 20-year cumulative gross profit and OPEX were 6,418,265€ and 3,977,610€, respectively, with a sweet basil price of 7.37€/kg. The IUVF project cost was estimated at 321,764 €, and for the investment, an interest rate of 6.50% was estimated. The NPV was calculated to be 911,317 € and the IRR to 34.74%, with the payback period to four years. In Table 4 and Table 5, the results are presented analytically for both the IUVF and GH facilities. The “Equity/loan/(subsidy) (price)” for scenario 1 states “50-50”, which means that 50% of the funding comes from equity financing and 50% from a bank loan (0% funding from other sources) at a basil price of 7.37 €/kg. In scenario 4, “20-50-30-8.37”, indicates that 20% of the funding comes equity financing, 50% from a bank loan, and 30% from other sources (e.g., crowdfunding) at a basil price of 8.37 €/kg.
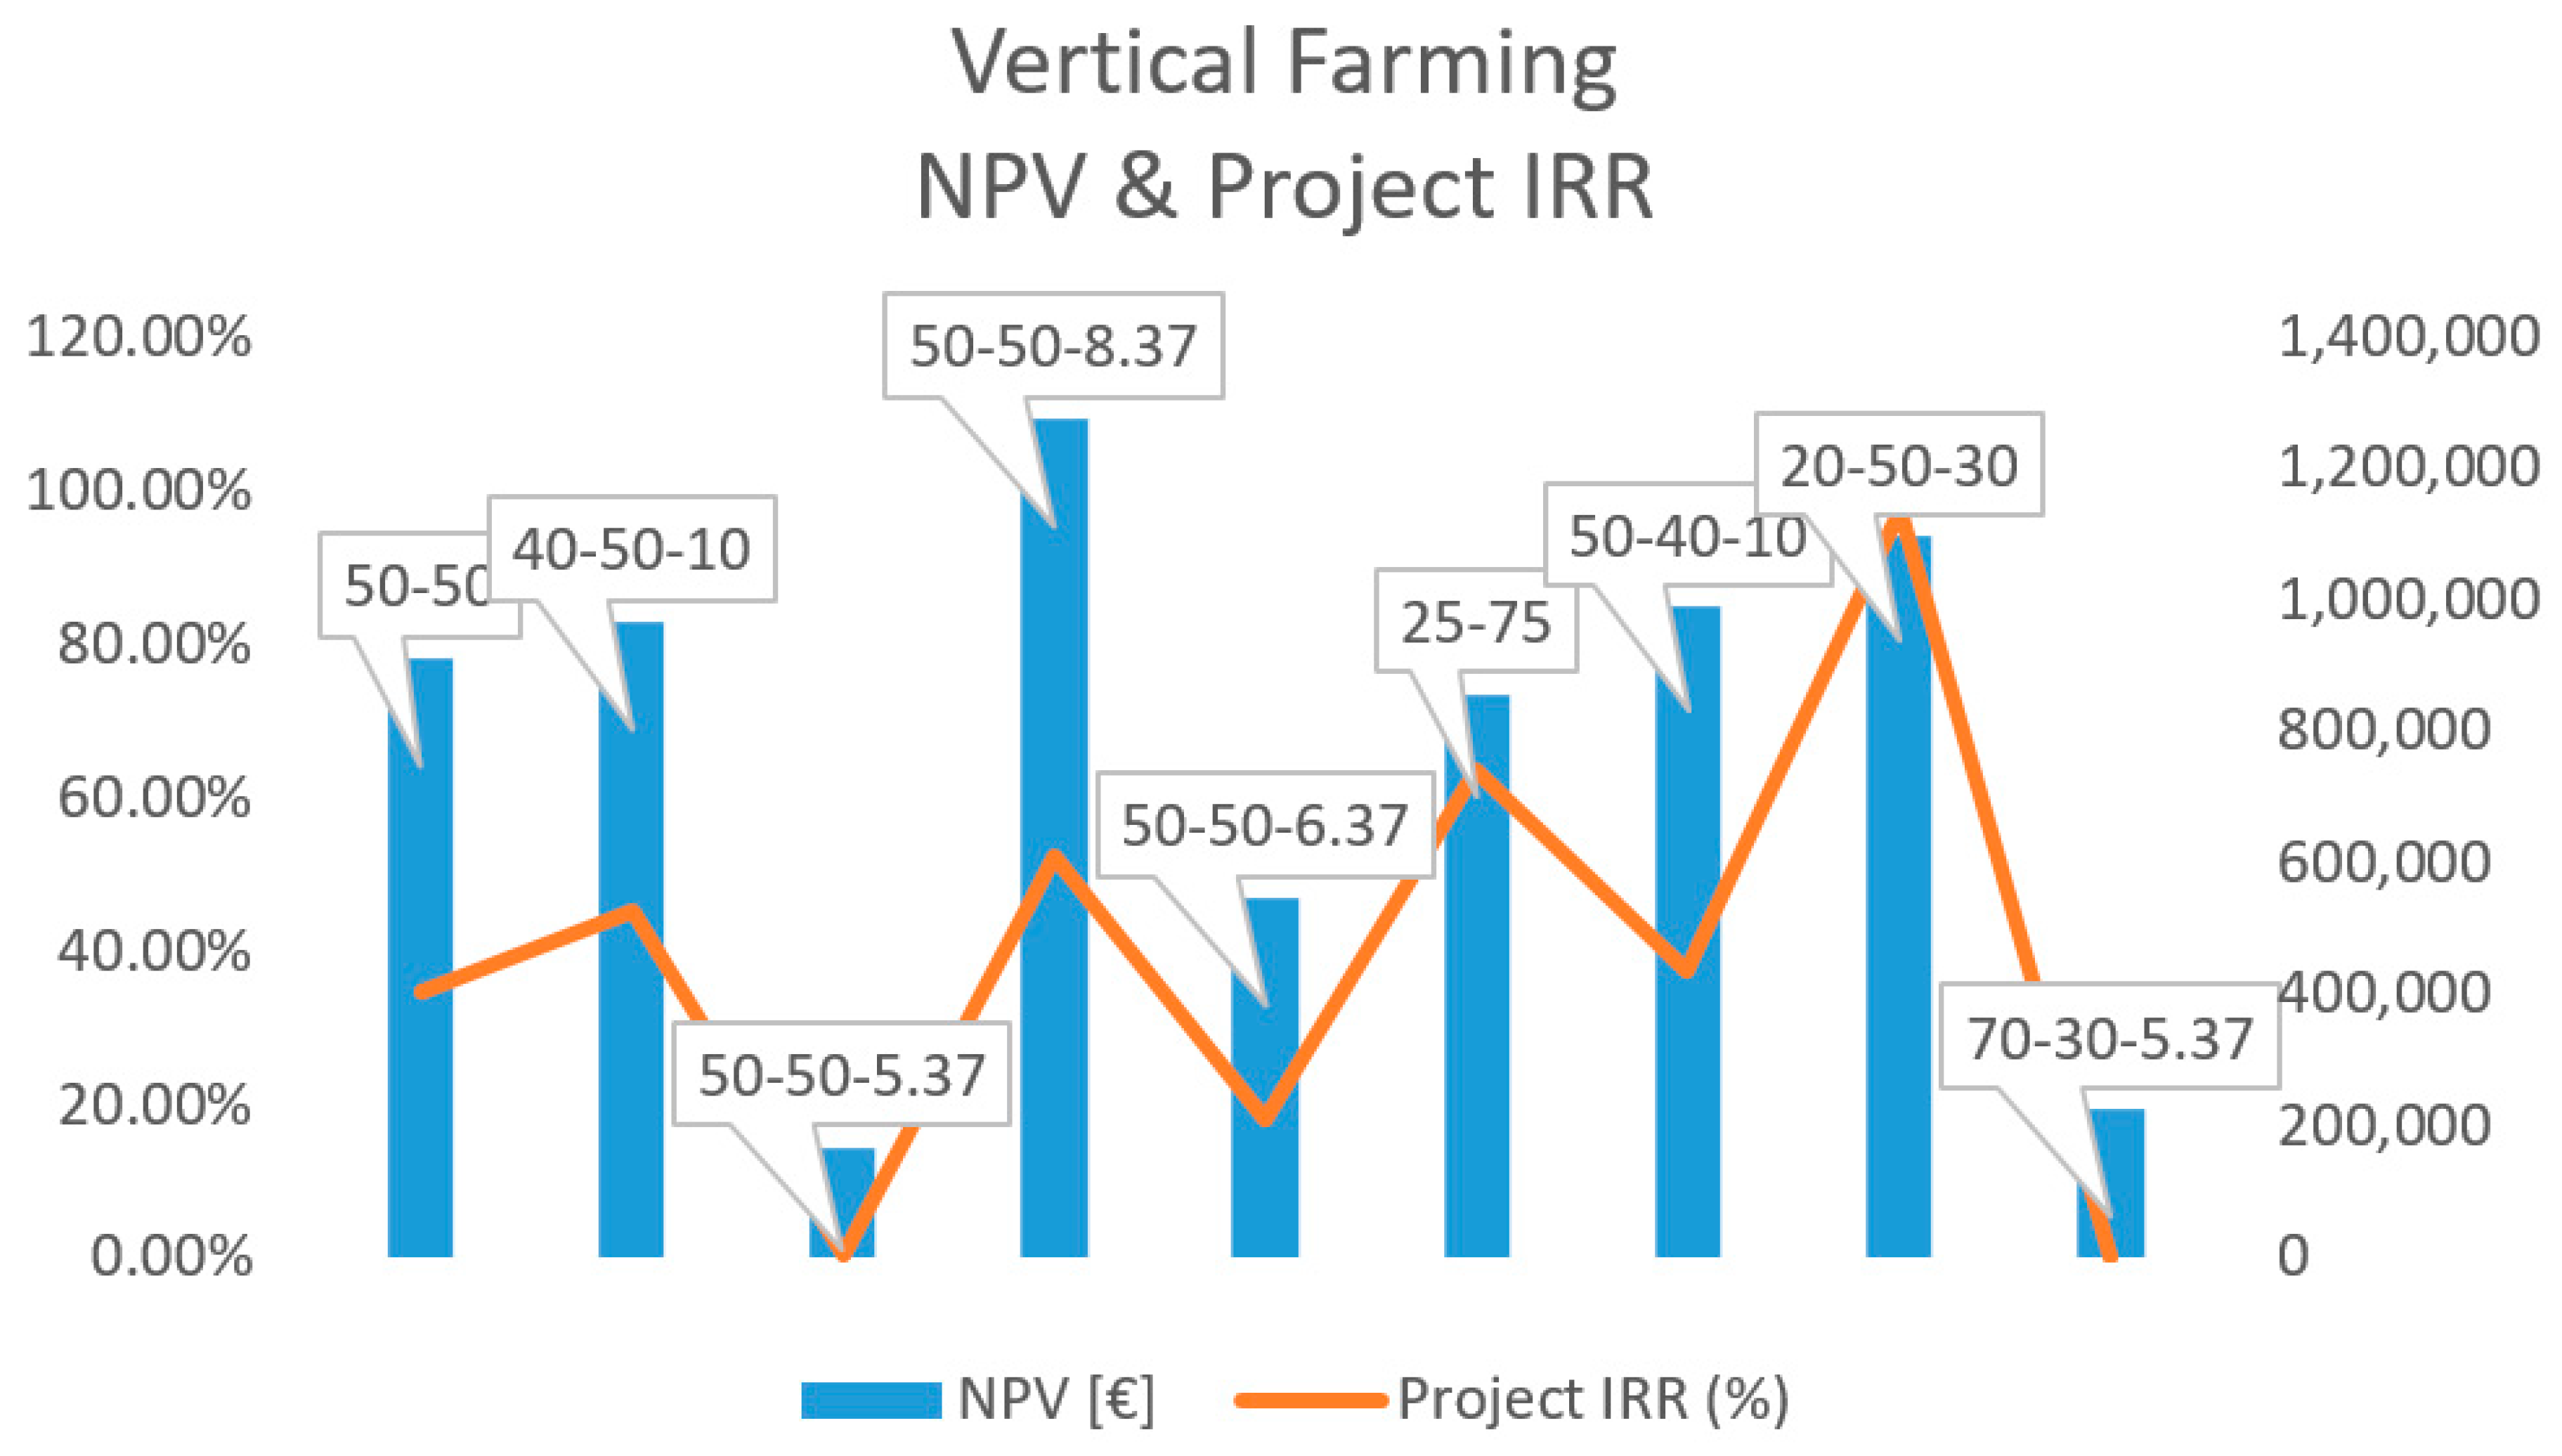
In Table 6 and Table 7, the results of the cash flow analysis of the IUVF facility are presented. The analysis shows that the 20-year cumulative gross profit increases with higher basil wholesale prices but also that the 20-year cumulative OPEX and the total costs of the project remain steady. It is seen that for the 50-50, 40-50-10, and 50-40-10 scenarios (all with a wholesale price of 7.37 €/kg), the differences are small in terms of IRR and NPV, with an equal payback period of four years. It should be noted that even with a wholesale price of 6.37 €/kg, the business is viable (with a payback period of six years) but is not at a lower price. If the wholesale price drops to 5.37 €/kg, the business is no longer profitable, and investors will have their money back in 21 years. Even with a different business plan, the result is the same (e.g., with an equity of 70%, a loan of 30%, and the same wholesale price (of 5.37€/kg)). The project’s IRR is 0.04%.
For Scenario 6 (which has an equity of 25%, a bank loan of 75%, and an interest rate of 6.25%), the results are even better (an IRR of 63.3%) with a three-year payback period. Lastly, in cases where supplementary funding is found (e.g., crowdsourcing or possible state subsidy), the cash flow analysis results show that the business is extremely profitable with a NPV value above 1 million €, an IRR of 97.5%, and a two-year payback period. Figure 3 comparatively illustrates the results of NPV and IRR of different funding scenarios of indoor urban vertical farms (IUVFs).
For the GH, the same analysis methodology was followed, similar scenarios were tested, and more scenarios were added compared to the IUVF case. In Table 8 and Table 9, the results are analytically presented.
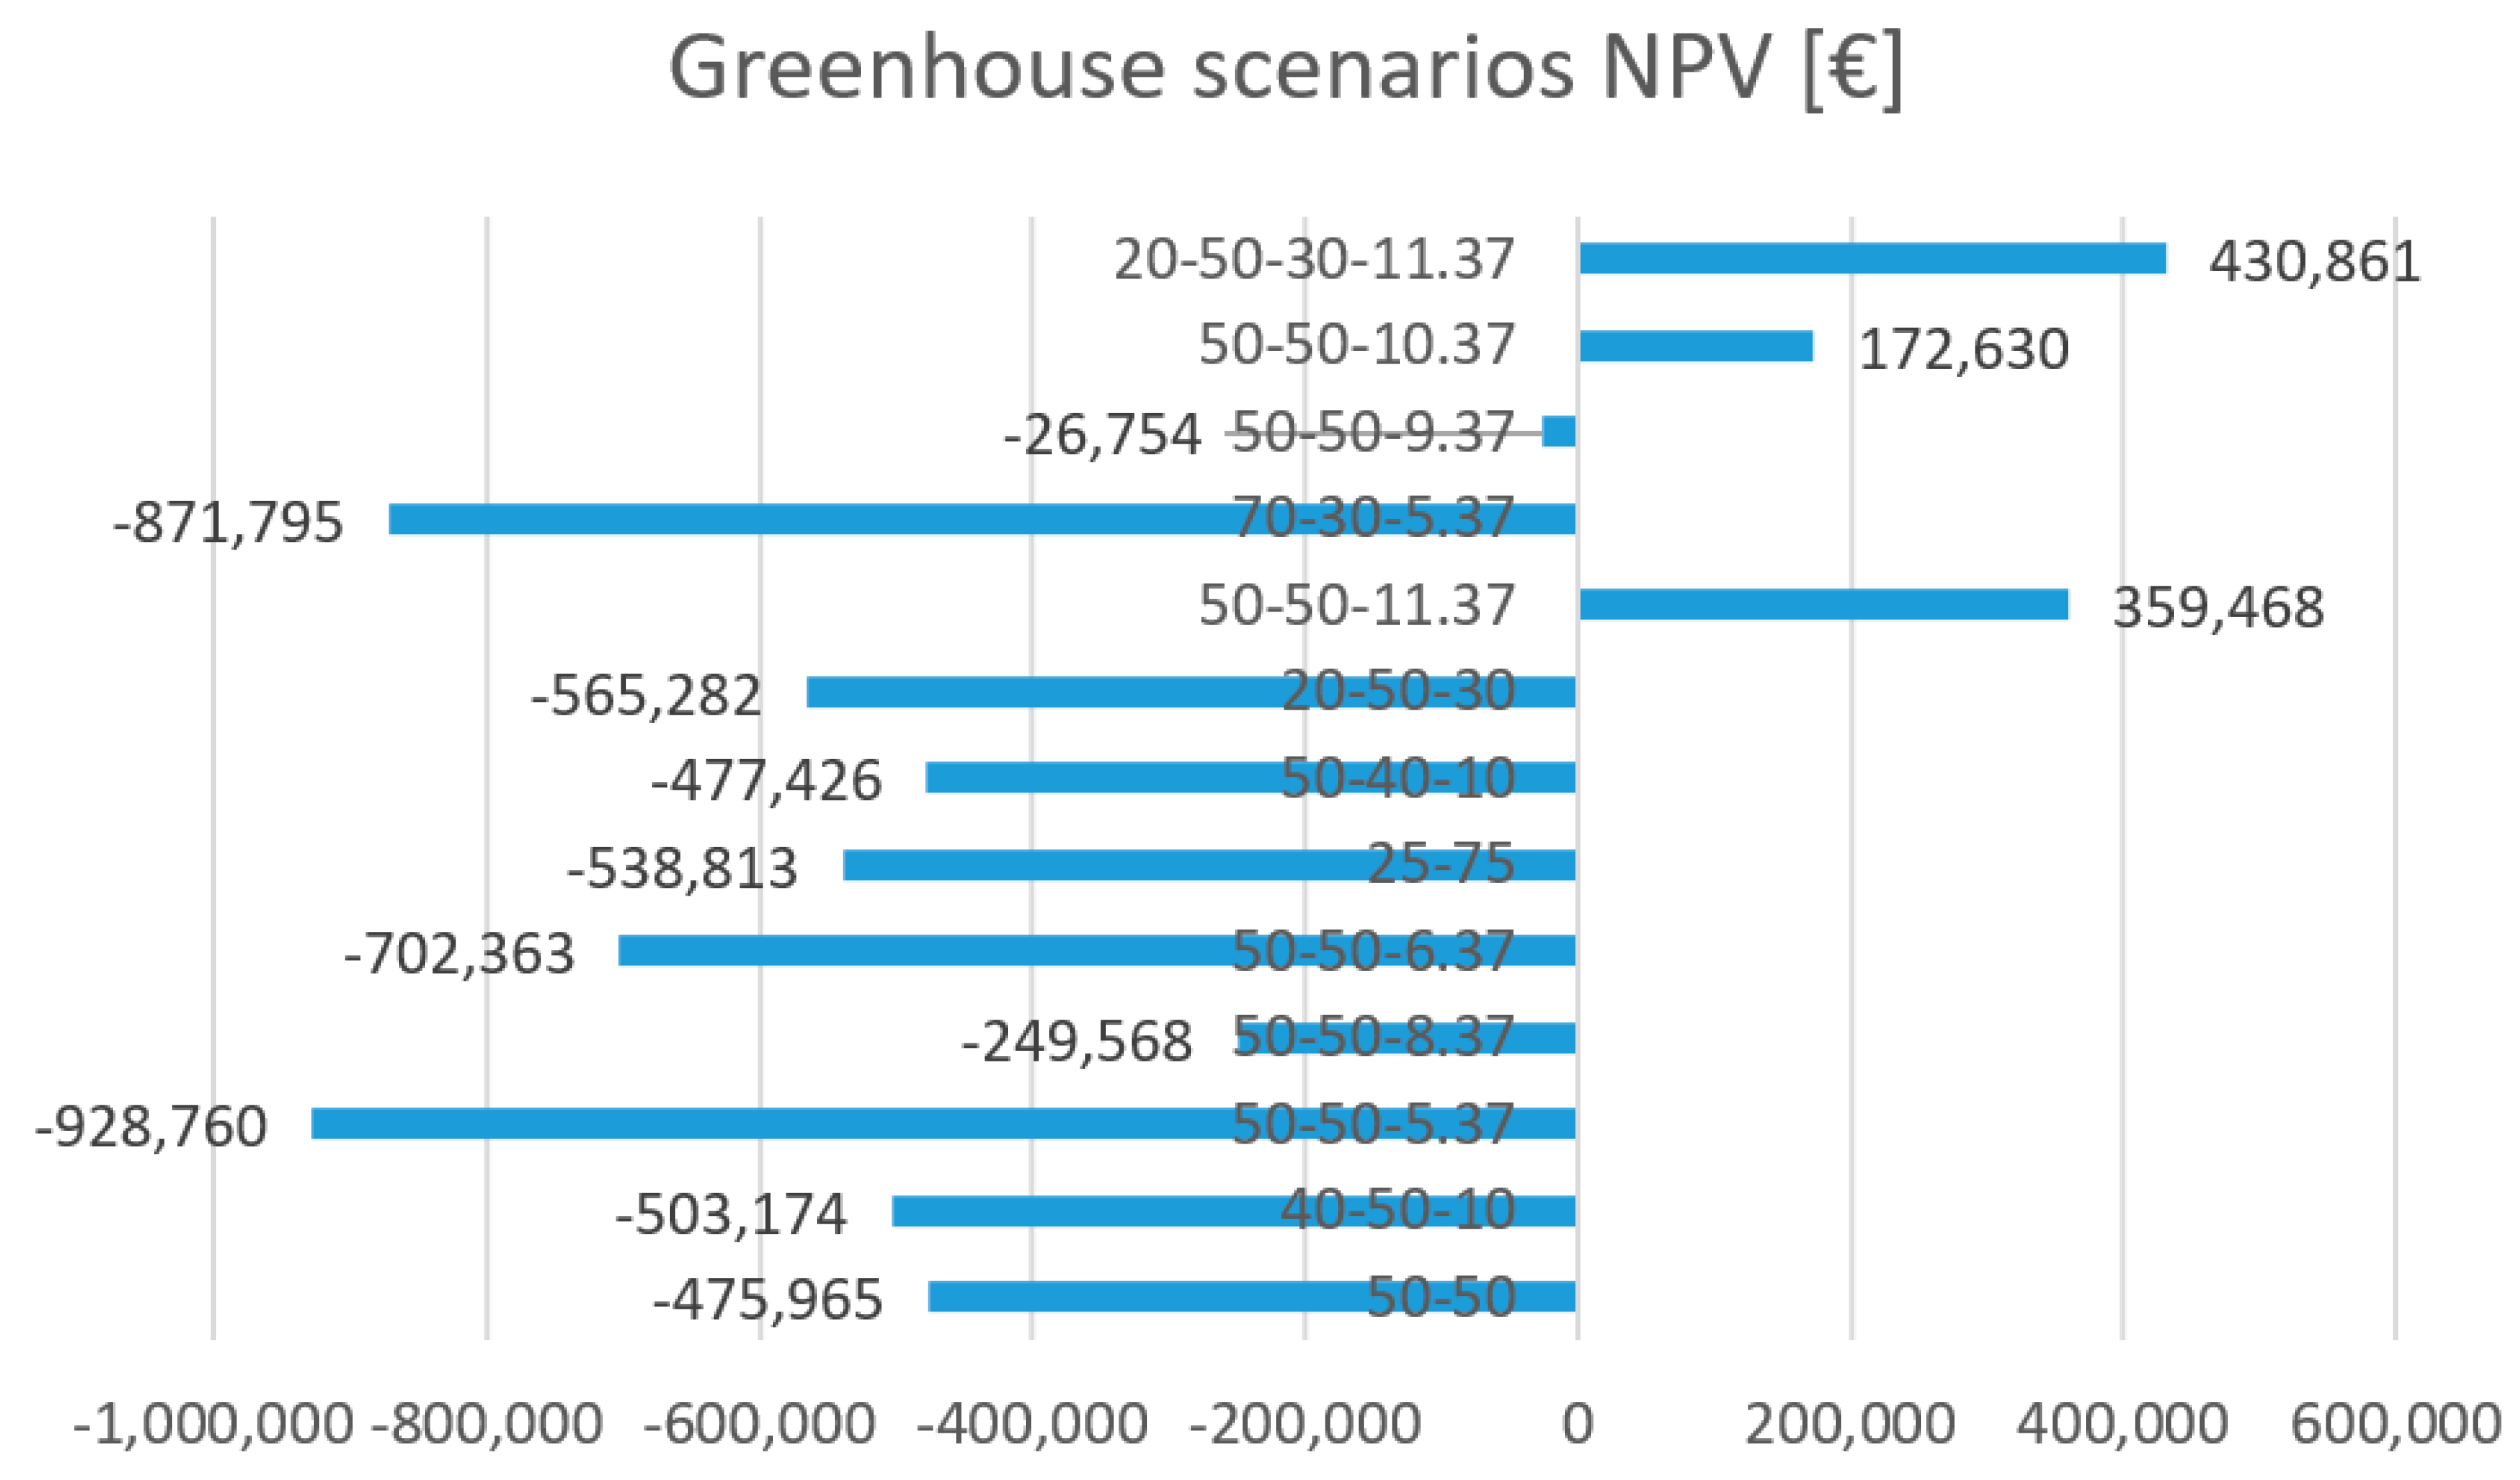
The analysis for the GH again shows that the 20-year cumulative gross profit increases with higher basil wholesale prices. In all the scenarios with wholesale prices lower than 9.37 €/kg (regardless of financial scheme, i.e., equity/loan/subsidy), the payback period is much longer than the operational duration of the project (more than 20 years). In practice, this means that the investors never get their capital back, and, for example, in the scenario “50-50-9.37”, the IRR is still −12.11%.
The NPV only turns positive with wholesale prices greater than or equal to 10.37 €/kg. In the scenario “50-50-10.37”, the project’s IRR reaches 4.64%, and the payback period is 15 years and is therefore still not considered the best investment option. If the wholesale price rises to 11.37 (shown as Figure 4), the business becomes profitable and the investors will get their money back within 7 or 3 years (the “20-50-30-11.37” and “50-50-11.37” scenarios with an IRR of 17.42% and 50.22%, respectively).
6. Discussion
Due to growing urban environments throughout the world, the financial opportunities and risks for commercial IUVF and GH facilities were compared for basil production in the Midtjylland region of Central Denmark. Due to the high fresh fruit and vegetable demand in Denmark [63] and great opportunity to use renewable energy [60], IUVF facilities were shown to provide a greater financial gain compared to GHs. By 2020, 30% of the energy in Denmark will be based on renewable energy sources [64], which provides the perfect opportunity to promote more sustainable food production systems in the country, resulting from food being produced closer to consumers, resulting in lower CO2 emissions.
Our study indicated that using IRR and NPV indexes, the IUVF facility can be a profitable and successful model of innovative and sustainable food production, as an investor can receive their investment back within a period of 3 to 6 years when the basil wholesale price is ≥ 6.36 €/kg. Thus, there is great opportunity in urban agriculture to include innovative production systems, such as IUVFs. However, although IUVFs are one innovative method to produce local food for megacities, there are many associated risks with such a venture. Production of fresh fruits and vegetables are low margin produce items that require relatively high initial capital investments and should be taken into consideration when contemplating an urban agriculture business that includes growing and marketing these products.
7. Conclusions
Using an adjusted model, taking into account the lower population density than in megacities, the aim of this study was to examine the business opportunities for vertical farms in Denmark and how these, with various adjustments, can be made a viable investment. Numerous scenarios were examined, and cash flow analyses were implemented and their results used to evaluate the scenarios based on NPV, IRR, and the payback period. It was found that regardless of financing scheme, the IUVF facility was much more profitable compared to the GH. In most of the GH cases examined, the investors cannot get their money back until the end of the operation in which they invest. In order to become a profitable GH investment, the wholesale price must be significantly higher (above 10 €/kg—a price which is objectively considered expensive in the market), and alternative funding, such as crowdfunding or a state subsidy, should be found. On the other hand, the investment opportunities for the IUVF facility (based on the cash flow analyses) were considered very interesting with high IRR rates and a payback period, in most cases, between 2-6 years.
Author Contributions
Conceptualization, G.X. and D.D.A.; methodology, G.X.; validation, G.X., D.D.A.; formal analysis, D.D.A.; investigation, D.D.A.; resources, G.X.; data curation, D.D.A.; writing—original draft preparation, D.D.A.; writing—review and editing, G.X.; visualization, G.X.; supervision, G.X. All authors have read and agreed to the published version of the manuscript.
Funding
This research received no external funding.
Conflicts of Interest
The authors declare no conflict of interest.
References
- Angel, S.; Parent, J.; Civco, D.L.; Blei, A.; Potere, D. The dimensions of global urban expansion: Estimates and projections for all countries, 2000–2050. Prog. Plan. 2011, 75, 53–107. [Google Scholar] [CrossRef]
- Lagos Population. Available online: http://worldpopulationreview.com/world-cities/lagos/ (accessed on 28 February 2019).
- Food and Agriculture Organization of the United Nations, International Fund for Agricultural Development, World Food Programme, The State of Food Insecurity in the World 2015. In Proceedings of the Meeting the 2015 international hunger targets: Taking Stock of Uneven Progress; FAO: Rome, Italy, 2015.
- Fuldauer, L.I.; M. Parker, B.M.; Yaman, R.; Borrion, A. Managing anaerobic digestate from food waste in the urban environment: Evaluating the feasibility from an interdisciplinary perspective. J. Clean. Prod. 2018, 185, 929–940. [Google Scholar] [CrossRef]
- Manos, D.P.; Xydis, G. Hydroponics: Are we moving towards that direction only because of the environment? A discussion on forecasting and a systems review. Environ. Sci. Pollut. Res. 2019, 26, 12662–12672. [Google Scholar] [CrossRef] [PubMed]
- Cuesa. Center for Urban Education about Sustainable Agriculture, USA, San Francisco. Available online: https://cuesa.org/learn/how-far-does-your-food-travel-get-your-plate (accessed on 8 November 2019).
- Blanke, M.M.; Burdick, B. Food (miles) for Thought; Energy Balance for Locally-grown versus Imported Apple Fruit. Environ. Sci. Pollut. Res. 2005, 12, 125–127. [Google Scholar] [CrossRef] [PubMed]
- UN Environment. Annual Report Putting the Environment at the Heart of People’s Lives; United Nations Environment Programme: Nairobi, Kenya, 2018. [Google Scholar]
- George Mason University. Agricultural Weather Research Holds Promise for Global Food Production; George Mason University: Fairfax, VA, USA, 28 March 2012; Available online: http://cos.gmu.edu/news/fall-2011/agricultural-weather-research-holds-promise-global-food-production (accessed on 8 October 2012).
- Li, C. Crop Diversity for Yield Increase. PLoS ONE 2009, 4. Available online: http://www.plosone.org/article/info%3Adoi%2F10.1371%2Fjournal.pone.0008049 (accessed on 1 November 2019). [CrossRef] [Green Version]
- Food and Agriculture Organization of the United Nations, 2016, FAOSTAT Database, FAO. Available online: www.fao.org/faostat (accessed on 1 December 2016).
- OECD Organisation for Economic Co-Operation and Development. Available online: https://stats.oecd.org/Index.aspx?DataSetCode=AIR_GHG (accessed on 15 November 2019).
- WWF Report, WWF: Denmark Has World’s Fourth Largest Ecological Footprint. Available online: http://cphpost.dk/news/international/wwf-denmark-has-worlds-fourth-largest-ecological-footprint.html (accessed on 15 November 2019).
- US Department of Seeberg Energy. Annual Energy Outlook; U.S. Energy Information Administration: Washington, DC, USA, 2014.
- Tropp, D. Why Local Food Matters: The Rising Importance of Locally-Grown Food in the US Food System (No. 160752); United States Department of Agriculture, Agricultural Marketing Service, Transportation and Marketing Program: Washington, DC, USA, 2019.
- Markets and Markets. Commercial Greenhouse Market by Equipment (Heating Systems, Cooling Systems, and Others), Type (Glass Greenhouse, Plastic Greenhouse and Others), Crop Type, & by Region—Global Trends & Forecasts to 2020. Available online: https://www.marketsandmarkets.com/Market-Reports/commercial-greenhouse-market-221045451.html (accessed on 25 October 2017).
- Statista Denmark: Import of Goods from 2007 to 2017. Available online: https://www.statista.com/statistics/318299/import-of-goods-to-denmark/ (accessed on 15 November 2019).
- Food and Agriculture Organization of the United Nations. (2011). Rome, Italy. Available online: http://www.fao.org/3/a-i2050e.pdf. (accessed on 15 October 2019).
- Xydis, G.; Liaros, S.; Botsis, K. Energy demand analysis via small scale hydroponic systems in suburban areas—An integrated energy-food nexus solution. Sci. Total Environ. 2017, 593, 610–617. [Google Scholar] [CrossRef] [Green Version]
- Kozai, T. Sustainable Plant Factory: Closed Plants Production System with Artificial Light for High Resource Use Efficiencies and Quality Produce. Acta Hortic. 2013, 1004, 27–40. [Google Scholar] [CrossRef]
- Barrett, D.M. Maximizing the Nutritional Value of Fruits and Vegetables. Review of literature on nutritional value of produce compares fresh, frozen, and canned products and indicates areas for further research. Food Technol. 2007, 61, 40–44. [Google Scholar]
- Togawa, T.; Fujita, T.; Dong, L.; Fujii, M.; Ooba, M. Feasibility assessment of the use of power plant-sourced waste heat for plant factory heating considering spatial configuration. J. Clean. Prod. 2014, 81, 60–69. [Google Scholar] [CrossRef]
- Avgoustaki, D.D. Optimization of Photoperiod and Quality Assessment of Basil Plants Grown in a Small-Scale Indoor Cultivation System for Reduction of Energy Demand. Energies 2019, 12, 3980. [Google Scholar] [CrossRef] [Green Version]
- Yang, Q.; Li, Z.; Lu, X.; Duan, Q.; Huang, L.; Bi, J. A review of soil heavy metal pollution from industrial and agricultural regions in China: Pollution and risk assessment. Sci. Total Environ. 2019, 642, 690–700. [Google Scholar] [CrossRef] [PubMed]
- United Against Food Waste. Available online: http://unitedagainstfoodwaste.com/facts-about-food-waste.html (accessed on 15 November 2019).
- Halloran, A.; Clement, J.; Kornum, N.; Bucatariu, C.; Magid, J. Addressing food waste reduction in Denmark. Food Policy 2014, 49, 294–301. [Google Scholar] [CrossRef]
- Nordic Council of Ministers. Initiatives on Prevention of Food Waste in the Retail and Wholesale Trades; Nordic Council of Ministers: Copenhagen, Denmark, 2011. [Google Scholar]
- Kozai, T.; Nio, G.; Tagakaki, M. Plant Factory as a Resource-Efficient Closed Plant Production System. In Plant Factory an Indoor Vertical Farming System for Efficient Quality Food Production; Academic Press: London, UK, 2016; pp. 69–90. [Google Scholar]
- Zhiyan Consulting Group 2013–2018 China IVD Industry Research and Investment Strategy Consultation Report; ReportLinker: HongKong, China, August 2013.
- ReportsnReports. Vertical Farming Market by Growth Mechanism (Hydroponics, Aeroponics and Aquaponics), Structure (Building Based and Shipping Container), Offering (Hardware, Software and Service), Crop Type, and Geography—Global Forecast to 2022. Available online: http://www.reportsnreports.com/reports/457086-vertical-farming-market-by-functional-device-lighting-hydroponic-componentclimate-control-and-sensors-growth-mechanism-aeroponics-hydroponics-and-others-and-bygeography-global-forecast-to-2020.html (accessed on 6 November 2019).
- Avgoustaki, D.D.; Xydis, G. Plant Factories in the Water-Food-Energy Nexus Era: A Systematic Bibliographical Review. Food Secur. 2020, 1–16. [Google Scholar] [CrossRef]
- Danish Energy Agency Energy in Denmark. Data, Tables, Statistics and Maps. Available online: https://ens.dk/sites/ens.dk/files/Statistik/energy_in_denmark_2016.pdf (accessed on 15 November 2019).
- Kaad-Hansen, L. Organic Denmark. Facts and Figures about Danish Organics. Available online: https://www.organicdenmark.com/facts-figures-about-danish-organics (accessed on 20 November 2019).
- The Local/Ritzau. Danish House Prices Reach Highest Ever Level, Beating 11-Year Record. Available online: https://www.thelocal.dk/20190318/danish-house-prices-reach-highest-ever-level-beating-11-year-record (accessed on 20 November 2019).
- Storey, A. Growing Hydroponic Basil? Powered by Plenty. Available online: https://university.upstartfarmers.com/blog/hydroponic-basil (accessed on 20 November 2019).
- Liaros, S.; Botsis, K.; Xydis, G. Technoeconomic Evaluation of Urban Plant Factories: The Case of Basil (Ocimum basilicum). Sci. Total Environ. 2016, 554, 218–227. [Google Scholar] [CrossRef]
- US Department of Energy. Annual Energy Outlook (AEO); U.S. Energy Information Administration: Washington, DC, USA, 2015.
- Adenaeuer, L. Up, Up and Away! The Economics of Vertical Farming. J. Agric. Stud. 2014, 2, 40–59. [Google Scholar] [CrossRef]
- Dou, H.; Niu, G.; Gu, M.; Masabni, J.G. Responses of Sweet Basil to Different Daily Light Integrals in Photosynthesis, Morphology, Yield, and Nutritional Quality. Hortic. Sci. 2018, 53, 496–503. [Google Scholar] [CrossRef]
- Beamman, A.R.; Gladon, R.J.; Schrader, J.A. Sweet Basil Requires an Irradiance of 500 μ mol·m-2·s-1 for Greatest Edible Biomass Production. HortScience 2009, 44, 64–67. [Google Scholar] [CrossRef] [Green Version]
- Colorado Energy. R-Value Table Insulation Values for Selected Materials. Available online: http://www.coloradoenergy.org/procorner/stuff/r-values.htm (accessed on 6 November 2019).
- Graamans, L.; Baeza, E.; Van Den Dobbelsteen, A.; Tsafaras, I.; Stanghellini, C. Plant factories versus greenhouses: Comparison of resource use efficiency. Agric. Syst. 2017, 160, 31–43. [Google Scholar] [CrossRef]
- Chalabi, M. Vertical farming: Skyscraper sustainability? Sustain. Cities Soc. 2015, 18, 74–77. [Google Scholar] [CrossRef]
- Naus, T. Is Vertical Farming Really Sustainable? EIT Food. Available online: https://www.eitfood.eu/blog/post/is-vertical-farming-really-sustainable (accessed on 7 November 2019).
- Pennisi, G.; Orsini, F.; Blasioli, S.; Cellini, A.; Crepaldi, A.; Braschi, I.; Spinelli, F.; Nicola, S.; Fernandez, J.A.; Stanghellini, C.; et al. Resource use efficiency of indoor lettuce (Lactuca sativa L.) cultivation as affected by red:blue ratio provided by LED lighting. Sci. Rep. 2019, 9, 14127. [Google Scholar] [CrossRef]
- Department of Primary Industries; Australian Government; Australian Centre for International Agriculture Research. Available online: https://www.dpi.nsw.gov.au/__data/assets/pdf_file/0019/470026/Lettuce-gross-margin-budget.pdf (accessed on 27 February 2020).
- Trading Economics. Available online: https://tradingeconomics.com/denmark/labour-costs (accessed on 7 November 2019).
- Real Estate Agency. Available online: https://www.matchoffice.com/dk/lease/warehouses/8200-aarhus-n (accessed on 7 November 2019).
- Dorward, A. Agricultural labour productivity, food prices and sustainable development impacts and indicators. Food Policy 2013, 39, 40–50. [Google Scholar] [CrossRef] [Green Version]
- Tiseo, I. Available online: https://www.statista.com/statistics/418075/electricity-prices-for-households-in-denmark/ (accessed on 7 November 2019).
- Eaves, J.; Eaves, S. Comparing the Profitability of a Greenhouse to a Vertical Farm in Quebec. Can. J. Agric. Econ. 2018, 66, 43–54. [Google Scholar] [CrossRef]
- HydroQuebec. Available online: http://www.hydroquebec.com/business/customer-space/rates/rate-g-general-rate-small-power.html (accessed on 7 November 2019).
- Basil Production. Department: Agriculture, Forestry and Fisheries, Republic of South Africa; Directorate Communication Services: Pretoria, South Africa, 2012. [Google Scholar]
- Raimodi, G.; Orsini, F.; Maggio, A.; De Pascale, S. Yield and quality of hydroponically grown sweet basil cultivars. Acta Hortic. 2006, 723, 357–360. [Google Scholar] [CrossRef]
- UC Davis [WIFSS] Western Institute for Food Safety and Security Basil. Available online: https://www.wifss.ucdavis.edu/wp-content/uploads/2016/10/Basil_PDF.pdf (accessed on 15 November 2019).
- Basil Wholesale Price around the World. Available online: https://www.tridge.com/intelligences/basil (accessed on 7 November 2019).
- Runkle, E.; Bugbee, B. Plant Lighting Efficiency and Efficacy: Μmols Per Joule. Available online: https://gpnmag.com/article/plant-lighting-efficiency-and-efficacy-%CE%BCmol%C2%B7j-%C2%B9/ (accessed on 7 November 2019).
- Putievsky, E.; Galambosi, B. Production Systems of Sweet Basil. In Basil: The Genus Ocimum; Hiltunen, R., Holm, Y., Eds.; Harwood Academic Publishers: Amsterdam, The Netherlands, 1999; pp. 39–61. [Google Scholar]
- Birkby, J. Vertical Farming. The World’s Largest Indoor Vertical Farm Is Coming to New Jersey. ATTRA Sustain. Agric. 2016, 1–12. [Google Scholar]
- Xydis, G.; Liaros, S.; Avgoustaki, D.D. Small Scale Plant Factories with Artificial Lighting and Wind Energy Microgeneration: A Multiple Revenue Stream Approach. J. Clean. Prod. 2020, 255, 120227. [Google Scholar] [CrossRef]
- Pedersen, E.H. Danish Agriculture. Danmarks Nationalbank. In Monetary Review, 2nd ed.; Quarter: Copenhagen, Denmark, 2014; pp. 63–69. [Google Scholar]
- Xydis, G. A techno-economic and spatial analysis for the optimal planning of wind energy in Kythira island, Greece. Int. J. Prod. Econ. 2013, 146, 440–452. [Google Scholar] [CrossRef] [Green Version]
- Growth, M.V.; Fagt, S.; Brøndsted, L. Social determinants of dietary habits in Denmark. Eur. J. Clin. Nutr. 2001, 55, 959–966. [Google Scholar] [CrossRef]
- Denmark.dk Pioneers in Clean Energy. Available online: https://denmark.dk/innovation-and-design/clean-energy (accessed on 20 February 2020).
Figure 1.
Total annual yield produced under the two cultivation facilities (red: indoor urban vertical farming—IUVF; green: greenhouse—GH) [43,57,59].

Figure 2.
Resource use efficiency for a) electricity and B) water in a GH and an IUVF facility.

Figure 3.
Comparative results of the various IUVF scenarios.

Figure 4.
Comparative net present value (NPV) results of the various GH scenarios.


Table 1.
General case study assumptions.
| GH | IUVF | Unit | Citation | |
|---|---|---|---|---|
| Real estate | ||||
| Lease | 25.76 | 31.5 | €/m2 | [48] |
| Width of building | 18.3 | 15 | m | |
| Length of building | 91.5 | 15 | m | |
| Height of building | 4.6 | 7.5 | m | |
| Growing space | 675 | 675 | m2 | |
| Grow levels | 1 | 6 | ||
| Growth-unit size | 1.5 | 1.5 | m2 | |
| Labor | ||||
| Laborers/10,000 kg yield | 0.18 | 0.18 | person | [49] |
| Hourly cost of labor | 43.5 | 43.5 | €/h | [47] |
| Electricity | ||||
| Electricity cost (500–2000 MWh) | 0.18823 | 0.18823 | €/kWh | [50] |
| Electricity cost (20,000–70,000) | 0.10086 | 0.10086 | €/kWh | [50] |
| Internal electricity distribution capital cost | 0.45 | 0.45 | €/W | [51] |
| Electricity demand charge | 13 | 13 | €/kW | [52] |
| Utility electricity distribution capital cost | 0.30 | 0.30 | €/W | [51] |
| Plants: Basil | ||||
| Harvest/year | 5 | 10 | [53] | |
| Yield/harvest | 2 | 5 | kg/m2 | [54,55] |
| Wholesale price | 7.37 | 7.37 | €/kg | [56] |
| LED price | 1.48 | 1.48 | € | |
| LED efficacy: photosynthetic photon efficacy (PPE) | 4.8 | 4.8 | μmol/J | [57] |
| Heating and cooling | ||||
| Ventilation system | 0.986 | 0.986 | €/W | [51] |
| Heating system capital cost | 0.0208 | 0.0208 | €/W | [51] |
Table 2.
Total monthly electricity consumption used in the GH facility with basil. [51].
Table 2.
Total monthly electricity consumption used in the GH facility with basil. [51].
| Electricity (kWh) | ||||||||
|---|---|---|---|---|---|---|---|---|
| Tout (°C) | Tin (°C) | DLI (mol/m2/d) | NG Heat (m3) | Ventilation | LED Lighting | A/C Cooling | Total Electricity | |
| Jan | 0.0 | 18.3 | 25.2 | 4738 | 8 | 24,517 | 0 | 24,524 |
| Feb | 1.0 | 18.3 | 28.8 | 3136 | 7 | 14,991 | 0 | 14,998 |
| Mar | 3.0 | 18.3 | 32 | 3037 | 8 | 7237 | 0 | 7245 |
| April | 6.0 | 21.1 | 31.5 | 2139 | 13 | 0 | 0 | 13 |
| May | 12.0 | 21.1 | 27 | 1330 | 13 | 0 | 0 | 13 |
| June | 15.0 | 21.1 | 22.5 | 0 | 13 | 0 | 2769 | 2781 |
| July | 17.0 | 21.1 | 19.8 | 0 | 91 | 0 | 2794 | 2886 |
| Aug | 17.0 | 21.1 | 15.3 | 0 | 91 | 0 | 3573 | 3665 |
| Sep | 14.0 | 21.1 | 12.6 | 386 | 88 | 4913 | 0 | 5002 |
| Oct | 10.0 | 18.3 | 14.4 | 1717 | 21 | 11,557 | 0 | 11,578 |
| Nov | 5.0 | 18.3 | 17.7 | 3081 | 20 | 21,636 | 0 | 21,656 |
| Dec | 2.0 | 18.3 | 21.6 | 3782 | 21 | 28,837 | 0 | 28,858 |
| Total | 23,345 | 396 | 113,686 | 9136 | 123,218 | |||
Table 3.
Total monthly electricity consumption in the IUVF facility with basil.
| Electricity (kWh) | ||||||||
|---|---|---|---|---|---|---|---|---|
| Tout (°C) | Tin (°C) | DLI (mol/m2/d) | NG Heat (m3) | Ventilation | LED Lighting | A/C Cooling | Total Electricity | |
| Jan | 0.0 | 18.3 | 0 | 3823 | 4 | 59,076 | 0 | 59,081 |
| Feb | 1.0 | 18.3 | 0 | 4830 | 4 | 53,359 | 0 | 53,363 |
| March | 3.0 | 18.3 | 0 | 3296 | 4 | 59,076 | 0 | 59,081 |
| April | 6.0 | 21.1 | 0 | 3442 | 4 | 57,171 | 0 | 57,175 |
| May | 12.0 | 21.1 | 0 | 2638 | 4 | 59,076 | 0 | 59,081 |
| June | 15.0 | 21.1 | 0 | 1942 | 4 | 57,171 | 2041 | 59,261 |
| July | 17.0 | 21.1 | 0 | 263 | 29 | 59,076 | 1950 | 61,055 |
| Aug | 17.0 | 21.1 | 0 | 298 | 29 | 59,076 | 3273 | 62,378 |
| Sep | 14.0 | 21.1 | 0 | 29 | 28 | 57,171 | 0 | 57,199 |
| Oct | 10.0 | 18.3 | 0 | 706 | 4 | 59,076 | 0 | 59,081 |
| Nov | 5.0 | 18.3 | 0 | 1862 | 4 | 57,171 | 0 | 57,175 |
| Dec | 2.0 | 18.3 | 0 | 3096 | 4 | 59,076 | 0 | 59,081 |
| Total | 26,225 | 125 | 695,576 | 7265 | 702,966 | |||
Table 4.
Capital expenditures (CAPEX) for GH and IUVF basil production.
| GH | IUVF | |||
|---|---|---|---|---|
| Cost (€) per Grow Unit | Total in % | Cost (€) per Grow Unit | Total in % | |
| Lights | 180.87 | 21.08% | 370.55 | 43.19% |
| Integral connection of lights, etc. | 51.67 | 6.02% | 105.87 | 12.34% |
| Electric distribution of electricity | 36.20 | 4.22% | 74.14 | 8.64% |
| Grow unit rack | 112.94 | 13.16% | 112.94 | 13.16% |
| Hydroponics | 98.15 | 11.44% | 98.15 | 11.44% |
| Ventilation fan system | 5.91 | 0.69% | 5.97 | 0.70% |
| NG heat system | 0.24 | 0.03% | 0.08 | 0.01% |
| Others | 90.34 | 10.53% | 90.34 | 10.53% |
| Total CAPEX | 216,123 | 321,763 | ||
Table 5.
Operational expenditures (OPEX) for GH and IUVF basil production.
| GH | IUVF | |||
|---|---|---|---|---|
| Annual Cost (€) | Total in % | Annual Cost (€) | Total in % | |
| Real estate lease | 43,058 | 28.4% | 7087 | 4.7% |
| Lights electricity | 13,443 | 8.9% | 49,290 | 32.6% |
| Ventilation electricity | 35 | 0.2% | 520 | 0.3% |
| Electricity demand charge | 6050 | 4% | 13,897 | 9.2% |
| Heating cost (NG) | 26,603 | 17.6% | 15,805 | 10.4% |
| Water | 1677 | 1.1% | 882 | 0.6% |
| Nutrients | 1149 | 0.8% | 574 | 0.4% |
| Seeds | 7031 | 4.6% | 7031 | 4.6% |
| Package | 556 | 0.4% | 2511 | 1.7% |
| Labor | 53,200 | 35.1% | 53,200 | 35.1% |
| Total OPEX | 152,802 | 150,800 | ||
Table 6.
Vertical farming scenarios and cash flow analysis (part 1).
| VERTICAL FARMING | SCE_1 | SCE_2 | SCE_3 | SCE_4 | SCE_5 |
|---|---|---|---|---|---|
| Equity/loan/(subsidy) (price) | 50-50 | 40-50-10 | 50-50-5.37 | 20-50-30-8.37 | 50-50-6.37 |
| 20-year cumulative gross profit (€) | 6,418,265 | 6,418,265 | 4,676,538 | 7,289,128 | 5,547,401 |
| 20-year cumulative OPEX (€) | 3,977,610 | 3,977,610 | 3,977,610 | 3,977,610 | 3,977,610 |
| Sweet basil (price/kg) | 7.37 | 7.37 | 5.37 | 8.37 | 6.37 |
| Project cost (€) | 321,764 | 321,764 | 321,764 | 321,764 | 321,764 |
| Subsidy/alternative funding | 0% | 10% | 0% | 0% | 0% |
| Loan | 50% | 50% | 50% | 50% | 50% |
| Equity | 50% | 40% | 50% | 50% | 50% |
| Interest rate | 6.50% | 5.80% | 6.50% | 6.50% | 6.50% |
| NPV (€) | 911,317 | 966,881 | 168,570 | 1,275,569 | 547,065 |
| Project IRR (%) | 34.74% | 45.25% | 0.38% | 52.24% | 17.96% |
| Period payback (years) | 4 | 4 | 21 | 3 | 6 |
Table 7.
Vertical farming scenarios and cash flow analysis (part 2).
| VERTICAL FARMING | SCE_6 | SCE_7 | SCE_8 | SCE_9 |
|---|---|---|---|---|
| Equity/loan/(subsidy) (price) | 25-75 | 50-40-10 | 20-50-30 | 70-30-5.37 |
| 20-year cumulative gross profit (€) | 6,418,265 | 6,418,265 | 6,418,265 | 4,676,538 |
| 20-year cumulative OPEX (€) | 3,977,610 | 3,977,610 | 3,977,610 | 3,977,610 |
| Sweet basil (price/kg) | 7.37 | 7.37 | 7.37 | 5.37 |
| Project cost (€) | 321,764 | 321,764 | 321,764 | 321,764 |
| Subsidy/alternative funding | 0% | 10% | 30% | 0% |
| Loan | 75% | 40% | 50% | 30% |
| Equity | 25% | 50% | 20% | 70% |
| Interest rate | 6.25% | 5.90% | 4.40% | 6.70% |
| NPV (€) | 857,409 | 988,363 | 1,095,480 | 226,049 |
| Project IRR (%) | 63.34% | 37.49% | 97.55% | 0.04% |
| Period payback (years) | 3 | 4 | 2 | 21 |
Table 8.
GH scenarios and cash flow analysis (part 1).
| GREENHOUSE | SCE_1 | SCE_2 | SCE_3 | SCE_4 | SCE_5 | SCE_6 |
|---|---|---|---|---|---|---|
| Equity/loan/(subsidy) (price) | 50-50 | 40-50-10 | 50-50-5.37 | 20-50-30-8.37 | 50-50-6.37 | 25-75 |
| 20-year cumulative gross profit (€) | 3,209,132 | 3,209,132 | 2,338,269 | 3,644,564 | 2,773,701 | 3,209,132 |
| 20-year cumulative OPEX (€) | 3,907,011 | 3,907,011 | 3,902,743 | 3,909,146 | 3,904,877 | 3,907,011 |
| Sweet basil (price/kg) | 7.37 | 7.37 | 7.37 | 7.37 | 7.37 | 7.37 |
| Project cost (€) | 216,127 | 216,127 | 216,127 | 216,127 | 216,127 | 216,127 |
| Subsidy/alternative funding | 0% | 10% | 0% | 0% | 0% | 0% |
| Loan | 50% | 50% | 50% | 50% | 50% | 75% |
| Equity | 50% | 40% | 50% | 50% | 50% | 25% |
| Interest rate | 6.50% | 5.80% | 6.50% | 6.50% | 6.50% | 6.25% |
| NPV (€) | −475,965 | −503,174 | −928,760 | −249,568 | −702,363 | −538,813 |
| Project IRR | ||||||
| Period payback (years) | NEVER | NEVER | NEVER | NEVER | NEVER | NEVER |
Table 9.
GH scenarios and cash flow analysis (part 2).
| GREENHOUSE | SCE_7 | SCE_8 | SCE_9 | SCE_10 | SCE_11 | SCE_12 | SCE_13 |
|---|---|---|---|---|---|---|---|
| Equity/loan/(subsidy) (price) | 50-40-10 | 20-50-30 | 50-50-11.37 | 70-30-5.37 | 50-50-9.37 | 50-50-10.37 | 20-50-30-11.37 |
| 20-year cumulative gross profit (€) | 3,209,132 | 3,209,132 | 4,950,860 | 2,338,269 | 4,079,996 | 4,515,428 | 4,950,860 |
| 20-year cumulative OPEX (€) | 3,907,011 | 3,907,011 | 3,915,549 | 3,902,743 | 3,911,280 | 3,913,414 | 3,915,549 |
| Sweet basil (price/kg) | 7.37 | 7.37 | 7.37 | 7.37 | 7.37 | 7.37 | 7.37 |
| Project cost (€) | 216,127 | 216,127 | 216,127 | 216,127 | 216,127 | 216,127 | 216,127 |
| Subsidy/alternative funding | 10% | 30% | 0% | 0% | 0% | 0% | 30% |
| Loan | 40% | 50% | 50% | 30% | 50% | 50% | 50% |
| Equity | 50% | 20% | 50% | 70% | 50% | 50% | 20% |
| Interest rate | 5.90% | 4.40% | 6.50% | 6.70% | 6.50% | 6.50% | 4.40% |
| NPV (€) | −477,426 | −565,282 | 359,468 | −871,795 | −26,754 | 172,630 | 430,861 |
| Project IRR | 17.42% | −12.11% | 4.64% | 50.22% | |||
| Period payback (years) | NEVER | NEVER | 7 | NEVER | NEVER | 15 | 3 |
© 2020 by the authors. Licensee MDPI, Basel, Switzerland. This article is an open access article distributed under the terms and conditions of the Creative Commons Attribution (CC BY) license (http://creativecommons.org/licenses/by/4.0/).
Share and Cite
MDPI and ACS Style
Avgoustaki, D.D.; Xydis, G. Indoor Vertical Farming in the Urban Nexus Context: Business Growth and Resource Savings. Sustainability 2020, 12, 1965. https://doi.org/10.3390/su12051965
AMA Style
Avgoustaki DD, Xydis G. Indoor Vertical Farming in the Urban Nexus Context: Business Growth and Resource Savings. Sustainability. 2020; 12(5):1965. https://doi.org/10.3390/su12051965
Chicago/Turabian StyleAvgoustaki, Dafni Despoina, and George Xydis. 2020. "Indoor Vertical Farming in the Urban Nexus Context: Business Growth and Resource Savings" Sustainability 12, no. 5: 1965. https://doi.org/10.3390/su12051965
Note that from the first issue of 2016, this journal uses article numbers instead of page numbers. See further details here.