Moving towards a Smarter Housing Market: The Example of Poland


Department of Real Estate and Investment Economics, Cracow University of Economics, Rakowicka 27, 31-510 Cracow, Poland
Sustainability 2020, 12(2), 683; https://doi.org/10.3390/su12020683
Submission received: 20 December 2019
/
Revised: 13 January 2020
/
Accepted: 14 January 2020
/
Published: 17 January 2020
(This article belongs to the Special Issue Sustainability of Real Estate and Social Dynamics)
Abstract
:Cities are currently undergoing vast changes, which have very significant implications for the functioning of the housing market. In particular, it should be stated that the traditional residential market, in imitation of the smart city concept, is becoming increasingly smarter. This smartness can be expressed in four dimensions: the “automatic” rental housing market; innovative digital platforms in the traditional housing market; innovative policies and housing models; and the ability to forecast demand on the housing market, which together form the so-called smart housing concept. On this basis, this study attempted to assess empirically the smartness of the residential markets in Polish provincial capitals. Firstly, after a thorough analysis of digital housing portals, official websites of Polish provincial capitals and public statistics data, the smart housing concept was operationalised in all its dimensions by defining appropriate indicators measuring its level in a given city. Then, using the zero unitarization and entropy weight methods, followed by a no-pattern synthetic measure, a comprehensive smart housing index was obtained for each city investigated. Research results showed that there is a large degree of variation in the level of smartness of the housing markets in the examined cities. Furthermore, the analysis also indicates that the economic dimension of the smart city concept and the co-working concept are the main driving forces behind the development of smart residential markets. In addition, the study reveals that the implementation of the smart housing concept has a positive impact on the quality of life of city inhabitants.
1. Introduction
Urban areas are an extremely important subject of scientific research [1] and a forum for implementing new policies. This is due to the fact that more than half of the world’s population already lives in cities [2,3]. Therefore, cities are currently undergoing changes to meet as many of the demands of a constantly growing number of inhabitants as possible [4]. One such requirement is the need for housing, which is provided by the real estate market operating in a given city. This market is strongly influenced by local conditions and, therefore, always has a local character [5]. On this basis, it should be stated that the current transformations in the functioning of cities have significant implications for housing. Changes in the residential markets have already been noticed by Maalsen [6], who was the first to introduce the concept of smart housing. This concept presents a new type of housing market, which is largely (but not exclusively) shaped by the increase in the smartness of cities. It should be noted that the smart city concept in today’s reality is very willingly supported and implemented by policy-makers in different parts of the world [7]. It can even be said that the smart city concept has changed the paradigm of urban space development [8], and the desire to increase the smartness of cities has become a key task for scientists, politicians and even local communities [9]. On this basis, it is highly likely that the housing market will also undergo a significant redefinition towards becoming smarter. The question, however, arises whether traditional housing markets in cities are already changing their specificity in this direction. In order to answer this question, appropriate scientific research should be carried out. Therefore, the aim of this article is both theoretical and empirical. In particular, from a theoretical point of view, this article is intended to:
- Redefine the smart housing concept on the basis of Maalsen’s reflections [6]. In this respect, the theoretical dimensions of this new housing market concept will be presented;
- Determine the potential drivers of the development of the smart housing concept;
- Determine the potential effects of the implementation of the smart housing concept;
- Operationalise the smart housing concept, i.e., a set of indicators will be proposed to assess the smartness of the residential market in a given city.
Whereas, from the empirical point of view, the aim of the article is to:
- Measure the smartness of housing markets in Polish provincial capitals;
- Identify the factors that significantly affect the development of the smartness of residential markets in studied cities;
- Determine how the smart housing concept affects, among others, the level of wages, poverty and housing availability in the cities in question.
This article offers a significant contribution to the literature on sustainable urban development, the smart city concept and, above all, the smart housing concept, which has not been adequately studied by scholars. Namely, according to the SCOPUS database, only 37 documents (articles, books, reviews, etc.) have been published since 2010 regarding the term “smart housing”, which is an extremely low amount in relation to the number of publications in comparable research areas (smart city—19,663 documents; sustainable urban development—1944 documents; smart home—9785 documents; smart building—2787 documents).
Turning to the analysis of documents on smart housing, 36 of them define this concept similar to the smart home or smart building concepts, i.e., the use of smart devices and, broadly speaking, the Internet of Things technology within the home [10,11] or within the building [12,13]. In the latter aspect, however, there are some differences in the approaches to the conceptualisation of smart housing. In particular, according to Elariane and Dubé [14] the above concept consists of five dimensions: smart meters; sensors or monitoring systems; automatic control system; user interface; and communication network to connect the devices with each other. This standpoint highlights the use of technology to improve both the quality of life of the household members and energy efficiency [15]. A broader approach to defining smart housing is presented by GhaffarianHoseini et al. [16], who refer it to smart homes equipped with modern technologies to achieve environmental, economic and socio-cultural sustainability. GhaffarianHoseini et al. [16] specify that three elements are taken into account within the smart housing concept: people, products (e.g., facilities, devices) and processes (e.g., interrelations), which together provide the well-being of home dwellers. The issue of quality of life was also pointed out by Kinder [17], according to which smart housing technologies can help the elderly to ensure independent living in their own homes. Another position on the smart housing concept is presented by Butryn et al. [18], who juxtaposes the analysed term with housing estates and claims that the latter are equipped with, among others, green roofs, solar cells, rainwater retention, external gym or three-layer windows. In turn, only one article, written by Maalsen [6], refers the smart housing concept to the functioning of the real estate market, which is the subject of research in this article. Moreover, to the best of the author’s knowledge, this study is the first to undertake an assessment of the smartness of the residential market. Therefore, new research on the smart housing concept will not only fill the identified research gap, but also provide a better understanding of the current changes in the housing markets in urban areas. A thorough knowledge of the above mentioned trends is not only important for the private sector but also for policy-makers who influence the socio-economic development of cities through public policies.
The rest of the article is organised as follows: Section 2 presents a theoretical understanding of the smart housing concept, its definition and operationalisation; Section 3 describes the data and methods used in the empirical research; Section 4 contains a description of the research findings and discussion; Section 5 presents the conclusions of the empirical research and, in addition, directions for future studies and recommendations for policy-makers.
2. Theoretical Framework of the Smart Housing Concept
Maalsen [6] defines the smart housing concept as encompassing the following dimensions: housing on demand; policy and housing hacks; smart economies driving smart housing needs; and new sharing economies. The first of the aforementioned dimensions of the smart housing concept—housing on demand—concerns, in general, the problem of availability of housing in a changing socio-economic environment, currently driven by factors such as a highly mobile workforce, changing preferences of young people or the developing gig economy. All these factors force a change in the traditional rental housing market, which is dominated by long-term liabilities, towards a more flexible market, with the possibility of frequent and simple changes in renting properties. The dimension of housing on demand is directly linked to the next dimension of the smart housing concept outlined by Maalsen [6], i.e., smart economies driving smart housing needs. In short, the smart city concept, and in particular one of its elements—the smart city economy—underlines the importance of entrepreneurship and innovation, which is inextricably linked to the high mobility of employees. In this dimension, Maalsen [6] also emphasises that employees in smart city economies are characterised by unpredictability of income and contract work, which affects their ability to own a home. Both factors mentioned above increase the demand for a flexible rental housing market. It should, therefore, be concluded that there is a very strong link between the dimensions of housing on demand and smart economies driving smart housing needs. The remaining elements of Maalsen’s smart housing concept—policy and housing hacks, and new sharing economies—refer to the implementation of non-standard housing policies by public authorities, and the development of new housing models that meet current needs in this respect [6].
The concept of smart housing, other than Maalsen’s considerations [6], has not received much scholarly attention thus far. Therefore, this article presents a proprietary observation on this topic taking as a starting point the dimensions of the smart housing concept defined by Maalsen [6].
Section 2.1, Section 2.2, Section 2.3 and Section 2.4 present a new approach to defining the smart housing concept as the inevitable transformation of the traditional housing market model. In particular, in this paper the smart housing concept materializes in four dimensions: the “automatic” rental housing market; innovative digital platforms in the traditional housing market; innovative policies and housing models; and the ability to forecast demand on the housing market. According to the above dimensions, it should be emphasised that the smart housing concept is extremely flexible, i.e., it meets the expectations of society as a whole, both rich and poor. In addition, the increase in the smartness of the housing market provides an opportunity to adapt the place of residence to the place of work, which is difficult in the traditional residential market. As a result, people who want to move can easily change their place of work, progress in their professional careers and, thus, receive higher wages. Furthermore, the ease of relocation and the increased availability and affordability of housing in smart housing markets increase the likelihood of reduction in the number of the long-term unemployed, thereby also reducing the level of poverty in the city.
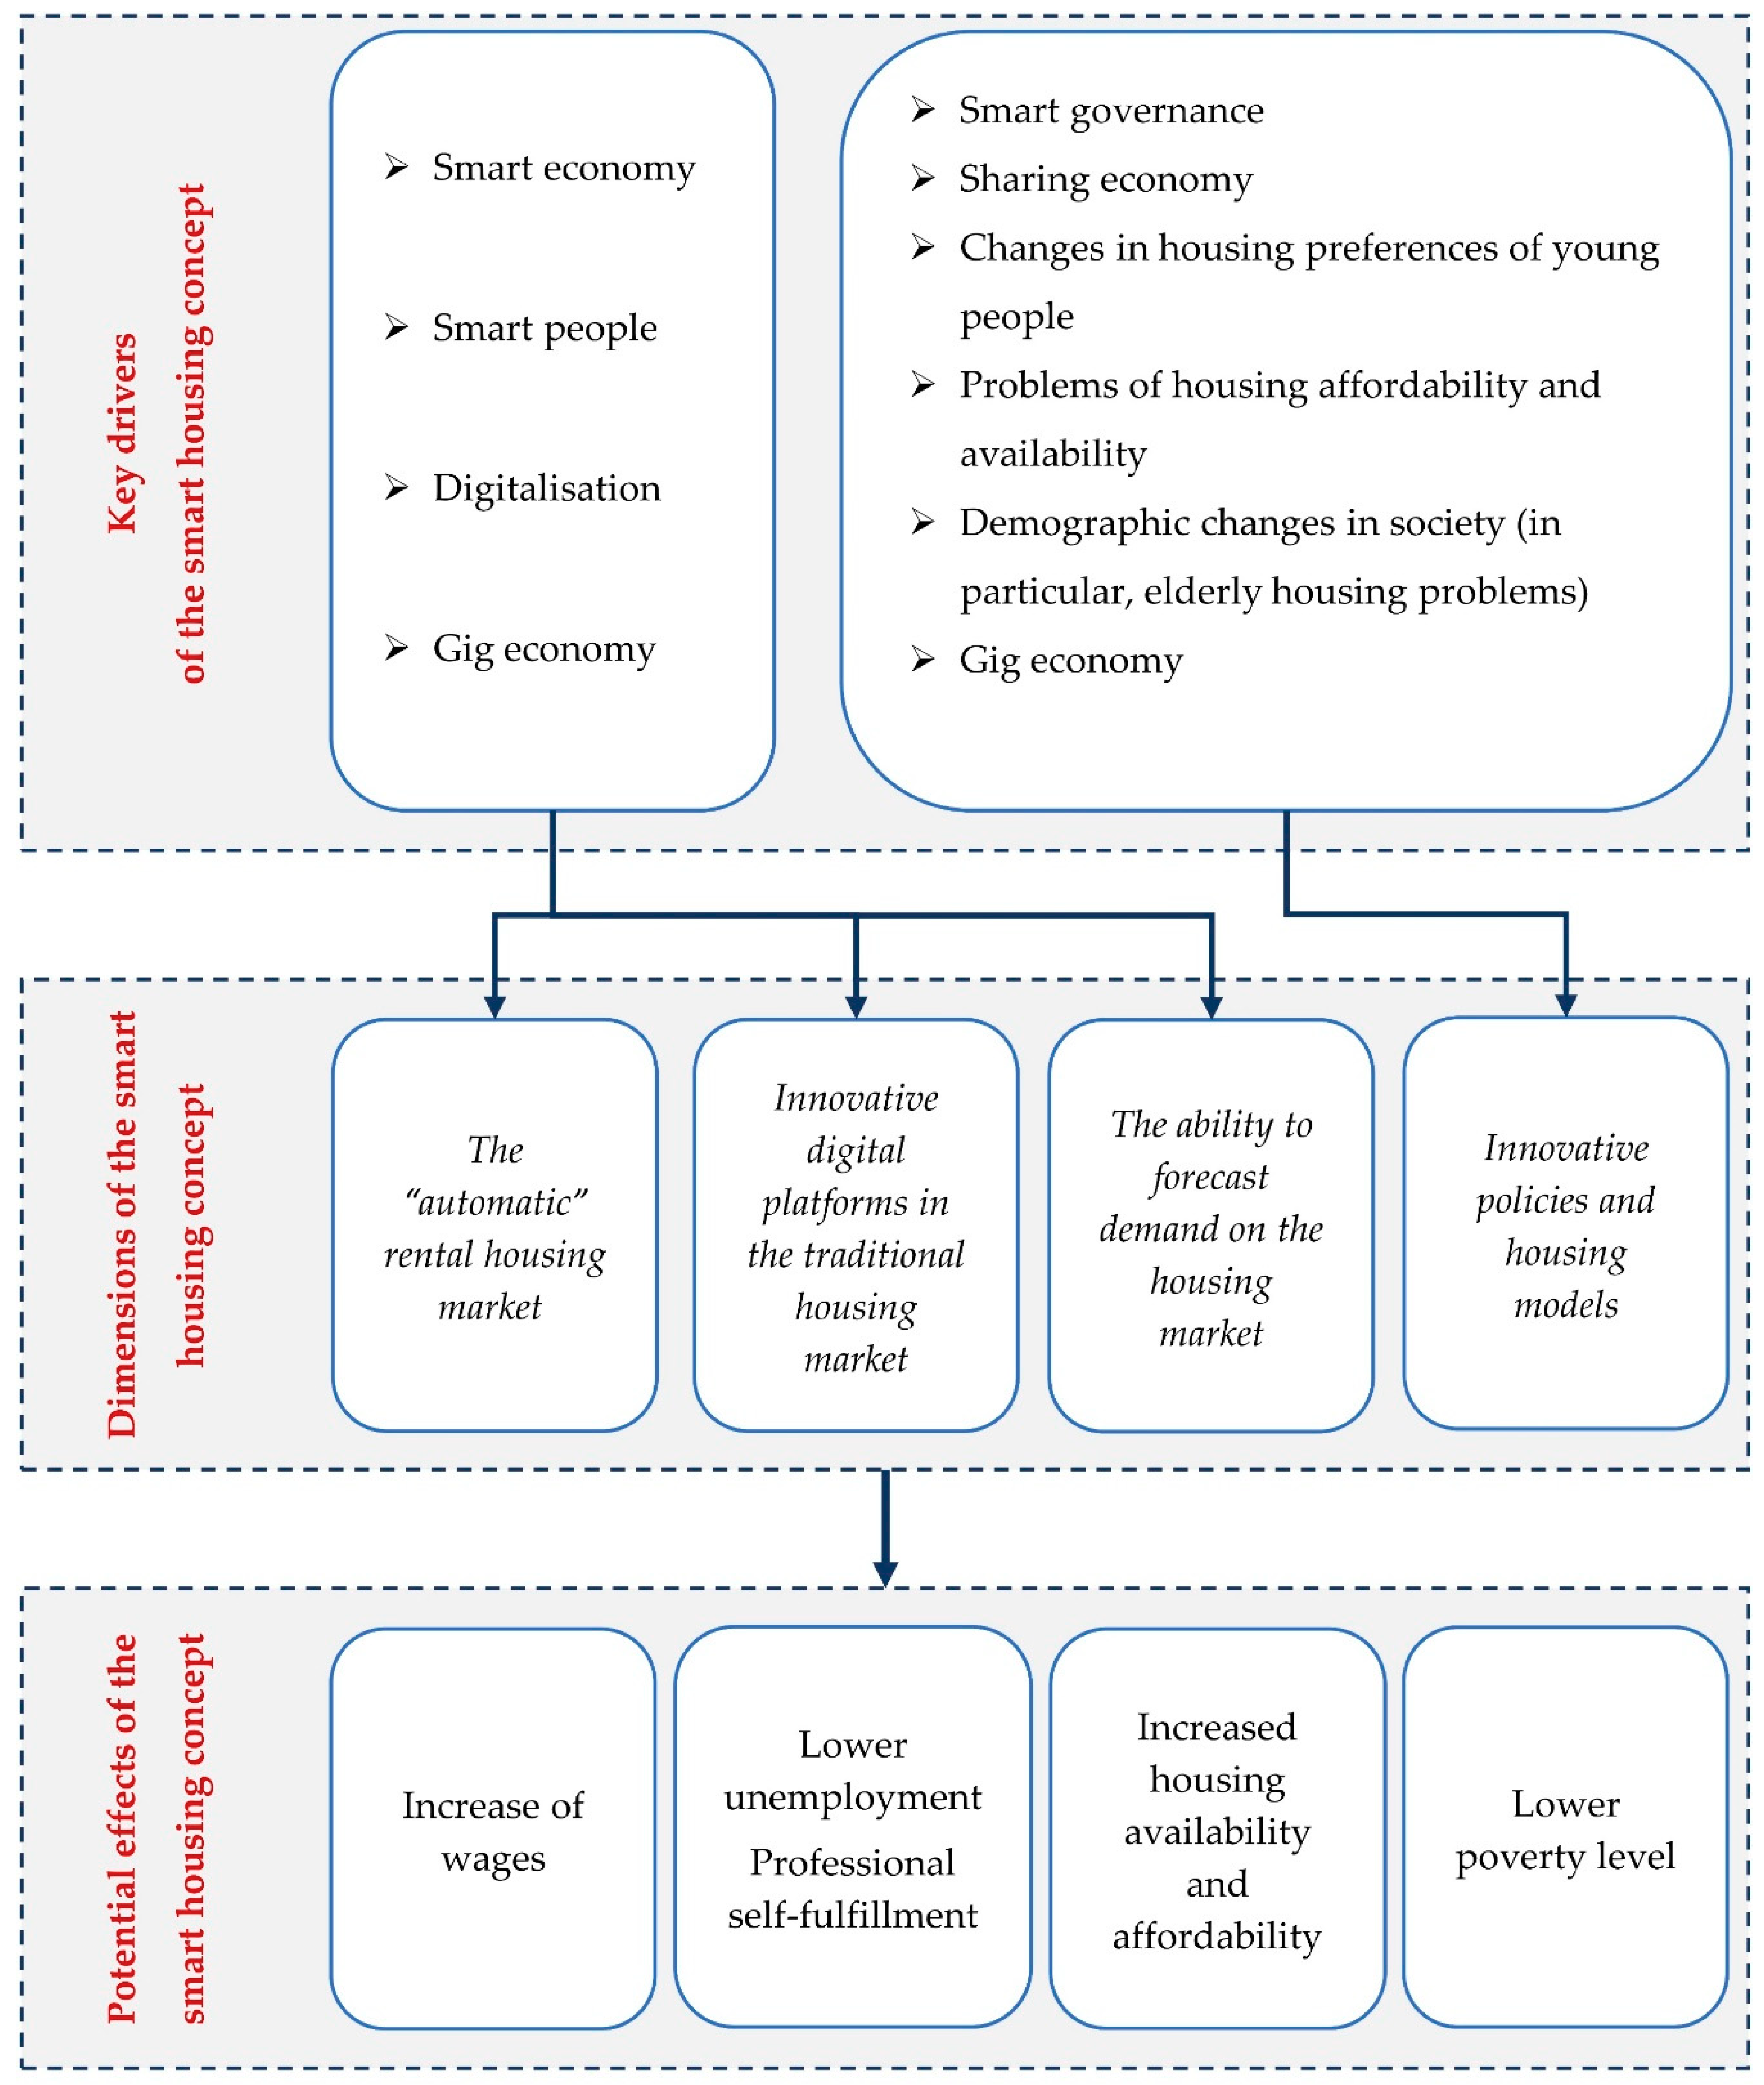
Moreover, when considering the smart housing concept, it is necessary to characterise its constituent elements and distinguish the ones that drive the development of smart housing markets. Section 2.1, Section 2.2, Section 2.3 and Section 2.4 are organised along these lines, i.e., the specific driving force will be described, followed by the smart housing concept dimension it affects. Figure 1 summarizes the results of theoretical considerations from Section 2.1, Section 2.2, Section 2.3 and Section 2.4 regarding the smart housing concept.
2.1. The “Automatic” Rental Housing Market—The First Dimension of the Smart Housing Concept
The first and main element influencing changes in the existing housing market is the smart city concept, which can be defined as the use of digital technology by the city in order to increase the quality and efficiency of services and resources provided [19,20,21]. Furthermore, the implementation of the smart city concept reduces operating costs, leads to an increase in social activity and contributes to sustainable development [22]. The term “smart city” is also defined in a broader way, as the development of knowledge economy (innovation, creativity, entrepreneurship) within the city [23,24]. The smart city concept can be further deconstructed into certain sub-groups. On this basis, the following areas of urban development can be listed within the smart city concept [22,25]: smart transport and mobility, smart environment, smart people, smart living, smart governance and smart economy. From the point of view of the smart housing concept, the economic context of smart cities is crucial, but smart people and smart governance are also important. As already mentioned, smart city economies are characterised by high employee mobility. There are several reasons for this. First of all, employees in smart cities very often belong to the sector of the gig economy [26], i.e., the labour market characterised by short-term contracts, and which is largely web-based [27]. As a result, workers in the gig economy sector are more likely to be mobile because they do not have a stable source of income [28]. Moreover, within the smart city economy dimension, the role of innovation and creativity is emphasised. It should be noted that economic innovation is also directly related to mobility, as innovative solutions are more likely to arise in an open environment, where employees are highly inclined to cooperate actively with people from other cities or even countries.
On the basis of the above argumentation, it should be stated that the smart city economy is one of the main determinants of the smart housing market development, because the changing economic environment also forces the traditional housing market to adapt (in this case, mainly the rental market). This adjustment should consist in the development of the so-called “automatic” rental housing market (the first dimension of the smart housing concept), which is characterised by high flexibility in signing and dissolving medium- and long-term contracts. This type of rental market should be supported by digital solutions that will further simplify and enable (even without leaving home) the choice of an appropriate place to live. It should be stressed, however, that the degree of automation of this rental market may differ between cities and countries. This depends on both the legal solutions adopted in the field of housing and the innovativeness of companies in the real estate sector.
It should be stressed that the economic dimension of the smart city concept is not the only parameter that affects the development of “automatic” renting. Smart people can also determine the level of smartness of a given residential market. This results from the fact that higher education (one of the components of the smart people dimension) affects the “automatic” rental market in two fields: (1) scientific, i.e., the highly mobile nature of research work, which very often forces scientists to change residence temporarily; (2) students, and especially foreign students, who, unfamiliar with the workings of the local housing market, are mostly interested in the easiest way to rent accommodation.
Another factor enabling the development of an “automatic” rental market is the already mentioned progressing and ubiquitous digitalisation, which can be defined as the use of digital technologies by a given organisation, country, etc. [29]. A distinction should be made between digitalisation and digitisation, which refers to the conversion of analogous data into their digital form [30]. It should be noted that both digitalisation and digitisation can be observed in the real estate sector; such issues have already been widely discussed in the scientific literature. In particular, in this context, digitalisation refers to the currently observed transformations of business models used so far into models using increasingly more advanced digital technology [31,32,33]. In relation to the housing market, digitalisation largely concerns the use of digital housing platforms [34] through which the process of renting or selling a flat is much easier and sometimes done entirely online. Conversely, digitisation in the context of the housing market refers to the coding in a digital version of residential property attributes [35] such as location, size, standard etc. It should also be stressed that the digitisation of properties is extremely important from the point of view of other areas of the real estate industry. In particular, it concerns property valuations, whose credibility depends largely on the level of systematization of digital real estate data from various sources [36].
2.2. Innovative Digital Platforms in the Traditional Housing Market—The Second Dimension of the Smart Housing Concept
It should be stressed that factors such as digitalisation, innovation and creativity within the smart city economy do not cause the emergence of digital housing platforms only with regard to the “automatic” rental market. Modern residential platforms are currently becoming increasingly common in the traditional real estate market, both in terms of rentals and sales. This is where the second dimension of the smart housing concept—innovative digital platforms in the traditional housing market—comes into play. It should, therefore, be stressed that the smart housing market also consists of a segment of the traditional housing market, which is served by innovative online platforms. These platforms make it easier to choose the right flat for rent or purchase through digital solutions, such as high-quality offers, the use of virtual reality or non-standard algorithms that match residential property to the requirements of customers. It should be noted that in this respect, the smart housing concept meets the expectations of less mobile people, who do not intend to change their place of residence for a longer period of time.
2.3. Innovative Policies and Housing Models—The Third Dimension of the Smart Housing Concept
The considerations presented above have described the materialisation of the smart housing concept under the influence of innovation resulting from the smart city economy and ubiquitous digitalisation. It should be stressed, however, that the increase in the smartness of housing markets also stems from diametrically different factors. Of the most important determinants in this respect are the issues of housing availability and affordability in cities. This aspect is extremely important for urban areas, where every year total population grows [37]. As such, the residential market must respond to the growing housing needs of city dwellers. The answer can be twofold. Firstly, it may be typically public, i.e., through the implementation of innovative housing policies aimed at ensuring housing for the poorer part of the population. Secondly, it may concern the development of innovative housing models that increase overall housing availability in a given city. Taking these two elements into account, the third dimension of the smart housing concept is formed, i.e., innovative policies and housing models.
Ensuring greater access to housing is not the only prerequisite for the development of innovative housing policies and models. Another factor is the general shift in young people’s housing preferences. Today, a growing number of young adults are interested in renting properties [38,39]. These preferences are also a consequence of the changing labour market, in which mobility plays an increasingly important role. Housing concerns relating to older people are also significant. The elderly prioritise the costs of maintaining a property [40]. New housing models should also take these considerations into account. Another factor contributing to the development of the third dimension of the smart housing concept is the growth of the smart city concept in the field of smart governance. It can be assumed that local authorities implementing the smart governance concept in the city will also be more innovative in their housing policies.
As initially presented, the third dimension of the smart housing concept is materialised through innovative policies and housing models. The question arises, however, as to what is innovative in this case. Simply put, it is a matter of implementing housing policies in a non-standard way and developing new housing models that meet current social needs [6]. Turning to the analysis of innovative housing policies, it should be stressed that these are usually of a local nature. This is due to the fact that such policies are implemented by the authorities of a given city in response to the specific needs of the local community.
As a model in terms of creating innovative housing policies, the city of Boston should be mentioned, where a Housing Innovation Lab, part of the Mayor’s Office of New Urban Mechanics, operates. The Lab implements innovative housing policies by conducting experiments in small parts of the city to assess whether a given policy fulfils its role. This approach is extremely beneficial because it allows a real check on how the chosen housing policy works before deciding to introduce it on a wider scale. The Lab is currently running nine projects, one of which is the compact living pilot policy, which aims to increase housing affordability, build communities, promote sustainable development and support creativity and innovation [41]. This pilot policy assumes new construction of 10 or more small, efficiently designed housing units, with easy access to places such as parks, jobs, groceries or libraries [41]. However, before determining the exact parameters of these new residential units, an experiment was carried out among the residents, which consisted in presenting a fully equipped 385-square-feet mobile apartment in different parts of the city. The experiment provided feedback from more than 2000 city residents and revealed that they are interested in compact living if: (1) it is well designed; (2) it has shared spaces; (3) it has good localisation [41].
When discussing the example of Polish provincial cities in this respect, it should be noted that there are significant deficiencies in the implementation of innovative housing policies. These cities, very often, limit themselves to allocating municipal flats for rent. The condition for securing a flat is usually that the potential tenant has a sufficiently low income. The processes involved within the conventional housing policy, however, are very often inefficient and lengthy. Moreover, cities usually do not have online platforms for property management, which reduces the transparency of their policies. In addition, there are considerable shortcomings in terms of the existence of dedicated programmes supporting, e.g., young families, students or recent university graduates, who are not able to secure accommodation in the private market. In view of the above, and taking into account the Polish particulars, one may label as “innovative housing policies in Poland” all programmes and activities (e.g., increasing the transparency of housing real estate management through the creation of a web portal) that go beyond the standard policy of municipal housing management, and that contribute to increasing the availability and affordability of housing for all who need it.
As already mentioned, the second part of the analysed dimension concerns new housing models, which are generally speaking based on the idea of shared living, promoted by the growing popularity of the sharing economy. New housing models are becoming increasingly popular worldwide because they are the answer to: problems related to the availability and affordability of housing, demographic changes, changes in the preferences of the young generation and the gig economy (especially in relation to low-paid workers) [42].
Within the above-mentioned models, we can distinguish two main concepts: home sharing and co-living. The first can be defined as unrelated people living together in a dwelling unit [43,44,45]. In this model, home sharers have their own rooms, but share rooms such as the kitchen, bathroom or living room. It should be noted that in the home-sharing model, the ownership relationships of the occupants might also vary. This could include the possibility of house sharers renting an entire house or sharing a house between the owner and a rent-paying sharer. According to the literature on the subject, the main advantages of a shared dwelling is the reduction of housing costs and the additional income for the owner [46]. This model is particularly attractive for older people, who have their own residential property, and stand to benefit not only in financial terms but also in terms of company and help in everyday life.
The second model of joint habitation, co-living, is a relatively new phenomenon. It has unique features that distinguish it from the home sharing model. In particular, apart from sharing a living space, co-living aims at building social bonds between tenants [47]. In the co-living model, features such as extensive communal facilities or the involvement of residents are important [48]. The architectural style of co-living buildings is also relevant, as it aims to support the community [49]. Moreover, the co-living model is operated by an external entity that manages the property [50]. It should also be stressed that co-living facilities may be located in both urban and rural areas [50], and very often also offer future residents common workplaces [51], which further strengthens the bonds of a given community.
When analysing the innovative policies and housing models dimension it should be noted that it is very much connected to the “automatic” rental housing market. In particular, in the latter case, it is possible (but not necessary) to base the concept on shared living. A similar situation can be observed in the case of innovative policies and housing models, where digital platforms can (but do not have to) be used to increase the “automatism” of given policies or models. It should be emphasised, however, that in both these dimensions there are some unique elements to which attention should be paid. In the case of the “automatic” rental housing market dimension, the ease of signing and dissolving rental agreements for entire dwellings, as well as for individual rooms is emphasised. When it comes to innovative policies and housing models, however, attention should be paid to the very idea of the joint accommodation of unrelated people who want to build social ties.
In conclusion, new housing models are responding to current socio-economic changes and are an indispensable element of a smart housing market. In addition to their advantages, however, it should also be noted that residents may experience some discomfort in both home sharing and co-living dwelling units, which may result from overcrowding, uncertainty, noise or potential conflicts with other residents [48,52].
2.4. The Ability to Forecast Demand on the Housing Market—The Fourth Dimension of the Smart Housing Concept
The previously mentioned dimensions of the smart city, i.e., smart economy and smart people, contribute to the materialisation of the final segment of the smart housing concept, i.e., the ability to forecast demand on the housing market. It should be noted that in the housing market, developers creating new supply cannot react in real time to the current demand from potential customers. This results from the fact that the investment process in the residential construction industry is time-consuming. Conversely, current demand in the housing market is a result of many factors, such as the level of wages, unemployment, interest rates or credit availability [53]. Therefore, when making decisions on the implementation of a given development project, one should be aware that the demand for residential real estate may change in the future and not correspond to the demand at the time of making the decision. In such a situation, there is a very serious risk of not selling all the residential units on offer. In this case, innovation resulting from the smart city concept may be useful. In particular, within the framework of the smart city economy, innovative enterprises can offer their services to real estate developers in preparing advanced analyses determining the parameters (price, number or structure of dwellings) of future demand on the housing market. It should be emphasised that such analyses may also be prepared by scientists, who fit into the smart people segment within the smart city concept.
3. Data and Methods
Due to the novelty of the smart housing concept, its measurement is a difficult task. This mainly results from lack of data. The difficulty increases when analysing countries such as Poland, where the development of the smart housing concept and even the smart city concept remain at a low level compared to other European countries [54]. After a thorough analysis of digital housing portals, official websites of Polish provincial capitals and public statistics data, however, the smart housing concept was operationalised in all its dimensions by defining appropriate indicators measuring its level in a given city (see Table 1).
It should be noted that prior to calculating the level of smartness of the residential market in a given city, the indicators presented in Table 1 should be normalised (similarly, some indicators in Table 2) in order to convert them to comparable values. For this purpose, the zero unitarization method was applied, which is given by the formula:
where —normalised value of the j-th variable for the i-th object ( is a stimulant variable), —the original value of the j-th variable for the i-th object, —the maximum value of the j-th variable among the i-th objects, —the minimum value of the j-th variable among the i-th objects, —the desired value of the j-th variable. Zero unitarization as a normalisation method is highly beneficial, as it meets all the requirements for this type of transformation, including positive values or stability of ranges of variability of normalised variables [55].
When establishing an indicator system, as in this case, there is a problem concerning weighting of variables. The baseline estimate relies on the assumption of equal weights of indicators. In such a case, in order to calculate the smartness level of the housing market, a no-pattern synthetic index was used, which is given in the formula:
where —value of the synthetic indicator for the i-th object, —number of diagnostic features.
In order to control the results obtained in the baseline estimate, however, robustness checks were carried out taking into account different weights of indicators. Weights have been calculated using the entropy weight method that proceeds in the following stages [56]:
- Calculating the entropy of the j-th variable as follows:where —number of objects, , , when , make ,
- Calculating the entropy weight of the j-th variable as follows:where and .
After calculating weights using the entropy weight method, a no-pattern synthetic index was calculated according to the following formula:
It should be noted that the aim of this article is not only to determine the level of implementation of the smart housing concept in the cities in question, but also to verify empirically:
- Factors that influence the development of the smartness of housing markets;
- Positive effects of the smart housing concept.
Only selected factors and effects were examined (see Table 2), because there is no relevant data for all the variables listed in Figure 1. Moreover, some of the analysed factors and effects are multidimensional in nature, which means that the same procedure will be used to determine them as in the study of the level of smartness of residential markets (i.e., no-pattern synthetic indexes were used to assess the level of poverty, smart economy, smart governance and smart people in each city investigated).
The assessment of the relationships between the defined factors and effects and the level of smartness of residential markets was carried out on the basis of the Kendall’s tau correlation coefficient, which is given in formula [57]:
where —the correlation coefficient, —number of concordant pairs, —number of discordant pairs, —number of observations. If there are tied pairs in the data, the modified Kendall’s tau coefficient () was used, which is defined as [57]:
where —number of tied observations in the a-th group of ties for the first variable, —number of tied observations in the c-th group of ties for the second variable. This study was based on the measurement of the Kendall’s tau correlation coefficient because this method is suitable for small sample sizes [58,59] (in this study the sample size is equal to 16). The possibility of using more advanced quantitative methods also excludes the temporal scope of the research, which because of lack of data covers only 2018 and 2019 (depending on availability). Lack of data is typical in research related to the smart city concept. One can cite here a study conducted by Sikora-Fernandez [22], who assessed the smartness of Polish cities using also data characterising not the cities themselves, but a larger area, e.g., a province.
4. Results and Discussion
4.1. Baseline Estimates—Equal Weights of Indicators
In the first stage of the empirical research, the level of smartness of housing markets in the studied cities was measured. This analysis was carried out in two stages: in the first stage, each dimension of the smart housing concept was evaluated separately; in the second stage, the comprehensive smart housing index was estimated on the basis of all dimensions of the investigated concept. The results of this study are presented in Table 3.
Based on the results presented in Table 3, it can be concluded that the smartest residential market is found in Cracow. This result is not surprising as Cracow is currently one of the fastest developing cities in Poland in terms of new jobs in innovative companies (BPO, SSC/GBS, IT, R & D), tourism or higher education. It is because of these features that Cracow is also ranked first in the “automatic” rental housing market dimension.
It should also be emphasised that housing developers are very active in the city of Cracow, which translates into the highest value, among the analysed cities, for innovative digital platforms in the traditional housing market. Unfortunately, the development of the real estate market through the construction of new dwellings by private developers may have contributed to stagnation in innovative housing policies offered by the city. In particular, there are currently no non-standard housing policies in Cracow that could increase both the availability and the affordability of housing. Conversely, the most innovative cities in the implementation of unconventional housing policies are Szczecin and Poznan, which translates into third and first place respectively in the innovative policies and housing models dimension. In particular, one should look at the housing programmes of the city of Szczecin, which uses so-called new housing models as part of their solutions on offer (see Table A3). In the discussed dimension, the last position is held by the city of Bialystok, which is characterised by a lack of innovative housing policies, lack of co-living facilities and the lowest number of rooms to rent per 1000 residents (see Table A4).
Looking at the level of the last dimension of the smart housing concept, i.e., ability to forecast demand on the housing market, it should be noted that the city of Gdansk has the highest value in this respect, and the city of Katowice the lowest. In this dimension, unexpectedly, the second place was taken by the city of Bydgoszcz, which in the remaining dimensions achieved results below the average.
When analysing the estimates for all dimensions of the smart housing concept, it can be initially concluded that there is a great deal of variation among the cities in this respect. In particular, there are cities such as Cracow, Warsaw and Wroclaw, which demonstrate good results in almost every category of the smart housing concept. Conversely, cities such as Zielona Gora, Kielce or Bialystok have very bad estimates in each studied dimension. Unfortunately, the above conclusions are characteristic for Poland, where very large disparities between regions or cities can be observed. Within the smart housing concept, this diversification can be further intensified because it is a new, highly innovative concept; therefore, its development takes place especially in large urban centres. The above considerations are shown in Figure 2 presenting the results achieved by the surveyed cities in terms of the four dimensions of the smart housing concept.
On the basis of Figure 2, it can be stated that the smallest disproportions among the analysed cities concern the ability to forecast demand on the housing market dimension of the smart housing concept. This is not surprising, because in forecasting future demand for their products, local developers may use analyses of local entrepreneurs or scientists, or order them further afield. Therefore, it should be stated that this dimension of the smart housing concept has the most flexible character. This cannot be said of the other dimensions of the smart housing concept, which are inextricably linked to a given territory. This conclusion is also confirmed by Figure 2, which shows that the other three dimensions of the smart housing concept behave very similarly, i.e., their values in different cities are not radically different. All this shows that the dimensions are closely linked and drive each other’s development.
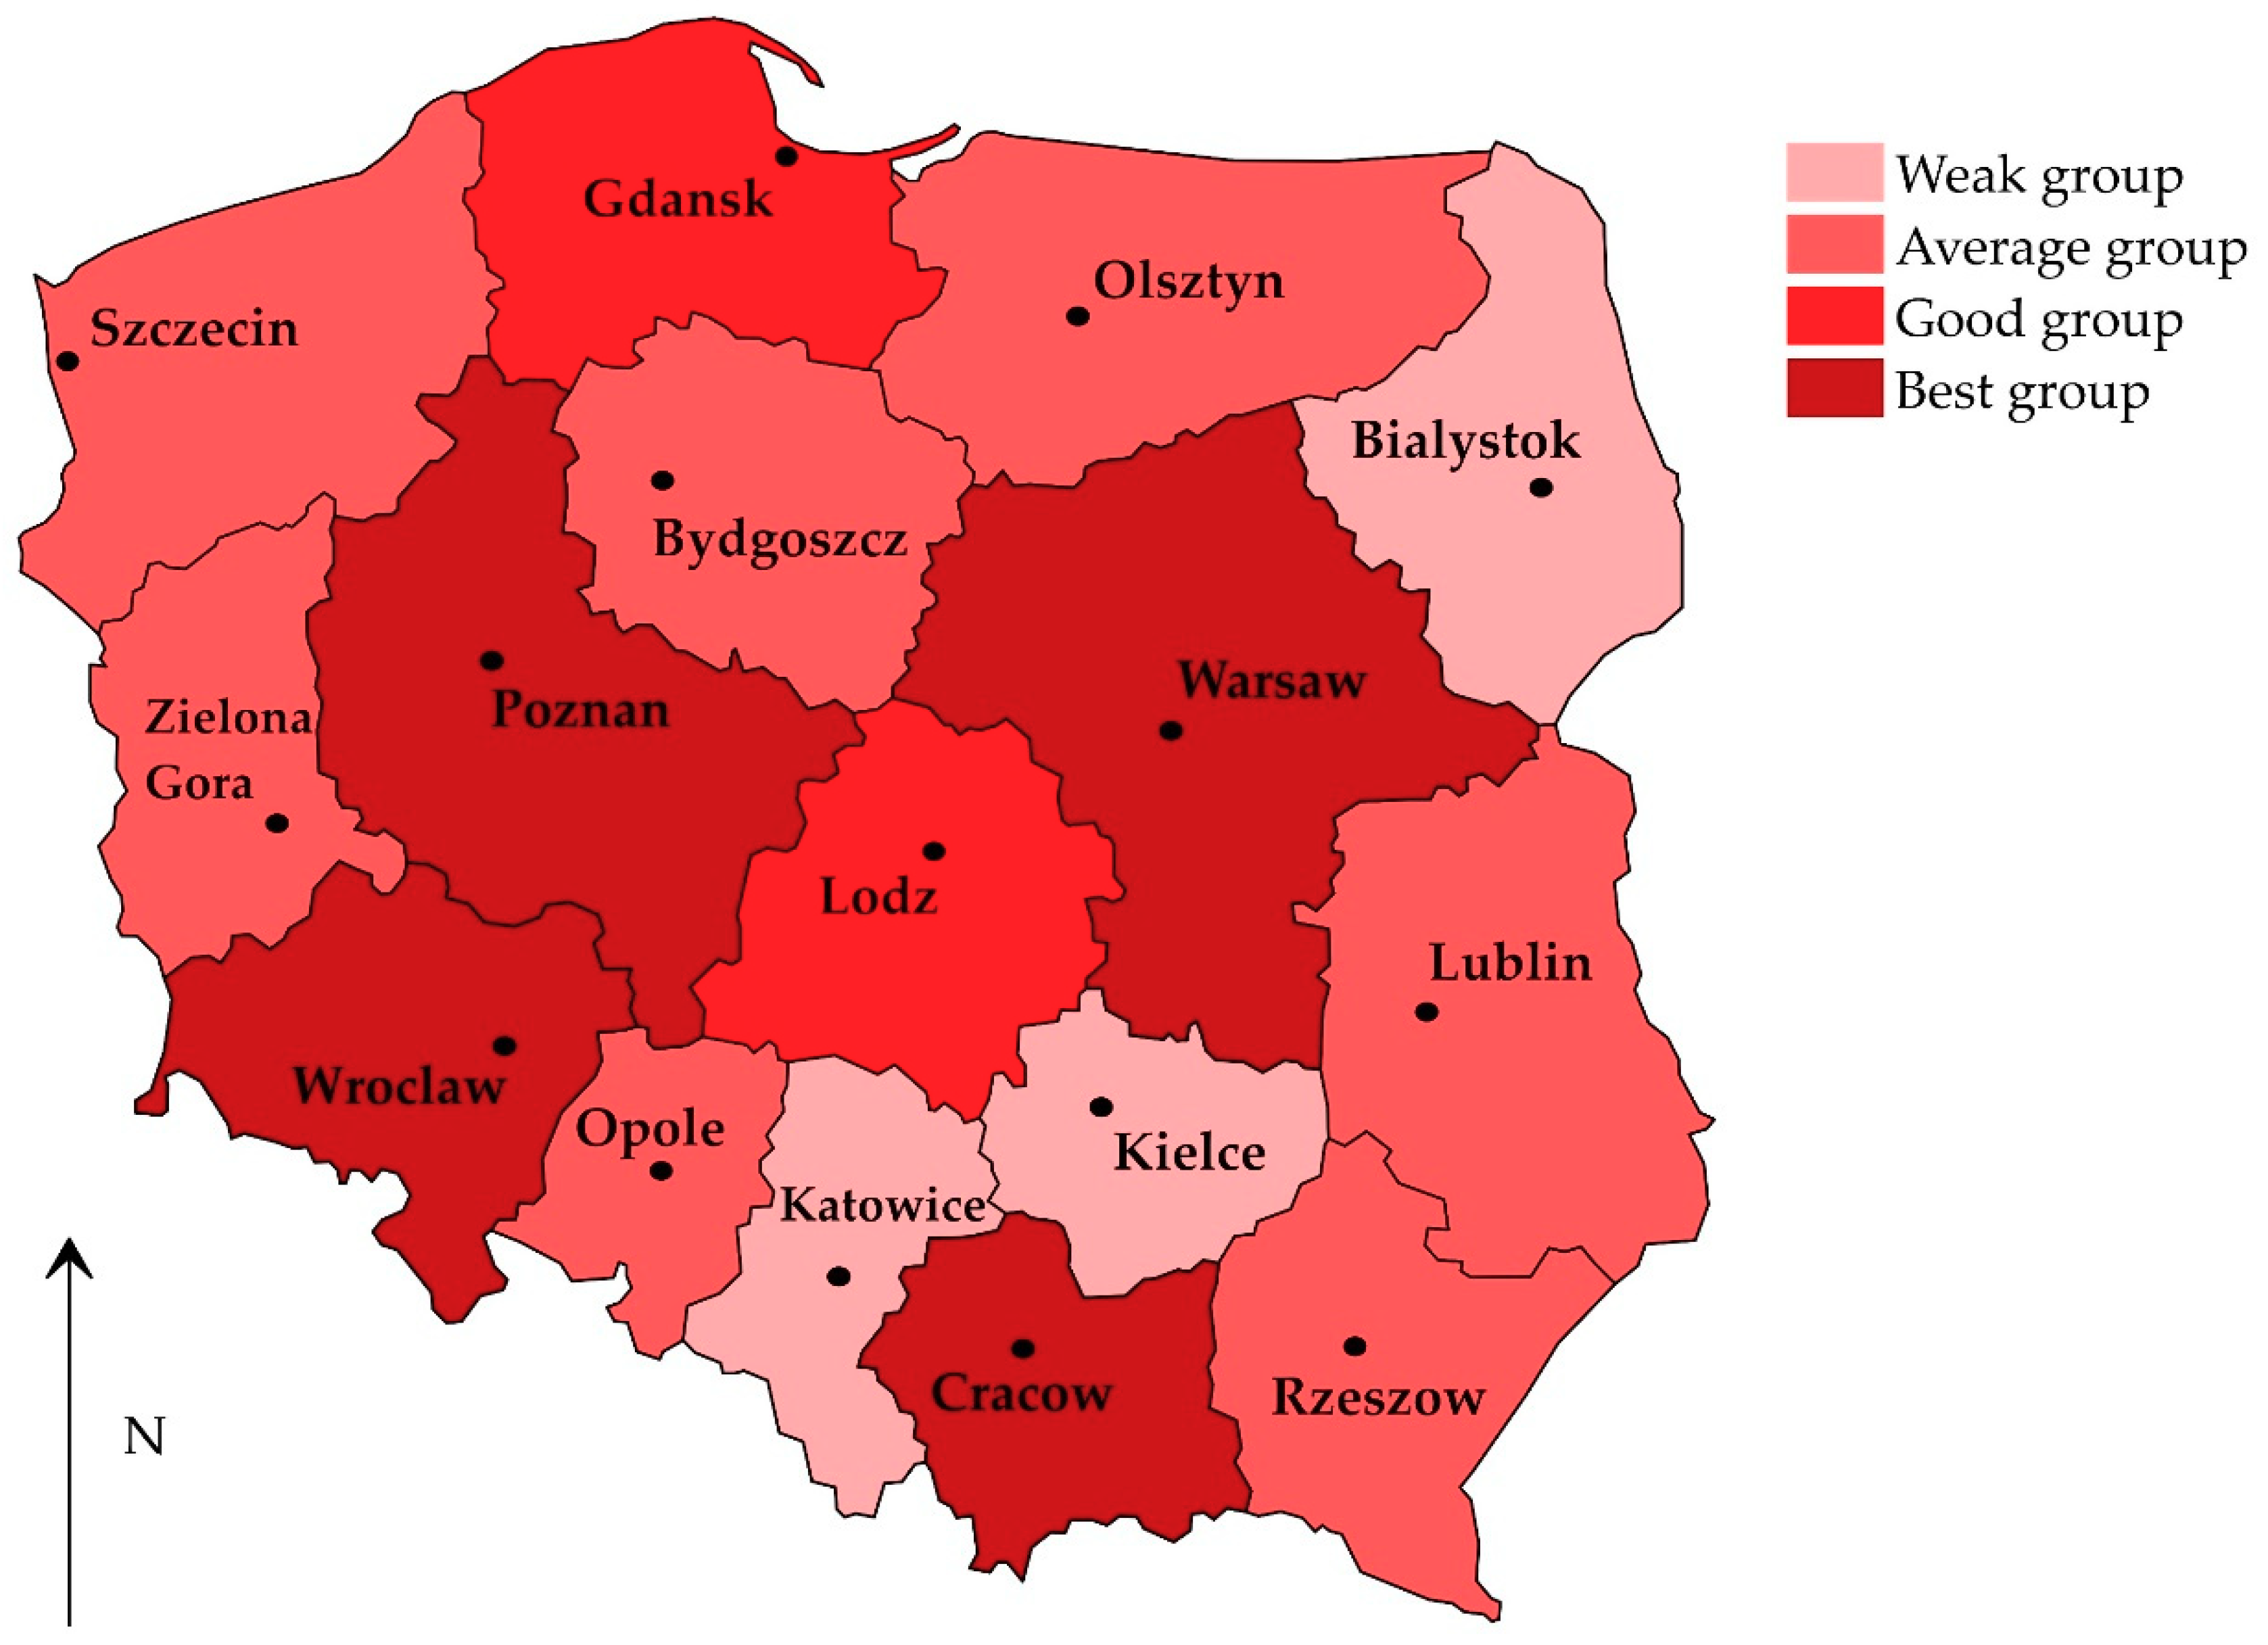
In order to investigate further the differences in the Comprehensive Smart Housing Index, the cities in question were classified into four groups of similar objects (see Table 4). This classification is another argument confirming the large disproportions in the smartness of the housing markets in Polish provincial cities. In particular, as many as 10 out of 16 cities are in the weak or average group, i.e., 62.5% of the analysed units. Then, the classification in Table 4 is presented in Figure 3 in order to check potential spatial dependencies. Through the results of this analysis, it can be cautiously concluded that, in general, the provincial cities in the western part of Poland have higher comprehensive smart housing index values than cities in the eastern part of the country (all cities in eastern Poland, i.e., Kielce, Olsztyn, Rzeszow, Lublin and Bialystok, are classified to the weak or average group).
In the next stage of this study, the correlations, between the comprehensive smart housing index and the factors that may drive the development of the smart housing concept as well as the potential positive effects of increasing the smartness of residential markets, were checked. The results of this analysis are presented in Table 5. In the vast majority of cases, they confirm the conclusions drawn on the basis of theoretical considerations. In particular, there is a very strong correlation between the comprehensive smart housing index and the smart economy index, which positively verifies the conclusions presented in Section 2.1 that, from the point of view of the smartness of the residential market, the development of the economic dimension of the smart city concept is crucial. In relation to the smart people dimension, a positive correlation with the analysed indicator can be observed, but it is insignificant, which makes any firm conclusions impossible. There is no correlation, however, between the smart governance index and the comprehensive smart housing index. This fact is not particularly surprising, as it may result from the specificity of the analysed cities. In particular, in Poland, the concept of governance is still being implemented. Despite the fact that in recent years a lot of progress has been made in this area, it should be emphasised that there is still a lot more to be done. This fact is indicated, among others, by the research conducted by Gross and Źróbek [62], who assessed the level of good governance in public real estate management systems in Poland in comparison with other countries in Europe.
The ultimate factor potentially driving the development of housing market intelligence was the indicator concerning the implementation of the co-working concept in the studied cities. The estimated correlation proved to be important and is consistent with previous theoretical considerations. In Poland, however, it may result mainly from the fact that the smart residential market is much more flexible, which provides better service for equally flexible co-working spaces. Co-working facilities in Poland, however, do not offer the option of shared living or at least the possibility of building relationships among the people working in the same office [63].
Next, the correlation between the comprehensive smart housing index and potential effects resulting from the increase in the smartness of residential markets in the analysed cities was assessed. The results of the study (see Table 6) confirmed almost entirely previous theoretical considerations on this issue. In particular, the empirical research showed that an increase in the smartness of housing markets improves the quality of life of residents mainly in economic terms (salary increase, lower unemployment).
Additionally, the obtained results confirm that the increase in the smartness of the residential markets increases the availability of housing. This may result from the fact that in smart housing markets there is much higher prevalence of the concept of shared living, which in the context of Poland may lead to, among others, the carving out of new residential units, e.g., in single-family houses belonging to elderly people. The rise in housing availability may also result from the increasingly common practice of constructing buildings with a larger number of flats, characterised by smaller size.
It should also be noted that the smart housing market is also characterised by active government action in the area of housing. In this respect, the activities of local authorities in creating new real estate resources for different social groups will undoubtedly increase both the general availability of housing but also its affordability. As regards the latter, there is some feedback loop whereby the smart housing market enables people to adapt their place of residence to their place of work, allowing them to choose the most attractive employer. This in turn translates into higher wages, which may lead to an increase in a person’s housing purchasing power.
Moreover, on the basis of Table 6 it can be seen that there is a negative correlation between the comprehensive smart housing index and the poverty index, which may indicate that the development of smart housing market in a given city also contributes to the reduction of poverty level. However, in this respect, the obtained correlation coefficient proved to be insignificant, which implies that this dependence should be analysed in subsequent studies.
4.2. Robustness Checks—Different Weights of Indicators
In order to control the results obtained in Section 4.1, the calculation of the Comprehensive Smart Housing Index using different weights of indicators has been carried out. Moreover, weights were calculated for indicators concerning the following synthetic indexes: (1) smart people index; (2) smart economy index; (3) smart governance index; and (4) poverty index.
In addition, two options were used to estimate the smartness of the housing markets. The first was to calculate weights for all indicators presented in Table 1. The second was to calculate weights for indexes synthetically describing each dimension of the smart housing concept (these indexes are presented in Table 3). The calculated weights of indicators are shown in Table 7. In particular, for the first option, the most important indicator was SH7, which describes the number of typical co-living facilities in a city. However, looking at the second option, the index describing the “automatic” rental housing market dimension of the smart housing concept proved to be crucial.
Estimates using different weights of indicators are almost entirely consistent with these presented in Section 4.1 (see Table 8). In particular, the housing markets in cities such as Cracow, Warsaw, Poznan, Wroclaw and Gdansk are still characterised by the highest levels of smartness. The biggest change in this respect concerns the city of Gdansk, which results from the fact that in this city there is the only functioning co-living facility in Poland [64]. Therefore, in the case of weighting of each indicator from Table 1, Gdansk’s position in the final ranking is artificially inflated; hence, two different weighting estimation procedures were applied when calculating the comprehensive smart housing index.
Moreover, when analysing Table 9 and Table 10, a similar consistency in the scope of potential driving forces and effects of the smart housing concept can also be observed (compare Table 5, Table 6, Table 9 and Table 10). The only difference concerns potential driving forces of the smart housing concept. In particular, there is little support for the conclusion that the development of the city in terms of smart people also contributes to the growth of the smartness of the housing market. However, this dependence is only significant in one case; hence, it should be the subject of future research.
5. Conclusions
The transformations in the functioning of cities currently underway require the appropriate adjustment of the housing market. This article attempted to determine these changes. In particular, the current residential market, following the example of the smart city concept, is becoming increasingly smarter. This smartness can be expressed in four dimensions, i.e., the “automatic” rental housing market; innovative digital platforms in the traditional housing market; innovative policies and housing models; and the ability to forecast demand on the housing market.
Moreover, the article empirically assessed the smartness of the residential markets in the Polish provincial capitals. It showed a very large variation in the scope of the analysed phenomenon in these cities (depending on the selection of weights of indicators, the coefficient of variation was equal to 51% or 97% or 106%). This large variation may result from the fact that the smart housing concept is a complete novelty in Poland and its level of development in comparison to other countries is low. In support of this thesis, one can cite, among others, statistics on the number of co-living facilities in given countries. In Poland, there is only one such facility, while in neighbouring Germany there are several thousand co-living beds available [65].
In addition, this article also examined the factors that may influence the development of a smart housing market. In this respect, the main determinants were the economic dimension of the smart city concept and the co-working concept, which is consistent with the theoretical analysis conducted in Section 2. Then, the positive effects of the implementation of the smart housing concept in urban spaces were examined. The results of the research indicated that the increase in the smartness of the residential market may have an impact on the improvement of the quality of life of residents in both social (increased housing availability) and economic terms (salary increase, lower unemployment).
The results obtained in the empirical study, however, should be treated with a certain degree of caution. This is due to the fact that only the correlation coefficient was used to estimate the relationships between the variables. In addition, the study has a cross-sectional character, which results from the novelty of the smart housing concept and the ensuing scarcity of available data. Future studies should take into account the change in the smartness value of the housing market in cities over time.
This study can be of importance to policy-makers as well. In particular, it highlights the weaknesses of public housing policies in Poland. Therefore, local authorities in Polish cities should seek innovative solutions in this area. In this respect, Polish policy-makers may base their approach on foreign experience, e.g., the city of Boston, which has established a unique Housing Innovation Lab [41] dealing with non-standard housing policies.
Funding
The research has been carried out as part of a research initiative financed by the Ministry of Science and Higher Education within “Regional Initiative of Excellence” Programme for 2019–2022. Project no.: 021/RID/2018/19. Total financing: 11 897 131.40 PLN.
Acknowledgments
I would like to thank Adam Nalepka and the anonymous reviewers for their constructive comments, which have led to meaningful improvements in the paper.
Conflicts of Interest
The author declares no conflict of interest.
Appendix A

Table A1.
Overview of residential platforms that fit into the “automatic” rental housing market dimension.
Table A1.
Overview of residential platforms that fit into the “automatic” rental housing market dimension.
| Name of Platform | Solutions Offered that Are a Good Fit to the “Automatic” Rental Housing Market |
|---|---|
| Flatio.com | The platform offers medium- and long-term tenancy agreements through an online platform and acts as an agent between the landlord and the potential tenant. The service user has the option to book a flat and the owner has to confirm or reject the reservation within 24 h. In addition, the user must create a profile on the basis of which the owner decides whether or not to rent the property. Other features of the platform:
|
| Pepehousing.com | The platform offers medium- and long-term tenancy agreements through an online platform and acts as an agent between the landlord and the potential tenant. The service user has the option to book a flat, and the owners must confirm or reject the reservation within 48 h. The user must create a profile on the basis of which the owner decides whether or not to rent the apartment. Other features of the platform:
|
| Rentflat24.pl | The platform offers medium- and long-term tenancy agreements through an online platform and acts as an agent between the landlord and the potential tenant. Other features of the platform:
|
| Easyrenting.pl | The platform offers medium- and long-term tenancy agreements through an online platform and acts as an agent between the landlord and the potential tenant. Other features of the platform:
|
Table A2.
Overview of selected innovative platforms operating in the Polish traditional housing market.
Table A2.
Overview of selected innovative platforms operating in the Polish traditional housing market.
| Name of Platform | Description of Innovative Functionalities |
|---|---|
| Ada.place |
|
| Obido.pl |
|
| Rynekpierwotny.pl |
|
| Otodom.pl |
|
Table A3.
Innovative housing policies in Polish provincial cities.
| City | Description of Innovative Housing Policies |
|---|---|
| Poznan |
|
| Szczecin |
|
| Gdansk |
|
| Lodz |
|
Table A4.
Values of indicators measuring the smartness of residential markets in studied cities.
| City | SH1 | SH2 | SH3 | SH4 | SH5 | SH6 | SH7 | SH8 |
|---|---|---|---|---|---|---|---|---|
| Wroclaw | 0.2 | 0.2 | 31.3 | 7.7 | 0.0 | 3.4 | 0 | −1.5 |
| Bydgoszcz | 0.0 | 0.0 | 4.3 | 2.4 | 0.0 | 1.1 | 0 | −0.5 |
| Lublin | 0.0 | 0.1 | 5.8 | 4.8 | 0.0 | 2.2 | 0 | 1.7 |
| Zielona Gora | 0.0 | 0.0 | 3.3 | 0.0 | 0.0 | 0.7 | 0 | 4.9 |
| Lodz | 0.3 | 0.1 | 5.2 | 2.7 | 2.0 | 1.5 | 0 | 2.7 |
| Cracow | 1.0 | 0.4 | 21.8 | 10.0 | 0.0 | 2.0 | 0 | 2.5 |
| Warsaw | 0.8 | 0.1 | 19.7 | 5.8 | 0.0 | 1.7 | 0 | −3.7 |
| Opole | 0.0 | 0.6 | 2.6 | 0.0 | 0.0 | 1.1 | 0 | 5.4 |
| Rzeszow | 0.0 | 0.3 | 3.8 | 4.4 | 0.0 | 1.4 | 0 | 4.2 |
| Bialystok | 0.0 | 0.1 | 1.7 | 1.8 | 0.0 | 0.6 | 0 | 6.1 |
| Gdansk | 0.1 | 0.1 | 5.5 | 3.9 | 3.3 | 1.7 | 1 | 0.0 |
| Katowice | 0.0 | 0.1 | 8.2 | 3.4 | 0.0 | 1.5 | 0 | 13.4 |
| Kielce | 0.0 | 0.1 | 3.8 | 0.0 | 0.0 | 0.9 | 0 | 6.4 |
| Olsztyn | 0.0 | 0.1 | 3.1 | 0.0 | 0.0 | 1.8 | 0 | 3.6 |
| Poznan | 0.3 | 0.2 | 11.1 | 5.9 | 11.0 | 3.4 | 0 | 1.9 |
| Szczecin | 0.0 | 0.1 | 4.1 | 1.9 | 10.0 | 0.7 | 0 | 3.9 |
Table A5.
Values of indicators measuring driving forces and effects of the smart housing concept.
| City | SHE1 | SP1 | SP2 | SP3 | SP4 | SP5 | SE1 | SE2 | SE3 | SE4 [%] | SE5 | SE6 [%] | SE7 | SG1 | SG2 [%] | SG3 | SG4 | SG5 [%] | PL1 [%] | PL2 [%] | WA1 | UR1 [%] | ND1 |
|---|---|---|---|---|---|---|---|---|---|---|---|---|---|---|---|---|---|---|---|---|---|---|---|
| Wroclaw | 16 | 218 | 433.9 | 1730.8 | 3.9 | 56 | 7.8 | 30.2 | 12.6 | 1.8 | 2.6 | 0.2 | 3.7 | 39.0 | 53.9 | 7.2 | 18 | 24.3 | 37.5 | 0.9 | 5338.5 | 1.8 | 513.6 |
| Bydgoszcz | 9 | 107 | 201.2 | 772.7 | 2.0 | 35 | 6.6 | 7.7 | 8.1 | 3.6 | 1.3 | 0.1 | 0.7 | 45.7 | 53.0 | 6.5 | 79 | 35.5 | 39.2 | 1.4 | 4481.4 | 3.6 | 432.1 |
| Lublin | 7 | 211 | 480.5 | 1795.4 | 2.6 | 55 | 6.8 | 36.2 | 9.8 | 5.5 | 2.0 | 0.1 | 0.9 | 44.2 | 54.7 | 11.5 | 91 | 30.0 | 47.2 | 1.9 | 4708.4 | 5.5 | 456.1 |
| Zielona Gora | 1 | 150 | 165.5 | 707.6 | 1.4 | 50 | 6.4 | 7.9 | 10.4 | 3.4 | 0.7 | 0.0 | 1.7 | 46.3 | 56.1 | 6.0 | 31 | 12.0 | 27.8 | 2.3 | 4419.3 | 3.4 | 437.4 |
| Lodz | 11 | 152 | 248.7 | 956.8 | 2.9 | 41 | 7.0 | 20.1 | 9.9 | 5.5 | 1.2 | 0.1 | 0.8 | 72.8 | 57.5 | 2.5 | 70 | 37.5 | 45.6 | 3.7 | 4779.5 | 5.5 | 523.9 |
| Cracow | 23 | 288 | 507.9 | 1750.4 | 2.7 | 56 | 7.3 | 30.5 | 11.1 | 2.4 | 2.8 | 0.2 | 3.6 | 38.9 | 58.4 | 10.3 | 117 | 23.3 | 40.2 | 1.2 | 5368.4 | 2.4 | 505.3 |
| Warsaw | 94 | 242 | 294.1 | 1234.9 | 4.0 | 75 | 8.0 | 22.0 | 13.6 | 1.5 | 1.3 | 0.1 | 3.9 | 46.7 | 66.6 | 6.2 | 52 | 42.1 | 35.3 | 1.1 | 6432.8 | 1.5 | 548.8 |
| Opole | 2 | 307 | 428.2 | 1495.2 | 3.1 | 61 | 12.5 | 17.9 | 7.9 | 3.3 | 1.2 | 0.0 | 0.1 | 40.6 | 54.6 | 21.0 | 109 | 28.0 | 37.3 | 0.9 | 4797.2 | 3.3 | 442.8 |
| Rzeszow | 4 | 196 | 626.8 | 1978.5 | 3.1 | 51 | 9.9 | 28.3 | 8.1 | 5.2 | 1.7 | 0.1 | 0.2 | 39.9 | 55.8 | 18.4 | 64 | 16.0 | 54.1 | 2.4 | 4802.4 | 5.2 | 425.9 |
| Bialystok | 9 | 148 | 249.2 | 833.8 | 3.4 | 44 | 6.7 | 9.4 | 9.6 | 6.2 | 0.3 | 0.0 | 0.3 | 40.3 | 53.5 | 7.9 | 103 | 32.1 | 43.1 | 2.6 | 4396.3 | 6.2 | 443.7 |
| Gdansk | 10 | 256 | 372.1 | 1393.2 | 2.8 | 44 | 7.7 | 16.4 | 12.4 | 2.6 | 2.5 | 0.1 | 1.6 | 39.7 | 60.7 | 9.3 | 62 | 29.4 | 36.3 | 1.1 | 5642.0 | 2.6 | 490.7 |
| Katowice | 9 | 244 | 502.2 | 1889.9 | 3.7 | 52 | 10.2 | 27.8 | 8.3 | 1.6 | 2.8 | 0.1 | 4.5 | 90.0 | 51.4 | 4.7 | 172 | 28.6 | 41.4 | 1.9 | 5699.0 | 1.6 | 492.6 |
| Kielce | 4 | 182 | 338.0 | 1035.1 | 4.1 | 48 | 12.3 | 14.3 | 8.8 | 5.4 | 1.3 | 0.0 | 0.1 | 35.8 | 56.8 | 17.1 | 41 | 36.0 | 38.9 | 2.7 | 4493.2 | 5.4 | 434.6 |
| Olsztyn | 2 | 211 | 354.4 | 1199.6 | 2.3 | 60 | 7.5 | 19.6 | 9.2 | 3.4 | 0.6 | 0.0 | 0.3 | 37.1 | 56.2 | 2.6 | 92 | 40.0 | 28.9 | 2.6 | 4648.6 | 3.4 | 453.6 |
| Poznan | 26 | 150 | 512.1 | 1940.4 | 4.5 | 68 | 8.4 | 33.1 | 11.8 | 1.2 | 1.9 | 0.1 | 1.5 | 28.0 | 57.2 | 7.4 | 26 | 41.2 | 30.9 | 1.7 | 5355.6 | 1.2 | 488.1 |
| Szczecin | 5 | 155 | 190.7 | 816.4 | 3.0 | 47 | 5.5 | 27.8 | 11.3 | 2.5 | 0.8 | 0.0 | 0.4 | 31.6 | 52.0 | 6.6 | 43 | 32.3 | 26.4 | 1.7 | 5007.5 | 2.5 | 447.4 |
References
- Kirby, A. Current research on cities and its contribution to urban studies. Cities 2012, 29, S3–S8. [Google Scholar] [CrossRef]
- Krzemińska, A.E.; Zaręba, A.D.; Dzikowska, A.; Jarosz, K.R. Cities of the future-bionic systems of new urban environment. Environ. Sci. Pollut. Res. 2019, 26, 8362–8370. [Google Scholar] [CrossRef] [PubMed]
- Hoffmann, B. Air pollution in cities: Urban and transport planning determinants and health in cities. In Integrating Human Health into Urban and Transport Planning; Nieuwenhuijsen, M., Khreis, H., Eds.; Springer International Publishing: Cham, Switzerland, 2019; pp. 425–441. [Google Scholar]
- Karaköse, M.; Yetiş, H. A cyberphysical system based mass-customization approach with integration of industry 4.0 and smart city. Wirel. Commun. Mob. Comput. 2017, 2017, 1–9. [Google Scholar] [CrossRef]
- Łaszek, J.; Olszewski, K. Regional development of residential and commercial real estate in Poland and the risk of real estate cycles. Barom. Reg. Anal. I Progn. 2018, 51, 41–51. [Google Scholar]
- Maalsen, S. Smart housing: The political and market responses of the intersections between housing, new sharing economies and smart cities. Cities 2019, 84, 1–7. [Google Scholar] [CrossRef]
- Vishnivetskaya, A.; Alexandrova, E. Smart city concept. Implementation practice. IOP Conf. Ser. Mater. Sci. Eng. 2019, 497, 012019. [Google Scholar] [CrossRef]
- Kunzmann, K.R. Smart cities: A new paradigm of urban development. Crios 2014, 4, 9–20. [Google Scholar]
- Eremia, M.; Toma, L.; Sanduleac, M. The smart city concept in the 21st century. Procedia Eng. 2017, 181, 12–19. [Google Scholar] [CrossRef]
- Imran; Ahmad, S.; Kim, D. Design and implementation of thermal comfort system based on tasks allocation mechanism in smart homes. Sustainability 2019, 11, 5849. [Google Scholar] [CrossRef] [Green Version]
- Gu, W.; Bao, P.; Hao, W.; Kim, J. Empirical examination of intention to continue to use smart home services. Sustainability 2019, 11, 5213. [Google Scholar] [CrossRef] [Green Version]
- Ferrández-Pastor, F.-J.; Mora, H.; Jimeno-Morenilla, A.; Volckaert, B. Deployment of IoT edge and fog computing technologies to develop smart building services. Sustainability 2018, 10, 3832. [Google Scholar] [CrossRef] [Green Version]
- Battista, G.; Evangelisti, L.; Guattari, C.; Basilicata, C.; De Lieto Vollaro, R. Buildings energy efficiency: interventions analysis under a smart cities approach. Sustainability 2014, 6, 4694–4705. [Google Scholar] [CrossRef] [Green Version]
- Elariane, S.A.; Dubé, J. Is smart housing a good deal? An answer based on monte carlo net present value analysis. Sustainability 2019, 11, 4193. [Google Scholar] [CrossRef] [Green Version]
- Alavi, S.A.; Rahmati, S.G.; Rezaali, M.; Mashayekhi, H. Analysis of intelligent indicators in reduction of urban housing damage (case study district 1 in Tehran). AJW 2019, 16, 109–118. [Google Scholar] [CrossRef]
- GhaffarianHoseini, A.; Ibrahim, R.; Baharuddin, M.N.; GhaffarianHoseini, A. Creating green culturally responsive intelligent buildings: Socio-cultural and environmental influences. Intell. Build. Int. 2011, 3, 5–23. [Google Scholar] [CrossRef]
- Kinder, T. Social innovation in services: Technologically assisted new care models for people with dementia and their usability. IJTM 2010, 51, 106. [Google Scholar] [CrossRef]
- Butryn, K.; Jasińska, E.; Kovalyshyn, O.; Preweda, E. Sustainable formation of urban development on the example of the primary real estate market in Krakow. E3S Web Conf. 2019, 86, 00010. [Google Scholar] [CrossRef]
- Park, S.; Lee, S.; Park, S.; Park, S. AI-based physical and virtual platform with 5-layered architecture for sustainable smart energy city development. Sustainability 2019, 11, 4479. [Google Scholar] [CrossRef] [Green Version]
- David, M.; Koch, F. Smart is not smart enough! Anticipating critical raw material use in smart city concepts: The example of smart grids. Sustainability 2019, 11, 4422. [Google Scholar] [CrossRef] [Green Version]
- Guo, Y.-M.; Huang, Z.-L.; Guo, J.; Li, H.; Guo, X.-R.; Nkeli, M.J. Bibliometric analysis on smart cities research. Sustainability 2019, 11, 3606. [Google Scholar] [CrossRef] [Green Version]
- Sikora-Fernandez, D. Smarter cities in post-socialist country: Example of Poland. Cities 2018, 78, 52–59. [Google Scholar] [CrossRef]
- Kitchin, R. The real-time city? Big data and smart urbanism. GeoJournal 2014, 79, 1–14. [Google Scholar] [CrossRef] [Green Version]
- Kourtit, K.; Nijkamp, P.; Arribas, D. Smart cities in perspective—A comparative European study by means of self-organizing maps. Innov. Eur. J. Soc. Sci. Res. 2012, 25, 229–246. [Google Scholar] [CrossRef]
- Milošević, M.R.; Milošević, D.M.; Stević, D.M.; Stanojević, A.D. Smart city: Modeling key indicators in Serbia using IT2FS. Sustainability 2019, 11, 3536. [Google Scholar] [CrossRef] [Green Version]
- Schiek, D.; Gideon, A. Outsmarting the gig-economy through collective bargaining—EU competition law as a barrier to smart cities? Int. Rev. Law Comput. Technol. 2018, 32, 275–294. [Google Scholar] [CrossRef] [Green Version]
- Stewart, A.; Stanford, J. Regulating work in the gig economy: What are the options? Econ. Labour Relat. Rev. 2017, 28, 420–437. [Google Scholar] [CrossRef]
- Tran, M.; Sokas, R. The gig economy and contingent work: An occupational health assessment. J. Occup. Environ. Med. 2017, 59, 63–66. [Google Scholar] [CrossRef] [Green Version]
- Brennen, J.S.; Kreiss, D. Digitalization. In The International Encyclopedia of Communication Theory and Philosophy; Jensen, K.B., Rothenbuhler, E.W., Pooley, J.D., Craig, R.T., Eds.; John Wiley & Sons, Inc.: Hoboken, NJ, USA, 2016; pp. 1–11. [Google Scholar]
- Gobble, M.M. Digitalization, digitization, and innovation. Res. Technol. Manag. 2018, 61, 56–59. [Google Scholar] [CrossRef]
- Piazolo, D. Real estate digitalization and the underlying modes of operation. In Proceedings of the 25th Annual European Real Estate Society Conference, Reading, UK, 27–30 June 2018. [Google Scholar]
- Sittler, P. Digitalization in real estate. In 24th Annual European Real Estate Society Conference; European Real Estate Society: Delft, The Netherlands, 2017. [Google Scholar]
- Veuger, J. A dramatic and irreversible shift in real estate systems. Int. J. Eng. Sci. Res. Technol. 2018, 7, 307–314. [Google Scholar]
- Rogers, D. Uploading real estate: Home as a digital, global commodity. In Housing and Home Unbound. Intersections in Economics, Environment and Politics in Australia; Cook, N., Davison, A., Crabtree, L., Eds.; Routledge: London, UK, 2016; pp. 37–52. [Google Scholar]
- Fields, D.; Rogers, D. Towards a critical housing studies research agenda on platform real estate. Hous. Theory Soc. 2019, 20, 1–23. [Google Scholar] [CrossRef] [Green Version]
- Morano, P.; Rosato, P.; Tajani, F.; Manganelli, B.; Di Liddo, F. Contextualized property market models vs. generalized mass appraisals: An innovative approach. Sustainability 2019, 11, 4896. [Google Scholar] [CrossRef] [Green Version]
- World Health Organization. Urban Population Growth. Available online: https://www.who.int/gho/urban_health/situation_trends/urban_population_growth_text/en/ (accessed on 4 January 2020).
- Filandri, M.; Bertolini, S. Young people and home ownership in Europe. Int. J. Hous. Policy 2016, 16, 144–164. [Google Scholar] [CrossRef]
- Zheng, S.; Cheng, Y.; Ju, Y. Understanding the intention and behavior of renting houses among the young generation: Evidence from Jinan, China. Sustainability 2019, 11, 1507. [Google Scholar] [CrossRef] [Green Version]
- Weeks, L.E.; LeBlanc, K. Housing concerns of vulnerable older Canadians. Can. J. Aging 2010, 29, 333–347. [Google Scholar] [CrossRef] [PubMed]
- Housing Innovation Lab. Available online: https://www.boston.gov/housing/housing-innovation-lab (accessed on 8 December 2019).
- Quinio, V.; Burgess, G. Is Co-Living a Housing Solution for Vulnerable Older People? Cambridge Centre for Housing & Planning Research: Cambridge, UK, 2018. [Google Scholar]
- Wyatt, A. Home sharing: An important housing option for US cities. Focus 2018, 14, 83–88. [Google Scholar]
- Cho, G.-H.; Woo, A.; Kim, J. Shared housing as a potential resource for community building. Cities 2019, 87, 30–38. [Google Scholar] [CrossRef]
- Woo, A.; Cho, G.-H.; Kim, J. Would you share your home? The multifaceted determinants of preference for shared housing among young adults. Appl. Geogr. 2019, 103, 12–21. [Google Scholar] [CrossRef]
- Horn, K.; Merante, M. Is home sharing driving up rents? Evidence from Airbnb in Boston. J. Hous. Econ. 2017, 38, 14–24. [Google Scholar] [CrossRef]
- Shafique, A. Co-Living and the Common Good; RSA: London, UK, 2018. [Google Scholar]
- Green, S.; McCarthy, L. Is sharing the solution? Exploring the opportunities and challenges of privately rented shared accommodation for single people in housing need. People Place Policy Online 2015, 9, 159–176. [Google Scholar] [CrossRef] [Green Version]
- Ataman, C.; Dino, I.G. Collective residential spaces in sustainability development: Turkish housing units within co-living understanding. IOP Conf. Ser. Earth Environ. Sci. 2019, 296, 012049. [Google Scholar] [CrossRef]
- Fix, R.; Lesniak, M. The Present and Future of Co-Living Typologies and Business Models. Available online: https://coliving.pressbooks.com/chapter/the-present-and-future-of-co-living-typologies-and-business-models/ (accessed on 8 December 2019).
- Bouncken, R.; Clauss, T.; Reuschl, A. Coworking-spaces in Asia: A business model design perspective. In Proceedings of the SMS Special Conference, Hong Kong, China, 11 December 2016. [Google Scholar]
- Mause, K. The Tragedy of the commune: Learning from worst-case scenarios. J. Socio Econ. 2008, 37, 308–327. [Google Scholar] [CrossRef]
- Tsatsaronis, K.; Zhu, H. What drives housing price dynamics: Cross-Country evidence. BIS Q. Rev. 2004, 65–67. Available online: https://www.bis.org/publ/qtrpdf/r_qt0403f.pdf (accessed on 14 January 2020).
- Akande, A.; Cabral, P.; Gomes, P.; Casteleyn, S. The Lisbon ranking for smart sustainable cities in Europe. Sustain. Cities Soc. 2019, 44, 475–487. [Google Scholar] [CrossRef]
- Jarocka, M. Wybór formuły normalizacyjnej w analizie porównawczej obiektów wielocechowych. Ekon. Zarządzanie 2015, 1, 113–126. [Google Scholar]
- Yin, G.; Lin, Z.; Jiang, X.; Qiu, M.; Sun, J. How do the industrial land use intensity and dominant industries guide the urban land use? Evidences from 19 industrial land categories in ten cities of China. Sustain. Cities Soc. 2020, 53, 101978. [Google Scholar] [CrossRef]
- Bolboaca, S.-D.; Jäntschi, L. Pearson versus spearman, kendall’s tau correlation analysis on structure-activity relationships of biologic active compounds. Leonardo J. Sci. 2006, 5, 179–200. [Google Scholar]
- Walker, D.A. Confidence intervals for Kendall’s tau with small samples (SPSS). J. Mod. App. Stat. Meth. 2016, 15, 868–883. [Google Scholar] [CrossRef] [Green Version]
- Helsel, D.R.; Hirsch, R.M. Statistical Methods in Water Resources; U.S. Geological Survey: Reston, VA, USA, 2002.
- Antonowicz, M.; Bogucka, K. Coworking-nowy produkt dla pasażera kolei. Probl. Transp. Logistyki 2019, 46, 7–18. [Google Scholar]
- Marona, B.; Van den Beemt-Tjeerdsma, A. Impact of public management approaches on municipal real estate management in Poland and The Netherlands. Sustainability 2018, 10, 4291. [Google Scholar] [CrossRef] [Green Version]
- Gross, M.; Źróbek, R. Good governance in some public real estate management systems. Land Use Policy 2015, 49, 352–364. [Google Scholar] [CrossRef]
- Skowron-Mielnik, B.; Sawulska, S. Coworking-analiza zjawiska i oferty rynkowej. Mark. Rynek 2016, 3, 835–849. [Google Scholar]
- Popowska, M. Co-Living or a sandpit for future entrepreneurs. First experience from Poland. Stud. Mater. 2017, 23, 7–13. [Google Scholar] [CrossRef]
- Lustigman, R.; Hillman, P.; Kingdom, J.; Challis, A. JLL European Coliving Index; JLL: Chicago, IL, USA, 2019. [Google Scholar]
Figure 1.
Key drivers, dimensions and potential effects of the smart housing concept.

Figure 2.
The level of smartness of housing markets by city and dimension.

Figure 3.
Spatial diversification of the level of smartness of residential markets in the examined cities. Note: in order to present the data better, whole provinces were marked instead of individual cities.
Figure 3.
Spatial diversification of the level of smartness of residential markets in the examined cities. Note: in order to present the data better, whole provinces were marked instead of individual cities.

Table 1.
Indicators to assess the smartness of a housing market.
| Dimensions of the Smart Housing Concept | Indicators |
|---|---|
| The “automatic” rental housing market a |
|
| Innovative digital platforms in the traditional housing market a |
|
| Innovative policies and housing models a |
|
| The ability to forecast demand on the housing market b |
|
All the above indicators, except one, are stimulants, i.e., an increase in their value is assessed positively. Conversely, the indicator concerning the difference in the average size between flats sold and flats completed is a nominant variable; in particular, the desired value is 0. a In these cases, the indicators were evaluated as of the 4 November 2019. b In this case, the indicator applies to 2018 as a whole. c Table A1 contains the descriptions of these platforms, in particular, solutions offered that are a good fit to the “automatic” rental housing market. d Table A2 contains the descriptions of these platforms, in particular, their innovative solutions for the traditional housing market. e Table A3 contains the descriptions of the innovative activities of studied cities in the area of housing policy. Table A4 contains values of the above indicators.
Table 2.
Potential driving forces and effects of the smart housing concept.
| Driving Forces | Indicators |
| Sharing economy a |
|
| Smart people |
|
| Smart economy |
|
| Smart governance |
|
| Effects | Indicators |
| Lower poverty level |
|
| Increase of wages |
|
| Lower unemployment |
|
| Increased housing availability and affordability |
|
a It should be noted that the smart housing concept incorporates the sharing economy to a certain extent, which can be manifested in the dimension of innovative housing policies and models. In particular, it concerns the tendency of society towards shared living. The sharing economy, however, can drive the development of smart housing also through the concept of co-working, which is directly derived from it [60]. All the above indicators, except one (a variable describing unemployment rate (destimulant) in the smart economy index), are stimulants. Depending on data availability, the indicators are for 2018 or 2019. Table A5 contains values of the above indicators.
Table 3.
Comprehensive Smart House Index estimates.
| City | Comprehensive Smart Housing Index | “Automatic” Rental Housing Market Index (SHI1) | Innovative Digital Platforms in the Traditional Housing Market Index (SHI2) | Innovative Policies and Housing Models Index (SHI3) | Ability to Forecast Demand on the Housing Market Index (SHI4) | |||||
|---|---|---|---|---|---|---|---|---|---|---|
| Score | Rank | Score | Rank | Score | Rank | Score | Rank | Score | Rank | |
| Cracow | 0.692 | 1 | 1.000 | 1 | 0.784 | 1 | 0.165 | 7 | 0.817 | 6 |
| Poznan | 0.567 | 2 | 0.317 | 3 | 0.430 | 4 | 0.661 | 1 | 0.861 | 5 |
| Wroclaw | 0.524 | 3 | 0.184 | 5 | 0.691 | 2 | 0.333 | 4 | 0.887 | 3 |
| Warsaw | 0.516 | 4 | 0.734 | 2 | 0.468 | 3 | 0.134 | 9 | 0.728 | 9 |
| Gdansk | 0.479 | 5 | 0.106 | 6 | 0.220 | 9 | 0.590 | 2 | 1.000 | 1 |
| Lodz | 0.370 | 6 | 0.289 | 4 | 0.188 | 10 | 0.203 | 5 | 0.799 | 7 |
| Lublin | 0.329 | 7 | 0.000 | 7 | 0.244 | 8 | 0.195 | 6 | 0.876 | 4 |
| Szczecin | 0.298 | 8 | 0.000 | 7 | 0.146 | 11 | 0.336 | 3 | 0.711 | 10 |
| Bydgoszcz | 0.288 | 9 | 0.000 | 7 | 0.125 | 12 | 0.064 | 12 | 0.964 | 2 |
| Rzeszow | 0.280 | 10 | 0.000 | 7 | 0.341 | 6 | 0.091 | 11 | 0.688 | 11 |
| Opole | 0.250 | 11 | 0.000 | 7 | 0.344 | 5 | 0.061 | 13 | 0.595 | 13 |
| Olsztyn | 0.238 | 12 | 0.000 | 7 | 0.085 | 14 | 0.139 | 8 | 0.729 | 8 |
| Zielona Gora | 0.167 | 13 | 0.000 | 7 | 0.021 | 16 | 0.016 | 15 | 0.632 | 12 |
| Bialystok | 0.160 | 14 | 0.000 | 7 | 0.098 | 13 | 0.000 | 16 | 0.543 | 14 |
| Kielce | 0.156 | 15 | 0.000 | 7 | 0.064 | 15 | 0.035 | 14 | 0.526 | 15 |
| Katowice | 0.098 | 16 | 0.000 | 7 | 0.280 | 7 | 0.112 | 10 | 0.000 | 16 |
Table 4.
Classification of the examined cities into groups of similar objects according to the comprehensive smart housing index.
Table 4.
Classification of the examined cities into groups of similar objects according to the comprehensive smart housing index.
| Group | Quantity | Percentage | Cities |
|---|---|---|---|
| Weak | 3 | 18.75% | Bialystok, Katowice, Kielce |
| Average | 7 | 43.75% | Bydgoszcz, Lublin, Zielona Gora, Opole, Rzeszow, Olsztyn, Szczecin |
| Good | 2 | 12.50% | Lodz, Gdansk |
| Best | 4 | 25.00% | Wroclaw, Cracow, Warsaw, Poznan |
The assignment to a given group was made according to the following formula [61]: best group: ; good group: ; average group: ; weak group: ; where —the average value of Comprehensive Smart Housing Index, —a value of Comprehensive Smart Housing Index for i-th city, —the standard deviation of Comprehensive Smart Housing Index.
Table 5.
Potential driving forces of the smart housing concept—correlation coefficients.
| Driving Forces | Correlation Coefficient |
|---|---|
| Smart People Index | 0.27 |
| Smart Economy Index | 0.53 *** |
| Smart Governance Index | −0.07 |
| Number of co-working places in the city | 0.59 *** |
*** One percent level of significance.
Table 6.
Potential effects of the smart housing concept—correlation coefficients.
| Effects | Correlation Coefficient |
|---|---|
| Poverty Index | −0.20 |
| Average gross monthly salary | 0.47 ** |
| Unemployment rate | −0.34 * |
| Number of dwellings per 1000 inhabitants | 0.42 ** |
** Five percent level of significance. * Ten percent level of significance.
Table 7.
The weights of indicators.
| Index | Indicator/Index | Weight [%] |
|---|---|---|
| Comprehensive smart housing index (the first option of calculating weights) | SH1 | 17.01 |
| SH2 | 5.40 | |
| SH3 | 7.18 | |
| SH4 | 5.71 | |
| SH5 | 20.92 | |
| SH6 | 4.50 | |
| SH7 | 38.16 | |
| SH8 | 1.12 | |
| Comprehensive smart housing index (the second option of calculating weights) | SHI1 | 61.46 |
| SHI2 | 13.57 | |
| SHI3 | 20.89 | |
| SHI4 | 4.08 | |
| Smart people index | SP1 | 18.25 |
| SP2 | 24.09 | |
| SP3 | 27.77 | |
| SP4 | 13.26 | |
| SP5 | 16.63 | |
| Smart economy index | SE1 | 12.10 |
| SE2 | 11.80 | |
| SE3 | 15.15 | |
| SE4 | 9.77 | |
| SE5 | 10.33 | |
| SE6 | 17.40 | |
| SE7 | 23.45 | |
| Smart governance index | SG1 | 24.24 |
| SG2 | 20.94 | |
| SG3 | 24.40 | |
| SG4 | 20.11 | |
| SG5 | 10.31 | |
| Poverty index | PL1 | 41.23 |
| PL2 | 58.77 |
Table 8.
Comprehensive smart house index (CSHI) estimates using different weights of indicators.
| City | The CSHI Using Equal Weights of Indicators (Baseline Estimates) | The CSHI Using Weights Calculated for Indexes Describing Each Dimension of the Smart Housing Concept | The CSHI Using Weights Calculated for All Indicators Describing the Smart Housing Concept | |||
|---|---|---|---|---|---|---|
| Score | Rank | Score | Rank | Score | Rank | |
| Wroclaw | 0.524 | 3 | 0.313 | 4 | 0.218 | 6 |
| Bydgoszcz | 0.288 | 9 | 0.070 | 12 | 0.042 | 12 |
| Lublin | 0.329 | 7 | 0.109 | 8 | 0.080 | 8 |
| Zielona Gora | 0.167 | 13 | 0.032 | 16 | 0.014 | 16 |
| Lodz | 0.370 | 6 | 0.278 | 5 | 0.165 | 7 |
| Cracow | 0.692 | 1 | 0.789 | 1 | 0.344 | 3 |
| Warsaw | 0.516 | 4 | 0.572 | 2 | 0.239 | 4 |
| Opole | 0.250 | 11 | 0.084 | 10 | 0.071 | 10 |
| Rzeszow | 0.280 | 10 | 0.093 | 9 | 0.078 | 9 |
| Bialystok | 0.160 | 14 | 0.036 | 15 | 0.023 | 14 |
| Gdansk | 0.479 | 5 | 0.259 | 6 | 0.547 | 1 |
| Katowice | 0.098 | 16 | 0.061 | 13 | 0.066 | 11 |
| Kielce | 0.156 | 15 | 0.037 | 14 | 0.022 | 15 |
| Olsztyn | 0.238 | 12 | 0.070 | 11 | 0.042 | 13 |
| Poznan | 0.567 | 2 | 0.426 | 3 | 0.395 | 2 |
| Szczecin | 0.298 | 8 | 0.119 | 7 | 0.238 | 5 |
Table 9.
Potential driving forces of the smart housing concept—correlation coefficients (robustness checks).
Table 9.
Potential driving forces of the smart housing concept—correlation coefficients (robustness checks).
| Driving Forces | Correlation Coefficient a | Correlation Coefficient b |
|---|---|---|
| Smart people index | 0.33 * | 0.28 |
| Smart economy index | 0.63 *** | 0.55 *** |
| Smart governance index | 0.03 | −0.02 |
| Number of co-working places in the city | 0.62 *** | 0.55 *** |
*** One percent level of significance. * Ten percent level of significance. a Correlations regarding the CSHI using weights calculated for indexes describing each dimension of the smart housing concept. b Correlations regarding the CSHI using weights calculated for all indicators describing the smart housing concept.
Table 10.
Potential effects of the smart housing concept—correlation coefficients (robustness checks).
Table 10.
Potential effects of the smart housing concept—correlation coefficients (robustness checks).
| Effects | Correlation Coefficient a | Correlation Coefficient b |
|---|---|---|
| Poverty index | −0.25 | −0.23 |
| Average gross monthly salary | 0.62 *** | 0.63 *** |
| Unemployment rate | −0.39 ** | −0.37 ** |
| Number of dwellings per 1000 inhabitants | 0.50 *** | 0.42 ** |
*** One percent level of significance. ** Five percent level of significance. a Correlations regarding the CSHI using weights calculated for indexes describing each dimension of the smart housing concept. b Correlations regarding the CSHI using weights calculated for all indicators describing the smart housing concept.
© 2020 by the author. Licensee MDPI, Basel, Switzerland. This article is an open access article distributed under the terms and conditions of the Creative Commons Attribution (CC BY) license (http://creativecommons.org/licenses/by/4.0/).
Share and Cite
MDPI and ACS Style
Tomal, M. Moving towards a Smarter Housing Market: The Example of Poland. Sustainability 2020, 12, 683. https://doi.org/10.3390/su12020683
AMA Style
Tomal M. Moving towards a Smarter Housing Market: The Example of Poland. Sustainability. 2020; 12(2):683. https://doi.org/10.3390/su12020683
Chicago/Turabian StyleTomal, Mateusz. 2020. "Moving towards a Smarter Housing Market: The Example of Poland" Sustainability 12, no. 2: 683. https://doi.org/10.3390/su12020683
Note that from the first issue of 2016, this journal uses article numbers instead of page numbers. See further details here.