Extracting Knowledge from Big Data for Sustainability: A Comparison of Machine Learning Techniques

1
Department of Computer Engineering, Punjabi University, Patiala 147002, India
2
Department of Industrial Engineering, University of Naples Federico II, P.le Tecchio 80, 80125 Naples, Italy
3
Department of Engineering, Centro Direzionale di Napoli, Isola C4, 80143 Naples, Italy
*
Author to whom correspondence should be addressed.
Sustainability 2019, 11(23), 6669; https://doi.org/10.3390/su11236669
Submission received: 24 September 2019
/
Revised: 18 November 2019
/
Accepted: 18 November 2019
/
Published: 25 November 2019
(This article belongs to the Special Issue Knowledge Management for Sustainability-oriented Performance)
Abstract
:At present, due to the unavailability of natural resources, society should take the maximum advantage of data, information, and knowledge to achieve sustainability goals. In today’s world condition, the existence of humans is not possible without the essential proliferation of plants. In the photosynthesis procedure, plants use solar energy to convert into chemical energy. This process is responsible for all life on earth, and the main controlling factor for proper plant growth is soil since it holds water, air, and all essential nutrients of plant nourishment. Though, due to overexposure, soil gets despoiled, so fertilizer is an essential component to hold the soil quality. In that regard, soil analysis is a suitable method to determine soil quality. Soil analysis examines the soil in laboratories and generates reports of unorganized and insignificant data. In this study, different big data analysis machine learning methods are used to extracting knowledge from data to find out fertilizer recommendation classes on behalf of present soil nutrition composition. For this experiment, soil analysis reports are collected from the Tata soil and water testing center. In this paper, Mahoot library is used for analysis of stochastic gradient descent (SGD), artificial neural network (ANN) performance on Hadoop environment. For better performance evaluation, we also used single machine experiments for random forest (RF), K-nearest neighbors K-NN, regression tree (RT), support vector machine (SVM) using polynomial function, SVM using radial basis function (RBF) methods. Detailed experimental analysis was carried out using overall accuracy, AUC–ROC (receiver operating characteristics (ROC), and area under the ROC curve (AUC)) curve, mean absolute prediction error (MAE), root mean square error (RMSE), and coefficient of determination (R2) validation measurements on soil reports dataset. The results provide a comparison of solution classes and conclude that the SGD outperforms other approaches. Finally, the proposed results support to select the solution or recommend a class which suggests suitable fertilizer to crops for maximum production.
1. Introduction
In the production of crops, the role of plant nutrients is well established. The essential nutrients are carbon (C), hydrogen (H), oxygen (O), nitrogen (N), potassium (K), calcium (Ca), and phosphorus (P). The required quantity of these nutrients should be present in the crops for yield targets. These nutrients come from various sources like atmosphere, soil, irrigation water, and mineral fertilizers. Any deficient nutrition can affect crop growth. The combinations and quantities of nutrients to be supplied depending on various factors including type of crops, soils, etc. The photochemical process provides the necessary energy required for burgeoning of a plant [1]. Soil helps in completing the process by holding air, nutrients, and water. Moreover, soil expedites the plant growth by supplying the nutrients for making carbohydrates. Each soil type has its own different features i.e., various nutrients present in the soil. The deficiency of the nutrients leads to decrease in productivity. Therefore, there is need for soil analysis. In this regard, soil analysis plays an imperative role to know about the nutrient contents of soil. After performing the soil analysis, an appropriate amount of fertilizers can be added to the soil to balance the nutrient content, and thus enhancing the agricultural productivity. The Agriculture department provides thousands of data files related to production. According to the latest updates, the agriculture-related data files are estimated to grow four times more by the end of 2019. Thus, the collection of thousands of different sets of data related files in itself forms a big dataset. It’s really impossible to handle big datasets with the traditional techniques, therefore, to handle the big datasets one needs to deploy big data analysis [2].
The recommendations to soil nutrients problem can be proposed in two ways—manual and automated using intelligent algorithms. The judgment for the manual recommendations is made by the field experts. However, the expert’s judgments depend on their experience and could be biased and inaccurate in some cases, which leads to financial loss or effects on crop production. An alternate method is the intelligent algorithms that use historical data for decision making. The decision depends on historical data so the accuracy of the system is very high and constant. This type of system is called expert system. It learns from data and recommends a solution based on historical evidence. This type of system does not exist in the agriculture sector because the mechanical devices which are used for soil analysis, generate complex and unstructured data that convert data into big data [3,4,5]. Traditional tools and techniques failed to handle big data, and the solution to this problem is big data analytics.
The basic goal of our study is to develop a soil report classification system that will be beneficial for farmers for using the appropriate amount of fertilizers to enhance the quality of soil. To achieve the goal of this paper, new tools and technologies are required to analyze the data flow and find the conclusions from large dataset. The solution to this problem is big data analysis. The most associated tool with big data analytics is Hadoop. This Hadoop framework permits the distributed process using MapReduce programming model of large dataset clusters. In this system, new data is created through analyzing, managing and accessing the data assembled from Tata laboratories with unusual patterns. The classification techniques stochastic gradient descent (SGD), artificial neural network (ANN), random forest (RF), K-NN, regression tree (RT), support vector machine (SVM) using polynomial function, SVM using radial basis function (RBF) have been studied for getting an insight into the soil analysis reports. Previous reports developed by experts are utilized to train the classification models. Later training, the prediction framework will consider the present data of the soil to predict the solutions or recommendation class suggests the fertilizer quantity for wheat and paddy crop which helps for the better growth of the crop production. This type of classification system has been already implemented in many fields such as the public sector, health sector [4,6], e-commerce sector, networking [7], telecommunication sector [3,8] and banking sector [9]. Therefore, the present study aims to bridge the research gap by investigating the classification systems related to soil reports and provide significant contributions to the body of knowledge. Accordingly, this study proposes a comparative analysis of the performance of seven different machine learning classification algorithms. This comparatives analysis is expected to support the recommendation of the right amount of fertilizer on behalf of historical data.
The remaining paper is structured as follows. Section 2 presents some existing work based on a classification recommendation system in the agriculture sector. The problem statement, datasets, Fertilizer Recommendation Class, Hadoop, MapReduce, SGD, ANN, RF, K-NN, RT, SVM using polynomial function, SVM using RBF function, performance indicators are presented in Section 3. The proposed model and performance evaluation have been elaborated in Section 4. In Section 5, conclusions and future research directions are discussed
2. Background
The deficiency of the nutrients will leads to a decrease in crop productivity, as soil is a measured source of nutrients for crops. Many researchers had contributed and come up with a different solution in order to give better crop productivity. The success story of “Green Revolution” in India and other developing countries had fascinated the researchers towards the maximization of fertilizers and pesticide usage in agriculture. It is found that to increase productivity, the use of chemical fertilizers such as Nitrogen (N), Phosphorus (P), and Potassium (K) is increased in unrestrained manner [10]. In China the study reveals that from 1960 to 2000 productivity of wheat increased three-fold, and to achieve that the farmers had increased the usage of chemical fertilizers almost five-fold [11]. There is a paradigm shift of fertilizer usage in agriculture from 1990s, where optimal usage of nutrients became an important issue for sustainable agriculture. Compare to other nutrients, issues of nitrogen fertilization are found in large numbers in research literature. This is mainly due to its pivotal role in high productivity and more general applicability across the different crops. The big data analysis technologies are now in use in agriculture to boost the yield of the crop, to make smarter and accurate decisions. The automated systems are useful for farmers to monitoring processes through alerts. The weather conditions and soil moisture are reported via internet of things IoT sensors [12].
In 2018, Bodake et al. [13] have introduced a system using techniques such as Cloud-Computing, and Data Mining. This model provides the details of the required fertilizers from soil sample. It helps to improve crop production with minimum cost of fertilizer. The data is collected in the database regarding crop details and soil conditions which provide total fertilizer requirements. Shastry and Sanjay [14] have designed a cloud-based agricultural framework that provides services of soil classification crop yield prediction. For soil classification, the author used a hybrid support vector machine (M-SVM) and customized artificial neural network (M-ANN). In [15] research work, the support vector machine, artificial neural network, and decision tree are used to classify soil texture classes. The experiments are done with Gaussian radius basic function performed better than other techniques. The overall accuracy rate of SVM is 0.943. Taghizadeh-Mehrjardi et al. [16] have used six different classifiers, namely the support vector machine, Logistics regression, artificial neural network, random forest, k-nearest neighbor and decision tree to predict group soil organic in Iran. In the experiments, a high accuracy rate produced by decision tree and artificial neural network. Brungard et al. [17] are used 11 diverse machine learning approaches to mapping soil taxonomic classes in arid area. Random forest indicator results to produce a high accuracy rate. Kovačević et al. [18] have been used to support vector machine (SVM) for the classification of soil. The soil chemical structure is the input of these methods. The key benefit of the approaches is that it required minimal number of samples to train the method.
Guevara-Hernandez et al. [19] have developed a classification system of wheat and barley grain. They are a total 99 features included 72 texture, 21 morphological, and six colors. The experiment was done on two classes. The accuracy of this research is more than 99%. Artificial neural network and K-nearest neighbor classifiers [20] are used to categorize Indian wheat seed variations by extracting 31 features using local binary pattern, gray level textural features, etc. The accuracy of this system is 66.8%. The common vector approach [21] is used to classify six wheat varieties. Using minimum distance property, supposed test image is allocated to a label. The accuracy of the method is 36.7%. In [22] a classification system is established through multi-layer observation network for classes of rain red wheat growth. The 87.22% precision is obtained by this method. Romero et al. [23] are used as a classification system for wheat by machine learning software WEKA (University of Waikato, Hamilton, New Zealand). The a priori modified local accuracy (MLA) is 90% accurate.
3. Materials and Methods
3.1. Problem Statement
A dataset of soil reports that contains soil nutrition values and recommended fertilizer quantities for paddy and wheat crop is collected. In each report, soil nutrition composition is represented as an n-dimensional vector. The value of the vector indicates the quantities of soil nutrition elements, such as organic carbon, phosphorous, potassium, sulfur, etc. The recommended fertilizer quantity is treated as a single value for the classification of reports. The recommended fertilizers with the nutrient compositions are shown in Table 1. In this research work, we are developing a system that identifies the fertilizer recommendation classes using different machine learning algorithms.
3.2. Dataset
For the experimental setup, the soil report datasets are collected from two Tata soil testing laboratories. The laboratories are located in different areas (Sangrur and Kutukshetra district) but their geographical conditions are the same. The datasets of the year 2011–2017 are collected for evaluation. The collected data are in the raw form that contained the soil nutrition composition values and recommended fertilizer quantities. The collected data contained millions of records, but in our study, only 30,000 random records of paddy and 30,000 random records of wheat from each laboratory are taken using rand() function.
3.3. Fertilizer Recommendation Class
In the collected data, there are many fertilizer recommendations. In this paper, only ten fertilizer recommendations solutions are selected for the classification reports with the support of agricultural experts. Table 2 shows the selected fertilizer solutions where the first five are related to wheat and remaining five are related to paddy with recommended quantity.
3.4. Hadoop
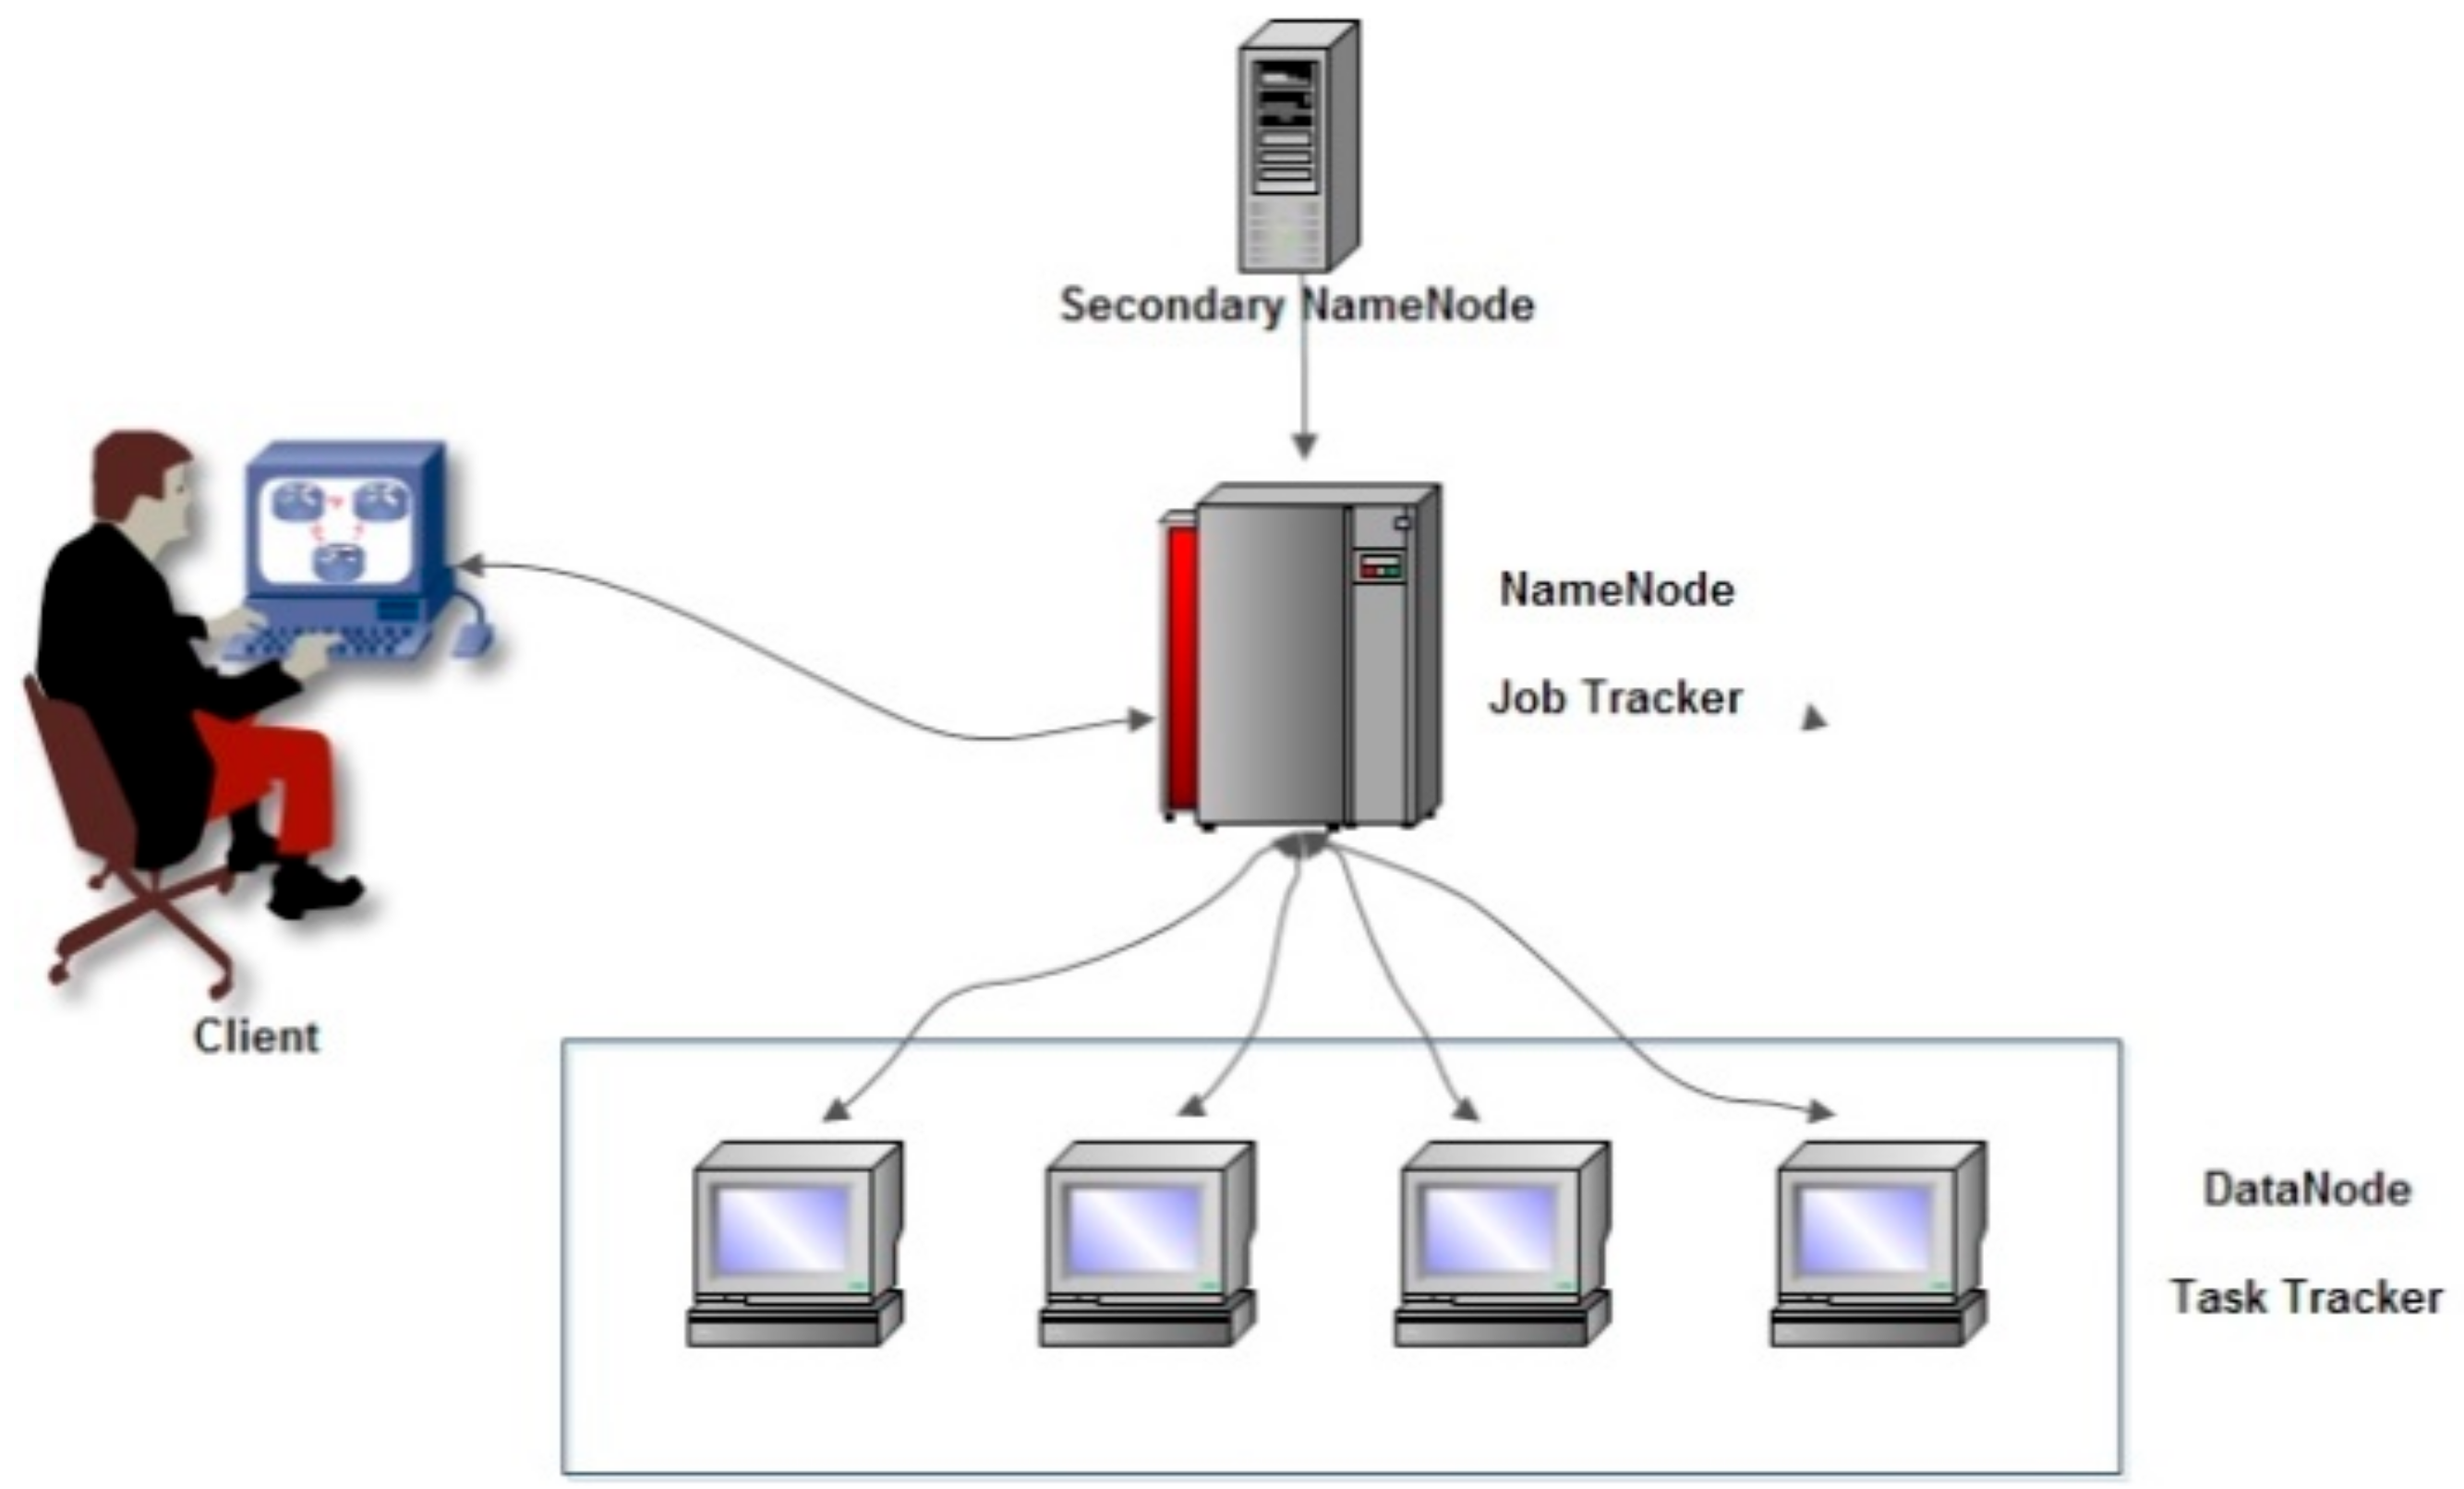
Hadoop is an open-source Java project from Apache Software Foundation and officially supported by the Linux operating system. The MapReduce [17] programming model and the Hadoop distributed file system (HDFS) are the main components of Hadoop [24,25,26]. The key advantage of Hadoop is its MapReduce programming model that enables the execution of the job in a distributed environment. It contains thousands of nodes with commodity hardware and an overwhelming amount of data (Figure 1). Hadoop framework provides java based library and can import any java support IDE, such as Netbeans, Eclipse. Hadoop open-source is widely used for MapReduce computations.
Hadoop framework works on the principle of master-slave architecture. In the Hadoop environment, thousands of nodes are grouped into clusters that are known as datanodes (Figure 1). Each datanode contains a task tracker that performs the computational task. All datanodes are connected to a masternode. The masternode has a job tracker that distributes the task to each datanode. Masternode is connected to the secondary node that is an independent node and becomes active when the masternode fails. The namenode stores the metadata of job distribution and data storage information.
Hadoop framework follows a fault tolerance mechanism. Hadoop distributed file system stores data at three different locations. In case of failure, namenode accesses the data from the alternate locations. Presently, the Hadoop system provides many data storage solutions, such as HBase, Hive, and Pig. HBase is a distributed column-oriented database in the category of not only SQL(NoSQL) storage system [27]. Hive is specially developed by Facebook for the SQL-based developers. Hive saves data in the table format and retrieves data using the SQL query [28]. Pig is a data storage tool developed by Google for custom queries [11]. The aforementioned data storage tools come under the HDFS.
3.5. MapReduce
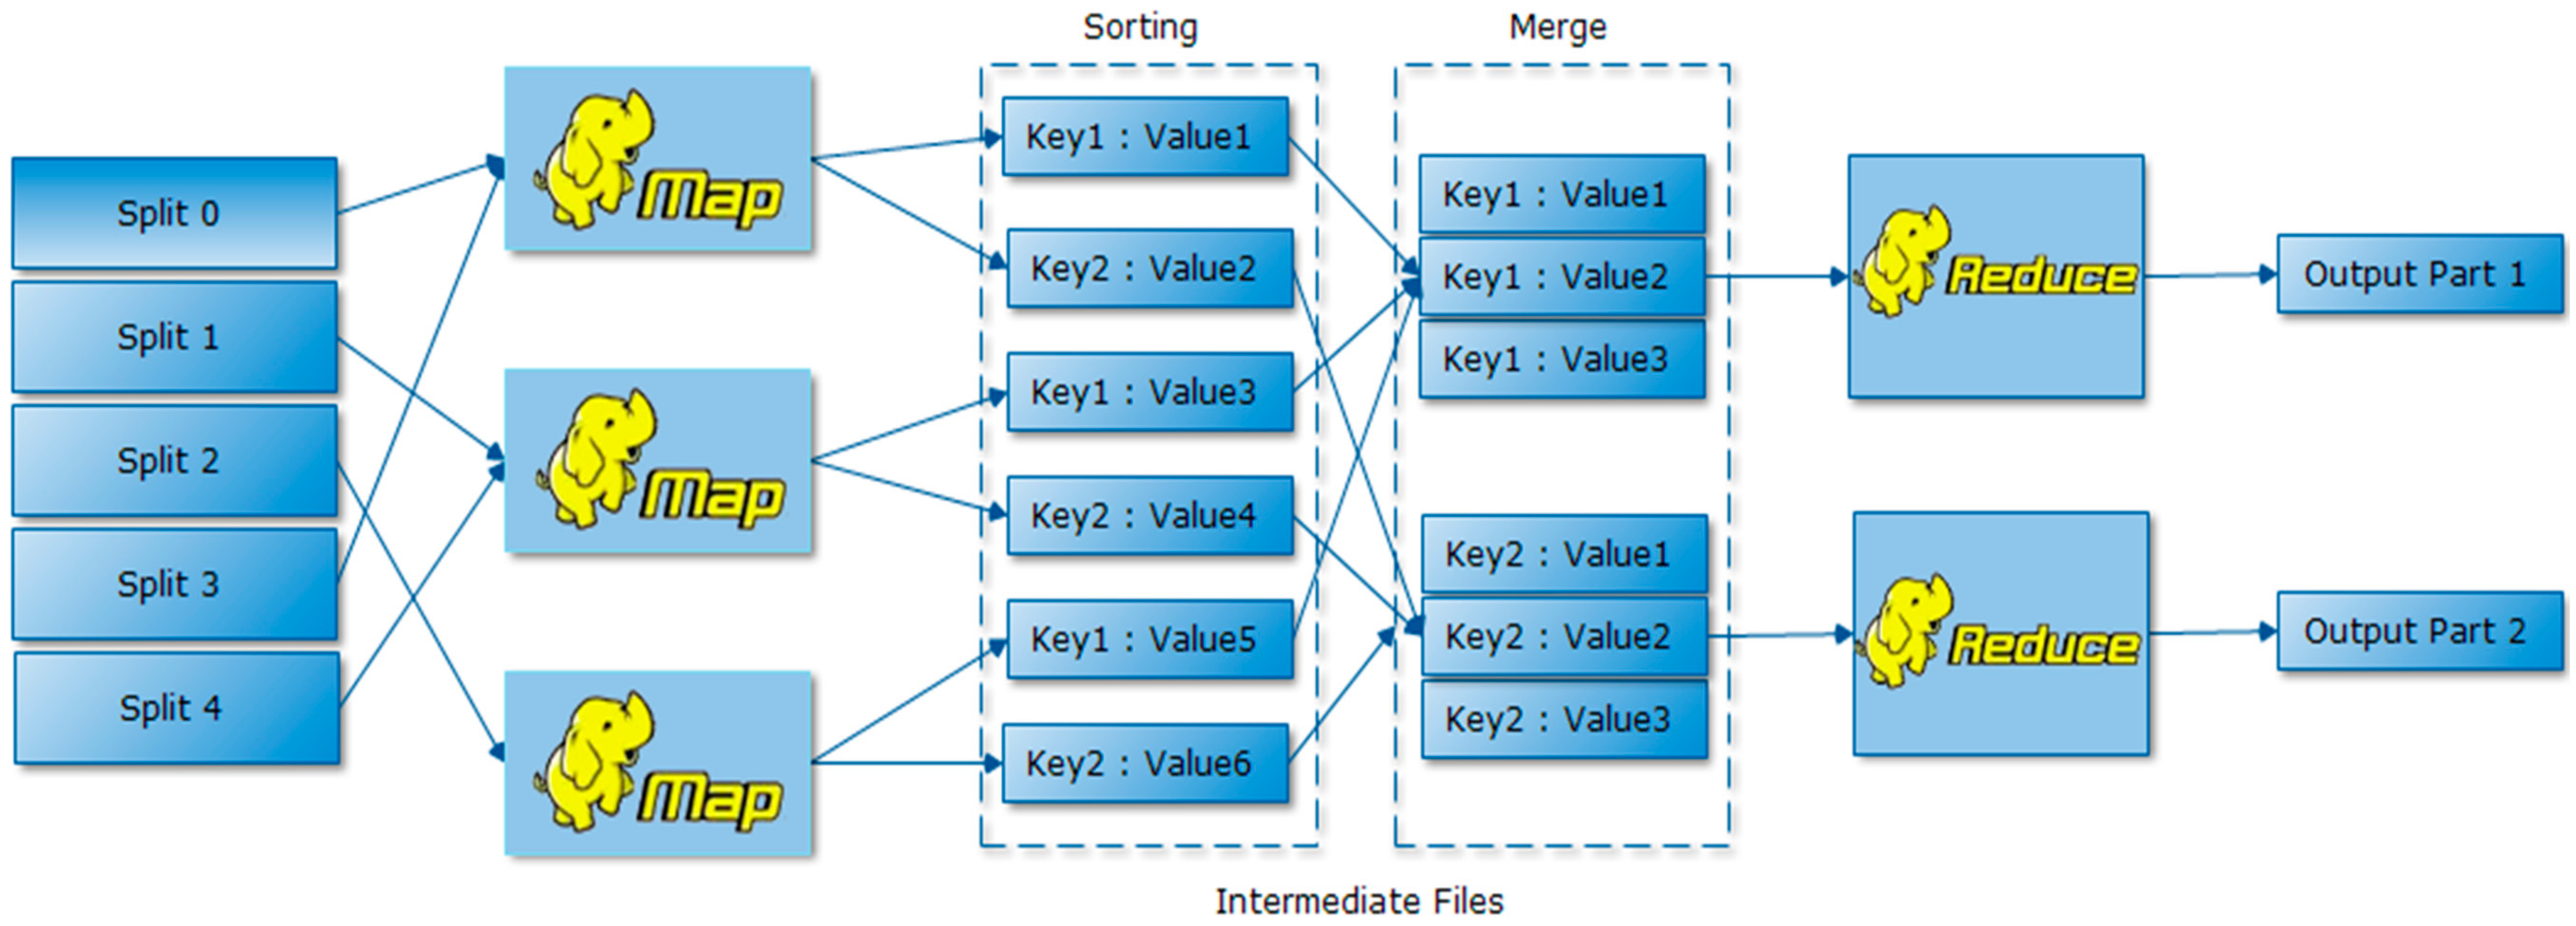
MapReduce model enables the users to process huge data available in both structured and unstructured forms in parallel batches over big clusters in a reliable and fault-tolerant manner [17,27,28]. This programming model is based on a well-known strategy of divide and conquers. In this paradigm the problem is classified into small sub-problems. Further, each sub-problem is resolved and the solutions are then combined into a final solution show in Figure 2. MapReduce used hash table data structure to mapping between key and its value.
3.6. Mahout
Mahout [29] library executes various classification and clustering algorithms. These algorithms have been changed to fit the MapReduce [30]. The Mahout implementations have been deployed within Apache Hadoop [26]. Mahout has been made to work with Hadoop, Mahout library supports the MapReduce paradigm and classification algorithms like Stochastic Gradient Descent (SGD) [31], Naive Bayes, Artificial Neural Networks (ANN) [32], and Hidden Markov Models (HMM) [33] implementations. Mahoot [29] has been made to run on top of Hadoop and Hadoop Distributed File System (HDFS) [24].
3.7. Stochastic Gradient Descent
Stochastic gradient descent (SGD) is a function optimization technique [34]. SGD generally use to support machine learning algorithms. The SGD assigns a gradient between the sample points. It also adjusts the weight in the objective function to go along with this gradient. These functions will directly assign to move a weight in direction (adding or subtracting from the current weights) then adjust the weights by a fixed value. In a nutshell, SGD has been taken into account as a stand-alone logistic regression method for classification [29]. The model is revised after every input process, and no information about the previous inputs is required to be retained. Logistic regression can be defined as:
where
where is the row of the matrix b lies between –1 to 1. Let the probability of b is 1 and −1 as follows:
where θ ∈ weights. To lessen the error function, the highest weight vector identifier has to be identified on the behalf of negative log probability [34].
where regulatory period to suppress large weight parameters.
3.8. Artificial Neural Network
Artificial neural network [32] is a branch of computer science and mathematics that are inspired from biological neural network. An artificial neural network (ANN) is a suitable tool for the recognition and classification of any kind of data. Mahout library provides ANN classification algorithm with linear regression. We select the extensively-used back-propagation (BP) neural network with one hidden layer in the experiments. We set a linear function in the input layer for neurons (each of which accepts all properties) and a sigmoid function for them in the hidden and output layers is formally defined as follows.
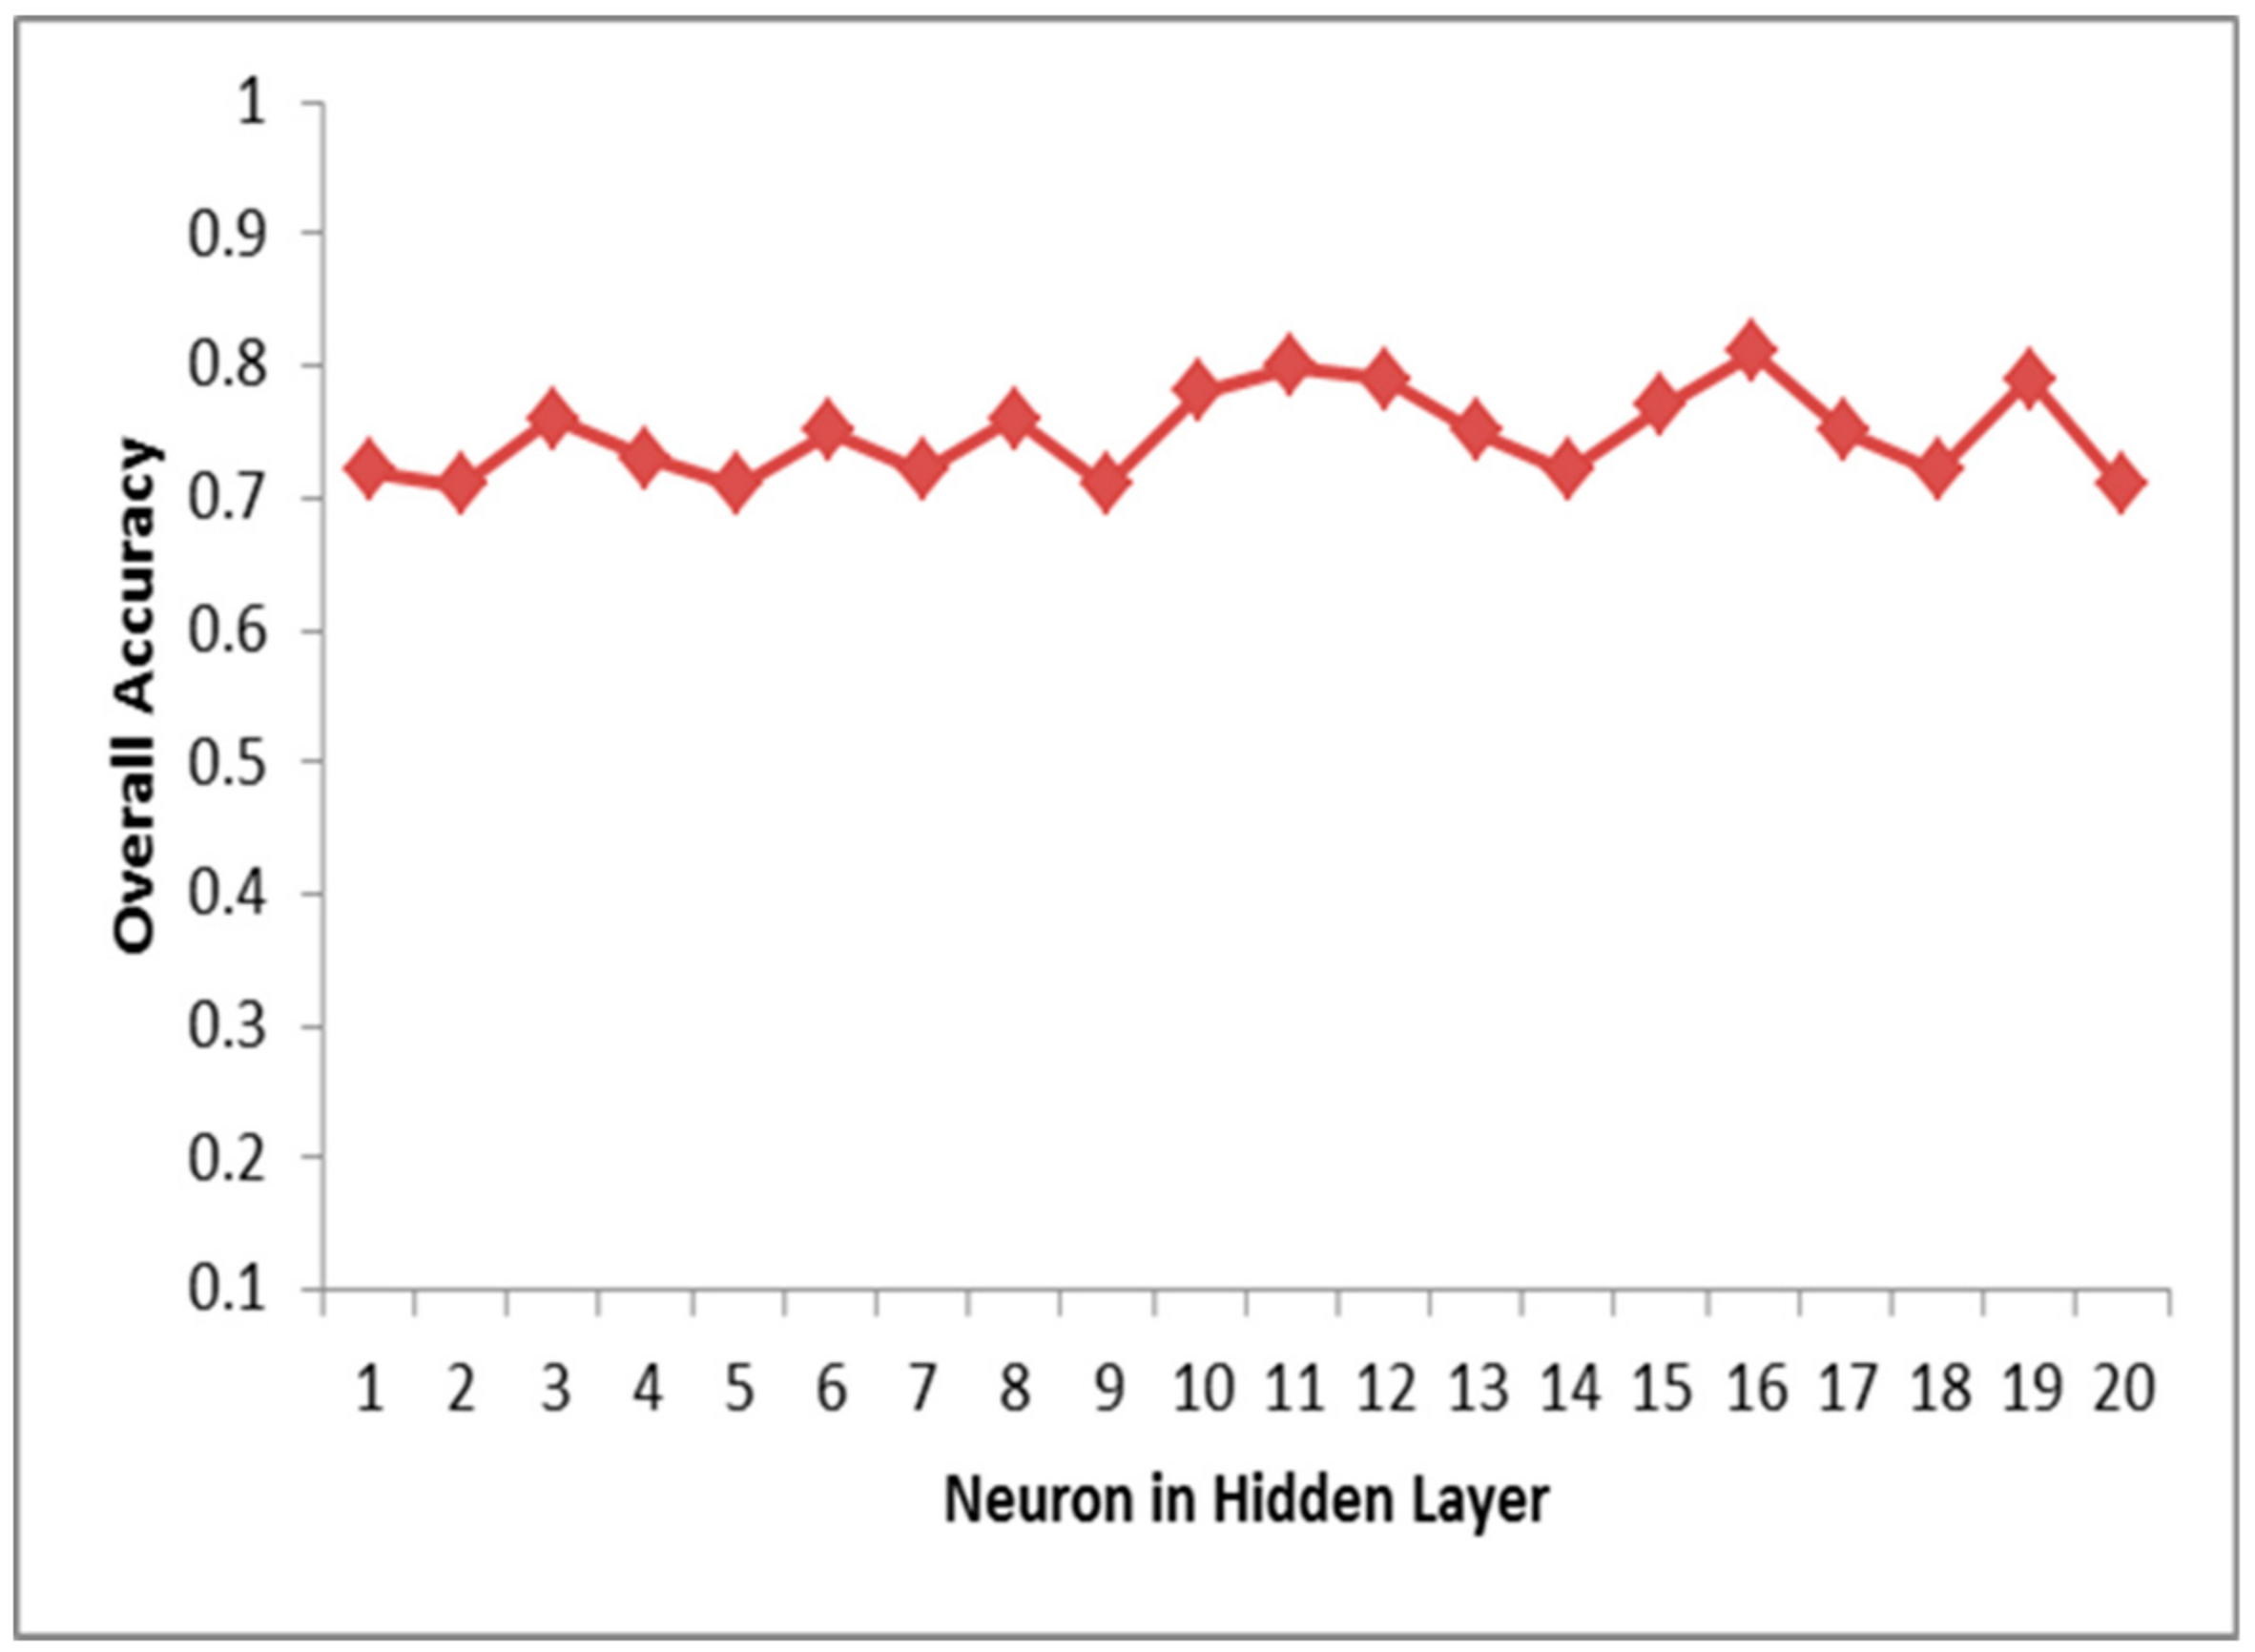
where is a feature of input , and are different layers neuron , , and indicate the weight associated with the input of different layers. In this research work mahout library is used to implement ANN, to recognize fertilizer solution recommendation class on the behalf of soil nutrition structure with input, hidden and an output layer. The hidden layer neuron varies from 2 to 20 for performance analysis. The input layer and output layer have 11 and 10 nodes, respectively. For implementation purpose data is divided into three sets: training, validation, and testing, which contains 70%, 15%, and 15% of data, respectively.
3.9. Random Forest
Based on the combination of aggregation and bootstrap ideas with decision trees random forests were introduced by Breiman [35]. This is a non-standard statistical method that allows considering regression problems as well as two and multi-class classification problems in single and multiple frameworks. The RF method consists of a pair of random regression trees that operate by making multiple regression trees and, thereafter, make a prediction [36]. The RF fusing the predictions of various trees and each is trained separately. It generates an arbitrary sample of information and looks at a large set of contributions to developing an alternative tree. After the creation of key attributes, it collects quite a few trees and finds their error rate to select which tree will be used.
3.10. K-Nearest Neighbor Algorithm
This is a sample-based training technique that is significantly working on the concept of equality and statistics [37]. A reference database holding information on a huge variety of soil nutrition composition values is investigated for soil reports that similar to the target soil nutrition composition values on the behalf of recommended solution. The similarity distances for the target soil nutrition compositions are measured on a Euclidean distance after normalization and re-scaling the soil nutrition data from the reference database. This results in the diverse input attribute gaining similar weight.
where is the “distance” of the nutrition composition value from the target nutrition composition values and is the difference of the nutrition composition values from the target soil in the nutrition composition attribute. Soil nutrition composition values of the database are arranged in ascending sequence according to their distance from target soil nutrition composition values. In this experiment, we first optimized the parameters ( and ) of K-NN method. Here, is the number of soil nutrition composition. The parameter is utilized to weigh each of the considered soil nutrition composition values while developing the output attributes’ estimate. The values of parameter k between 1 and 10 and parameter p between 0.5 and 3 are examined.
3.11. Regression Tree Models
The regression tree (RT) [38] methods are used in the field of digital mapping of soil salinity. The single trees are hard to develop because of incorrect parameter settings, tree un-stability. These concerns have assisted in the creation of bagging, boosting and random approaches. These approaches are helped to improve predictive performance [39]. The bagging models are used random independent bootstrap replicates. After that they are joined using average of regression output [40]. The boosted regression tree(BRT) model is a novel tree-based model created to optimize predictive performance using combination of various simple trees into a strong model despite considering a single tree model based on conventional regression trees [35,39,41,42]. It is used here, to characterize the relationship between soil nutrition composition and fertilizer recommendations.
3.12. Support Vector Machine (SVM)
SVM [15,43] is a binary classifier model, used as a classification task. This classifier assumes two classes where each class is considered through decision surface.
The idea of SVM is as below. From a set of the database here samples, {,}, , where is an -dimensional vector and indicates the equivalent class label. The Support Vector Machine computes a hyperplane using the following equation,
where indicates the input space. > 0 controls the trade-off in minimum classification error and maximum margin. , and are improved variables in the training stage. For this experiment, SVM [15] by a polynomial and Gaussian radius basis methods are used. The outcomes reported an improved performance under SVMs in comparison to ANN and classification tree techniques. For SVM with a polynomial method the best results obtained using combination of = 90 and p = 3 and radial basis function (RBF) function using = 100, r = 1 produced best results. When we compared both functions for SVM polynomial function performed better than RBF function.
For this proposed experiment, SGD, k-NN, ANN, RF, RT, and SVM with polynomial and Gaussian radius basis methods are compared. Overall accuracy, receiver operating characteristics (ROC), and area under the ROC curve (AUC) are utilized as performance measures to find the models’ accuracy for classification.
3.13. Performance Evaluation
In this research work, the k-fold cross validation function is used for performance analysis. Here collected reports are randomly divided into ten subsets which are also known as 10-fold cross-validation. Out of these ten subsets, one subset used for testing and rest for training. Each subset once appeared in test set and at same time other as training subset. This process is replicated ten times. Training subset is used to train classifier and test subsets were used to test the performance developed model.
The performance evaluation of the experiments are using (true positive), (false positive), (true negative) and (false negative) as true positive (required correctly predicted number of instance), false positive (required falsely predicted number of instance), true negative (non-required correctly predicted number of instance) and false negative (non-required falsely predicted number of instance), respectively. Then, measures the accuracy as follows:
In addition to the above-mentioned evaluation method, we use ROC curve and AUC to examine the benefits and drawbacks of the classifier. We also used the confusion matrix to evaluate the performance. ROC is a probability curve and AUC indicates degree of differentiation. It identifies capability of the model to distinguish between classes. The AUC–ROC curve shows the trade-off between the true positive rate () and the false positive rate (), where the and are defined as follows:
The model is better when the ROC curve is near to the upper left corner of the graph. When AUC is near to 1, the model is better.
The performances of the models are also calculated using three other validation measurements: mean absolute prediction error (MAE), root mean square error (RMSE) and coefficient of determination (). These indices were calculated as follows:
Here, n is the number of reports (samples) in each class, are the predicted and observed nutrition composition values , respectively. evaluates the average prediction bias, and reveals the total quality of the prediction. Predictions become increasingly optimal as and approach zero.
4. Proposed Model and Results
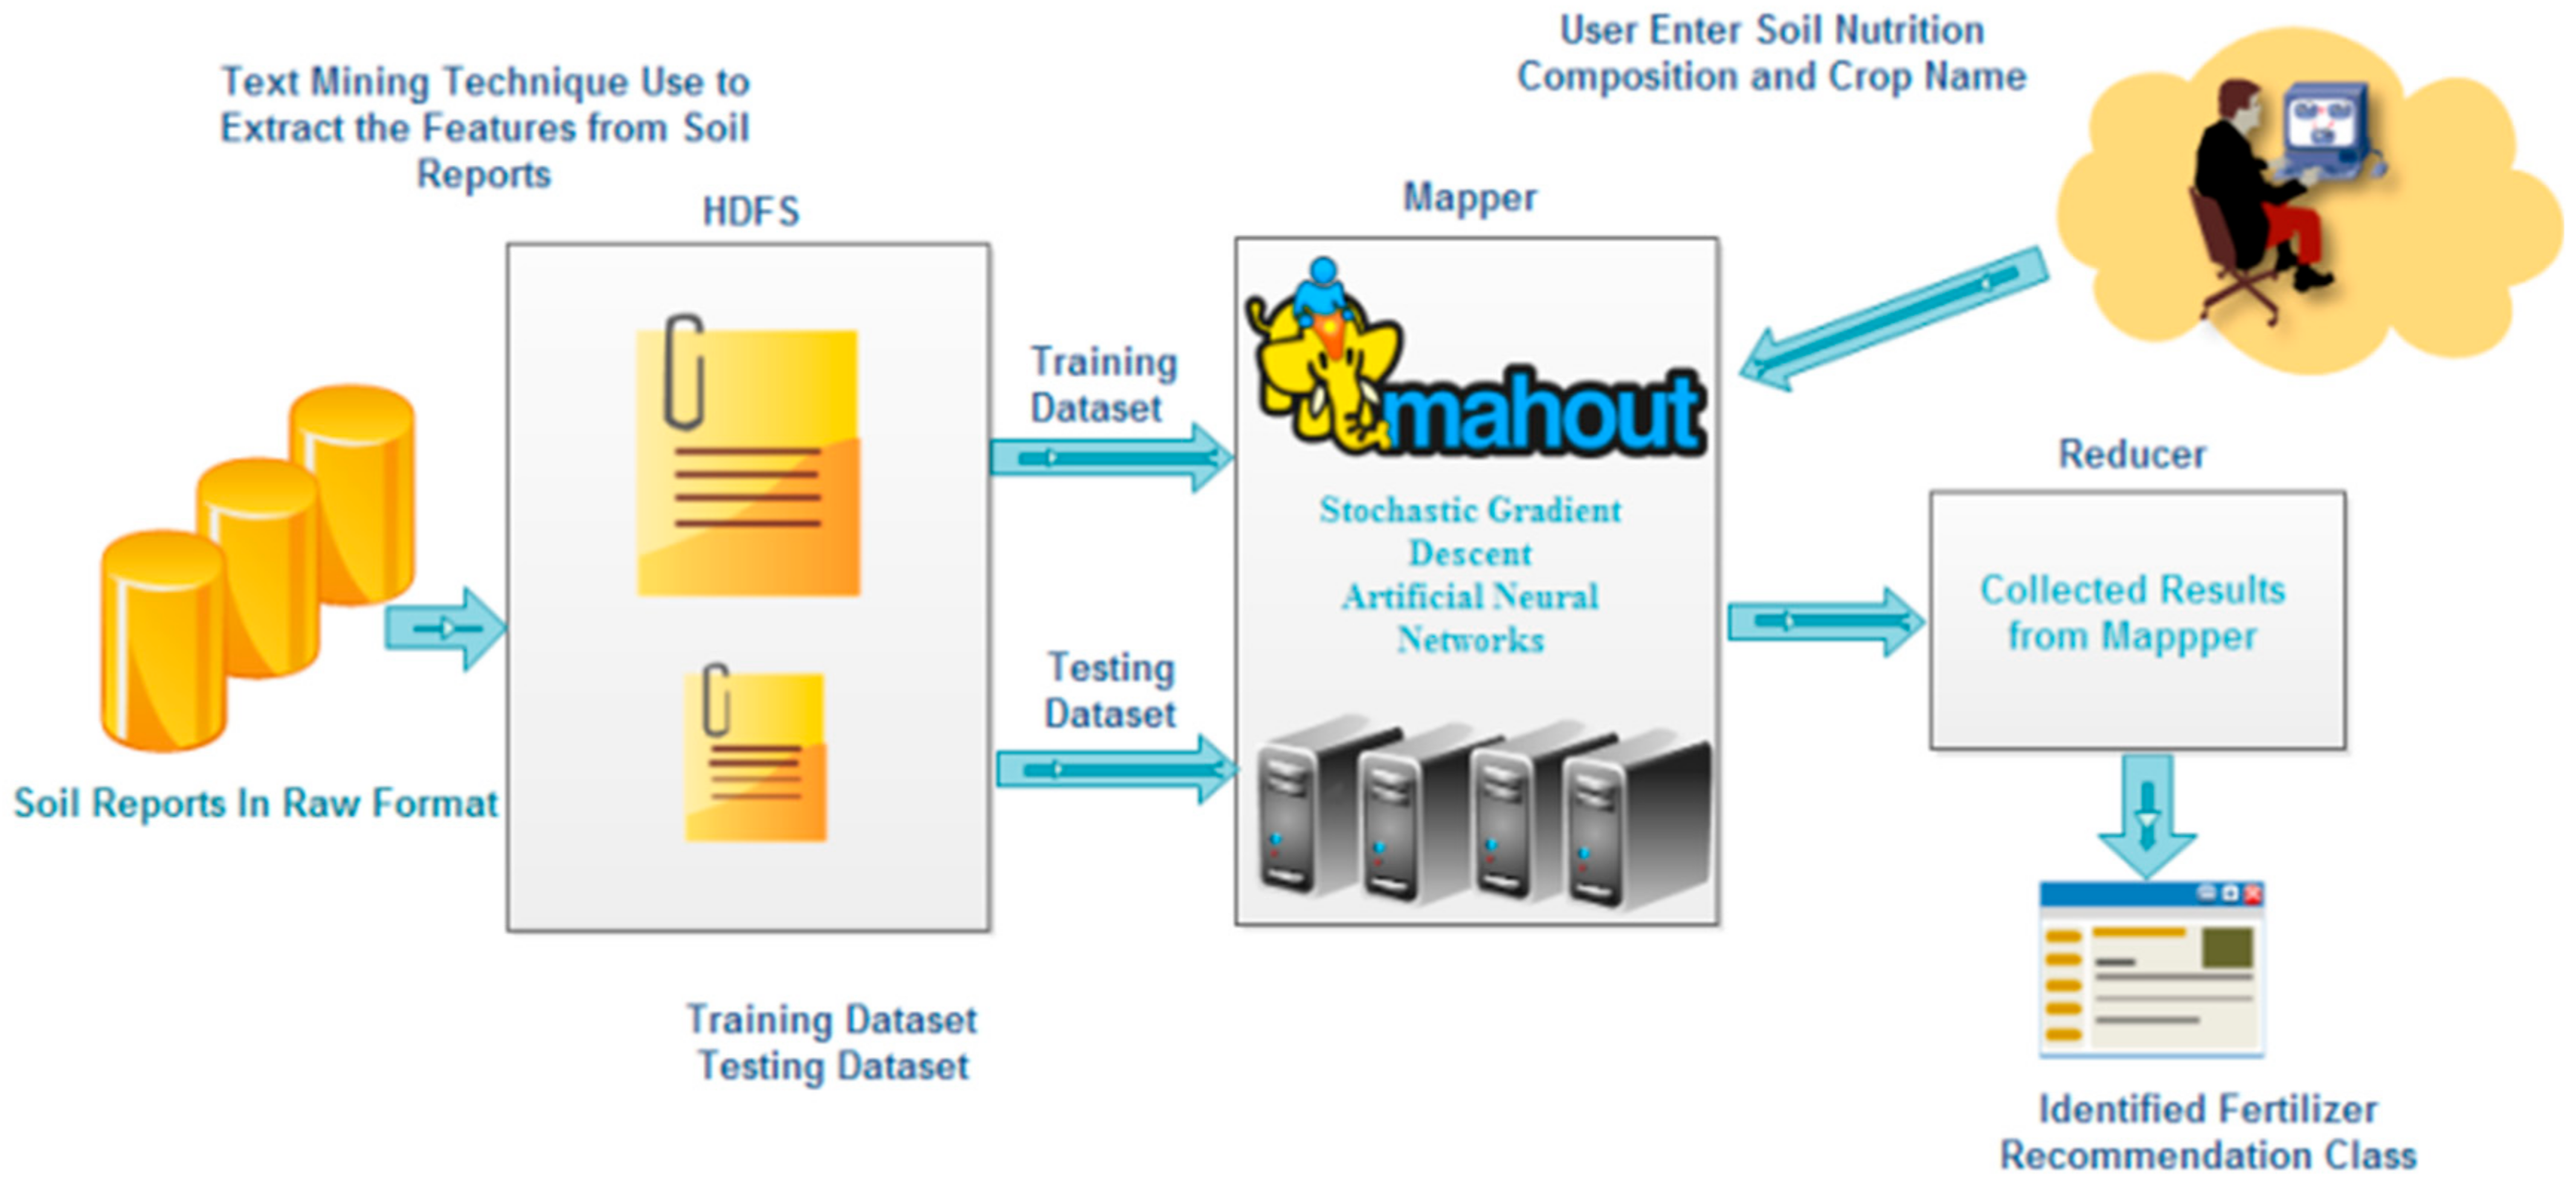
The basic goal of our study is to propose a model that will identify fertilizer recommendation solution classes. The first step of the proposed model was to extract values from collected reports that are in textual raw format. Pattern-based KMP (Knuth Morris Pratt) text mining technique is utilized to extract the soil nutrition value and fertilizer recommendations, which are saved into distributed system. Soil nutrition composition and crop names are saved into dimensional vector. Fertilizer solution of the report acted like a single string that was used as a target value for classification. In the proposed model, most commonly used fertilizer recommendations were selected for classification. The target value string contains six different fertilizer recommendations, shown in Table 2. After extracting the data, it was randomly divided into ten subsets as discussed in Section 3.13. One subset used for testing and the rest of subsets used for training once and this process was repeated 10 times. For the training model machine, learning algorithms were performed using SGD, ANN, RF, K-NN, RT, and SVM. The SGD and ANN are implemented using Mahoot library on Hadoop cluster. For better performance analysis, other algorithms RF, K-NN, RT, and SVM are implemented using traditional single machine. To check the performance of developed model for overall accuracy and area under curve (AUC) performance indicators are used.
In the proposed research, the recommendation procedure, masternode approved the soil nourishment, crop name using an application program interface, or the soil testing machines from a web interface. The Hadoop distributed file system and Parellel job procedures are used by MapReduce programming model for data storage. The job tracker divides the jobs into data locality nodes, mappers executed machine learning techniques and predicts recommendation class. The Mapper used a Hashmap to store the outcomes and submit to the reducer. Then reducer rearranges the data and predicted final fertilizer recommendation class. The function of fertilizer recommendation system depicts in Figure 3.
4.1. Experimental Setup
Herein the experimental analysis of our proposed approach is illustrated. Table 3 describes the hardware and software configurations of different hosts. In our experiments for masternode we used an 8-core machine using 6 GB RAM with 2.40 GHz speed. Similarly, for three datanodes 4-core machines have been used with 6, and 4 GB RAM with 2.0 GHz speed. Hadoop version 2.7.0 and Mahoot 0.10.0 is installed over OS Ubuntu version 16.04.
4.2. Model Performance and Results
To measure the models’ performance, the experiments are done firstly by SGD and ANN. The idea to use these models is that these are very popular in big data analytics for classification in health, banking and e-commerce sectors. So, we observe the performance of both of them initially. The SGD and ANN are performed on a Hadoop cluster. We have also done the experiments on RF, K-NN, RT, and SVM for classification using a single machine. Lastly, we have compared all the classification methods for better performance evaluation of the Hadoop cluster and a single machine.
The accuracy produced by SGD, ANN, RF, KNN, RT, SVM (Poly), and SVM (RBF) of fertilizer recommendation classes is shown in Figure 4. In the case of SGD, first and second class has the highest accuracy among all the other classes. However, class no. five have minimum accuracy. The overall accuracy which is calculated by using the average of all the ten classes of SGD is 0.88. The highest accuracy of a class using mentioned classifiers will help to select the suitable fertilizer quantity to crops for maximum production.
Besides, the use of unsuitable fertilizers will hamper crop production. In Figure 5, the experiments show that the overall accuracy of all 10 classes on different neurons from 1 to 20. Where we find that the highest accuracy is achieved by 16 neurons using hidden layer is 0.811. The SGD and ANN confusion matrix performed in Table 4. The overall accuracy of SGD is 0.865 which is greater than overall accuracy using ANN i.e., 0.814. Table 5 shows the AUC values of two different machine learning classification methods. The overall AUC values of the SGD and ANN classifiers are 0.882, and 0.816, respectively. With respect to both performed indicators of two classification algorithms we conclude that SGD is the best machine learning algorithm, to identify fertilizer recommendation class for current data.
4.3. Comparison with Existing Methods
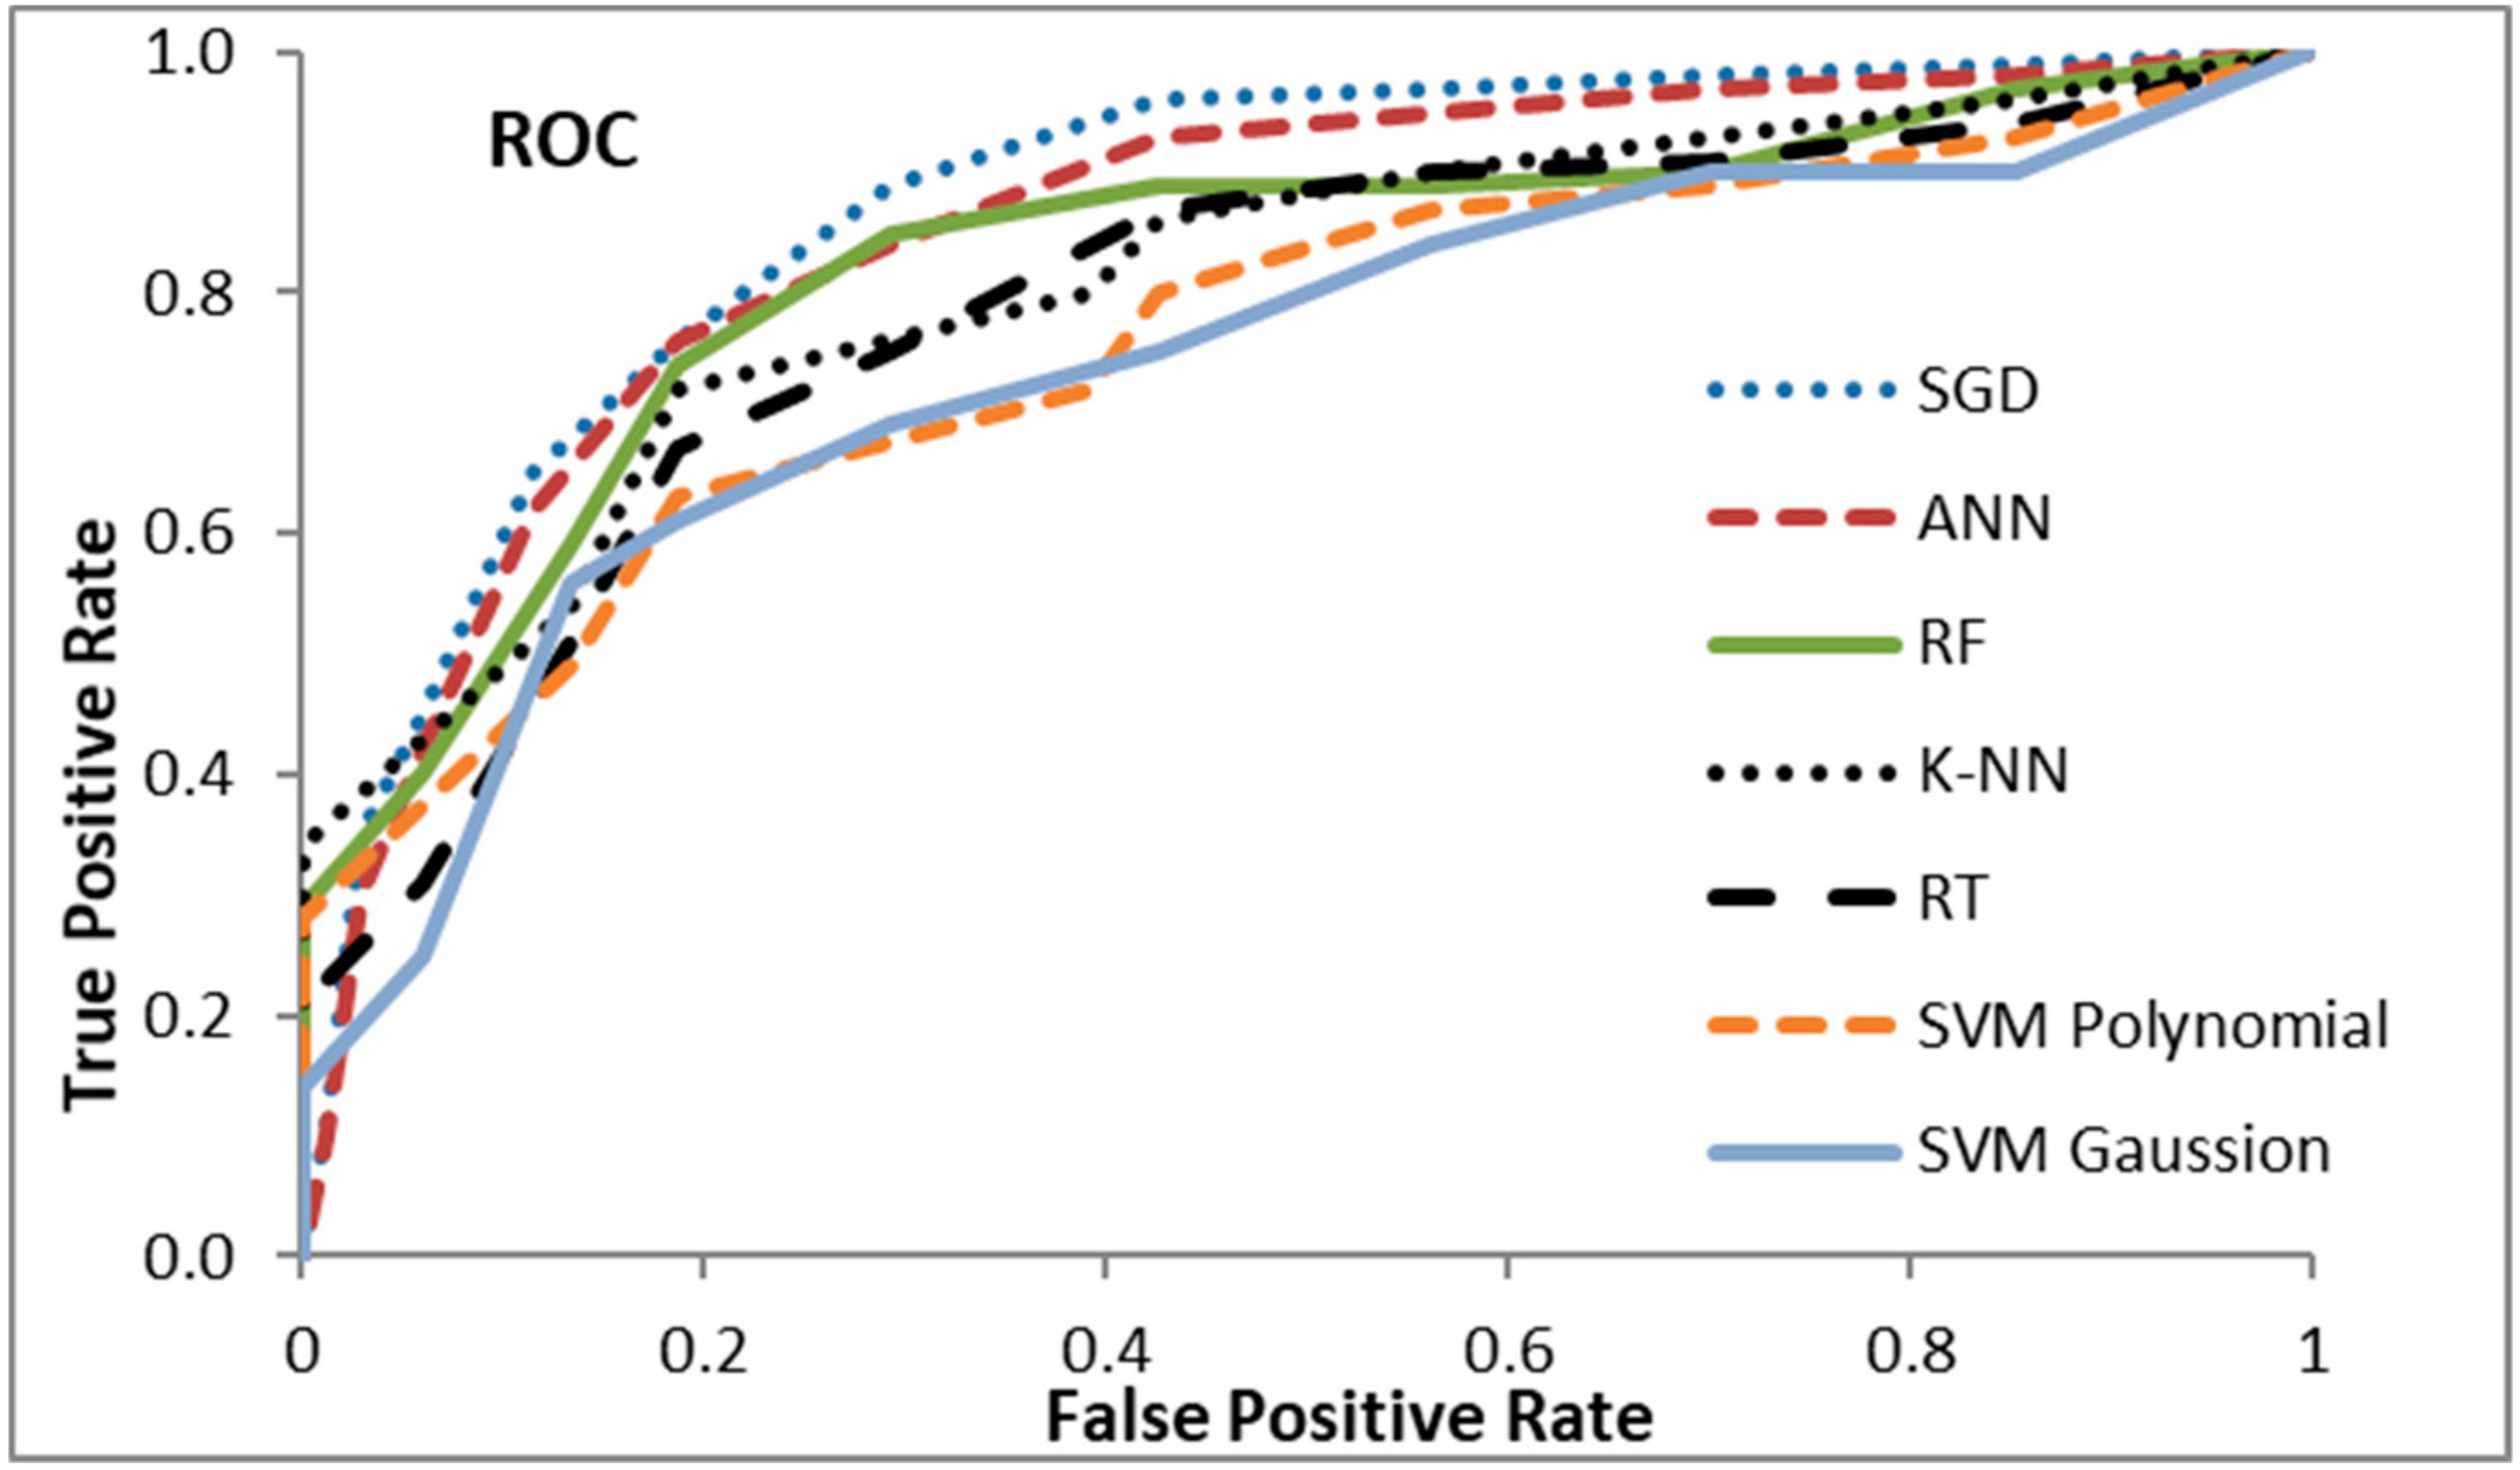
For the better performance analysis, the performance of the proposed methods are compared with the five approaches: random forest (RF) [44], K-NN [45], regression tree (RT) [38], SVM using polynomial functions [15], SVM using Gaussian radius basis function [15] using the average AUC and overall accuracy on our dataset. The approaches such as random forest (RF) [44], K-NN [45], regression tree (RT) [38], SVM using polynomial functions [15], SVM using Gaussian radius basis function [15] have been already used by many authors in soil classification. Figure 6 depicts the ROC curves of seven approaches, and Table 6 reports to the comparative analysis of the seven approaches using AUC and overall accuracy. It is observed from the Table 6 that SGD achieves the highest value of AUC, 0.882, and overall accuracy is 0.881, followed by the ANN, with 0.816 and 0.814 values of average AUC and overall accuracy, respectively. The third best approach on our dataset RF [44] achieves 0.79 and 0.786 using average AUC and overall accuracy, respectively. The K-NN [45] achieves the next highest AUC and overall accuracy values i.e., 0.783 and 0.761, respectively.
The next AUC and overall average values obtained by the regression tree (RT) [38] are 0.756 and 0.749, respectively. The performance of the method SVM using the polynomial function, which yields AUC and overall average values of 0.743 and 0.737 are much better than the performance of method SVM using Gaussian radius basis functions which AUC and overall average values of 0.728 and 0.719, respectively.
Table 7 shows the predictive performance of the stochastic gradient descent (SGD) [11], artificial neural network (ANN) [32], random forest (RF) [44], K-NN [45], regression tree (RT) [38], SVM using polynomial functions [15], SVM using Gaussian radius basis function models based on the Ten-fold cross-validation, consisting the ,, and values. In particular, the SVM using Gaussian radius basis functions with an MAE of 0.75 had the greater tendency for overestimation, whereas SGD method with of 0.41 reported the lowest tendency for overestimation following by ANN (0.49), RF(0.53), K-NN(0.57), RT (0.66), and SVM using Polynomial functions (0.73) values. The data varied from 0.45 to 0.86 (i.e., 0.45, 0.58, 0.65, 0.60, 0.73, 0.82, and 0.86 for SGD, ANN, RF, K-NN, RT, SVM using polynomial functions and Gaussian radius basis functions, respectively). The coefficient of determination () values SGD, ANN, RF, K-NN, RT, SVM using Polynomial functions and SVM using Gaussian radius basis functions have 0.74, 0.71, 0.69,0.64, 0.62, 0.60, and 0.59. The SGD method has the lowest MAE (0.41) and RMSE (0.45) values, as well as the highest (0.74) value. Therefore, it is the most superior method to determine nutrition composition values. However, ANN prediction followed closely with ME, RMSE, and values of 0.49, 0.58, and 0.71, respectively. This shows a modest improvement in prediction accuracy by ANN. Therefore, both SGD and ANN models should be standardized, and the best result applied for prediction of target fertilizer recommendation. The RF method comparatively performed low from SGD, and ANN but outperformed from K-NN, RT, and SVM. Similarly, K-NN, RT, and SVM using Gaussian radius basis and Polynomial functions performed comparatively low form SGD method. Hence, this implies that the SGD method predicts the data very precisely.
5. Conclusions and Future Research
Plants must obtain food in their systems in order to survive as animals do. Plants produce energy for the use of animals, so they must fill their nutrients. The major things that plants need to grow are water, nutrients, and light. The water is used to carry moisture and nutrients back and forth between the leaves and roots, in plants. Water and nutrients are usually taken through roots from the soil. Fertilizers provide nutrients to plants during watering. The essential nutrients are nitrogen (N), phosphorus (P), and potassium (K) for the growth of plants. To making green leaves, big flowers and strong roots, and fight for diseases nitrogen, phosphorus, and potassium help, respectively. In the present work, the recommended classification of fertilizer structure has been established to improve the soil quality. The classification system supports to recommend the right amount of soil fertilizer on behalf of soil reports generated by agricultural specialists. For performance analysis, we use AUC and the overall accuracy of the fertilizer recommendation system. Two different machine learning algorithms SGD and ANN are used to identify the recommendation class. For better performance analysis we are also compared the SGD and ANN with other existing approaches such as random forest, K-NN, regression tree, SVM using polynomial functions, and SVM using Gaussian radius basis functions. As a result, we found that SGD performs better than above existing techniques. For future research trends, local attributes and more crops, in addition to wheat and paddy, should be included for good understanding of our findings. The comparative study should also use SPARK library.
Author Contributions
R.G. and H.A. have given their contribution to the algorithmic ideas; H.A., P.C. and R.C. supervised the whole work and analyzed the results.
Funding
This research received no funding.
Acknowledgments
The authors thank Tata Chemical Limited Soil and Water Testing Laboratory for provided Soil reports. The authors are grateful to the Agriculture Department, Punjab for help to select samples and validate the results. In addition, they also wish to thank the Department of Computer Engineering (Punjabi University, Patiala), the Department of Engineering (University of Naples Parthenope) and the Department of Industrial Engineering (University of Naples Federico II) for technical support.
Conflicts of Interest
The authors declare no conflict of interest.
References
- Emerson, R.; Arnold, W. The photochemical reaction in photosynthesis. J. Gen. Physiol. 1932, 16, 191–205. [Google Scholar] [CrossRef] [PubMed]
- Evans, L.T. Environmental Control of Plant Growth; Academic Press: New York, NY, USA, 1963. [Google Scholar]
- Acker, O.; Blockus, A.; Pötscher, F. Benefiting from Big Data: A New Approach for the Telecom Industry; Strategy, Analysis Report; PWC: London, UK, 2013. [Google Scholar]
- Andreu-Perez, J.; Poon, C.; Merrifield, R.D.; Wong, S.T.; Yang, G.Z. Big data for health. IEEE J. Biomed. Health Inf. 2015, 19, 1193–1208. [Google Scholar] [CrossRef] [PubMed]
- Lytras, M.D.; Visvizi, A. Big Data and Their Social Impact: Preliminary Study. Sustainability 2019, 11, 5067. [Google Scholar] [CrossRef]
- Osden, J. Towards a Big Data Framework for the Prevention and Control of HIV/AIDS, TB and Silicosis in the Mining Industry. International Conference on Health and Social Care Information Systems and Technologies, Portugal. Procedia Technol. 2014, 16, 1533–1541. [Google Scholar]
- Bernard, M. Amazon Big Data. Available online: http://www.smartdatacollective.com/bernardmarr/182796/amazon-using-big-data-analytics-read-your-mind (accessed on 6 February 2014).
- Singh, I.; Singh, S. Framework for targeting high value customers and potential churn customers in telecom using Big Data Analytics. Int. J. Educ. Manag. Engin. [CrossRef]
- Long, P.; Siemens, G. Analytics In Learning And Education. Educ. Rev. 2011, 46, 30. [Google Scholar]
- Wilcke, W.; Yasin, S.; Schmitt, A.; Valarezo, C.; Zech, W. Soils along the altitudinal transect and in catchments. In Gradients in a Tropical Mountain Ecosystem of Ecuador; Springer: Berlin/Heidelberg, Germany, 2008; pp. 75–85. [Google Scholar]
- Zhen, L.; Zoebisch, M. Resource Use and Agricultural Sustainability: Risks and Consequences of Intensive Cropping in China; Kassel University Press GmbH: Kassel, Germany, 2006; Volume 86. [Google Scholar]
- Babu, T.G.; Babu, A. IoT (Internet of Things) & Big Data Solutions to Boost Yield and Reduce Waste in Farming. In Proceedings of the 2018 IADS International Conference on Computing, Communications & Data Engineering (CCODE), Tirupati, India, 7–8 February 2018. [Google Scholar]
- Bodake, K.; Ghate, R.; Doshi, H.; Jadhav, P.; Tarle, B. Soil based Fertilizer Recommendation System using Internet of Things. MVP J. Eng. Sci. 2018, 1, 13–19. [Google Scholar]
- Shastry, K.A.; Sanjay, H.A. Cloud-Based Agricultural Framework for Soil Classification and Crop Yield Prediction as a Service. In Emerging Research in Computing, Information, Communication and Applications; Springer: Singapore, 2019; pp. 685–696. [Google Scholar]
- Wu, W.; Li, A.D.; He, X.H.; Ma, R.; Liu, H.B.; Lv, J.K. A comparison of support vector machines, artificial neural network and classification tree for identifying soil texture classes in southwest China. Comput. Electron. Agric. 2018, 144, 86–93. [Google Scholar] [CrossRef]
- Taghizadeh-Mehrjardi, R.; Nabiollahi, K.; Kerry, R. Digital mapping of soil organic carbon at multiple depths using different data mining techniques in Baneh region, Iran. Geoderma 2016, 266, 98–110. [Google Scholar] [CrossRef]
- Cattaneo, G.; Giancarlo, R.; Piotto, S.; Petrillo, U.F.; Roscigno, G.; Di Biasi, L. MapReduce in Computational Biology—A Synopsis. In Italian Workshop on Artificial Life and Evolutionary Computation; Springer: Cham, Switzerland, 2016; pp. 53–64. [Google Scholar]
- Kovačević, M.; Bajat, B.; Gajić, B. Soil type classification and estimation of soil properties using support vectormachines. Geoderma 2010, 154, 340–347. [Google Scholar] [CrossRef]
- Guevara-Hernandez, F.; Gil, J.G. A machine vision system for classification of wheat and barley grain kernels. Span. J. Agric. Res. 2011, 3, 672–680. [Google Scholar] [CrossRef]
- Ronge, R.; Sardeshmukh, M. Indian wheat seed classification based on texture analysis using ann. In Proceedings of the 2014 International Conference on Advances in Computing. Communications and Informatics, New Delhi, India, 24–27 September 2014; pp. 937–942. [Google Scholar]
- Gülmezoğlu, M.B.; Gülmezoğlu, N. Classification of bread wheat varieties and their yield characters with the common vector approach. In Proceedings of the International Conference on Chemical, Environmental and Biological Sciences, Dubai, United Arab Emirates, 18–19 March 2015; pp. 120–123. [Google Scholar]
- Pazoki, A.; Pazoki, Z. Classification system for rain fed wheat grain cultivars using artificial neural network. Afr. J. Biotechnol. 2011, 10, 8031–8038. [Google Scholar]
- Romero, J.R.; Roncallo, P.F.; Akkiraju, P.C.; Ponzoni, I.; Echenique, V.C.; Carballido, J.A. Using classification algorithms for predicting durum wheat yield in the province of Buenos Aires. Comput. Electron. Agric. 2013, 96, 173–179. [Google Scholar] [CrossRef]
- Brungard, C.W.; Boettinger, J.L.; Duniway, M.C.; Wills, S.A.; Edwards, T.C., Jr. Machine learning for predicting soil classes in three semi-arid landscapes. Geoderma 2015, 239, 68–83. [Google Scholar] [CrossRef]
- Lam, C. Hadoop in Action; Manning Publications: Greenwich, CT, USA, 2010; pp. 3–5. [Google Scholar]
- White, T. Hadoop: The Definitive Guide; O’Reilly Media, Inc.: Sebastopol, CA, USA, 2012. [Google Scholar]
- Sun, J.; Jin, Q. Scalable rdf store based on hbase and mapreduce. Proceedings of the IEEE 3rd International Conference on Advanced Computer Theory and Engineering (ICACTE), Chengdu, China, 20–22 August 2010. [Google Scholar]
- Thusoo, A.; Sarma, J.S.; Jain, N.; Shao, Z.; Chakka, P.; Anthony, S.; Murthy, R. Hive: A warehousing solution over a map-reduce framework. Proc. VLDB Endow. 2009, 2, 1626–1629. [Google Scholar] [CrossRef]
- Owen, S.; Anil, R.; Dunning, T.; Friedman, E. Mahout in Action; Manning Publications Co.: New York, NY, USA, 2011. [Google Scholar]
- Gates, A.; Dai, D. Programming Pig: Dataflow Scripting with Hadoop; O’Reilly Media, Inc.: Sebastopol, CA, USA, 2012. [Google Scholar]
- Gardner, W.A. Learning characteristics of stochastic-gradient-descent algorithms: A general study, analysis, and critique. Signal Process. 1984, 6, 113–133. [Google Scholar] [CrossRef]
- Yegnanarayana, B. Artificial Neural Networks; Prentice-Hall: New Delhi, India, 1999. [Google Scholar]
- Rabiner, L.R.; Juang, B.H. An introduction to hidden Markov models. IEEE Assp Magazine 1986, 3, 4–16. [Google Scholar]
- Shvachko, K.; Hairong, K.; Radia, S.; Chansler, R. The Hadoop Distributed File System. In Proceedings of the IEEE 26th Symposium On Mass Storage Systems and Technologies, Incline Village, NV, USA, 7 October 2010; pp. 1–10. [Google Scholar]
- Breiman, L. Random forests. Mach. Learn. 2001, 45, 5–32. [Google Scholar] [CrossRef]
- Lieb, M.; Glaser, B.; Huwe, B. Uncertainty in the spatial prediction of soil texture: Comparison of regression tree and random forest models. Geoderma 2012, 170, 70–79. [Google Scholar]
- Nemes, A.; Rawls, W.J.; Pachepsky, Y.A. Use of the nonparametric nearest neighbor approach to estimate soil hydraulic properties. Soil Sci. Soc. Am. J. 2006, 70, 327–336. [Google Scholar] [CrossRef]
- Martin, M.P.; Wattenbach, M.; Smith, P.; Meersmans, J.; Jolivet, C.; Boulonne, L.; Arrouays, D. Spatial distribution of soil organic carbon stocks in France. Biogeosciences 2010, 8, 1053–1065. [Google Scholar] [CrossRef]
- Skurichina, M.; Duin, R.P. Bagging, boosting and the random subspace method for linear classifiers. Pattern Anal. Appl. 2002, 5, 121–135. [Google Scholar] [CrossRef]
- Efron, B.; Tibshirani, R.J. An Introduction to the Bootstrap; CRC Press: Boca Raton, FL, USA, 1994. [Google Scholar]
- Friedman, J.H. Greedy function approximation: A gradient boosting machine. Ann. Stat. 2001, 29, 1189–1232. [Google Scholar] [CrossRef]
- Elith, J.; Leathwick, J.R.; Hastie, T. A working guide to boosted regression trees. J. Anim. Ecol. 2008, 77, 802–813. [Google Scholar] [CrossRef]
- Cortes, C.; Vapnik, V. Support-vector networks. Mach. Learn. 1995, 20, 273–297. [Google Scholar] [CrossRef]
- Were, K.; Bui, D.T.; Dick, Ø.B.; Singh, B.R. A comparative assessment of support vector regression, artificial neural networks, and random forests for predicting and mapping soil organic carbon stocks across an Afromontane landscape. Ecol. Indic. 2015, 52, 394–403. [Google Scholar] [CrossRef]
- Mansuy, N.; Thiffault, E.; Pare, D.; Bernier, P.; Guindon, L.; Villemaire, P.; Poirier, V.; Beaudoin, A. Digital mapping of soil properties in Canadian managed forests at 250 m of resolution using the k-nearest neighbor method. Geoderma 2014, 235, 59–73. [Google Scholar] [CrossRef]
Figure 1.
Hadoop Cluster.

Figure 2.
MapReduce Programming Model.

Figure 3.
Fertilizer Recommendation System.

Figure 4.
Accuracy of each class of stochastic gradient descent (SGD), artificial neural network (ANN), random forest (RF), K-NN, regression tree (RT), support vector machine (SVM) using a polynomial function, SVM using radial basis function (RBF).
Figure 4.
Accuracy of each class of stochastic gradient descent (SGD), artificial neural network (ANN), random forest (RF), K-NN, regression tree (RT), support vector machine (SVM) using a polynomial function, SVM using radial basis function (RBF).

Figure 5.
Overall Accuracy ANN with different numbers of neurons.

Figure 6.
The receiver operating characteristics (ROC) curves for various methods.


Table 1.
The recommend fertilizer name and their compositions for the nutrition of soil.
| Fertilizer Name | Soil Nutrition Composition |
|---|---|
| Urea | Nitrogen 46% |
| Diammonium Phosphate (D.A.P) | Nitrogen 18%, Diammonium Phosphate 46% |
| Muriate of Potash (M.O.P) | Muriate of potash K60% |
| Sulfur Bentonite | Bentonite Sulfur S90% |
| Zink Sulfate | Zink Sulfate 33% |
| Granubor Natur | Di-Sodium Tetra Borate Penta hydrate B14.6% |
Table 2.
Fertilizer recommendation quantity of classes (kilogram).
| Target Value | Fertilizers During Seeding | Urea After Seeding | |||||||
|---|---|---|---|---|---|---|---|---|---|
| Urea | D.A.P | M.O.P | Sulfur Bentonite | Zink Sulfate | Granubor | After First Irrigation | After Second Irrigation | ||
| Wheat | Sol. I | 7 | 56 | 33 | 11.1 | 0.0 | 2.7 | 29 | 29 |
| Sol. II | 28 | 43 | 33 | 11.1 | 0.0 | 2.7 | 45 | 45 | |
| Sol. III | 2 | 69 | 33 | 0.0 | 0.0 | 2.7 | 29 | 29 | |
| Sol. IV | 12 | 43 | 33 | 0.0 | 0.0 | 2.1 | 29 | 29 | |
| Sol. V | 19 | 43 | 27 | 0.0 | 0.0 | 0.0 | 36 | 36 | |
| Paddy | Sol. VI | 10 | 22 | 33 | 0.0 | 3.6 | 2.1 | 19 | 19 |
| Sol. VII | 1 | 35 | 33 | 0.0 | 3.6 | 2.7 | 14 | 14 | |
| Sol. VIII | 9 | 26 | 33 | 5.8 | 3.6 | 2.1 | 19 | 19 | |
| Sol. IX | 4 | 26 | 33 | 5.8 | 3.6 | 0.0 | 14 | 14 | |
| Sol. X | 5 | 35 | 27 | 0.0 | 3.6 | 2.1 | 19 | 19 | |
Here, Sol. indicates the fertilizer recommendations solutions.
Table 3.
The hardware and software configurations of different hosts.
| Core | HDD | RAM (GB) | Core Speed (GHz) | Hadoop | Ubuntu |
|---|---|---|---|---|---|
| 8 | 1 | 16 | 2.40 | 2.7 | 16.04 |
| 4 | 1 | 6 | 2.0 | 2.7 | 16.04 |
| 4 | 1 | 4 | 2.0 | 2.7 | 16.04 |
| 4 | 1 | 4 | 2.0 | 2.7 | 16.04 |
Table 4.
Confusion matrix of SGD and ANN classifiers.
| Solution | (a) | (b) | (c) | (d) | (e) | (f) | (g) | (h) | (i) | (h) | Overall Accuracy | |
|---|---|---|---|---|---|---|---|---|---|---|---|---|
| SGD | (a) | 1462 | 17 | 9 | 13 | 27 | 39 | 4 | 3 | 23 | 4 | 88.15 |
| (b) | 24 | 1103 | 6 | 22 | 2 | 10 | 14 | 18 | 3 | 8 | ||
| (c) | 20 | 8 | 731 | 8 | 4 | 16 | 33 | 17 | 7 | 11 | ||
| (d) | 7 | 9 | 11 | 586 | 11 | 8 | 7 | 15 | 0 | 1 | ||
| (e) | 15 | 28 | 27 | 16 | 1143 | 32 | 9 | 20 | 9 | 37 | ||
| (f) | 5 | 19 | 12 | 9 | 0 | 898 | 4 | 24 | 16 | 43 | ||
| (g) | 23 | 4 | 41 | 18 | 16 | 21 | 1345 | 22 | 13 | 49 | ||
| (h) | 9 | 11 | 6 | 14 | 1 | 2 | 0 | 643 | 19 | 12 | ||
| (i) | 16 | 3 | 20 | 8 | 16 | 1 | 33 | 9 | 1012 | 18 | ||
| (j) | 6 | 11 | 22 | 2 | 0 | 18 | 13 | 17 | 2 | 548 | ||
| ANN | (a) | 1321 | 35 | 27 | 23 | 21 | 66 | 19 | 28 | 29 | 32 | 81.42 |
| (b) | 53 | 972 | 2 | 21 | 68 | 36 | 6 | 10 | 37 | 7 | ||
| (c) | 26 | 0 | 753 | 16 | 3 | 22 | 4 | 7 | 1 | 29 | ||
| (d) | 11 | 15 | 28 | 496 | 22 | 2 | 20 | 42 | 11 | 8 | ||
| (e) | 7 | 18 | 27 | 47 | 1097 | 51 | 17 | 18 | 25 | 31 | ||
| (f) | 31 | 49 | 20 | 29 | 3 | 779 | 14 | 38 | 11 | 56 | ||
| (g) | 29 | 34 | 38 | 11 | 41 | 35 | 1261 | 7 | 53 | 42 | ||
| (h) | 14 | 35 | 14 | 21 | 7 | 8 | 2 | 585 | 26 | 15 | ||
| (i) | 18 | 37 | 23 | 59 | 62 | 46 | 80 | 45 | 928 | 30 | ||
| (j) | 5 | 11 | 17 | 60 | 4 | 3 | 14 | 1 | 3 | 543 | ||
Table 5.
The AUC of SGD and ANN classifiers for fertilizer solution classes.
| Solution | SGD | ANN |
|---|---|---|
| (a) | 0.93 | 0.81 |
| (b) | 0.91 | 0.80 |
| (c) | 0.83 | 0.82 |
| (d) | 0.87 | 0.80 |
| (e) | 0.88 | 0.79 |
| (f) | 0.89 | 0.75 |
| (g) | 0.84 | 0.87 |
| (h) | 0.90 | 0.80 |
| (i) | 0.88 | 0.84 |
| (j) | 0.89 | 0.88 |
| Average | 0.882 | 0.816 |
Table 6.
Comparative analysis of various approaches using average AUC and Overall accuracy.
| Methods | Average AUC | Overall Accuracy |
|---|---|---|
| SGD [11] | 0.882 | 0.881 |
| ANN [32] | 0.816 | 0.814 |
| RF (Random Forest) [44] | 0.790 | 0.786 |
| K-NN [45] | 0.783 | 0.761 |
| RT (Regression Tree) [38] | 0.756 | 0.749 |
| SVM using Polynomial functions [15] | 0.743 | 0.737 |
| SVM using Gaussian radius basis functions [15] | 0.728 | 0.720 |
Table 7.
Predictive performance of various methods using mean absolute prediction error (MAE), root mean square error (RMSE), and coefficient of determination (R2) prediction error indices.
Table 7.
Predictive performance of various methods using mean absolute prediction error (MAE), root mean square error (RMSE), and coefficient of determination (R2) prediction error indices.
| Methods | |||
|---|---|---|---|
| SGD [11] | 0.41 | 0.45 | 0.74 |
| ANN [32] | 0.49 | 0.58 | 0.71 |
| RF(Random Forest) [44] | 0.53 | 0.65 | 0.69 |
| K-NN [45] | 0.57 | 0.60 | 0.64 |
| RT(Regression Tree) [38] | 0.66 | 0.73 | 0.62 |
| SVM using Polynomial functions [15] | 0.73 | 0.82 | 0.60 |
| SVM using Gaussian radius basis functions [15] | 0.75 | 0.86 | 0.59 |
© 2019 by the authors. Licensee MDPI, Basel, Switzerland. This article is an open access article distributed under the terms and conditions of the Creative Commons Attribution (CC BY) license (http://creativecommons.org/licenses/by/4.0/).
Share and Cite
MDPI and ACS Style
Garg, R.; Aggarwal, H.; Centobelli, P.; Cerchione, R. Extracting Knowledge from Big Data for Sustainability: A Comparison of Machine Learning Techniques. Sustainability 2019, 11, 6669. https://doi.org/10.3390/su11236669
AMA Style
Garg R, Aggarwal H, Centobelli P, Cerchione R. Extracting Knowledge from Big Data for Sustainability: A Comparison of Machine Learning Techniques. Sustainability. 2019; 11(23):6669. https://doi.org/10.3390/su11236669
Chicago/Turabian StyleGarg, Raghu, Himanshu Aggarwal, Piera Centobelli, and Roberto Cerchione. 2019. "Extracting Knowledge from Big Data for Sustainability: A Comparison of Machine Learning Techniques" Sustainability 11, no. 23: 6669. https://doi.org/10.3390/su11236669
Note that from the first issue of 2016, this journal uses article numbers instead of page numbers. See further details here.