Sustainability and Subjective Well-Being: How Students Weigh Dimensions
by
 , ,
, ,
Attila Lengyel
1 ,
,
Sándor Kovács
1,*,
Anetta Müller
1,
Lóránt Dávid
2,
Szilvia Szőke
1 and
Éva Bácsné Bába
1 1
Faculty of Economics and Business, University of Debrecen, Böszörményi út 138, H-4032 Debrecen, Hungary
2
Faculty of Economics and Social Sciences, Szent István University, Páter Károly utca 1, H-2100 Gödöllő, Hungary
*
Author to whom correspondence should be addressed.
Sustainability 2019, 11(23), 6627; https://doi.org/10.3390/su11236627
Submission received: 6 October 2019
/
Revised: 18 November 2019
/
Accepted: 21 November 2019
/
Published: 23 November 2019
(This article belongs to the Special Issue Education and Sustainable Development)
Abstract
:Sustainability and Subjective Well-Being (SWB) are strongly interrelated domains. The way students view them and prioritize their dimensions should be factored into curricular developments in education for sustainability. Instruments developed to examine sustainability and SWB preferences typically use rating scale items to measure dimensions as separate entities. In contrast, the question format used in this study forces the students to rate variables in relation to each other. The sum of both SWB and sustainability variables was fixed, which means that increasing the weight of a priority automatically meant a decrease in the weight that could be allocated for the remaining elements. Two-block Partial Least Squares (PLS) modelling was used to examine how pre-defined SWB and sustainability dimensions behave when handled within the same model. It was found that those who ordered the three sustainability dimensions as Environment > Society > Economy tended to rank SWB dimensions as (Relations with others, Inner peace) > (Health, Close to nature) > (Good job, Leisure). Our research proved that the use of question formats resembling real-life resource allocation dilemmas and the treatment of SWB and sustainability as one system can yield invaluable information for the educational process.
1. Introduction
Today the vast majority of scientists agree that Subjective Well-Being (SWB) based on (over) consumption is not reconcilable with environmental sustainability [1,2,3,4,5]. Less consumption, however, does not necessarily entail lower levels of SWB. On the contrary, there is research evidence of higher SWB levels among people who choose to pursue intrinsic (spiritual) rather than extrinsic (materialistic) goals [6,7]. Thus, sustainability and Subjective Well-Being (hereafter SWB) are not only inseparable [8,9], but higher levels of eudemonic types of well-being, where emphasis is on intrinsic motivations and a harmonious relationship with others [10], seem to produce higher levels of sustainability.
While it is obvious that educating individuals to nurture eudemonic SWB and sustainability values should start as early as possible [11], our research focuses on undergraduate university students of economics. Studying the views of the students in tertiary education is especially critical as they are prospective decision makers of the future. Higher education institutions (hereafter HEIs) striving to create sustainability curriculums that carry the potential of transforming students’ SWB and sustainability priorities must have a thorough understanding of a student’s value system concerning these two domains. This understanding should be based upon regular empirical assessment of students’ sustainability and SWB values and priorities using quantitative, qualitative or mixed methodologies. Besides clear benefits for curriculum development, the results of these tests could also assist students by providing regular feedback on how their views change during the educational process.
Measuring the various dimensions of SWB sustainability by the typical rating scale formats prevalent in earlier literature can provide valuable data on how these domains are valued as separate items. However, in this way, no insight is possible into how they are prioritized if they are handled as one interdependent group of items. The question format used in our research places students in a dilemma situation that better resembles real-life decision-making. In real-life circumstances, the amount of time, energy and financial resources are finite for the individual, and dividing them between various SWB or sustainability dimensions necessarily entails a biased allocation process in which a certain weight given to a dimension necessarily affects the possible weighing of the other dimensions.
As a typical procedure, researchers studying the relationship between SWB and sustainability use various scales to measure these domains and compare scale scores to see how strongly the constructs are related [12]. The two-block Partial Least Squares (PLS) model employed in our study allows a deeper understanding of the interaction between the two domains as it is able to examine how various groups of SWB and sustainability variables interact. We believe that both the unique question format and the use of the two-block PLS model greatly contribute to forming a more systemic view of students’ SWB and sustainability priorities.
Based on the propositions discussed above, the research questions our study aims to answer are: 1. How do undergraduate university students prioritize SWB and sustainability dimensions if there is an aggregate weight to be divided between the dimensions? 2. How do SWB and sustainability dimensions relate to each other when treated within the same statistical model based on two-block Partial Least Squares?
2. Literature Review
University students (the campus sample) have often been chosen as the target population of SWB surveys [13,14]. Many of these studies focus on comparing hedonic and eudemonic well-being preferences, choices and outcomes [15]. In a longitudinal research, Sheldon, Corcoran and Prentice [16] found that goals related to happiness, that is, hedonism-based well-being, could not be accomplished while goals related to improving one’s eudemonic values were successful. Braaten et al. [17] point out, while hedonic well-being is also important for students’ cognitive-affective balance during university years, it is eudemonic goals that can have long-lasting effects on the overall satisfaction with life. In an empirical study, Freire et al. [18] found that eudemonic values alongside with self-efficacy are instrumental to deal with stress during university life. In Delle Fave et al.’s [19] research, along with Norway and Croatia, Hungarian respondents placed the biggest emphasis on the Health domain. In the same survey, along with Norway and the USA, Hungarians conceptualised happiness within the domain of family. Social activity and social relationships have been found to be positively correlated with SWB in earlier studies [20,21]. In the World Values Survey (hereafter WVS), family as a value shows little fluctuation across different cultures while the importance of friends varies greatly (WVS 2014). Examining gender differences in students’ value systems over a 20-year period, Beutel and Marini [22] found that female students showed higher preference for non-materialistic values such as meaning in life and responsibility for others. Earlier research has found level of education to be a predictor of post-materialistic goals [23]. Warner and Vroman [24] found that physical health significantly affected the level of happiness in a university sample. The positive relationship between health and happiness has also been documented in general populations as well [25]. Veenhoven [26] found that freedom is positively correlated with happiness in nations with a relatively high standard of living.
SWB is typically measured via self-report instruments using verbal or numeric rating scales [27]. The chosen dimensions of SWB are measured by these rating scales as separate items and then the overall mean value is calculated from the individual scores. In one of the popular SWB instruments, the Personal Well-being Index (hereafter PWI), seven SWB domains are measured on an end-defined numeric rating scale running from 0–10 [28]. Later, the scale was shortened to five dimensions to fit cross-cultural measurements [29]. This methodology cannot simulate real life decision making. However, a lot of authors emphasize establishing real-life resembling learning contexts [30,31]. Jerram calls attention to exposing students to “… authentic contexts that reflect the way the knowledge will be used in real life…” [32] (p. 114).
While one can find theoretical elaborations on how to weigh sustainability dimensions (hereafter SDs) in various circumstances [33,34], quantitative research about how students in tertiary education weight SDs is scarce [35]. At the same time, understanding the interplay and connectedness of SDs and being able to balance them in real life projects frequently appears as a desirable learning outcome of HEIs [36,37]. Dimensions of sustainability in the literature are usually depicted in the form of a Venn diagram of three overlapping circles suggesting an equal importance and non-hierarchical connection between them. In spite of the widespread use of the Venn representation, students’ perception and understanding of SDs seems to be heavily unbalanced across cultures. In a qualitative study using a representative sample, Perrault and Clark [38] found that American students’ predominantly identified sustainability with environmental problems, hardly mentioning social and economic aspects. Earlier, Kagawa [39] reported the same weighing pattern among English students, and Tuncer [40] also found similar bias towards environmental issues in a sample of Turkish students. Koch et al. [41] examined Indonesian students’ knowledge of sustainable management and found that they were much better informed ecologically than about socio-economic issues of sustainability. In contrast, Lengyel et al. [42], in a qualitative study involving a sample of undergraduate students of economics, reported that when students were assigned the task of laying down principles for building a small self-sufficient community in a country location, the social aspect received the biggest emphasis, followed by economy and environment. STARS (Sustainability Tracking, Assessment and Rating System™), a voluntary, self-reporting framework for HEIs, calls this model a three-legged stool representation and mentions it together with the Russian doll model of three nested concentric circles, without giving priority to either of the two models. Systems thinking properly applied to the three dimensions naturally leads to a Russian doll model of strong sustainability [43].
Considering our research questions, the previously discussed literature and our sample consisting of students of economics, we hypothesized that: 1. Health and Relations with others will be the most important SWB dimensions for students. 2. Eudemonic type of SWB dimensions will be lower ranked than other dimensions. 3. Sustainability dimensions will be relatively closely weighed at all spatial scales. 4. Female students will show higher preferences for eudemonic SWB dimensions. 5. The level of education will positively correlate with the level of SWB. 6. Students who rank eudemonic SWB dimensions higher tend to favour a strong sustainability ranking pattern of Environment > Society > Economy. 7. Environment will be the highest ranked SD at all spatial levels.
3. Materials and Methods
3.1. Data Collection and Methods of Statistical Assessment
The empirical research was conducted in the Economic faculties of three universities in Hungary: John von Neumann University, Eszterházi Károly University, and University of Debrecen. Students of all programme levels (2-year higher level vocational training, bachelor, masters, PhD) received the link to the test. Out of the 865 questionnaires that were returned, 524 were fully completed and served as the basis of statistical analysis (John von Neumann University n = 265, Eszterházi Károly University n = 149, University of Debrecen n = 110). Table 1. shows the demographic makeup of the sample.
As a survey instrument, we used an online questionnaire consisting of five questions, besides the ones asking about demographic information (gender, age, income level of parents, level of programme). The questionnaire was totally anonymous, no personal information besides demographic data was required. As sustainability issues are relevant on a local, regional (here it means country level) and global level, we wanted to see whether students discount the three dimensions across space. Mitigation policies and sustainability policies, in general, inevitably involve spatial discounting [44,45]. From spatial discounting data, inferences can be made about the respondents’ sense of spatial interconnectedness which is an important factor in making value-based decisions about sustainability [46]. As a question format, 0–100 rating scales were used with slide precision of 5 scale points. Using 0–100 scales in attitude surveys is not widespread but not without precedent either [47,48]. Some authors argue that unlike typical Likert-type rating scales with 4–7 scale points providing ordinal level data, 0–100 scales can be considered an interval level measurement making statistical analysis more reliable [49]. The full version of the questionnaire is in Appendix A.
In the first three questions, respondents had to prioritize between the three SDs (environment, society, economy) on three different spatial scales (Local, Country, Global). As it was our aim to test how students prioritize sustainability efforts between the three SDs as a system, they were instructed that at each spatial level all possible sustainability efforts are taken to be 100% and they had to allocate percentage values between the three dimensions. For each spatial scale there were three sliders and a scale ranging from 0–100. Compared to the typical rating scale item format, our presentation of the question forced the students to rate variables in relation to each other. The sum of the variables had to be 100%, which means that increasing the weight of a priority automatically meant a decrease in the weight that could be allocated for the remaining elements.
The fourth survey question aimed to test certain dimensions of SWB. As in the case of the first three questions, students had to assign percentage values to the different dimensions based on how important they were in determining the respondent’s SWB in relation to the other values. Percentage values for each dimension were set by respondents using a slider on a 0–100 scale. Similar to the first three questions, the sum of the variables had to be 100%, which means that increasing the weight of an SWB dimension automatically meant a decrease in the weight allocated for the remaining elements. The SDs variables and the SWB variables could not be handled as scales, as the aggregate value for both in each case was one hundred percent. The tested SWB dimensions were:
- Relations with others (family, friends, partners, colleagues)
- Close to nature (live close to nature and spend as much time as possible in nature)
- Inner peace (inner harmony, quiet and calmness)
- Belief in God
- Health (mental and physical)
- Freedom (freedom to do what you want to do)
- Money (to do what you want and buy what you want)
- Leisure (cinema, concerts, holiday travel etc.)
- Good job (work in a good atmosphere, for good money and do what you enjoy)
Some of the above dimensions can be found in already established SWB instruments. Relations with others, Money, and Health in differently worded forms are among the dimensions of the PWI, and the domains Belief in God and Inner peace considerably overlap with the “Spirituality or religion” included as an optional extra dimension of the scale [50]. Freedom or autonomy is often measured as an eudemonic SWB dimension [51] while Leisure as a hedonic element [52]. Belief in God and Inner peace was chosen to reflect on the imperative of paradigm change moving from consumer values towards spiritual ones. Closeness to nature represents the importance of relearning to take instructions from nature [42]. Finally, Good job is a dimension having culture-dependent significance in the Hungarian society.
Positive relations with others have been found to be an important aspect of eudemonic well-being [53]. Nature connectedness has been shown to be positively correlated with subjective well-being [54,55] and sustainable behaviour [56]. The distinction between Belief in God and Inner peace was warranted by the fact that there has been a marked increase in the number of SBNR (Spiritual But Not Religious) [57] alongside a considerable decrease in the number of regular churchgoers in Hungary and in Europe in general. The decrease is biggest among young people [58,59]. The health dimension was especially important to include as the Hungarian population’s health status has been among the worst in Europe and the OECD for decades [46,60] and this low health status is characteristic of Hungarian college students as well [61]. Leisure activities form a very important part of students’ life in a HEI, and leisure dimensions and SWB are positively correlated among students of HEIs [62]. Leisure satisfaction and SWB are also strongly correlated in college and university populations [63]. In individualistic consumer societies such as Hungary, personal freedom is a very highly valued asset and it has a significant effect on SWB [62]. The connection between money, material aspiration and SWB has been a very intensively researched area of well-being research [13,64] According to a motivation survey, salary is still the top priority of job seekers in Hungary [65]. Job satisfaction and SWB are relatively strongly correlated [66]. Already validated SWB measures do not or only partly measure preferences for these dimensions [67,68].
The fifth question tested the respondent’s level of happiness. Similar to the questions before, a slider had to be moved between 0–100 where 0 meant total unhappiness and 100 perfect happiness. The question was: How happy have you been feeling recently? Measuring happiness with a single item scale has been the procedure of several studies [69].
3.2. Two-Block Partial Least Squares Analysis of the Data
Partial Least Squares (hereafter PLS) is a statistical method that combines regression with principal component analysis [70]. It is well-suited to analyse complex multivariate data sets. Using PLS with two (or more) data sets or blocks, it is possible to establish linear combinations of variables which are predictive of linear combinations of variables in the other block [71,72]. The method finds factors in both sets but with the goal of maximizing the covariance between the two sets of variables obtaining the maximum correlations between the corresponding factors from both sets (called Block 1 and 2). The complete algorithm is described in Rohlf and Corti [73] and implemented in R 3.4.4. software [74] in the Morpho package.
In our study the variables were categorized into one of two blocks. Block 1. consisted of the nine (3-3) variables of SDs prioritized on the three spatial levels while Block 2. had variables of SWB dimensions and the level of happiness. By using the 2-block PLS model we were able to identify groups of variables in one block that “move together” with groups of variables in the other. For checking within group differences and variance between variables, t-test and one-way ANOVA were employed.
4. Results
It should be noted that in the three universities taking part in the empirical research, sustainability is integrated into the core curricula as a course titled “Environmental economics” and also offered in the form of elective courses such as “Sustainable tourism management”. In the University of Debrecen alone “Sustainable development” is offered as an elective course.
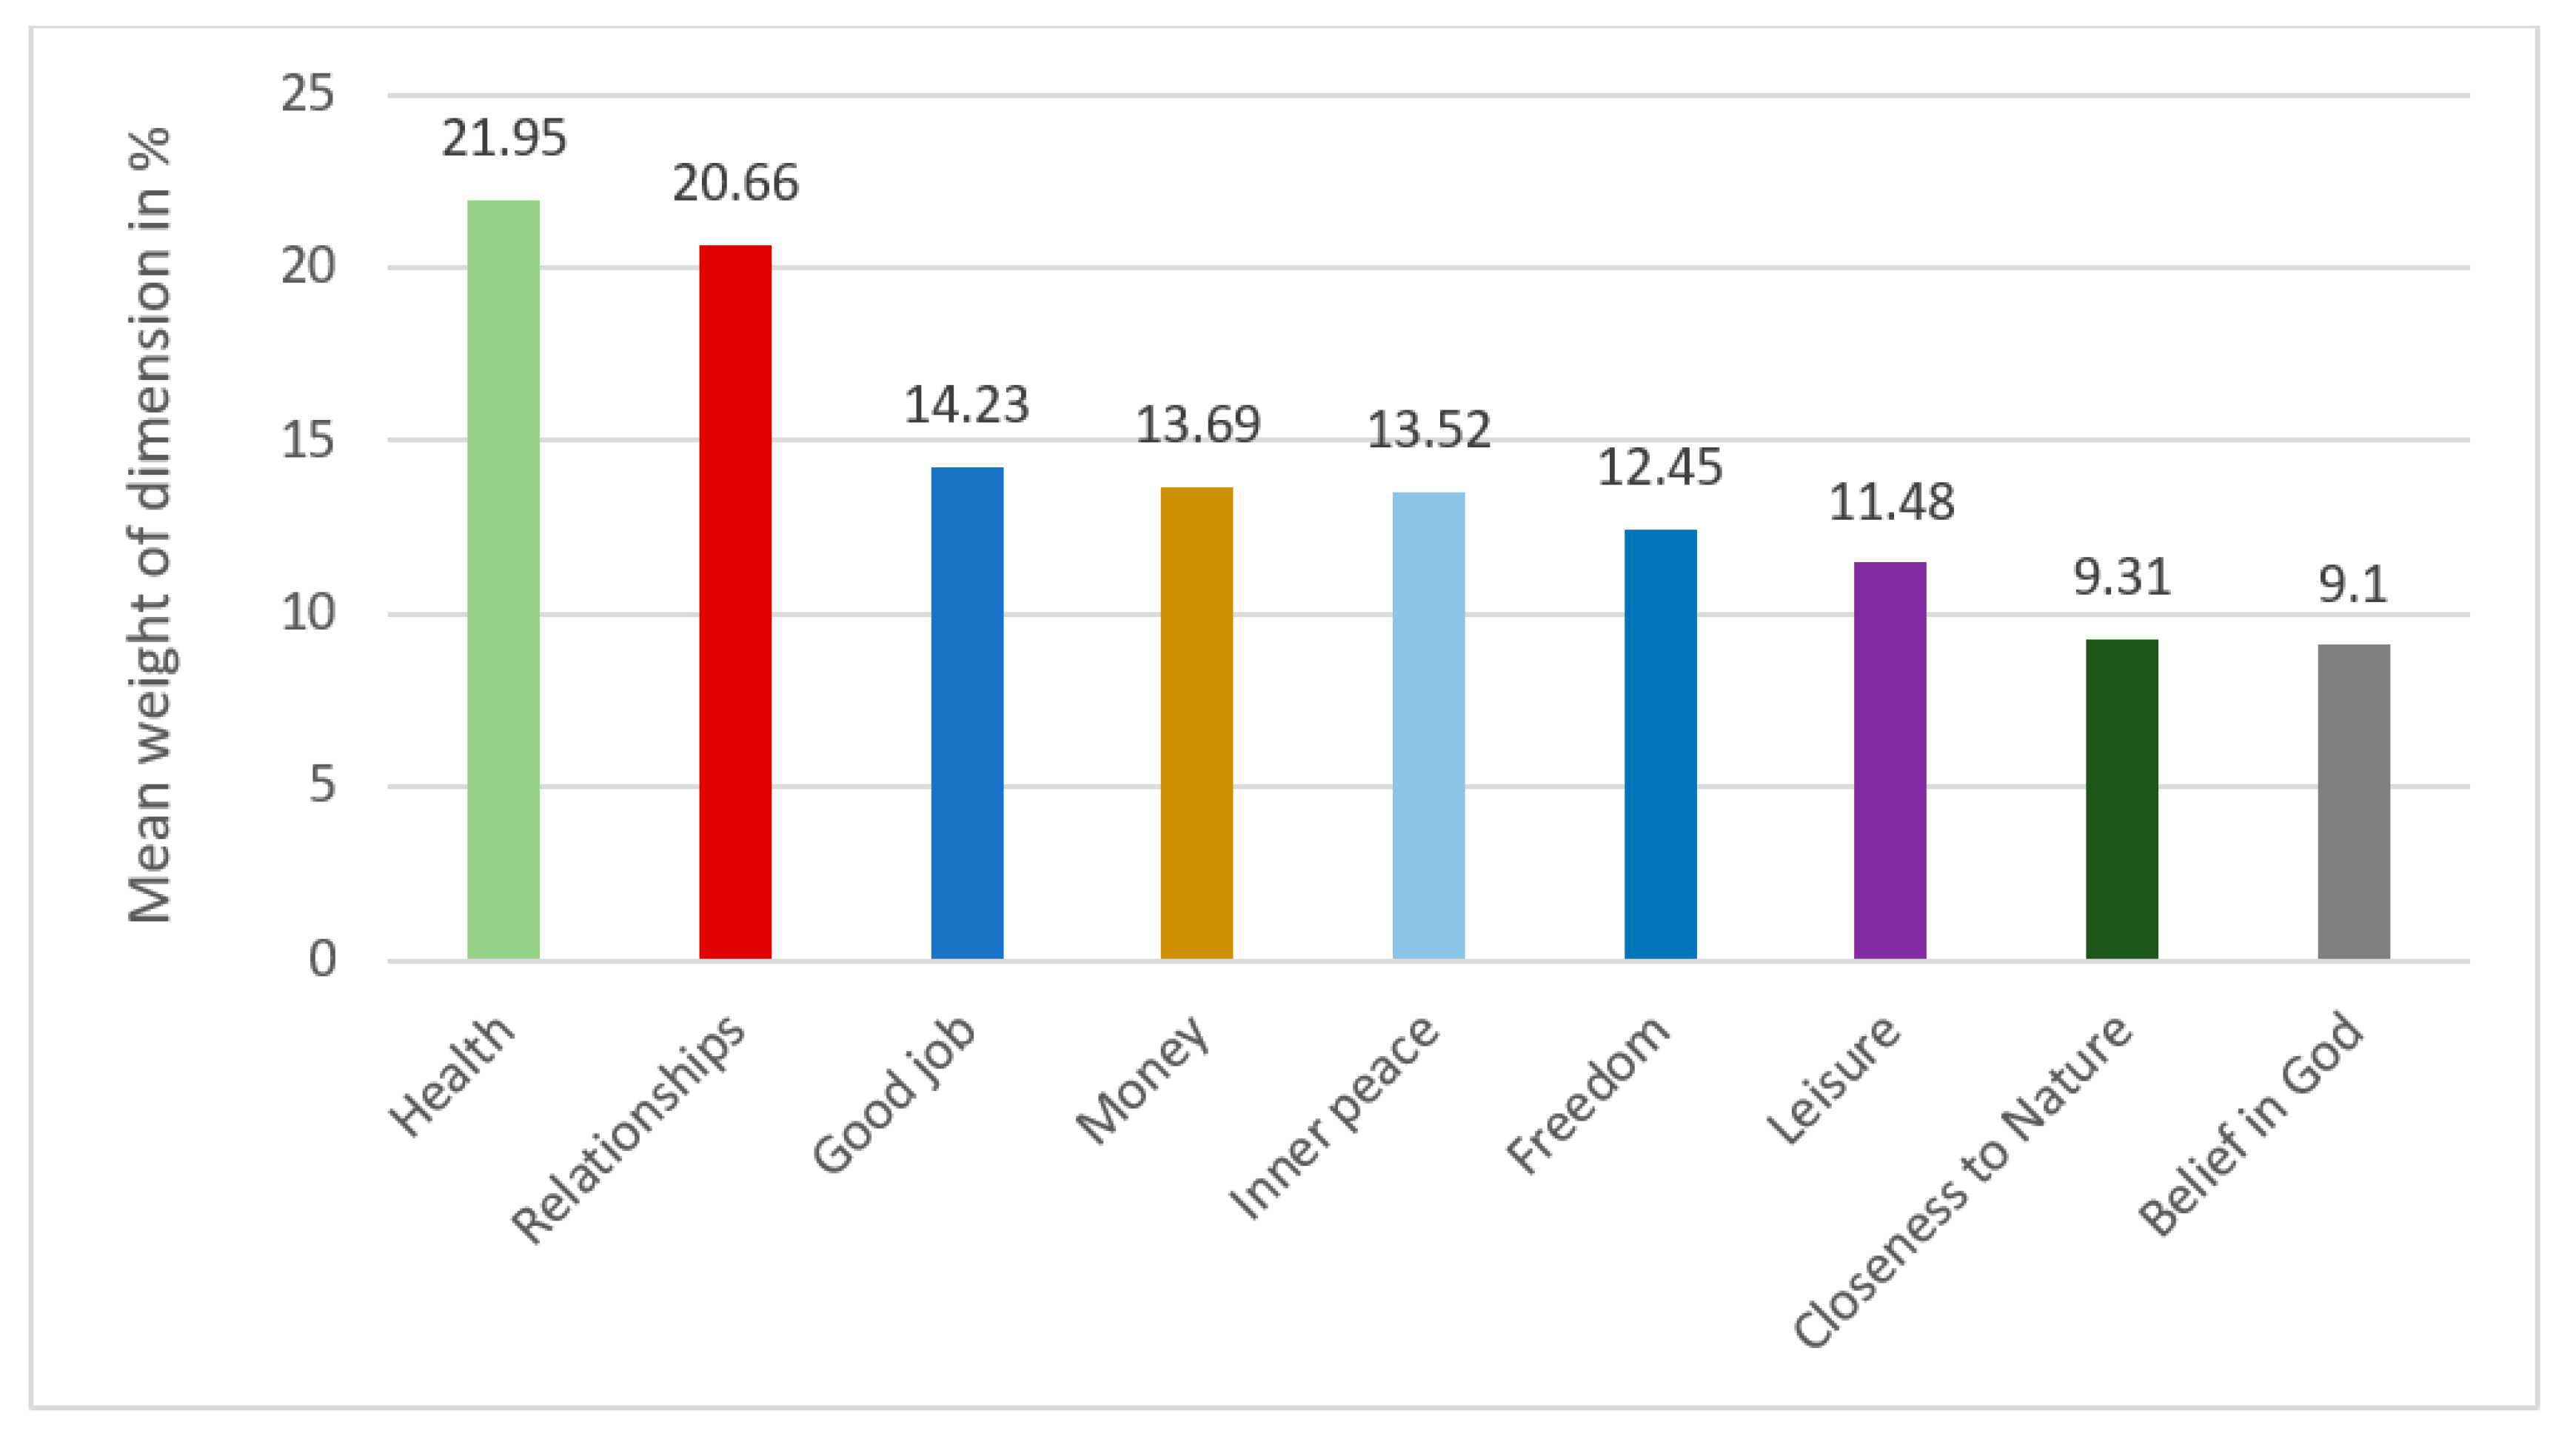
Examining the mean values of the nine SWB dimensions and their ranking (Figure 1) we can find several aspects that support earlier literature but there are some notable differences too. Of special significance among earlier literature is a large-scale investigation of happiness concepts in 13 countries, including Hungary [19]. Many of our results coincide with the results of this survey. Ranking Health and Relationships with others as the most important factors in SWB largely coincides with recent findings of Delle Fave et al. [19], and Lamu and Olsen’s [75] cross-cultural research conducted on large samples in Australia, Canada, Germany, Norway, UK and the US. Based on the results, our first hypotheses predicting Health and Relations with others to be the most important SWB dimensions for students has been confirmed.
Contrary to earlier research findings, pointing out a strong relationship between religious involvement, belief in God and SWB in general populations [76,77], and in college/university samples [78,79] in our research, students ranked this SWB dimension the lowest. This result, however, is in complete harmony with representative surveys of the last two decades about Hungarian youth, as they reported a steadily decreasing religiosity among young people [59,80]. As for nature connectedness being the second lowest rated SWB dimension, our results do not seem to lend much support to cross-cultural studies where closeness to nature and SWB is positively correlated [81]. Leisure’s ranking (third lowest, even lower than Inner peace) is apparently another counter-intuitive result [52]. We had expected Leisure to be one of the highest-ranking dimensions. In an early study, Balatsky and Diener [82] found that Russian students’ Leisure and Recreation satisfaction were the strongest predictors of overall SWB. In a representative survey Brajša-Žganec, Merkaš, and Šverko [83] found that Leisure significantly contributes to the SWB of the Croatian public. Freedom’s relatively low significance in a student sample is, once again, somewhat unexpected even though earlier empirical investigations of this variable and SWB did not yield straightforward correlations. Analysing data for 46 nations, Veenhoven [26] concludes that Freedom is positively related with SWB (happiness) in rich nations, but not in poor ones. Worldwide Gallup survey results between 2005–2017 show medium strong correlation between Freedom and SWB.
Considering this prioritization pattern, Hypothesis 2 predicting that eudemonic type of SWB dimensions will be lower ranked than other dimensions is only partially confirmed. While eudemonic dimensions like Inner peace, Freedom or Closeness to nature do rank lower that Good job or Money, Relations with others ranks higher.
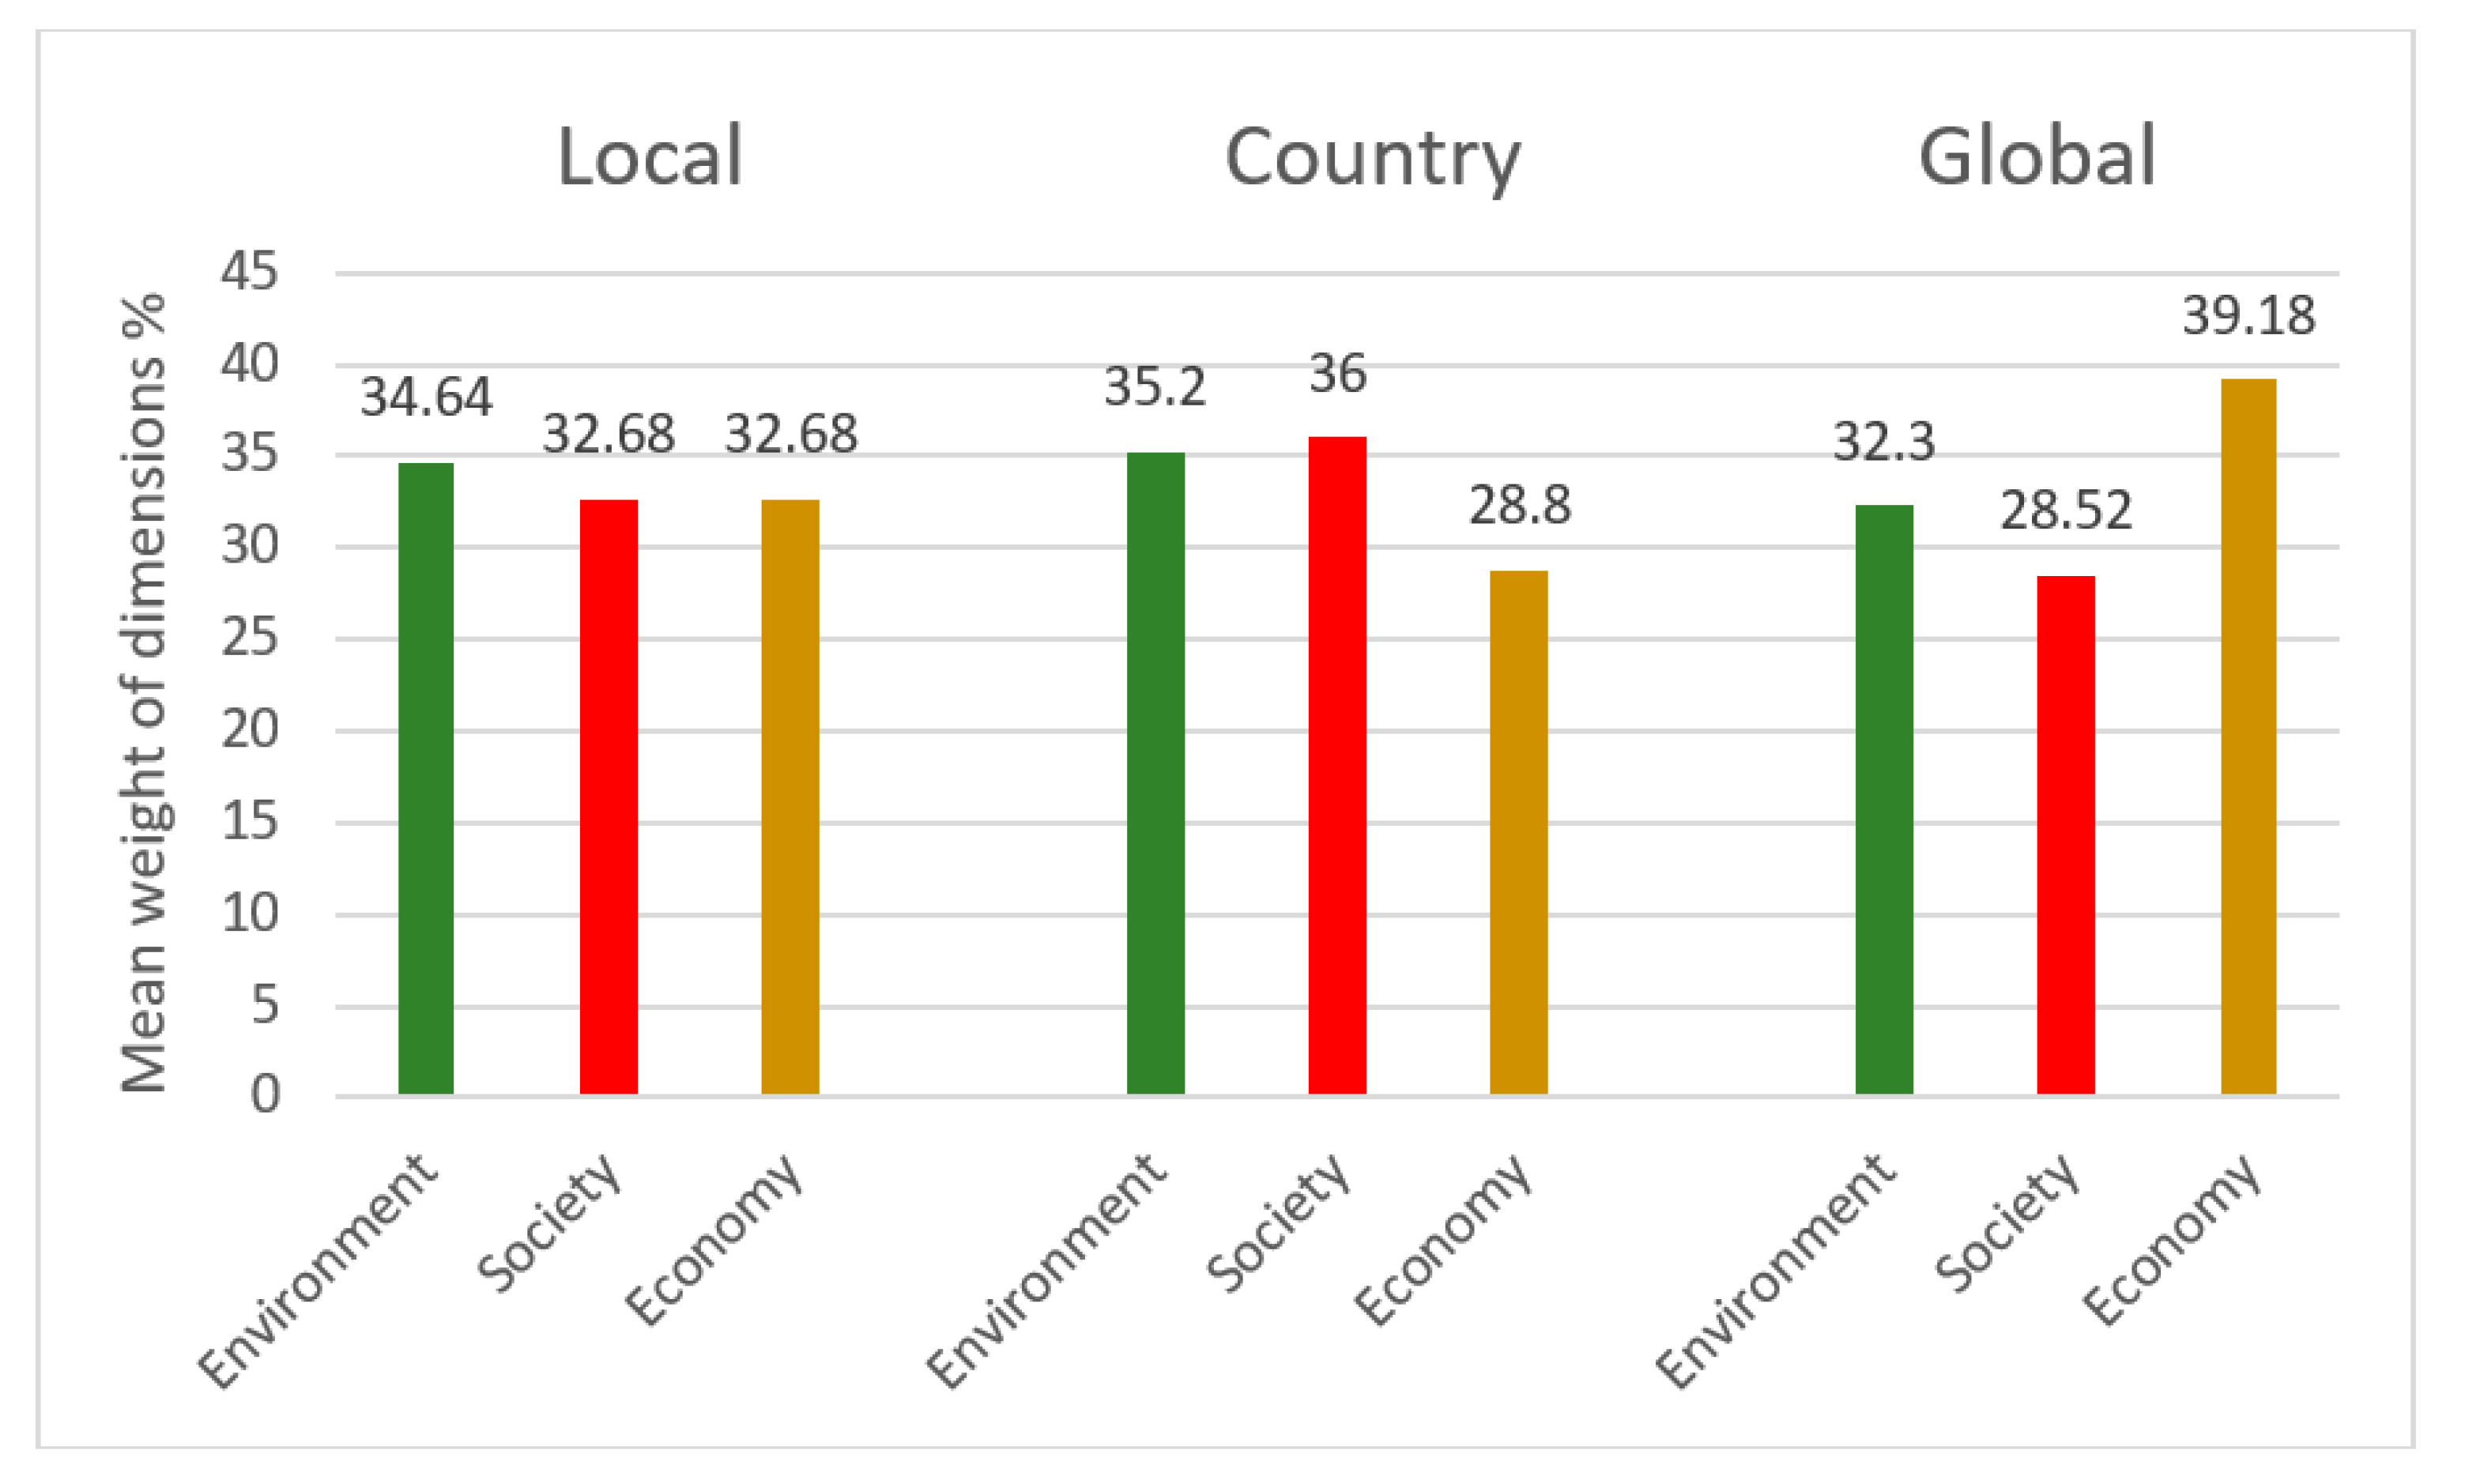
Figure 2 shows how students weigh the three sustainability pillars on the three spatial levels.
While it is obvious that sustainability change agents (hereafter SCA) have to embrace, among other key competencies, systems thinking enabling them to work across different spatial and systemic scales [84], most of their efforts are made in connection with local sustainability challenges [85].
The weight differences are very small and the three dimensions might be represented by a typical Venn diagram. These results support our third hypothesis expecting sustainability dimensions to be relatively closely weighed at all spatial scales. However, our seventh hypothesis predicting the Environment to be the highest ranked SD at all spatial levels, has to be rejected. Interestingly, this balanced weighing pattern was also found in a sample of 54 decision makers of a German automotive company in a research on sustainability life cycle assessment of different car components [34]. Kagawa’s [39] research is one of the few testing university (Plymouth) students’ weighing of sustainability dimensions. In his experiment, students showed a huge bias towards the environmental dimension (86%) and only marginally considered the social (6%) and the economic dimension (8%). Positive bias for the environmental pillar seems to be the most widespread among students and teachers of HE [86,87]. In Keseru et al.’s [88] experiment, mobility project stakeholders in Europe heavily over-weighed societal criteria (M = 46.25) while underweighting both the environmental (M = 28.5) and the economic domains (M = 25).
Although the rate of discounting is moderate, it is in line with earlier findings in the literature demonstrating an optimistic spatial bias in connection with the environment, that is, as the distance is increased from the respondent’s point of reference, positive assessment of the environment is decreased [89]. This finding is supported by Lengyel’s [90] research involving a nationwide sample of local leaders of Hungary. Local government leaders heavily and negatively discounted the importance of environmental protection between the local (their municipality) and the global levels. While temporal discounting of social problems is addressed by many in earlier literature [91,92], their discounting across space is rarely examined [44]. The slight negative discounting of social sustainability challenges between the local and country levels might only be hypothetically answered. In the Hungarian context, one possible reason why students see social challenges bigger on the country level is the fact that in the last ten years over three hundred thousand youth left the country in the hope of a better life in one of the western European countries [93]. The slight positive discounting of the social dimension of sustainability might correspond to findings about social discounting [94,95]. Discounting patterns of the economic dimension are even more difficult to explain as there is no relevant literature. The slight positive discounting between the local and country levels might be attributed to the improving macroeconomic performance indicators of the country in the last ten years, while the marked negative discounting between the country and global levels could be the result of the severe global economic crisis a few years ago. These assumptions need in-depth investigation that goes beyond the scope of this paper.
Results of the 2-Block PLS Model
After the canonical correlation, the scores of variables belonging to the two blocks of Axis 1. is 0.278, and for Axis 2. is 0.273. The data set was transformed into two dimensions where relationships are visualized using two axes. The axes (dimensions) are latent variables and in the coordinate system the coordinates of variables are equal to their correlation with these latent variables. Consequently, if a variable is close to an axis, its correlation with that axis is low. As correlations can be negative, we can notice opposites. Importance of Relations with others and Economy (Lo) can be characterized with a relatively long position vector in opposing directions, which entails that their role in the model is opposite too. We can say that a significant part of the sample ranked Relations with others high, while at the same time ranked the importance of local economic challenges low. The reverse is also true: a considerable number of respondents thought that efforts for the local economy are more important than human relations. Leisure and Inner peace are another example. Variables close to one another were evaluated similarly by students. In Figure 3, three ellipses show the groups of variables that were evaluated similarly. These groups of variables also tend to move together. For example, students who valued Economy, Happiness, Closeness to nature, Freedom and Health similarly tended not to value the variables in the other two groups too thigh.
The positive and negative side of Axis 2. showed significant differences for gender when scores were tested by t statistics (t(517) = 3.727; p < 0.001). Relations with others (0.571), Inner peace (0.364), and the importance of Money (−0.52) and Leisure (−0.429) are on opposite sides of Axis 2. In brackets, loadings belonging to the variable are shown. Male students tended to rank Money and Leisure higher while female students placed larger emphasis on Relations with others and Inner peace. Examining the variables separately, we found significant differences between female and male students in terms of Inner peace (t(517) = 2.521; p = 0.012) and Money (t(517) = 4.069; p < 0.001). This result seems to be supporting earlier literature on gender differences concerning certain values [96] as well as our fourth hypothesis predicting that female students would show higher preferences for eudemonic SWB dimensions.
We tested differences in scores between different education levels. The one-way ANOVA resulted in significant differences in both blocks of Axis 1 (Block 1: F(4, 512) = 3.786; p = 0.005, Block 2: F(4, 512) = 4.799; p = 0.001.). For Block 1 the results mean that students with higher education levels ranked economic dimensions higher while those with lower education levels were more concerned about societal problems. On the variable level there was significance difference between secondary school graduates (grammar school, vocational school) and those already possessing a higher education certificate or degree (2-year higher level vocational training, bachelor degree, master’s degree): secondary school graduates considered economic problems significantly less important on all spatial levels (local t(515) = 3.124; p = 0.002, country t(515) = 2.934; p = 0.003, global t(515) = 2.464; p = 0.014) while they ranked the social dimensions higher on local (t(515) = 2.103; p = 0.036) and country levels (t(515) = 2.850; p = 0.005). Somewhat counterintuitively, students with higher education levels tended to rank global environmental challenges lower than their lower-educated peers (t(515) = 2.180; p = 0.030).
Significant differences were found for Health (t(515) = 3.490; p = 0.001), Relations with others (t(515) = 2.060; p = 0.040), Freedom (t(515) = 3.452; p = 0.001) and Leisure (t(515) = 2.316; p = 0.021). Uncovering the causes of why secondary school graduates valued Freedom and Relations with others more and why respondents with a degree prioritized Health and Leisure higher goes beyond the scope of this study. While there have been studies analysing the connection between the level of education and the level of SWB [97,98], no prior literature discusses how the level of education influences preferences for various SWB dimensions. Based on these results, it can be stated that the fifth hypothesis, expecting the level of education to be positively correlated with the level of SWB, has to be rejected.
Taking into account that out of nine Central and Eastern European countries (Albania, Bosnia and Herzegovina, Bulgaria, Croatia, Czech Republic, Hungary, Macedonia, Poland, Romania, Serbia, and Slovenia), Hungary ranks ninth [99] in terms of the application of the five ESD principles (Futures thinking, Critical and creative thinking, Participation and participatory learning, Partnership, Systemic thinking), the overall results of our empirical research might warrant some optimism. Compared to Kagawa’s [39] and Schaffhauser-Linzatti and Ossmann’s [100] results, Hungarian students’ weighing of the three SDs is relatively not so far from the strong sustainability (Russian doll) model of Environment > Society > Economy. Weighing on the local level shows the largest similarity to the strong sustainability model. Additionally, those who ordered the three SDs as Environment > Society > Economy (strong sustainability group) tended to rank SWB dimensions as (Relations with others, Inner peace) > (Health, Close to nature) > (Good job, Leisure). It must be underlined that for this strong sustainability group, Inner peace was ranked highest, higher than Happiness or Leisure. Our sixth hypothesis, stating that students who rank eudemonic SWB dimensions higher tend to favour a strong sustainability ranking pattern of Environment > Society > Economy, is confirmed.
In light of the empirical results detailed in this section, it can be stated that the hypotheses initially formulated in connection with the two research questions have been only partially confirmed by the empirical results.
5. Discussion
The aim of the present study was two-fold. We wanted to test how undergraduate university students of Economics from three Hungarian universities prioritize SDs at three spatial levels and also how they rank nine SWB dimensions. The question format we created was intended to simulate real-life decision-making processes [101] necessarily characterized by restrictions on allocable resources. Weighing the various dimensions of the two examined domains against each other, students were forced to take a wholistic view of the decision-making challenge [102]. In this way, we believe, this study has managed to move beyond the typically used rating scale question formats where the dimensions of the two domains are tested as separate indicators and not as a system of interconnected elements.
While certain values, such as Health or Relations with others show considerable invariance across cultures in student populations [19], Diener and Biswas-Diener [103] call attention to the importance of interpreting research results by factoring in the actual life circumstances and cultural background of respondents [13]. Our results support these propositions. Inner peace’s relatively high ranking among the SWB dimensions is possibly attributable to the fact that the Hungarian population in general [104], and Hungarian university students in particular [105], do not fair too well in terms of psychological well-being. As possible future educational policy implication and recommendation, it might be suggested that Hungarian universities should launch courses focusing on students’ health, stress management skills and inner harmony. Another good example for the importance of context-dependent interpretation is the poor rating of the SWB variable, Belief in God. This formulation of the frequently measured eudemonic SWB dimension ‘religiousness’, covers not only those who are members of a monotheism-based community, but also those who do believe in God, yet are not church-goers. The low priority attached to this dimension is even more interesting considering the fact that between 2001–2016 there was an over three-fold increase in the number of church-run schools in Hungary. Most of this change has taken place in the past ten years and at the moment around 23% of secondary school students study in church-run institutions [106]. The fact that Hungarian university students’ rating of this SWB dimension is in stark contrast with earlier international research results, but is in harmony with Hungarian research findings of the past decades, clearly calls for an explanation based on the socio-cultural characteristics of the Hungarian society. While our results cannot facilitate such an explanation, further research into this question might find the causal patterns behind this phenomenon.
Closeness to nature was the second lowest-rated SWB dimension after Belief in God, whereas the environmental pillar at the local level was the highest-rated SD. While connectedness to nature is only weakly correlated (r = 0.18) with the level of SWB [55], several authors argue that sustainability, based on a paradigm change from a consumer lifestyle to an eudemonic type of existence, is only possible if the broken relationship between nature and humans is re-established [107]. Since Rousseau, several thinkers pointed out how our disconnection from nature, or desperate effort to dominate it, that is, the desacralization of nature, is at the root of our sustainability crisis [108]. Taylor writes, “We have lost contact with ourselves, and our own natural being, and are driven by an imperative of domination that condemns us to ceaseless battle against nature both within and around us” [109] (p. 94). Hay [110] also underlines the importance of human-nature relationship when he says, “Without a sacred regard for nature, there are also no moral constraints on our activities—the closest that some in modern society come to these is a feeling of stewardship, still set within an anthropocentric framework” [110] (p. 318). We are deeply convinced that educational policy should encourage and support universities in launching programs that foster the reconnection of the alienated (post) modern subject to nature.
The balanced weighing pattern of SDs on each spatial scale, especially on the local and country levels might be, at least in part, the result of the almost predominant use, in HEIs, of the Venn diagram for the representation of how SDs are related. This representation suggests that the three SDs are not hierarchically related, thus students are cognitively conditioned to view sustainability as a non-hierarchical system of the three SDs. The Venn representation was endorsed by the 2005 UN World Summit and appears in countless publications [111]. However, as Boroń and Kosiek [112] point out, that for strong sustainability no trade-off between the three domains is possible [112]. Certainly, this issue also has some farther reaching policy implications concerning the role of higher education and its dependence on governmental decisions and market circumstances. The Venn diagram depicts a weak form of sustainability which obviously fits better into a governmental policy and curricular paradigm still heavily focused on neoliberal principles.
Through the PLS analysis it became clear how groups of variables relate to each other and other groups of variables. The fact that we can find the three environmental variables, Inner peace and Relations with others in one group (Figure 3) is in harmony with earlier literature establishing links between these dimensions. Caring for nature and caring for others are closely linked attitudes [113]. Nature connectedness and Inner peace or mindfulness as well as Nature connectedness and Social well-being were found to be strong positive correlates in earlier research [54]. In another group, the closeness of local social sustainability and the importance of finding a Good job is obvious, considering the Hungarian socio-economic context. Outmigration of young people from villages and small towns has been happening for decades [114,115]. Additionally, as it was noted earlier, outmigration of young people from the country for work is a serious problem on the national level. Interestingly, students connect their job prospects to social sustainability much more than economic sustainability. The reason behind this might lie in the fact that students are not yet faced with the challenges of the job market and the direct everyday dependence on economic circumstances. It might also explain why Money is not connected with Happiness. In Flynn and MacLeod’s [116] research involving undergraduate students, financial security had little significance in students’ perceived happiness. Similar results were reported by Chan, Miller and Tcha [117], in a sample of Australian university students. The fact that the Health SWB dimension is in the same group as the Economy variables might be attributed to the fact that compared to the average standard of living, Health in Hungary (including preventive steps and receiving medical treatment) is expensive. As health care is free in Hungary, it might sound contradictory, however, as another specifically Hungarian factor, there is a tradition of tipping medical professionals intensively during hospitalization. Arora, Kühlbrandt and McKee [118] found that out of the 13 Central and Eastern European countries, after Croatia and Albania, Hungary showed the highest disparity in unmet healthcare needs, which seems to support the claim that health is expensive and is strongly related with one’s standard of living.
The use of two-block PLS yielded insights that are not possible through typical correlation-based statistical analysis techniques. The finding that students who ranked SDs Environment > Society > Economy (strong sustainability group), tended to rank SWB dimensions, (Relations with others, Inner peace) > (Health, Close to nature) > (Good job, Leisure) might have far-reaching educational policy implications. Strengthening psychological well-being, marked by SWB dimensions such as Relations with others, Inner peace and Closeness to nature in students, could possibly result in shifting the weighing patterns of SDs towards strong sustainability and eudemonic values. In a recent pioneering effort, Wamsler and Brink [119] empirically demonstrated that higher levels of Inner peace (mindfulness) go together with more sustainable behaviour. In a theoretical study, Wamsler et al. [120] call attention to the emerging role of mindfulness in teaching sustainability and this is also underlined by Lengyel et al. [42] in a qualitative study involving Hungarian university students.
Our study has some obvious limitations. Our sampling method was restricted to creating a sample of convenience to explore the examined areas, which entails that our results cannot be generalised. Additionally, the base population consisted only of Hungarian university students, thus not allowing for cross-cultural comparisons. In future research, more diversified and possibly representative samples and longitudinal examination of the changes in students’ SWB and sustainability preferences during the years of their training program or even beyond that, might yield data suitable to look for causal relationships and predictive capabilities. Including various social groups such as local leaders, politicians, typical consumers, low-income groups, and ethnic minorities, to mention only a few, in future research using the framework presented in our paper might yield results with policy relevance on the three examined spatial levels.
We are planning to extend this research including new SWB dimensions such as physical activity and mindfulness. Physical activity done in moderation has a significantly positive effect on SWB. Mindfulness is a fast-emerging construct to be considered as one of the most important dimensions to transform our unsustainable consumer lifestyle to a new one, based on eudemonic values.
Author Contributions
Conceptualization, A.L.; methodology, A.L. and S.K.; formal analysis, A.L. and S.K.; investigation, A.L., É.B.B. and A.M.; data curation, S.K., A.L.; writing—original draft preparation, A.L. and S.K.; writing—review and editing, S.S.; visualization, A.L., S.K. and S.S.; supervision, L.D.; project administration, A.M., S.S.; funding acquisition, É.B.B., L.D.
Funding
The publication is supported by the GINOP-2.3.2-15-2016-00005 project. The project is co-financed by the European Union under the European Regional Development Fund. The funders had no role in the design of the study; in the collection, analyses, or interpretation of data; in the writing of the manuscript, or in the decision to publish the results.
Conflicts of Interest
The authors declare no conflicts of interest.
Appendix A
Survey questions about sustainability dimensions at three spatial levels:
- Taking all possible sustainability efforts at the local level to be at 100%, how would you allocate efforts between the three sustainability dimensions, being environment, society and economy? Move the sliders under the three dimensions to set percentages. The sum has to be 100.
- Environment (slider 0–100)
- Society (slider 0–100)
- Economy (slider 0–100)
- Taking all possible sustainability efforts at the country level to be at 100%, how would you allocate efforts between the three sustainability dimensions, being environment, society and economy? Move the sliders under the three dimensions to set percentages. The sum has to be 100.
- Environment (slider 0–100)
- Society (slider 0–100)
- Economy (slider 0–100)
- Taking all possible sustainability efforts at the global level to be at 100%, how would you allocate efforts between the three sustainability dimensions, being environment, society and economy? Move the sliders under the three dimensions to set percentages. The sum has to be 100.
- Environment (slider 0–100)
- Society (slider 0–100)
- Economy (slider 0–100)
Survey questions about SWB dimensions:
The subjective well-being dimensions below can affect peoples’ sense of happiness. Taking their possible effect on your happiness to be at 100%, how would you weigh their importance? Move the sliders under the nine dimensions to set percentages. The sum has to be 100.
- Relations with others (family, friends, partners, colleagues) (slider 0–100)
- Close to nature (live close to nature and spend as much time as possible in nature) (slider 0–100)
- Inner peace (inner harmony, quiet and calmness) (slider 0–100)
- Belief in God (slider 0–100)
- Health (mental and physical) (slider 0–100)
- Freedom (freedom to do what you want to do) (slider 0–100)
- Money (to do what you want and buy what you want) (slider 0–100)
- Leisure (cinema, concerts, holiday travel etc.) (slider 0–100)
- Good job (work in a good atmosphere, for good money and do what you enjoy) (slider 0–100)
References
- Turner, G.M. A comparison of the limits to growth with 30 years of reality. Glob. Environ. Chang. 2008, 18, 397–411. [Google Scholar] [CrossRef]
- Zovanyi, G. The No-Growth Imperative: Creating Sustainable Communities under Ecological Limits to Growth; Routledge: Abingdon, UK, 2012. [Google Scholar]
- Garnett, M. How will capitalism end? Essays on a failing system. Eur. Leg. 2019, 24, 868–870. [Google Scholar] [CrossRef]
- Kennedy, P. Vampire Capitalism: Fractured Societies and Alternative Futures; Springer: Berlin/Heidelberg, Germany, 2016. [Google Scholar]
- Schweickart, D. Is sustainable capitalism possible? Procedia Soc. Behav. Sci. 2010, 2, 6739–6752. [Google Scholar] [CrossRef]
- Dittmar, H.; Bond, R.; Hurst, M.; Kasser, T. The relationship between materialism and personal well-being: A meta-analysis. J. Pers. Soc. Psychol. 2014, 107, 879–924. [Google Scholar] [CrossRef]
- Kasser, T.; Rosenblum, K.L.; Sameroff, A.J.; Deci, E.L.; Niemiec, C.P.; Ryan, R.M.; Hawks, S. Changes in materialism, changes in psychological well-being: Evidence from three longitudinal studies and an intervention experiment. Motiv. Emot. 2014, 38, 1–22. [Google Scholar] [CrossRef]
- Costanza, R.; Daly, L.; Fioramonti, L.; Giovannini, E.; Kubiszewski, I.; Mortensen, L.F.; Wilkinson, R. Modelling and measuring sustainable wellbeing in connection with the UN sustainable development goals. Ecol. Econ. 2016, 130, 350–355. [Google Scholar] [CrossRef]
- Verhofstadt, E.; Van Ootegem, L.; Defloor, B.; Bleys, B. Linking individuals’ ecological footprint to their subjective well-being. Ecol. Econ. 2016, 127, 80–89. [Google Scholar] [CrossRef]
- Gallagher, M.W.; Lopez, S.J.; Preacher, K.J. The hierarchical structure of well-being. J. Pers. 2009, 77, 1025–1050. [Google Scholar] [CrossRef]
- Davis, J.; Elliott, S. (Eds.) Research in Early Childhood Education for Sustainability: International Perspectives and Provocations; Routledge: Abingdon, UK, 2014. [Google Scholar]
- Jacob, J.; Jovic, E.; Brinkerhoff, M.B. Personal and planetary well-being: Mindfulness meditation, pro-environmental behavior and personal quality of life in a survey from the social justice and ecological sustainability movement. Soc. Indic. Res. 2009, 93, 275–294. [Google Scholar] [CrossRef]
- Steel, P.; Taras, V.; Uggerslev, K.; Bosco, F. The happy culture: A theoretical, meta-Analytic, and empirical review of the relationship between culture and wealth and subjective well-being. Pers. Soc. Psychol. Rev. 2018, 22, 128–169. [Google Scholar] [CrossRef]
- Nixon, E.; Scullion, R.; Hearn, R. Her majesty the student: Marketised higher education and the narcissistic (dis) satisfactions of the student-consumer. Stud. High. Educ. 2018, 43, 927–943. [Google Scholar] [CrossRef]
- Nikolaev, B. Does higher education increase hedonic and eudaimonic happiness? J. Happiness Stud. 2018, 19, 483–504. [Google Scholar] [CrossRef]
- Sheldon, K.M.; Corcoran, M.; Prentice, M. Pursuing eudaimonic functioning versus pursuing hedonic well-being: The first goal succeeds in its aim, whereas the second does not. J. Happiness Stud. 2019, 20, 919–933. [Google Scholar] [CrossRef]
- Braaten, A.; Huta, V.; Tyrany, L.; Thompson, A. Hedonic and eudaimonic motives toward university studies: How they relate to each other and to well-being derived from school. J. Posit. Psychol. Wellbeing 2019, 3, 179–196. [Google Scholar]
- Freire, C.; Ferradás, M.; Núñez, J.; Valle, A.; Vallejo, G. Eudaimonic well-being and coping with stress in university students: The mediating/moderating role of self-efficacy. Int. J. Environ. Res. Public Health 2019, 16, 48. [Google Scholar] [CrossRef]
- Delle Fave, A.; Brdar, I.; Wissing, M.P.; Araujo, U.; Castro Solano, A.; Freire, T.; Nakamura, J. Lay definitions of happiness across nations: The primacy of inner harmony and relational connectedness. Front. Psychol. 2016, 7, 30. [Google Scholar] [CrossRef]
- Wang, J.L.; Jackson, L.A.; Gaskin, J.; Wang, H.Z. The effects of Social Networking Site (SNS) use on college students’ friendship and well-being. Comput. Hum. Behav. 2014, 37, 229–236. [Google Scholar] [CrossRef]
- Harris, K.; English, T.; Harms, P.D.; Gross, J.J.; Jackson, J.J. Why are extraverts more satisfied? Personality, social experiences, and subjective well-being in college. Eur. J. Pers. 2017, 31, 170–186. [Google Scholar] [CrossRef]
- Beutel, A.M.; Marini, M.M. Gender and values. Am. Social. Rev. 1995, 60, 436–448. [Google Scholar] [CrossRef]
- Moors, G. The two faces of (post) materialism: A decomposition approach. Int. J. Public Opin. Res. 2003, 15, 396–412. [Google Scholar] [CrossRef]
- Warner, R.M.; Vroman, K.G. Happiness inducing behaviors in everyday life: An empirical assessment of “the how of happiness”. J. Happiness Stud. 2011, 12, 1063–1082. [Google Scholar] [CrossRef]
- Diener, E.; Tay, L. A scientific review of the remarkable benefits of happiness for successful and healthy living. Happiness 2017, 90. Available online: http://www.bhutanstudies.org.bt/publicationFiles/OccasionalPublications/Transforming%20Happiness/Chapter%206%20A%20Scientific%20Review.pdf (accessed on 22 November 2019).
- Veenhoven, R. Freedom and happiness: A comparative study in forty-four nations in the early 1990s. In Culture and Subjective Wellbeing; MIT Press: Cambridge, MA, USA, 2000; pp. 257–288. [Google Scholar]
- Krueger, A.B.; Stone, A.A. Measuring subjective wellbeing: Progress and challenges. Science 2014, 346, 42. [Google Scholar] [CrossRef] [PubMed]
- Lau, A.L.; Cummins, R.A.; Mcpherson, W. An investigation into the cross-cultural equivalence of the Personal Wellbeing Index. Soc. Indic. Res. 2005, 72, 403–430. [Google Scholar] [CrossRef]
- Jovanović, V.; Cummins, R.A.; Weinberg, M.; Kaliterna, L.; Prizmic-Larsen, Z. Personal Wellbeing Index: A cross-cultural measurement invariance study across four countries. J. Happiness Stud. 2019, 20, 759–775. [Google Scholar] [CrossRef]
- Jeronen, E.; Palmberg, I.; Yli-Panula, E. Teaching methods in biology education and sustainability education including outdoor education for promoting sustainability—A literature review. Educ. Sci. 2017, 7, 1. [Google Scholar] [CrossRef]
- Reese, S.A. Online learning environments in higher education: Connectivism vs. dissociation. Educ. Inf. Technol. 2015, 20, 579–588. [Google Scholar] [CrossRef]
- Jerram, C. Applying adult education principles to an undergraduate subject. In Authentic Learning Environments in Higher Education; IGI Global: Hershey, PA, USA, 2006; pp. 107–119. [Google Scholar]
- Finkbeiner, M.; Schau, E.M.; Lehmann, A.; Traverso, M. Towards life cycle sustainability assessment. Sustainability 2010, 2, 3309–3322. [Google Scholar] [CrossRef]
- Tarne, P.; Lehmann, A.; Finkbeiner, M. Introducing weights to life cycle sustainability assessment—How do decision-makers weight sustainability dimensions? Int. J. Life Cycle Assess. 2018, 24, 530–542. [Google Scholar] [CrossRef]
- Berglund, T.; Gericke, N. Exploring the role of the economy in young adults’ understanding of sustainable development. Sustainability 2018, 10, 2738. [Google Scholar] [CrossRef]
- Hill, L.M.; Wang, D. Integrating sustainability learning outcomes into a university curriculum: A case study of institutional dynamics. Int. J. Sustain. High. Educ. 2018, 19, 699–720. [Google Scholar] [CrossRef]
- Fiselier, E.S.; Longhurst, J.W.; Gough, G.K. Exploring the current position of ESD in UK higher education institutions. Int. J. Sustain. High. Educ. 2018, 19, 393–412. [Google Scholar] [CrossRef]
- Perrault, E.K.; Clark, S.K. Sustainability in the university student’s mind: Are university endorsements, financial support, and programs making a difference? J. Geosci. Educ. 2017, 65, 194–202. [Google Scholar] [CrossRef]
- Kagawa, F. Dissonance in students’ perceptions of sustainable development and sustainability: Implications for curriculum change. Int. J. Sustain. High. Educ. 2007, 8, 317–338. [Google Scholar] [CrossRef]
- Tuncer, G. University students’ perception on sustainable development: A case study from Turkey. Int. Res. Geogr. Environ. Educ. 2008, 17, 212–226. [Google Scholar] [CrossRef]
- Koch, S.; Barkmann, J.; Strack, M.; Sundawati, L.; Bögeholz, S. Knowledge of Indonesian university students on the sustainable management of natural resources. Sustainability 2013, 5, 1443–1460. [Google Scholar] [CrossRef] [Green Version]
- Lengyel, A.; Szőke, S.; Kovács, S.; Dávid, L.D.; Bácsné Bába, É.; Müller, A. Assessing the essential pre-conditions of an authentic sustainability curriculum. Int. J. Sustain. High. Educ. 2019, 20, 309–340. [Google Scholar] [CrossRef]
- Hosseinian-Far, A.; Jahankhani, H. Quantitative and systemic methods for modeling sustainability. Green Inf. Technol. 2015, 83–92. Available online: https://www.sciencedirect.com/science/article/pii/B978012801379300005X?via%3Dihub (accessed on 22 November 2019).
- Perrings, C.; Hannon, B. An introduction to spatial discounting. J. Reg. Sci. 2001, 41, 23–38. [Google Scholar] [CrossRef]
- Baum, S.D.; Easterling, W.E. Space-time discounting in climate change adaptation. Mitig. Adapt. Strategy Glob. Chang. 2010, 15, 591–609. [Google Scholar] [CrossRef]
- Lengyel, A. Spatial Aspects of Sustainability Mindfulness and Tourism. Ph.D. Thesis, Enyedi György Doctoral School of Regional Sciences, Szent István University, Gödöllő, Hungary, 2018. Available online: http://phd.szie.hu/?docId=15965 (accessed on 22 November 2019).
- Webb, D. Subjective wellbeing on the Tibetan plateau: An exploratory investigation. J. Happiness Stud. 2009, 10, 753–768. [Google Scholar] [CrossRef]
- MacKerron, G.; Mourato, S. Happiness is greater in natural environments. Glob. Environ. Chang. 2013, 23, 992–1000. [Google Scholar] [CrossRef] [Green Version]
- Reips, U.D.; Funke, F. Interval-level measurement with visual analogue scales in Internet-based research: VAS Generator. Behav. Res. Methods 2008, 40, 699–704. [Google Scholar] [CrossRef] [PubMed]
- Cummins, R.A. International Wellbeing Group Personal Wellbeing Index, 5th ed.; Australian Centre on Quality of Life, Deakin University: Melbourne, Australia, 2013. [Google Scholar]
- Smallenbroek, O.; Zelenski, J.M.; Whelan, D.C. Authenticity as a eudaimonic construct: The relationships among authenticity, values, and valence. J. Posit. Psychol. 2017, 12, 197–209. [Google Scholar] [CrossRef]
- Newman, D.B.; Tay, L.; Diener, E. Leisure and subjective well-being: A model of psychological mechanisms as mediating factors. J. Happiness Stud. 2014, 15, 555–578. [Google Scholar] [CrossRef]
- Ryff, C.D.; Singer, B.H. Know thyself and become what you are: A eudaimonic approach to psychological well-being. J. Happiness Stud. 2008, 9, 13–39. [Google Scholar] [CrossRef]
- Howell, A.J.; Dopko, R.L.; Passmore, H.A.; Buro, K. Nature connectedness: Associations with well-being and mindfulness. Pers. Individ. Differ. 2011, 51, 166–171. [Google Scholar] [CrossRef]
- Capaldi, C.A.; Dopko, R.L.; Zelenski, J.M. The relationship between nature connectedness and happiness: A meta-analysis. Front. Psychol. 2014, 5, 976. [Google Scholar] [CrossRef] [Green Version]
- Gosling, E.; Williams, K.J. Connectedness to nature, place attachment and conservation behaviour: Testing connectedness theory among farmers. J. Environ. Psychol. 2010, 30, 298–304. [Google Scholar] [CrossRef]
- Parsons, W.B. (Ed.) Being Spiritual but Not Religious: Past, Present, Future (s); Routledge: Abingdon, UK, 2018. [Google Scholar]
- Brenner, P.S. Cross-national trends in religious service attendance. Public Opin. Q. 2016, 80, 563–583. [Google Scholar] [CrossRef] [Green Version]
- Bullivant, S. Europe’s Young Adults and Religion; Benedict XVI Centre for Religion and Society: Paris, France, 2018. [Google Scholar]
- Baji, P.; Brodszky, V.; Rencz, F.; Boncz, I.; Gulácsi, L.; Péntek, M. Health status of the Hungarian population between 2000–2010. Orv. Hetil. 2015, 156, 2035–2044. [Google Scholar] [CrossRef] [PubMed] [Green Version]
- Kaj, M.; Tékus, É.; Juhász, I.; Stomp, K.; Wilhelm, M. Changes in physical fitness of Hungarian college students in the last fifteen years. Acta Biol. Hung. 2015, 66, 270–281. [Google Scholar] [CrossRef] [PubMed] [Green Version]
- Liu, H.; Yu, B. Serious leisure, leisure satisfaction and subjective well-being of Chinese university students. Soc. Indic. Res. 2015, 122, 159–174. [Google Scholar] [CrossRef]
- Ito, E.; Walker, G.J.; Liu, H.; Mitas, O. A cross-cultural/national study of Canadian, Chinese, and Japanese university students’ leisure satisfaction and subjective well-being. Leis. Sci. 2017, 39, 186–204. [Google Scholar] [CrossRef]
- Diener, E.; Oishi, S.; Lucas, R.E. National accounts of subjective well-being. Am. Psychol. 2015, 70, 234. [Google Scholar] [CrossRef] [PubMed]
- LeanCenter Motivációs kutatás 2017 (Motivation Research 2017). Available online: https://www.hrportal.hu/download/motivacios_kutatas.pdf (accessed on 22 November 2019).
- Bowling, N.A.; Eschleman, K.J.; Wang, Q. A meta-analytic examination of the relationship between job satisfaction and subjective well-being. J. Occup. Organ. Psychol. 2010, 83, 915–934. [Google Scholar] [CrossRef] [Green Version]
- Kapteyn, A.; Lee, J.; Tassot, C.; Vonkova, H.; Zamarro, G. Dimensions of subjective well-being. Soc. Indic. Res. 2015, 123, 625–660. [Google Scholar] [CrossRef] [Green Version]
- Sandvik, E.; Diener, E.; Seidlitz, L. Subjective well-being: The convergence and stability of self-report and non-self-report measures. In Assessing Well-Being; Springer: Dordrecht, The Netherlands, 2009; pp. 119–138. [Google Scholar]
- Veenhoven, R. Measures of happiness: Which to choose? In Metrics of Subjective Well-Being: Limits and Improvements; Springer: Cham, Switzerland, 2017; pp. 65–84. [Google Scholar]
- Pagès, J.; Tenenhaus, M. Multiple factor analysis combined with PLS path modelling. Application to the analysis of relationships between physicochemical variables, sensory profiles and hedonic judgements. Chemom. Intell. Lab. Syst. 2001, 58, 261–273. [Google Scholar] [CrossRef]
- Sampson, P.D.; Streissguth, A.P.; Barr, H.M.; Bookstein, F.L. Neurobehavioral effects of prenatal alcohol: Part II. Partial least squares analysis. Neurotoxicol. Teratol. 1989, 11, 477–491. [Google Scholar] [CrossRef]
- Streissguth, A.P.; Bookstein, F.L.; Sampson, P.D.; Barr, H.M. The Enduring Effects of Prenatal Alcohol Exposure on Child Development: Birth through Seven Years, a Partial Least Squares Solution; The University of Michigan Press: Ann Arbor, MI, USA, 1993. [Google Scholar]
- Rohlf, F.J.; Corti, M. Use of two-block partial least squares to study covariation in shape. Syst. Biol. 2000, 49, 740–753. [Google Scholar] [CrossRef] [Green Version]
- The R Development Core Team. A Language and Environment for Statistical Computing; R Foundation for Statistical Computing: Vienna, Austria, 2019. [Google Scholar]
- Lamu, A.N.; Olsen, J.A. The relative importance of health, income and social relations for subjective well-being: An integrative analysis. Soc. Sci. Med. 2016, 152, 176–185. [Google Scholar] [CrossRef] [PubMed] [Green Version]
- Ellison, C.G. Religious involvement and subjective well-being. J. Health Soc. Behav. 1991, 32, 80–99. [Google Scholar] [CrossRef] [PubMed]
- Ngamaba, K.H. Determinants of subjective well-being in representative samples of nations. Eur. J. Public Health 2017, 27, 377–382. [Google Scholar] [CrossRef] [PubMed] [Green Version]
- Colón-Bacó, E. The strength of religious beliefs is important for subjective well-being. Undergrad. Econ. Rev. 2010, 6, 11. [Google Scholar]
- Abdel-Khalek, A.M.; Lester, D. Subjective well-being and religiosity: Significant associations among college students from Egypt and the United Kingdom. Int. J. Cult. Ment. Health 2017, 11, 332–337. [Google Scholar] [CrossRef]
- Székely, L.; Szabó, A. (Eds.) Magyar Ifjúság [Hungarian Youth 2016]; Új Nemzedék Központ: Budapest, Hungary, 2016. [Google Scholar]
- Capaldi, C.A.; Passmore, H.A.; Ishii, R.; Chistopolskaya, K.A.; Vowinckel, J.; Nikolaev, E.L.; Semikin, G.I. Engaging with natural beauty may be related to well-being because it connects people to nature: Evidence from three cultures. Ecopsychology 2017, 9, 199–211. [Google Scholar] [CrossRef]
- Balatsky, G.; Diener, E. Subjective well-being among Russian students. Soc. Indic. Res. 1993, 28, 225–243. [Google Scholar] [CrossRef]
- Brajša-Žganec, A.; Merkaš, M.; Šverko, I. Quality of life and leisure activities: How do leisure activities contribute to subjective well-being? Soc. Indic. Res. 2011, 102, 81–91. [Google Scholar] [CrossRef]
- Wiek, A.; Withycombe, L.; Redman, C.L. Key competencies in sustainability: A reference framework for academic program development. Sustain. Sci. 2011, 6, 203–218. [Google Scholar] [CrossRef] [Green Version]
- Van Poeck, K.; Læssøe, J.; Block, T. An exploration of sustainability change agents as facilitators of nonformal learning: Mapping a moving and intertwined landscape. Ecol. Soc. 2017, 22, 33. [Google Scholar] [CrossRef] [Green Version]
- Borg, C.; Gericke, N.; Höglund, H.; Bergman, E. Subject- and experience-bound differences in teachers’ conceptual understanding of sustainable development. Environ. Educ. Res. 2014, 20, 526–551. [Google Scholar] [CrossRef]
- Cebrián, G.; Junyent, M. Competencies in education for sustainable development: Exploring the student teachers’ views. Sustainability 2015, 7, 2768–2786. [Google Scholar] [CrossRef] [Green Version]
- Keseru, I.; Bulckaen, J.; Macharis, C.; de Kruijf, J. Sustainable consensus? The NISTO evaluation framework to appraise sustainability and stakeholder preferences for mobility projects. Transp. Res. Procedia 2016, 14, 906–915. [Google Scholar] [CrossRef] [Green Version]
- Gifford, R.; Scannell, L.; Kormos, C.; Smolova, L.; Biel, A.; Boncu, S.; Kaiser, F.G. Temporal pessimism and spatial optimism in environmental assessments: An 18-nation study. J. Environ. Psychol. 2009, 29, 1–12. [Google Scholar] [CrossRef] [Green Version]
- Lengyel, A. A fenntarthatósági kritériumok térbeli diszkontálása. (Spatial discounting of sustainability criteria). Területi Statisztika 2017, 57, 183–204. [Google Scholar]
- Baum, S.D. Discounting Across Space and Time in Climate Change Assessment. Ph.D. Thesis, The Graduate School College of Earth and Mineral Science, The Pennsylvania State University, Centre County, PA, USA, 2010. [Google Scholar]
- Pearce, D.; Groom, B.; Hepburn, C.; Koundouri, P. Valuing the future. World Econ. 2003, 4, 121–141. [Google Scholar]
- Eurostat EU Citizens in Other EU Member States. 2018. Available online: http://ec.europa.eu/eurostat/documents/2995521/8926076/3-28052018-AP-EN.pdf/48c473e8-c2c1-4942-b2a4-5761edacda37 (accessed on 22 November 2019).
- Evans, D.J.; Sezer, H. Social discount rates for member countries of the European Union. J. Econ. Stud. 2005, 32, 47–59. [Google Scholar] [CrossRef]
- Jones, B.; Rachlin, H. Social discounting. Psychol. Sci. 2006, 17, 283–286. [Google Scholar] [CrossRef]
- Negi, A.S.; Khanna, A.; Aggarwal, R. Spirituality as predictor of depression, anxiety and stress among engineering students. J. Public Health 2019, 1–14. Available online: https://link.springer.com/article/10.1007/s10389-019-01092-2 (accessed on 22 November 2019).
- Checa, I.; Perales, J.; Espejo, B. Measurement invariance of the Satisfaction with Life Scale by gender, age, marital status and educational level. Qual. Life Res. 2019, 28, 963–968. [Google Scholar] [CrossRef]
- Dolan, P.; Peasgood, T.; White, M. Do we really know what makes us happy? A review of the economic literature on the factors associated with subjective well-being. J. Econ. Psychol. 2008, 29, 94–122. [Google Scholar] [CrossRef]
- Dlouhá, J.; Vintar Mally, K.; Dlouhý, J. ESD principles in higher education from a perspective of Central and Eastern European countries. Int. J. Sustain. High. Educ. 2017, 18, 822–840. [Google Scholar] [CrossRef]
- Schaffhauser-Linzatti, M.M.; Ossmann, S.F. Sustainability in higher education’s annual reports: An empirical study on Australian and Austrian universities. Int. J. Sustain. High. Educ. 2018, 19, 233–248. [Google Scholar] [CrossRef]
- Prado, A.; Arce, R.; Lopez, L.E.; García, J.; Pearson, A.A. Simulations versus case studies: Effectively teaching the premises of sustainable development in the classroom. J. Bus. Ethics 2019, 1–25. Available online: https://link.springer.com/article/10.1007/s10551-019-04217-5 (accessed on 22 November 2019).
- Bastianoni, S.; Coscieme, L.; Caro, D.; Marchettini, N.; Pulselli, F.M. The needs of sustainability: The overarching contribution of systems approach. Ecol. Indic. 2019, 100, 69–73. [Google Scholar] [CrossRef]
- Diener, E.; Biswas-Diener, R. Will money increase subjective well-being? Soc. Indic. Res. 2002, 57, 119–169. [Google Scholar] [CrossRef]
- Kopp, M.S.; Csoboth, C.T.; Réthelyi, J. Psychosocial determinants of premature health deterioration in a changing society: The case of Hungary. J. Health Psychol. 2004, 9, 99–109. [Google Scholar] [CrossRef]
- Barth, A.; Nagy, I.; Kiss, J. Comparison the psychological wellbeing of university students from Hungary and Romania. Pract. Theory Syst. Educ. 2015, 10, 186–193. [Google Scholar] [CrossRef] [Green Version]
- Varga, J.; Hajdu, T.; Hermann, Z.; Horn, D. A közoktatás indikátorrendszere. In Indicators of the Hungarian Education System; Hungarian Academy of Science: Budapest, Hungary, 2017. [Google Scholar]
- Yang, Y.; Hu, J.; Jing, F.; Nguyen, B. From awe to ecological behavior: The mediating role of connectedness to nature. Sustainability 2018, 10, 2477. [Google Scholar] [CrossRef] [Green Version]
- White, L. The historical roots of our ecologic crisis. Science 1967, 155, 1203–1207. [Google Scholar] [CrossRef] [Green Version]
- Taylor, C. The Ethics of Authenticity; Harvard University Press: Cambridge, MA, USA, 1992. [Google Scholar]
- Hay, R. Becoming ecosynchronous, part 1. The root causes of our unsustainable way of life. Sustain. Dev. 2005, 13, 311–325. [Google Scholar] [CrossRef]
- Caradonna, J.L. Sustainability: A History; Oxford University Press: Oxford, UK, 2014. [Google Scholar]
- Boroń, S.; Kosiek, T. Total sustainability management. describing the conditions, requirements and application of sustainability management. Manag. Syst. Prod. Eng. 2019, 27, 110–118. [Google Scholar] [CrossRef] [Green Version]
- Schultz, P.W. Inclusion with nature: The psychology of human-nature relations. In Psychology of Sustainable Development; Springer: Boston, MA, USA, 2002; pp. 61–78. [Google Scholar]
- Makkai, B.; Máté, É.; Pirisi, G.; Trócsányi, A. Where have all the youngsters gone? The background and consequences of young adults’ outmigration from Hungarian small towns. Eur. Countrys. 2017, 9, 789–807. [Google Scholar] [CrossRef] [Green Version]
- Ritter, K. Special features and problems of rural society in Hungary. Stud. Mundi Econ. 2018, 5, 98–112. [Google Scholar] [CrossRef]
- Flynn, D.M.; MacLeod, S. Determinants of happiness in undergraduate university students. Coll. Stud. J. 2015, 49, 452–460. [Google Scholar]
- Chan, G.; Miller, P.W.; Tcha, M. Happiness in university education. Int. Rev. Econ. Educ. 2005, 4, 20–45. [Google Scholar] [CrossRef]
- Arora, V.S.; Kühlbrandt, C.; McKee, M. An examination of unmet health needs as perceived by Roma in Central and Eastern Europe. Eur. J. Public Health 2016, 26, 737–742. [Google Scholar] [CrossRef]
- Wamsler, C.; Brink, E. Mindsets for sustainability: Exploring the link between mindfulness and sustainable climate adaptation. Ecol. Econ. 2018, 151, 55–61. [Google Scholar] [CrossRef]
- Wamsler, C.; Brossmann, J.; Hendersson, H.; Kristjansdottir, R.; McDonald, C.; Scarampi, P. Mindfulness in sustainability science, practice, and teaching. Sustain. Sci. 2018, 13, 143–162. [Google Scholar] [CrossRef] [Green Version]
Figure 1.
Ranking of Subjective Well-being (SWB) dimensions. Source: Authors’ compilation based on questionnaire results.
Figure 1.
Ranking of Subjective Well-being (SWB) dimensions. Source: Authors’ compilation based on questionnaire results.

Figure 2.
Relative weight of sustainability dimensions on three spatial scales. Source: Authors’ compilation based on questionnaire results.
Figure 2.
Relative weight of sustainability dimensions on three spatial scales. Source: Authors’ compilation based on questionnaire results.

Figure 3.
2-block PLS (Partial Least Squares) model of the variables. Source: Authors’ compilation based on questionnaire results (Lo = local, Co = country, Gl = global).
Figure 3.
2-block PLS (Partial Least Squares) model of the variables. Source: Authors’ compilation based on questionnaire results (Lo = local, Co = country, Gl = global).


Table 1.
Demographic data of the sample.
| Gender (%) | Educational Level (%) | ||||||
|---|---|---|---|---|---|---|---|
| Male | Female | Secondary Technical School | Secondary Grammar School | Higher Level Vocational | Bachelor Degree | Master’s Degree | PhD |
| 43.2 | 56.8 | 23.9 | 39.9 | 11.3 | 17.2 | 6.3 | 0.2 |
Source: Authors’ compilation.
© 2019 by the authors. Licensee MDPI, Basel, Switzerland. This article is an open access article distributed under the terms and conditions of the Creative Commons Attribution (CC BY) license (http://creativecommons.org/licenses/by/4.0/).
Share and Cite
MDPI and ACS Style
Lengyel, A.; Kovács, S.; Müller, A.; Dávid, L.; Szőke, S.; Bácsné Bába, É. Sustainability and Subjective Well-Being: How Students Weigh Dimensions. Sustainability 2019, 11, 6627. https://doi.org/10.3390/su11236627
AMA Style
Lengyel A, Kovács S, Müller A, Dávid L, Szőke S, Bácsné Bába É. Sustainability and Subjective Well-Being: How Students Weigh Dimensions. Sustainability. 2019; 11(23):6627. https://doi.org/10.3390/su11236627
Chicago/Turabian StyleLengyel, Attila, Sándor Kovács, Anetta Müller, Lóránt Dávid, Szilvia Szőke, and Éva Bácsné Bába. 2019. "Sustainability and Subjective Well-Being: How Students Weigh Dimensions" Sustainability 11, no. 23: 6627. https://doi.org/10.3390/su11236627
Note that from the first issue of 2016, this journal uses article numbers instead of page numbers. See further details here.