Influence Area of Transit-Oriented Development for Individual Delhi Metro Stations Considering Multimodal Accessibility


1
Department of Civil Engineering, Nagoya University, Nagoya 464-8603, Japan
2
Institutes of Innovation for Future Society, Nagoya University, Nagoya 464-8603, Japan
3
Institute of Materials and Systems for Sustainability, Nagoya University, Nagoya 464-8603, Japan
*
Authors to whom correspondence should be addressed.
Sustainability 2019, 11(16), 4295; https://doi.org/10.3390/su11164295
Submission received: 5 July 2019
/
Revised: 30 July 2019
/
Accepted: 5 August 2019
/
Published: 8 August 2019
(This article belongs to the Special Issue Sustainable Transportation for Sustainable Cities)
Abstract
:Understanding the influence areas for transit stations in Indian cities is a prerequisite for adopting transit-oriented development (TOD). This study provides insights into the last mile patterns for selected Delhi Metro Rail (DMR) stations, specifically, Karkardooma, Dwarka Mor, Lajpat Nagar, and Vaishali, and the extent of the influence area based on different access modes. The variation in the extent of the influence areas based on various modes and the locational characteristics of stations have been considered in this study. The last mile distances reported in the conducted survey involved the problems of rounding and heaping, and they were subjected to multiple imputation to remove the bias. The spatial extent of the influence areas for various modes was estimated based on the compound power exponential distance decay function. Further, the threshold walking distances were calculated using the receiver operating characteristic (ROC) curves. The variations were noted in the last mile distances among stations. The walking distances (mean and 85th percentile) among stations did not vary considerably; however, large variations were noted when comparing other modes. These differences in accessibility must be taken into account when considering multimodal accessibility and multimode-based TOD. The study can provide useful inputs for planning and implementing TOD in New Delhi.
1. Introduction
The influence areas are a critical part of transit-oriented development (TOD), as this is the area around the station where the TOD principles are applied, including high densities, mixed land-uses, mixed income housing and improved infrastructure for non-motorized transport. Andersen and Landex [1] define the influence area of public transit as a “vicinity of a stop or station of a public transport line” and the “area is where most of the non-transferring passengers at the particular stop or station come from”. The influence area of a transit station, therefore is an area around a transit which serves as the customer base for transit services. It is also the area that receives the maximum benefits of transit. Often these influence areas are based on the distances people are willing to travel to transit in a specified time. These specifications are further based on the various travel modes that are used for last-mile connectivity, often by walking. In the literature, this area has been specified based on access distance, which directly provides the geographic extent of the TOD. A distance of 2000 ft (600 m) was introduced by Calthorpe [2,3]. Untermann [4] and Dittamar and Ohland [5] determined the distance as 1/2 mi (800 m). These aforementioned distances have been specified based on the walking distance that people prefer to transit [6,7,8]. To determine the extent of the TOD influence areas, some literature refers to a single distance, whereas it is reported that others use a distance range as a basis. Guerra et al. [8] and Flamm and Rivasplata [9] emphasized that in the U.S, the radius of influence area can vary between 1/4 and 1/2 mi (400–800 m). Consequently, various cities have adopted different radii for TOD. Guerra et al. [8] raised doubts about the feasibility of adopting 1/2 mi (800 m) as the de facto standard for TOD in the United States as it is “more an artifact of historical precedent than a statistical or analytical construct”.
In the National TOD Policy of India, the influence area of TOD has been set between 500 m to 800 m [10]. The capital city of New Delhi is among the pioneers in the country to adopt TOD into its city planning. The Unified Traffic and Transportation Infrastructure (Planning & Engineering) Centre (UTTIPEC) suggested that the influence zones in New Delhi be classified into an intense zone with a radius of 300 m, a standard TOD zone with a radius of 800 m (which corresponds to a 10-min walk), and a TOD transition zone with a radius of 2000 m (which corresponds to a 10-min cycle ride) [11]. In the Delhi Master Plan 2021, which lays out the specifications for city planning for the coming years, the city authorities have adopted a TOD influence zone of 500 m on both sides of the mass rapid transit system (MRTS) corridor and the Delhi Metro Rail (DMR).
The currently adopted standards are heavily influenced by the TOD standards adopted in developed countries. Quite often, the distances that are used range between approximately 400 m to 800 m considering walking as the last mile mode [3,4,5,6,7,8,9]. It has been noted that the influence areas for transit vary depending on the type of access mode, the type of main mode, the trip purpose, and the area type [12]. Walking is undoubtedly the most popular access mode worldwide and has been widely studied by several researchers. In addition, in many cities in developed countries, bicycles are popular as access modes, with many transit agencies allowing bicycles to be taken aboard. The access distances for cyclists have been noted to have a large range (from 1.96 to 4.8 km), varying among studies and cities [9,13,14]. Lee et al. [14] explored the possibility of introducing a bicycle-based TOD in Seoul, Korea, which could enable the coverage of 74–94% of the area, as compared to the coverage of 30% by walk-only catchment areas. The catchment ranges of feeder buses and cars (kiss and ride) were estimated in the range of 1.24–3.73 miles (approx. 2000–6000 m) and 0.62–4.35 miles (approx. 1000–7000 m) respectively [15], increasing the influence area of transit services to a larger extent. Therefore, a walk-based TOD is not always necessary; however, it should include other modes of last mile connectivity. The influence of modes other than walking on the catchment areas of transit stations thus, must be thoroughly investigated.
Johar et al. [16] studied the distances walked by commuters from bus stops to various destinations in New Delhi and found that the mean walking distances (based on lognormal distribution) were 677, 660, 654, and 637 m for shopping, recreation, education, and work trips, respectively. The research shows that commuters walk longer distances to access rail transit than reaching the bus transit [17,18,19]. Therefore, it can be assumed that commuters walk longer distances to reach metro stations in Delhi. Additionally, in Indian cities, modes such as cycle rickshaws, auto rickshaws, mini vans (commonly known as gramin seva in New Delhi) and other forms of informal transport are commonly used for last mile connectivity. Considering the multimodal nature of last mile connectivity in New Delhi, Ann et al. [20] estimated the influence zones for DMR stations in New Delhi. In the study, the mean values of the distance for access were estimated to be 700 m for walking, 2900 m for informal transit, 6300 m for buses and private transport. Moreover, using the distance decay function, the 85th percentile distances for access were estimated to be 1400 m for walking, 5600 m for informal transit, 11900 m for private transport and buses. Zhao et al. [21], El-Geneidy et al. [22] and Hochmair [23] have also used the 85th percentile value to establish the catchment areas around transit stations for modes such as walking and cycling. In addition, Ann et al. [20] found that the threshold distance for access was 1200 m for walking, which is close to the 80-85th percentile values from the decay analysis. These results are considerably different from those in India’s national TOD policy, which specifies the extent of the influence area for walking to be 500–800 m. According to this, the TOD development and associated higher densities and infrastructure will be concentrated within this 500–800 m, limiting the planned development to a limited area without much justification. Moreover, according to the estimated decay curves, the influence area with 500–800 m can only cover 50%–65% of the current transit passengers who walk to stations [20], excluding the rest from the spatial extent of TOD. Hence, in order to capture the benefits of TOD and extend it to real users of the transit system, the guidelines set for the size of the influence areas and for the extent of influence areas based on ground reality need to be reconsidered. This aspect highlights the need to examine TOD principles and standards based on the mobility characteristics of Indian cities. It has already been shown that commuters to the DMR system in New Delhi, travel much longer distances than 500–800 m. The difference in the last mile connectivity patterns in Indian cities, and cities of the developed world can impact the spatial extent of the TOD influence areas. The multimodal accessibility, if not accounted for in TOD planning, may lead to the exclusion of a certain amount of existing transit users. A brownfield development in such conditions may not be cost effective in developing countries and could also possibly displace several low-income households that may not be able to afford to live in the new developments.
The larger size of the influence areas estimated by Ann et al. [20] as compared to the size specified in the national TOD policy can help planners and policy makers identify and plan for the real catchment areas of DMR in New Delhi. They need not restrict the development plans for only 500–800 m around stations. Additionally, it can help transit agencies to identify catchment areas and to estimate demand. However, Ann et al. [20] estimated the influence area with all DMR stations together. They have not considered the station specific characteristics. The locational differences between stations may cause different accessibility patters and traveling preference. Therefore, whether the extent of the influence area differs for individual stations is an aspect worth investigating.
This study focuses on estimating the influence areas for various last mile modes for the individual metro stations in New Delhi. Four stations were chosen from the DMR network: Karkardooma, which is a city station and interchange and urban regional center station; Dwarka Mor, which is a subcity residential area station; Lajpat Nagar, which is an interchange and market station in a central city environment; and Vaishali, which is an outer city station. A questionnaire survey was conducted at these stations to collect information regarding last mile mobility patterns of metro commuters. The methodology for estimation of the sizes of the influence areas was drawn from Ann et al. [20]. The reported distance data from the surveys revealed considerable heaping and rounding. Thus, the multiple imputation (MI) derived from the work of Heitjan and Rubin [24], Drechsler and Kiesl [25] and Yamamoto et al. [26] was applied to remove the rounding bias before employing the distance decay and receiver operating characteristic (ROC) curves.
The remaining paper is organized as follows: Section 2 describes the data collection process, and the estimation of the influence areas for the different modes, along with the distance decay analysis and ROC analysis, is described in Section 3. Section 4 summarizes the study and presents the derived conclusions.
2. Data Collection
2.1. Study Area and Data
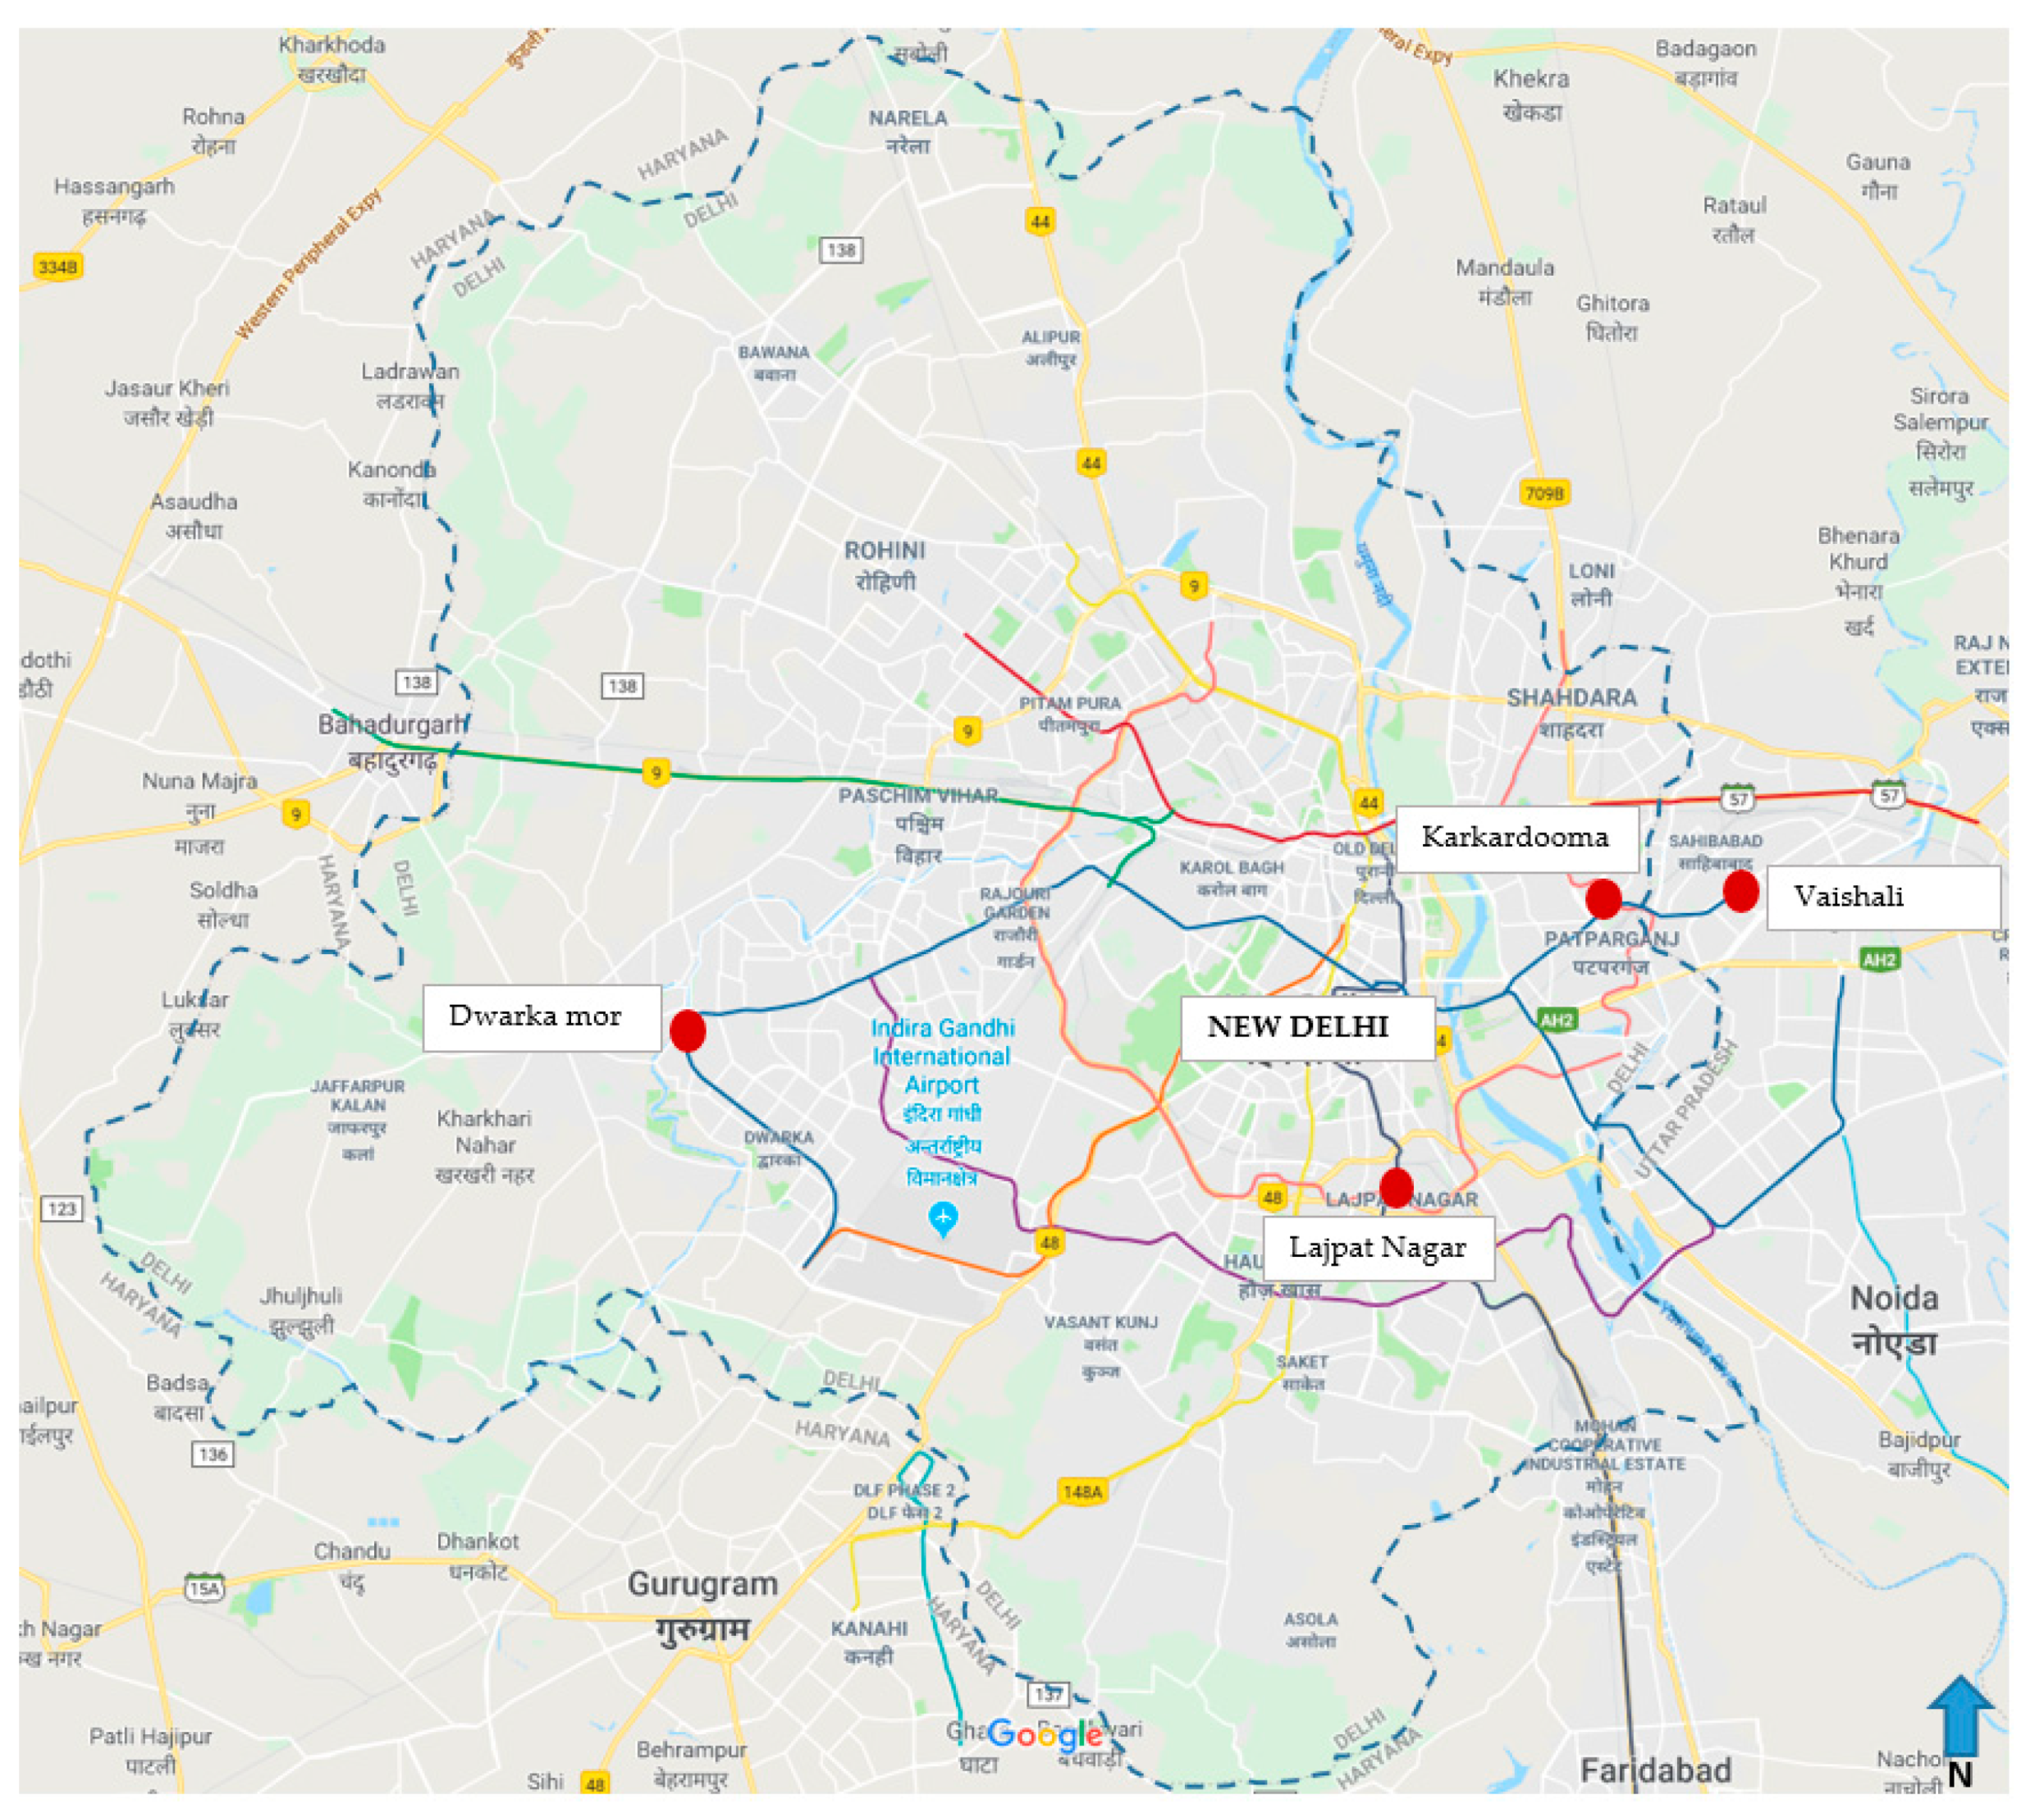
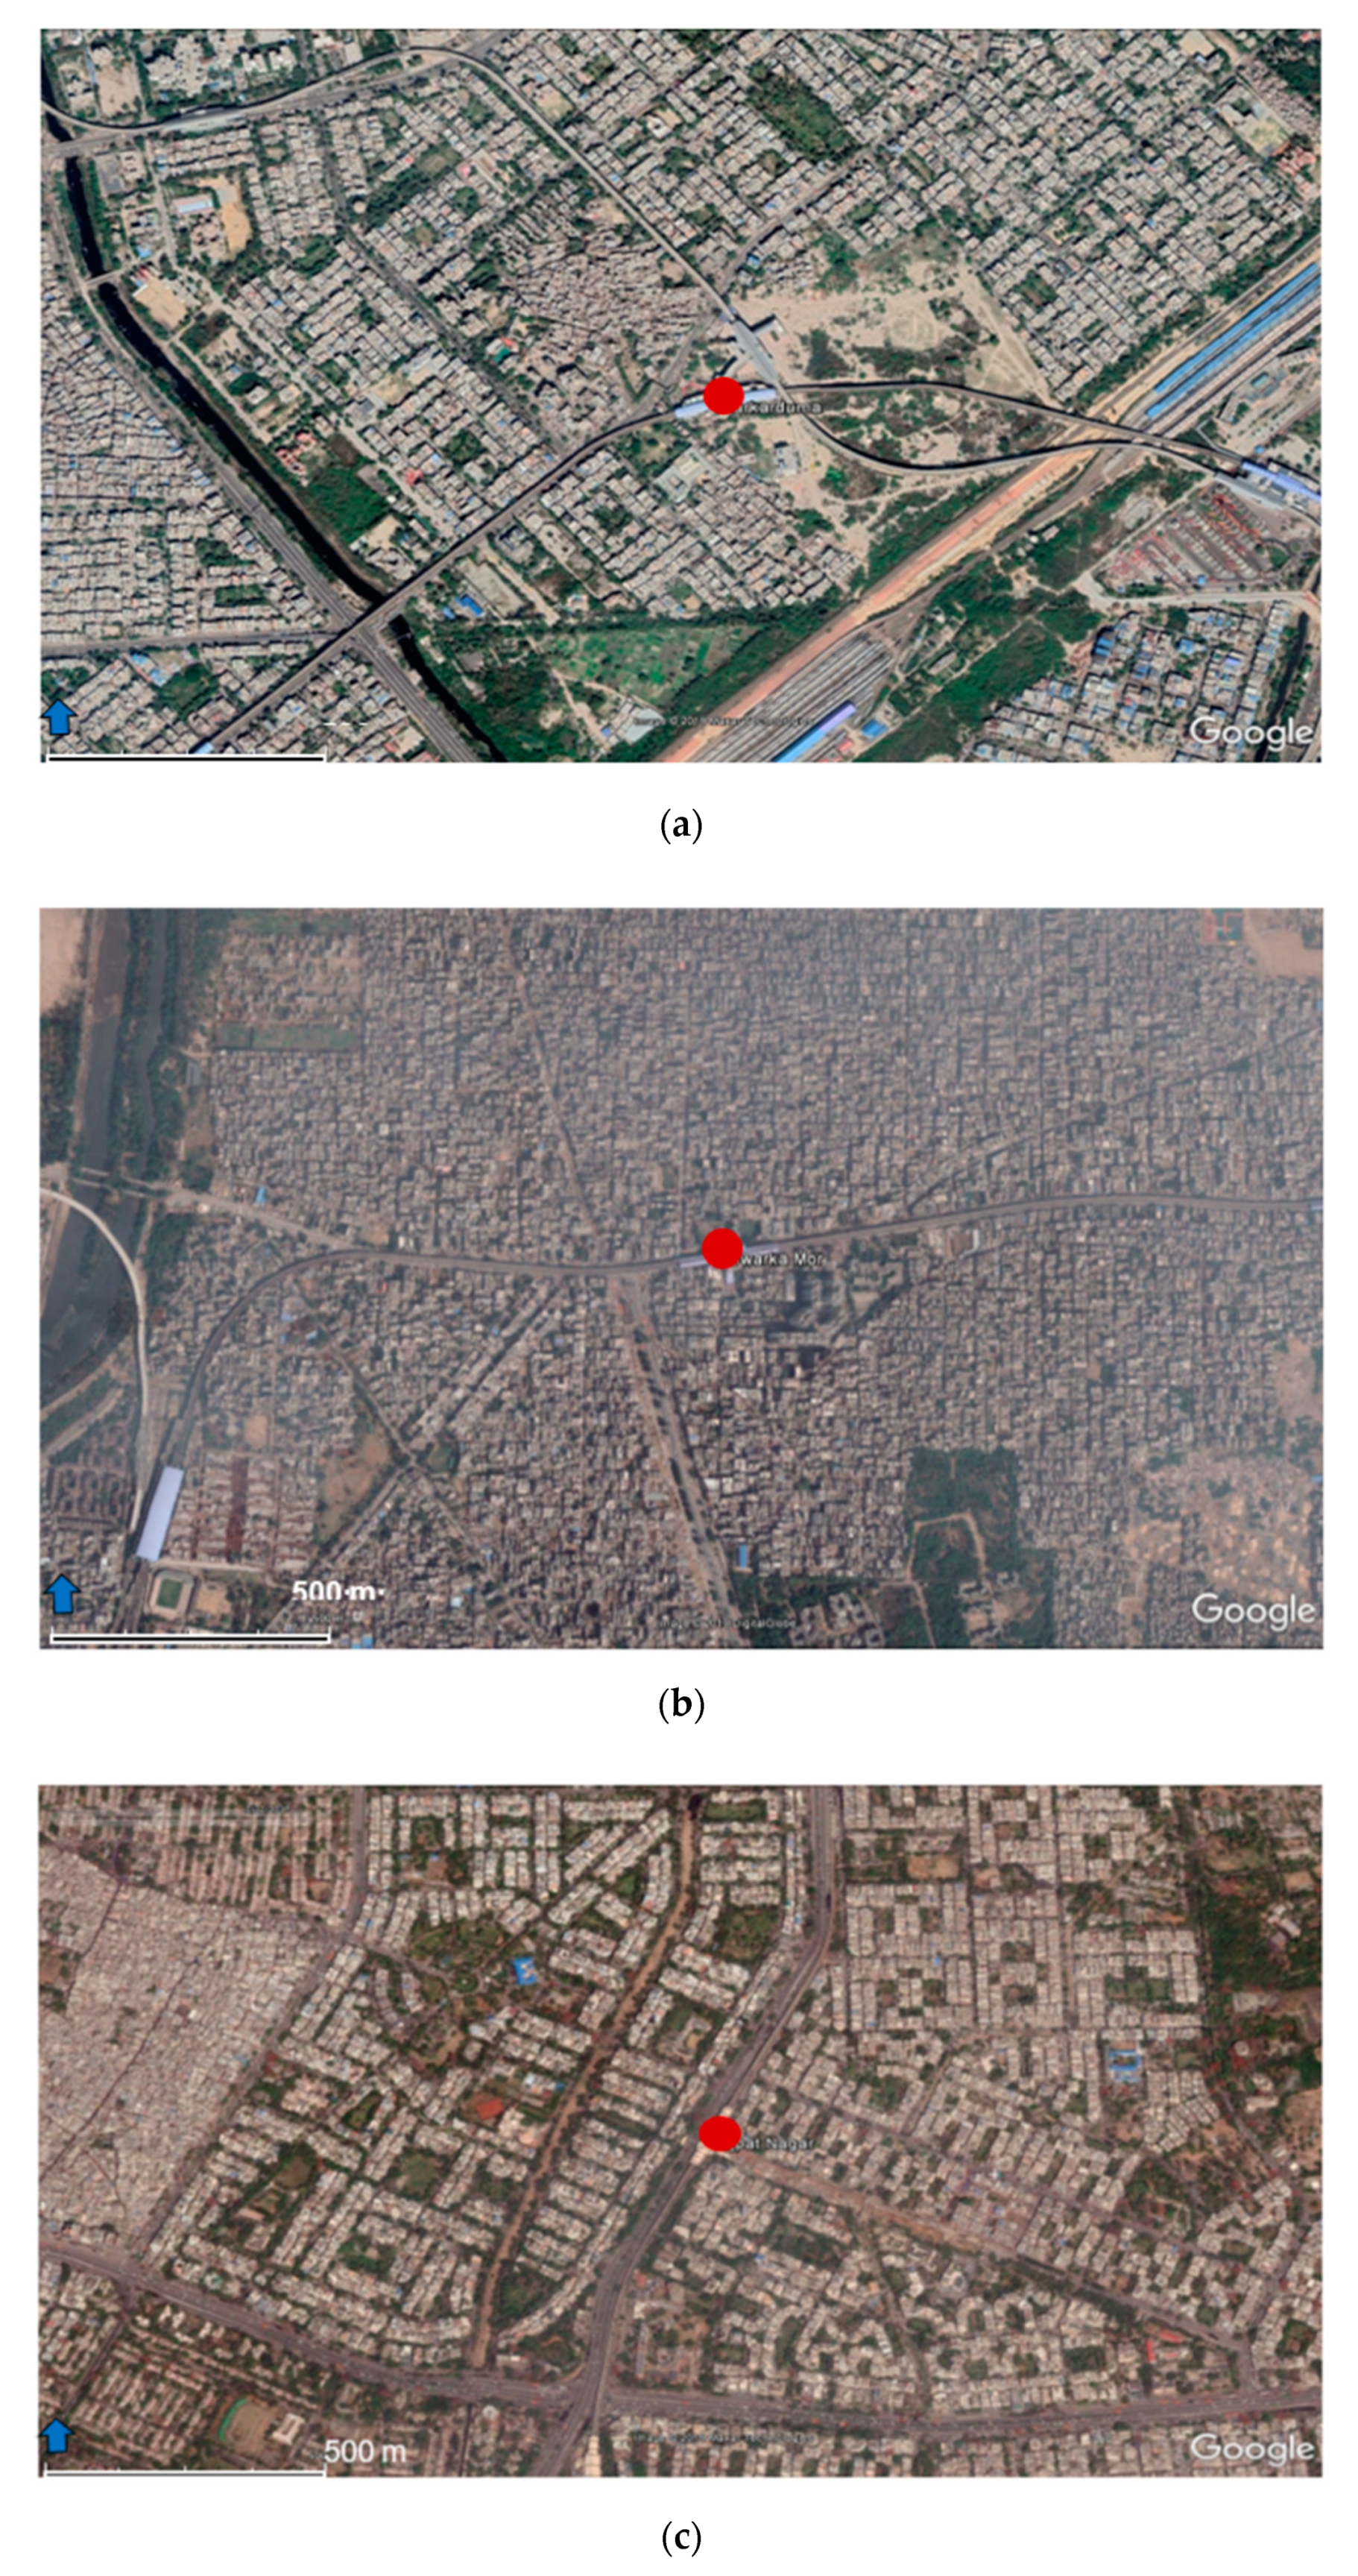
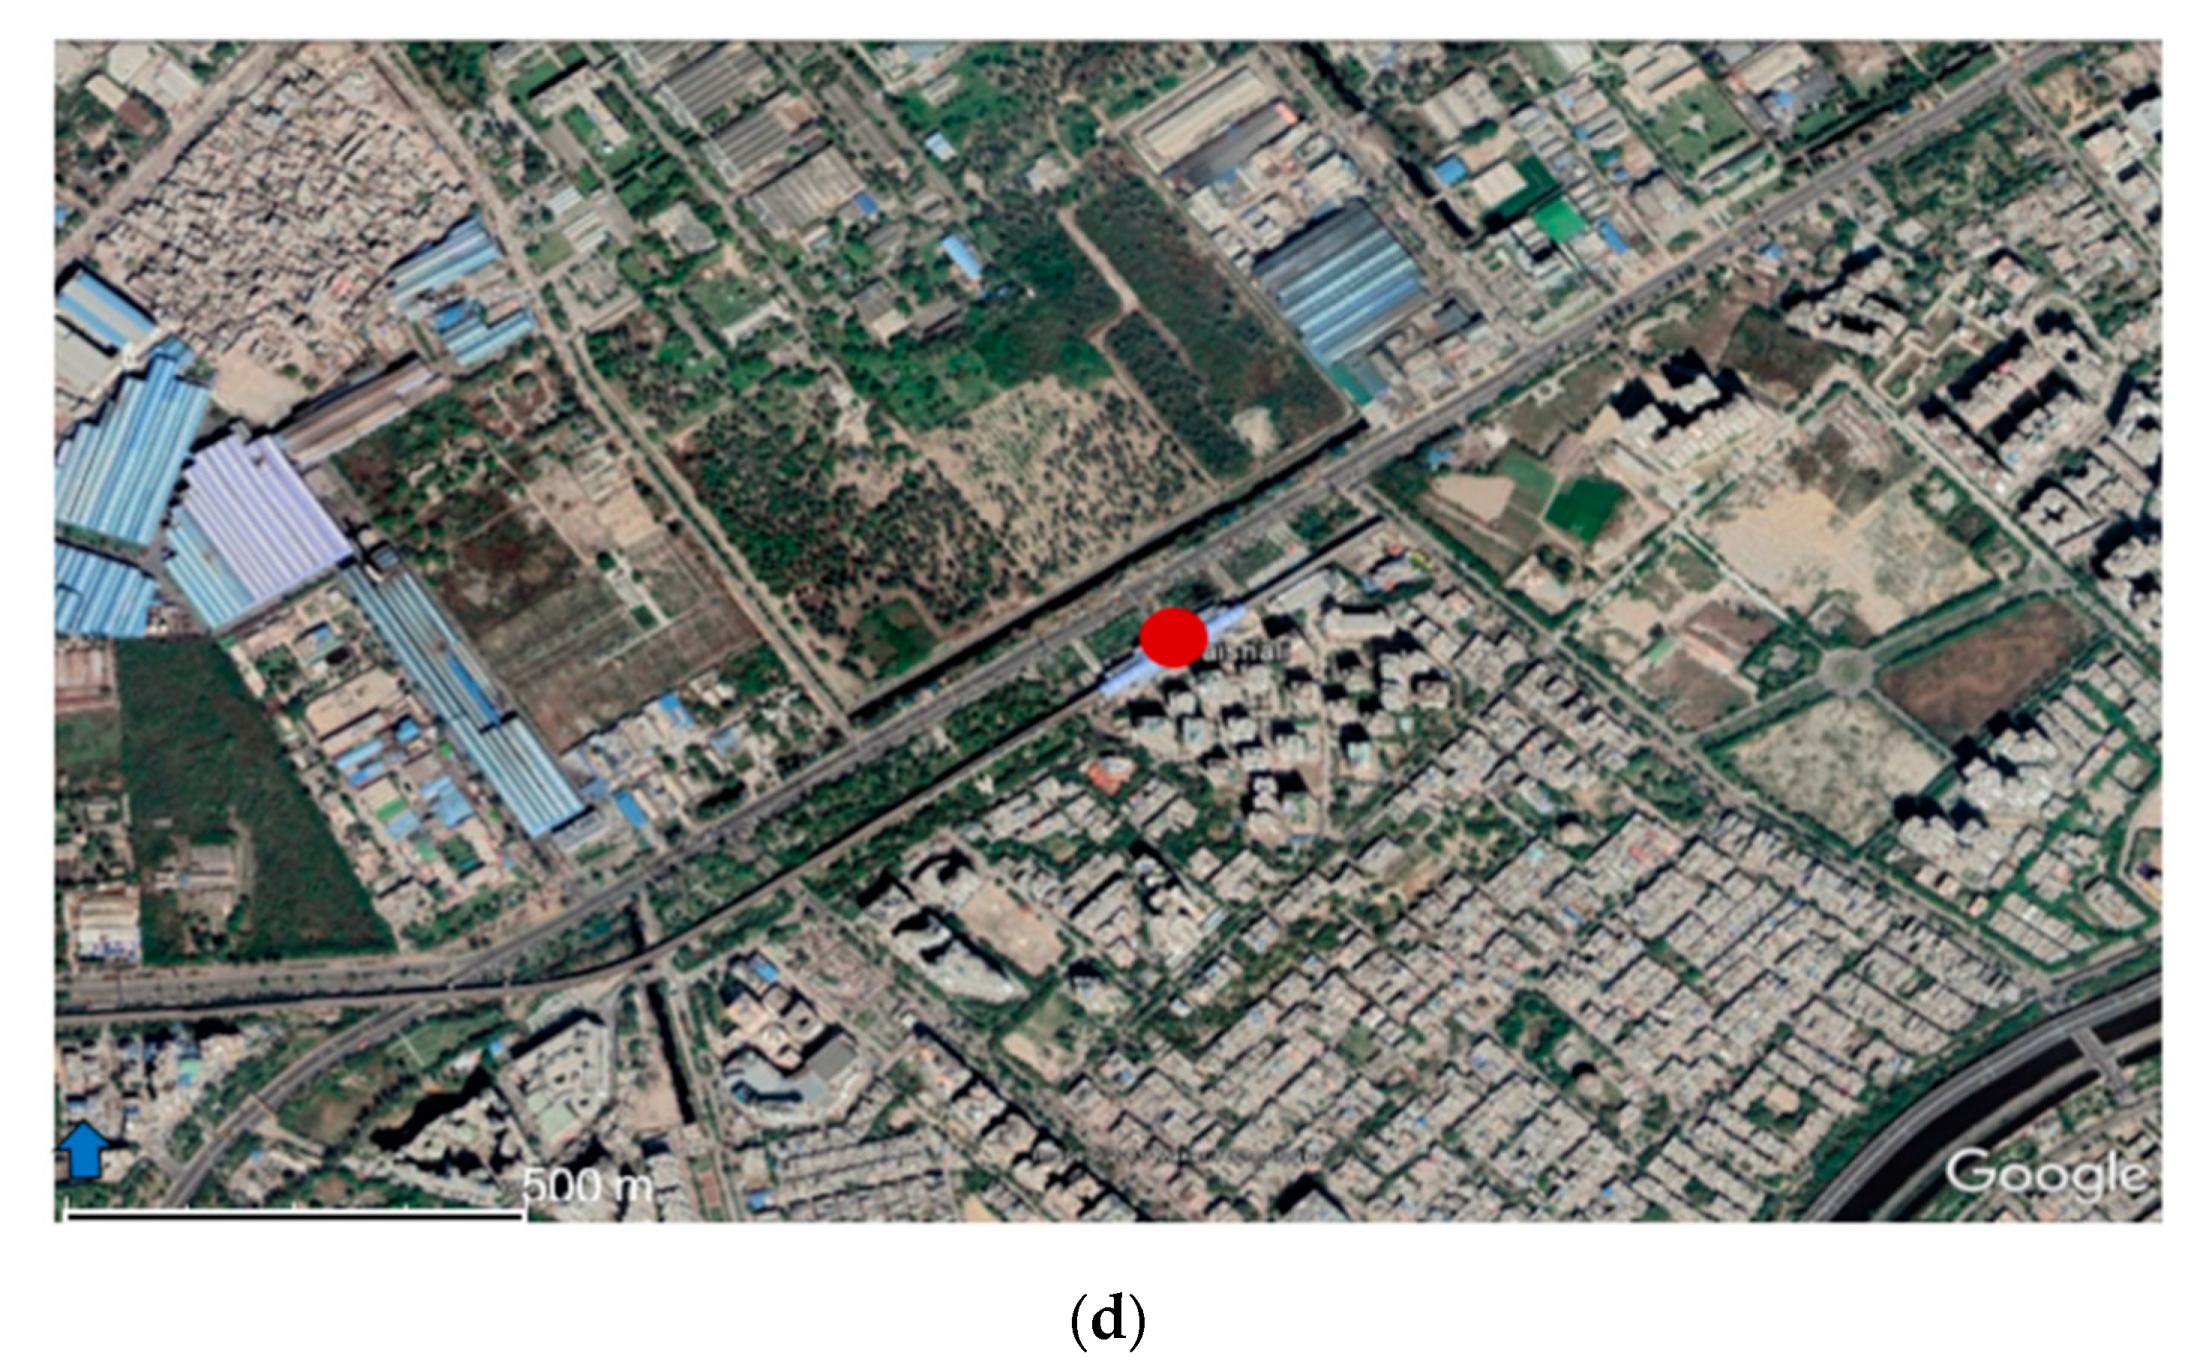
It is considered essential to understand the variation of the last mile distance patterns across the different types of stations. Therefore, a survey was planned and executed for specific DMR stations. The survey was carried out for four existing DMR stations of the DMR network in New Delhi, India, namely, Karkardooma, Dwarka Mor, Lajpat Nagar, and Vaishali. The modeling is not targeted to assess prospective locations for transit stations but rather understand the influence areas for the four existing DMR stations to help in planning for brownfield development for TOD around these stations. The Karkardooma and Dwarka Mor stations were selected to be developed by the city authorities in consideration of TOD. Karkardooma is a part of a TOD project of Delhi Development Authority (DDA), and has been planned for development with over 30 hectares of residential and commercial centers. In addition, Karkardooma is an interchange station and a place of commercial importance in East Delhi. The station has been developed as a complex in a mixed land use area and has a parking facility for private modes (privately owned cars and two-wheelers). The DDA has selected Dwarka to be developed into a smart subcity in the South-West region of New Delhi, with commercial, residential, and entertainment facilities being established according to TOD norms. The area is sought after for residential purposes and has medium to high density. There are also some institutions and government offices around the station. The Lajpat Nagar station area represents a mixed land use, mixed income, highly dense area located in New Delhi, and falls on the interchange of the Violet and Pink lines of the DMR network. One of the major markets in the city lies in close proximity to the station, and the area is of considerable commercial and residential importance. Vaishali is an end station on the Red Line. The station is located in the suburbs with highly dense and mixed-income housing. Although this region is outside New Delhi, it belongs to the National Capital Region (NCR) of Delhi. Mixed land use is predominant around the station area. The modeling is not targeted to assess prospective locations for transit stations but rather understand the influence areas for the four existing DMR stations to help in planning for a brownfield development for TOD around these stations. The locations of these stations are shown in Figure 1 on a map of New Delhi and aerial shots of the station and its surrounding area are shown in Figure 2.
The purpose of the survey was to collect data pertaining to the last mile connectivity of commuters at the selected stations and to estimate the distances travelled by commuters to access these stations. The survey contained questions concerning access and egress travel patterns of DMR passengers, such as the trip purposes, the travel modes, the travel distances, and the time. The passengers’ attributes, such as gender, age, and income, were also included. The preferred mode for covering the last mile distance, and the various alternatives available to the commuters were also determined. Furthermore, additional information pertaining to the passengers’ willingness to travel and the motives behind choosing a particular mode was collected.
The distances collected from surveys often suffer from rounding and heaping, leading to biased results. To increase the accuracy of the distance data reported by the respondents in the survey, spatial data was initially planned to be obtained by plotting the origin/destination points of the commuters on a map. However, this idea was dismissed because during the pilot survey, the respondents were reluctant to provide this information, which they deemed to be sensitive and personal. In addition, during the survey, low participation of female commuters was noticed, as they appeared to be uncomfortable interacting with the surveyors, likely because they did not wish to talk to strangers. The survey was conducted at the platform when the commuters were waiting for the train. The commuters deboarding the train were always in a hurry to exit the station, and it was difficult to engage them in the survey. A total of 1061 respondents were interviewed during the survey across the four stations (Karkardooma: 267, Dwarka Mor: 250, Lajpat Nagar: 286, Vaishali: 258). The responses for access and egress were then combined according to the stations.
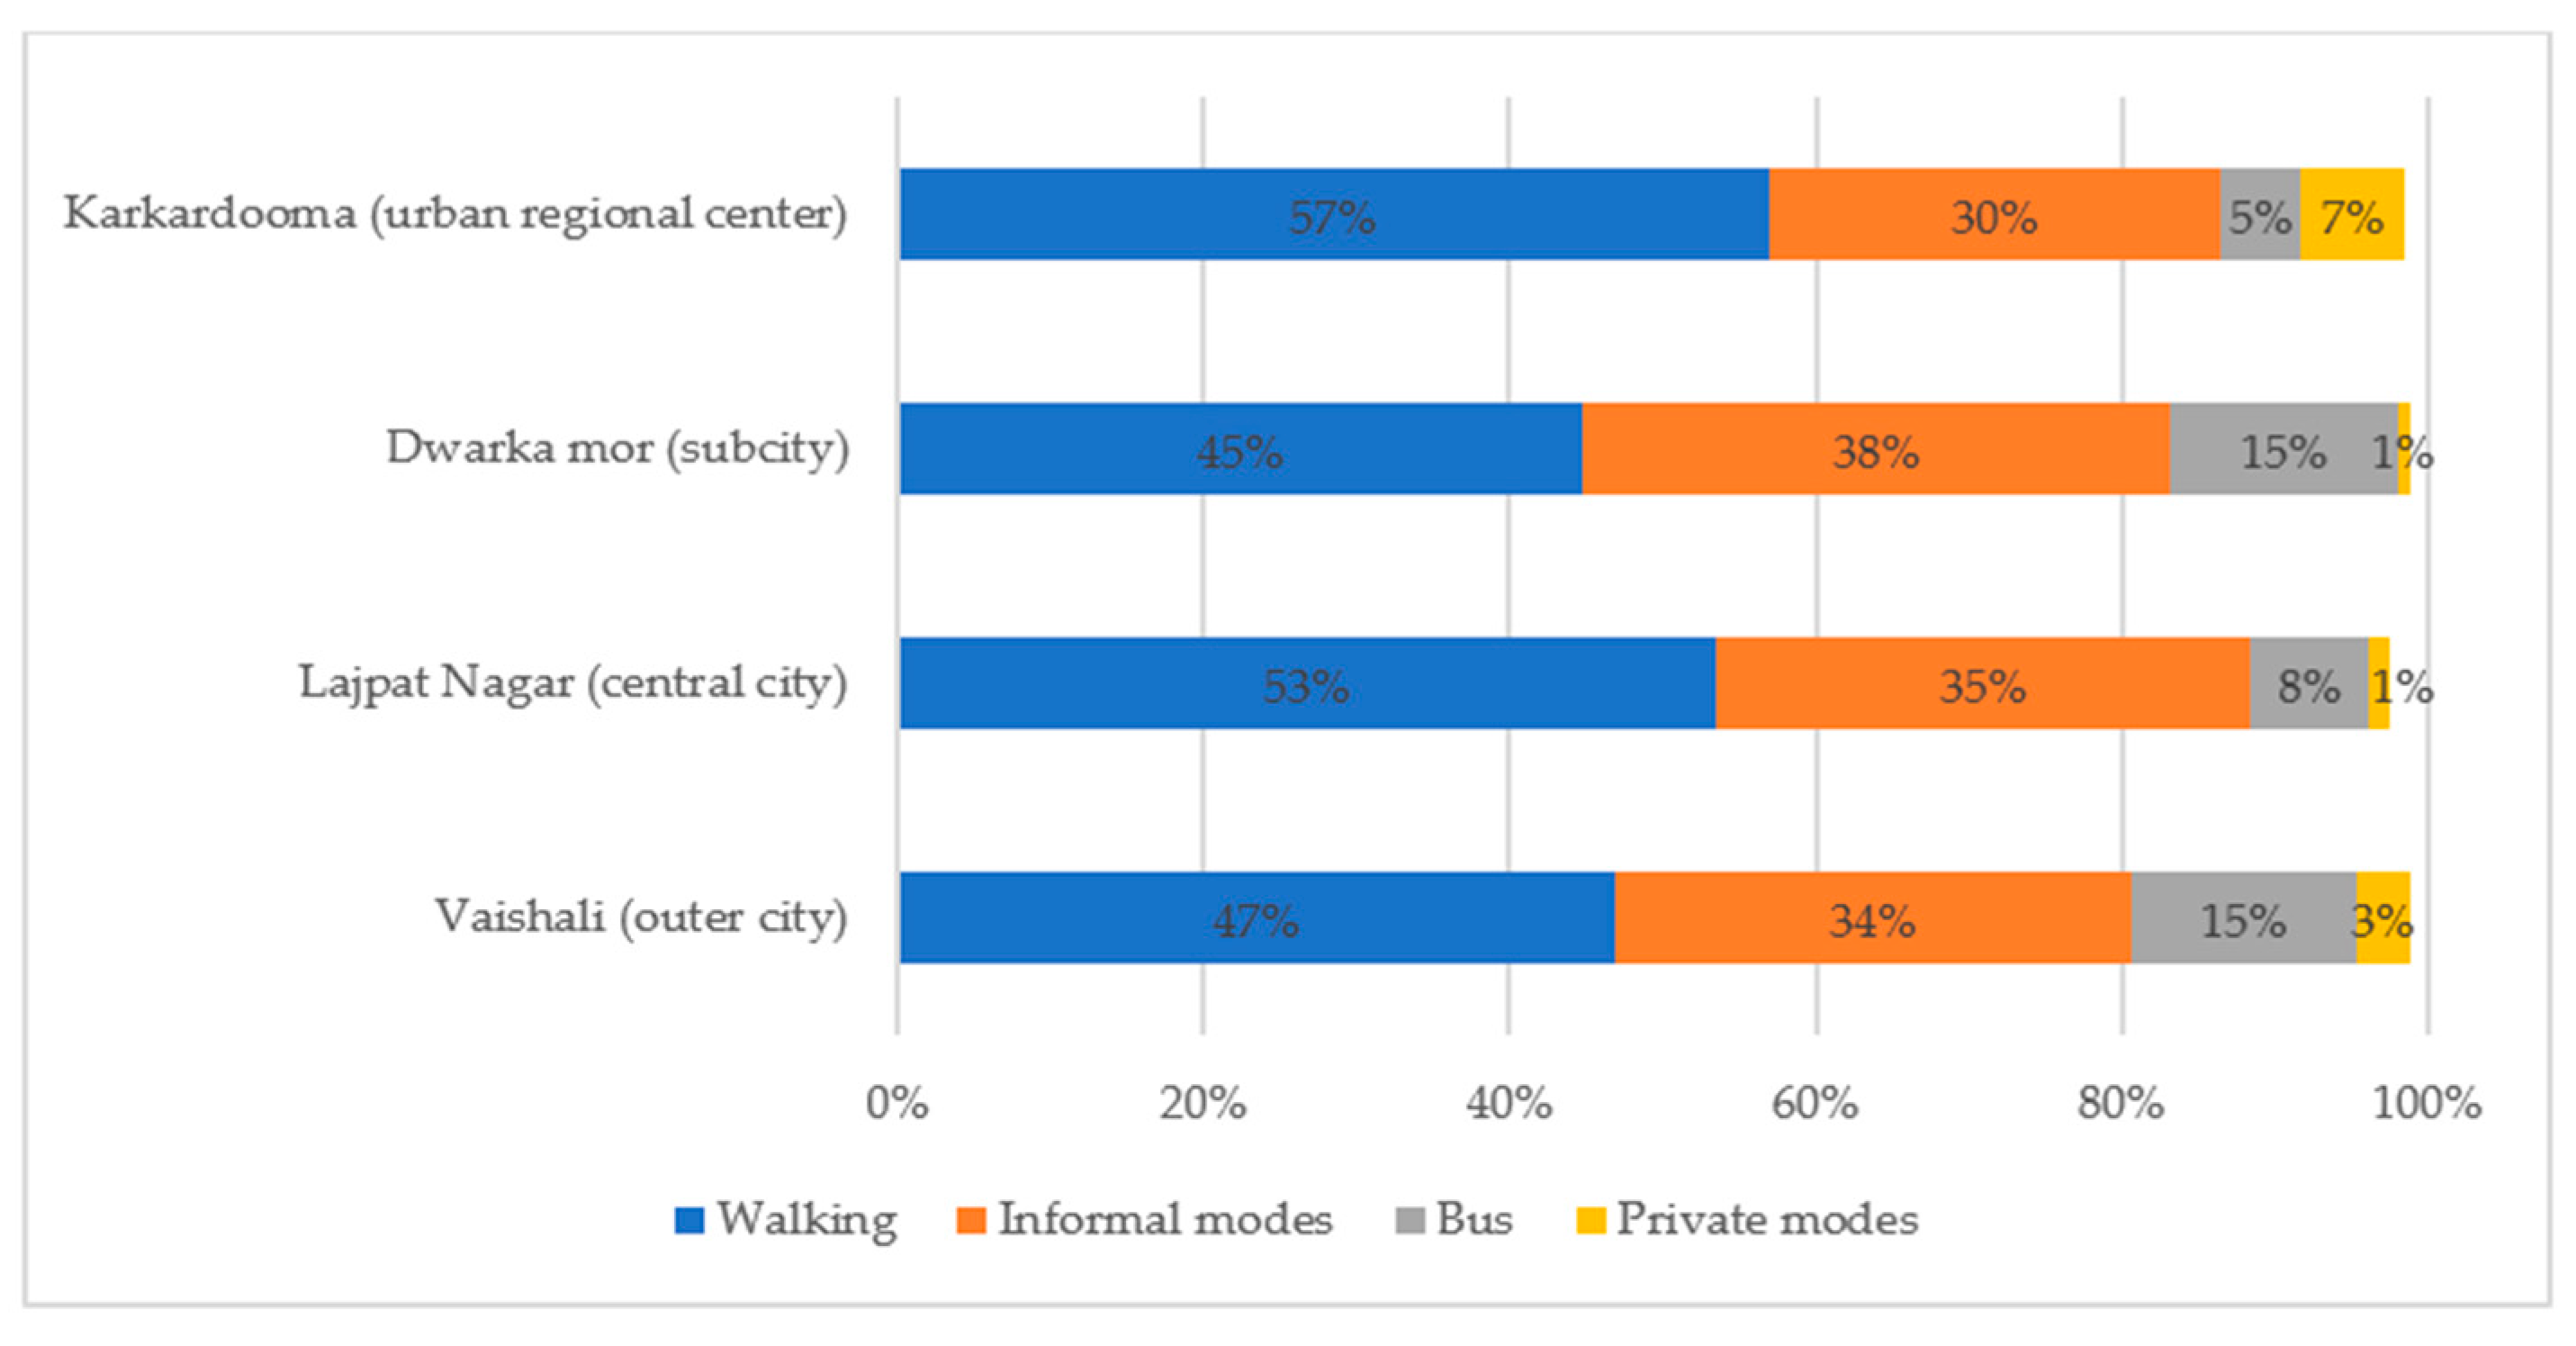
An analysis of the last mile modes indicated that walking is the most preferred mode, followed by informal modes. Auto rickshaws, electric rickshaws, mini vans (gramin sevas), shared auto rickshaws and cycle rickshaws were considered under the category of informal modes. The shares of the bus and the private modes were low, and they were combined for ease in the analysis. The absence of bicycles as a last mile mode was noticed in the survey, which was also noted by Ann et al. [20]. The mode share for last mile connectivity is shown in Figure 3.
2.2. Rounding Problem of Reported Distance Data
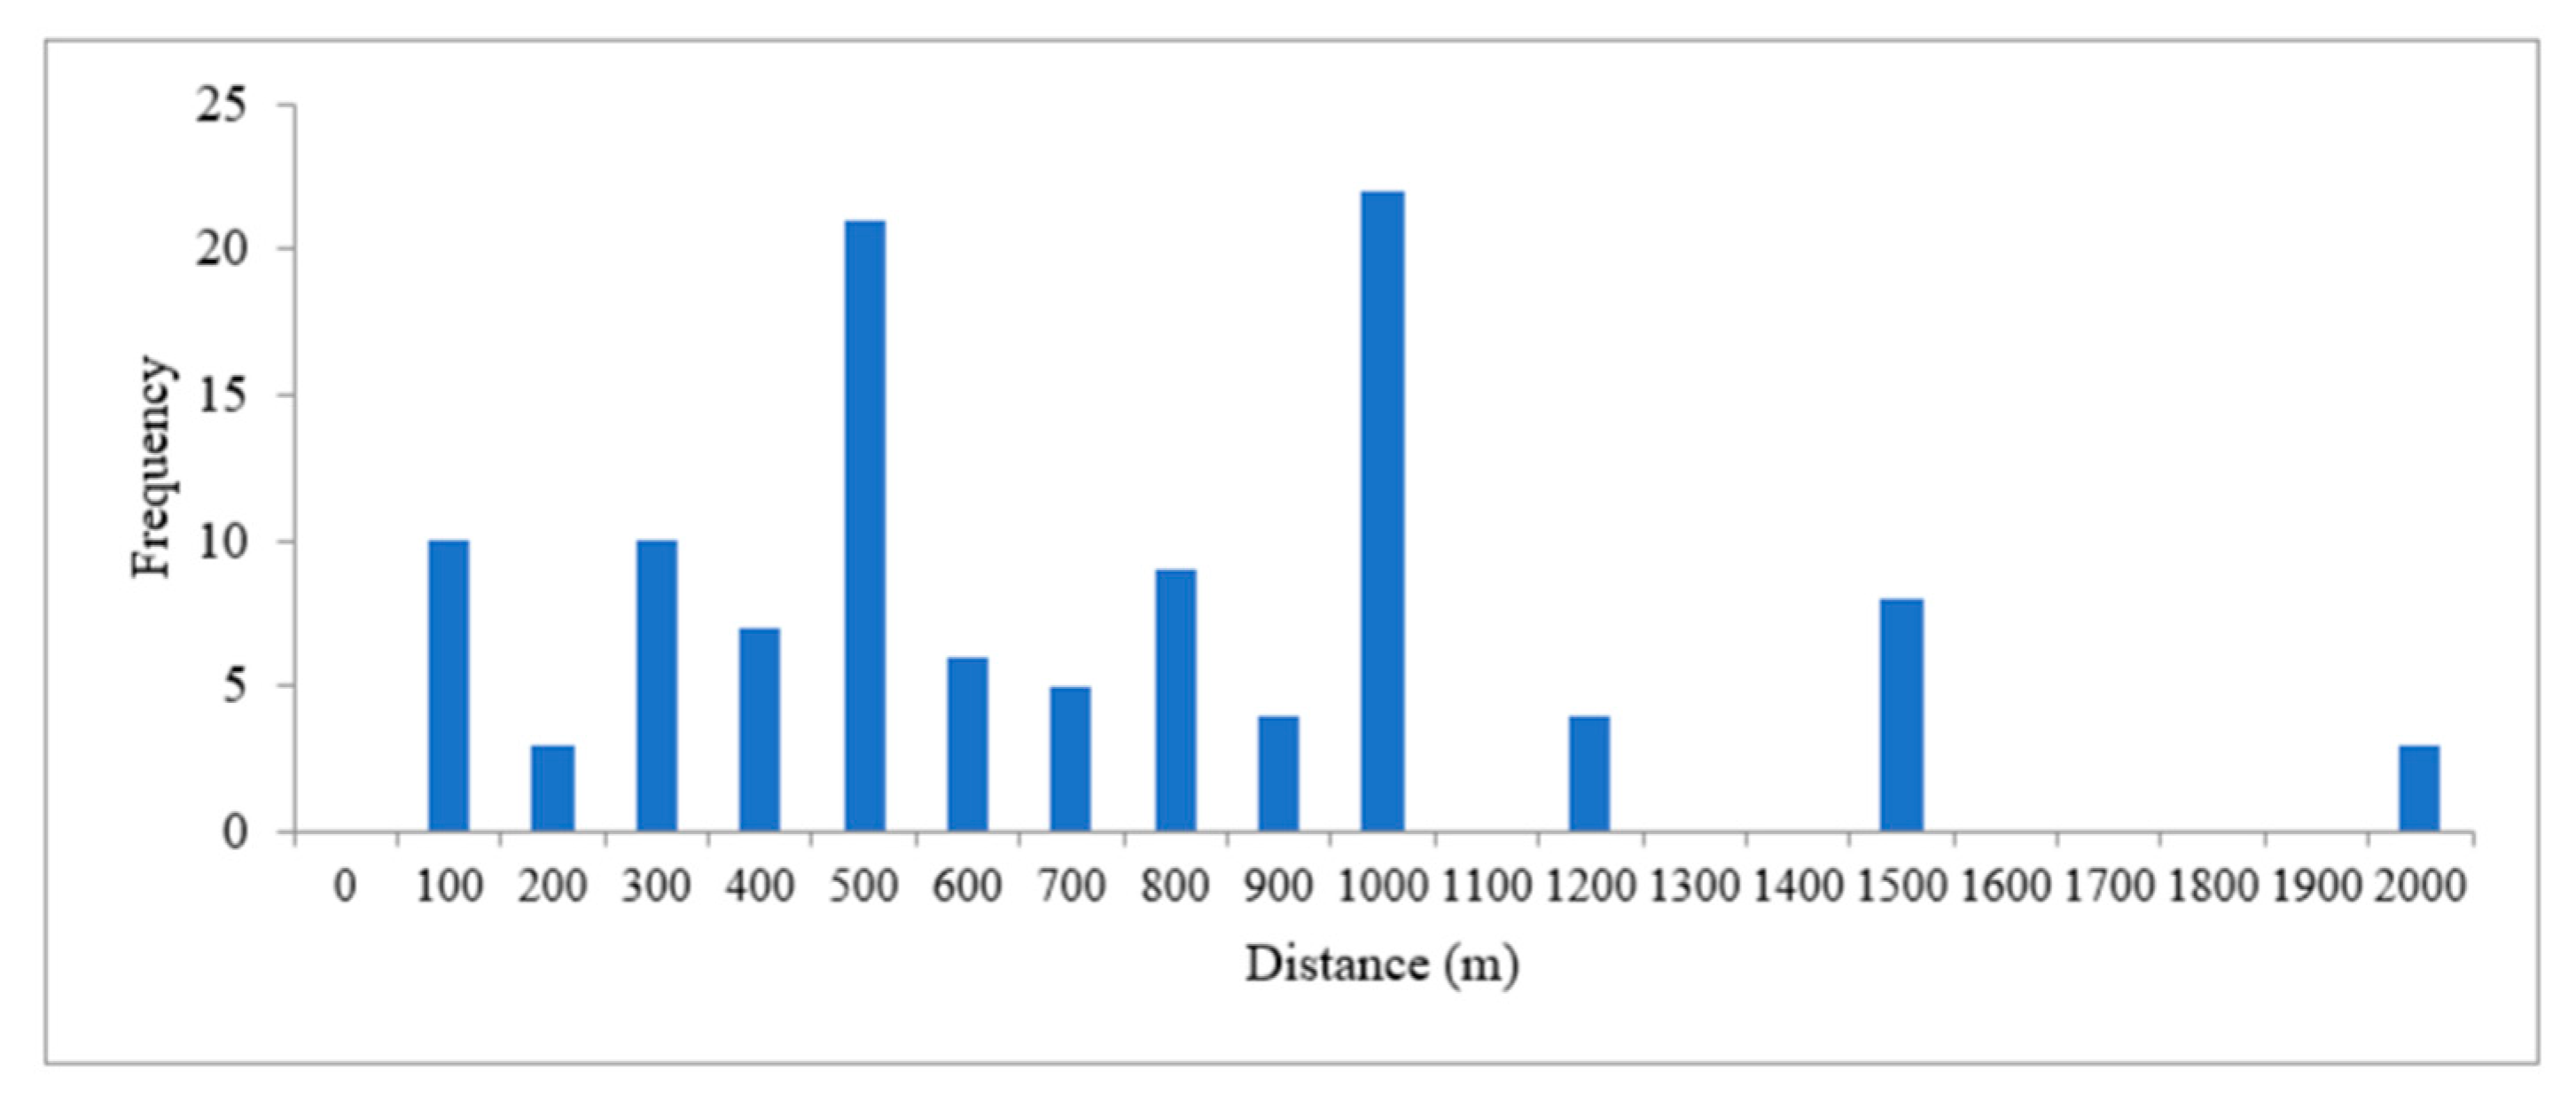
The histograms and cumulative frequency graphs were studied to observe the heaping behavior of the reported distances for all stations. The reported distances were heaped at 100, 500, and 1000 m for walking, and at 500, 1000, and 5000 m for the bus and the private modes across all stations. It was observed that coarseness increased with the distance. A histogram for walking distances for Dwarka Mor station has been shown in Figure 4. The heaping can be clearly seen at multiples of 100, 500 and 1000 m. The longer distances were commonly rounded to the nearest 1000 or 5000 m across modes.
Compared to the raw data of the reported heaped distances, the imputed data can lead to a better analysis and interpretation, as illustrated by Ann et al. [20]. The study highlighted that when rounding is present, the imputed data gives a better fit and statistically significant estimates for a distance decay analysis. The imputed data also yielded results for cases where the raw data could not. In the case of a ROC analysis, the imputed data gave a smoother curve and unique Youden’s index for each distance range. With heaping in the raw data, the multiple distance ranges corresponded to the same Youden’s index and hence, the threshold extended to multiple distance ranges. Therefore, this study also applied a heaping model to account for the heaping issues and performed MI to obtain the imputed dataset to achieve results devoid of rounding bias/errors. Appendix A describes the imputation process adopted for the reported distance data. The subsequent analysis was conducted using the imputed dataset.
3. Estimating Influence Areas of Each Mode
3.1. Distance Decay Analysis
The exponential form of distance decay was proposed by Zhao et al. [21], El-Geneidy et al. [22], Hochmair [23] and Larsen et al. [27] to forecast the travel demand. Compared to a buffer analysis, the exponential form of distance decay provides a better understanding of the transit catchment areas, by assuming varying the demand with the distance. This method was adopted by Ann et al. [20] to estimate the influence areas for the metro stations in New Delhi, and the following equation was used:
where y is the percentage of passengers traveling longer than a particular distance d, and α is the exponential decay constant to be estimated.
This function has a limitation in that it cannot reflect the curve shape change with the distance. In our studies, the coverage curve declined gently for short distances implying that people do not mind the distance increase in short trips. However, it decreases rapidly in a certain range of distances which means that the distance increase causes a strong impact on one’s perception. Finally, the curve decreased slowly with a long tail for long trips as shown in Figure 5. This tendency was observed for all stations studied.
Halas et al. [28] suggested a compound power exponential form of the distance decay with two parameters to investigate the daily travel to work flows. The equation of this function can be written as:
where d is the distance from the center, and and are the positive parameters. The function follows a bell-shaped curve reflecting the shape changes with the distance. The curve is concave in the beginning and then changes to a convex shape. The parameter indicates the variation in the interaction with distance, i.e., the extent of interaction, and explains the perception of commuters at various distances, determining the shape of the curve. Therefore, this function is expected to reflect our data properly.
In this study, both Equations 1 and 2 were used to estimate the distance decay curves for the different stations with different modes. The estimates of the two decay functions for each station are presented in Table 1. The high t-statistic values for the parameter estimates signify satisfactory outcomes for the estimation. The correlation coefficient was close to one for all the categories in the compound power exponential function, indicating the closeness of the observed and estimated data. In the compound function, when the value of is close to one, the function adopts the simpler exponential form. All the estimation results of are higher than 1 to indicate the limitation of the simple exponential function. In addition, the estimated values are different for the four stations and for the various modes. Therefore, this function makes it possible to catch the differences in the effects of the station locations and the access modes to the transit passengers.
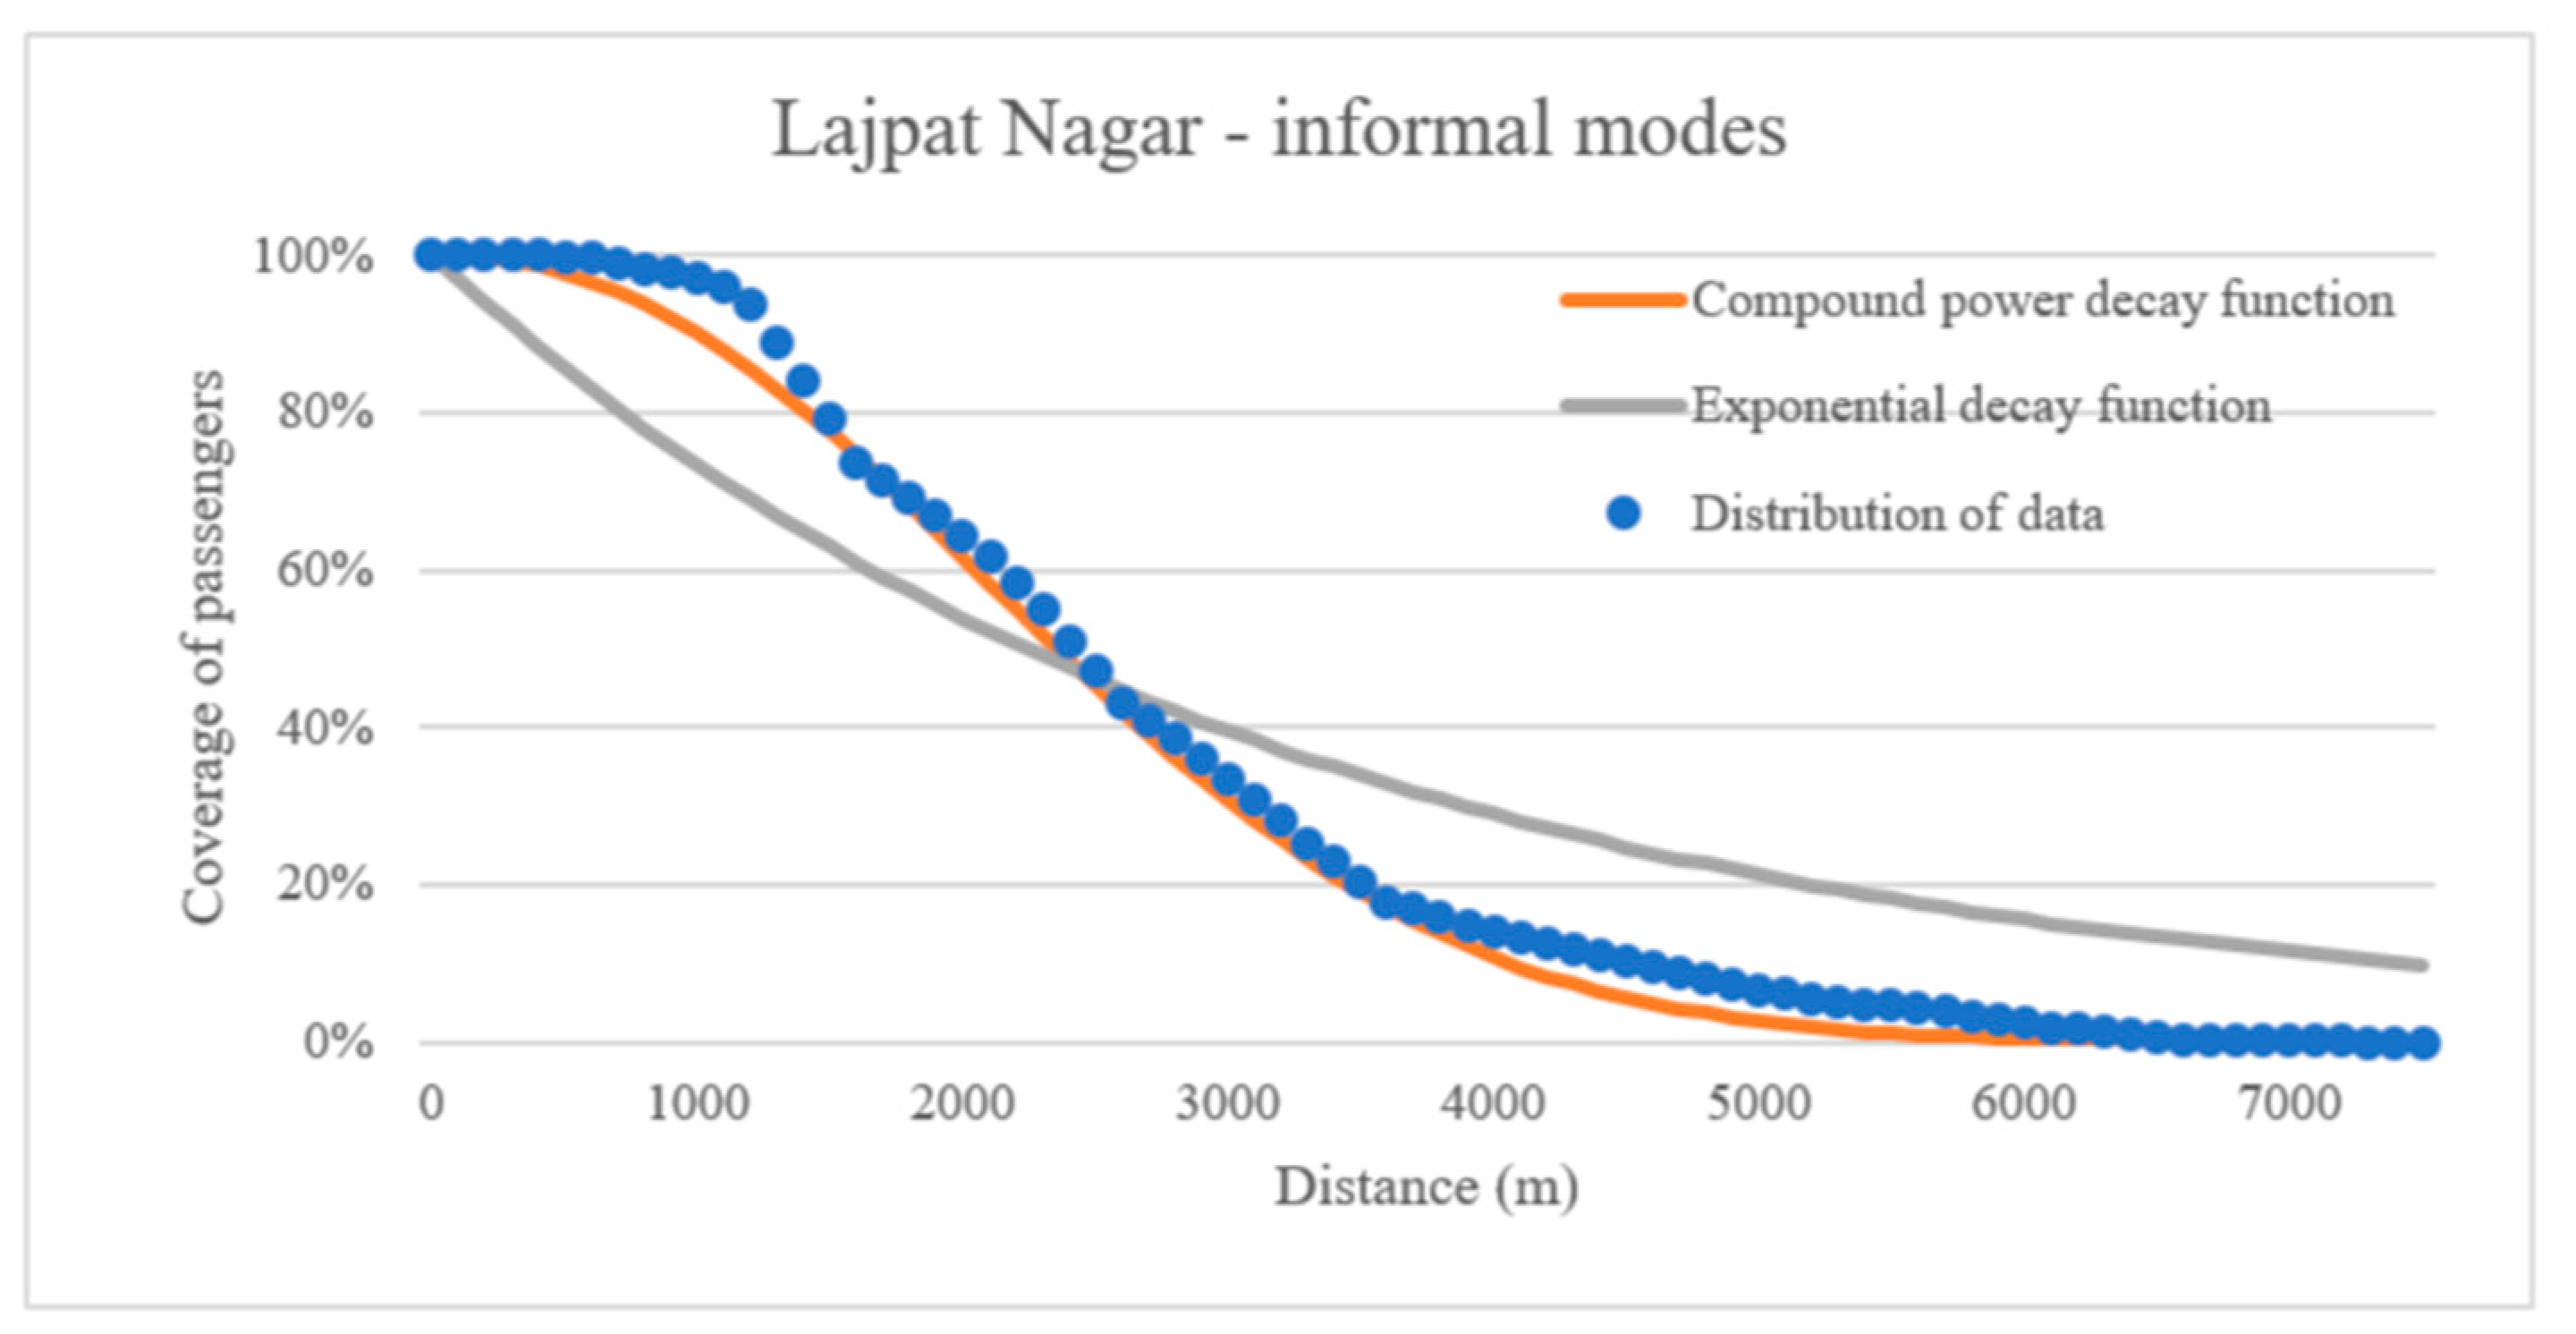
Comparing the goodness of fit of Model 1 and Model 2, the correlation coefficient is close to 1 for both of the models and the residual standard error is also very small (close to zero). However, Model 2 gives a better fit with respect to the shape of the distribution of the imputed data compared to Model 1. As an example, the distance decay curves estimated for the Lajpat Nagar station considering the informal mode are shown in Figure 6. The compound power exponential curve closely follows the distribution of the imputed data, whereas the exponential curve takes a simple form that does not reflect the observed data. This phenomenon was witnessed across the three modes.
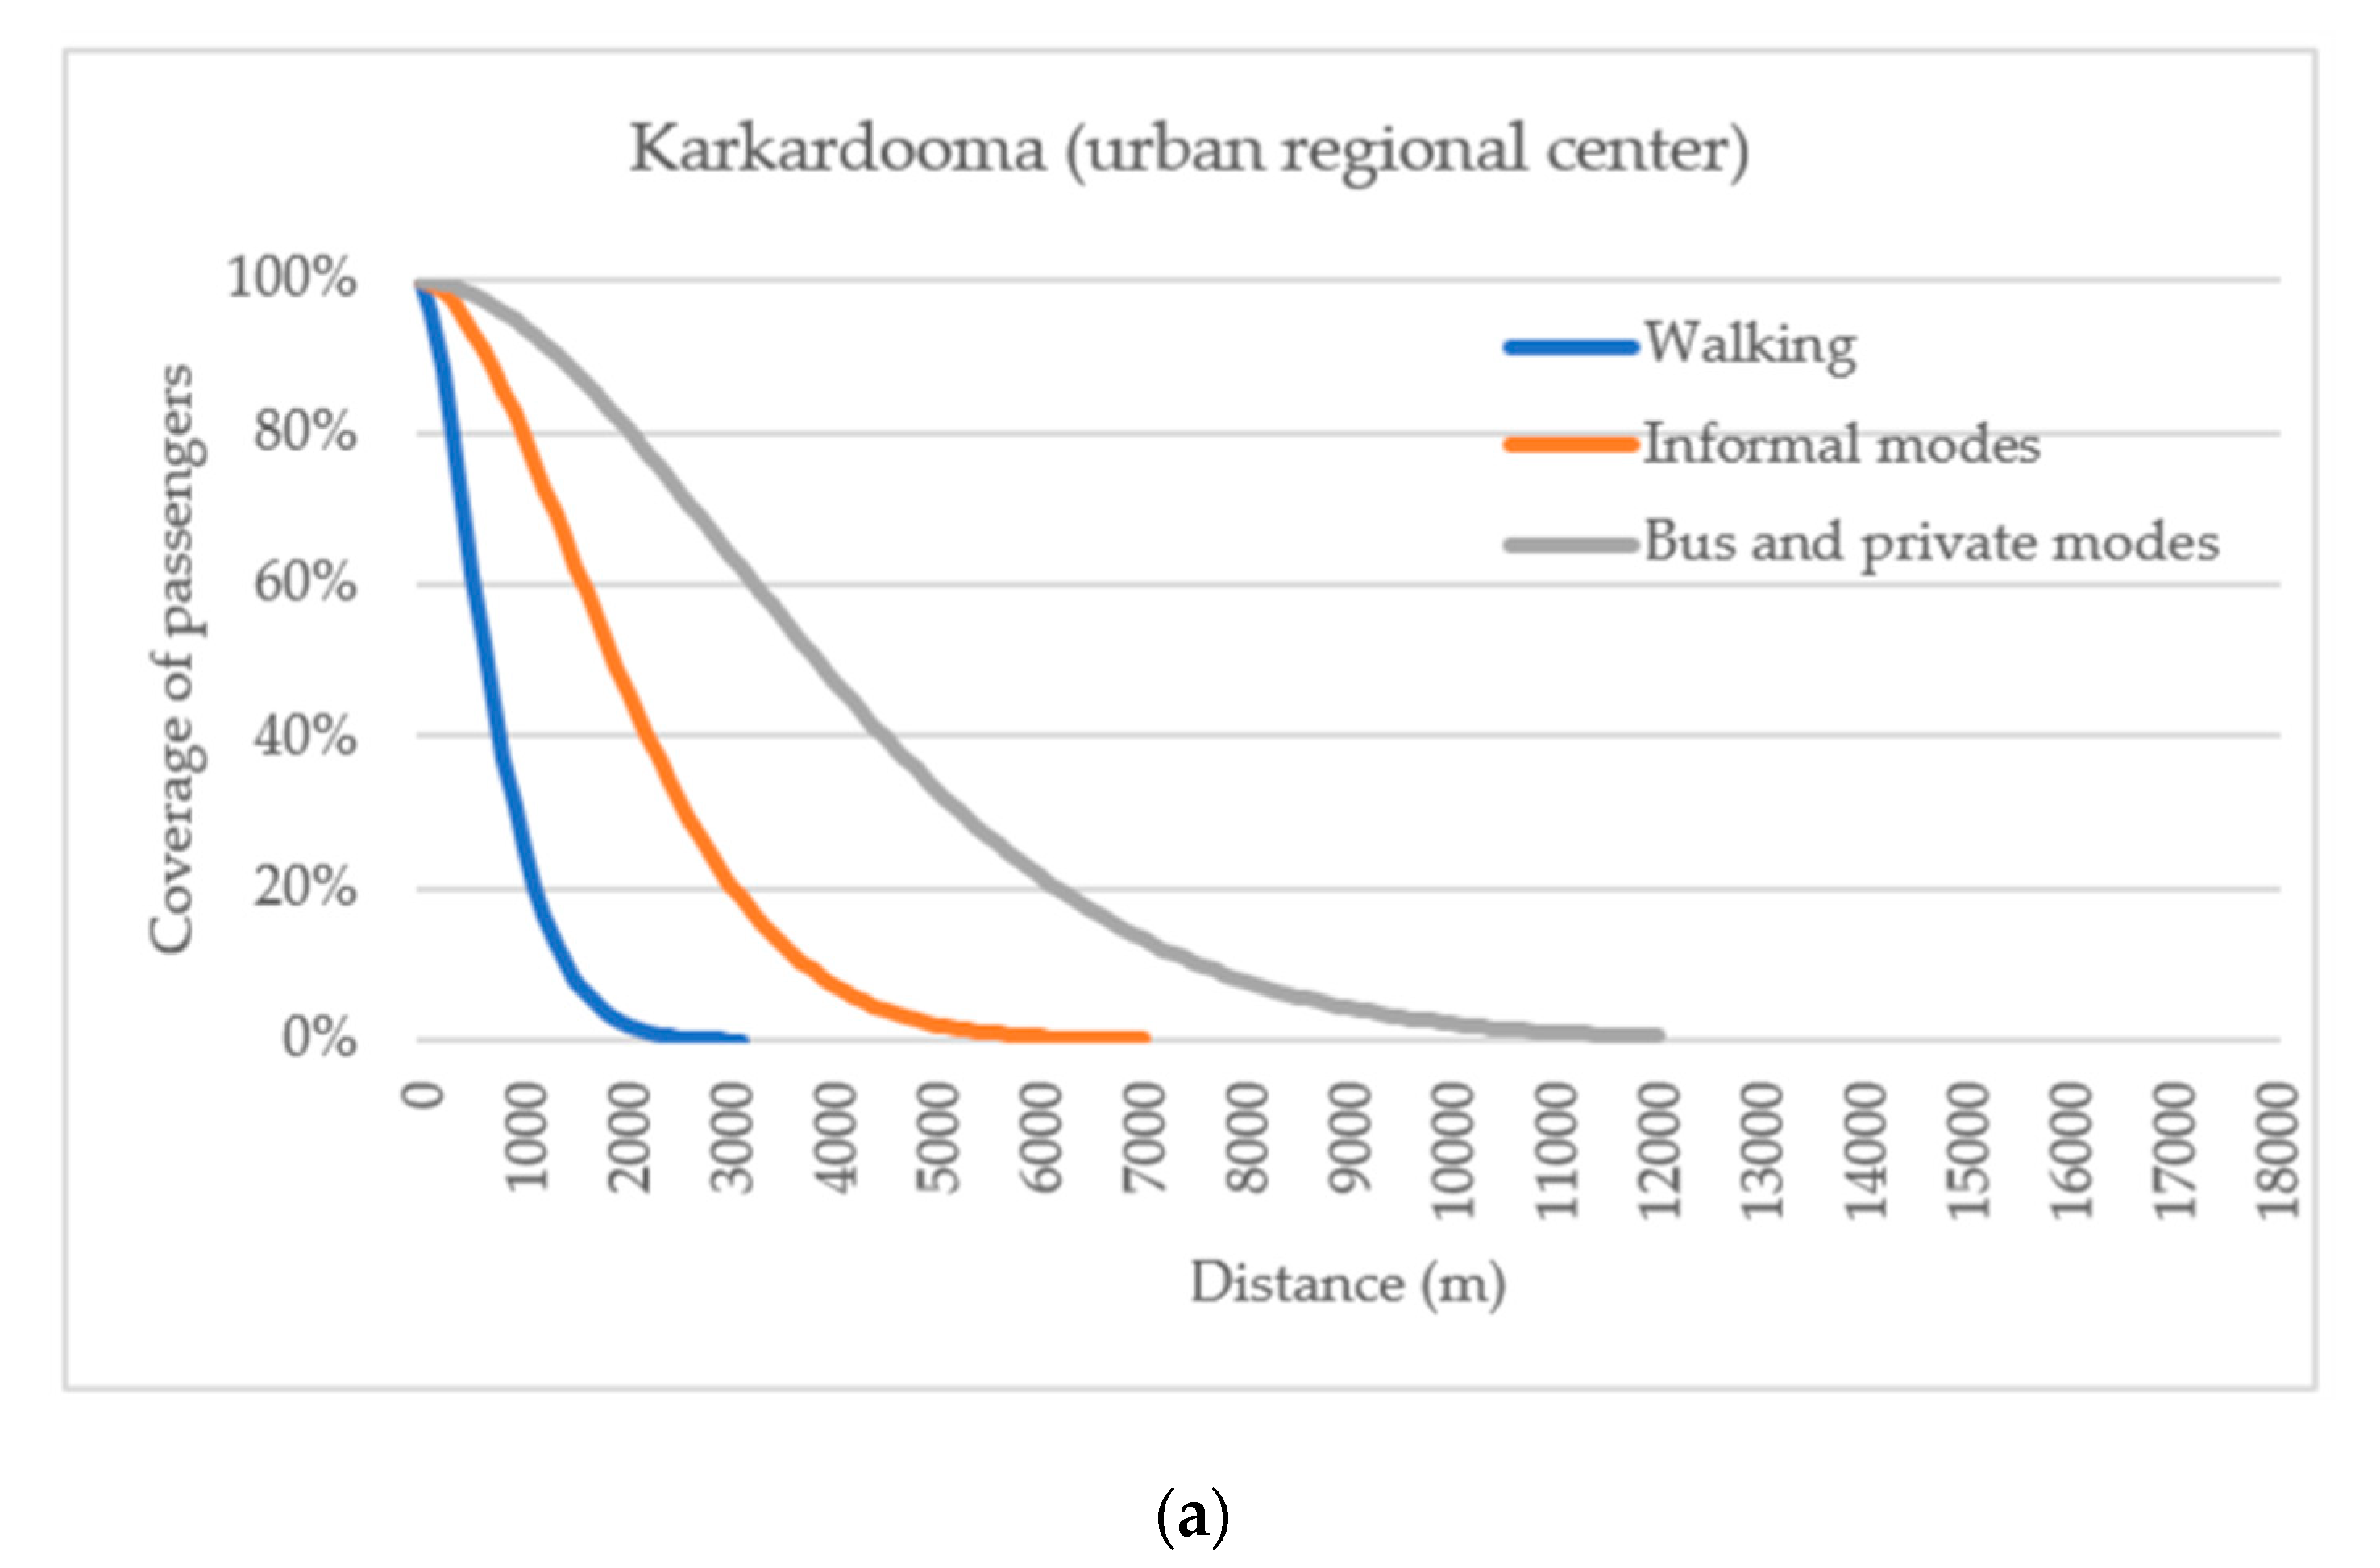
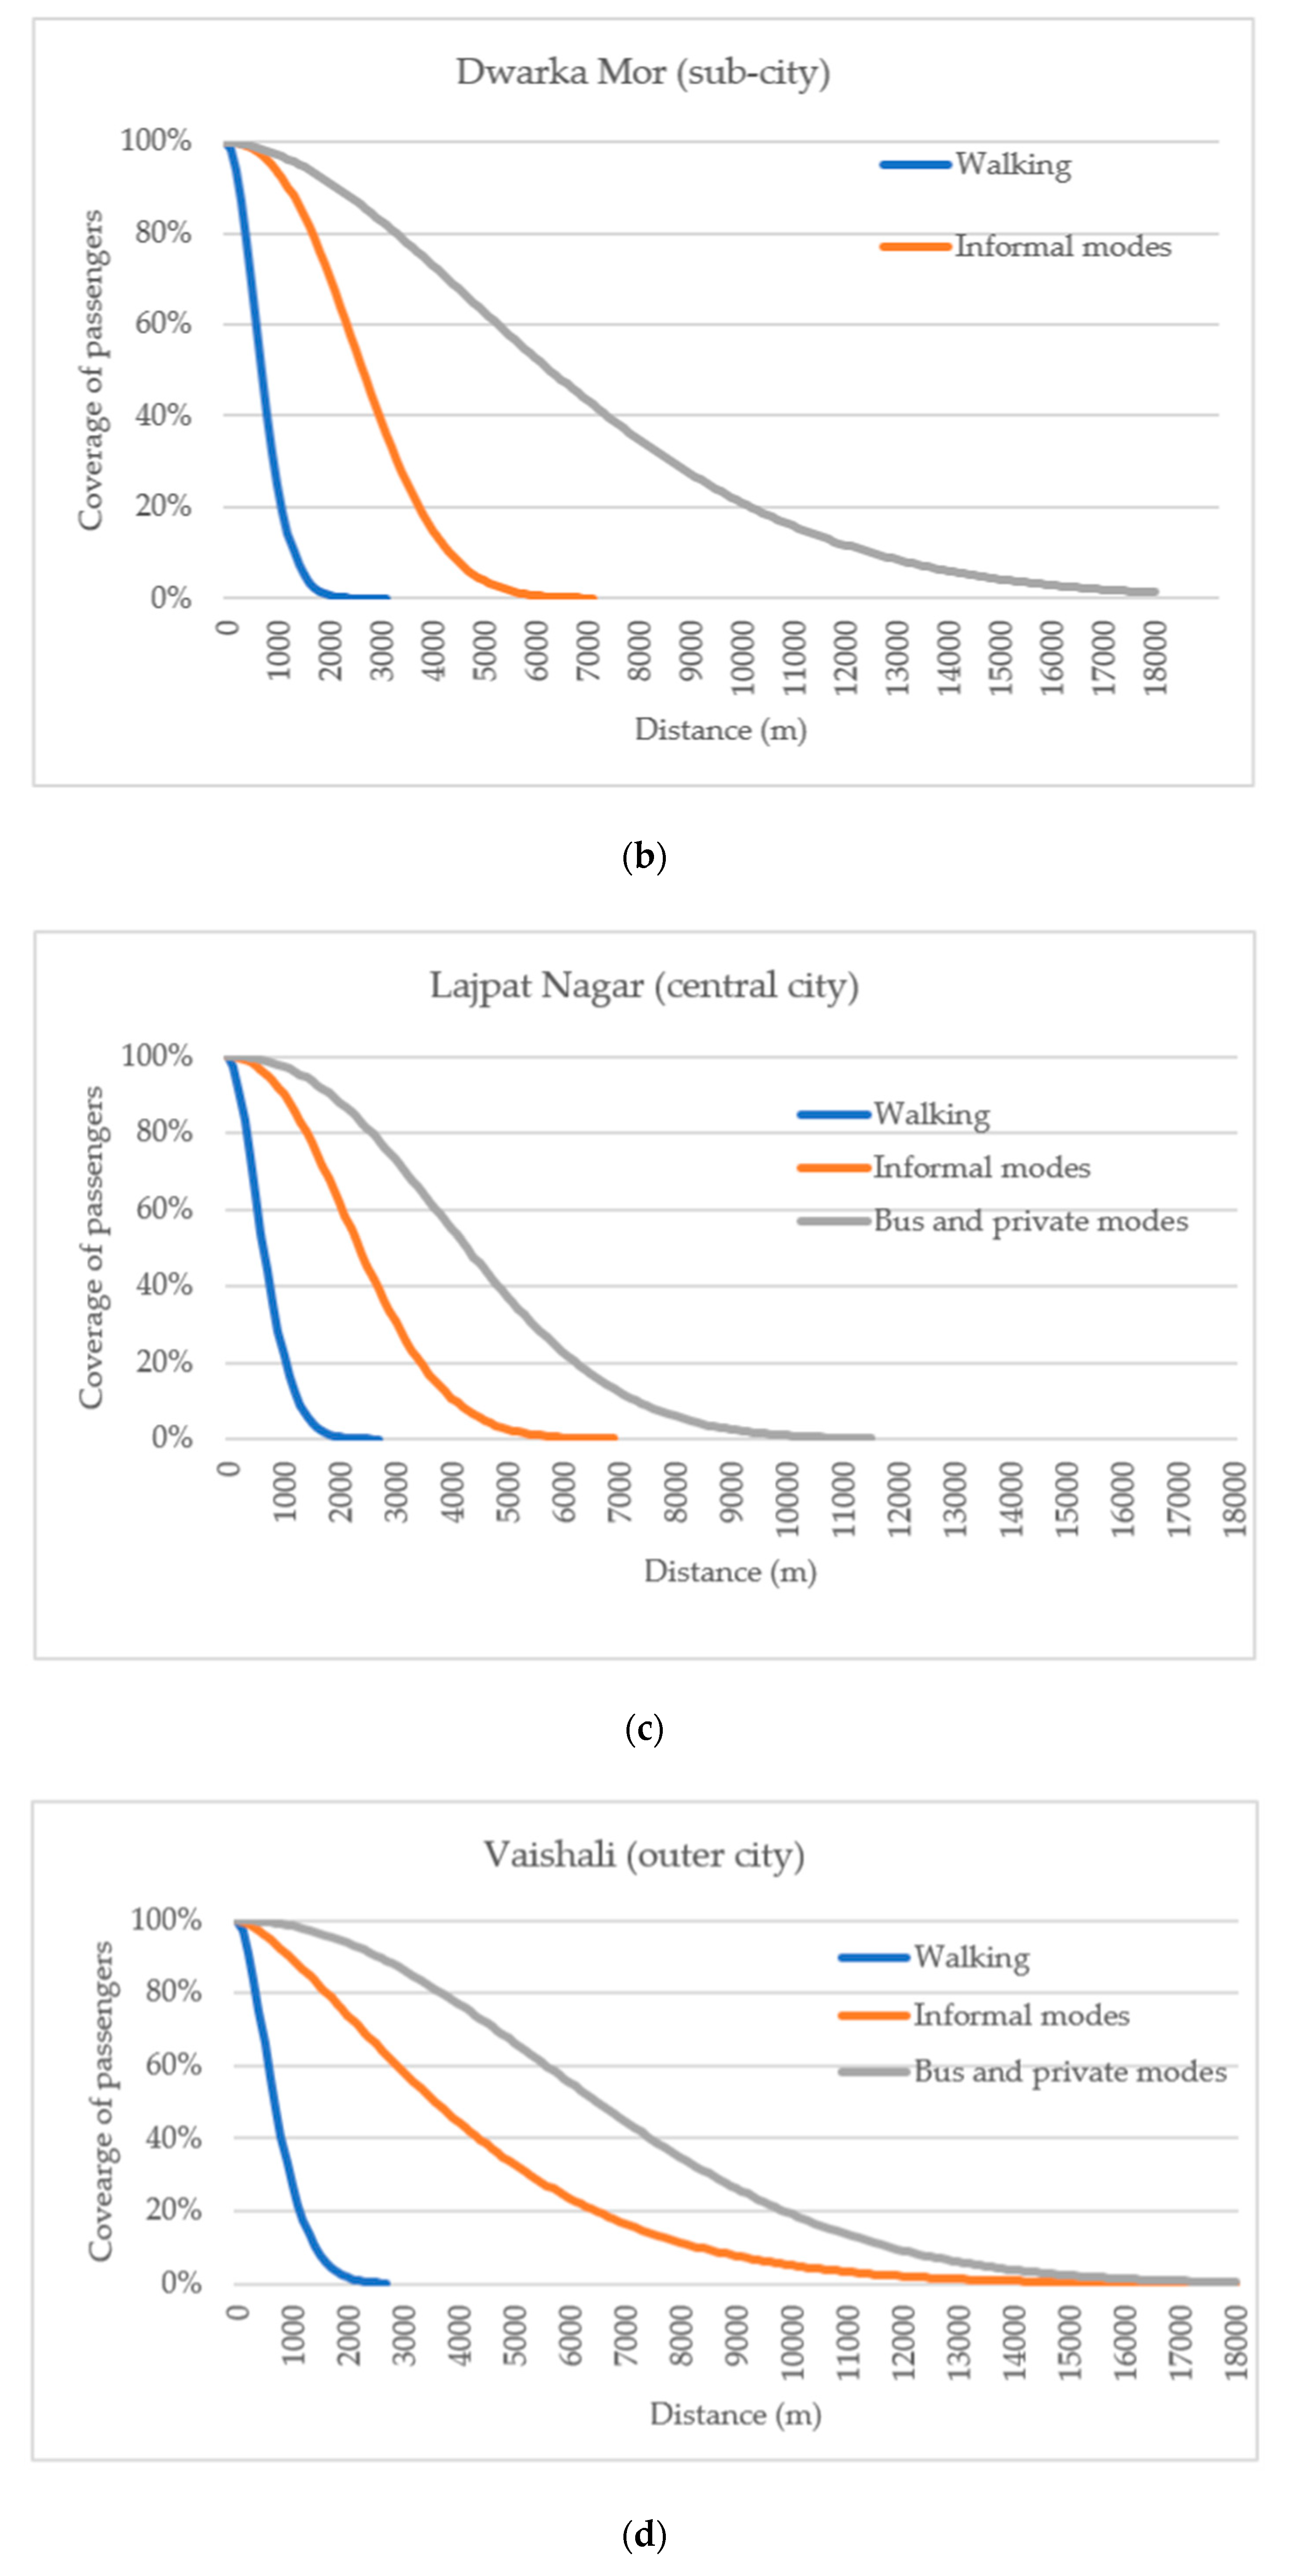
Figure 7 shows the decay curves with different modes for each station. For walking, all stations show similar results. The stations nearer to the city center, Karkardooma and Lajpat Nagar, show similar decay curves for all these modes. For informal modes, Vaishali shows longer distances than other stations, almost twice of other stations. Being an end station, outside the city limits, it can be assumed that commuters rely on informal modes to access the metro station from long distances and informal modes hence play a more prominent role around this station. In the case of the bus and private modes, Dwarka Mor and Vaishali show gradual decay and depict longer distances than the other two stations, highlighting the preference of these modes for long distances.
The compound power exponential decay function was used to estimate the influence areas based on different percentiles. The mean, median, and percentile distances were estimated accordingly. Table 2, Table 3 and Table 4 summarize the estimated travel distances pertaining to walking, the informal modes, and the bus and the private modes, respectively. The distances were rounded to the nearest 100 m to facilitate the provision of references for the TOD planning. The statistical summary of the imputed data was compared with the estimates obtained using the distance decay function. The mean and median estimated from the distance function yielded slightly larger distances than those corresponding to the estimates from the statistical summary.
The mean, median, and percentile walking distances were comparable for all the stations. The decay function estimation provided a mean walking distance of 800 m for Karkardooma, Lajpat Nagar and Dwarka Mor and 900 m for Vaishali. The mean walking distance for Karkardooma, Dwarka Mor and Lajpat Nagar indicate an increase of 14%, as estimated for access trips by Ann et al. [20] for the DMR network. The 85th percentile distance, used to define the catchment areas for the transit stations, was 1200, 1200, 1100 and 1300 m for Karkardooma, Dwarka Mor, Lajpat Nagar, and Vaishali, respectively. Comparing the 85th percentile values for walking, these values were in agreement with the value of 1200–1400 m estimated by Ann et al. [20], with Lajpat Nagar exhibiting a slightly smaller distance. Compared to these distances, the influence area (500–800 m) specified in the National TOD policy is extremely conservative. The mean distances travelled by informal modes for Karkardooma, Dwarka Mor and Lajpat Nagar were 2300, 3100, and 2800 m, respectively, whereas the mean distance suggested by Ann et al. [20] for informal modes was 2900 m. For the outer city station, Vaishali, the distance was as much as 59% higher than estimated for New Delhi. The 85th percentile distance determined for the informal modes in the previous study was 5600 m for the informal transit. In this study, the 85th percentile distances for the three stations within the city boundaries (Karkardooma: 3300 m, Dwarka Mor: 4000 m, and Lajpat Nagar: 3700 m) were considerably smaller than estimated for the DMR network, although for Vaishali, the distance was 30% higher than the distance estimated for the regions within New Delhi. The variations in the mean and the 85th percentile distances were more evident when the distances for the bus and private modes were examined for Karkardooma, Dwarka Mor, Lajpat Nagar and Vaishali. The estimated mean distances were 4700, 7800, 5000, and 7800 m, respectively, and the estimated 85th percentile distances were 6800, 11,200, 6700, and 10,700 m, respectively. Dwarka Mor (subcity station) and Vaishali (outer city station) exhibited larger mean and 85th percentile values compared to the other two stations situated in the core urban areas of New Delhi. These stations being far away from the station, and being one of the easiest ways to reach other parts of the city, the commuters are willing to travel further on buses than other stations. Vaishali and Dwarka Mor reported a 26 % increase in the mean distance for the DMR network. The 80th and 85th percentile estimates for Vaishali and Dwarka Mor were smaller compared to the estimate for the DMR (access).
3.2. ROC Analysis
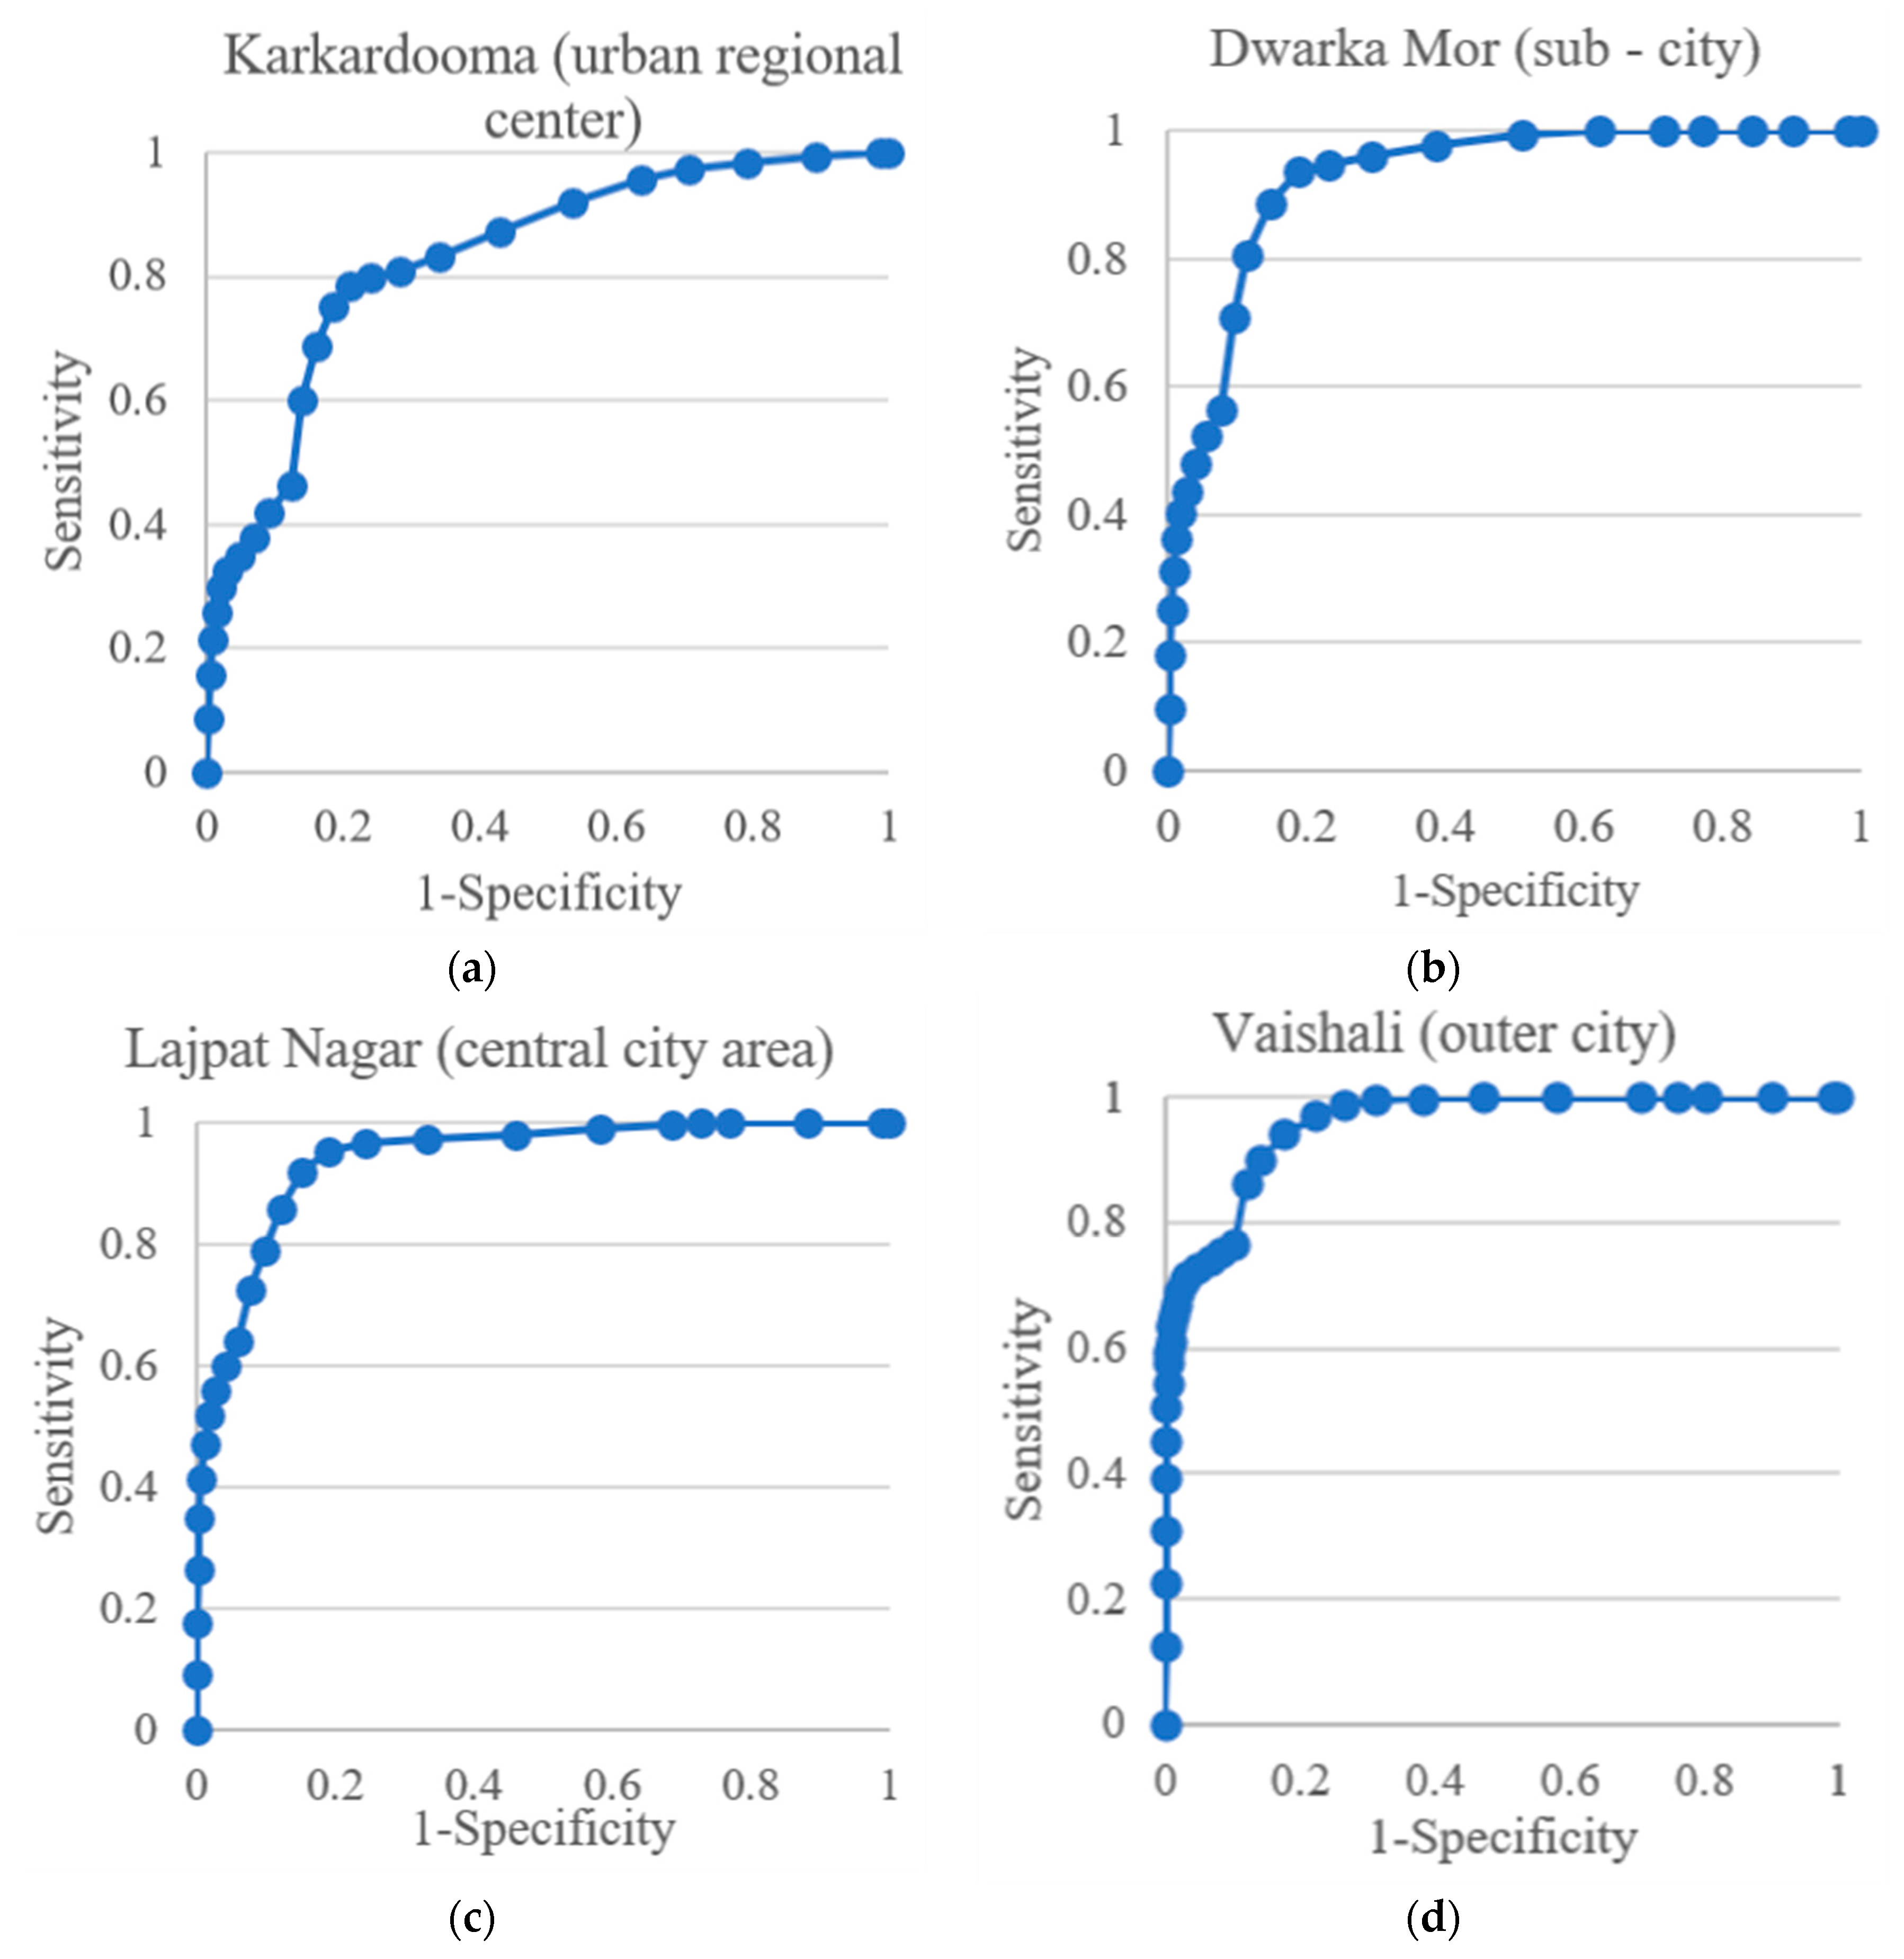
Adopted from the field of medicine, the ROC analysis has been applied in the field of transportation studies. The ROC curves have been used to estimate the threshold distances walked or cycled by students to a school or university [29,30,31]. This method provides a simple yet effective approach to estimate the threshold distances by comparing the number of active users (people who walk) versus the number of passive users (commuters who use other modes) for different distance ranges. In this research, the threshold walking distance for each station was estimated by taking into account the tradeoff between the true (sensitivity) and false positive rates (1–specificity) across a series of distance ranges by using a ROC analysis. For each distance range, the active users were the commuters who walked to access transit stations, and the passive users were commuters who used informal modes, buses, and private modes to access transit. The ROC curves for each station are shown in Figure 8. The threshold distance is calculated using the Youden’s index. Youden’s index is described as the maximum vertical distance from the ROC curve to the diagonal from the lower left corner to the top right corner of the graph. However, it was not possible to estimate the threshold distance of the informal, bus and private modes by using the ROC curve, since the false positive rates for long distance travel with those modes could not be obtained.
As shown in Table 5, Youden’s index was calculated as −0.575, −0.798, −0.767, and −0.763 for Karkardooma, Dwarka Mor, Lajpat Nagar, and Vaishali, respectively. The area under the curve (AUC) values for the curves were approximately 1, and thus, the analysis can be considered effective to obtain the threshold values. The estimation results are presented in Table 5. The threshold walking distance for Dwarka Mor and Vaishali was 1300 m, and for Karkardooma and Lajpat Nagar, it was 1200 m. These values are located between the 80th and 85th percentile values of the decay analysis shown in the previous section. This is consistent with the results of Ann et al. [20].
The results for the threshold distances indicate that commuters are willing to walk similar distances to all stations. The mean distances walked to the stations are also comparable to each other. Although the mean distances travelled by modes other than walking exhibited differences among the stations. The threshold distances were not impacted as the maximum distances for walking were 2500 m for Karkardooma, Lajpat Nagar, and Dwarka Mor and 3500 m for Vaishali. Ker and Ginn [32] implied that walking distances in urban areas are larger than those walked to the stations in suburban areas, as demonstrated in the case of Perth. However, such a conclusion cannot be drawn from the cases considered in the present study. Further research needs to be conducted with more types of stations and more samples in each station type to enable the derivation of conclusive remarks.
4. Conclusions
In this study, the focus was on the last mile distances travelled to individual stations of the DMR network in New Delhi. The objective was to compare the last mile distances travelled on different modes among stations, and to establish the TOD influence zones for the metro stations. The results are aimed at influencing the TOD policy in India and helping create TOD policies that are suited to the urban and transport characteristics in India.
In the primary survey carried out for the study, the issues of rounding and heaping were observed, highlighting the issues in the data collection for transportation studies in India, where there is already a dearth of sufficient data. The potential bias in the results of the estimation was removed by creating an imputed dataset, which was subsequently used to perform a distance decay analysis and a ROC analysis for determining the extent of the TOD influence areas.
The bell-shaped curve of the compound power exponential form of distance decay was found to be reliable to investigate the decreasing interaction between the distance from the stations and the percentage coverage of passengers. The estimation result of the decay function provided that the extent of the TOD influence area varies with access modes as well as with the location of the station. The mean and the percentile values of the travel distances increase in the order of walking, the informal modes, and the bus and private modes.
For walking, the difference among stations was not significant implying the willingness to walk does not vary much with the location of stations. Vaishali, the outer city station exhibited slightly higher distances than the other three stations. However, the mean walking distance for Karkardooma, Dwarka mor and Lajpat Nagar indicate an increase of 14%, as estimated for access trips by Ann et al. [20] for the DMR network. The outer station, Vaishali showed a 29% increase. The threshold distances estimated using the ROC analysis were in agreement with the 80th–85th percentile distances for walking. The threshold walking distance for the four stations lies in the range of 1200–1300 m which is close to the result of the general case across all stations in New Delhi [20]. These distances also indicate that the size of the influence area (500–800 m) specified in the National TOD policy and the Master Plan for Delhi 2021 is extremely conservative.
In the case of informal modes, there was considerable variation among stations. Vaishali, which is an outer station, corresponded to nearly two times the distance for the other three stations. For Vaishali, the distance was as much as 59% higher than estimated for New Delhi for the mean distance whereas the 85th percentile distance was 30% higher. It means that people who live outside of the city usually travel longer distances on informal modes to reach stations compared those who live inside of the city.
This large variation was also noted when comparing the last mile distances for the bus and private modes. Dwarka Mor (subcity station) and Vaishali (outer city station) corresponded to larger distances compared to those of the other two stations situated in the core urban areas of New Delhi. The mean distances and the 85th percentile distances for Dwarka Mor and Vaishali are nearly twice as much as those for Karkardooma and Lajpat Nagar. Vaishali and Dwarka mor also reported a 26 % increase in the mean distance than the DMR network. The 80th and 85th percentile estimates for Vaishali and Dwarka mor were smaller compared to the estimate for the DMR (access) [20].
It can thus be concluded that variations are present in the last mile distances among stations. Although the walking distances did not vary considerably among stations, large variations were observed when other modes were compared. The outer city station, Vaishali, exhibited longer distances for informal modes, buses, and private modes, which illustrates that access to such metro stations means commuters tend to travel longer distances on motorized modes. Therefore, when considering multimodal accessibility and multimode-based TOD, these differences in accessibility must be taken into account.
The study provides insights into the last mile patterns for the four DMR stations, and the extent of the influence area for each mode was calculated. The results are not the same across the selected stations, however, they are not considerably different either. Further research needs to be conducted across more station types to arrive at a conclusive remark regarding the size of the influence areas for specific station types.
The estimates of the influence areas for each station can be used to delineate the influence areas for these stations in New Delhi, enabling planners and policy makers to cater to a larger population and maximize the benefits of TOD. The influence areas based on walking should be at least 1200 m based on this study and Ann et al. [20]. These estimates can be used for a brownfield development (existing stations) and are based on the last mile patterns of existing commuters. Given that informal modes play a very important role in last mile connectivity, the inclusion of informal modes increases the size of the influence areas considerably as shown in this study. The findings from this study can be applied in other cities in India as well as in other developing countries with the presence of informal modes as a preliminary guideline to assess the influence areas and to understand that these areas can extend further than 500–800 m. The methodology can be applied to last mile distances of transit systems and to individual stations. The MI need be applied only in cases where the respondents tend to round the distances.
Author Contributions
Conceptualization: T.Y., S.A., and M.J.; methodology: T.Y., S.A., and M.J.; software: T.Y., M.J., and S.A.; validation: T.Y., S.A., and M.J.; analysis: T.Y., S.A., and M.J.; writing—original draft preparation: S.A. and M.J.; writing—review and editing: T.Y., S.A., and M.J.
Funding
This study received no external funding.
Acknowledgments
The authors are deeply grateful to the Delhi Metro Rail Corporation (DMRC) for providing support for performing this study.
Conflicts of Interest
The authors declare no conflicts of interest.
Appendix A
Appendix A.1. Multiple Imputation to Overcome Rounding and Heaping Issues
The cases of rounding in the reported distance data for the four stations are presented in Table A1. The reported distances were heaped at 100, 500, and 1000 m for walking, and at 500, 1000, and 5000 m for bus and private modes across all stations. For informal transport, the rounding was observed at four levels, i.e., 100, 500, 1000, and 5000 m for two stations, Karkardooma and Dwarka Mor. For the other two stations, the rounding was observed at 500, 100, and 5000 m.

Table A1.
Rounding of reported distances for various modes for various stations *.
| Station | Case | Walking | Informal | Bus & Private Modes |
|---|---|---|---|---|
| Karkardooma (Urban Regional Center) | Multiples of 5000 m excluding multiples of 10,000 m | 0 | 14 | 7 |
| Multiples of 1000 m excluding multiples of 5000 m | 47 | 88 | 23 | |
| Multiples of 500 m excluding multiples of 1000 m | 39 | 26 | 4 | |
| Multiples of 100 m excluding multiples of 500 m | 83 | 21 | 2 | |
| Not multiples of 100 m | 8 | 1 | 0 | |
| Total cases | 177 | 150 | 39 | |
| Dwarka Mor (Subcity) | Multiples of 5000 m excluding multiples of 10,000 m | 0 | 14 | 13 |
| Multiples of 1000 m excluding multiples of 5000 m | 37 | 106 | 29 | |
| Multiples of 500 m excluding multiples of 1000 m | 33 | 17 | 1 | |
| Multiples of 100 m excluding multiples of 500 m | 68 | 9 | 1 | |
| Not multiples of 100 m | 1 | 0 | 0 | |
| Total cases | 139 | 146 | 53 | |
| Lajpat Nagar (Central City) | Multiples of 5000 m excluding multiples of 10,000 m | 0 | 16 | 10 |
| Multiples of 1000 m excluding multiples of 5000 m | 42 | 92 | 17 | |
| Multiples of 500 m excluding multiples of 1000 m | 46 | 28 | 3 | |
| Multiples of 100 m excluding multiples of 500 m | 74 | 6 | 1 | |
| Not multiples of 100 m | 2 | 0 | 0 | |
| Total cases | 164 | 142 | 33 | |
| Vaishali (Outer City) | Multiples of 5000 m excluding multiples of 10,000 m | 0 | 25 | 14 |
| Multiples of 1000 m excluding multiples of 5000 m | 43 | 93 | 35 | |
| Multiples of 500 m excluding multiples of 1000 m | 25 | 16 | 2 | |
| Multiples of 100 m excluding multiples of 500 m | 63 | 7 | 0 | |
| Not multiples of 100 m | 2 | 0 | 0 | |
| Total cases | 133 | 149 | 60 |
* The coloured cells indicate the categories with significant number of rounding.
Appendix A.1.1. Heaping Model to Account for Rounding Errors
Yamamoto et al. [26] encountered the issue of rounding in the reported vehicle kilometers travelled in their study, and a heaping model was used to account for the rounding and heaping errors. The model takes the form of a discrete mixture of an ordered probit model. Ann et al. [20] used the same heaping model to account for rounding and heaping issues in last mile distances, which followed a log normal distribution. Higher coarseness was observed at larger distances in both studies. The present study draws from the two preceding studies [20,26]. The first part of the model uses a distance function to articulate the distribution of the heaping data, as defined in Equation (A1):
where is the actual distance of individual i, and is the reported distance. is a parameter vector, is a vector of explanatory variables, and is a random variable that follows a normal distribution with a mean of 0 and variance of . Three modes were considered: walking, informal modes, and bus and private modes, and for each mode, was treated differently. Based on the cases of rounding presented in Table A1, different categories of rounding were considered. The walking distances were most likely to be rounded to multiples of 100, 500, and 1000 m all the four stations. The distances travelled by informal transport were assumed to be rounded to multiples of 500, 1000, and 5000 m for the Lajpat Nagar and Vaishali stations. However, for Karkardooma and Dwarka Mor, the rounding was considered to occur at multiples of 100, 500, 1000, and 5000 m. As mentioned earlier, bus and private modes were treated as a single category owing to the small sample size, and the corresponding rounding was considered at multiples of 500, 1000, and 5000 m. Considering these rounding ranges, the actual distance was expected to lie in the ranges [ − 50, + 50], [ − 250, + 250], [ − 500, + 500], and [ − 2500, + 2500], respectively, if the reported distance was rounded to multiples of 100, 500, 1000, and 5000 m.
The latent variable, which indicates the coarseness of the reported distance, is a function of the actual distance, and the coarseness function can be defined as in Equation (A2)
where, denotes the unobserved tendency of the coarseness of the reported data, and are parameters, and is a normally distributed random variable with a mean of 0 and variance of . is the socioeconomic parameter.
The coarseness of the reported data, , can be discretized as given in Equation (A3), considering only if three cases of rounding are present, and considering two threshold values and if four cases are present.
In the ordered response model, the reported distances can be assigned to specific rounding categories based on the known coarseness levels. Specifically, if = 1, the distance is assumed to be rounded to the nearest 100 m. Similarly, if = 2, 3, 4, the reported distance is assumed to be rounded to the nearest multiple of 500, 1000, and 5000 m, respectively. is assumed to be distributed as a bivariate normal with mean and covariance as given in Equations (A4) and (A5), respectively.
A region S() of possible values for (, ) can be defined, which all map to . For the case of walking, the regions , , and respectively correspond to multiples of 100, 500, and 1000 m. In the case of informal transport modes for Dwarka Mor and Karkardooma, for which four cases of rounding are considered, a fourth region corresponds to multiples of 1000 m. For bus and private transport, the regions , and are effective. The region of possible values is defined as follows:
The log-likelihood function for the parameters is estimated by maximum likelihood (ML) method; the log likelihood function is given by Equation (A7).
where is the bivariate normal of E and V.
The estimation results of the bivariate ordered response probit model are presented in Table A2. The estimates have high statistical significance. Variables like age, gender, income, vehicle ownership, etc. were found to be not significant in explaining the reported distance or the coarseness. The log-distance coefficient , was positive for all modes across the four stations, signifying the increase in coarsened with travel distance. Comparing across stations, , was least for Vaishali station for all modes. It signifies that commuters from had the least tendency to round travel distances. The estimate for for bus and private modes for Dwarka Mor was comparable to Karkardooma. It may be said that for these two stations, last mile distances travelled on bus had lesser coarseness levels with distance than other modes and other stations. The coarseness function constant, , also comparatively lower for Vaishali, imply lower rounding for last mile distances reported in Vaishali. Considering the distance function, signifies the distances travelled for each mode. The estimates of were highest for Vaishali followed by Dwarka Mor, i.e., stations far away from the city center had longer last mile distances for all modes compared to stations nearer to the city center.
Table A2.
Estimation results of the heaping model (in the form “Estimate (t-stat)”).
| Variable | Karkardooma (Urban Regional Center) | Dwarka Mor (Subcity) | Lajpat Nagar (Central City) | Vaishali (Outer City) | ||||||||
|---|---|---|---|---|---|---|---|---|---|---|---|---|
| Walking | Informal Modes | Bus and Private Modes | Walking | Informal Modes | Bus and Private Modes | Walking | Informal Modes | Bus and Private Modes | Walking | Informal Modes | Bus and Private Modes | |
| Coarseness Equation: Constant | −7.025 | −6.549 | −9.362 | −7.389 | −7.927 | −5.683 | −6.927 | −9.280 | −9.374 | −6.665 | −7.470 | −4.025 |
| (−10.98) | (−8.52) | (−4.68) | (−6.97) | (−5.13) | (−1.22) | (−6.89) | (−5.13) | (−1.98) | (−7.06) | (−8.36) | (−0.82) | |
| Distance Equation: Constant | 6.348 | 7.421 | 8.088 | 6.398 | 7.796 | 8.589 | 6.306 | 7.670 | 8.301 | 6.411 | 8.136 | 8.779 |
| (101.92) | (113.13) | (59.61) | (85.49) | (169.14) | (107.72) | (99.62) | (149.10) | (74.97) | (83.32) | (116.47) | (118.87) | |
| Threshold (ɵ2) | 0.779 | 0.848 | 1.628 | 0.900 | 1.013 | 2.339 | 1.403 | 1.464 | 1.518 | 0.549 | 1.569 | 2.173 |
| (3.738) | (4.98) | (3.98) | (3.22) | (4.05) | (4.40) | (3.41) | (5.60) | (3.05) | (2.74) | (6.75) | (5.14) | |
| Threshold (ɵ1) | - | 2.519 | - | - | 3.246 | - | - | - | - | - | - | - |
| (9.65) | (7.99) | |||||||||||
| Std. Deviation (σe) | 0.766 | 0.766 | 0.742 | 0.727 | 0.516 | 0.506 | 0.723 | 0.572 | 0.536 | 0.750 | 0.804 | 0.540 |
| (14.69) | (17.26) | (6.4) | (14.08) | (11.76) | (7.11) | (13.08) | (11.99) | (5.68) | (13.06) | (11.86) | (9.55) | |
| Log-Distance (α) | 1.059 | 1.002 | 1.225 | 1.103 | 1.205 | 0.867 | 1.072 | 1.210 | 1.225 | 0.997 | 0.973 | 0.626 |
| (11.69) | (9.96) | (5.04) | (6.99) | (5.90) | (1.61) | (7.15) | (5.42) | (2.15) | (7.44) | (9.12) | (1.16) | |
| Number of Cases | 175 | 150 | 39 | 139 | 146 | 52 | 164 | 141 | 33 | 133 | 142 | 60 |
| Log-Likelihood | −433.7 | −396.2 | −96.6 | −351.1 | −337.4 | −122.6 | −384.9 | −301.9 | −76.8 | −335.0 | −384.3 | −163.3 |
Appendix A.1.2. Multiple Imputation to Obtain Exact Values of Reported Distances
The distance intervals of the true distance were determined using the random heaping model described in the previous section. The true distance can be obtained using the reported distance values and the estimated parameters of the heaping model, as presented in Table A1. The simple rejection sampling approach, based on the work of Heitjan and Rubin [24], Drechsler and Kiesl [25], and Ann et al. [20] is used to conduct the imputation process. In this process, the estimated parameters of the heaping model, and the fixed observed data (), were used to derive values for ( for individuals subject to , confining to the plausible region defined by Equations (A3) and (A6) for each mode.
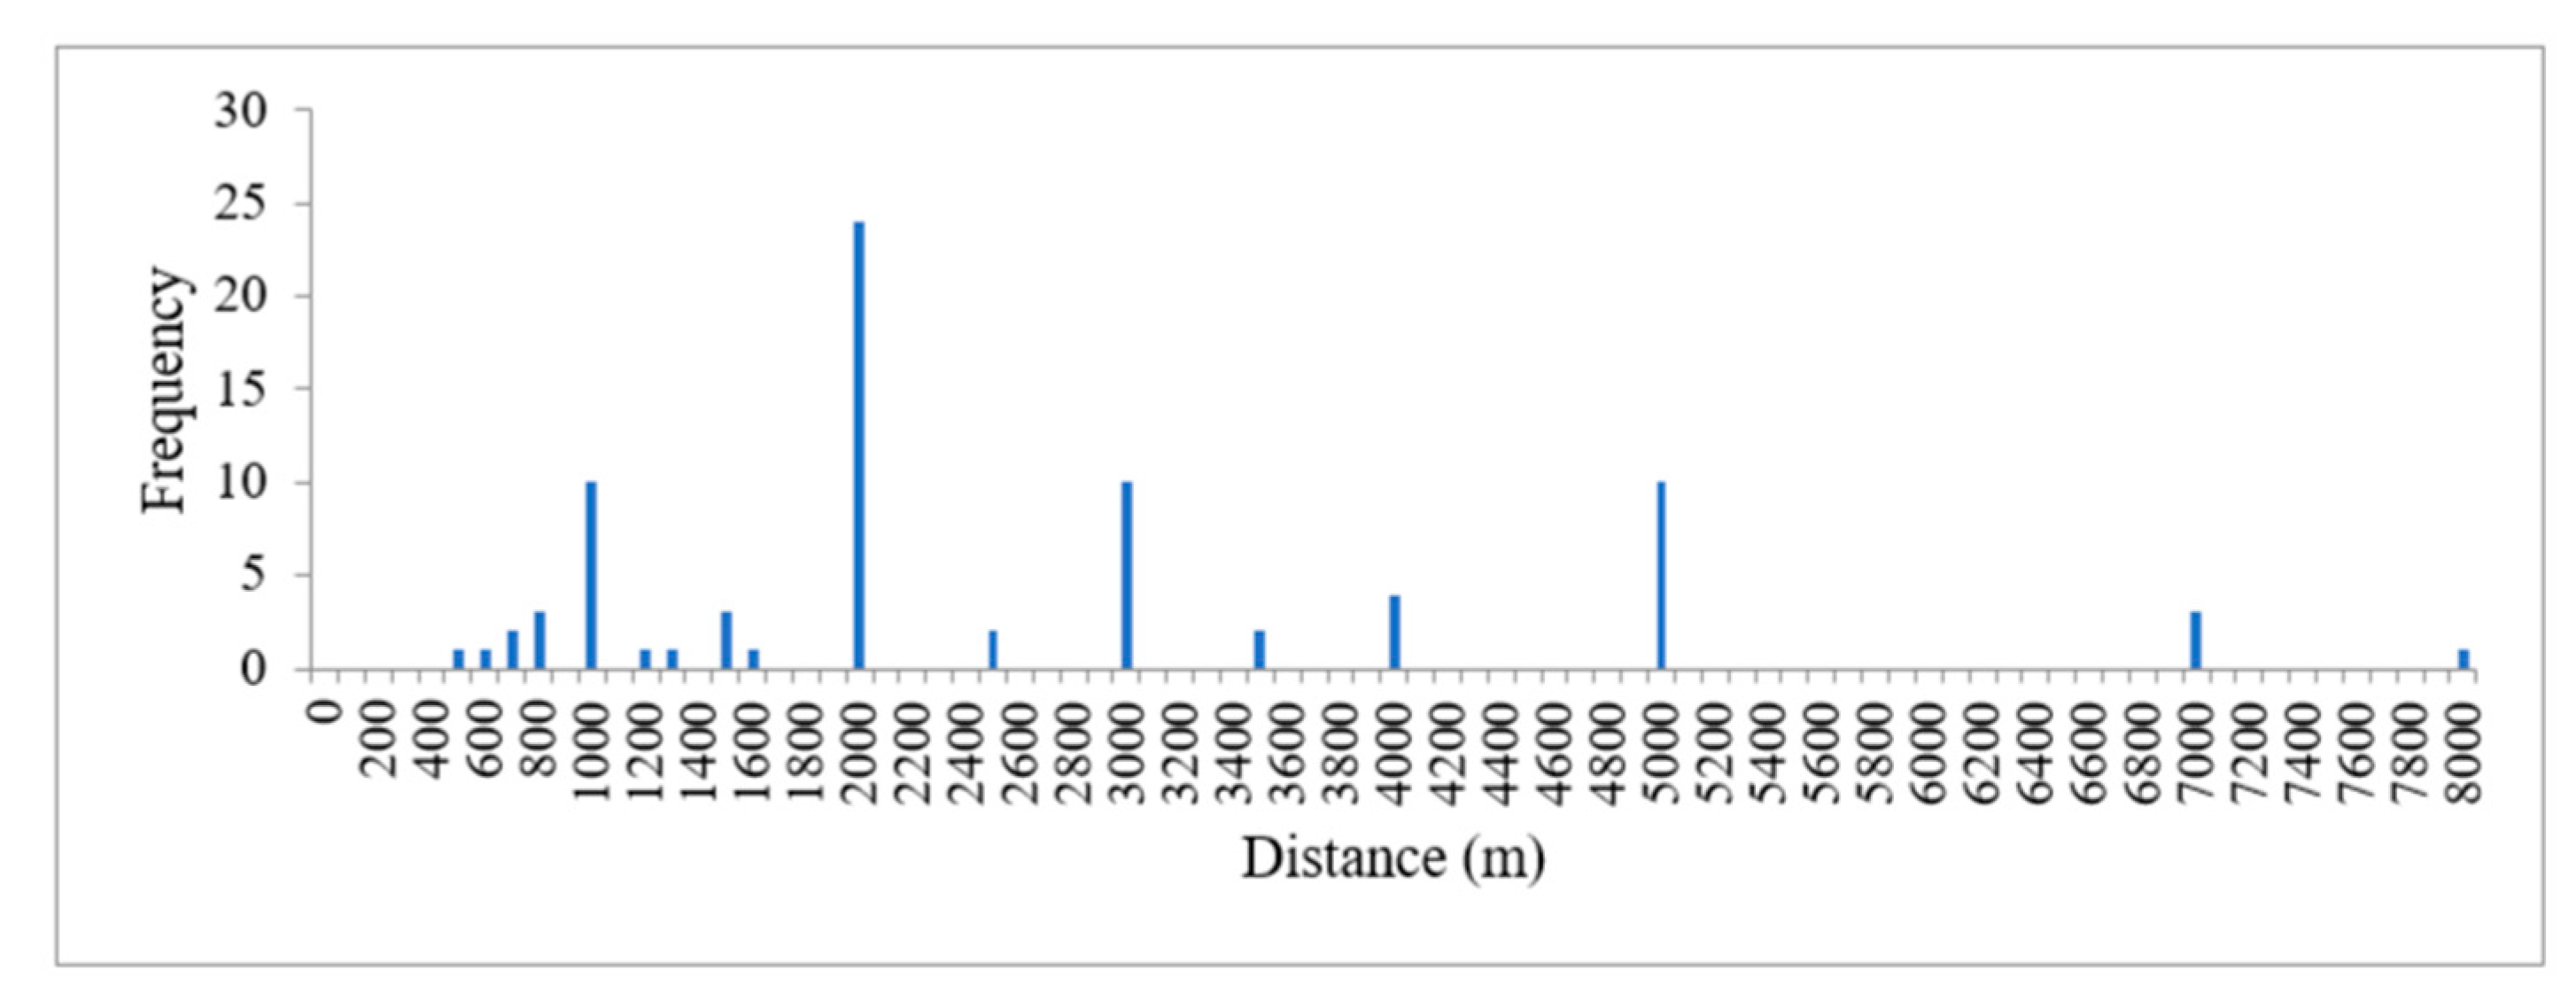
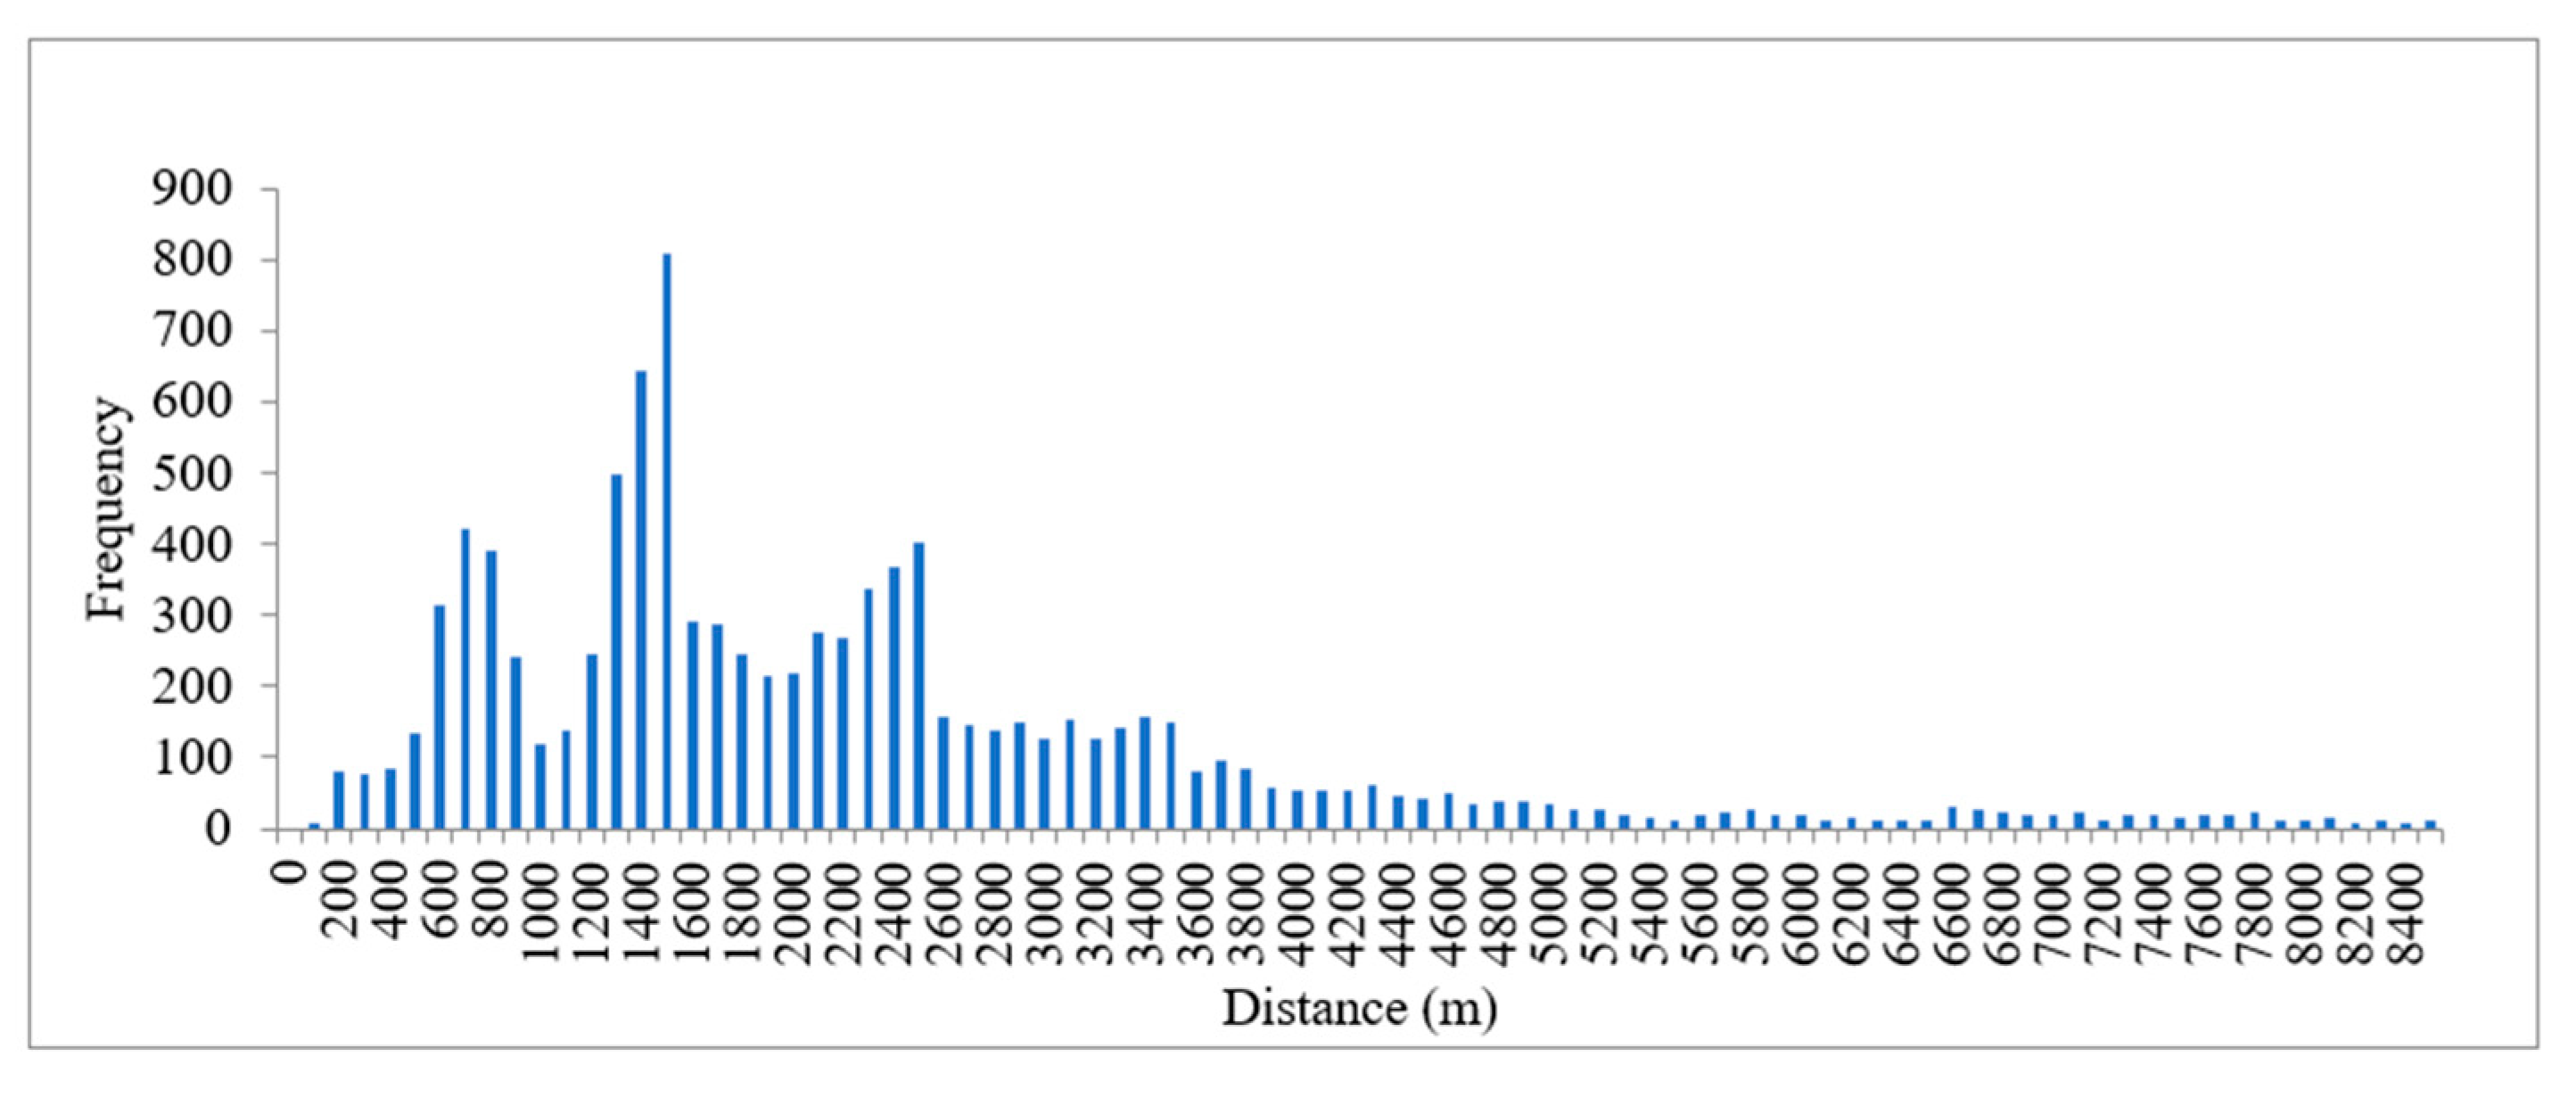
The candidate values were derived 1000 times from a truncated bivariate normal distribution and tested for boundary conditions to obtain the imputed data with 1000 points. Figure A1 and Figure A2 display the relative distribution of the distance data before and after imputation, respectively for informal modes at Karkardooma. It can be seen from these graphs that using the MI process, the shape of the distribution is maintained, and the heaping of the data is eliminated. Similar results were obtained for all stations for all modes.
Figure A1.
Histogram of distances travelled on informal modes for Karkardooma station (before imputation).
Figure A1.
Histogram of distances travelled on informal modes for Karkardooma station (before imputation).

Figure A2.
Histogram of distances travelled on informal modes for Karkardooma station (after imputation).
Figure A2.
Histogram of distances travelled on informal modes for Karkardooma station (after imputation).

References
- Andersen, J.; Landex, A. Catchment Areas for public transport. in urban transport xiv. In Urban Transport and the Environment in the 21st Century; WIT Press: Southampton, UK, 2008; pp. 175–184. [Google Scholar]
- Calthorpe, A. Transit-Oriented Development Design Guidelines; Resolution No. R-280480; Planning Department: San Diego, CA, USA, 1992.
- Calthrope, P. The Next American Metropolis: Ecology, Community and the American Dream; Princeton Architectural Press: Princeton, NJ, USA, 1993. [Google Scholar]
- Untermann, R.K. Accommodating the Pedestrian: Adapting Towns and Neighborhoods for Walking and Biking; Van Nostrand Reginhold: New York, NY, USA, 1984. [Google Scholar]
- Dittamar, H.; Ohland, G. The New Transit Town—Best Practices in Transit Oriented Development; Island Press: Washington, DC, USA, 2004. [Google Scholar]
- Cervero, R.; Bernick, M.; Jill, G. Market Opportunities and Barriers to Transit-Based Development in California (Working Paper); Transportation Center, The University of California: Berkeley, CA, USA, 1994. [Google Scholar]
- Bernick, M.; Cervero, R. Transit Villages for the 21st Century; McGraw Hill: New York, NY, USA, 1997. [Google Scholar]
- Guerra, E.; Cervero, R.; Tischler, D. The Half-Mile Circle: Does it best represent transit station catchments? Transp. Res. Board Natl. Acad. 2012, 2276, 101–109. [Google Scholar] [CrossRef]
- Flamm, B.J.; Rivasplata, C.R. Public transit Catchment areas—The curious case of cycle transit users. J. Transp. Res. Board 2014, 2419, 101–108. [Google Scholar] [CrossRef]
- MoUD. National Transit Oriented Development (TOD) Policy 2015; Government of India: New Delhi, India, 2015.
- UTTIPEC. Transit Oriented Development: Policy. Norms. Guidelines; Delhi Development Authority: New Delhi, India, 2012.
- Ann, S.; Jiang, M.; Yamamoto, T. Re-examination of the standards for transit oriented development influence zones in India—A literature review. J. Transp. Land Use 2019. under review. [Google Scholar]
- FTA. Final Policy Statement on Eligibility of Pedestrian and Bicycle Improvements—Summary, Federal Register—FTA–2009—0052; Federal Transit Authority: Washington, WA, USA, 2011.
- Lee, J.; Choi, K.; Leem, Y. Bicycle-based transit-oriented development as an alternative to overcome the criticisms of the conventional transit-oriented development. Int. J. Sustain. Transp. 2016, 10, 975–984. [Google Scholar] [CrossRef]
- Gil, J.; Read, S. Measuring Sustainable Accessibility Potential Using the Mobility Infrastructure’s Network Configuration. In Proceedings of the Eighth International Space Syntax Symposium, Santiago, Chile, 3–6 January 2012; pp. 1–19. [Google Scholar]
- Johar, A.; Jain, S.; Garg, P.; Gundaliya, P. A study for Commuter Walk Distance from Bus Stops to Different Destination along Routes in Delhi; European Transport, Issue 59; Institute for the Study of Transport within the European Economic Integration (ISTIEE): Trieste, Italy, 2015. [Google Scholar]
- O’Sullivan, S.; Morrall, J. Walking Distance to and from Light-Rail Transit station. Transp. Res. Rec. 1996, 1538, 19–26. [Google Scholar] [CrossRef]
- Gutiérrez, J.; Cardozo, O.D.; Garcia-Palomares, J.C. Transit ridership forecasting at station level: an approach based on distance-decay weighted regression. J. Trans. Geogr. 2011, 19, 1081–1092. [Google Scholar] [CrossRef]
- Zielstra, D.; Hochmair, H. Comaparative study of Pedestrian Accessibility to Transit Stations Using Free and Proprietary Network data. Transportation Research Record: J. Trans. Res. Board 2011, 2217, 145–152. [Google Scholar] [CrossRef]
- Ann, S.; Jiang, M.; Mothafer, G.; Yamamoto, T. Examination on the Influence Area of Transit-Oriented Development: Considering Multimodal Accessibility in New Delhi, India. Sustainability 2019, 11, 2621. [Google Scholar] [CrossRef]
- Zhao, F.; Chow, L.F.; Li, M.T.; Gan, A.; Ubaka, I. Forecasting transit walk accessibility: Regression model alternative to buffer method. Transp. Res. Rec. 2003, 1835, 34–41. [Google Scholar] [CrossRef]
- El-Geneidy, A.; Grimsrud, M.; Wasfi, R.; Tétreault, J.; Surprenant-Legault, J. New evidence on walking distances to transit stops: Identifying redundancies and gaps using variable service areas. Transportation 2014, 41, 193–210. [Google Scholar] [CrossRef]
- Hochmair, H.H. Assessment of bicycle service areas around transit stations. Int. J. Sustain. Transp. 2015, 9, 15–29. [Google Scholar] [CrossRef]
- Heitjan, D.F.; Rubin, D.B. Inference from coarse data via multiple imputation with application to age heaping. J. Am. Stat. Assoc. 1990, 85, 304–314. [Google Scholar] [CrossRef]
- Drechsler, J.; Kiesl, H. Beat the heap: An imputation strategy for valid inferences from rounded income data. J. Surv. Stat. Methodol. 2016, 4, 22–42. [Google Scholar] [CrossRef]
- Yamamoto, T.; Madre, J.L.; de Lapparent, M.; Collet, R. A random heaping model of annual Vehicle Kilometres Travelled considering heterogeneous approximation in reporting. Transportation 2018, 45, 1–19. [Google Scholar] [CrossRef]
- Larsen, L.; El-Geneidy, A.; Yasmin, F. Beyond the quarter mile: examining travel distances by walking and cycling, Montréal, Canada. Can. J. Urban Res. Can. Plan. Policy Suppl. 2010, 19, 70–88. [Google Scholar]
- Halas, M.; Klapka, P.; Kladivo, P. Distance-decay functions for daily travel-to-work flows. J. Transp. Geogr. 2014, 35, 107–119. [Google Scholar] [CrossRef]
- Chillon, P.; Panter, J.; Corder, K.; Jones, A.P.; Van Sluijs, E.M.F. A longitudinal study of the distance that young people walk to school. Health Place 2015, 31, 133–137. [Google Scholar] [CrossRef] [PubMed]
- Rodríguez-López, C.; Salas-Fariña, Z.M.; Villa-González, E.; Borges-Cosic, M.; Herrador-Colmenero, M.; Medina-Casaubón, J.; Ortega, F.B.; Chillón, P. The threshold distance associated with walking from home to school. Health Educ. Behav. 2017, 44, 857–866. [Google Scholar] [CrossRef] [PubMed]
- Chillon, P.; Molina-Garcia, J.; Castillo, I.; Queralt, A. What distance do university students walk and bike daily to class in Spain? J. Transp. Health 2016, 3, 315–320. [Google Scholar] [CrossRef]
- Ker, I.; Ginn, S. Myths and realities in walkable catchments: The case of walking and transit. Road Transp. Res. 2003, 12, 69. [Google Scholar]
Figure 1.
Survey locations in New Delhi; Image source—www.google.com/maps.
Figure 1.
Survey locations in New Delhi; Image source—www.google.com/maps.

Figure 2.
Aerial shots of station areas showing surrounding built up areas: (a) Karkardooma, (b) Dwarka Mor, (c) Lajpat Nagar and (d) Vaishali.
Figure 2.
Aerial shots of station areas showing surrounding built up areas: (a) Karkardooma, (b) Dwarka Mor, (c) Lajpat Nagar and (d) Vaishali.


Figure 3.
The share of last mile modes across the stations.

Figure 4.
The distribution of reported distances for access by walking for Dwarka Mor.

Figure 5.
The distribution of distances (after imputation) travelled for Lajpat Nagar on various modes (walking, informal modes and bus and private modes).
Figure 5.
The distribution of distances (after imputation) travelled for Lajpat Nagar on various modes (walking, informal modes and bus and private modes).

Figure 6.
The distance decay curves for informal modes at Lajpat Nagar.

Figure 7.
The distance decay curves (compound power exponential form) for all modes for (a) Karkardooma, (b) Dwarka Mor, (c) Lajpat Nagar and (d) Vaishali.
Figure 7.
The distance decay curves (compound power exponential form) for all modes for (a) Karkardooma, (b) Dwarka Mor, (c) Lajpat Nagar and (d) Vaishali.


Figure 8.
The ROC curves for walking for (a) Karkardooma, (b) Dwarka Mor, (c) Lajpat Nagar and (d) Vaishali.
Figure 8.
The ROC curves for walking for (a) Karkardooma, (b) Dwarka Mor, (c) Lajpat Nagar and (d) Vaishali.

Table 1.
The estimation results of the distance decay functions (Model 1: Exponential form; Model 2: Compound power exponential form).
Table 1.
The estimation results of the distance decay functions (Model 1: Exponential form; Model 2: Compound power exponential form).
| Modes | Estimate of Parameters | Karakardooma (Urban Regional Center) | Dwarka Mor (Subcity) | Lajpat Nagar (Central City) | Vaishali (Outer City) | ||||
|---|---|---|---|---|---|---|---|---|---|
| Model 1 | Model 2 | Model 1 | Model 2 | Model 1 | Model 2 | Model 1 | Model 2 | ||
| Walking | (t-stat) | 1.1491 (56.75) | 1.3838 (133.18) | 1.0820 (37.94) | 1.3836 (107.43) | 1.1786 (43.34) | 1.5242 (69.21) | 1.081(43.33) | 1.3019 (111.51) |
| (t-stat) | - | 1.4991 (110.47) | - | 1.9062 (82.41) | - | 1.7681 (55.54) | - | 1.648 (84.45) | |
| Correlation Coefficient | 0.996 | 0.998 | 0.988 | 0.999 | 0.988 | 0.997 | 0.990 | 0.999 | |
| Residual Standard Error | 0.019 | 0.005 | 0.024 | 0.005 | 0.024 | 0.009 | 0.017 | 0.005 | |
| Sample Size | 139 | 139 | 175 | 175 | 164 | 164 | 133 | 133 | |
| Informal Modes | (t-stat) | 0.3863 (41.40) | 0.2322 (61.35) | 0.2816 (28.23) | 0.0659 (40.08) | 0.3098 (30.04) | 0.1052 (41.82) | 0.1936 (49.57) | 0.1126 (24.60) |
| (t-stat) | - | 1.7449 (84.11) | - | 2.4243 (104.74) | - | 2.2017 (88.53) | - | 1.424 (48.51) | |
| Correlation Coefficient | 0.988 | 0.998 | 0.990 | 0.998 | 0.989 | 0.998 | 0.988 | 0.990 | |
| Residual Standard Error | 0.012 | 0.003 | 0.022 | 0.003 | 0.019 | 0.003 | 0.007 | 0.004 | |
| Sample Size | 146 | 146 | 150 | 150 | 141 | 141 | 142 | 142 | |
| Bus and Private Modes | (t-stat) | 0.1958 (41.40) | 0.0641 (61.35) | 0.1152 (28.23) | 0.0279 (40.08) | 0.172 (30.04) | 0.0269 (41.82) | 0.1117 (49.57) | 0.0159 (24.60) |
| (t-stat) | - | 1.7713 (84.11) | - | 1.7479 (104.74) | - | 2.2388 (88.53) | - | 2.018 (48.51) | |
| Correlation Coefficient | 0.991 | 0.997 | 0.996 | 0.993 | 0.995 | 0.998 | 0.988 | 0.988 | |
| Residual Standard Error | 0.007 | 0.002 | 0.007 | 0.003 | 0.008 | 0.001 | 0.010 | 0.004 | |
| Sample Size | 52 | 52 | 39 | 39 | 33 | 33 | 60 | 60 | |
Table 2.
Summary of travel distances for walking (m).
| Karkardooma (Urban Regional Center) | Dwarka Mor (Subcity) | Lajpat Nagar (Central City) | Vaishali (Outer City) | |||||
|---|---|---|---|---|---|---|---|---|
| Imputed Dataset | Decay Function | Imputed Dataset | Decay Function | Imputed Dataset | Decay Function | Imputed Dataset | Decay Function | |
| Minimum | 50 | - | 50 | - | 50 | - | 50 | - |
| Maximum | 2500 | - | 2500 | - | 2497 | - | 3498 | - |
| Mean | 700 | 800 | 800 | 800 | 700 | 800 | 800 | 900 |
| Median | 600 | 600 | 700 | 700 | 700 | 600 | 700 | 700 |
| 70th percentile | 900 | 900 | 900 | 900 | 800 | 900 | 900 | 1000 |
| 75th percentile | 1000 | 1000 | 1000 | 1000 | 900 | 900 | 1000 | 1000 |
| 80th percentile | 1100 | 1100 | 1000 | 1100 | 1000 | 1000 | 1200 | 1100 |
| 85th percentile | 1300 | 1200 | 1200 | 1200 | 1100 | 1100 | 1200 | 1300 |
| 90th percentile | 1600 | 1400 | 1400 | 1300 | 1300 | 1300 | 1500 | 1400 |
Table 3.
Summary of travel distances for informal modes (m).
| Karkardooma (Urban Regional Center) | Dwarka Mor (Subcity) | Lajpat Nagar (Central City) | Vaishali (Outer City) | |||||
|---|---|---|---|---|---|---|---|---|
| Imputed Dataset | Decay Function | Imputed Dataset | Decay Function | Imputed Dataset | Decay Function | Imputed Dataset | Decay Function | |
| Minimum | 87 | - | 650 | - | 266 | - | 751 | - |
| Maximum | 8499 | - | 7495 | - | 7482 | - | 17474 | - |
| Mean | 2200 | 2300 | 2800 | 3100 | 2600 | 2800 | 4700 | 4600 |
| Median | 1800 | 1900 | 2600 | 2600 | 2300 | 2400 | 3300 | 3600 |
| 70th percentile | 2500 | 2600 | 3300 | 3300 | 3000 | 3000 | 5000 | 5300 |
| 75th percentile | 2700 | 2800 | 3400 | 3500 | 3200 | 3200 | 5800 | 5800 |
| 80th percentile | 3100 | 3000 | 3600 | 3700 | 3400 | 3500 | 7400 | 6500 |
| 85th percentile | 3400 | 3300 | 4000 | 4000 | 3800 | 3700 | 8700 | 7300 |
| 90th percentile | 4100 | 3700 | 4400 | 4300 | 4500 | 4100 | 11800 | 8300 |
Table 4.
Summary of travel distances for bus and private modes (m).
| Karkardooma (Urban Regional Center) | Dwarka Mor (Subcity) | Lajpat Nagar (Central City) | Vaishali (Outer City) | |||||
|---|---|---|---|---|---|---|---|---|
| Imputed Dataset | Decay Function | Imputed Dataset | Decay Function | Imputed Dataset | Decay Function | Imputed Dataset | Decay Function | |
| Minimum | 258 | - | 1506 | - | 1253 | - | 1006 | - |
| Maximum | 12,083 | - | 17,496 | - | 12,371 | - | 17,489 | - |
| Mean | 4100 | 4700 | 7000 | 7800 | 4600 | 5000 | 7100 | 7800 |
| Median | 4100 | 3800 | 5800 | 6300 | 4300 | 4300 | 6100 | 6500 |
| 70th percentile | 5000 | 5200 | 8600 | 8600 | 5500 | 5500 | 8300 | 8500 |
| 75th percentile | 5500 | 5700 | 9900 | 9300 | 5800 | 5800 | 8900 | 9200 |
| 80th percentile | 6400 | 6200 | 11,300 | 10,200 | 6200 | 6200 | 10,600 | 9900 |
| 85th percentile | 7000 | 6800 | 12,200 | 11,200 | 6900 | 6700 | 12,100 | 10,700 |
| 90th percentile | 7600 | 7600 | 13,100 | 12,500 | 7900 | 7300 | 12,800 | 11,800 |
Table 5.
The estimation results of the receiver operating characteristic (ROC) for walking for various station types.
Table 5.
The estimation results of the receiver operating characteristic (ROC) for walking for various station types.
| ROC Analysis | Karkardooma (Urban Regional Center) | Dwarka Mor (Subcity) | Lajpat Nagar (Central City) | Vaishali (Outer City) |
|---|---|---|---|---|
| Maximum Youden Index | −0.575 | −0.798 | −0.767 | −0.763 |
| Threshold (m) | 1200 | 1300 | 1200 | 1300 |
| AUC | 0.832 | 0.928 | 0.939 | 0.958 |
| Observations N | 26 | 26 | 26 | 36 |
© 2019 by the authors. Licensee MDPI, Basel, Switzerland. This article is an open access article distributed under the terms and conditions of the Creative Commons Attribution (CC BY) license (http://creativecommons.org/licenses/by/4.0/).
Share and Cite
MDPI and ACS Style
Ann, S.; Jiang, M.; Yamamoto, T. Influence Area of Transit-Oriented Development for Individual Delhi Metro Stations Considering Multimodal Accessibility. Sustainability 2019, 11, 4295. https://doi.org/10.3390/su11164295
AMA Style
Ann S, Jiang M, Yamamoto T. Influence Area of Transit-Oriented Development for Individual Delhi Metro Stations Considering Multimodal Accessibility. Sustainability. 2019; 11(16):4295. https://doi.org/10.3390/su11164295
Chicago/Turabian StyleAnn, Sangeetha, Meilan Jiang, and Toshiyuki Yamamoto. 2019. "Influence Area of Transit-Oriented Development for Individual Delhi Metro Stations Considering Multimodal Accessibility" Sustainability 11, no. 16: 4295. https://doi.org/10.3390/su11164295
Note that from the first issue of 2016, this journal uses article numbers instead of page numbers. See further details here.