Biowaste Management in Italy: Challenges and Perspectives


DIATI, Politecnico di Torino, corso Duca degli Abruzzi 24, 10129 Torino, Italy
*
Author to whom correspondence should be addressed.
Sustainability 2019, 11(15), 4213; https://doi.org/10.3390/su11154213
Submission received: 5 July 2019
/
Revised: 30 July 2019
/
Accepted: 1 August 2019
/
Published: 4 August 2019
(This article belongs to the Special Issue Advances in Biorefining of Biowaste)
Abstract
:The aim of this work is the development of a methodology for the technical and environmental assessment of biowaste valorization in 2G biorefineries. Italy was chosen as case study, considering years 2016–2017. Approach: the Italian context was evaluated through the following key parameters: Gross domestic power, climate, demography, and population density distribution described the Italian framework. The four most abundant biowaste categories were defined through their amounts and geo-localization: wastewater and sewage sludge (WSS, 4.06 Mt/y), organic fraction of municipal solid waste (OFMSW, 1.7 Mt/y), agricultural livestock waste (ALW, 5.7 Mt/y), and waste deriving from the food industry (FIW, 2.6 Mt/y). The geo-localization and quantitative evaluations of the available biowaste amounts were aimed at defining the dimension and localization of the biorefinery plant and at optimizing supply and transport chains, while the qualitative characteristic were aimed to evaluate the most promising process among thermo-valorization (TH) and anaerobic digestion (AD). Results: All considered biowastes were appropriate for biorefinery processes, since carbon content exceeds 40% and the carbon–nitrogen ratio was between 10 and 30. All biowaste categories were evaluated as feedstocks for two biorefinery processes: anaerobic digestion (AD) and thermo-valorization (TH) with energy recovery. Compared to TH, AD achieved in all cases the best performances in terms of produced energy and avoided CO2 emissions. The primary energy production of AD and TH for WSS, OFMSW, ALW, and FIW were respectively: 7.89 vs. 2.4 kWh/kg; 8.7 vs. 2.6 kWh/kg; 10.85 vs. 5.5 kWh/kg; and 12.5 vs. 7.8 kWh/kg. The main findings of this work were: the adoption of AD was technically more suitable than TH; AD increased the avoided CO2 emissions of 10%–89.9% depending on biowaste category.
1. Introduction
Currently, our society depends on fossil fuels for the production of over 80% of energy and 90% of platform chemicals [1]. The fossil fuel consumption entails greenhouse gas (GHGs) emissions, depletion of non-renewable resources and increase of extraction costs and purchase of fuels. At the same time, the global consumption of energy and platform chemicals raises of 7% every year, due to demographic increase and consumption trends [2]. EU policies are boosting the transition from linear to circular economy through the employment of renewable resources according to sustainable production and consumption criteria. In the last decades these concepts found their roots in green chemistry [3] and white biotechnology [4]. In 2015 EU joined the 2030 Agenda, which established 17 sustainable development goals (SDGs) related to socio-economic and health issues, clean energy and water, climate change mitigation, responsible production, and consumption. The SDGs concerning climate change mitigation and energy use are: GHG reduction equal to 40% of the levels of 1990; at least 27% of the used energy has to come from renewable energy and 27% energy savings compared to current situation [5]. The main contributes to GHG emissions are from Asia (30%), USA (15%), Europe (10%), and India (6.5%) [6].
In this context, biorefinery systems play a key role. Biorefineries are technological processes able to convert biomass into a market spectrum of high added-value products as platform chemicals and energy. On the grounds of biomass origin, biorefineries are classified into 1G, 2G and 3G (where G stands for generation), respectively referring to ad hoc produced biomasses, waste biomasses and algae. Every year around 50 billion tons of biomasses are produced in the world [7]. Biomasses may be classified in three main categories: lignocellulosic, lipidic and sugary. They are resources with significant growth in the short and long term, and their uses for chemicals and energy production are a consolidated reality in Europe [8].
The aim of this study is the proposal of a methodology for the assessment of biowaste potential in 2G biorefinery systems in the Italian context. Italy was chosen as case study, considering years 2016–2017. This two-year period was chosen because of the availability and completeness of data. Four categories of biowaste were considered: wastewater and sewage sludge (WSS), organic fraction of municipal solid waste (OFMSW), agricultural–livestock waste (ALW), and waste deriving from the food industry (FIW). The novelty of the proposed methodology consisted in the combination of technical and environmental assessments into the following seven phases, performed in sequence: (1) definition of the case study framework; (2) quantitative evaluation and geo-localization of available biowaste; (3) physico–chemical evaluation of biowaste; (4) analysis of present biowaste management; (5) quantitative assessment of the valorization of biowaste through two biorefinery processes: Anaerobic digestion (AD) and thermal valorization (TH); (6) comparison between present and proposed biowaste management perspectives on the grounds of CO2 emissions; (7) analysis of 2G full-scale biorefinery systems in the case study framework. In this study most attention was focused on energy production, since transport and heat sectors are strongly influenced by the local economic framework [3,9].
Biorefinery and biowaste valorization are hot topics in scientific literature and nowadays reality. From 2016 to 2019, in Science Direct are available: 159 research articles, 59 book chapters, 39 review articles and 3 encyclopedia, with a percentage enhancement of publications from 2016 to 2019 of 44%. The works available in Scientific literature concerned valorization of biowaste of different origins and structure, mostly at lab or pilot scale, focusing for 30% on specific biowaste stream, 45% lab process parameter control and 25% on generable products. Our work is unique, because it is the combination of scientific literature achievements and real biorefinery cases. The progress with respect of the most recent state-of-the-art and similar case studies are: (1) the specific focus on two mature biorefinery processes: thermo-valorization (TH) and anaerobic digestion (AD), adopting the scientific upgrade to study, analyze and improve the full-scale biorefinery systems available in Italy (Section 3.6); (2) furthermore, TH and AD yields and efficiencies were calculated, both from technical and environmental perspectives, referring to biowaste, which can be collectable and available according to Italian regions and climate. The characteristic of uniqueness of the proposed work is the attempt to build a bridge between scientific research and real biorefinery systems. In fact, the geo-localization and quantitative evaluations of the available biowaste amounts were aimed at defining the dimension and localization of the necessary biorefinery plant and at optimizing supply and transport chains, while qualitative evaluation was aimed to evaluate the most promising process between AD and TH. The Italian real case studies are reported in Section 3.6 and they were studied considering the main achievement of TH and AD reached at the moment. To our knowledge, this work is the first to quantitatively assess the perspectives for the adoption of Circular Economy strategies in Italy about biowaste management. These strategies have to be applied both in urban and in industrial systems, converting biowaste, which are mostly perceived as underestimated low-value side streams, into more valuable product and energy. The generation of energy and various commodities in a combined approach addressing sustainability is the challenge and key-driver for Europe [10].
2. Materials and Methods
2.1. Case Study Framework
The present study was carried out in Italy, which was analyzed under three complementary perspectives: geographical and climate areas division, by means of Köppen classification [11]; demographic distribution, described through national reference statistics [12] based on years 2016–2017; economic development, considering gross domestic product (GDP), which measure the income and output for a given country’s economy and it is equal to the total expenditures for all final goods and services produced within the country in a defined period of time, usually 1 year [9,13]. The maps in Figure 1 were drawn with DataWrapper, an open source map-creator software.
2.2. Biowaste Quantitative Analysis and Geo-Localization
The available quantity of biowaste was the key parameter to define the size of the biorefinery process and the amount of generable products. The quantitative analysis of biowaste was based on national and EU databases referring to years 2016–2017 [14,15,16,17,18,19,20]. Four bio-waste categories, defined according to EU Commission Decision 2000/532/EC and Eurostat—ISPRA (Istituto Superiore per la Protezione e per la Ricerca Ambientale) databases classification, were selected: wastewater and sewage sludge (WSS), organic fraction of municipal solid waste (OFMSW), agricultural livestock waste (ALW), and waste deriving from the food industry (FIW). Collection and transport costs were evaluated from technical, economic, and environmental perspectives.
2.3. Biowaste Qualitative Analysis: Physico–Chemical Features
The qualitative description of biowaste categories was performed through elemental analysis, total solids (TS), and volatile solids (VS) data deriving from the critical analysis of 21 reviews and research papers (see Table 1). The qualitative analysis was carried on 14 biowaste flows, defined most representative of the four considered categories: wastewater and sewage sludge (WSS); organic fraction of municipal solid waste (OFMSW); rice waste, animal manure, corn and wheat waste, fruit and vegetable from agro-waste (for ALW); winery waste, milking waste from animal, dairy waste, slaughter waste, processed candies waste, olives and oil waste, processed fruit and vegetable waste, and spent coffee grounds (for FIW).
2.4. Current Biowaste Management
2.5. Technical and Environmental Analysis of Biowaste Valorization through Biorefineries Processes
Considering the importance of clean energy production and GHG emissions reduction in SDGs, this work investigated the technical feasibility and the environmental impacts of two biorefinery systems for biowaste valorization: anaerobic digestion (AD) and thermo-valorization (TH). The technical assessment consisted in the evaluation of the amount of primary energy theoretically produced from stoichiometric evaluations, while the environmental assessment consisted in the evaluation of CO2 equivalent emissions and avoided CO2 emissions, referring to 1 kg of biowaste. About AD, the specific biogas production (SBP) and methane (CH4) were calculated by means of Buswell and Neave equations, from the elementary composition of the biowaste to be fed in the AD process, it is possible to determine the maximum theoretical production of biogas and methane. It was assumed that 1 nm3 of methane produces 10.5 kWh of primary energy. While for TH, the lower heating values (LHV) of the 14 biowaste flows were considered. CO2 equivalent emissions were calculated directly from AD and TH processes, modeled with stoichiometric reactions, while the avoided CO2 emissions were calculated by means the conversion factor equal to 0.44 t CO2 emitted per MWh produced, defined for Italy and central EU-28 [21,22].
2.6. Full-Scale Biorefinery Systems in Italy
The most important five Italian biorefinery systems were described and geo-referred: a chemical biorefinery system [23]; two biological biorefinery systems [24,25]; and two thermo–chemical biorefinery systems [26,27]. The data were derived from the Internet sites and public sustainability reports of the companies managing the above-mentioned installations.
3. Results and Discussion
3.1. Case Study Framework
Italy is a peninsula extending between the 36th and 47th north parallels, divided into three-macro areas: north, center, and south, with a total of 20 regions (Figure 1A). The regions are located as follows: Eight in the north (Liguria, Piemonte, Lombardia, Valle d’Aosta, Emilia Romagna, Friuli-Venezia-Giulia, Trentino-Alto-Adige, and Veneto), four in the center (Lazio, Marche, Toscana, and Umbria) and 6 in the south (Abruzzo, Campania, Calabria, Basilicata, Molise, and Puglia), plus two major islands (Sicilia and Sardegna). According to the Köppen classification, ten climate categories were identified for Italy (Figure 1B) and the general climate trends are: humid temperate in the north of Italy, and Mediterranean climate with dry summer period in the center, south, and the Islands.
In 2017, Italian population was equal to 60.6 M inhabitants, with the following partition: 48.6% male and 51.4% female [12]. The most and the least populated regions were Lombardia and Valle d’Aosta, respectively with 10 M and 127 k inhabitants [12] (Figure 1C). Italy was the 5th most populated country of EU-28, accounting an average of 201 inhabitants/km2. The most and least density populated regions were Lombardia and Valle d’Aosta, with respectively 420 inhabitants/km2 and 39 inhabitants/km2 [12].
3.2. Biowaste Quantitative Analysis and Geo-Localization
The geo-localization and quantitative evaluations of the available biowaste amounts were aimed at defining the dimension and localization of the biorefinery plant and at optimizing supply and transport chains. In Italy and EU-28, the Commission Decision 2000/532/EC and Technical Guidance on the classification of waste (2018/C 124/01) classified waste on the grounds of the activity from which they were produced: residential, commercial, public, construction and demolition, public services, treatment plants, industrial, agriculture.
The methodology here presented defined four main biowaste categories, according to EU Waste Directive and European Policies, Eurostat and ISPRA databases, as defined in Section 2.2.
WSS enclosed 3 types of waste flows: WSS from urban wastewater treatment plants (CER 190805); not hazardous WSS from industrial wastewater treatment plants (CER 190812 and 190814); hazardous WSS from industrial wastewater treatment plants (CER 190811* and 190813*) (Figure 2). The biowaste amounts were expressed as average value plus/minus standard deviation, taking into account of the considered period of time. In 2016, WSS total production in Italy was 4.06 Mt/y [17,28]. All regions exhibited the same trend: the highest production concerned WSS from urban wastewater, followed by not hazardous WSS and then hazardous WSS (Figure 2), respectively with 3.2 Mt/y, 0.81 Mt/y, and 0.07 Mt/y. These trends are consistent with EU-28 WSS production of middle—high income countries [29,30], witnessing both the significance of Italy as case study, and the social-economic development for wastewater management system, related to SDG no. 6. In Italy, the highest and lowest productions of WSS were respectively recorded in Lombardia (1.14 Mt/y) and in Valle d’Aosta (0.008 Mt/y). Here, the different amounts of produced WSS were due to fact that Valle d’Aosta had lower dimension and density population compared to other Italian regions. Valle d’Aosta had trend comparable to Luxemburg [14,15].
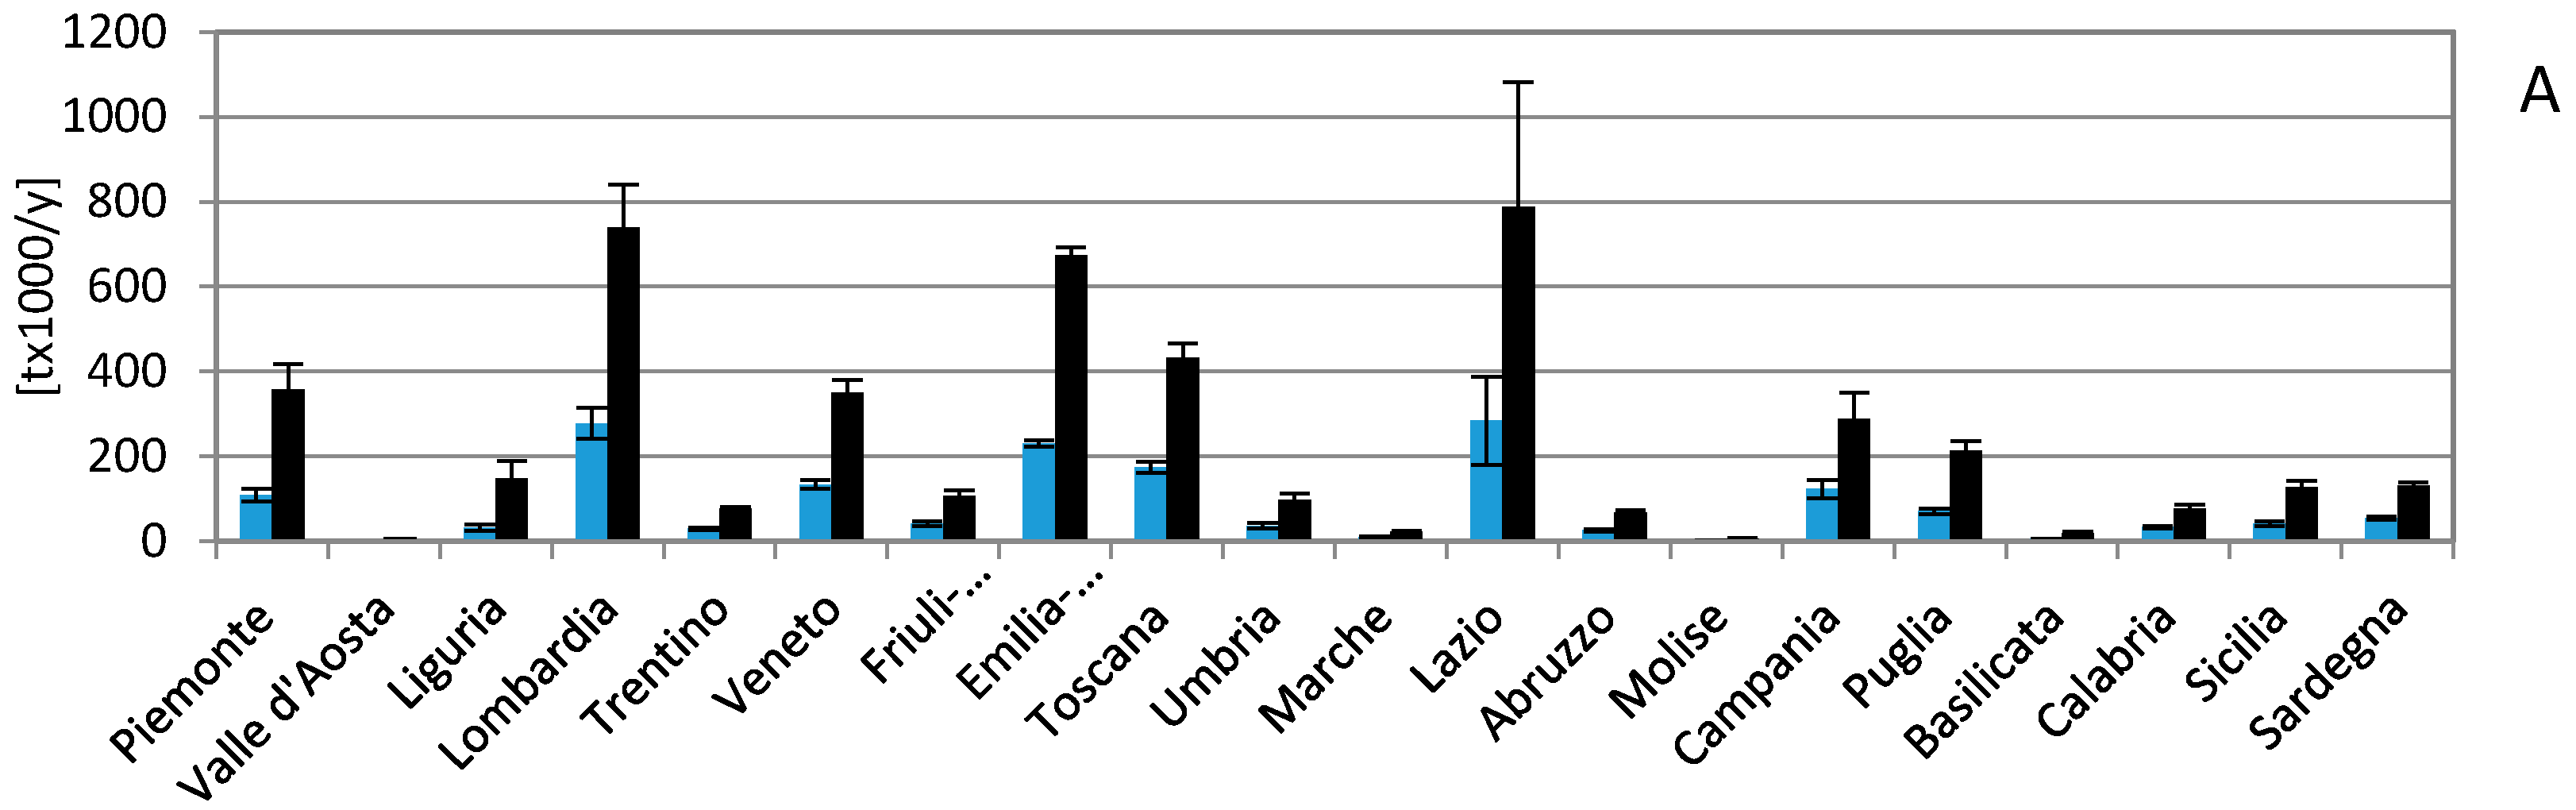
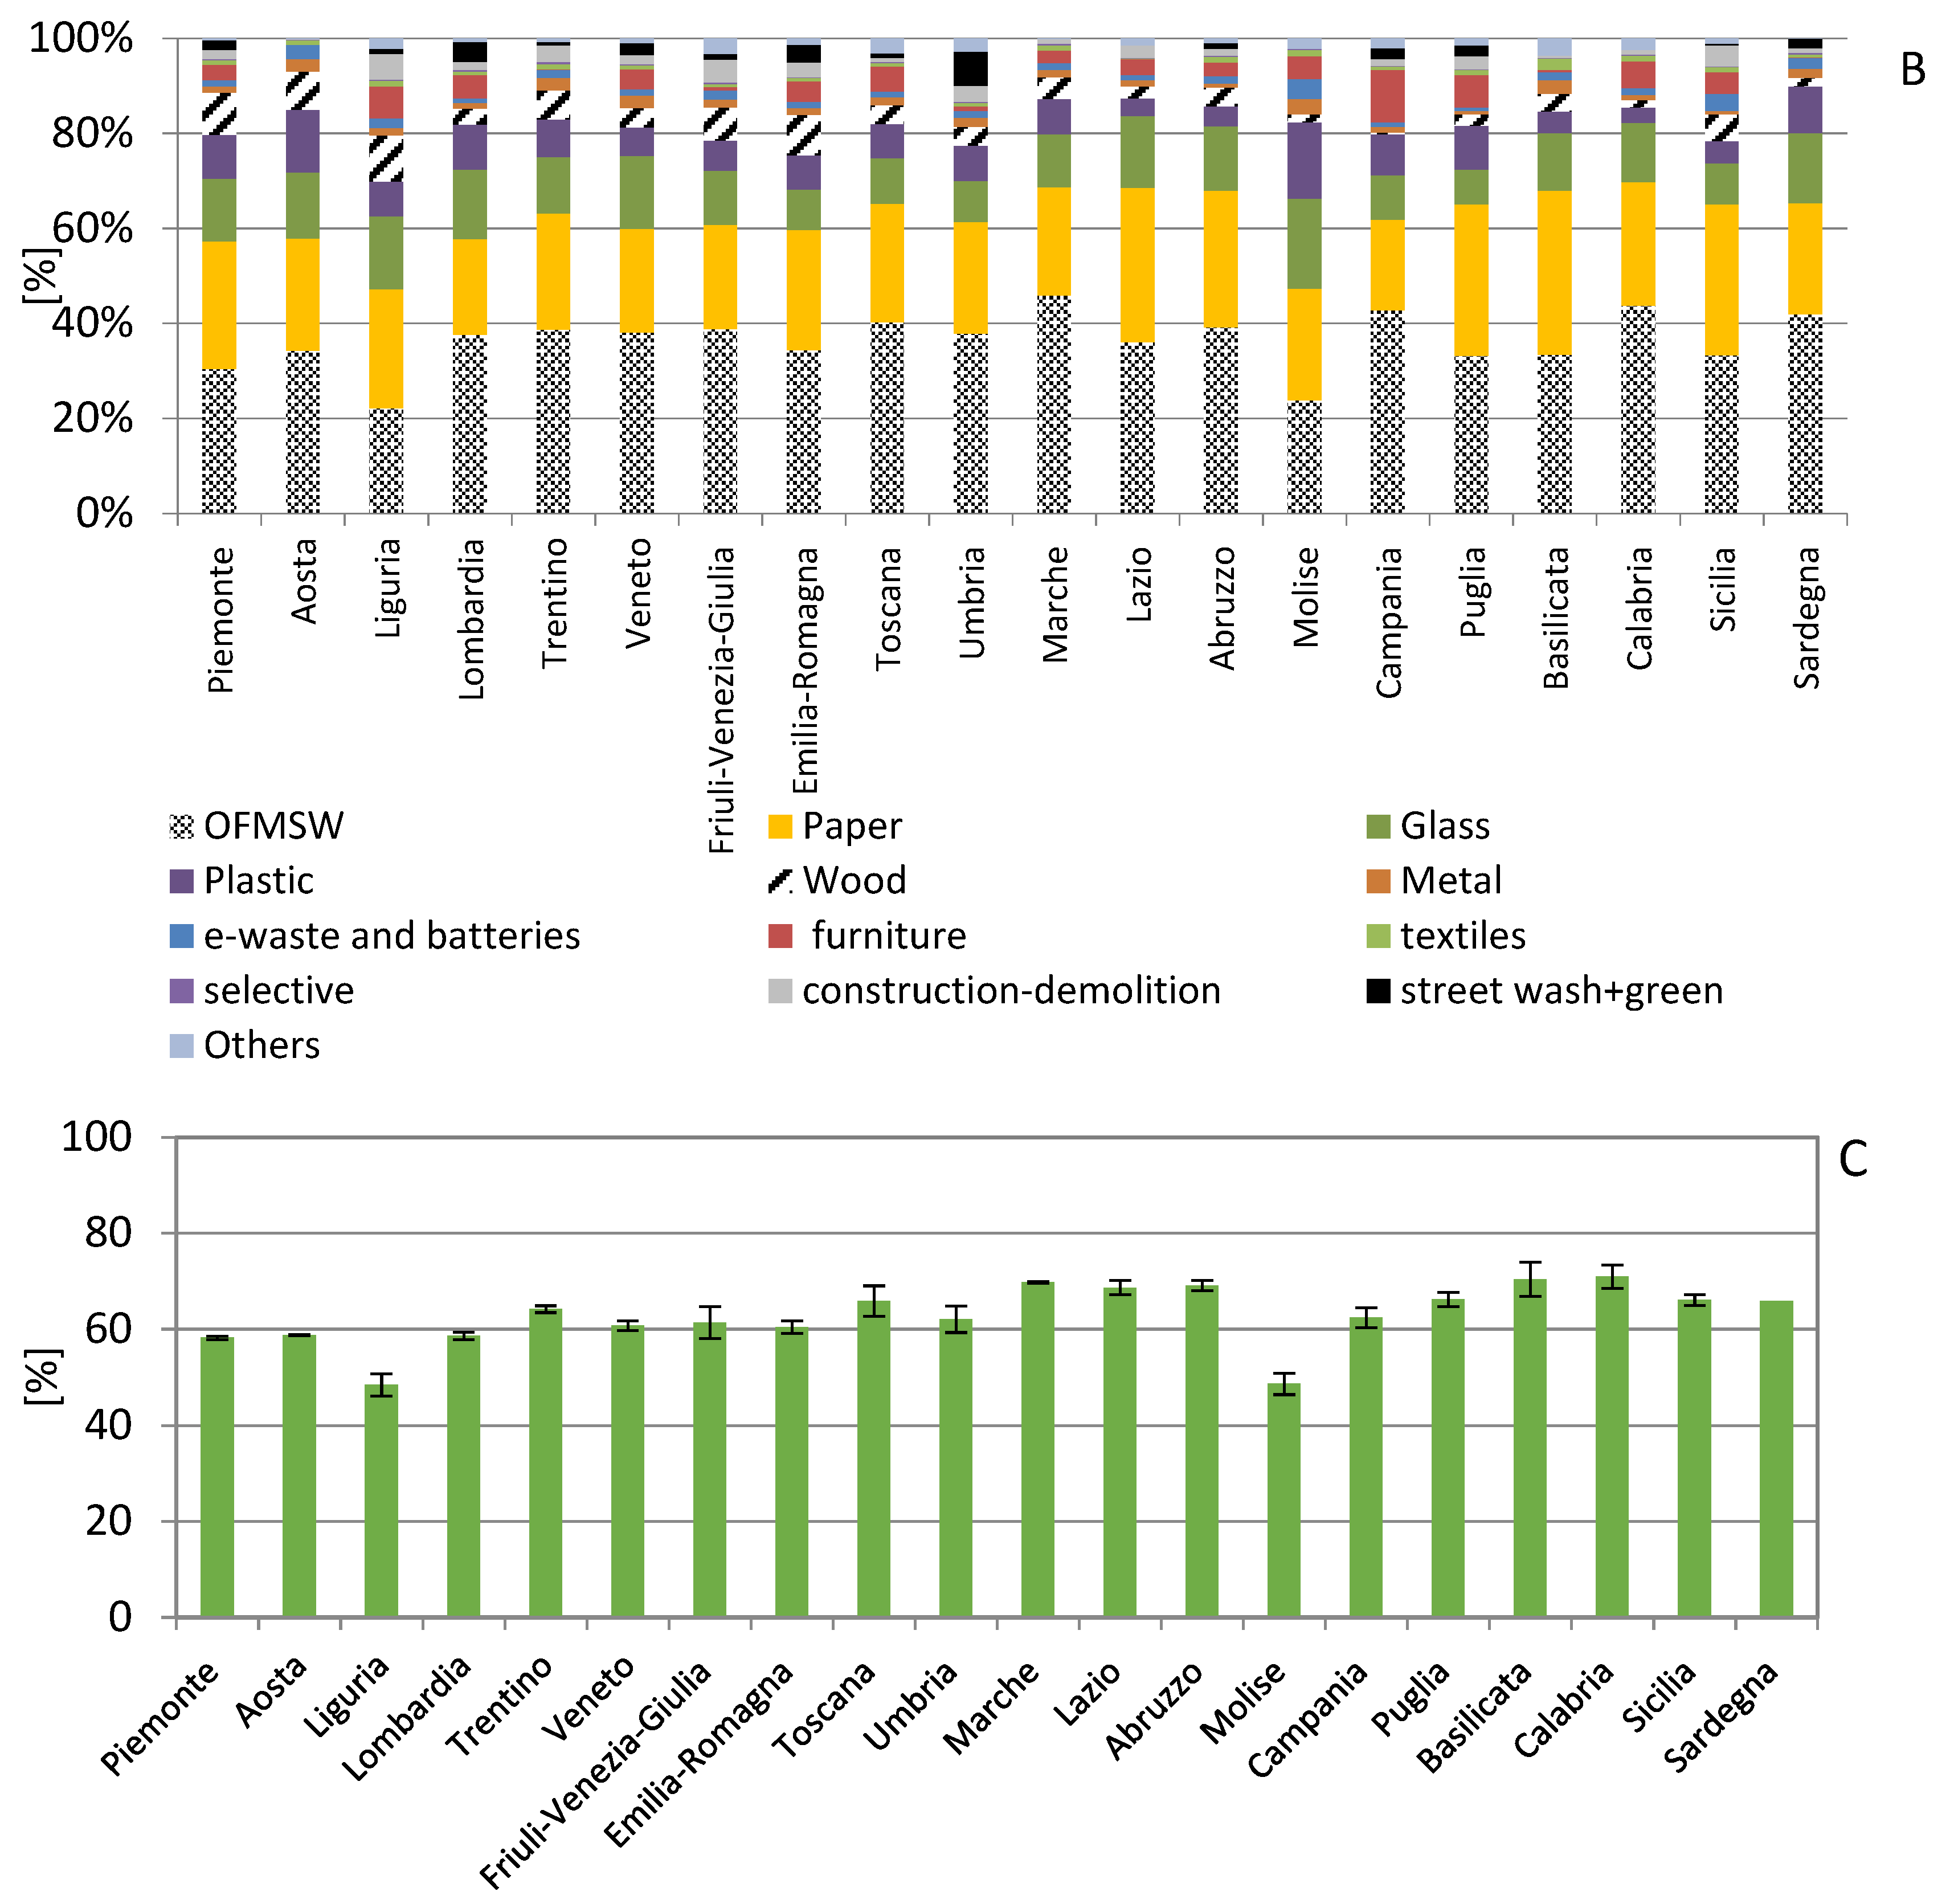
OFMSW is a sub-category of municipal solid waste (MSW). According to US Environmental Protection Agency (EPA), MSW is composed of plastic (product packaging), grass clippings and OFMSW, large furniture, clothing, glass (bottles and cans), paper, appliances, e-waste, and batteries. MSW derive from households, hospitals, schools, small business activities, and bars/restaurants [31]. EPA’s definition of MSW does not include sludge from municipal wastewater treatment, waste from industrial processes, end-of-life vehicles, ash from MSW combustion, construction and demolition waste. In 2016, the total amount of OFMSW in Italy was 1.7 ± 0.25 Mt/y [17]. The amounts of MSW and OFMSW (Figure 3A) and the percentages of specific waste streams (Figure 3B) allowed to calculate the amount of biodegradable matter in MSW and furthermore the perspectives to exploit this fraction together with OFMSW.
Lazio reached the highest production of MSW and OFMSW (283.95 × 10³ t/y ± 103.63), followed by Lombardia (277.87 × 10³ t/y ± 37.12) and Emilia-Romagna (230.92 × 10³ t/y ± 7.61), exhibiting trends similar to Germany, Denmark, and Belgium [15]. These data can be explained by the high GDP per capita, which lead to higher consumption and therefore greater production of OFMSW and MSW. Figure 3A evidenced a strong standard deviation, related to the heterogeneity of OFMSW and MSW in the different part of each region, emphasizing the importance of efficient waste collection systems [10]. Moreover, in 2015–2017, the collection rate of OFMSW (i.e., kitchen waste, wet waste, waste from the maintenance of gardens and parks), increased of 7.3% [17]. OFMSW total amount in 2017 was equal to 1.7 ± 0.27 Mt/y and it enclosed the fractions destined to domestic composting (about 0.22 Mt/y) [17].
Considering the three Italian macro-areas, (north, center, and south plus islands), the separate collection from 2015 to 2017 increased more in the central and southern regions (around 10% in both), and less in the north (5.4%). However, in terms of collection per capita the values were in the opposite ranking: 129 kg/inhabitant per year in the north, 111 kg/inhabitant per year in the center and 77 kg/inhabitant per year in the south plus the Islands, with a national average of 108 kg/inhabitant per year [17]. These trends agreed with central EU countries as Germany, Netherlands and Austria [14,15] From 2015 to 2017, the separate collection of the cellulosic fraction (paper and cardboard) increased in the north, Center and south respectively of: 2.2%, 2.6% and 0.3% [17]. Taking into account the amounts of OFMSW, paper and clothes, the total biodegradable fraction of MSW that could be valorized in biorefinery processes could increase from 30 to 50% v/v depending on the regions (Figure 3B). We considered the last version of available databases: 2017–2018 Eurostat database and 2017–2018, ISPRA database, but both these databases reported data of 2015–2016.
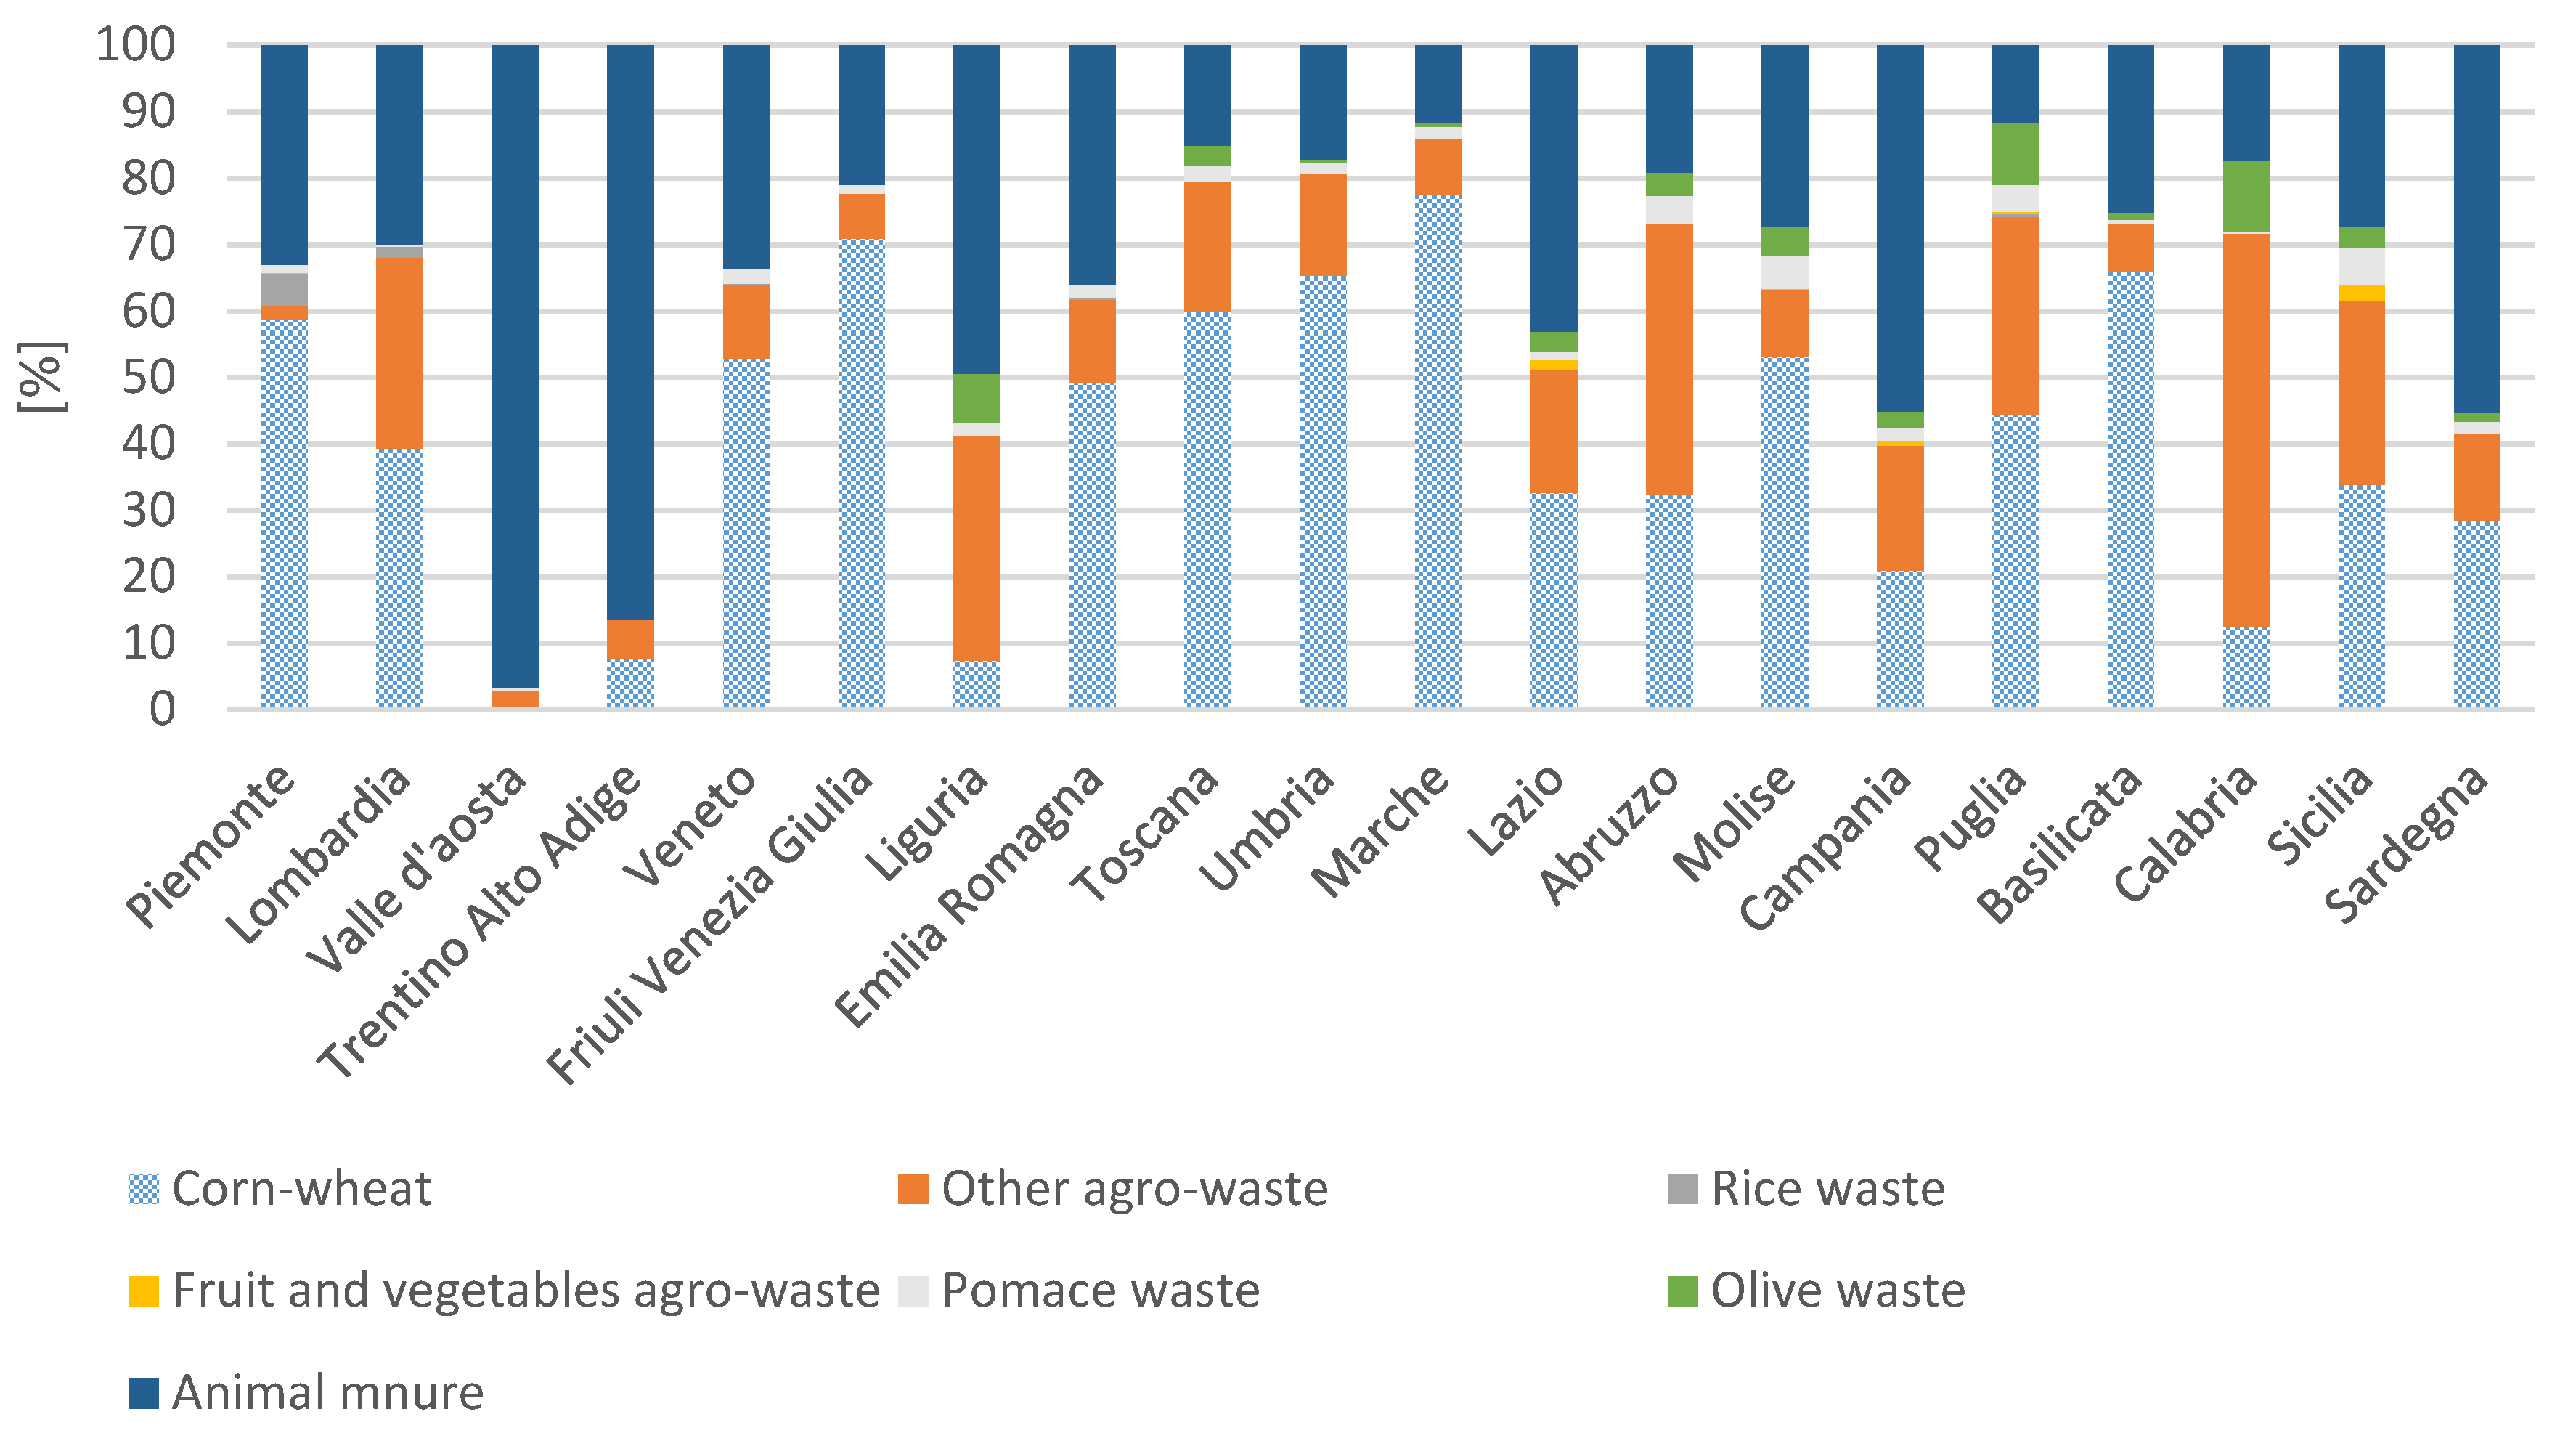
ALW encloses waste from agricultural activity (i.e., corn, wheat, fruit, vegetables, rice, pomace, olive wastes) and livestock waste as animal manure and milking wastes [18,28] The total amount of ALW produced in Italy in 2016 was 5.7 ± 0.23 Mt/y. The main streams of ALW are reported in Table 1 and Figure 4. The wide standard deviation range (50–103%) witnesses the high heterogeneity of the availability of ALW in each Italian region (Table 1). The region with the highest ALW production were Lombardia (0.33 ± 0.30 Mt/y), Puglia (0.24 ± 0.33 Mt/y) and Piemonte (0.29 ± 0.27 Mt/y), representing respectively 15%, 10% and 9% of total italian production. The reason of these trends were: in Piedmont the soil was efficient exploited thanks to the adoption of efficient irrigation systems and use of modern agricultural machinery; however Lombardia had a higher productivity thanks to the abundance of irrigation, the adoption of modern techniques, good fertilizers and to the presence of large rationally organized companies [18].
Considering rice waste [18], the highest production was observed in Piemonte (0.024 ± 0.043 Mt/y) and Lombardia (0.014 ± 0.036 Mt/y). These data may be explained by the fact that the Italian rice fields were mainly located in the Novara and Vercelli provinces (in Piemonte, near the border with Lombardia).
About fruit and vegetable waste [18], the highest production was registered in Sicilia (6.1 ± 4.9 Mt/y), Lazio (0.004 ± 0.008.6 Mt/y) and Campania (0.002 ± 0.002.3 Mt/y). Finally, considering pomace waste, the chief producing regions were Puglia (0.022 ± 0.002 Mt/y), Sicilia (0.014 ± 0.02 Mt/y) and Veneto (0.011 ± 0.011 Mt/y). These data can be explained by the very favourable climate present in these regions. For the olive waste the major producing regions were: Puglia (0.052 ± 0.034 Mt/y), followed by Calabria (0.037 ± 0.028 Mt/y). Finally, the highest productions of animal manure were observed in Lombardia (0.253 ± 0.68.1 Mt/y) and Campania (0.167 ± 0.171 Mt/y). These data could be explained through the high number of cattle and pig farms present in these regions. For the aim of this study, it is important to know the percentage production of the individual agricultural biomasses present in each region (Figure 4).
FIW includes food and beverage manufacturing data taken from the economic activity identified as ATECO 10–11 [18]. The biowaste from food and beverage manufacturing sector was calculated through mass and energy balances per unit of product and the total amount was 2.6 Mt/y for 2016 [18]. In Figure 5A the amount of FIW was reported for each region for the year 2016. The regions with the highest FIW production were Lombardia (0.56 Mt/y), Emilia Romagna (0.47 Mt/y) and Veneto (0.36 Mt/y), which represented respectively 19%, 17% and 13% of total national production [18] Lombardia, Emilia Romagna and Veneto were characterised by high number of food manufacturing enterprises and high GDP [9,12]. The data concerning the principal food manufacturing streams (Figure 5B) are referred to the whole Italy, because the data for the single regions and all food manufacturing sectors were not available. The considered main food manufacturing waste streams derive from: fishing, slaughter, wine manufacturing, processed fruit and vegetables, oil and olives, dairy, wheat-corn processing, milking, candy and sugar manufacturing, beverage production and spent ground coffee. Among these specific waste streams, the most abundant ones were: dairy waste (12.6% of the total FIW in 2016), processed candy waste (12.2%), slaughter waste (12.1%), and spent coffee ground (11.5%). Based on [18], the trend of FIW production in Italy in 2017 for macro-areas was: North-east 36.4%, north-west 25.5%, south and Islands 29.3% and center 8.8%. To witness the representativeness of Italy as case study for EU-28 biowaste production, it is worth to underline the similar trend between FIW production in north-east of Italy and Germany, and Southern Italy plus the Islands with Spain and France [13,14].
To sum up, among the four studied bio-waste categories the order of biowaste production was: ALW (5.7 ± 0.23 Mt/y), WSS (4.06 Mt/y), FIW (2.6 Mt/y), and OFMSW (1.7 ± 0.25 Mt/y), leading to a total amount of 14 Mt/y. FIW production was lower than ALW and WSS, since food industry manufacturing processes are usually optimized in order to maximize the production and minimize waste production [7].
However, it should be observed that biowaste is not a free resource since there are costs connected to collection, transport, and biomass conversion. The highly heterogeneous geo-localization of biowaste in each region (48%–70%) made collection/logistics systems quite complicate, reducing the efficiency of the collection [32]. Transport cost was affected by tortuosity factor, biowaste density, collection site-plant distance and type of vehicle (oil, gas, small–medium–big sizes). In general, the cost of transport [33] had to be analyzed from economic and environmental viewpoints. Biowaste transport cost ranged between 0.41 and 1.2 €/t [34] but over 100 km distance and water content over 30%, the transport is considered unsustainable [35]. From an environmental point of view, collection and transport of biowaste are sustainable if there is a reduction of GHG of 40%–60% compared to current situation [36]. Another important parameter affecting waste biomass collection and transport is the seasonal variation of the available biomass [36].
3.3. Biowaste Qualitative Features
To identify the most suitable biorefinery process (chemical, thermo–chemical and biological) and the amount of energy that can be produced, the biowaste had to be chemically and physically characterized. It is central to know the qualitative biowaste feature such as carbon content, carbon/nitrogen ratio, water content and biowaste structure, to understand the suitability of the biowaste to be processed in biorefinery process to obtain the desired products. In particular for AD process the most important qualitative features are Carbon content, C/N ratio, pH and VS/TS, while for TH process are water content and Carbon content. Table 2 shows the physico–chemical features of the 14 most abundant biowaste flows in Italy grouped in the 4 categories WSS, OFMSW, ALW, and FIW as defined in Section 2.2. The stoichiometric formula was calculated taking into account the standard deviation of the elemental composition of the feedstock, to achieve a high consistency. Furthermore, AD requires a strict regulation of control parameters because of it is a bio-chemical process which can be run under well-defined range of conditions (pH, NH4, COD, VS/TS, etc.)
All the considered waste flows exhibited at least 40% carbon content and carbon–nitrogen ratio was between 10 and 30, which make them suitable feedstocks for 2G biorefinery systems, according to [20,36]. The high carbon content of these biowaste flows represents an important renewable carbon resource, which could be valorized and exploited to produce both platform chemicals and bioenergy, significantly contributing to the reduction of the use of non-renewable resources. The main drawback of the employment of biowaste as carbon source is the high water content (60%–90% according to [37]. On the other side, the organic matter expressed as VS/TS was higher than 80% w/w for all the considered biowastes, thus thermo–chemical and biological processes were both suitable to maximize biowaste conversion into high added-value products [38]. Biowaste can be integrated into plants and processes, thus producing added value in terms of jobs, investment costs, and growth of the bioresource product market [4].
3.4. Current Biowaste Management
Biowaste disposal in Italy is regulated according to EU-28- legislation. Directive 1999/31/EC requires that member states reduce the amount of landfilled biodegradable MSW to 35% of 1995 amounts by 2016. Directive 2008/98/EC set the waste management hierarchy to avoid endangering human health and to protect environment status quo: prevention, re-use, recycling, recovery, and disposal. Another fundamental principle applied to waste management is the extended producer responsibility, which obliges the polluter to cover the costs of prevention, control and reclamation. The current management and disposal operations referred to the four considered biowaste categories was analyzed considering the national reference database [19]. In Italy there are: 274 composting facilities (61% in the north) treating over 4.1 Mt/y of biowaste; 21 AD plants (90% in the north) treating 0.7 Mt/y of biowaste; 31 facilities combining anaerobic and aerobic processes (89% in the north) treating around 4 Mt/y of biowaste; 5.4 Mt/y of waste (i.e., MSW and the dry fraction selected by mechanical-biological plants).
WSS management consisted mainly in landfilling (24%–62%), followed by incineration (32%–50%); OFMSW management consisted in mechanical biological treatment (38%–72%), incineration with energy recovery (16%–52%) and anaerobic digestion (7%–32%). In Valle d’Aosta 100% OFMSW underwent composting. ALW and FIW management consisted mainly in energy recovery (20%–57%). The Italian situation was consistent with current EU-28 waste management (Eurostat, 2018): for WSS 30%–40% landfilling, followed by incineration with energy recovery; for MSW, in general mostly recycling (30%–65%), for ALW, mainly incineration with energy recovery (17%–60%). EU data for FIW management are not available.
3.5. Technical and Environmental Assessment of Biowaste Valorization through Biorefinery Processes
The potential of biowaste for energy production ranges between 33 and 1135 EJ/y, which corresponds to 5–185 billion barrels of oil, able to satisfy the energy world necessity of 820 EJ/y by 2040 [20]. Biowaste-derived energy and liquid transportation fuels can minimize climate change and the dependence on fossil fuels [59]. In EU-28, over 80% of energy comes from non-fossil resources [2] for the following uses: transport (33.1%), households (25.4%), industrial sector (25.3%), public services (13.6%) and agriculture and forestry (2.2%) [60].
The technical feasibility of two biorefinery processes, both aimed at the production of bioenergy, was assessed in this study for the considered biowaste flows (Table 3): anaerobic digestion (AD) a multistep biological process, and thermo-valorization (TH), a thermochemical process. For all the considered biowastes, AD reached the highest energy production. Even if these values came from stoichiometric calculations, AD resulted in more efficiency for these type of biowaste, because AD requires a strict regulation of control parameters (i.e., pH, temperature, TS and VS), but in more flexible ranges than TH. AD was a suitable process also for biowaste flows with high water content as WSS.
TH required less flexible operational conditions than AD, as: feedstock having LHV of at least 2000 kcal/kg, water content below 40%, 30% w/w mass reduction, and pathogens stabilization [61]. Considering the feasibility of AD, the highest performances were achieved by dairy (13.6 kWh/kg), milking (12.9 kWh/kg) and olive and oil waste (11.6 kWh/kg). This trend was due to biowaste composition, particularly to the high amount of proteins and lipids, able to increase methane production and consequently energy production [62].
The environmental assessment (Table 4) compared AD, TH, and current biowaste management in Italy in terms of CO2 equivalent emissions and CO2 avoided. To achieve higher coherence, a period of four years (2012–2016) was considered [6]. For all biowaste categories the environmental benefit asset was reached by AD as a CO2 neutral process. Anyway, among the four biowaste categories, the highest emissions of CO2 derived from ALW, due to the large use of fertilizers and pesticides [63].
The main findings of the technical and environmental assessments were the following: compared to TH, AD achieved the best performances in terms of produced energy and avoided CO2 emissions. The average values of the primary energy production of AD and TH for the four bio-waste categories (expressed as average and standard deviation of the 14 biowaste streams) were: for WSS 4.6 vs. 2.4 kWh/kg; for OFMSW 6.7 vs. 2.6 kWh/kg; for ALW 7.95 ± 0.42 vs. 3.43 ± 0.25 kWh/kg and for FIW 8.9 ± 0.98 vs. 6.31 ± 0.72 kWh/kg.
The avoided CO2 emissions increased in a range between 10% and 89.9%, according to waste biomass categories, with the adoption of AD instead of TH. AD, compared to present biowaste management, may reduce CO2 emissions in a range between 72.2% and 98.9% depending on the biowaste category. Hence, the main findings of the present study defined AD as a promising process both by technical and environmental perspectives. In Section 3.6, the application at full scale of AD and TH were respectively described with Acea Pinerolese and TRM.
3.6. Full-Scale Biorefinery Systems in Italy
This section presents five examples of full-scale 2G biorefinery systems in Italy: Novamont, a chemical biorefinery system; Betarenewable and Acea, two biological biorefinery systems; TRM and ENI, two thermo–chemical biorefinery systems.
Novamont is a chemical company founded in 1990 by Montedison Group and based in Novara (Piemonte, north of Italy), while the headquarter is in Terni (Umbria, center of Italy) [23]). Novamont works in bio-plastics sector, both in Italy and in Europe, with the goal of combining chemistry and agriculture in an integrated biorefinery system, thus boosting social, economic, and environmental benefits. Novamont manufactures three products from agricultural biowaste: Mater-Bi, Matrol-Bi and Celus-B. Mater-Bi is a thermoplastic biopolymer produced from corn starch, cellulose and vegetable oils. Mater-Bi is biodegradable and compostable according to the European standard UNI EN 13,432 and it is employed to produce biodegradable bags for shopping and for OFMSW separate collection. Matrol-Bi is a bio-lubricant oil produced from renewable agricultural feedstocks; it has technical features comparable to fossil fuels and it is biodegradable. CELUS-BI is a cosmetic product made up of biodegradable micro-granules; it is used to produce biodegradable moisturizers, shampoo, foundation cream and lipsticks.
Beta Renewables is a joint venture between Biochemtex, an engineering company of the Mossi Ghisolfi group, the American fund TPG (Texas Pacific Group) and the Danish Novozymes, a leader in bioinnovation. Betarenewable is a 2G biorefinery system located in Crescentino (Piemonte, north of Italy) able to convert agricultural waste from a 70 km radius catchment area into bio-ethanol [24]. The plant produces 40,000 t/y of bio-ethanol for the European market. The project was supported by the European Commission under the VII Framework Program for Research and Development. The technology used to obtain the bio-ethanol involves the integration and collaboration of PROESA® (ethanol production from biomass) which, combined with Cellic® enzymes produced by Novozymes, converts sugars present in the lignocellulosic biomass to obtain alcohol, fuels and other chemicals with lower GHG emissions and competitive costs compared to fossil fuels. PROESA® also produces biofuels that ensure a reduction in GHG emissions close to 90% compared to the use of fossil fuels; a considerably higher reduction compared to that achieved by first-generation biofuels.
TRM (Metropolitan Waste Treatment) belongs to Iren Group, and is a waste-to-energy plant dedicated to the treatment of MSW [26]. TRM plant can operate in an electric or cogeneration arrangement, supplying energy for district heating in Turin city: in the first case, the plant produces the energy corresponding to the annual needs of about 175,000 families of three people; in the second case the plant produces the thermal energy for the annual needs of 17,000 houses of 100 m2 and the electricity consumed by about 160,000 families. Energy recovery from MSW in TRM plant saves about 70,000 t/y of fossil fuel.
Acea Pinerolese is a multi-utility located in Pinerolo (Piemonte) [25]. The Ecological Pole is internationally recognized as a model for OFMSW valorization (around 60,000 t/y). It is made of five process units: a 75,000-person equivalent wastewater treatment plant (with tertiary treatment in the water line and mesophilic AD in the sludge line), a pre-selection line (to separate the impurities from OFMSW), an anaerobic digestion unit for the OFMSW, a composting facility and a MSW landfill. AD of the OFMSW is a thermophilic process fed with 14% TS. In the composting plant, the digestate deriving from AD of the OFMSW is mixed with green waste and after three months it becomes quality compost (Florawiwa®), sold to farmers and floriculturists. The water necessary for AD derives from the wastewater treatment facility. The biogas stored in a gasometer derives from the flows: AD, the sludge line of the wastewater treatment facility and the MSW landfill. A CHP plant, powered by biogas, produces heat partly used for the operation of the plant and partly for the district heating of part of the City of Pinerolo and renewable electricity used by the Ecological Pole and partly sold on the network. Since 2014 part of the biogas is transformed into bio-methane. Acea Pinerolese collaborates with FCA Group’s Fiat Research Center, with which it has already completed several projects, including the development of the Biomethair Panda fed with biomethane and bio-hydrogen mixtures obtained from the AD of OFMSW. The ecological pole treats 60,000 t/y of OMSW and 20,000 t/y of green waste, producing about 6000 t/y of compost. In 2016, the biogas production was 10,241.50 Nm3/y, yielding 17.1 GWh/y of electrical energy and 18.8 GWh/year of thermal energy available for district heating and internal heating. With the biogas produced in one year by the pole, it is possible to heat around 2500 homes and produce electricity for about 5700 households.
Eni developed waste to fuel processes able to convert OFMSW into bio-oils to be used as fillers in the refining cycle to obtain biofuels [27]. Compared to alternative solutions for waste treatment, such as composting or AD, the waste to fuel technology developed and patented by Eni allows greater energy recovery, up to 80% of the energy contained in waste, reducing odor emissions and the occupation of areas. Eni has a pilot photo-bioreactor plant at the Ragusa Oil Center (Sicilia, Southern Italy) for the use of CO2 produced in the field of hydrocarbon extraction through micro-algae, in order to produce 3G- bio-oil and Omega 3. The experimental plant module is able to capture and exploit about 80 t/y of CO2 contained in the gas associated with the extraction of oil from wells. The plant, which exploits the process of growth, reproduction and photosynthesis of selected algal strains favored by concentrated sunlight, was launched on April 2017 and it is currently undergoing biological ramp-up. Eni’s Green Refinery project in Porto Marghera, Venezia (Veneto, north-east Italy) is the first case in the world for the conversion of a conventional petrochemical refinery into 2G-biorefinery, able to transform palm oil, spent fried oil and vegetable oil into high quality biofuels. The 2G-biorefinery in Porto Margherita produces four types of fuels: (1) green diesel, (2) green naphtha, (3) liquid petroleum gas, and (4) jet fuel. The technology adopted for the 2G-biorefinery in Porto Margherita is based on the EcofiningTM project, a system developed in San Donato Milanese (Milano, Lombardia) laboratories in collaboration with Honeywell-UOP and then applied to the catalytic hydrodesulphurization section of the Venice refinery. The analysis of petrol and diesel samples have shown that Eni’s biodiesel, thanks to 15% of renewable components, reduces pollutant emissions: up to 40% compared to conventional un-burnt hydrocarbons and carbon monoxide. Moreover, thanks to a more sustainable production cycle, it contributes to reduce CO2 emissions by an average of 5%.
4. Conclusions
The aim of this study was the definition of a methodology for the quantitative and qualitative assessment of biowaste potential in 2G biorefinery systems in the Italian context according to Circular Economy strategies. Italy was chosen as representative case study of EU-28 reality. The case study was described through the following key parameters: gross domestic power, climate, demography, and density distribution. To evaluate the dimension and localization of necessary 2G-biorefinery plants, the amounts and geo-localization of four biowaste categories were estimated: WSS, 4.06 Mt/y, OFMSW, 1.7 ± 0.25Mt/y, ALG, 5.7± 0.23 Mt/y, and FIW, 2.6 Mt/y. Physico–chemical features of the considered biowaste streams were suitable for biorefinery processes, since carbon content was about 40% and carbon-nitrogen ratio was between 10 and 30. Compared to TH, AD achieved the best performances in terms of produced energy and avoided CO2 emissions. The main findings of the present study were: (1) primary energy production of AD and TH for WSS, OFMSW, AW, and FIW were respectively: 7.89 vs. 2.4 kWh/kg, 8.7 vs. 2.6 kWh/kg, 10.85 vs. 5.5 kWh/kg, and 12.5 vs. 7.8 kWh/kg; (2) the avoided CO2 emissions were increased between 10% and 89.9%, according to biowaste categories, with the adoption of AD instead of TH; (3) AD, compared to present waste biomass management, may reduce CO2 emissions between 72.2% and 98.9% depending on the waste biomass category.
Author Contributions
F.D. performed the collection and interpretation of data and wrote the draft of the manuscript. F.P. contributed to the collection and interpretation of data. S.F. supervised and planned the research, contributed to the interpretation of data and revised the manuscript.
Funding
This research received no external funding.
Conflicts of Interest
The authors declare no conflict of interest.
References
- Parajuli, R.; Dalgaard, T.; Jørgensen, U.; Adamsen, A.P.S.; Knudsen, M.T.; Birkved, M.; Gylling, M.; Schjørring, J.K. Biorefining in the prevailing energy and materials crisis: A review of sustainable pathways for biorefinery value chains and sustainability assessment methodologies. Renew. Sustain. Energy Rev. 2015, 43, 244–263. [Google Scholar] [CrossRef]
- Maity, S.K. Opportunities, recent trends and challenges of integrated biorefinery: Part I. Renew. Sustain. Energy Rev. 2015, 43, 1427–1445. [Google Scholar] [CrossRef] [Green Version]
- De Jong, E.; Jungmeier, G. Biorefinery Concepts in Comparison to Petrochemical Refineries. Ind. Biorefin. White Biotechnol. 2015, 1, 3–33. [Google Scholar]
- Koutinas, A.A.; Vlysidis, A.; Pleissner, D.; Kopsahelis, N.; Garcia, I.L.; Kookos, I.K.; Papanikolaou, S.; Kwan, T.H.; Lin, C.S.K. Valorization of industrial waste and by-product streams via fermentation for the production of chemicals and biopolymers. Chem. Soc. Rev. 2014, 43, 2587. [Google Scholar] [CrossRef] [PubMed]
- UNRICH. Centro Regionale Delle Nazioni Unite 2018. Available online: https://www.unric.org/it/agenda-2030. (accessed on 12 December 2019).
- Eurostat. Air Emissions Accounts. Available online: http://appsso.eurostat.ec.europa.eu/nui/show.do?dataset=env_ac_ainah_r2&lang=en (accessed on 8 February 2019).
- Alexandri, M.; Venus, J. Feedstock flexibility in sustainable chemistry: Bridging sectors still not sufficiently familiar with each other–Showcases of ongoing and emerging initiatives. Curr. Opin. Green Sustain. Chem. 2017, 8, 4–29. [Google Scholar] [CrossRef]
- Mossman, M. Chemical Building Blocks from Municipal Solid Waste. BEsustainable. Available online: http://www.besustainablemagazine.com/cms2/chemical-building-block-from-municipal-solid-waste/?utm_campaign=BE-Sustainable:%20Bioenergy%20and%20bioeconomy%20updates&utm_medium=email&utm_source=EOACLK (accessed on 12 December 2019).
- Eurostat. GDP Per Capita, Consumption Per Capita and Price Level Indices. Available online: http://appsso.eurostat.ec.europa.eu/nui/show.do?dataset=prc_ppp_ind&lang=en (accessed on 12 December 2019).
- Dahiya, S.; Kumar, A.N.; Sravan, J.S.; Chatterjee, S.; Sarkar, O.; Mohan, S.V. Food waste biorefinery: Sustainable strategy for circular bioeconomy. Bioresour. Technol. 2018, 248, 2–12. [Google Scholar] [CrossRef]
- Istat. Ambiente e Energia. Available online: http://www4.istat.it/it/files/2017/12/C02.pdf (accessed on 14 January 2019).
- Istat. Popolazione e Famiglie. Available online: http://www4.istat.it/it/files/2017/12/C03.pdf (accessed on 14 January 2019).
- Eurostat. Population Density by NUTS 2. Available online: http://ec.europa.eu/eurostat/tgm/table.do?tab=table&init=1&plugin=1&language=en&pcode=tps00003 (accessed on 20 February 2018).
- Eurostat. Generation of Municipal Waste Per Capita. Available online: http://ec.europa.eu/eurostat/web/products-datasets/-/cei_pc031 (accessed on 27 February 2018).
- Eurostat. Available online: http://ec.europa.eu/eurostat/tgm/table.do?tab=table&init=1&language=en&pcode=ten00020&plugin=1 (accessed on 3 January 2018).
- Ispra. Rapporto Rifiuti Speciali Ed.2016 n.246 Versione Integrale. Available online: http://www.isprambiente.gov.it/files/pubblicazioni/rapporti/RapportoRifiutiSpeciali_Ed.2016n.246_Vers.Integrale.pdf (accessed on 19 January 2019).
- Ispra. Rapporto Rifiuti Urbani Edizione 2017 n272 in Versione Integrale. Available online: http://www.isprambiente.gov.it/files2017/pubblicazioni/rapporto/RapportoRifiutiUrbani_Ed.2017_n.272_Vers.Integrale_rev08_02_2018.pdf (accessed on 19 January 2019).
- Ispra. Rapporto Rifiuti Speciali Edizione 2017 n.264 in Versione Integrale. Available online: http://www.isprambiente.gov.it/public_files/RapportoRifiutiSpecialiEd.2017n264VersioneIntegrale2.pdf (accessed on 19 January 2019).
- Ispra. Rapporto Rifiuti Urbani Edizione 2018 n292 in Versione Integrale. Available online: http://www.isprambiente.gov.it/files2018/pubblicazioni/rapporti/RapportoRif297.pdf (accessed on 30 January 2019).
- EEA (European Environmental Agency). Effectiveness of Waste Management Policies in the European. Available online: https://www.eea.europa.eu/publications/diverting-waste-from-landfill-effectiveness-of-waste-management-policies-in-the-european-union (accessed on 30 January 2019).
- FAO. Available online: http://www.fao.org/home/en/ (accessed on 19 February 2019).
- ENEL. Dichiarazione Ambientale Aggiornamento. Available online: https://corporate.enel.it/content/dam/enel-it/progetti/documenti/impianti-emas%20move/Bastardo/dichiarazione-ambientale-aggiornamento_2018.pdf (accessed on 21 February 2019).
- Novamont. Available online: http://www.novamont.com/ (accessed on 2 February 2019).
- Betarenewable. Available online: http://www.betarenewables.com/it/proesa/che-cos-e-proesa (accessed on 2 February 2019).
- Acea Pinerolese. Available online: http://www.aceapinerolese.it/ (accessed on 2 February 2019).
- TRM. Available online: http://trm.to.it (accessed on 2 May 2018).
- ENI. Available online: https://www.eni.com/it_IT/innovazione/piattaforme-tecnologiche/bio-refinery.page (accessed on 2 February 2019).
- Enea. Censimento Potenziale Energetico Biomasse, Metodo Indagine, Atlante Biomasse Su WEB-GIS. Available online: http://aida.casaccia.enea.it/aida/file/RSE167.pdf (accessed on 7 February 2019).
- Corte dei Conti. Relazione Emergenza. Available online: http://www.rifiutilab.it/_downloads/Relazione-emergenza-CORTE-CONTI-6-2007-G.pdf http://ec.europa.eu/eurostat/tgm/table.do (accessed on 4 May 2018).
- Eurostat. Sewage Sludge Production and Disposal. Available online: http://appsso.eurostat.ec.europa.eu/nui/show.do?dataset=env_ww_spd&lang=en (accessed on 15 February 2019).
- US EPA. Available online: https://www.epa.gov/ (accessed on 2 February 2019).
- Sultana, A.; Kumar, A. Development of tortuosity factor for assessment of lignocellulosic biomass delivery cost to a biorefinery. Appl. Energy 2014, 119, 288–295. [Google Scholar] [CrossRef]
- Golecha, R.; Gan, J. Biomass transport cost from field to conversion facility when biomass yield density and road network vary with transport radius. Appl. Energy 2016, 164, 321–331. [Google Scholar] [CrossRef]
- Ramli, N.N.; Epplin, F.M. Cost to produce liquid biofuel from invasive eastern redcedar biomass. Biomass-Bioenergy 2017, 104, 45–52. [Google Scholar] [CrossRef]
- Behera, S.; Arora, R.; Nandhagopal, N.; Kumar, S. Importance of chemical pretreatment for bioconversion of lignocellulosic biomass. Renew. Sustain. Energy Rev. 2014, 36, 91–106. [Google Scholar] [CrossRef]
- Budzianowski, W.M. High-value low-volume bioproducts coupled to bioenergies with potential to enhance business development of sustainable biorefineries. Renew. Sustain. Energy Rev. 2017, 70, 793–804. [Google Scholar] [CrossRef]
- Pleissner, D. Decentralized utilization of wasted organic material in urban areas: A case study in Hong Kong. Ecol. Eng. 2016, 86, 120–125. [Google Scholar] [CrossRef]
- Demichelis, F.; Cassini, S.; Fiore, S. The pivoting role of biomass for process and product design in 2G-biorefinery system. Unpublished work.
- Van Lier, J.; Mahmoud, N.; Zeeman, G. Anaerobic Wastewater Treatment Principles Modelling and Design; IWA Publishing: London, UK, 2008. [Google Scholar]
- Venus, J.; Fiore, S.; Demichelis, F.; Pleissner, D. Centralized and decentralized utilization of organic residues for lactic acid production. J. Clean. Prod. 2018, 172, 778–785. [Google Scholar] [CrossRef]
- Cerda, A.; Artola, A.; Font, X.; Barrera, R.; Gea, T.; Sánchez, A. Composting of food wastes: Status and challenges Part, A. Bioresour. Technol. 2018, 248, 57–67. [Google Scholar] [CrossRef]
- Schanes, K.; Dobernig, K.; Gözet, B. Food waste matters - A systematic review of household food waste practices and their policy implications. J. Clean. Prod. 2018, 182, 978–991. [Google Scholar] [CrossRef]
- Chung, I.M.; Kim, J.K.; Lee, K.J.; Park, S.K.; Lee, J.H.; Son, N.S.; Jin, Y.K.; Kim, S.H. Geographic authentication of Asian rice (Oryza sativa L.) using multi elemental and stable isotopic data combined with multivariate analysis. Food Chem. 2018, 240, 840–849. [Google Scholar] [CrossRef]
- Nečemer, M.; Potočnik, D.; Ogrinc, N. Discrimination between Slovenian cow, goat and sheep milk and cheese according to geographical origin using a combination of elemental content and stable isotope data. J. Food Compos. Anal. 2016, 52, 16–23. [Google Scholar] [CrossRef]
- Banerjee, J.; Singh, R.; Vijayaraghavan, R.; Macfarlane, D.; Patti, A.F.; Arora, A. Bioactives from fruit processing wastes: Green approaches to valuable chemicals. Food Chem. 2017, 225, 10–22. [Google Scholar] [CrossRef]
- Lam, S.S.; Liew, R.K.; Lim, X.Y.; Ani, F.N.; Jusoh, A. Fruit waste as feedstock for recovery by pyrolysis technique. Int. Biodeterior. Biodegrad. 2016, 113, 325–333. [Google Scholar] [CrossRef]
- Link, S.; Arvelakis, S.; Paist, A.; Liliedahl, T.; Rosén, C. Effect of leaching pretreatment on the gasification of wine and vine (residue) biomass. Renew. Energy 2018, 115, 1–5. [Google Scholar] [CrossRef]
- Barone, G.; Dambrosio, A.; Storelli, A.; Busco, A.; Ioanna, F.; Quaglia, N.C.; Giacominelli-Stuffler, R.; Storelli, M.M. Traditional Italian cheeses: Trace element levels and estimation of dietary intake. J. Food Compos. Anal. 2018, 66, 205–211. [Google Scholar] [CrossRef]
- Vidal, G.; Carvalho, A.; Mendez, R.; Lema, J.M. Influence of the content in fats and proteins on the anaerobic biodegradability of the dairy wastewaters. Bioresour. Technol. 2000, 74, 231–239. [Google Scholar] [CrossRef]
- Shahzad, K.; Narodoslawsky, M.; Sagir, M.; Ali, N.; Ali, S.; Rashid, M.I.; Ismail, I.M.I.; Koller, M. Techno-economic feasibility of waste biorefinery: Using slaughtering waste streams as starting material for biopolyester production. Waste Manag. 2017, 67, 73–85. [Google Scholar] [CrossRef]
- Kokossis, A.; Koutinas, A. Integrated Biorefineries: Design Analysisys and Otimisation; Stuart, P., El-Halwagi, M., Eds.; CRC Press/Taylor and Francis Group: Boca Raton, FL, USA, 2012; pp. 469–487. [Google Scholar]
- Haque, M.A.; Kachrimanidou, V.; Koutinas, A.; Lin, C.S.K. Valorization of bakery waste for biocolorant and enzyme production by Monascus purpureus. J. Biotechnol. 2017, 231, 55–64. [Google Scholar] [CrossRef]
- Gustavsson, J.; Cederberg, C.; Sonesson, U.; Otterdijk, R.V.; Meybeck, A. Global Food Losses and Bakery Waste; Extent, Causes and Prevention; Food and Agriculture Organization of the United Nations: Rome, Italy, 2011. [Google Scholar]
- Lin, C.S.K.; Pfaltzgraff, L.A.; Herrero-Davila, L.; Mubofu, E.B.; Abderrahim, S.; Clark, J.H.; Koutinas, A.A.; Kopsahelis, N.; Stamatelatou, K.; Dickson, F.; et al. Bakery waste as a valuable resource for the production of chemicals, materials and fuels. Current situation and global perspective. Energy Environ. Sci. 2013, 6, 426–464. [Google Scholar] [CrossRef]
- Innangi, M.; Niro, E.; D’Ascoli, R.; Danise, T.; Proietti, P.; Nasini, L.; Regni, L.; Castaldi, S.; Fioretto, A. Effects of olive pomace amendment on soil enzyme activities. Appl. Soil Ecol. 2017, 119, 242–249. [Google Scholar] [CrossRef]
- Ruffino, B.; Fiore, S.; Roati, C.; Campo, G.; Novarino, D.; Zanetti, M. Scale effect of anaerobic digestion tests in fed-batch and semi-continuous mode for the technical and economic feasibility of a full scale digester. Bioresour. Technol. 2015, 182, 302–313. [Google Scholar] [CrossRef]
- Ruffino, B.; Zanetti, M.C.Z. Present and future solutions of waste management in a candied fruit–jam factory: Optimized anaerobic digestion for one site energy production. J. Clean. Prod. 2017, 159, 26–37. [Google Scholar] [CrossRef]
- Woiciechowski, A.L.; Pandey, A.; Machado, C.M.M.; Cardoso, E.B.; Soccol, C.R. Hydrolysis of Coffee Husk: Process Optimization to Recover Its Fermentable Sugar. In Coffee Biotechnology and Quality; Sera, T., Soccol, C.R., Pandey, A., Roussos, S., Eds.; Springer: Dordrecht, The Netherlands, 2000. [Google Scholar]
- Yuea, D.; Youa, F.; Snyderba, S.W. Biomass-to-bioenergy and biofuel supply chain optimization: Overview, key issues and challenges. Comput. Chem. Eng. 2014, 66, 36–56. [Google Scholar] [CrossRef]
- Eurostat. Available online: http://ec.europa.eu/eurostat/statistics-explained/index.php/Glossary:Carbon_dioxide_equivalent (accessed on 7 February 2019).
- Sirini, P.; Tchobanoglous, G.; Noto La Diega, R.C. Ingegneria dei Rifiuti Solidi; Mc Graw Hill: Milan, Italy, 2015; pp. 651–660. [Google Scholar]
- Angelidaki, I.; Alves, M.; Bolzonella, D.; Borzacconi, L.; Campos, J.L.; Guwy, A.J.; Kalyuzhnyi, S.; Jenicek, P.; Van Lier, J.B. Defining the biomethane potential of solid organic wastes and energy crops: A proposed protocol for batch assays. Water Sci. Technol. 2009, 59, 927–934. [Google Scholar] [CrossRef]
- Agriregionieuropa. Andrea Bartolazzi le Energie Rinnovabili; Hoepli: Milan, Italy, 2006; ISBN 88-203-3587-5. In Italian; Available online: https://agriregionieuropa.univpm.it/it/content/article/31/21/le-emissioni-di-gas-serra-della-zootecnia-potenzialita-di-mitigazione-e (accessed on 7 February 2019).
Figure 1.
Case study framework description: (A) geographical distribution (Region); (B) climate areas (type of climate); (C) population density (inhabitant/km2); (D) GDP (Euro) in Italy in 2016–2017.
Figure 1.
Case study framework description: (A) geographical distribution (Region); (B) climate areas (type of climate); (C) population density (inhabitant/km2); (D) GDP (Euro) in Italy in 2016–2017.

Figure 2.
Wastewater and sewage sludge (WSS) production in Italy in 2016–2017 [17,28]: CER 190805 (in blue), CER 190812 and 190814 (in black), and CER 190811* and 190813* (in grey). CER codes identify waste materials in EU on the grounds of the activity that originated them; hazardousness is labeled with an asterisk (*).

Figure 3.
(A) Amounts of MSW (in black) and OFMSW (in blue); (B) Percentage distribution of waste streams in MSW; (C) biodegradable fraction of MSW.
Figure 3.
(A) Amounts of MSW (in black) and OFMSW (in blue); (B) Percentage distribution of waste streams in MSW; (C) biodegradable fraction of MSW.


Figure 5.
Food and beverage waste [18] for each regions (A); main food beverage waste streams (B).
Figure 5.
Food and beverage waste [18] for each regions (A); main food beverage waste streams (B).


Table 1.
Biowaste streams of ALW category [18].
Table 1.
Biowaste streams of ALW category [18].
| Corn and Wheat [t × 1000] | Other Agro-Waste [t × 1000] | Rice Waste [t × 1000] | Fruit and Vegetables Waste [t × 1000] | Pomace Waste [t × 1000] | Olives Waste [t × 1000] | Animal Manure [t × 1000] | Total [t × 1000] | |
|---|---|---|---|---|---|---|---|---|
| Piemonte | 295.7 ± 273.0 | 10.0 ± 16.9 | 24.4 ± 43.5 | 0.8 ± 1.5 | 6.1 ± 7.6 | 0.0 ± 0.0 | 166.2 ± 269 | 503.1 |
| Lombardia | 330.1 ± 303.7 | 242.0 ± 789.7 | 13.7 ± 36.1 | 0.2 ± 0.6 | 1.5 ± 3.1 | 0.0 ± 0.0 | 253.4 ± 268.1 | 840.9 |
| Valle d’Aosta | 0.2 ± 0 | 1.7 ± 0.0 | 0.0 ± 0.0 | 0.0 ± 0.0 | 0.3 ± 0.0 | 0.0 ± 0.0 | 67.8 ± 0.0 | 70.0 |
| Trentino Alto Adige | 0.8 ± 0.4 | 0.6 ± 0.2 | 0.0 ± 0.0 | 0.0 ± 0.0 | 0.0 ± 0.0 | 0.0 ± 0.0 | 8.6 ± 8.5 | 10.0 |
| Veneto | 249.2± 134.0 | 52.4 ± 52.6 | 0.5 ± 0.9 | 0.0 ± 0.0 | 10.5 ± 10.7 | 0.2 ± 0.0 | 158.4 ± 101.7 | 471.3 |
| Friuli Venezia Giulia | 148.2 ± 180.2 | 14.1 ± 10.8 | 0.0 ± 0.0 | 0.0 ± 0.0 | 2.8 ± 2.1 | 0.0 ± 0.0 | 44.0 ± 47.3 | 209.1 |
| Liguria | 1.1 ± 1.1 | 4.8 ± 3.0 | 0.0 ± 0.0 | 0.0 ± 0.0 | 0.3 ± 0.2 | 1.1 ± 0.0 | 7.1 ± 1.2 | 14.4 |
| Emilia Romagna | 173.0 ± 107.9 | 44.3 ± 33.8 | 0.9 ± 2.6 | 0.0 ± 0.0 | 6.9 ± 6.7 | 0.0 ± 0.0 | 127.0 ± 122.5 | 352.1 |
| Toscana | 72.4 ± 65.8 | 23.8 ± 20.0 | 0.0 ± 0.0 | 0.0 ± 0.0 | 2.8 ± 3.3 | 3.6 ± 2.9 | 18.3 ± 15.5 | 120.9 |
| Umbria | 215.0 ± 233.2 | 50.9 ± 38.5 | 0.0 ± 0.0 | 0.0 ± 0.0 | 5.5 ± 1.2 | 1.3 ± 1.4 | 56.6 ± 45.3 | 329.5 |
| Marche | 134.8 ± 12.6 | 14.5 ± 11.2 | 0.0 ± 0.0 | 0.0 ± 0.0 | 3.3 ± 2.6 | 1.0 ± 0.5 | 20.2 ± 15.6 | 173.8 |
| Lazio | 87.4 ± 52.3 | 49.6 ± 28.5 | 0.0 ± 0.0 | 4.0 ± 8.6 | 3.3 ± 3.6 | 8.1 ± 3.2 | 115.5 ± 49.9 | 267.8 |
| Abruzzo | 57.3 ± 51.8 | 72.6 ± 92.7 | 0.0 ± 0.0 | 0.0 ± 0.0 | 7.5 ± 10.9 | 6.3 ± 7.2 | 34.1 ± 13.5 | 177.7 |
| Molise | 81.7 ± 98.2 | 15.7 ± 16.1 | 0.0 ± 0.0 | 0.1 ± 0.01 | 7.7 ± 8.9 | 6.8 ± 7.2 | 42.0 ± 14.4 | 154.2 |
| Campania | 63.4 ± 60.5 | 57.3 ± 14.2 | 0.0 ± 0.0 | 2.4 ± 2.3 | 5.7 ± 4.3 | 7.4 ± 8.0 | 167.5 ± 171.2 | 303.7 |
| Puglia | 243.9 ± 332.6 | 162.8 ± 84.1 | 3.4 ± 7.6 | 1.2 ± 1.2 | 22.3± 18.3 | 51.7 ± 33.6 | 63.4 ± 47.2 | 548.6 |
| Basilicata | 226.0 ± 37.1 | 25.0 ± 26.2 | 0.0 ± 0.0 | 0.0 ± 0.0 | 1.8 ± 0.3 | 4.0 ± 0.2 | 86.3 ± 58.1 | 343.1 |
| Calabria | 42.4 ± 34.5 | 202.4 ± 165.8 | 0.0 ± 0.0 | 0.0 ± 0.0 | 1.3 ± 0.9 | 36.7 ± 28.2 | 59.0 ± 41.5 | 341.8 |
| Sicilia | 81.3 ± 68.0 | 66.4 ± 36.7 | 0.0 ± 0.0 | 6.1 ± 4.9 | 13.5 ± 20.7 | 7.2 ± 3.9 | 65.9 ± 48.1 | 240.4 |
| Sardegna | 65.0 ± 36.3 | 30.2 ± 19.5 | 0.0 ± 0.0 | 0.1 ± 0.2 | 4.1 ± 2.4 | 3.1 ± 1.1 | 127.3 ± 54.6 | 229.8 |
Table 2.
Physico–chemical characteristics of the considered biowaste flows. WSS: wastewater and sewage sludge; MSW: municipal solid waste; ALW: agricultural livestock waste; FIW: waste deriving from the food industry; OFMSW: organic fraction of municipal solid waste.
Table 2.
Physico–chemical characteristics of the considered biowaste flows. WSS: wastewater and sewage sludge; MSW: municipal solid waste; ALW: agricultural livestock waste; FIW: waste deriving from the food industry; OFMSW: organic fraction of municipal solid waste.
| Category | Biomass | C [%] | N [%] | S [%] | H [%] | O [%] | ST [%] | SV/ST [%] | Formula | References |
|---|---|---|---|---|---|---|---|---|---|---|
| WSS | WSS | 50 | 3 | 1.9 | 8.6 | 36.5 | 2 | 65 | C19NH40O11 | [39] |
| MSW | OFMSW | 49.66 ± 8.23 | 2.64 ± 0.34 | 0.44 ± 0.27 | 6.03± 1.03 | 35.98 ± 6.52 | 18 ± 0.29 | 45 | C22NH3O12 | [40,41,42] |
| ALW | rice waste | 37.17 | 7.24 | 18.43 | 5 | 32.16 | 88 | 98 | C6NS1H11O6 | [41,43] |
| animal manure | 40.96 | 1.48 | 0 | 5.2 | 33.14 | 19 | 98 | C32NH49O20 | [44] | |
| corn and wheat | 43.6 | 0.6 | 5 | 8 | 42.8 | 89 | 94 | C85NS4H187O65 | [45] | |
| fruit and vegetable from agro-waste | 41.3 ± 5.57 | 1.2 ± 1.17 | 0 | 5.65 ± 0.39 | 51.85 ± 5.14 | 21 | 95 | C40NH66O37 | [46,47] | |
| FIW | winery waste | 49.8 | 2 | 0 | 5.8 | 42.4 | 85 | 81 | C29NH41O38 | [48,49] |
| milking waste | 46.5 | 4.9 | 5.62 | 8.43 | 34.55 | 13 | 98 | C11NSH24O7 | [44,49] | |
| dairy waste | 46.9 | 4.9 | 5.62 | 9.03 | 33.55 | 43 | 97 | C11NSH26O7 | [44,48] | |
| slaughter waste | 54.9 | 5.9 | 1 | 8.5 | 29.7 | 90 | 80 | C11NSH20O4 | [50,51] | |
| processed candies waste | 44.4 | 0.15 | 0 | 7.3 | 42.53 | 77 | 98 | C22NH40O14 | [52,53,54] | |
| olive and oil waste | 49 | 3.4 | 0 | 10.3 | 30.3 | 56 | 99 | C5NH14O3 | [55] | |
| processed fruit and vegetable waste | 43.2 | 0.15 | 0 | 6.22 | 50.43 | 66 | 99 | C345NH596O302 | [54,56,57] | |
| spent coffee ground | 47.5 | 1.18 | 0 | 6.01 | 44.86 | 86.8 ± 6.3 | 90.7 ± 3.0 | C47NH71O33 | [37,58] |
Table 3.
Technical assessment of the feasibility of anaerobic digestion (AD) and thermo–chemical (TH) biorefinery processes on the considered biowaste flows (SBP: specific biogas production; LHV: lower heating value).
Table 3.
Technical assessment of the feasibility of anaerobic digestion (AD) and thermo–chemical (TH) biorefinery processes on the considered biowaste flows (SBP: specific biogas production; LHV: lower heating value).
| Biowaste | Formula | AD | TH | |||||
|---|---|---|---|---|---|---|---|---|
| C/N | SBP [Nm3/kgsv] | CH4 [%] | Primary Energy [kWh/kg] | LHV [kcal/kg] | Primary Energy [kWh/kg] | |||
| WSS | wastewater and sewer sludge | C19NH40O11 | 16.7 | 1.0 | 60.0 | 4.6 | 2118 | 2.46 |
| MSW | OFMSW | C22NH3O12 | 18.8 | 1.0 | 53.0 | 6.7 | 1912 | 2.22 |
| ALW | rice waste | C6NS1H11O6 | 5.1 | 0.7 | 44.0 | 5.9 | 3570 | 4.14 |
| animal manure | C32NH49O20 | 27.7 | 1.0 | 53.0 | 2.52 | 2000 | 2.32 | |
| corn-wheat-waste | C85NS4H187O65 | 72.7 | 0.9 | 55.0 | 4.8 | 4017 | 4.66 | |
| fruit and vegetable from agro-waste | C40NH66O37 | 34.4 | 0.8 | 46.0 | 18.9 | 2261 | 2.62 | |
| FIW | winery waste | C29NH41O38 | 24.9 | 0.9 | 70.0 | 8.2 | 8092 | 7.39 |
| milking waste | C11NSH24O7 | 9.5 | 0.9 | 58.0 | 12.9 | 4760 | 5.52 | |
| dairy waste | C11NSH26O7 | 9.6 | 0.9 | 61.0 | 13.6 | 4284 | 4.97 | |
| slaughter waste | C11NSH20O4 | 9.3 | 1.0 | 60.0 | 9.0 | 6182 | 7.17 | |
| processed candies waste | C22NH40O14 | 295.9 | 0.9 | 65.0 | 6.4 | 2618 | 3.04 | |
| olive and oil waste | C5NH14O3 | 14.1 | 0.9 | 63.0 | 11.6 | 9996 | 10.60 | |
| processed fruit and vegetable waste | C345NH596O302 | 18.5 | 0.9 | 55.0 | 6.7 | 3570 | 4.14 | |
| spent coffee ground | C47NH71O33 | 40.3 | 1.1 | 57.0 | 8.4 | 4046 | 4.69 | |
Table 4.
Environmental assessment of the feasibility of anaerobic digestion (AD) and thermo–chemical (TH) biorefinery processes on the considered biowaste flows and comparison with current biowaste management in Italy.
Table 4.
Environmental assessment of the feasibility of anaerobic digestion (AD) and thermo–chemical (TH) biorefinery processes on the considered biowaste flows and comparison with current biowaste management in Italy.
| Biowaste | Formula | AD | TH | AD vs. TH kgCO2 Avoided/kg Biowaste | Current Biowaste Management in 2012–2016 According to [20] | |||
|---|---|---|---|---|---|---|---|---|
| kg CO2 Emitted/kg Biowaste | kg CO2 Avoided/kg Biowaste | kg CO2 Emitted/kg Biowaste | kgCO2 Avoided/kg Biowaste | [%] | kg CO2 Emitted/kg Biowaste | |||
| WSS | wastewater and sewer sludge | C19NH40O11 | 0.09 | 2.02 | 1.83 | 1.08 | 46.5 | 10.1 ± 1.5 |
| MSW | OFMSW | C22NH3O12 | 0.074 | 2.95 | 1.82 | 0.98 | 66.9 | 3.6 ± 0.1 |
| ALG | rice waste | C6NS1H11O6 | 0.46 | 2.60 | 1.38 | 1.82 | 29.8 | 103.4 ± 12.1 |
| animal manure | C32NH49O20 | 0.16 | 1.11 | 1.5 | 1.02 | 7.9 | ||
| corn-wheat-waste | C85NS4H187O65 | 0.65 | 2.11 | 1.7 | 2.05 | 2.9 | ||
| fruit and vegetable from agro-waste | C40NH66O37 | 0.16 | 8.32 | 1.54 | 1.15 | 86.1 | ||
| FIW | winery waste | C29NH41O38 | 0.59 | 3.61 | 1.83 | 3.25 | 9.9 | 11.1 ± 0.6 |
| milking waste | C11NSH24O7 | 0.09 | 5.68 | 1.71 | 2.43 | 57.2 | ||
| dairy waste | C11NSH26O7 | 0.3 | 5.98 | 1.37 | 2.19 | 63.5 | ||
| slaughter waste | C11NSH20O4 | 0.6 | 3.96 | 2.01 | 3.15 | 20.3 | ||
| processed candy waste | C22NH40O14 | 0.53 | 2.82 | 1.58 | 1.34 | 52.5 | ||
| olive and oil waste | C5NH14O3 | 0.37 | 5.10 | 1.79 | 4.66 | 8.6 | ||
| processed fruit and vegetable waste | C345NH596O302 | 0.61 | 2.95 | 1.75 | 1.82 | 38.2 | ||
| spent coffe ground | C47NH71O33 | 3.3 | 3.70 | 1.74 | 2.06 | 44.2 | ||
© 2019 by the authors. Licensee MDPI, Basel, Switzerland. This article is an open access article distributed under the terms and conditions of the Creative Commons Attribution (CC BY) license (http://creativecommons.org/licenses/by/4.0/).
Share and Cite
MDPI and ACS Style
Demichelis, F.; Piovano, F.; Fiore, S. Biowaste Management in Italy: Challenges and Perspectives. Sustainability 2019, 11, 4213. https://doi.org/10.3390/su11154213
AMA Style
Demichelis F, Piovano F, Fiore S. Biowaste Management in Italy: Challenges and Perspectives. Sustainability. 2019; 11(15):4213. https://doi.org/10.3390/su11154213
Chicago/Turabian StyleDemichelis, Francesca, Francesco Piovano, and Silvia Fiore. 2019. "Biowaste Management in Italy: Challenges and Perspectives" Sustainability 11, no. 15: 4213. https://doi.org/10.3390/su11154213
Note that from the first issue of 2016, this journal uses article numbers instead of page numbers. See further details here.