Article

Urban Shrinkage and Sustainability: Assessing the Nexus between Population Density, Urban Structures and Urban Sustainability

Department of Human Geography and Regional Development, Faculty of Science, University of Ostrava, 709 00 Ostrava, Czech Republic
*
Author to whom correspondence should be addressed.
Sustainability 2019, 11(15), 4142; https://doi.org/10.3390/su11154142
Submission received: 30 June 2019 / Revised: 19 July 2019 / Accepted: 29 July 2019 / Published: 1 August 2019
(This article belongs to the Special Issue Shrinking Cities—Testing Ground for Sustainability)

Abstract

:
Urban shrinkage has become a common pathway (not only) in post-socialist cities, which represents new challenges for traditionally growth-oriented spatial planning. Though in the post-socialist area, the situation is even worse due to prevailing weak planning culture and resulting uncoordinated development. The case of the city of Ostrava illustrates how the problem of (in)efficient infrastructure operation, and maintenance, in already fragmented urban structure is exacerbated by the growing size of urban area (through low-intensity land-use) in combination with declining size of population (due to high rate of outmigration). Shrinkage, however, is, on the intra-urban level, spatially differentiated. Population, paradoxically, most intensively declines in the least financially demanding land-uses and grows in the most expensive land-uses for public administration. As population and urban structure development prove to have strong inertia, this land-use development constitutes a great challenge for a city’s future sustainability. The main objective of the paper is to explore the nexus between change in population density patterns in relation to urban shrinkage, and sustainability of public finance.

1. Introduction

The study of the urban shrinkage process has ranked among established research areas in a number of scientific disciplines [1,2,3,4,5,6,7]. Although shrinkage has affected 40% of medium-sized and large cities in Europe ten years ago [8] and 70% in Central and Eastern Europe [9], today it seems that some of the previously shrinking cities are gradually succeeding in mitigating or countering this process [7]. Unlike previous research on urban decline or urban decay, this process can be perceived to be somewhat neutral [10], because, under certain conditions, it can be an alternative path of sustainability in a city’s trajectory that can create a favorable environment for the renewal of urban growth [11]. In other words, urban shrinkage represents a complex open-ended process [12]. Rich empirical evidence suggests that there are cases in social reality where the urban shrinkage process shows both positive and negative effects [13]. Finding adequate local policy responses is, however, still rather rare [14,15], although the shrinkage presents many specific challenges for sustainability [16,17,18].
In terms of planning, sustainability is a very complex process of balancing economic, social, and environmental aspects [19,20,21], which is further hindered in the post-socialist context by the weakness of planning and public institutions in general [22]. According to the recently previewed UN’s landmark study on the state of planet Earth, issues related to land-use have the most detrimental impact on the sustainability of the global environment [23]. Thus, we focus on the development of land-use. Nonetheless, due to a functional interdependence of individual aspects of the sustainability concept, we also examine the impact of spatial population patterns on financial sustainability from the public sector perspective. The key to the understanding of (un)sustainability of individual pathways of shrinking is in the exploration of the context and dynamics of urban shrinkage [12,24]. Case studies appear to be an appropriate method for integration of the above. The object of this study is the industrial shrinking city of Ostrava, located in the north-eastern part of Czechia, which implements a neoliberal pro-growth strategy [15].
For purpose of this text, we understand “urban shrinkage as an empirical phenomenon resulting from the interplay of changing drivers at different spatial levels (from regional to global) that produces a decline in population at the local scale“ [12] (p. 89). These processes bring about at an urban level some built-up area and infrastructure sustainability issues. It can be said that these cities have too much infrastructure available for too few residents [25], which is a problem especially for cities that have started to grow rapidly in the early 19th century, as this infrastructure is now at the end of its lifespan and requires substantial investment [26]. Therefore, the main objective of this paper is to identify and assess the change in population density patterns in relation to urban shrinkage at the intra-urban level, more specifically, to set the identified patterns in the context of urban sustainability, and the financial sustainability of public administration in particular. The main research questions are as follows:
  • How did population density patterns change in the shrinking Ostrava at the intra-urban level?
  • How are the identified population density patterns reflected in the present and future sustainability of Ostrava?
To answer these two questions, the following structure has been developed. In the first part of the paper, we discuss the issue of population density at an analytical and normative level and also the changes in population density in association with urban shrinkage. Since we have adapted an evolutionary perspective in the spirit of “history matters”, we analyze the city’s development in detail and with a long-term perspective. Particularly, we employ (implicitly) a core assumption of evolutionary economic geography (EEG) about no-ergodicity resulting in path dependency [27]. Furthermore, we use several key concepts from EEG such as co-evolution (in our case built environment and population development) and sunk costs (cf. [28]) related to the existing infrastructure and population development.
The core of the paper includes detailed results regarding both the changes in spatial patterns of population density and the impact of these changes on sustainable urban development. Finally, the broader and more general implications for the research agenda of shrinking cities as well as the limits of the submitted research are derived from the results.

2. Population Density as An Analytical and Normative Indicator in the Context of Shrinkage

For several decades, population density has been a classic indicator [29,30], which, despite some relative simplicity, is characterized by ambiguity (cf. [31]), hence it is rather difficult to interpret [32]. The easiest expression of population density is probably the number of residents per urban (built-up) area [33]. Population density can be perceived by dual optics both as an analytical indicator and as a normative indicator, with both of these dimensions intermingling.
In the analytical dimension, the change in the spatial patterns of population density is frequently used to examine concentration or deconcentration processes [34,35,36], nonetheless it has primarily a long tradition in urban sprawl measurements [37]. The importance of population density change can be simply illustrated in relation to the classical theory of urban development of van den Berg et al. [38,39]. Suburbanization decreases population density within the administrative boundaries of the urban region as a whole, because the population in the compact city decreases and, on the contrary, grows in its outskirts. However, due to the dominance of the structure of single detached houses, the patterns are dispersed. In contrast, the deurbanization process leads to a decline in population density both in the compact city and in the outskirts. Although reurbanization should lead to an increase in population density in urban areas, for example, due to gentrification and the smaller size of gentrifier households, it may not have this effect [40,41]. A change in population density at intra-urban levels can be investigated [42], which allows for better identification of variability and the capture of real physical and functional diversity of larger administration units [32,43].
The normative dimension of population density is associated mostly with public spending and sustainability. At an urban level, this approach assumes that compact urban forms are more sustainable than dispersed ones [44]. According to a prevailing opinion, “as densities fall, spending for many municipal services rises, as it is more expensive to serve expansive development in terms of investments in infrastructure and other services” [45] (p. 151). The relationship between density and infrastructure spending is not completely unambiguous. According to Westphal, this relationship takes the form of an inverted “U” curve where the savings potential between a compact and dispersed settlement structure ranges from 10% to 80% [42]. In other words, with the growing density, the cost savings is increasing; however, after the exceeding a certain threshold, cost savings is declining due to the congestion or high rents. This argument is analogical to an already a well-established discussion on (dis)economies of agglomeration [46].
The key contribution, at least for this text, is the work by Hudeček et al. [47]. The authors investigated public spending on operation and maintenance in relation to urban spatial structures in Czechia, based on the study of 22 cities and 6 urban districts. In this study, it was found that compact urban structures with high population density and vice versa are the least expensive. More specifically, they have identified that a 1% increase in population density reduces public spending by 0.75% per capita. A very important finding is that “urban structures with population density below 100 inhabitants per hectare are not financially efficient for the municipal budgets” [47] (p. 14). Similarly, it was identified that with a 1% decrease in population density, water supply, and wastewater disposal systems related costs would increase by 1% [48].
In contrast, Holcombe and Williams [49] did not find any positive statistical relationship between population density and public spending on highways, water, sewer, police, and fire protection in the U.S. However, this study looked at cities as a whole not taking into account the compactness of different types of urban development. On the other hand, it is obvious that too high a density can generate negative externalities in the form of traffic congestion, high real estate prices, and a negative impact on the quality of life (cf. [50]). Indeed, the quality of life does not necessarily have to be associated with urban density [51] and moreover, the problem of population density, due to the thermal island effect, is growing proportionally to the progressing climate change [52].
Analytical and normative strands of analysis may pose different implications for shrinking cities. One of the most visible manifestations of urban shrinkage is undoubtedly the decrease in population density [12], which may be driven by the outflow of population, decreasing households’ size [53] and by the increase in floor area per capita [33]. The spatial patterns of population density change can be highly variable at the intra-urban level, with growing and decreasing locations situated in one another’s immediate spatial proximity [4,54]. Hollander et al. [13] point to different forms of population density decline in the form of hollowing-out of the inner city or spatially deconcentrated perforation [55]. Other examples emphasize an increase in population density in inner-urban fringe districts [43,56] also known as inner-suburbanization [57]. Finally, in some cases, irregular to random patchwork structures may be formed [58].
Regarding the normative dimension, it is not surprising that shrinking cities face the sustainability issues of the built environment [26,59]. Empirical studies point to the growing cost of technical infrastructure operation [60] and the emergence of “cold spots“ [48] and the need for reduction of school infrastructure [61,62]. The combination of rising infrastructure maintenance costs and falling, incomes can plunge shrinking cities into a “vicious circle” of decline [63].
However, urban shrinkage cannot be simply considered fatal, since this process, under certain circumstances, may be an opportunity to increase sustainability [13]. A decrease in population density and the resulting impacts can include “vacant dwellings and derelict land”, which “present themselves as extraordinary changes in circumstances and an opportunity to deconstruct created situations, otherwise unthinkable” [64] (p. 27). Disadvantages of urban shrinking can be transformed into advantages when applying appropriate strategies such as smart shrinking [13,65], smart decline [5] and right-sizing. With regard to public spending, an increase of population density can enable reduction of redundant infrastructure, and eventually also the financial burden, as part of a consolidation strategy [66]. The newly cleared-out sites can be used to develop green infrastructure [67,68]. Ultimately, appropriately approached de-densification can result in a high quality of life in a shrinking city [50,69]. Transformation of the disadvantages of shrinkage to advantages depends on the lens through which shrinkage is perceived [70], its reflection in the urban agenda [14] and the planning culture [71] resulting from the overall context.

3. Context of Shrinking Cities in Post-Socialist States

Post-socialist states are particularly prone to shrinkage due to their political and economic transition [36], with the situation being aggravated by its fast and abrupt progress in comparison to Western countries [9]. More than 70% of post-socialist cities with a population of over 200,000 faced a period of shrinking [9] between 1990 and 2005. The most significant cause of population decline in post-socialist cities was the economic decline, negative natural growth, and outmigration. For example, outmigration in V4 countries (Poland, Czechia, Slovakia, Hungary) was from the 2000s most often directed to suburban locations in the outskirts of larger and medium-sized cities, resulting in population decline in urban cores [72]. This exodus from inner cities can be explained on one hand by older housing stock that during state socialism suffered from ideologically motivated disinvestment [73,74,75] and on the other by the presence of mass housing estates of scope unknown to the West [12] (p. 305). These were supposed to counteract housing shortage [7,9] in rapidly urbanizing socialist countries [76], yet in some cities, the shortage has endured to this day. Thus, some shrinking post-socialist cities do not face vacancies [74] to the extent common in the West (e.g., [77]). In the context of limitations on redevelopment in inner cities [78], and ”changing consumption patterns“ [72] (p. 1369), economic change has led to an increase in income disparities and emergence of blighted districts for the poor, and flight of the rich to the newly built inner-city enclaves and suburban areas [73].
However, we cannot omit the role of governments that use their powers to regulate market-induced spatial growth and segregation to only a limited extent [79], or even such patterns were directly supported by government policies [7,80]. The reason for passivity was the fact that “urban planning was” in the post-socialist area “perceived as contradictory to the market”, and “unregulated market”, in turn, “as the mechanism of allocation of resources that would generate a wealthy, economically efficient, and socially just society” [73] (p. 391). Subsequently, the density of settlements was reduced, especially in the city cores, but due to the nature of the built-up area also in the hinterland of towns. Despite the population decline in shrinking cities, urban land use has increased spatially [72].
In addition to the relocation of the population between core and hinterland, outmigration to more distant towns or abroad also occurred, especially in cases where restructuring in the 1990s brought significant loss of jobs (cf. [2,81]). The dominant policy strategy was to attract investment and to turn the economic decline into economic growth hoping it would stabilize and eventually create new population growth [12,82], even though the cause of population decline consisted of several factors, including drop in fertility in whole post-socialist countries [9]. In this context, such policy reaction does not seem adequate and is unlikely to be successful [15].
Furthermore, according to Haase et al. [12] (p. 314), pro-growth policies in shrinking cities undermine the stability and sustainability of the urban regions. This pro-growth orientation stems from the embeddedness in neoliberalism but also can be interpreted in terms of post-socialist path-dependency, as 96% of Eastern European cities with a population of above 200,000 were between 1960 and 1985 gaining population [9]. Alternatively, shrinkage was considered by local political leaders to be a temporary phenomenon associated with post-socialist transformation [83]. Although some shrinking cities respond to changes in demand for public services (e.g., school closures in inner cities and expansion of homes for the elderly, or kindergartens in suburban locations [75,83]), it is almost always ad hoc response to isolated issues that are not attributed to the complex urban shrinkage problem [84]. Cases of explicit acceptance of shrinkage by local politicians are rare and isolated and only concern cities especially hardly hit by shrinkage (e.g., Lodz [84], Bytom [15], and Walbrzych [75]). But holistic strategies aimed at adaptation to shrinkage [15,84], and particularly, problems of the land use and built environment (cf. [85]) are still lacking in post-socialist shrinking cities.

4. Data and Methods

In this text, we have applied the interpretative case study method [86], which allows to fully capture the specifics of the context, which is essential for understanding the trajectories of urban shrinkage process [12]. In agreement with the aforementioned, we are loosely inspired by the methods of evolutionary economic geography: “Follow the path” and “deep contextualization” [87]. The creation of the research framework was mainly based on the studies of Wolff et al. [43] and Hudeček et al. [47]. The former author’s note that due to the spatial proximity of ongoing decline and small-scale (re)growth, there is a need to focus on district and neighborhood levels. For this reason, basic settlement units (BSUs) data from 1991, 2001 and 2011 (see Appendix A) have been used to track changes at the micro-spatial level. These periods were chosen because they represent different stages of development after the end of the centrally planned economy in 1989. This data allows us to capture trends in population changes and share of one- and two-person households.
For built-up area data from 2006, and 2012 Urban Atlas (UA) were used to calculate population densities (for UA product description, see Appendix B). The following selected classes from UA (see Table 1) are understood as built-up areas associated with residential housing.
Other UA classes were not used because they were not directly related to residential housing and their representation in the defined BSUs with residential function was very low. The sealing degree within classes 11xxx was not taken into consideration and all such sites were considered built-up areas. Due to the unavailability of data on built areas from 1991 and the time discrepancy between UA 2006 data and the 1991 census, the data on built-up sites from UA 2006 were modified in GIS by means of visual interpretation according to a georeferenced base map of Ostrava in scale 1: 10,000 from 1992. In order to better match with the census in 2001, the UA data on the built-up sites from 2006 were also partially revised using the colored orthophoto map from 2003. For the 2011 census, the UA data from 2012 were used unchanged. Subsequently, proportions of built-up sites in individual basic settlement units were acquired in GIS for the monitored reference periods (1991, 2001, 2011), and population density was calculated.
The individual BSUs were then cleaned (units with a population of less than 50 inhabitants in 2011 were left-out) and divided into seven categories of types of urban structures according to Hudeček et al. [47], which makes it possible to assess their financial sustainability in terms of public maintenance costs. Individual categories are distinguished by the type of housing development, by the ratio of public space and greenery, and by the extent of public infrastructure. The categories are as follows:
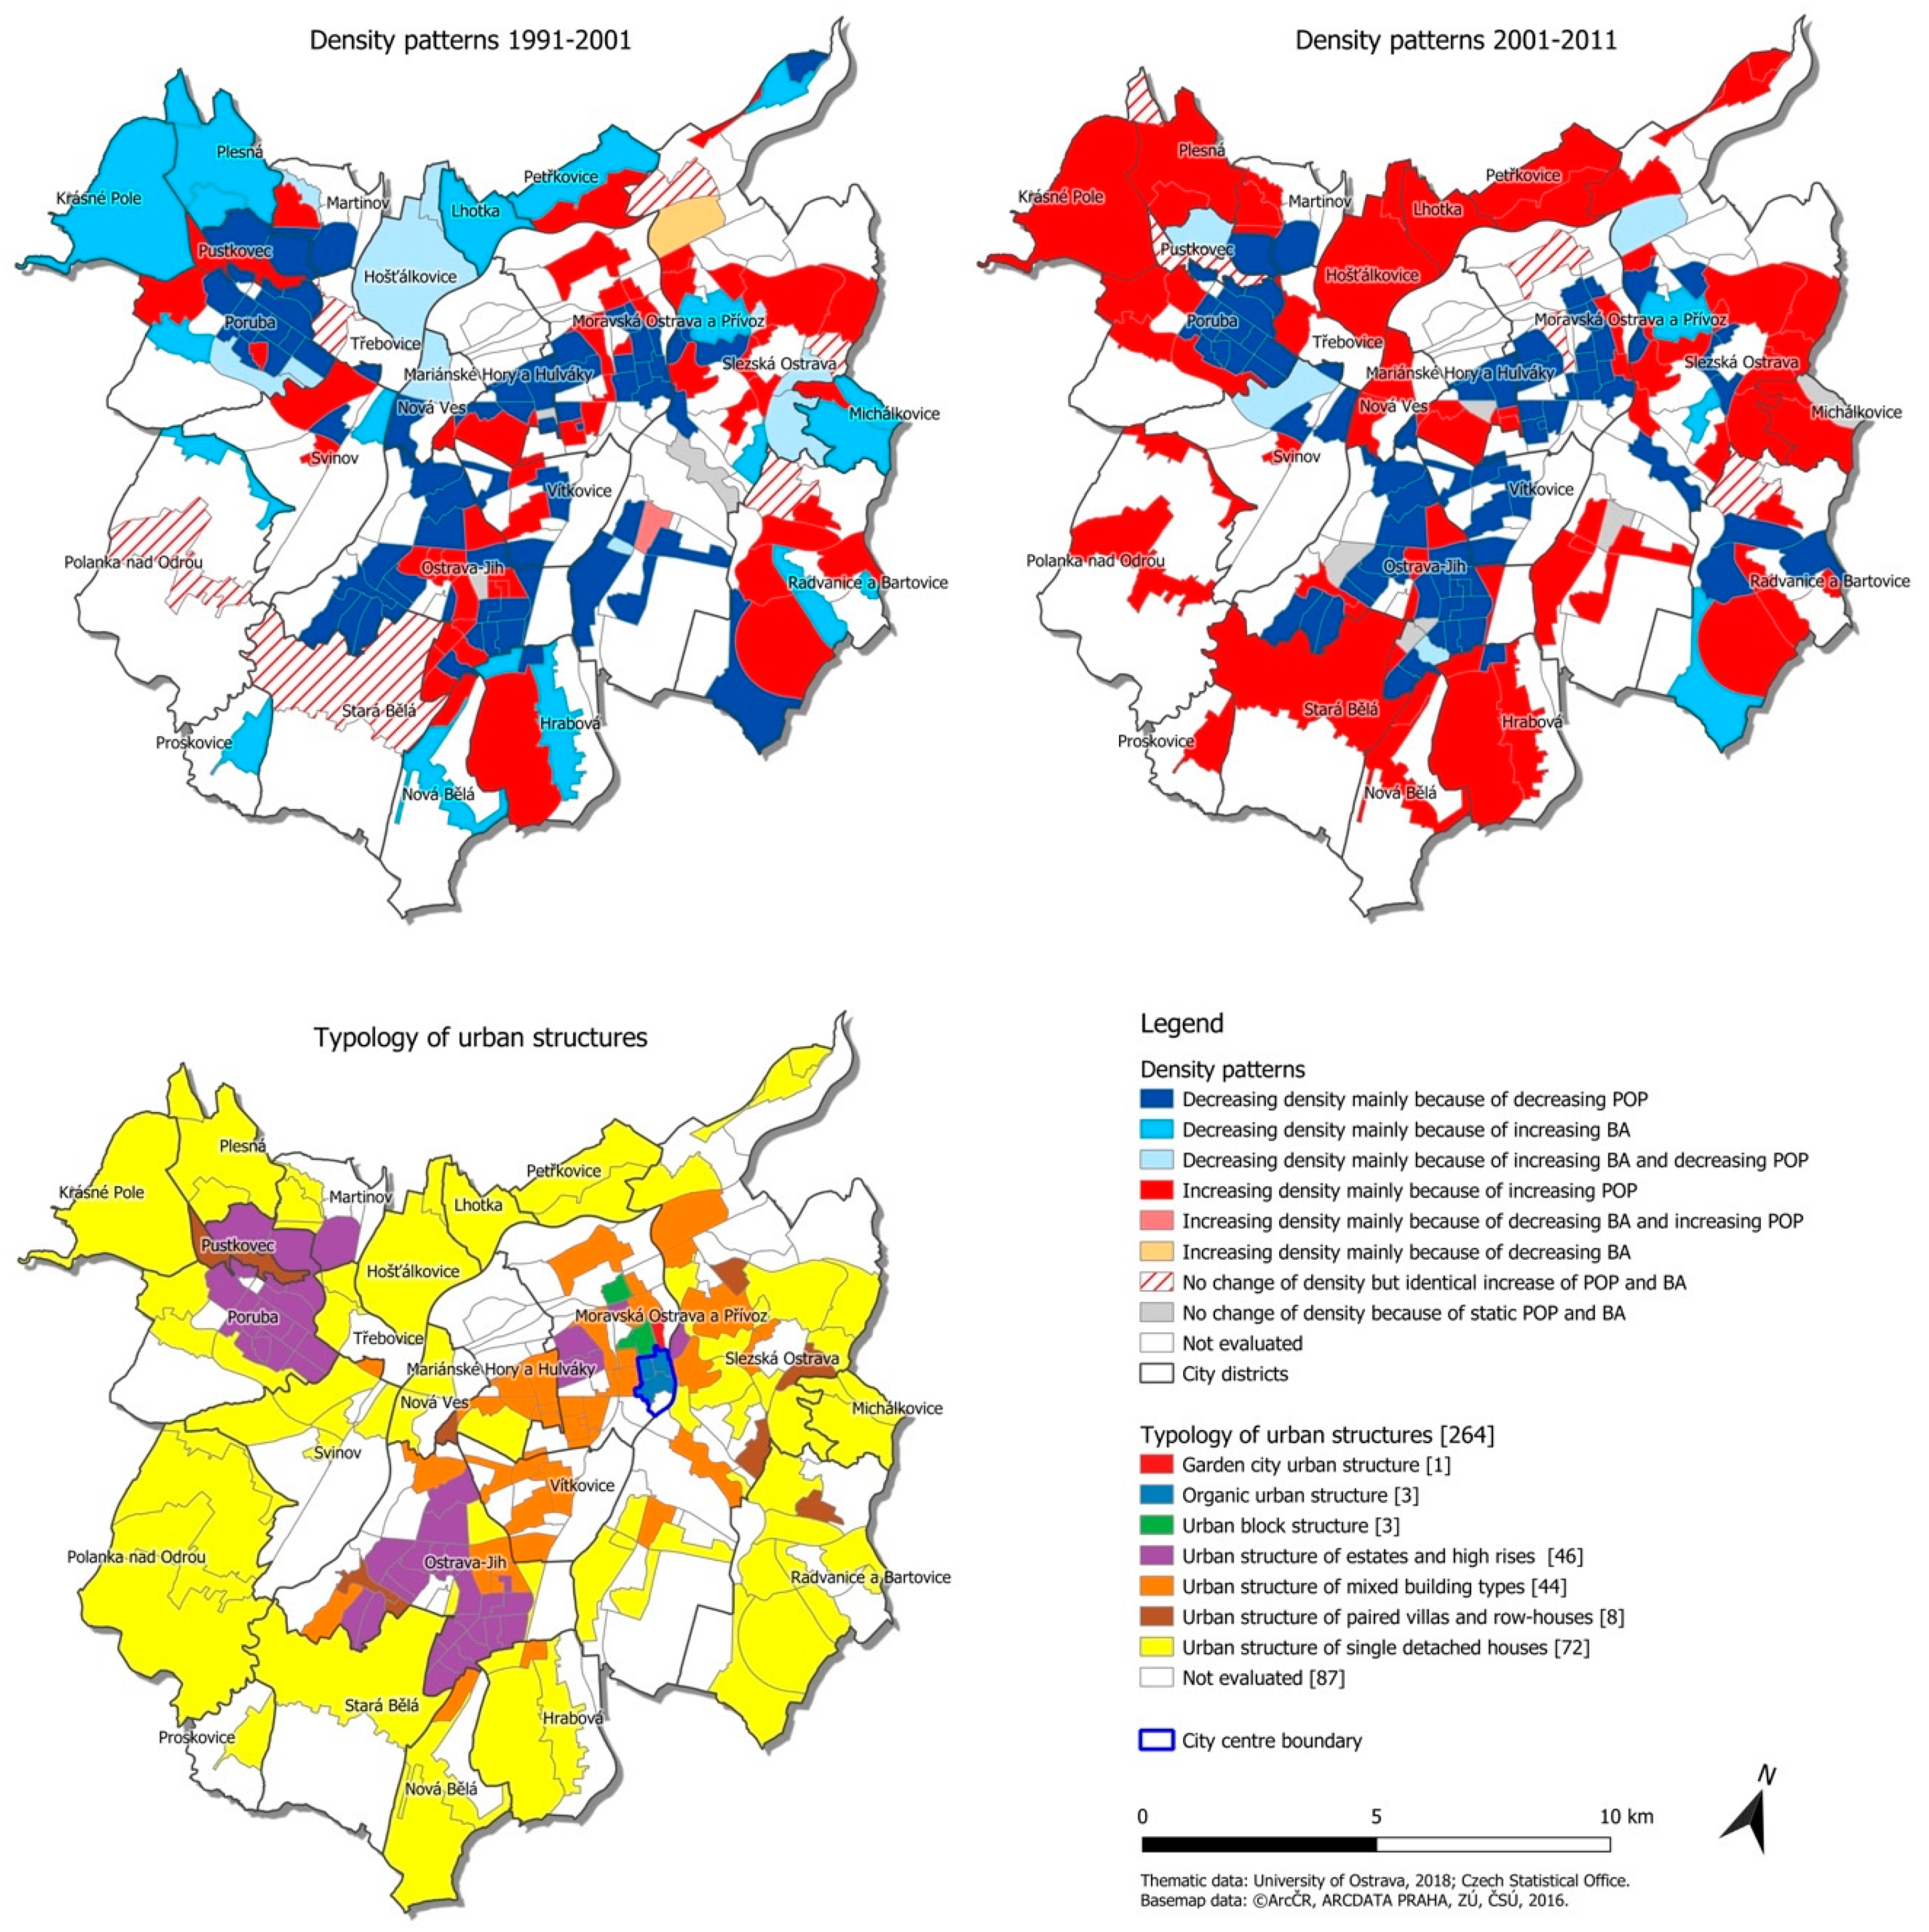
  • Organic urban structure—this group is represented by an archetypal historic city center with irregular streets and squares where public space is mainly designed for pedestrian traffic. Houses form closed irregular blocks. The organic urban structure category is relatively expensive to maintain, however, due to its usually high population density, the cost per capita is a financially very advantageous type of housing development. In the case of Ostrava, due to its industrial past, this type concerns a limited area of the city center.
  • Urban block structure—this group is characterized as compact closed blocks with a regular network of streets and pavements, complemented by greenery in the form of parks. Similarly to the previous category, this type of housing development is very effective in terms of cost per hectare due to the high population density. In the case of Ostrava, it is mainly an area adjacent to the city center with primarily a residential housing function.
  • Garden city urban structure—this category involves multi-story villas located separately in gardens with fences. The network of streets is irregular, complemented by public parks. Although it has lower maintenance costs, due to its low population density, it is one of the costliest types. In the case of Ostrava, there is only one area, near the city center, in one of the most representative housing areas.
  • Urban structure of single detached houses—a similar category to the previous one, but the built-up area is less dense. Garden area is also separated by fences, however the street network is usually regular. This type is usually not accompanied by significant public amenities. The cost per hectare is one of the costliest due to its low population density. These are represented by older built-up areas, integrated to Ostrava during the 20th century, while the recent increase is due to the suburbanization process.
  • Urban structure of paired villas and row-houses—in contrast to the previous category, it predominantly consists of semi-detached houses and terraced houses. However, despite its higher population density, this is a rather costly type of housing development. This type occurs in inner urban fringe districts, especially in the eastern part of Ostrava, but spatially is rather marginal.
  • Urban structure of mixed building types—this type of housing development is a combination of solitary structures as well as compact blocks and semi-open blocks. In the case of Ostrava, these are areas representing the cores of individual urban districts, often complemented by adjacent residential districts. Due to its usually relatively high population density, this is a relatively sustainable type of housing development. In some rare cases, these are remnants of those districts, which, due to historical development, have lost their importance or have given way to industrial production sites.
  • Urban structure of estates and high rises—this type of housing development is characterized by its large scale. The buildings are surrounded by plentiful greenery and free open space with lots of parking spaces. Public amenities are concentrated near public transport stations. Due to its high population density, it is one of the most financially advantageous types of housing development. In Ostrava, it can be found especially in Ostrava-Jih and Poruba. The latter is, however, complemented by a more generously designed public space and is characterized by a more human scale than the mass disposition of Ostrava-Jih.
The defined categories were slightly adapted to the needs of the study, as the original categorization was based on the model of the city of Prague, which has a much longer history compared to Ostrava, the higher number of representatives of individual categories, and greater spatial extent of categories. However, given the BSU scale we used, which allows for flexible coverage of changes in the type of built-up areas and population density, the results can be considered commensurate with original categorization. For an overview of the financial demands and sustainability of individual types of urban development, we also used the assumed total current expenditure per hectare based on the study by Hudeček et al. [47], shown in Table 2. To analyze the change in population density of individual BSUs depending on the change in the number of inhabitants and built-up area, we used the operationalization framework of population density as set by Wolff et al. [43], except that we also assess the units that have not undergone any change in population density. Stable density may be a result of the change in relative values through either an identical increase of population and built-up area or identical decrease of population and built-up area (see [43]). This process should allow us to analyze the financial sustainability of the built-up area more closely.

5. Profile of Study Area

The focus of the paper is based on the development of the city after 1989. Nevertheless, in the spirit of the “follow the path” method, it is necessary to briefly outline the history of urban development that has been studied more in detail elsewhere [63]. Three basic phases can be distinguished in the urban development of Ostrava (see Figure 1).
The first phase defined, based on available data, from 1869 through 1930, was characterized by massive industrialization and spontaneous urbanization, which was also typical for other cities based on the exploitation of hard coal and steel production. Due to the combination of the above-mentioned processes, spatial overlap and blending of (incompatible) functions [90], intensified by a polycentric structure from originally isolated settlement cores and production premises (mines, factories), was created. The part of the city formed in this period is often referred to as “old Ostrava”. Between 1940 and 1948, there was a small population decline (as a result of the Holocaust and the subsequent expulsion of the German population).
The second phase (1948–1989) was characterized by ongoing urbanization, already driven by “socialist” industrialization [91]. The renewed demographic growth had spatially highly differentiated impacts. These were conditioned by directive urban planning [92]. Similar to other socialist cities, large housing estates [93] were built at a considerable distance from “old Ostrava”. First was the Poruba district situated in the western part of the city, where the population increased from 1596 (1950) to 83,196 (1970), with plans for this district being even 180,000 [94]. The second large residential area was the Ostrava-Jih, where the population increased from 22,532 (1961) to 118,806 (1991). This area was also planned for a larger population (280,000).
In contrast, the process of population decline was experienced by “old Ostrava”. The area of the narrower and wider inner city of Ostrava lagged behind during the socialism in physical, functional, and social terms. An important feature was the relatively large demolitions of buildings and the controlled hollowing-out of urban structures in the city center and wider inner city, resulting in a perforated urban structure. As a result, the population of “old Ostrava” dropped from 148,281 to 90,145 (−40%) during the centrally planned economy. Thus, while in 1950 the old Ostrava concentrated approximately 68% of the entire population, in 1991 it was only 27%. At the same time, there was an intentional spatial concentration and segregation of socially disadvantaged and Roma population into the inner city from the 1960s, with approximately 43% of all Roma in the city of Ostrava residing for example, in the district of Přívoz (northern part of ”old Ostrava”) [95].
Since the early 1970s, we have been observing stagnation of the socialist growth model, which was also reflected in a decrease in growth dynamics in Ostrava. Here, since 1975, the importance of immigration has been declining, with the demographic growth becoming dependent on natural growth. In addition, the surrounding rural communities were integrated into Ostrava in the mid-1970s [96]. If socialist cities were considered generally more compact and characterized by higher density than their capitalist counterparts [97], Ostrava was the exception. In its case, it was fragmented and sprawling city over an area of 214 km2 [98] with a lot of green areas. At the turn of the second and third phase (in 1990), Ostrava had a population density (inhabitants per square mile) of 4,000, while Atlanta, being a “poster child” of the sprawling city [99], had in 1990 3,000 ([100] cit. in [101] p. 26), and a comparable city of Leipzig, which also has fought suburbanization and shrinkage, had more than a double the density of Ostrava in 1990 [102]. In addition, the city was designed by socialist planners to accommodate 500,000 inhabitants, which was partly reflected by the built technical and social infrastructure.
The third phase (1989–present) is then characterized by the urban shrinkage process. Between 1990 and 2018, the population decreased to 287,265 (−13.4%) not including foreigners (11,000). The causes of urban shrinkage are basically not much different from other cities in post-socialist Europe [103]. Rumpel and Slach [104] identified the following specific causes of shrinkage:
(a)
Environmental factors: Environmental pollution, especially air pollution, is one of the main reasons for outmigration from Ostrava. Despite the fact that the amount of total emissions dropped from 35,000 tons (1990) to 929 tons (2012) [105], Ostrava is one of the most polluted cities in Europe [106]. Poor environmental quality still acts as a key push factor, especially for the educated population (see below). Another environmental burden is brownfields, which account for 8.4% of the city’s area [107].
(b)
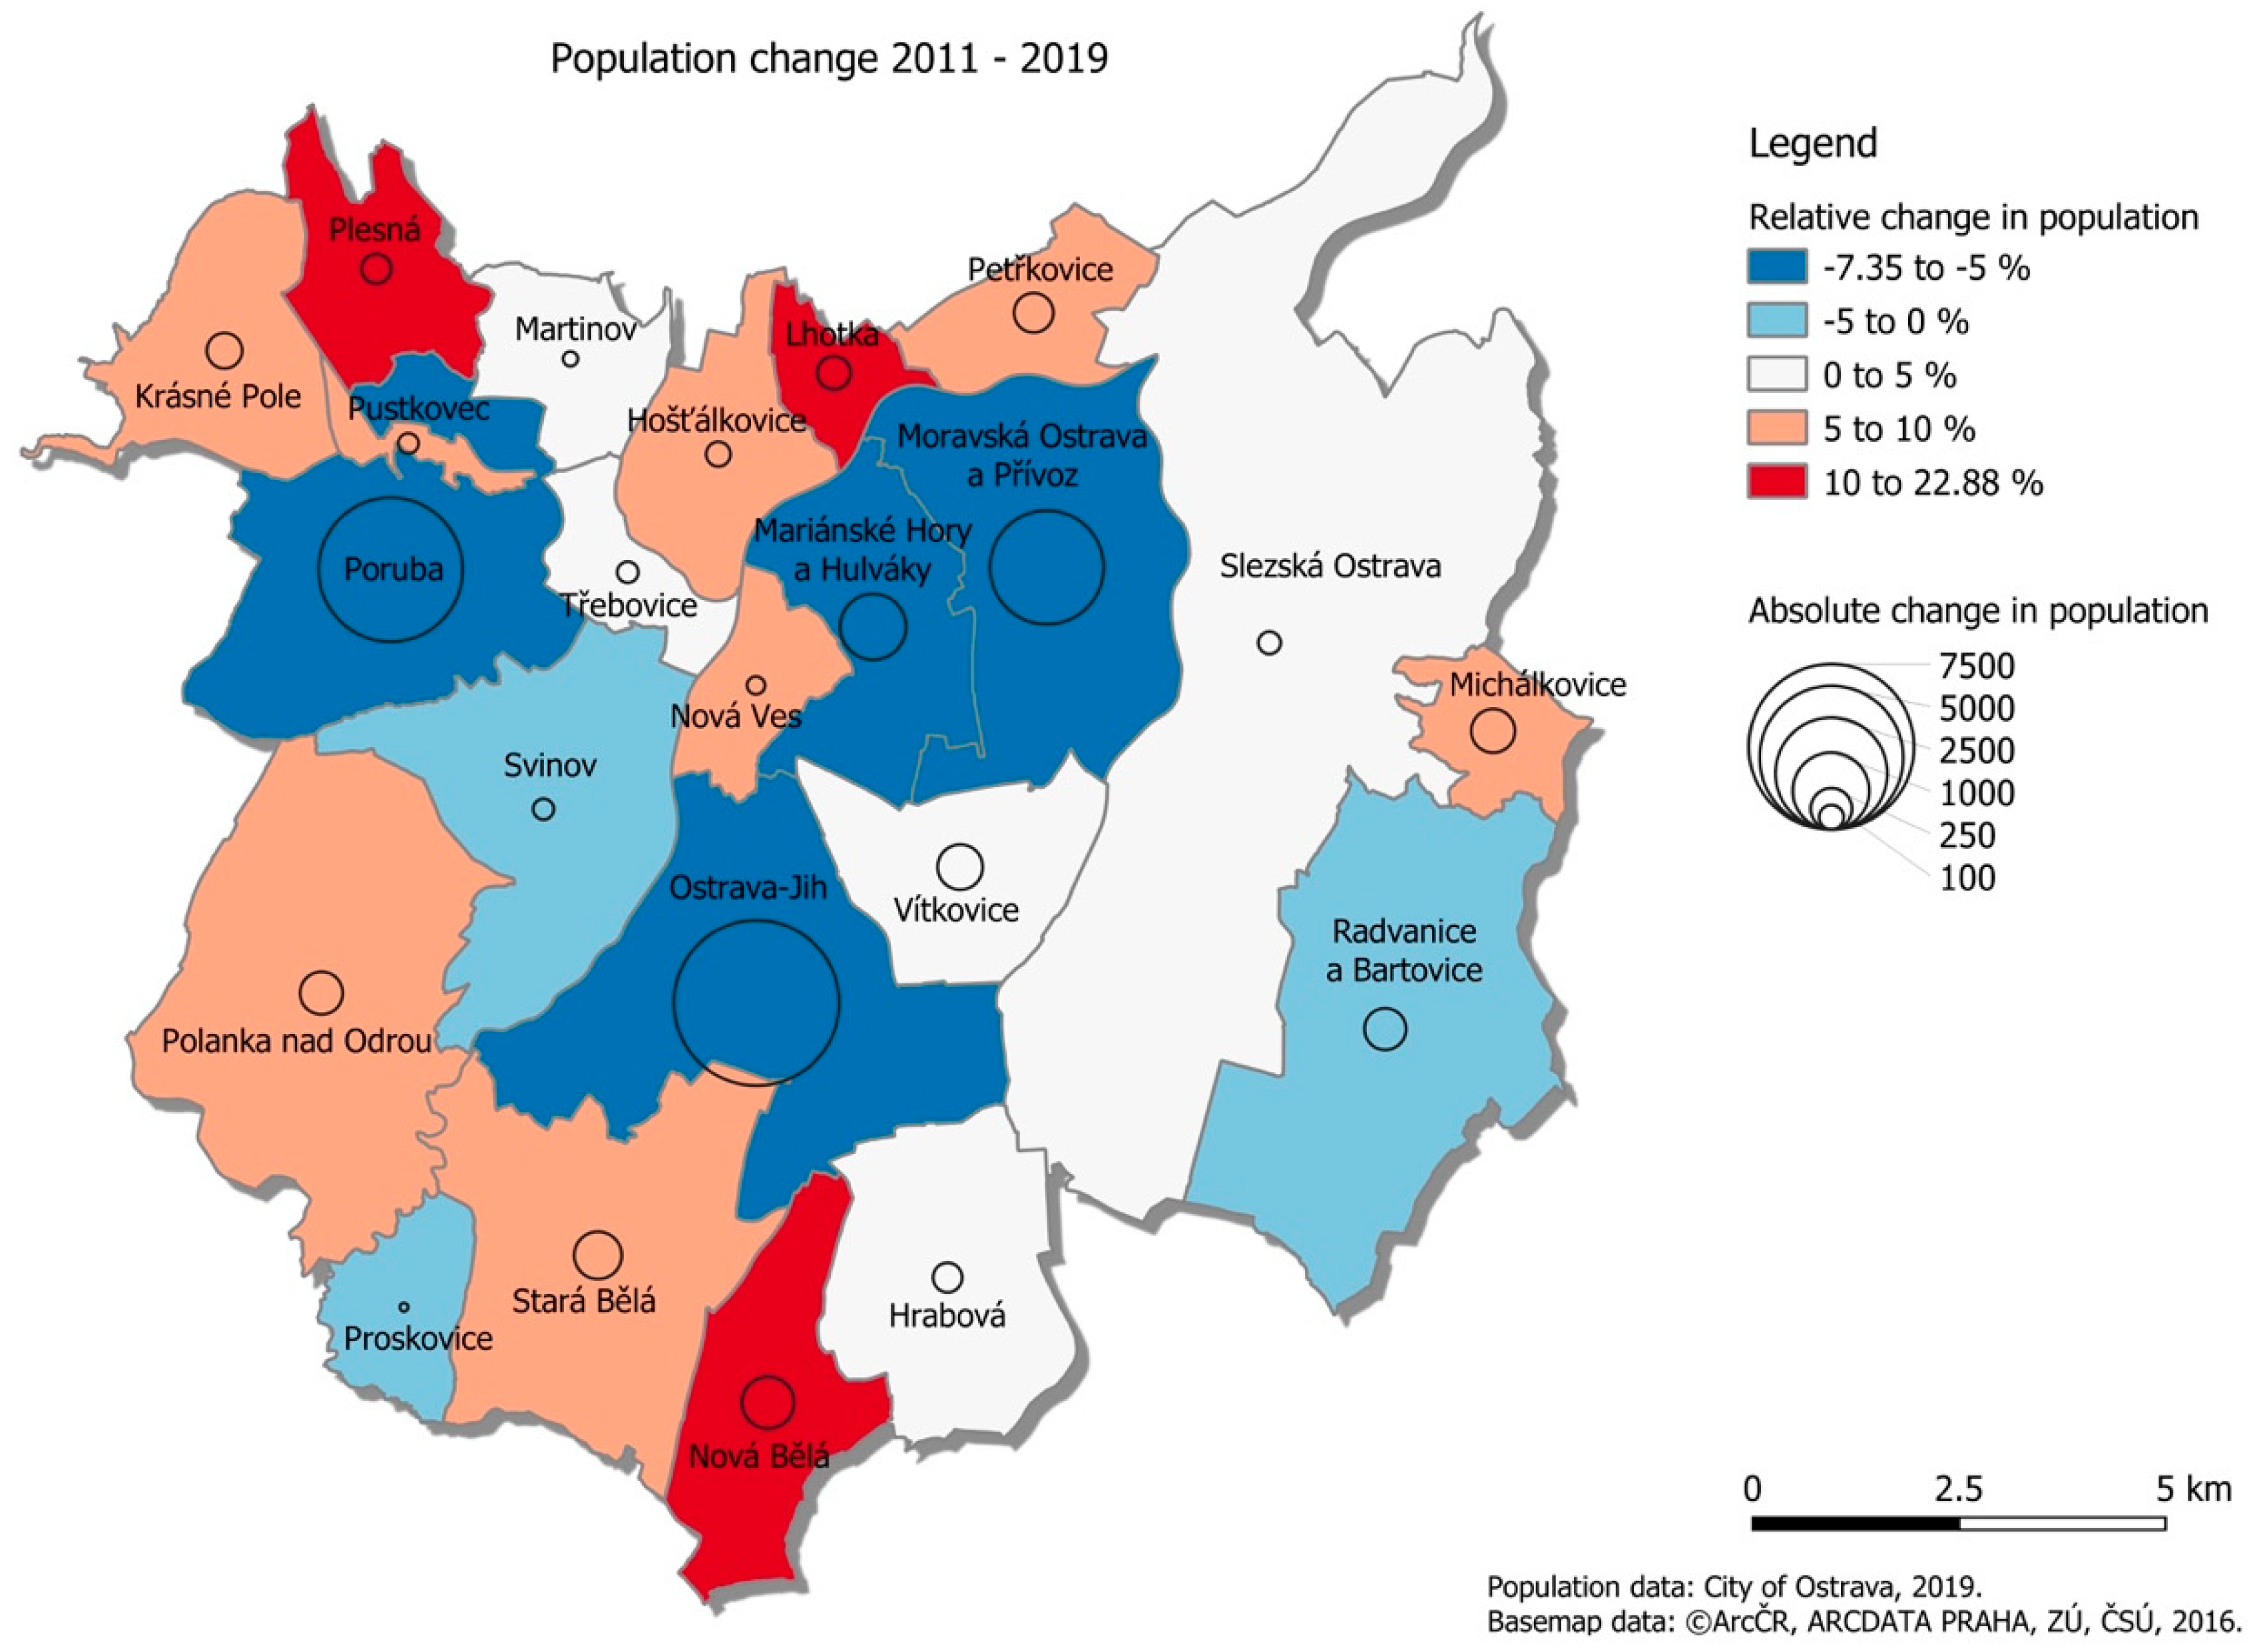
Suburbanization: Outmigration in particular by escaping from an unsatisfactory urban environment, known as escapism (cf. [108]). The main migration flows are directed to the south-eastern or north-western part of the region [109], which have better environmental conditions. The paradox is that air quality in some (close) suburban locations is not significantly different from Ostrava [105]. We should also not neglect the impact of poor-quality housing stock or virtually non-existent spatial regulation. In the population decline of the city, suburbanization accounts for more than 60%, losing approximately 3000 inhabitants in favor of suburban locations between 2012 and 2017 [110].
(c)
Economic factors: Transformation of the economy in the form of deindustrialization accompanied by weak growth of the service sector. Between 1989 and 1999, approximately 50,000 jobs were lost in hard coal mining and manufacturing industry. The crisis of the region culminated in 2004 (18.4% unemployment rate), but since then the city has been growing economically thanks to the inflow of foreign direct investment [63], except for the period of economic crisis between 2008 and 2011. This economic growth was also reflected in the unemployment rate reaching 5.1% in 2019 [111]. An interesting fact is that Ostrava is one of the most economically successful regions in Czechia during the transition period [112], despite that its population is still declining.
(d)
Outmigration: The lack of attractive job opportunities is listed as the main cause of outmigration from Ostrava. It is mainly characterized by the selective outmigration of young, highly qualified people (brain-drain). In recent years, also thanks to the above-mentioned economic growth and low unemployment rate, the issues related to the environment and quality of life have been in the center of attention [113]. To illustrate this, between 2012 and 2017, 1600 residents moved from Ostrava to Prague and its surroundings [114].
(e)
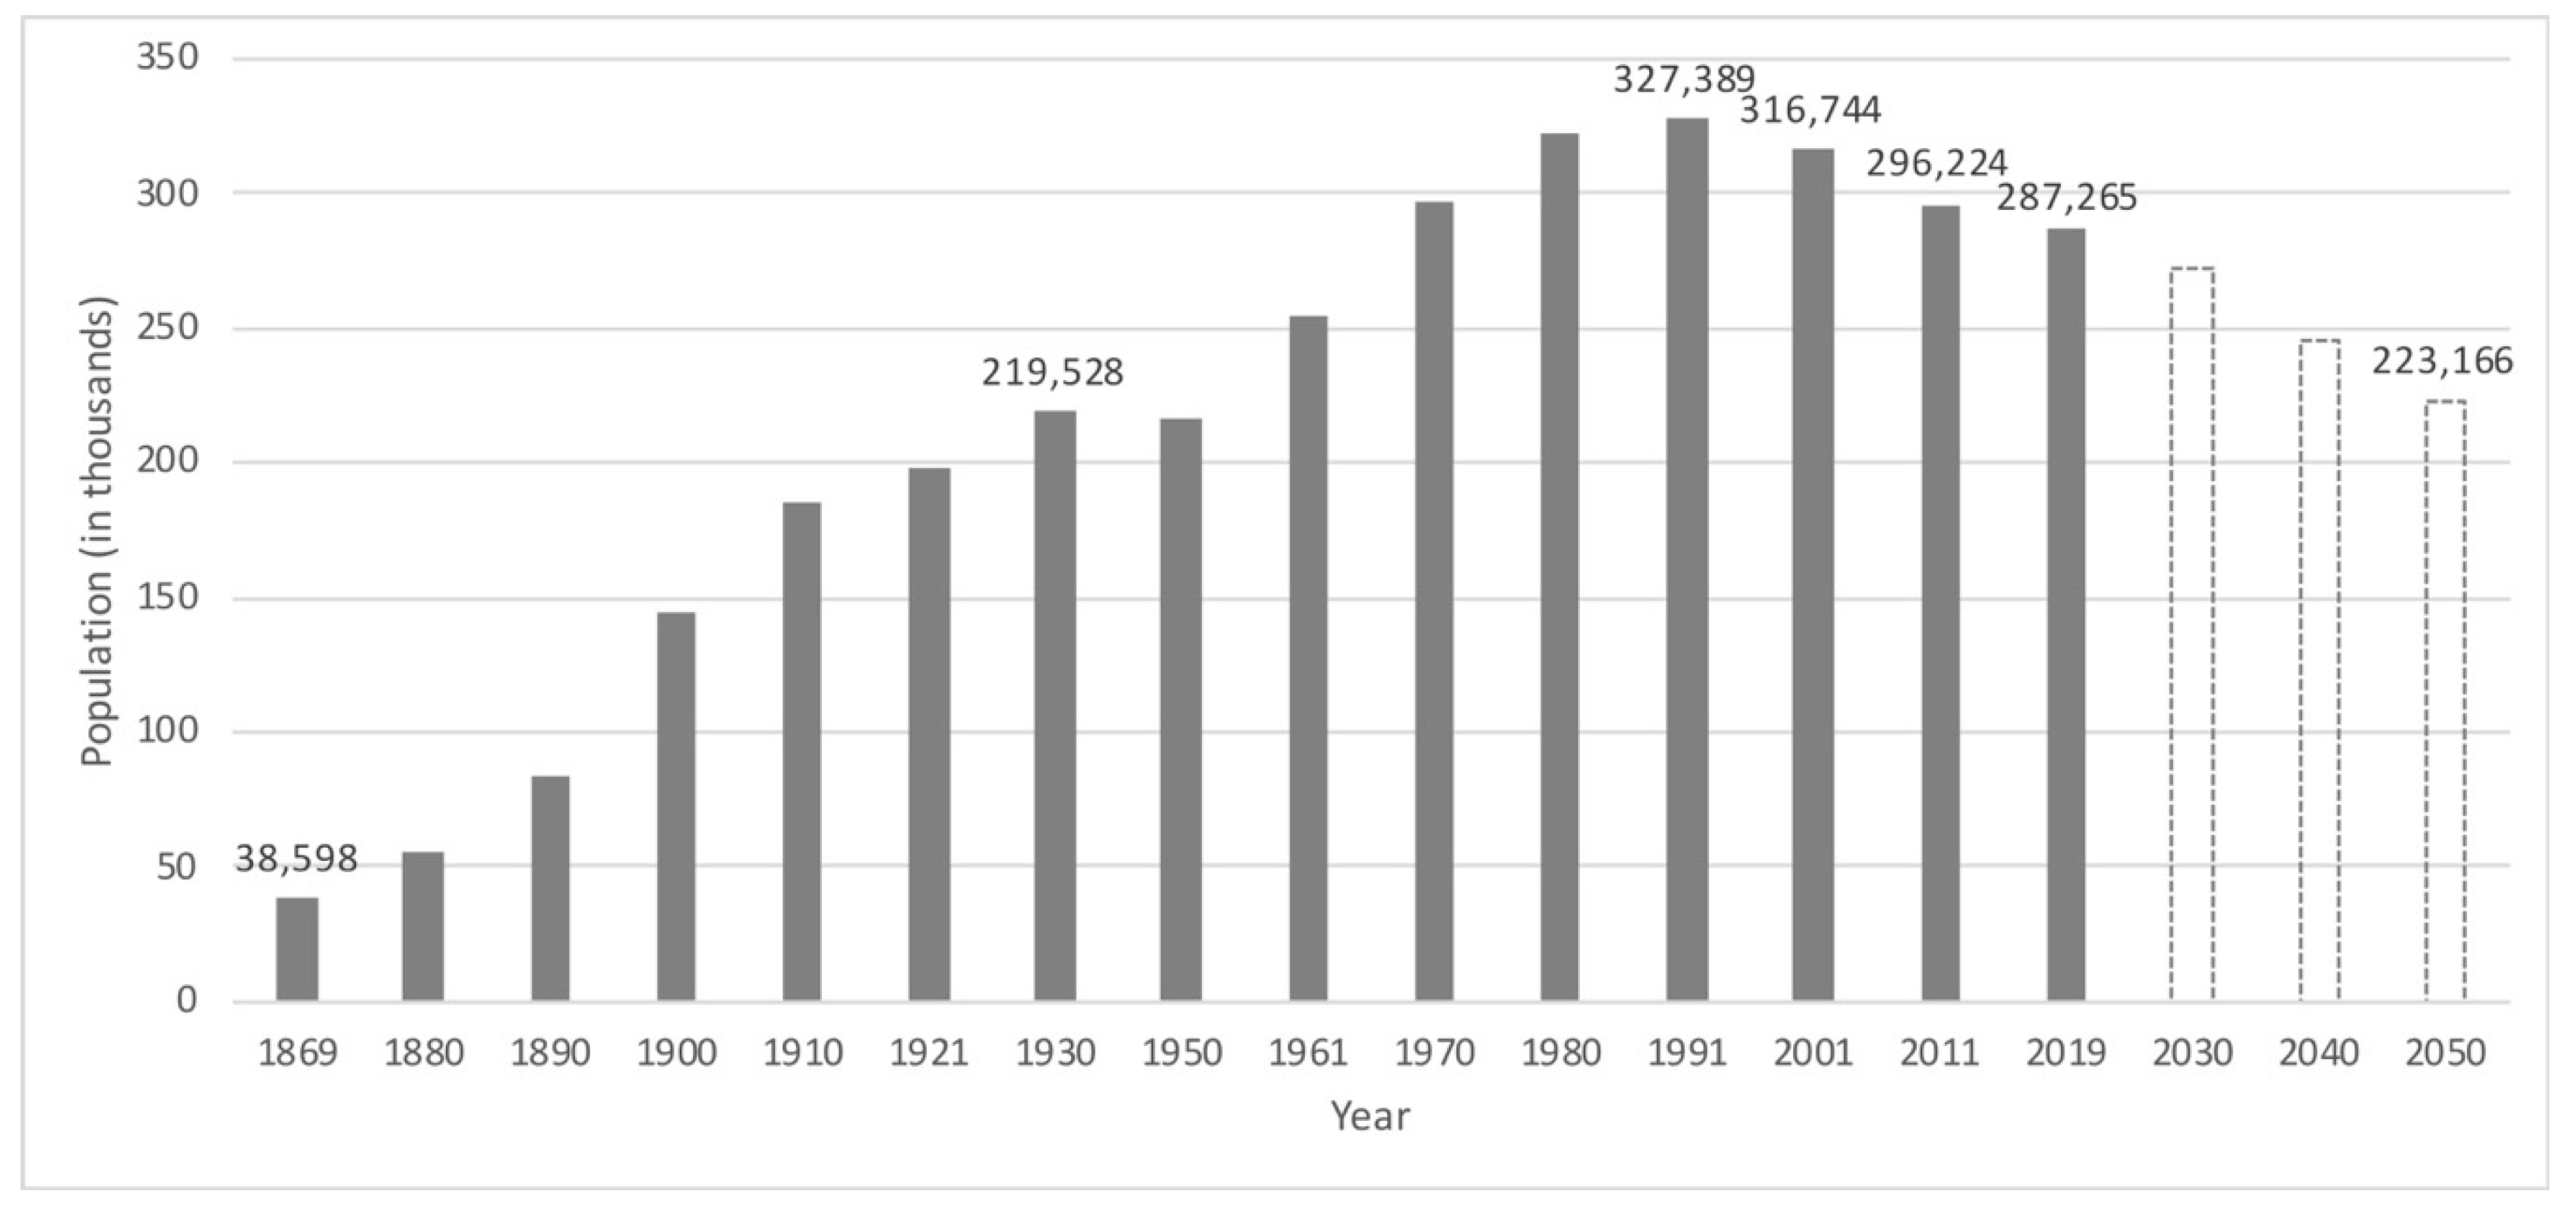
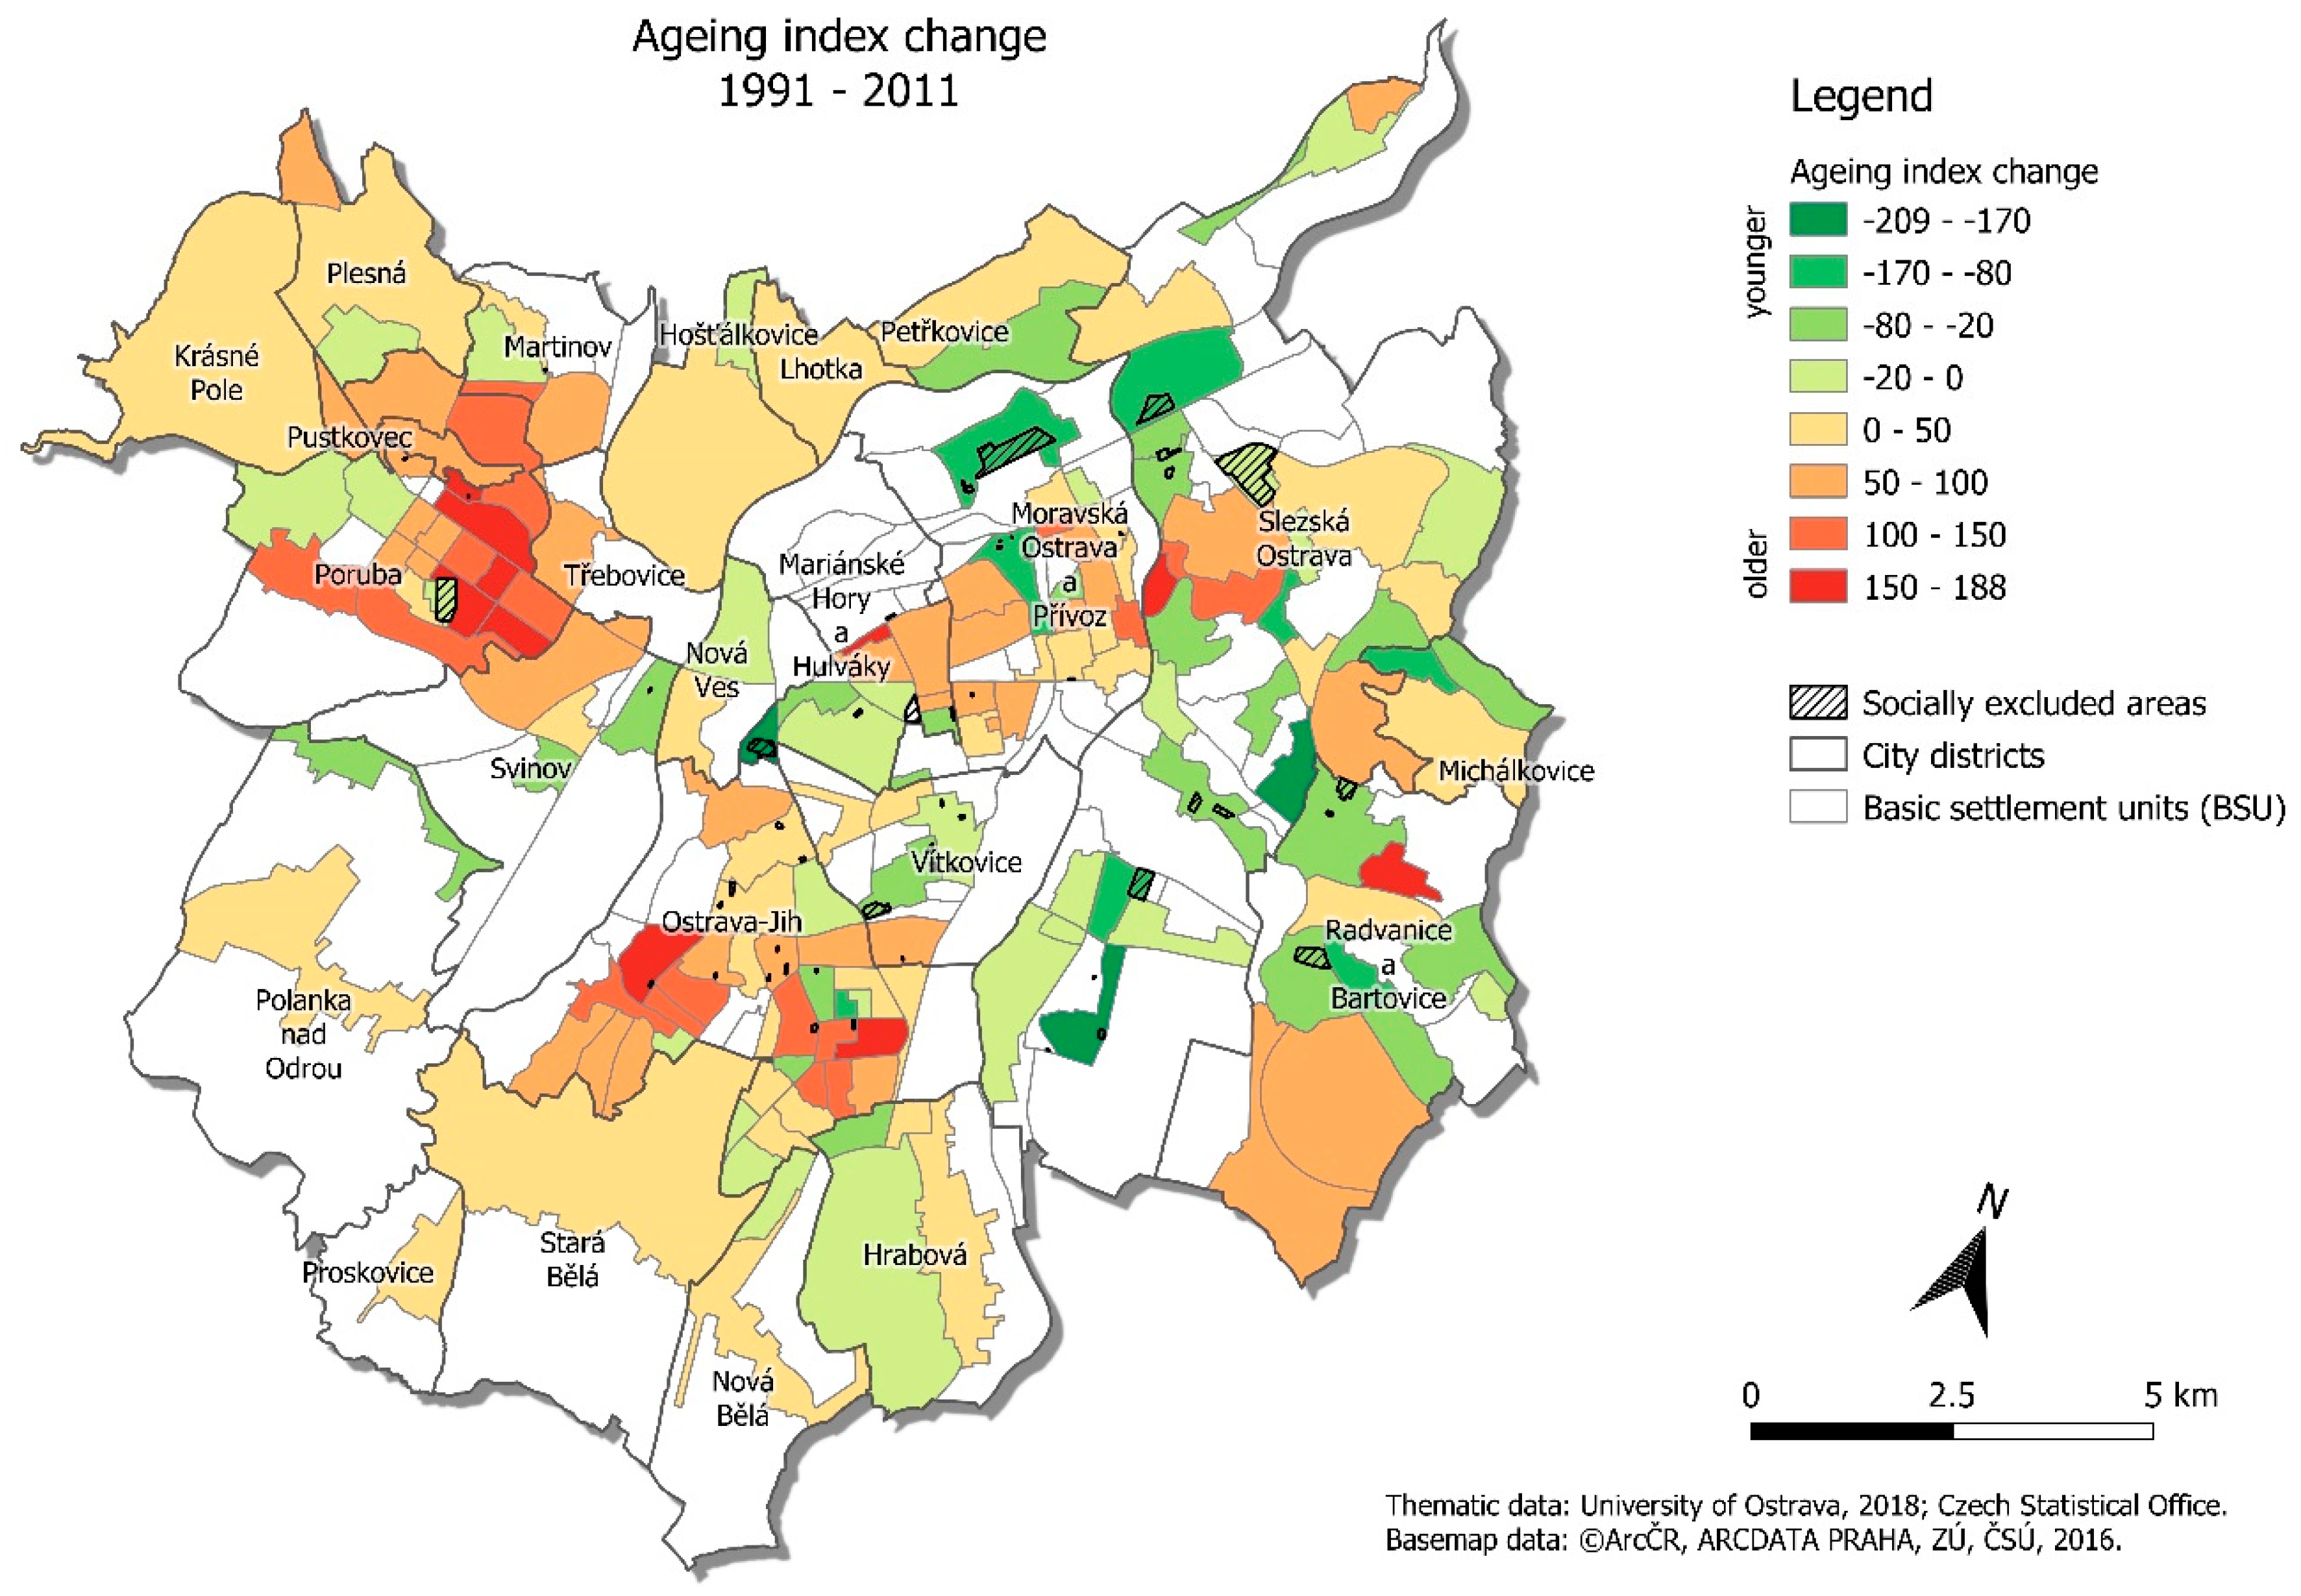
Natural demographic changes are also an important factor in the shrinkage of Ostrava. In addition to the decline in the number of births (1990: 4516, 2017: 2970 [115]), aging is a major process that can be documented by the aging index, which expresses how many people aged 65 and over account for 100 children under 15 years of age. In 1991, Ostrava’s aging index was 55.5, thus Ostrava was one of the youngest big cities in the Czechia in terms of demography when in 2012 the aging index was 114 and in 2025 is expected to reach 158 [116] (see Figure 2).
(f)
Policy response: The dominant strategy focused on the attraction of investment and economic growth, while other causes and consequences (see below) of shrinkage were trivialized (cf. [51]). Although we may have seen a more proactive approach to countering shrinkage [51], aimed at mismatch on a real estate market, segregation, brownfield regeneration and industrial heritage utilization [90], it is rather isolated cases (thematically or spatially), the funding of which is dependent on external sources [116]. Despite these efforts (especially in recent years), some shrinkage impacts have intensified.
The consequences of shrinkage will be documented in detail on the example of spatial changes in population density. We should note that it is not possible to clearly separate causes and consequences as they are mutually reinforcing. Briefly, we can list the following impacts of shrinkage:
(a)
Outmigration driven by the need for jobs, higher quality of life, and overall higher life expectations (cf. socio-economic escalator [117]) weakens the region’s knowledge base and deepens the labor market mismatch, because of its selective nature, the “gap” grows between the required and available workforce. To some extent, the possibility of further growth of hi-tech [118] and other promising industries as well as overall urban development of Ostrava is “curbed”. Although this effect is limited due to the economic boom.
(b)
Through social filtration, i.e., outflow of the middle and upper classes and families with children (the main source group), the demographic and also economic (outflow of purchasing power) potential of the city decreases [109]. At the same time, many residents still work in the city and use its publicly subsidized services, although they live elsewhere. Other aspects such as increasing traffic load and the mismatch between existing and available social and technical infrastructure (sewer system, schools, etc.) in the inner city and the outskirts of the city [119] cannot be omitted. Given the absence of mutual social and economic coordination, the existing suburbanization process bears the characteristics of parasitic urbanization [120]. To summarize, there is a simultaneous increase in spending and a decrease in revenues of local government.
(c)
The shrinking process accelerates social segregation [119]. Research confirms an increase in residential segregation in the form of socially excluded localities in Ostrava [121]. These are usually concentrated in a compact inner city in abandoned localities or near brownfields [122]. Essentially, the patterns that have already historically existed deepen. According to rough estimates, around 6000 persons live in excluded localities, another 8000 live in second-class housing (boarding houses), and another 20,000 persons in Ostrava are at risk of losing their homes. Between 2006 and 2015, the number of excluded localities and boarding houses increased from 10 to 57 [123]. Moreover, residential segregation can be considered to be the cause and effect of shrinkage (cf. [82]).
On the other hand, it is appropriate to mention the following specifics, especially from the national context. Unlike most shrinking cities, Ostrava does not face the issue of empty flats and the need for extensive demolition to any significant extent, which is generally the result of inherited housing shortage from the era of a centrally planned economy. Lastly, although the city’s population continues to decline, it is not reflected in its revenues. The dominant source of revenues for the municipal budget (approximately 80%) is the centrally redistributed revenue from shared taxes by the number of residents (in detail [116,124]). What is important is that these revenues are tied to the state of the national economy, which explains why, despite the decline in population, the municipal income is growing from these taxes. In the crisis year 2010, Ostrava received 221 million EUR from shared taxes (the total budget was 248 million EUR). In 2018, shared tax revenues amounted to 283 million EUR (a total of 383 million EUR). In particular, the inflow of money from EU funds contributes to an increase in sources apart from tax sharing. However, the city is losing its finances, because if the 1990 population were maintained, the budget would be theoretically higher by almost 40 million EUR.

6. Results: Evolution of Spatial Patterns of Intra-urban Population Density

Our results provide the following picture. The demographic decline during the first monitored period in Ostrava (1991–2001) was relatively weak at the micro-level (−3.46%), therefore the population density changes were also relatively weak (see Figure 3, for detailed analysis use Figure S1 in Supplementary Material). Their development was also greatly influenced by inherited patterns from centrally planned economy, with the first transition years being characterized by a relatively low unemployment rate (until 1997), a decline in construction due to real price growth, and real income decline (cf. [125]) and by gradual development of supportive instruments of the housing supply (cf. [126]).
The largest decline in population density was recorded in the historic city center and some resurrecting BSUs in the inner city corresponding to the organic urban structure and the urban block structure. This was mainly the result of the dynamic growth of the service sector in the form of commercialization (cf. [127]) since this sector was extremely under-dimensioned during the centrally planned economy. In the city center of Ostrava, many units were rebuilt from residential to serve commercial use. Population density increased slightly through in-fill development in residentially attractive locations in the dispersed inner city, where extensive demolitions took place in the past and in the areas near parks. The population density increase was typical for the localities with low-quality housing stock neglected during the socialist period in the northern part of Ostrava inner city. Unlike large housing estates, the decline was not accompanied by an increase in the age index, the opposite was true–it dropped here due to a higher birth rate of socially weaker population and lower life expectancy (cf. [128], see Figure 2), and at the same time the floor area per capita decreased, all of which reflected the social filtration process. Interestingly, this locality went through a decline in the given period and was described as socially excluded. This development demonstrates that the change in population density is an ambiguous indicator and other indicators need to be taken into account in order to produce accurate interpretation.
The most visible example of the decline in built-up areas is the Hrušov locality, where the long-term decline was accelerated by floods in 1997 resulting in this area becoming the most devastated locality in Ostrava [129,130]. The structures of estates and high rises in “old Ostrava” and also in Poruba and Ostrava-Jih were displaying a slight decrease in population density, but there were also growing localities. In the Poruba district, it was one of the largest socially excluded localities [122], and in the Ostrava-Jih district, the growth was driven by the construction of apartment buildings on the edge of the structure of estate and high rises. The most homogeneous in the population density change were localities situated in attractive inner-urban fringe districts, although population density growth was moderate. An interesting fact was that the number of inhabitants of Ostrava-South remained virtually unchanged, while in Poruba, despite its higher perceived attractiveness, the number of inhabitants decreased by 9002 (−10.7%). A key role here is played by the earlier construction of this housing estate.
In the second monitored period (2001–2011), the shrinkage process accelerated (−6.93% of the population), and the same can be said for spatial population density patterns. The period of economic stagnation was replaced by dynamic economic growth in 2004 and delayed suburbanization gradation, which started in the Czechia after 2002 (cf. [126]). In the central part of Ostrava, the number of residents in residentially attractive localities near greenery and water has increased significantly. A good example is a locality adjacent to the main city park. Residential buildings were constructed by developers here, which led to an increase in the number of inhabitants from 804 to 1343 over one decade. Identical patterns can be traced to the already described localities in the dispersed inner city, with an above-average proportion of university-educated people being typical for all growing localities in attractive city parts, which can be seen as an indicator of higher socio-economic status. However, the city center as a whole was losing population. Another typical category is socially segregated localities in the northern part of the inner city. These are generally population-wise stable localities with decreasing age index and the minimum representation of university-educated people, as well as with degrading built-up environment (cf. [131]). The prevailing trend in the densely built-up area of the city center and the inner city is the de-densification driven mainly by the aging process and increases in single-person households.
A similar trend, but in a more intense form, is seen in large housing estates. The ongoing decline in density in the Poruba district is mainly due to the aging process and generally decreasing household sizes (some localities had an age index of 240), even though the adjacent, initially rural communities are growing. In comparison with the previous period, the process of de-densification in Ostrava-Jih was intensified. Again, growing or stable localities in terms of population are characterized either by the fact that they were originally sparsely built-up areas, where new homes are being built, or we are referring to socially excluded localities with decreasing age index. Inner-urban fringe districts grew most visibly and significantly, however, the population density increase was relatively small. The overall picture of changes in population density in Ostrava is closest to the patchwork city model. However, if we take into account the polycentric character of Ostrava with three dominant cores, namely the city centre in the district of Moravská Ostrava and Přívoz, Ostrava-Jih, and Poruba, there is an apparent hollowing-out of the inner city syndrome, where individual de-densified city cores are surrounded by newly densified areas formed by in particular urban structures of single detached houses, creating a perforated structure.

7. Connecting Population Density Changes and Sustainability

The above-mentioned changes in spatial patterns indicate a potential pitfall in relation to the sustainability of urban development. Despite an overall decreasing trend in the population of the city of Ostrava (−10.1%), a built-up area has increased (7.5%) during 1991–2011, which is obviously reflected in a decrease in the average population density. When looking at developments in individual researched BSUs, further trends can be observed at the micro level leading to deterioration in the city sustainability (see Table 2). On the one hand, structures characterized by high population density, such as organic urban structures, urban block structures and urban structures of housing estates have been declining over a long period of time in terms of the population density. This development leads to the fact that the most financially sustainable parts of the city are becoming more expensive per capita, thus gradually losing this advantage. The organic urban structure category has, due to this development, even approached the 100/ha limit, which is considered to be borderline for efficient housing development from a financial perspective. On the other hand, we can observe the trend of expanding of the urban structure area with low population density.
The vast majority of the urban housing development growth in the Ostrava area was driven by an urban structure of single detached houses, which is one of the most expensive structures per capita. This development represents a double trap for Ostrava, because on one hand the revenues from population size decreases, and on the other hand, the maintenance costs of the urban structure itself are increased by reducing the sustainability of economically advantageous types of housing development and by increasing the areas of financially disadvantageous urban structures. Currently, the development of infrastructure (e.g., planned new buildings for the Scientific Library or Philharmonic Orchestra), but also a considerable part of regeneration projects for some selected Ostrava sites is subsidized by EU funds or national funds (Lower Vitkovice Area, Black Meadow). However, these funds are intended for construction only, whereas the financial burden that the operation and maintenance of the implemented projects will represent for the city budget in the future is not taken into account. Similar investments in shrinking cities, while ignoring the unavailability of adequate housing for low-income groups, appear, according to Silverman ”...paradoxical and grotesque” [132] (p. 6). In addition, this strategy setting of land use development does not reflect the obsolescence of older types of housing development and infrastructure, which primarily documents the city’s pro-growth orientation.
Figure 4 shows that identified trends have actually continued after the monitored period (1991–2011), when, however, the data are only available disaggregated to whole city districts. Those districts with dominating urban structure of single detached houses show sustained population growth, confirming the importance of inner-suburbanization. In the center of Ostrava, there is a mitigation of depopulation in selected areas, and similar patterns are in the inner city, but it should be noted that these are usually socially excluded localities. Urban structures of estates and high rises in terms of population decline further. Their decline is driven mainly by aging, and due to low residential attractiveness resulting in a low inflow of new residents, which is especially the case of Ostrava-Jih district. According to the demographic projection [89], Ostrava copies the lower, pessimistic variant, according to which the Ostrava population should be only approximately 223,000 people by 2050, which represents a shrinkage of approximately one-third of the population compared to the peak.
Again, shrinkage does not necessarily have to bring negative effects, but it depends on the city’s response to this problem. In the first decades following 1989, the problem was rather trivialized, as evidenced by a statement made in 2012 by the then Mayor: “And there (Pittsburgh) the population declined from approximately half a million to three hundred thousand people. So, we haven’t ended up so badly yet” [133]. As already indicated, there has been some shift in recent years, but this is somewhat ambivalent. On the one hand, the vision of the city’s current strategy is to mitigate the negative migration balance by attracting new (especially young) residents, while on the other hand the current Mayor expresses the conviction that “[i]f Ostrava only ends up having 250,000 people in the end, but they are all happy, it won’t mind” [134]. In other words, the city adopted an almost solely pro-growth strategy to countering shrinkage [51], therefore instruments related to the management of decline have been ignored [116]. Obviously, the question is not whether the city will or will not implement such instruments, but when and at what price (cf. [70]).

8. Discusion and Conclusions

The paper aimed to analyze and assess the nexus between spatial patterns of population density and their sustainability in the context of the shrinking city of Ostrava, which was for better understanding set in the context of a dominant strategy of responding to urban shrinkage. The main findings of the research can be summarized as follows.
The city entered a transition period with a highly fragmented and sprawled urban structure inherited from the past, with the overall decline in the average population density of the BSUs (1991: 73.3 inhabitants/ha, 2011: 61.26 inhabitants/ha) being relatively modest. Much more substantial changes took place at an intra-urban level. The evolution of spatial patterns of population densities at this level pointed to processes of three types, showing some connection between shrinkage intensity and fragmentation of spatial patterns of population densities. First, the most visible manifestation is the continued hollowing-out of three Ostrava cores in favor of less densely built-up areas situated on the city fringe, being a crystalline example of inner-suburbanization. Here the number of inhabitants and also the built-up area are growing. Secondly, in some parts of the center and inner city, “pockets” of population density growth of two types are formed. The first type is localities driven by higher socio-economic status inhabitants in attractive locations in the city center and inner city, while the latter type is characterized by the growth driven by socially weaker population groups.
In the localities of large housing estates, which are losing population, there is the second listed type of (socially excluded) locality or the localities with single housing units with a high age index. To summarize, the evolution after 1989 accelerated and intensified the inherited fragmented and sprawled structure, which is also illustrated by the mismatch between population decline and built-up area growth. Surprisingly, it seems, at least, in contrast to the outlined development, that the extent of demolition is minor. This phenomenon can be attributed to the combination of inherited housing shortage, and the growth of the number of one- and two-person households due to aging, especially in large housing estates.
However, the most significant implication is the change in population densities in relation to the sustainability of public finances. The results clearly show that the change in population densities continuously increases costs and thus reduces sustainability. Basically, in the localities with a high population density that are cheaper in terms of their maintenance, the population is declining, and vice versa. In addition, while the built-up area of the first group is stagnating, costly maintenance localities are experiencing relatively rapid growth. If the lower variant of demographic development forecast is fulfilled, it can be assumed that a number of localities with the population above a critical threshold of 100 inhabitants/ha would fall below this threshold if the existing built-up area was maintained. Already in 2011, despite both the qualitative and quantitative development of the service industry, the very center of Ostrava was already at this level, with the less equipped and less attractive locations likely to follow this trend even more intensively. The results found are in contrast to the city’s approach addressing urban shrinkage impacts.
Corresponding with the adapted neoliberal pro-growth governance regime, emphasis has been placed on the economic revitalization of the city over the long term, which was supposed to subsequently also solve social or demographic problems. Despite a partial shift in recent years in the perception of urban shrinkage, responses are, compared to the previous pro-growth strategy aimed at attraction of foreign direct investment, focused instead on the attraction of young and educated people, but without any adequate measures. The ongoing suburbanization process suggests that, similar to other industrial cities, Ostrava is attractive to work in, but not to live in (cf. [135]), and while other cities have used economic growth for reurbanization by making the inner city more attractive [7], Ostrava has thus far missed this opportunity to increase sustainability.
Ignoring the unsustainable pathway of urban shrinkage also corresponds to the good financial condition of the city, which, similar to other shrinking cities, is dependent on external sources and decision-making mechanisms [11]. In the opposite sense, one can cite the experience that “the awareness of the challenges brought about by shrinkage developed only when related problems became highly visible” [10] (p. 11). In the case of Ostrava, it seems that the acceptance of urban shrinkage and the resulting measures will most likely be driven by a change of external environment. It can be stated that the city is becoming more vulnerable, losing its ability to influence its own destiny in the long run.
Furthermore, this case study provides implications for the research agenda of shrinking cities. Findings show the financial unsustainability of neoliberal pro-growth governance in shrinking cities [22], and its vulnerability to external influences. Although the shrinking process has not yet significantly affected the city’s revenues or economic growth, in the long run, a possible change in the external environment, combined with long-term local trivialization of the process, could bring a profound structural crisis. This may be potentiated by the long inertia of the development of demographic and physical structures, or by the high cost of possible remediation, which, given the limited powers of the municipality, will not be easy to implement. Here, the proverb “prevention is better than cure” proves true (cf. [66]). If we paraphrase Rink et al. [11], we can state that Ostrava serves as the “worst practice” city, a city that, despite rising revenues and economy, continues to lose its population, thus creating a problematic future situation. We have documented the case of the spatially growing shrinking city, which can serve as a warning to cities in a similar situation before they choose this path of development. Through the lens of EEG, based on the abovementioned results, we can conclude that the identified development path has intensified inherited negative path dependency and thus creates a constraining rather than enabling environment for the more sustainable development path (cf. [136]). To put it simply, the city is locked-in in a highly unsustainable path and potential de-locking will be extremely complicated. The results also seem to be in contrast to the assumption held in post-socialist countries about the role of market and planning (cf. [73]). The unregulated market does not only lead to spatially unjust land use patterns, but also harms the effectivity of resource allocation, and hence the financial functioning of the city. Yet the role of planning that should resolve these urban challenges is still to be fully appreciated in the mindsets of post-socialist societies.
Furthermore, the available data allowed us to only examine a period limited by censuses. For a deeper underpinning of urban shrinkage dynamics, it will be necessary to integrate the future results of the census (probably available in 2022) that will re-examine whether the identified trends at the micro level continue or not. A promising alternative for further research into intra-urban spatial patterns is the relational comparison with other cities in an analogical context, and above all, the use of new, more dynamic data sources such as mobile phone location data (eg. [137,138]).
Lastly, we are aware that policy response is not only about accepting shrinkage at the local level, but is embedded in a broader policy framework that guides the allocation of resources [14]. In the context of sustainability, it is essential to study not only the (un)sustainability of the processes themselves, but also the adaptive capacity of the system to adequately respond to such processes [19]. In this sense, it would be valuable to further examine the national and supranational institutional settings, as well as economic conditions that impair finding sustainable solutions to discussed challenges.

Supplementary Materials

The following are available online at https://www.mdpi.com/2071-1050/11/15/4142/s1, Figure S1: Geographic layers (ESRI Shapefile format) with calculated population densities within BSU for 1991–2001 and 2001–2011 periods.

Author Contributions

Conceptualization, O.S.; data curation, L.K.; funding acquisition, O.S.; investigation, L.K. and A.N.; methodology, O.S. and L.K.; resources, L.K. and A.N.; supervision, O.S. and P.R.; validation, L.K.; visualization, L.K. and A.N.; writing—original draft, O.S., V.B., A.N. and P.R.; writing—review & editing, O.S., V.B., L.K., A.N. and P.R.

Funding

This research was funded by the Czech Science Foundation through a research grant ‘Paths development in traditional industries in old industrial regions in Czechia: governance, actors, institutions and leadership’, grant number 18-11299S.

Conflicts of Interest

The authors declare no conflict of interest.

Appendix A

Basic settlement units (BSU) represent the smallest territorial unit for which the public has the possibility to obtain data for the population and housing census. In cities, they were defined as urbanistic districts according to the principle of dividing the city from urban and spatial planning aspects according to prevailing functional use (residential areas, industrial areas, transportation, agricultural areas, forest areas, recreational areas, etc.) [139].

Appendix B

Urban Atlas is a freely available harmonized data land use/land cover for European cities and their hinterland created under the GMES/Copernicus program. Coverage includes 305 functional urban areas (FUA) for 2006 and 697 FUA for 2012 on a 1: 10,000 scale. The minimum mapping unit is 0.25 ha for urban areas and 1 ha for rural areas. Thematic data resolution includes 20 landscape classes for 2006, which were subsequently extended to 27 classes in 2012. Minimum overall accuracy for level 1 class 1 “Artificial surfaces” is 85%. Classes in 112xx (Discontinuous urban fabric) are classified according to their sealing degree [140].

References

  1. Oswalt, P.; Rieniets, T. Atlas of Shrinking Cities; Hatje Cantz: Ostfildern, Germany, 2006; ISBN 3775717145. [Google Scholar]
  2. Nuissl, H.; Rink, D. The ‘production’ of urban sprawl in eastern Germany as a phenomenon of post-socialist transformation. Cities 2005, 22, 123–134. [Google Scholar] [CrossRef]
  3. Stryjakiewicz, T.; Ciesiółka, P.; Jaroszewska, E. Urban shrinkage and the post-socialist transformation: The case of Poland. Built Environ. 2012, 38, 196–213. [Google Scholar] [CrossRef]
  4. Wiechmann, T.; Pallagst, K.M. Urban shrinkage in Germany and the USA: A Comparison of Transformation Patterns and Local Strategies. Int. J. Urban Reg. Res. 2012, 36, 261–280. [Google Scholar] [CrossRef] [PubMed]
  5. Hollander, J.B.; Németh, J. The bounds of smart decline: A foundational theory for planning shrinking cities. Hous. Policy Debate 2011, 21, 349–367. [Google Scholar] [CrossRef]
  6. Großmann, K.; Beauregard, R.; Dewar, M.; Haase, A. European and US perspectives on shrinking cities. Urban Res. Pract. 2012, 5, 360–363. [Google Scholar] [CrossRef]
  7. Haase, A.; Wolff, M.; Špačková, P.; Radzimski, A. Reurbanisation in Postsocialist Europe–A Comparative View of Eastern Germany, Poland, and the Czech Republic. Comp. Popul. Stud. 2017, 42, 353–390. [Google Scholar]
  8. Turok, I.; Mykhnenko, V. The trajectories of European cities, 1960–2005. Cities 2007, 24, 165–182. [Google Scholar] [CrossRef]
  9. Mykhnenko, V.; Turok, I. East European cities-Patterns of growth and decline, 1960-2005. Int. Plan. Stud. 2008, 13, 311–342. [Google Scholar] [CrossRef]
  10. Rink, D.; Haase, A.; Bernt, M.; Krzysztofik, R. Specification of Working Model; Workpackage 1; Helmholtz Centre for Environmental Research: Leipzig, Germany, 2009. [Google Scholar]
  11. Rink, D.; Haase, A.; Grossmann, K.; Couch, C.; Cocks, M. From long-term shrinkage to re-growth? The urban development trajectories of Liverpool and Leipzig. Built Environ. 2012, 38, 162–178. [Google Scholar] [CrossRef]
  12. Haase, A.; Bernt, M.; Großmann, K.; Mykhnenko, V.; Rink, D. Varieties of shrinkage in European cities. Eur. Urban Reg. Stud. 2016, 23, 86–102. [Google Scholar] [CrossRef]
  13. Hollander, J.B.; Pallagst, K.M.; Schwarz, T.; Popper, F.J. Planning Shrinking Cities. Prog. Plan. 2009, 72, 223–232. [Google Scholar]
  14. Bernt, M.; Haase, A.; Großmann, K.; Cocks, M.; Couch, C.; Cortese, C.; Krzysztofik, R. How does(n’t) Urban Shrinkage get onto the Agenda? Experiences from Leipzig, Liverpool, Genoa and Bytom. Int. J. Urban Reg. Res. 2014, 38, 1749–1766. [Google Scholar] [CrossRef]
  15. Rink, D.; Couch, C.; Haase, A.; Krzysztofik, R.; Rumpel, P.; Rink, D.; Couch, C.; Haase, A.; Krzysztofik, R. The governance of urban shrinkage in cities of post-socialist Europe: Policies, strategies and actors. Urban Res. Pract. 2014, 7, 258–277. [Google Scholar] [CrossRef]
  16. Herrmann, D.L.; Shuster, W.D.; Mayer, A.L.; Garmestani, A.S. Sustainability for Shrinking Cities. Sustainability 2016, 8, 911. [Google Scholar] [CrossRef]
  17. Rocak, M.; Zuyd, H.; Hospers, G. Searching for Social Sustainability: The Case of the Shrinking City of Heerlen. Sustainability 2016, 8, 382. [Google Scholar] [CrossRef]
  18. Runge, A.; Kantor-Pietraga, I.; Runge, J.; Krzysztofik, R.; Dragan, W. Can depopulation create urban sustainability in postindustrial regions? A case from Poland. Sustainability 2018, 10, 4633. [Google Scholar] [CrossRef]
  19. Bossel, H. Indicators for Sustainable Development: Theory, Method, Applications: A Report to the Balaton Group; International Institute for Sustainable Development: Winnipeg, MB, Canada, 1999; ISBN 1895536138. [Google Scholar]
  20. Campbell, S. Green Cities, Growing Cities, Just Cities? Urban Planning and the Contradictions of Sustainable Development. J. Am. Plan. Assoc. 1996, 62, 296–312. [Google Scholar] [CrossRef]
  21. Pike, A.; Rodríguez-Pose, A.; Tomaney, J. What kind of local and regional development and for whom? Reg. Stud. 2007, 41, 1253–1269. [Google Scholar] [CrossRef]
  22. Haase, A.; Rink, D.; Grossmann, K. Shrinking Cities in Post-Socialist Europe: What Can We Learn from Their Analysis for Theory Building Today? Geogr. Ann. Ser. B Hum. Geogr. 2016, 98, 305–319. [Google Scholar]
  23. IPBES. UN Report: Nature’s Dangerous Decline ‘Unprecedented’; Species Extinction Rates ‘Accelerating’; IPBES: Bonn, Germany, 2019. [Google Scholar]
  24. Großmann, K.; Bontje, M.; Haase, A.; Mykhnenko, V. Shrinking cities: Notes for the further research agenda. Cities 2013, 35, 221–225. [Google Scholar] [CrossRef]
  25. Vale, L.J.; Campanella, T.J. The Resilient City: How Modern Cities Recover from Disaster; Oxford University Press: Oxford, UK, 2005; ISBN 0195175840. [Google Scholar]
  26. Rybczynski, W.; Linneman, P. How to save our shrinking cities. Public Interest 1999, 135, 30–44. [Google Scholar]
  27. Martin, R. Pfadabhängigkeit und die ökonomische Landschaft. In Denkanstöße zu Einer Anderen Geographie der Ökonomie; Berndt, C., Glückler, J., Eds.; Transcript Verlag: Bielefeld, Germany, 2006; pp. 47–76. ISBN 978-3-8394-0454-6. [Google Scholar]
  28. Hassink, R. Regional resilience: A promising concept to explain differences in regional economic adaptability? Camb. J. Reg. Econ. Soc. 2010, 3, 45–58. [Google Scholar] [CrossRef]
  29. Clark, C. Urban population densities. J. R. Stat. Soc. 1951, 114, 490–496. [Google Scholar] [CrossRef]
  30. Dovey, K.; Pafka, E. The urban density assemblage: Modelling multiple measures. Urban Des. Int. 2014, 19, 66–76. [Google Scholar] [CrossRef]
  31. Soja, E.W. Postmetropolis: Critical Studies of Cities and Regions; Blackwell Oxford: Oxford, UK, 2000; ISBN 1577180011. [Google Scholar]
  32. Kasanko, M.; Barredo, J.I.; Lavalle, C.; McCormick, N.; Demicheli, L.; Sagris, V.; Brezger, A. Are European cities becoming dispersed? A comparative analysis of 15 European urban areas. Landsc. Urban Plan. 2006, 77, 111–130. [Google Scholar] [CrossRef]
  33. Haase, D.; Kabisch, N.; Haase, A. Endless Urban Growth? On the Mismatch of Population, Household and Urban Land Area Growth and Its Effects on the Urban Debate. PLoS ONE 2013, 8, 1–8. [Google Scholar] [CrossRef]
  34. McDonald, J.F. Econometric studies of urban population density: A survey. J. Urban Econ. 1989, 26, 361–385. [Google Scholar] [CrossRef]
  35. Batty, M.; Sik Kim, K. Form follows function: Reformulating urban population density functions. Urban Stud. 1992, 29, 1043–1069. [Google Scholar] [CrossRef]
  36. Wolff, M.; Wiechmann, T. Urban growth and decline: Europe’s shrinking cities in a comparative perspective 1990–2010. Eur. Urban Reg. Stud. 2018, 25, 122–139. [Google Scholar] [CrossRef]
  37. Sýkora, L. Suburbanizace a její společenské dŭsledky. Sociol. Čas. 2003, 39, 217–232. [Google Scholar]
  38. Van den Berg, L.; Drewett, R.; Klaasen, L.H.; Rossi, A.; Vijverberg, C.H.T. Urban Europe: A Study of Growth and Decline; Pergamon: Oxford, UK, 1982; ISBN 9780080231563. [Google Scholar]
  39. Ouředníček, M. Teorie stádií vývoje měst a diferenciální urbanizace. Geografie 2000, 105, 361–369. [Google Scholar]
  40. Siedentop, S.; Zakrzewski, P.; Stroms, P. A childless urban renaissance? Age-selective patterns of population change in north american and german metropolitan areas. Reg. Stud. Reg. Sci. 2018, 5, 1–20. [Google Scholar] [CrossRef]
  41. Rérat, P. The return of cities: The trajectory of Swiss cities from demographic loss to reurbanization. Eur. Plan. Stud. 2019, 27, 355–376. [Google Scholar] [CrossRef]
  42. Westphal, C. Density figures for urban restructuring? Raumforsch. Raumordn. 2009, 67, 7–20. [Google Scholar] [CrossRef]
  43. Wolff, M.; Haase, A.; Haase, D.; Kabisch, N. The impact of urban regrowth on the built environment. Urban Stud. 2017, 54, 2683–2700. [Google Scholar] [CrossRef]
  44. Jabareen, Y.R. Sustainable urban forms: Their typologies, models, and concepts. J. Plan. Educ. Res. 2006, 26, 38–52. [Google Scholar] [CrossRef]
  45. Edwards, M.M.; Xiao, Y. Annexation, local government spending, and the complicating role of density. Urban Aff. Rev. 2009, 45, 147–165. [Google Scholar] [CrossRef]
  46. Turok, I. Cities, regions and competitiveness. Reg. Stud. 2004, 38, 1069–1083. [Google Scholar] [CrossRef]
  47. Hudeček, T.; Hnilička, P.; Dlouhý, M.; Leňo Cutáková, L.; Leňo, M. Urban structures, population density and municipal expenditures: An empirical study in the Czech Republic. Urban Stud. 2019, 1–16. [Google Scholar] [CrossRef]
  48. Moss, T. ‘Cold spots’ of Urban Infrastructure: ‘Shrinking’ Processes in Eastern Germany and the Modern Infrastructural Ideal. Int. J. Urban Reg. Res. 2008, 32, 436–451. [Google Scholar] [CrossRef]
  49. Holcombe, R.; Williams, D. The Impact of Population Density and Racial Composition on Municipal Government Expenditures. Public Financ. Rev. 2008, 36, 1–15. [Google Scholar] [CrossRef]
  50. Hartt, M. The Prevalence of Prosperous Shrinking Cities. Ann. Am. Assoc. Geogr. 2019, 109, 1651–1670. [Google Scholar] [CrossRef]
  51. Hospers, G.J. Policy responses to urban shrinkage: From growth thinking to civic engagement. Eur. Plan. Stud. 2014, 22, 1507–1523. [Google Scholar] [CrossRef]
  52. Schwarz, N.; Schlink, U.; Franck, U.; Großmann, K. Relationship of land surface and air temperatures and its implications for quantifying urban heat island indicators—An application for the city of Leipzig (Germany). Ecol. Indic. 2012, 18, 693–704. [Google Scholar] [CrossRef]
  53. Hartt, M.; Hackworth, J. Shrinking cities, shrinking households, or both? Int. J. Urban Reg. Res. 2018, 1–13. [Google Scholar] [CrossRef]
  54. Tighe, J.R.; Ganning, J.P. The divergent city: Unequal and uneven development in St. Louis. Urban Geogr. 2015, 36, 654–673. [Google Scholar] [CrossRef]
  55. Rink, D.; Siemund, S. Perforation als Leitbild für die schrumpfende Stadt? Erfahrungen aus Leipzig. disP Plan. Rev. 2016, 52, 50–60. [Google Scholar] [CrossRef]
  56. Krzysztofik, R.; Kantor-Pietraga, I.; Runge, A.; Spórna, T. Is the suburbanisation stage always important in the transformation of large urban agglomerations? The case of the Katowice conurbation. Geogr. Pol. 2017, 90, 71–85. [Google Scholar] [CrossRef]
  57. Frank, S. Inner-city suburbanization–no contradiction in terms. Middle-class family enclaves are spreading in the cities. Raumforsch. und Raumordn. Spat. Res. Plan. 2018, 76, 123–132. [Google Scholar] [CrossRef]
  58. Florida, R.; Adler, P. The patchwork metropolis: The morphology of the divided postindustrial city. J. Urban Aff. 2018, 40, 609–624. [Google Scholar] [CrossRef]
  59. Rieniets, T. Shrinking cities: Causes and effects of urban population losses in the twentieth century. Nat. Cult. 2009, 4, 231–254. [Google Scholar] [CrossRef]
  60. Naumann, M.; Bernt, M. When the tap stays dry: Water networks in eastern Germany. Local Environ. 2009, 14, 461–471. [Google Scholar] [CrossRef]
  61. Martinez-Fernandez, C.; Weyman, T.; Fol, S.; Audirac, I.; Cunningham-Sabot, E.; Wiechmann, T.; Yahagi, H. Shrinking cities in Australia, Japan, Europe and the USA: From a global process to local policy responses. Prog. Plan. 2016, 105, 1–48. [Google Scholar] [CrossRef]
  62. Nelle, A.B. Tackling human capital loss in shrinking cities: Urban development and secondary school improvement in Eastern Germany. Eur. Plan. Stud. 2016, 24, 865–883. [Google Scholar] [CrossRef]
  63. Rumpel, P.; Slach, O. Governance of Shrinkage of the City of Ostrava; European Science and Art Publishing Praha: Prague, Czech Republic, 2012; ISBN 8087504194. [Google Scholar]
  64. Sousa, S.; Pinho, P. Planning for shrinkage: Paradox or paradigm. Eur. Plan. Stud. 2015, 23, 12–32. [Google Scholar] [CrossRef]
  65. Rhodes, J.; Russo, J. Shrinking ‘smart’?: Urban redevelopment and shrinkage in Youngstown, Ohio. Urban Geogr. 2013, 34, 305–326. [Google Scholar] [CrossRef]
  66. Hummel, D. Right-Sizing Cities in The United States: Defining Its Strategies. J. Urban Aff. 2015, 37, 397–409. [Google Scholar] [CrossRef]
  67. Haase, D. Urban ecology of shrinking cities: An unrecognized opportunity? Nat. Cult. 2008, 3, 1–8. [Google Scholar] [CrossRef]
  68. Rink, D. Wilderness: The nature of urban shrinkage? The debate on urban restructuring and restoration in Eastern Germany. Nat. Cult. 2009, 4, 275–292. [Google Scholar] [CrossRef]
  69. Pallagst, K. Das Ende der Wachstumsmaschine. Berl. Debatte Initial 2007, 18, 4–13. [Google Scholar]
  70. Hartt, M. Shifting perceptions in shrinking cities: The influence of governance, time and geography on local (In)action. Int. Plan. Stud. 2018, 1–16. [Google Scholar] [CrossRef]
  71. Pallagst, K.; Fleschurz, R.; Said, S. What drives planning in a shrinking city? Tales from two German and two American cases. Town Plan. Rev. 2017, 88, 15–28. [Google Scholar] [CrossRef]
  72. Schmidt, S.; Fina, S.; Siedentop, S. Post-socialist Sprawl: A Cross-Country Comparison. Eur. Plan. Stud. 2015, 23, 1357–1380. [Google Scholar] [CrossRef]
  73. Sýkora, L. Post-Socialist Cities. In International Encyclopedia of Human Geography; Kitchin, R., Thrift, N., Eds.; Elsevier: Oxford, UK, 2009; Volume 8, pp. 387–395. ISBN 9780080449111. [Google Scholar]
  74. Szafrańska, E.; Coudroy de Lille, L.; Kazimierczak, J. Urban shrinkage and housing in a post-socialist city: relationship between the demographic evolution and housing development in Łódź, Poland. J. Hous. Built Environ. 2019, 34, 441–464. [Google Scholar] [CrossRef]
  75. Jaroszewska, E. Urban Shrinkage and Regeneration of an Old Industrial City: The Case of Wałbrzych in Poland. Quaest. Geogr. 2019, 38, 75–90. [Google Scholar] [CrossRef]
  76. Kabisch, S.; Grossmann, K. Challenges for large housing estates in light of population decline and ageing: Results of a long-term survey in East Germany. Habitat Int. 2013, 39, 232–239. [Google Scholar] [CrossRef]
  77. Accordino, J.; Johnson, G.T. Addressing the vacant and abandoned property problem. J. Urban Aff. 2000, 22, 301–315. [Google Scholar] [CrossRef]
  78. Kazimierczak, J.; Szafrańska, E. Demographic and morphological shrinkage of urban neighbourhoods in a post-socialist city: The case of Łódź, Poland. Geogr. Ann. Ser. B Hum. Geogr. 2019, 101, 138–163. [Google Scholar] [CrossRef]
  79. Sagan, I.; Grabkowska, M. Urban Regeneration in Gdańsk, Poland: Local Regimes and Tensions Between Top-Down Strategies and Endogenous Renewal. Eur. Plan. Stud. 2012, 20, 1135–1154. [Google Scholar] [CrossRef]
  80. Ruzicka, M. Continuity or rupture? Roma/Gypsy communities in rural and urban environments under post-socialism. J. Rural Stud. 2012, 28, 81–88. [Google Scholar] [CrossRef]
  81. Birch, K.; Mykhnenko, V. Varieties of neoliberalism? Restructuring in large industrially dependent regions across Western and Eastern Europe. J. Econ. Geogr. 2009, 9, 355–380. [Google Scholar] [CrossRef]
  82. Šerý, O.; Svobodová, H.; Šilhan, Z.; Szczyrba, Z. Shrinking of cities in the Czech Republic and its reflection on society: Case study of Karviná City. Geogr. Pannon. 2018, 22, 68–80. [Google Scholar] [CrossRef]
  83. Buček, J.; Bleha, B. Urban Shrinkage as a Challenge to Local Development Planning in Slovakia. Morav. Geogr. Rep. 2013, 21, 2–15. [Google Scholar] [CrossRef] [Green Version]
  84. Stryjakiewicz, T.; Jaroszewska, E. The Process of Shrinkage as a Challenge to Urban Governance. Quaest. Geogr. 2016, 35, 27–37. [Google Scholar] [CrossRef] [Green Version]
  85. Hackworth, J. The limits to market-based strategies for addressing land abandonment in shrinking American cities. Prog. Plan. 2014, 90, 1–37. [Google Scholar] [CrossRef]
  86. Ženka, J.; Kofroň, J. Metodologie Výzkumu V Sociální Geografii–Případové Studie; Ostravská Univerzita: Ostrava, Czech Republic, 2012; ISBN 978-80-7464-148-0. [Google Scholar]
  87. Pike, A.; MacKinnon, D.; Cumbers, A.; Dawley, S.; McMaster, R. Doing evolution in economic geography. Econ. Geogr. 2016, 92, 123–144. [Google Scholar] [CrossRef]
  88. CSO. Population of municipalities 2019; Czech statistical office: Prague, Czech Republic, 2019. [Google Scholar]
  89. Šotkovský, I. Changes of the population size and ageing process in Ostrava. In Sborník příspěvků z XXII. sjezdu České geografické společnosti; Ostravská univerzita: Ostrava, Czech Republic, 2010; pp. 665–673. ISBN 978-80-7368-903-2. [Google Scholar]
  90. Bosák, V.; Nováček, A.; Slach, O. Industrial culture as an asset, barrier and creative challenge for restructuring of old industrial cities: Case study of Ostrava (Czechia). GeoScape 2018, 12, 52–64. [Google Scholar] [CrossRef]
  91. Illner, M.; Viturka, M.; Havlík, V.; Falťan, L.; Zubek, L.; Ježek, J.; Maier, K. Územní aspekty politické a ekonomické transformace v České republice. Available online: https://halshs.archives-ouvertes.fr/halshs-01496195/document (accessed on 17 July 2019).
  92. Špačková, E. Vize socialistického mesta na príkladu Nové Ostravy. Archit. Urban. 2016, 50, 18–37. [Google Scholar]
  93. Sailer-Fliege, U. Characteristics of post-socialist urban transformation in East Central Europe. GeoJournal 1999, 49, 7–16. [Google Scholar] [CrossRef]
  94. Strakoš, M. Nová Ostrava a Její Satelity: Kapitoly z Dějin Architektury 30.-50. Let 20. Století; Národní Památkový Ústav, Územní Odborné Pracoviště: Ostrava, Czech Republic, 2010; ISBN 8085034603. [Google Scholar]
  95. Davidová, E. Romany Immigrants in Ostrava-Sound into the 60ties of the 20th century. Hist. Hist. Relat. Sci. 2009, 16, 317–328. [Google Scholar]
  96. Havrlant, M. Geografie Severomoravského kraje; Pedagog. Fak. v Ostravě: Ostrava, Czech Republic, 1980. [Google Scholar]
  97. Musil, J. Changing urban systems in post-communist societies in Central Europe: Analysis and prediction. Urban Stud. 1993, 30, 899–905. [Google Scholar] [CrossRef]
  98. Zarecor, K.E. What Was So Socialist about the Socialist City? Second World Urbanity in Europe. J. Urban Hist. 2018, 44, 95–117. [Google Scholar] [CrossRef]
  99. Green, J. Atlanta Counted Among Five Global Cities Boldly Fighting Consequences of Sprawl. Available online: https://atlanta.curbed.com/2019/3/15/18267588/atlanta-cities-national-geographic-sprawl (accessed on 17 July 2019).
  100. Downs, A. New Visions for Metropolitan America; Brook: Washington, DC, USA, 1994; ISBN 0815719256. [Google Scholar]
  101. Farris, J.T. The barriers to using urban infill development to achieve smart growth. Hous. Policy Debate 2001, 12, 1–30. [Google Scholar] [CrossRef]
  102. Bontje, M. Facing the challenge of shrinking cities in East Germany: The case of Leipzig. GeoJournal 2004, 61, 13–21. [Google Scholar] [CrossRef]
  103. Döringer, S.; Uchiyama, Y.; Penker, M.; Kohsaka, R. A meta-analysis of shrinking cities in Europe and Japan. Towards an integrative research agenda. Eur. Plan. Stud. 2019, 1–20. [Google Scholar] [CrossRef]
  104. Rumpel, P.; Slach, O. Je Ostrava “smršťujícím se městem”? Sociol. Čas. Czech Sociol. Rev. 2012, 48, 859–878. [Google Scholar]
  105. Jiřík, V.; Machaczka, O.; Miturová, H.; Tomášek, I.; Šlachtová, H.; Janoutová, J.; Velická, H.; Janout, V. Air pollution and potential health risk in Ostrava region—A review. Cent. Eur. J. Public Health 2016, 24, 4–17. [Google Scholar] [CrossRef]
  106. Sram, R.J.; Dostal, M.; Libalova, H.; Rossner, P.; Rossnerova, A.; Svecova, V.; Topinka, J.; Bartonova, A. The European hot spot of B [a] P and PM 2.5 exposure—the Ostrava region, Czech Republic: Health research results. ISRN Public Health 2013, 2013, 1–12. [Google Scholar] [CrossRef]
  107. Kunc, J.; Martinát, S.; Tonev, P.; Frantál, B. Destiny of urban brownfields: Spatial patterns and perceived consequences of post-socialistic deindustrialization. Transylv. Rev. Adm. Sci. 2014, 41, 109–128. [Google Scholar]
  108. Bourne, L.S. Reinventing the suburbs: Old myths and new realities. Prog. Plan. 1996, 3, 163–184. [Google Scholar] [CrossRef]
  109. Ivan, I.; Horák, J. Population Changes Caused by Industrialization and Deindustrialization–Comparison of Ostrava and Glasgow. Geogr. Čas. 2011, 63, 113–132. [Google Scholar]
  110. CSO. Population of Municipalities of the Czech Republic 2013; Czech statistical office: Prague, Czech Republic, 2013. [Google Scholar]
  111. Prokop, P. KOMENTÁŘ k Vývoji Nezaměstnanosti v Okrese Ostrava za Měsíc Červen 2019; CSO: Ostrava, Czech Republic, 2019. [Google Scholar]
  112. Ženka, J.; Pavlík, A.; Slach, O. Resilience of metropolitan, urban and rural regions: A Central European perspective. GeoScape 2017, 11, 25–40. [Google Scholar] [CrossRef]
  113. Nováček, A.; Slach, O.; Schachlová, N. Šetření Kvality Života (Včetně Push a Pull Faktorů) z Pohledu Obyvatel Centra Ostravy; University of Ostrava: Ostrava, Czech Republic, 2019. [Google Scholar]
  114. CSO. Population of Municipalities 2017; Czech statistical office: Prague, Czech Republic, 2017. [Google Scholar]
  115. MOS. Městská a Obecní Statistika; Czech statistical office: Prague, Czech Republic, 2017. [Google Scholar]
  116. Rumpel, P.; Slach, O.; Koutský, J. Shrinking cities and governance of economic regeneration: The case of Ostrava. Ekon. Manag. Econ. Manag. 2013, 16, 113–128. [Google Scholar]
  117. Kooiman, N.; Latten, J.; Bontje, M. Human capital migration: A longitudinal perspective. Tijdschr. Voor Econ. En Soc. Geogr. 2018, 109, 644–660. [Google Scholar] [CrossRef]
  118. Tödtling, F.; Skokan, K.; Höglinger, C.; Rumpel, P.; Grillitsch, M. Innovation and knowledge sourcing of modern sectors in old industrial regions: Comparing software firms in Moravia-Silesia and Upper Austria. Eur. Urban Reg. Stud. 2013, 20, 188–205. [Google Scholar] [CrossRef]
  119. Grossmann, K.; Haase, A.; Arndt, T.; Cortese, C.; Rumpel, P.; Rink, D.; Slach, O.; Tichá, I.; Violante, A. How Urban Shrinkage Impacts on Patterns of Socio-Spatial Segregation: The Cases of Leipzig, Ostrava, and Genoa. In Urban Ills: Twenty-First-Century Complexities of Urban Living in Global Contexts; Carol, C.Y., Sanders Thompson, V., Wells, A., Eds.; Lexington Books: Lanham, MD, USA, 2013; pp. 241–268. ISBN 978-0739177006. [Google Scholar]
  120. Beauregard, R.A. The radical break in late twentieth-century urbanization. Area 2006, 38, 218–220. [Google Scholar] [CrossRef]
  121. Baum, D.; Vondroušová, K.; Tichá, I. Charakteristika Sociálně Prostorové Segregace ve Srovnání Dvou Měst (Halle-Ostrava); Ostravská Univerzita v Ostravě: Ostrava, Czech Republic, 2014; ISBN 807464491X. [Google Scholar]
  122. Inspektor, T.; Ivan, I.; Horák, J. Mapping and monitoring unemployment hot spots towards identification of socially excluded localities: Case study of Ostrava. J. Maps 2014, 10, 35–46. [Google Scholar] [CrossRef]
  123. Strategický Plán Sociálního Začleňování Ostrava 2015–2018; Agentura pro sociální začleňování: Ostrava, Czech Republic, 2018; Available online: https://ostrava.cz/cs/urad/hledam-informace/aktualni-informace/agentura-pro-socialni-zaclenovani-na-magistratu-mesta-ostravy/SPSZ.pdf (accessed on 17 July 2019).
  124. Roubínek, P.; Kladivo, P.; Halás, M.; Koutský, J.; Opravil, Z. Changes in the financing of municipalities and local governments of selected cities: Possible effects on disintegration processes and municipal policy. Econ. Manag. 2015, 18, 134–150. [Google Scholar] [CrossRef]
  125. Sýkora, L. Suburbanizace a její důsledky: výzva pro výzkum, usměrňování rozvoje území a společenskou angažovanost. In Suburbanizace a její sociální, ekonomické a ekologické důsledky; Sýkora, L., Ed.; Ústav pro ekopolitiku: Prague, Czech Republic, 2002; pp. 9–19. [Google Scholar]
  126. Ouředníček, M.; Posová, D. Suburbánní bydlení v Pražském městském regionu: Etapy vývoje a prostorové rozmístění; Sociální Geogr. Pražského městského Reg. Univerzita Karlov. v Praze, Přírodovědecká Fak. Kated. sociální Geogr. a Reg. rozvoje: Praha, Czech Republic, 2006; pp. 96–113. [Google Scholar]
  127. Sýkora, L. Changes in the internal spatial structure of post-communist Prague. GeoJournal 1999, 49, 79–89. [Google Scholar] [CrossRef]
  128. Van de Kaa, D.J. Europe’s second demographic transition. Popul. Bull. 1987, 42, 1–59. [Google Scholar]
  129. Maes, M.; Loopmans, M.; Kesteloot, C. Urban shrinkage and everyday life in post-socialist cities: Living with diversity in Hrušov, Ostrava, Czech Republic. Built Environ. 2012, 38, 229–243. [Google Scholar] [CrossRef]
  130. Martinát, S.; Dvořák, P.; Klusáček, P.; Kunc, J.; Havlíček, M. Hybné síly dlouhodobých proměn industrializované krajiny (případová studie Hrušov). Acta Pruhoniciana 2014, 106, 35–44. [Google Scholar]
  131. Krejčí, T.; Martinát, S.; Klusáček, P. Spatial differentiation of selected processes connected to the second demographic transition in post-socialistic cities (the examples of Brno and Ostrava, Czech Republic). Morav. Geogr. Reports 2011, 19, 39–50. [Google Scholar]
  132. Silverman, R.M. Rethinking shrinking cities: Peripheral dual cities have arrived. J. Urban Aff. 2018, 1–18. [Google Scholar] [CrossRef]
  133. Gabzdyl, J. Konec jedné éry. Ostrava po mnoha letech nemá ani 300 tisíc obyvatel. MF Dnes, 13 December 2012. [Google Scholar]
  134. Lesková, I. Ostravanů ubývá. Lidé míří za město, kde hledají přírodu a bezpečí. MF Dnes, 24 April 2018. [Google Scholar]
  135. Kühn, M. Immigration strategies of cities: local growth policies and urban planning in Germany. Eur. Plan. Stud. 2018, 26, 1747–1762. [Google Scholar] [CrossRef]
  136. Martin, R. Roepke Lecture in Economic Geography—Rethinking regional path dependence: Beyond lock-in to evolution. Econ. Geogr. 2010, 86, 1–27. [Google Scholar] [CrossRef]
  137. Ouředníček, M.; Nemeškal, J.; Špačková, P.; Hampl, M.; Novák, J. A synthetic approach to the delimitation of the Prague Metropolitan Area. J. Maps 2018, 14, 26–33. [Google Scholar] [CrossRef] [Green Version]
  138. Šveda, M.; Barlík, P. Daily commuting in the Bratislava metropolitan area: case study with mobile positioning data. Pap. Appl. Geogr. 2018, 4, 409–423. [Google Scholar] [CrossRef]
  139. CSO. Territorial Identification Register of Basic Settlement Units. Changes in 1996–2013; Czech statistical office: Prague, Czech Republic, 2013. [Google Scholar]
  140. Meirich, S. Mapping Guide for A European Urban Atlas. GSE Land Information Services. 2008, pp. 1–36. Available online: https://land.copernicus.eu/user-corner/technical-library/urban-atlas-mapping-guide (accessed on 1 July 2019).
Figure 1. Population change in Ostrava (1869–2019 [88]) and prediction of population change until 2050 according to Šotkovský [89].
Sustainability 11 04142 g001
Figure 2. Aging index change (1991–2011) on the basic settlement units (BSU) scale of Ostrava.
Sustainability 11 04142 g002
Figure 3. Patterns of population density changes under differing constellations of development of urban population (POP) and built-up area (BA) in Ostrava typology of urban structures within basic settlement units.
Sustainability 11 04142 g003
Figure 4. Population change on the level of districts of Ostrava during period 2011–2019.
Sustainability 11 04142 g004
Table 1. Selected residential classes of Urban Atlas.
CodeResidential Area ClassSealing Degree
11100Continuous urban fabric>80%
11210Discontinuous dense urban fabric50%–80%
11220Discontinuous medium density urban fabric30%–50%
11230Discontinuous low-density urban fabric 10%–30%
11240Discontinuous very low-density urban fabric<10%
11300Isolated structures-
12220Other roads and associated land-
Table 2. Changes of urban structures in Ostrava 1991–2011 with estimated total expenditure.
IndicatorsPeriodOrganic Urban StructureUrban Block StructureGarden City Urban StructureSingle Detached HousesPaired Villas and Row-HousesMixed Building TypesEstates and High Rises∑ or Average Value
BSU units-3316584346169 *
Population1991622573890945,765501068,301192,654326,244
20015153697561347,691503166,584182,918314,965
20114983611467752,658506960,915162,695293,111
Population change1991–2001−1072−405−296192621−1717−9736−11,279
2001–2011−170−86164496738−5669−20,223−21,854
1991–2011−1242−1266−232689359−7386−29,959−33,133
Built-up area (ha)199149.7551.3610.742410.68167.53900.19860.254450.51
200649.7551.3610.742669.71171.13890.15864.514707.36
201149.7551.3610.742727.06172.37906.27867.424784.96
Population density (ha)1991125.13143.6984.6218.9829.9075.87223.9573.30
2001103.58135.8057.0717.8629.4074.80211.5966.91
2011100.16119.0463.0219.3129.4167.22189.5661.26
Share of built-up area with population density under 100 persons/ha199122.1767.8610010010071.355.61-
200173.6567.8610010010069.164.41-
201151.4867.8610010010074.173.48-
Age index199175.9695.9294.1685.46116.98102.0551.6982.05
2001101.8599.29162.6781.7066.8982.0388.1183.98
2011151.41109.23118.69114.80102.0391.32136.57114.72
Average share of 1 and 2 person households199156.0065.8659.3550.9253.3759.9751.2753.85
200161.9464.5462.6052.1450.3759.6058.3556.10
201171.9472.4468.6753.7052.2165.3068.6061.38
Estimated total expenditure (€/ha) **-10,36113,0338182668310,01810,22413,614-
Notes: * these 169 BSU represents 99.66% in 1991, 99.44% in 2001 and 98.95% in 2011 of population of Ostrava ** original data use currency CZK, (€/ha) is based on average yearly exchange rate in 2018 (1 EUR = 25.6 CZK), source of estimated total expenditure Hudeček et al. [47].

