Article

Modelling Environmental Burdens of Indoor-Grown Vegetables and Herbs as Affected by Red and Blue LED Lighting

by
Giuseppina Pennisi
1,2,3,†,
Esther Sanyé-Mengual
1,†,
Francesco Orsini
1,*,†,
Andrea Crepaldi
4,
Silvana Nicola
2,
Jesús Ochoa
3,
Juan A. Fernandez
3 and
Giorgio Gianquinto
1
1
Department of Agricultural and Food Sciences (Distal), Research Centre in Urban Environment for Agriculture and Biodiversity (ResCUE-AB), University of Bologna, Viale Fanin, 44, 40127 Bologna, Italy
2
Department of Agricultural, Forest and Food Sciences, DISAFA-VEGMAP, University of Turin, Largo Paolo Braccini, 2, 10097 Grugliasco, Italy
3
Department of Agricultural Engineering, Universidad Politécnica de Cartagena, Paseo Alfonso XIII 48, 30203 Cartagena, Spain
4
Flytech s.r.l., Via dell’Artigianato, 65, Zona artigianale Paludi, 32010 Belluno, Italy
*
Author to whom correspondence should be addressed.
These authors equally contributed to this publication.
Sustainability 2019, 11(15), 4063; https://doi.org/10.3390/su11154063
Submission received: 14 June 2019 / Revised: 15 July 2019 / Accepted: 25 July 2019 / Published: 27 July 2019
(This article belongs to the Special Issue Sustainable Urban Agriculture)

Abstract

:
Notwithstanding that indoor farming is claimed to reduce the environmental pressures of food systems, electricity needs are elevated and mainly associated with lighting. To date, however, no studies have quantified the environmental and economic profile of Light Emitting Diodes (LED) lighting in indoor farming systems. The goal of this study is to quantify the effect of varying the red (R) and blue (B) LED spectral components (RB ratios of 0.5, 1, 2, 3 and 4) on the eco-efficiency of indoor production of lettuce, chicory, rocket and sweet basil from a life cycle perspective. The functional unit of the assessment was 1 kg of harvested fresh plant edible product, and the International Reference Life Cycle Data System (ILCD) method was employed for impact assessment. Even though most of the materials of the LED lamp and electronic elements were imported from long distances (14,400 km), electricity consumption was the largest contributor to the environmental impacts (with the LED lamps being the main electricity consumers, approximately 70%), apart from the resources use indicator, where the materials of the lamps and the mineral nutrients were also relevant. RB0.5 was the most energy-efficient light treatment but had the lowest eco-efficiency scores due to the lower crop yields.

1. Introduction

Climate change, fertile land loss and natural resource depletion pose a great risk on current agricultural systems [1]. In recent years, the increasing world population [2] together with the growing evidence that urban cultivation may substantially reduce the food system’s carbon footprint [3] have led to the exploration of innovative growing systems that are specifically designed for the urban environment. The concept of Zero-Acreage Farming (Z-farming, [4]) builds on the potential synergies between agriculture and buildings, combining concepts of circularity and bio-economy. The associated benefits range from the potential reduction of water and nutrient use (e.g., through closed or recirculating systems) and the lower environmental burdens (e.g., irrigation needs covered by rainwater collected from building surfaces or regenerated greywater) to the potential for urban renewal through combined ecosystem services provision including recreational, aesthetic and social functions [5]. Among Z-farming systems, increased attention has been given to the so-called indoor farming systems (or vertical farming or Plant Factories with Artificial Lighting, PFALs), which allow turning unused buildings (e.g., abandoned warehouses) into plant production environments [6].

1.1. About the Sustainability of Indoor Farming

As the application of indoor farming technologies takes place in several regions of the world—mainly in Asian (42%), European (30%) and North American (21%) countries—the market is expected to reach a global value of 5.80 billion USD by 2022 [7]. From a production perspective, indoor farming systems allow for increasing yields (up to 23-fold, as compared to traditional agriculture [8]), improved food quality [9], and greater production stability due to enhanced resilience to climatic events as compared with traditional agricultural systems [6]. The potential for reducing land use for agriculture is associated with both the possibility to explore the vertical dimension allowed by the use of artificial lighting [6], the possibilities offered for year-round production [10], and the potential reconversion of abandoned or unused buildings into agricultural systems [11]. Furthermore, the environmental sustainability of crop production is increased by avoiding or limiting the use of pesticides or herbicides [8] and improving water and nutrient use efficiency [12]. On the other hand, a number of questions arises on the sustainability of indoor plant cultivation with reference to energy use, particularly regarding the energy needs associated with artificial lighting [13].

1.2. Light Emitting Diode (LED) Lighting for Indoor Cultivation of Leafy Vegetables and Herbs

The rapid evolution in plant LED lighting technologies experienced in the last decade has resulted in revolutionary changes in the greenhouse and controlled-environment agricultural industry sector [14]. From the first research on potential applications in outer space [15], the current application of LED lighting ranges from the progressive substitution of incandescent lights used in the photoperiod management for flowering species [16] to the replacement of both fluorescent lamps in growth rooms [17] and high pressure sodium (HPS) lamps for supplemental lighting in greenhouses [18]. Lettuce (Lactuca sativa L.) is found among the most studied crops for LED lighting applications, due to its small size, short life cycle and the possibility of standardizing lighting properties for the entire vegetative phase up to the final harvest [19,20,21]. Accordingly, a combined search for terms “lettuce” and “LED light” on the Scopus® database in the last 50 years identified 214 research products, of which 123 were published in the last 5 years alone. Similar to lettuce, sweet basil (Ocimum basilicum L.), has been extensively studied for indoor cultivation under artificial lighting, with interesting applications in terms of quality improvements, including changes in both the metabolic and aromatic profiles [9,12]. Other leafy vegetables on which artificial lighting use is gaining increased attention include rocket (Eruca sativa Mill.) and chicory (Cichorium intybus L.), a growing market for which in the ready-to-eat sector may sustain the economic viability of their cultivation indoors [10,22,23,24,25].
Within the light spectrum, both the blue (400–500 nm) and red (600–700) fractions are known to play a major role on the plant’s photosynthetic performance, given that they correspond to the main absorption peaks of chlorophyll a and b [20]. Under mixed red and blue light, while a prevalent red light has been shown to promote plant growth in basil [12], the blue spectral components were reported to foster the biosynthesis of functional compounds [26], with similar responses also observed in lettuce [20,27]. As a result, the adoption of LED lighting featuring red and blue diodes is a common strategy for pursuing enhanced energy use efficiency in indoor lettuce production [19,20,21]. Furthermore, the production performance and energy use efficiency of sweet basil grown under mixed red and blue lighting was recently shown to vary in response to the relative red and blue components in the spectrum, reaching the maximum yield when the ratio between the red and blue spectral fractions (RB ratio) was equal to 3 [12].

1.3. The Eco-efficiency of LED Farming

To date, scientific literature on LED applications for agricultural production has mainly focused on agronomic and physiological traits, with the main targets being the improvement of yield and quality features of the produce [6]. On the other hand, very limited figures on the environmental sustainability of indoor food production is available [14], therefore limiting the efficient comparison of these technologies against traditional systems. In such scenario, the elevated variability of structural and technological features among commercial indoor farming systems [6] results in limitations on standardizing efficiency and sustainability indicators. Artificial lighting is known to be the main driver of energy use in an indoor farming system [14]. While overall efficacy in converting electricity into photons was similar between LEDs and high pressure lamps until a few years ago [28,29], the recent advances in LED technologies have increased the photosynthetic photon efficacy (PPE) up to 2.3 μmol J−1, with further expected increases in the coming decades [30]. It was also recently shown how the relative intensity of red and blue spectral fractions affect the PPE [28], with prevailing blue light being more efficient in converting electricity into light, although at the expense of reduced growth in basil [12]. Despite these indicators, the eco-efficiency assessment of indoor farming is still scarcely explored. In a preliminary Life Cycle Analysis (LCA) study [31], it was claimed that more than 60% of the CO2 emissions in an indoor farm were related to the use of electricity associated with lighting supplied by HPS lamps. To our knowledge, however, no studies have to date, addressed the environmental footprint of indoor cultivation of leafy vegetables and herbs in response to different LED spectral compositions.

1.4. Goal and Objectives

The goal of this study was to assess the eco-efficiency and food production potential of LED lighting for indoor cultivation of four horticultural species, namely, lettuce, chicory, basil and rocket. The specific objectives were to address the following research questions:
  • How much food can an indoor farming system produce?
  • What are the environmental burdens of indoor vegetable cultivation?
  • What is the economic balance of indoor vegetable production in a simplified indoor farming system?
  • How can light spectral properties and management promote eco-efficiency?
To answer these questions, an experimental small-scale indoor farming system was assessed, employing the Life Cycle Assessment (LCA) [32,33] and Life Cycle Costing (LCC) [34] methods.

2. Materials and Methods

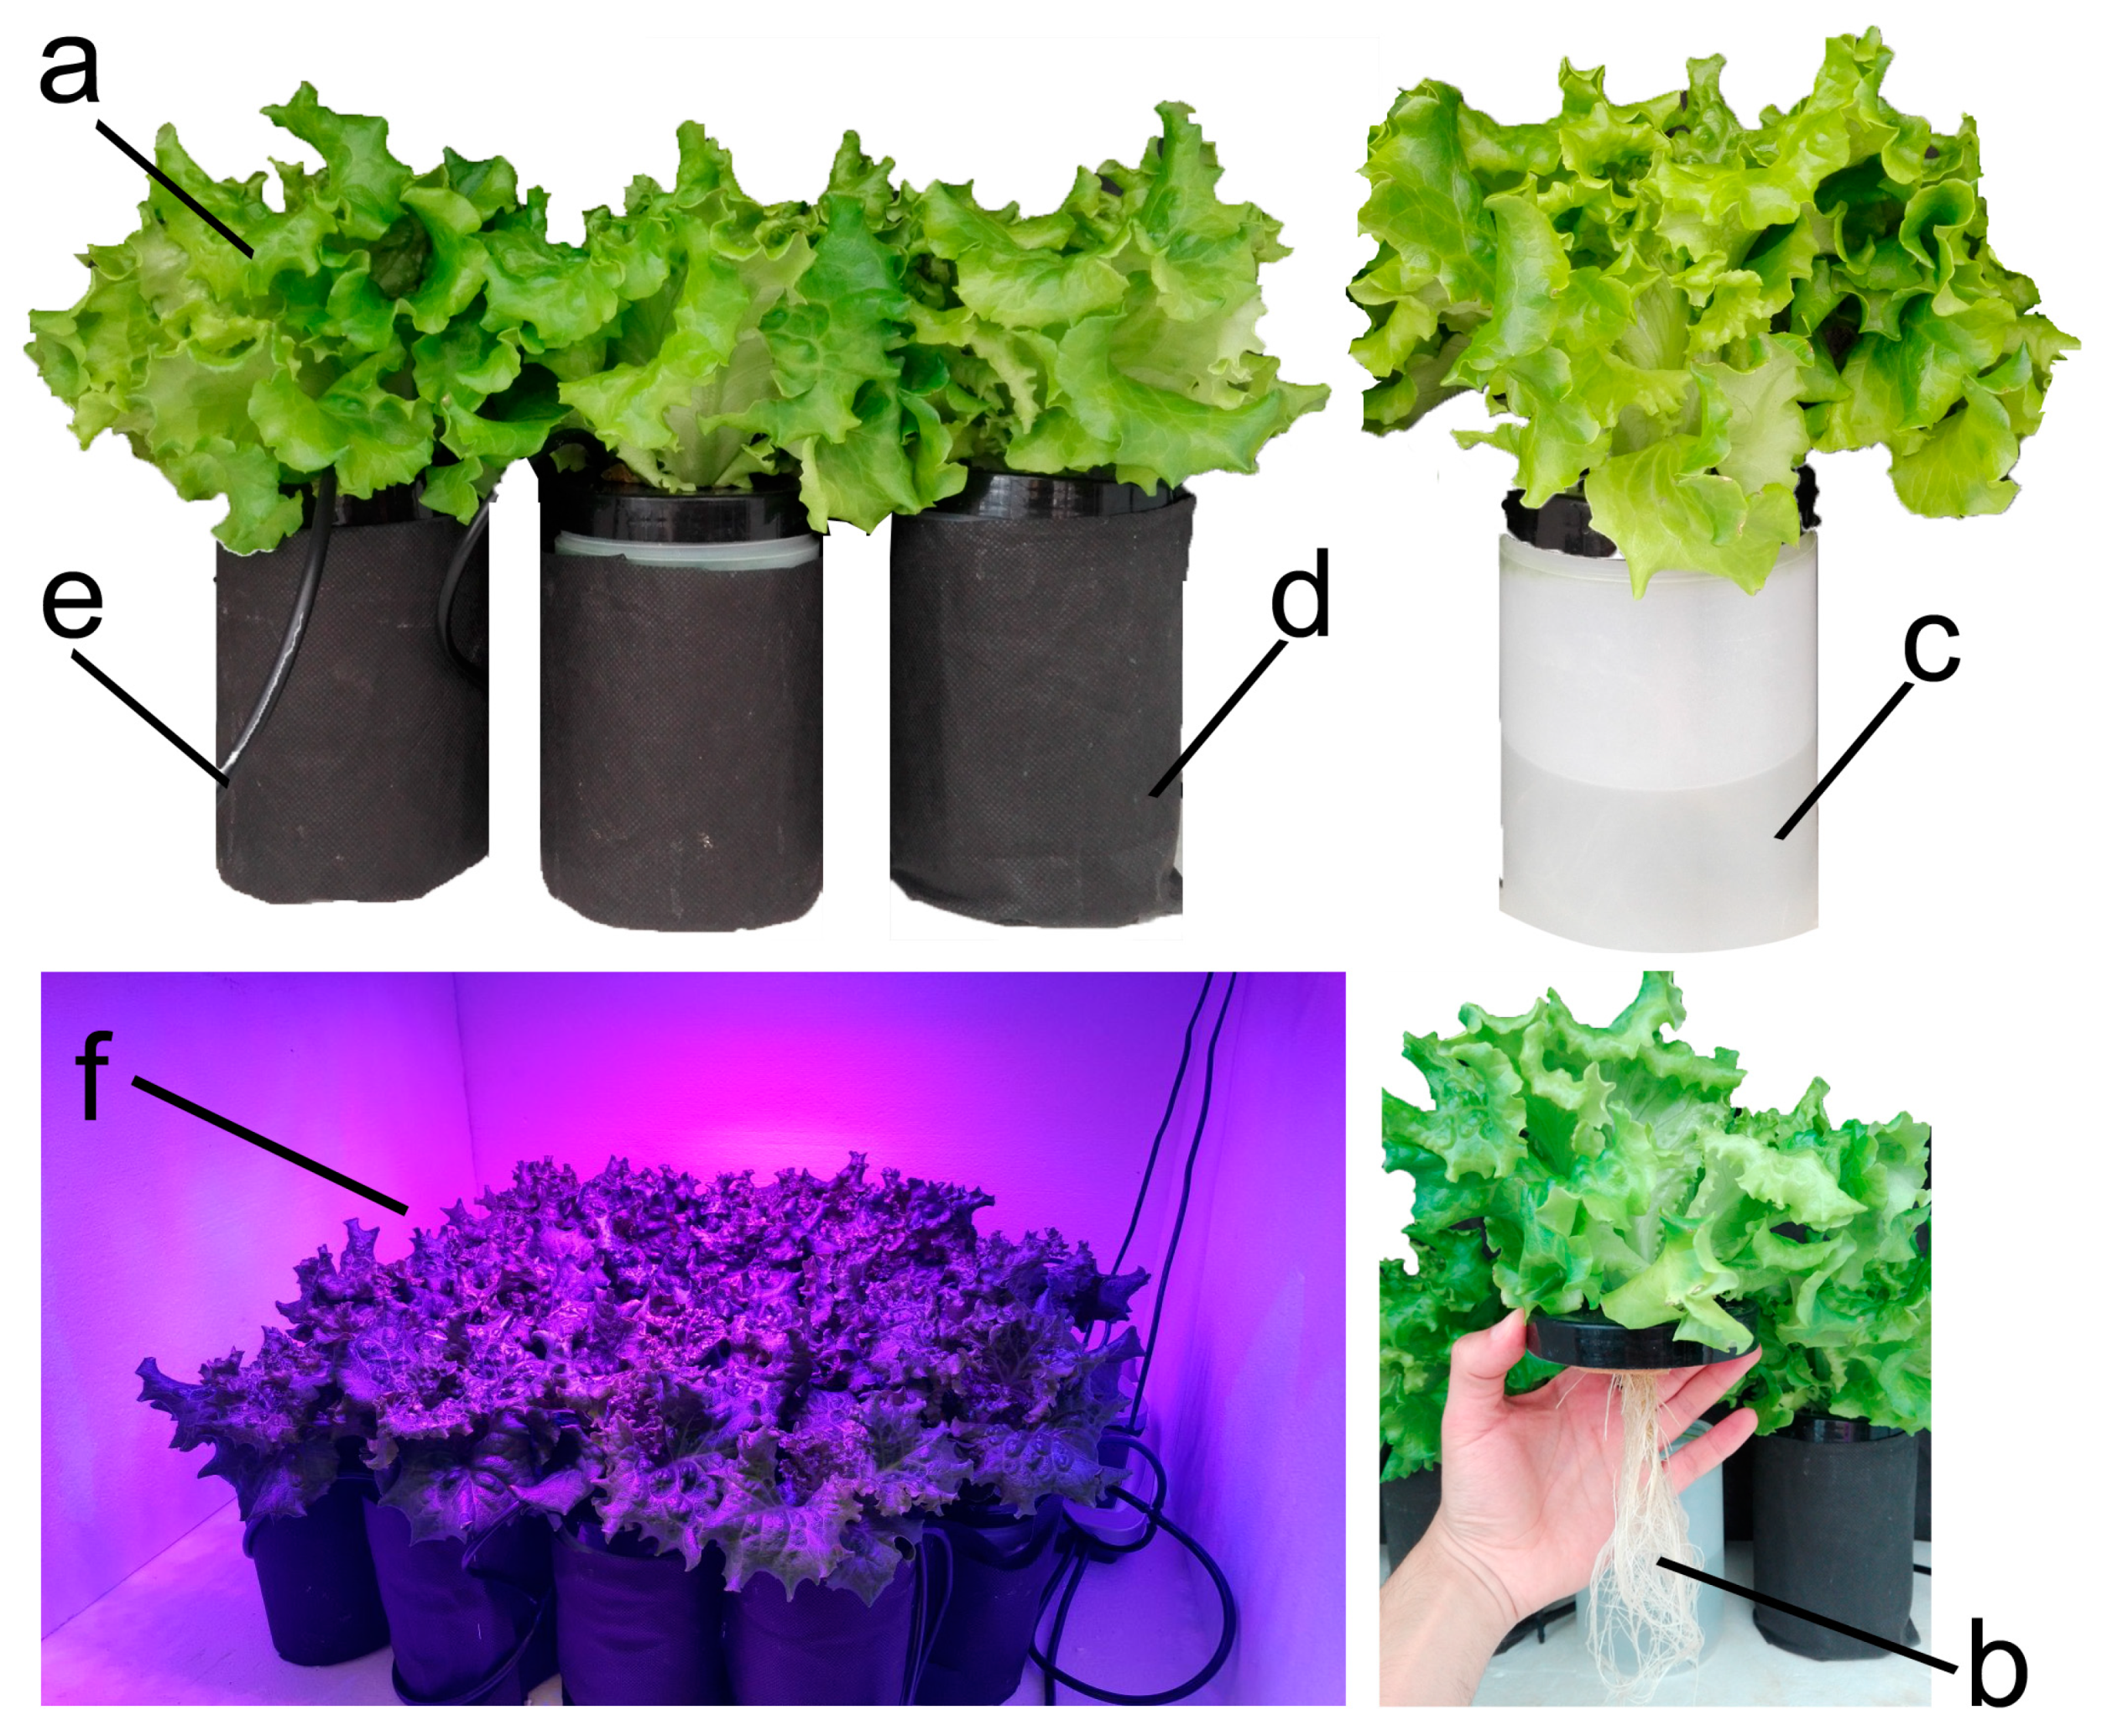
2.1. Plant Material and Growth Conditions

An experimental case study at the University of Bologna was used for data collection. Different artificial light treatments were tested in separated growing compartments (0.6 m2 each) within a climate-controlled growth chamber (temperature set at 24 ± 2 °C, RH of 55–70% and 450 ppm CO2), which were insulated by wood and polystyrene panels. For the light treatments, LED lamps (Flytech®, Belluno, Italy) featuring red and blue diodes with different red:blue (RB) ratios (namely 0.5, 1, 2, 3 and 4 [12]) and the same photosynthetic photon flux density (PPFD, 215 ± 5 μmol m−2 s−1) and photoperiod (16/8 light/dark) were used. Experiments included the cultivation of lettuce (Lactuca sativa L.), basil (Ocimum basilicum L.), rocket (Eruca sativa Mill.) and chicory (Cichorium intybus L.), and each experiment was repeated twice, between February and October 2018 (Table 1).
All plants were prepared in a dedicated growing compartment within the same growth chamber. Seeds were germinated in polystyrene containers filled with peat at a density of 960 plants m−2, under cool fluorescent light supplied by a neon lamp (TL-D 90 De Luxe 58 W, Philips, Eindhoven, The Netherlands) providing a 16-h photoperiod. Seedlings were transplanted into individual hydroponic systems, respectively, at 14 (lettuce, rocket and chicory) and 21 (basil) days after sowing (DAS). The hydroponic systems, which resembled a deep-water culture, are illustrated in Figure 1 and were constituted with plastic pots (1 L of volume) filled with a constantly-aerated nutrient solution (pH: 6.4, EC: 1.56 dS m−1; see Appendix A). After transplanting, light treatments were differentiated and plants were distributed in the growing compartments at a planting density of 100 plants m−2. Harvest was conducted at 14 (lettuce) and 18 (basil, rocket and chicory) days after transplanting (DAT), respectively, which corresponded to 28 (lettuce), 32 (rocket and chicory) and 39 (basil) DAS.

2.2. Measurements and Determinations

Before each experiment, light treatments were randomized among insulated compartments and lamp electric power consumption (LEPC, W = J s−1) was determined using a multimeter (Fluke 189, Fluke Corporation, Everett, WA, USA). At harvest, crop fresh yields (g plant−1) were recorded and related to the length of the crop cycle and the planting density, in order to provide standard values of yearly production per unit of grown surface (kg m−2 year−1). At this stage, water consumption (L plant−1) was also measured as the difference between the amount of nutrient solution supplied at the beginning of the experiment in each individual plant pot and the remaining nutrient solution at harvest. The amount of electricity and nutrient solution needed for producing 1 kg of crop yield, expressed respectively as kWh kg−1 and L kg−1, were calculated for each plant species.

2.3. Environmental and Economic Assessment

The environmental and economic assessment of the indoor farming system was conducted from a life cycle perspective with the application of the Life Cycle Assessment (LCA) [32,33] and the Life Cycle Costing (LCC) [34] methods, respectively. LCA is “a structured, comprehensive and internationally standardized method that quantifies all relevant emissions and resources consumed and the related environmental and health impacts and resource depletion issues that are associated with any goods or services” [35]. LCC follows the same approach as LCA but for the economic dimension, thereby taking into account all economic inputs and outputs of the system under assessment. The relevance of a life cycle-based assessment (both LCA and LCC) is that the entire life cycle of a product is taken into account (resource extraction, production, distribution, use and end of life), thereby avoiding trade-offs or environmental impacts or economic costs among the different life cycle stages.

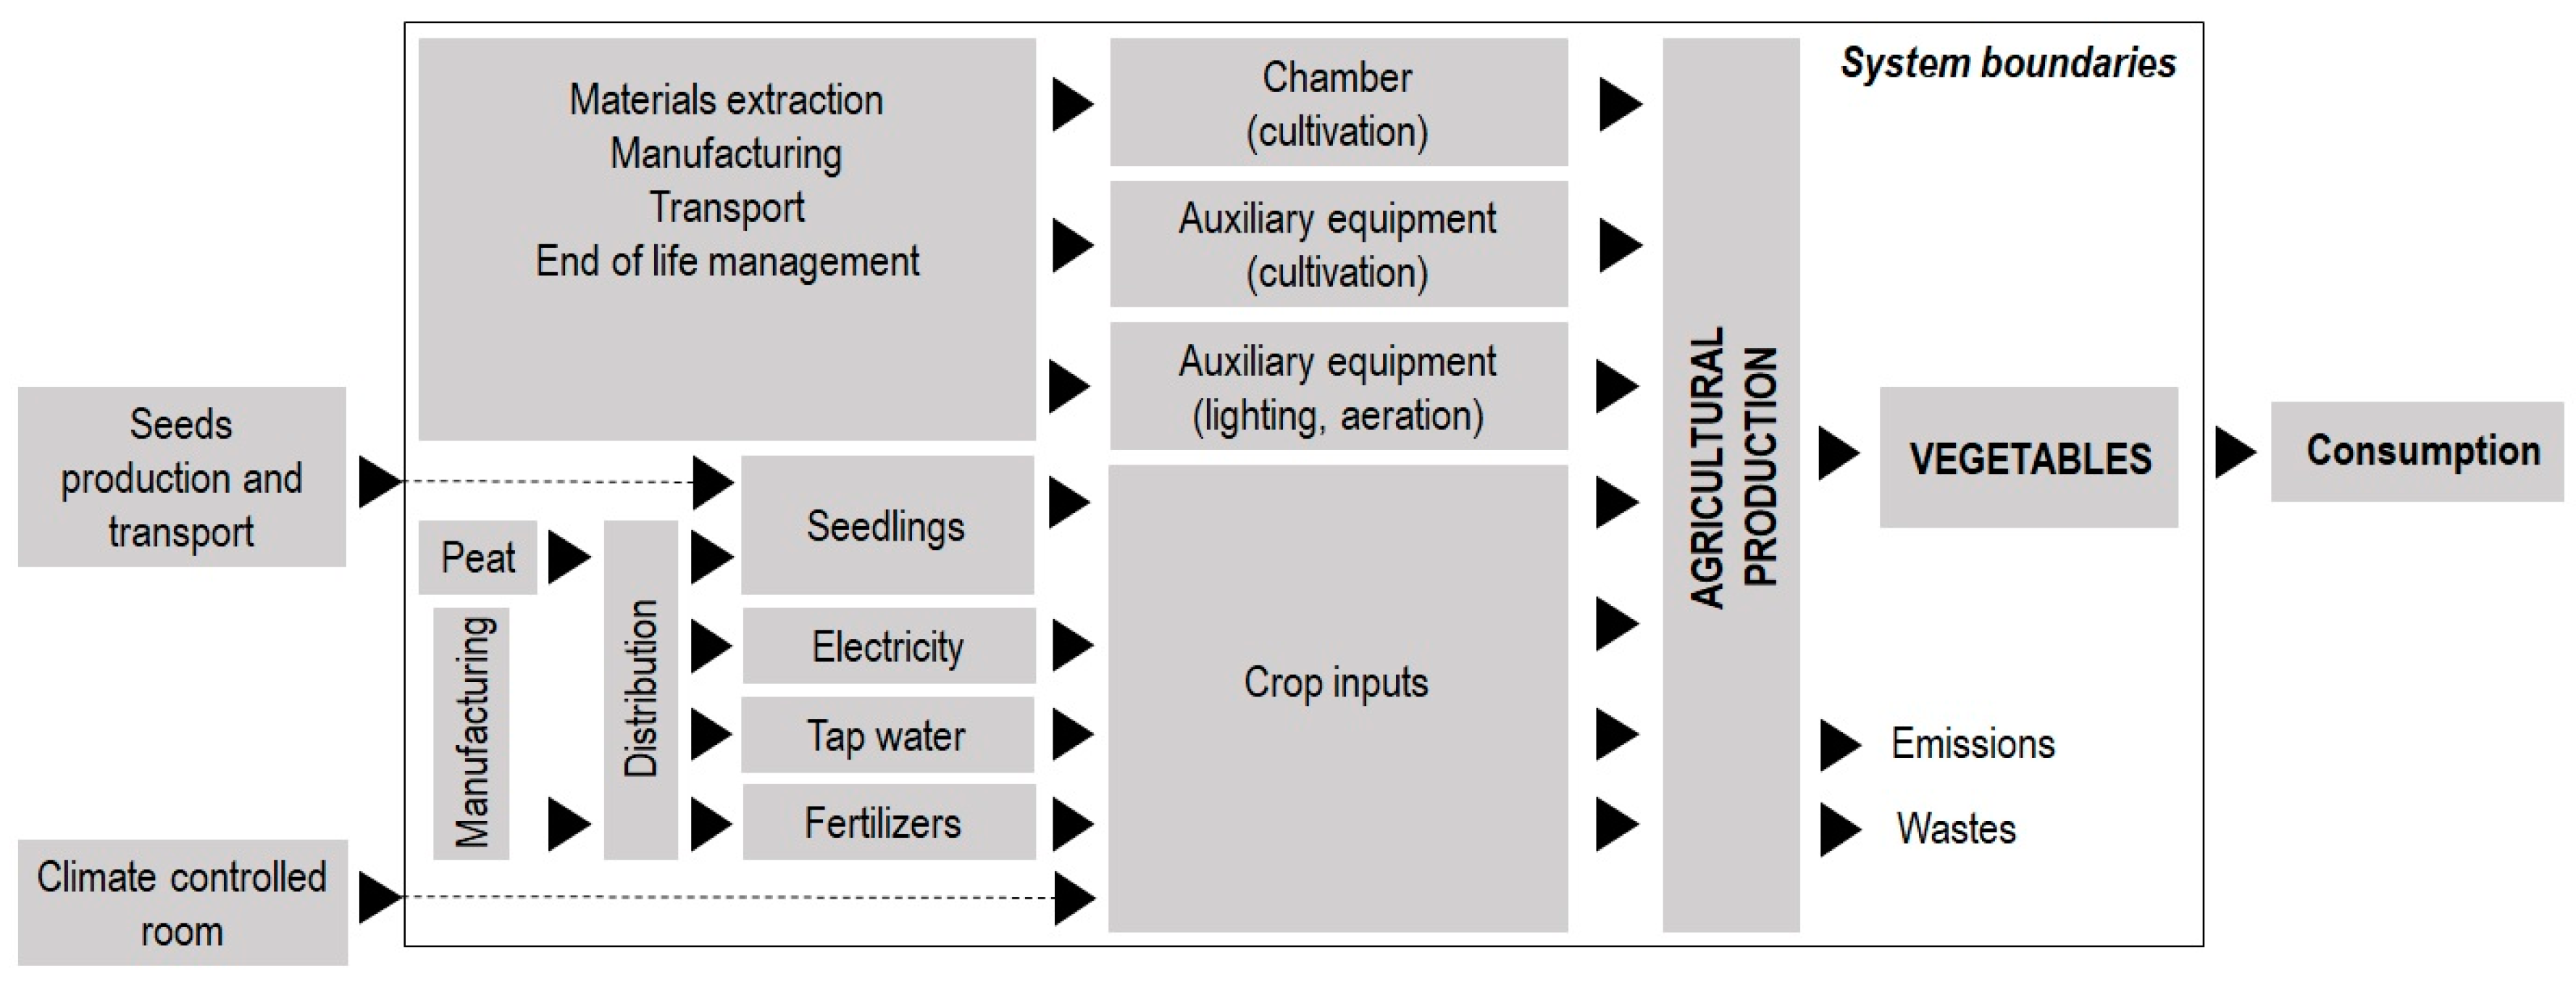
2.3.1. Goal and Scope

The goal of the analysis was twofold: (a) to provide data on the indoor production of leafy vegetables and herbs, and (b) to compare the environmental and economic impacts of different lighting conditions on indoor farming and the impacts of different crop species. The LCA and LCC methods used a functional unit of 1 kg of vegetable or herb produced from a cradle-to-farm gate perspective (Figure 2), including the inputs and outputs related to the stages: chamber and auxiliary equipment (cultivation, aeration and lighting) and the different crop inputs. Once the crops were produced, they were ready for consumption, as the case study consisted of an experimental growing system, without further processing needed after harvest. The distribution stage was therefore omitted. Lastly, the consumption stage remained outside the system boundaries due to the lack of data and because it was considered to be similar for the different vegetables and different lighting conditions under assessment.
The growing chamber used for the experimentation was placed inside the experimental greenhouses of the University of Bologna. The greenhouse had a climate system that positively influenced the growing conditions. However, the requirements related to the climate system were excluded from the system boundaries due to the following assumptions:
  • the growing chamber occupied a small volume of the total greenhouse volume;
  • the design of the university greenhouse was performed to satisfy experimental demands, rather than following market greenhouse designs, and heating-cooling demand can vary consistently from real-world settings;
  • the growing chamber can be placed at different locations, which would have different conditions in terms of climate;
  • among the possibilities of location, the growing chamber can benefit from residual heating-cooling related to the place (e.g., location in residential buildings where heating-cooling is already employed for human comfort), as for rooftop greenhouses [36].
Furthermore, the over-estimation of the environmental impacts of LED farming due to the efficiency of scale of an experimental set was slightly compensated for by excluding this element from the boundaries.

2.3.2. Life Cycle Inventory

Data for the LCA and LCC were collected from the experiments and background datasets were obtained from the Ecoinvent database [37] (e.g., electricity production, transport, manufacturing processes). In this section, the characteristics of the inventory are detailed for each life cycle stage.
Structure and auxiliary equipment: The system consisted of growth chambers built within a wooden frame and insulated by means of expanded polystyrene panels. The structure was assembled employing screws. The area of each growth chamber was 0.6 m2. Seedlings were transplanted onto individual pots resembling a deep-water culture, which were made of high-density polyethylene (HDPE). The dark cloth that was employed to prevent algae formation in each pot (Element “e” of Figure 1) was excluded from the Life Cycle Inventory (LCI) following a mass cut-off criterion, as less than 1 g of material was employed per crop cycle. Each growth chamber contained a total of 60 plants. The illumination equipment included 7 LED lamps for each growth chamber. The cultivation equipment also included aeration tubes (polypropylene), two aeration pumps per chamber for providing oxygen to the nutrient solution and two vents per chamber for introducing air into the chamber. The lifespan of all the auxiliary equipment was set as 10 years, apart from the 5 years set for pots and aeration tubes (both made of plastic materials).
All the elements and materials of the LED lamps, which were still prototypes, were provided by the company Flytech srl (Belluno, Italy). A local supply of the different elements (100 km) was assumed for the structure and auxiliary equipment, apart from the LED lamp components that have specific suppliers (Table 2). All transports were considered for a medium-size lorry with EURO5 technology.
Crop inputs: The substrate used in the nursery for seedlings germination, the electricity required for the lamps, pumps and vents, the water and nutrient required for the nutrient solution were accounted for in the experimental trials. The substrate and mineral fertilizers were obtained from local companies, considering a transport of 100 km. All transports were considered for a medium-size lorry with EURO5 technology. The crop consumed electricity due to the use of LED lamps for illumination (7 per growing chamber), aeration pumps (3.5 W, 2 per growing chamber) and vents (3 W, 2 per growing compartment). Electricity consumption depended on the red-blue (RB) ratio and the crop period. While the LED lamps were used for a 16-h photoperiod per day, both aeration and vent equipment were used continuously during the 24 h in a day during the entire crop cycle. All these electronic elements used electricity. The amount of nutrient solution consumed by the crop also depended on the plant species and the LED treatment. The details of the nutrient solution are found in Appendix A. Further information on the plant’s growing system, the lamp’s electric absorbance and the cultivation protocol can be found in [12].
Waste management: The end-of-life scenario for plastic and electronic elements was considered to be 100% recyclable, while wood elements were assumed to be landfilled at the end of the life cycle. A transport of 10 km to the waste management facilities was considered, according to the availability of different type of facilities around the study area. In indoor production, the discarded nutrient solution is usually employed in successive growth cycles, by mixing it with freshly prepared nutrient solution [10]. According to the LCA and LCC method, this resource should be considered in the life cycle of the following product rather than in the one considered for this analysis [35]. In this assessment, it was considered to be stored for future uses and thus no impact for its end-of-life management was considered.
Cost data: The elements of the growing chamber infrastructure were re-used from other experiments and were free of cost (i.e., wood and polystyrene). The cost of the other auxiliary equipment (e.g., pots, aeration tubes) was included. Since the electronic devices were purchased, the market price for these elements was included in the assessment. The LED lighting company provided the market price of the designed lamp. The cost of the crop inputs was obtained from the corresponding invoices, including the cost of tap water and electricity from the local suppliers.

2.3.3. Life Cycle Impact Assessment

The impact assessment included results at the midpoint level, both characterized and normalized values. First, the 16 midpoint indicators of the International Reference Life Cycle Data System (ILCD) [38] were assessed, following the recommendations by global guidelines [35] (Appendix B). Second, the characterized values were normalized (with normalization factors based on [39]) and weighted, considering that all impact categories have the same weight and relevance [40], in order to obtain a “single normalized impact” to compare the different options. The software Simapro [41] was used for the calculations. The economic cost of the life cycle is expressed with the indicator total cost (TC).

2.3.4. From Experimental Data to Annual Crop Estimations

The experimental set-up considered the cultivation of one plant from seed to harvest, without involving multiple harvests of the same plant. However, this experiment parameter differentiates from a productive crop in the nursery use, as in a year-round production scenario, the plant may undergo multiple harvests before being substituted with a new one [42,43,44]. Accordingly, we may refer to the Number of Cutting and Regrowth (NCR) as the number of harvests that are to be conducted on the same plant, and to Harvest Frequency (HF) when referring to the number of days between single harvests [42,43,44]. When multiple harvests are conducted on the same plant, a harvest frequency of 14 days (as the one used in this paper) was shown to preserve yield across the season in rosette-type leafy vegetables, as are three out of four of those used in this experimentation [45,46].
In order to assess how sensitive the results were to this experimental limitation, annual crop scenarios were designed to emulate how the crop requirements would perform in a crop system under production-oriented conditions rather than experimental ones. Scenarios with assumptions rather than with collected data are common in LCA and LCC as a way to evaluate the sensitivity of the results to a change in different parameters or to evaluate improvement scenarios of the system, particularly in comparative studies such as this one, where the red-blue ratio is compared [35]. Since the environmental conditions were constant within the growing chamber, the resulting crop inputs and yield data could be estimated to be similar throughout the entire year. Accordingly, three different scenarios were analyzed to include a potential variability in the cycles examined before substituting the plant:
  • Low NCR: plants are substituted every 2 cycles. In order to guarantee year-round production, plants need to be produced in the nursery ten times every 365 days.
  • Medium NCR: plants are substituted every 3 cycles. Plants need to be prepared seven times in the nursery every year.
  • High NCR: plants are substituted every 5 cycles. Four times plants are prepared in the nursery along the year.

3. Results and Discussion

3.1. Agronomic Assessment of Indoor Farming with LED Systems

Differences in crop yield were associated with light treatments in all studied crops, with higher fresh biomass production in RB3 (103.6 kg m−2 year−1) for lettuce or in RB ≥ 2 for basil, rocket and chicory (average values of 54.7, 52.3 and 37.1 kg m−2 year−1, respectively), similar to previously reported results on lettuce [47,48] and basil [12]. Daily uptake of nutrient solution was affected by RB ratio in lettuce, basil and rocket, with higher values when RB ≥ 2 was used (with a consumption of 3.6, 3.5 and 5.5 L m−2 d−1, respectively), whereas no changes in daily nutrient solution uptake were attributable to light treatments in chicory (data not shown). The effect of variations in the red and blue spectral components on the water uptake was previously associated with physiological adaptations altering stomatal functions [49] which were also linked with changes in biomass accumulation and dry matter content in both lettuce [50] and basil [12].
Considering the variations of electricity consumption (due to the different lighting treatments) and crop yield, the amount of electricity required for producing 1 kg of fresh lettuce ranged between 14.8 and 25.5 kWh kg−1, with the lowest value associated with RB3 (Table 3). Basil and rocket showed similar trends of electricity efficiency with the highest values of electricity required for producing 1 kg of fresh product associated with a greater fraction of blue light (e.g., RB ≤ 1) in the spectrum and lower values when red was prevalently used (RB > 1) [9,12] (Table 3). On the other hand, the light treatments did not affect the electricity consumption associated with chicory production, which resulted the highest as compared with other crop species (mean value of 57.3 kWh kg−1) (Table 3).
Based on the variations of both nutrient solution uptake and crop yield, differences in resource use efficiency were found in response to the varied RB ratio, as previously observed in lettuce [27] or basil [12]. In lettuce, efficiency was maximized in RB3, with values as low as 12.9 L kg−1 (Table 3). For basil, rocket and chicory cultivation, efficiency showed similar trends and was maximized by the adoption of RB ≥ 2 (average values of 23.7, 40.2 and 39.9 L kg−1, respectively).

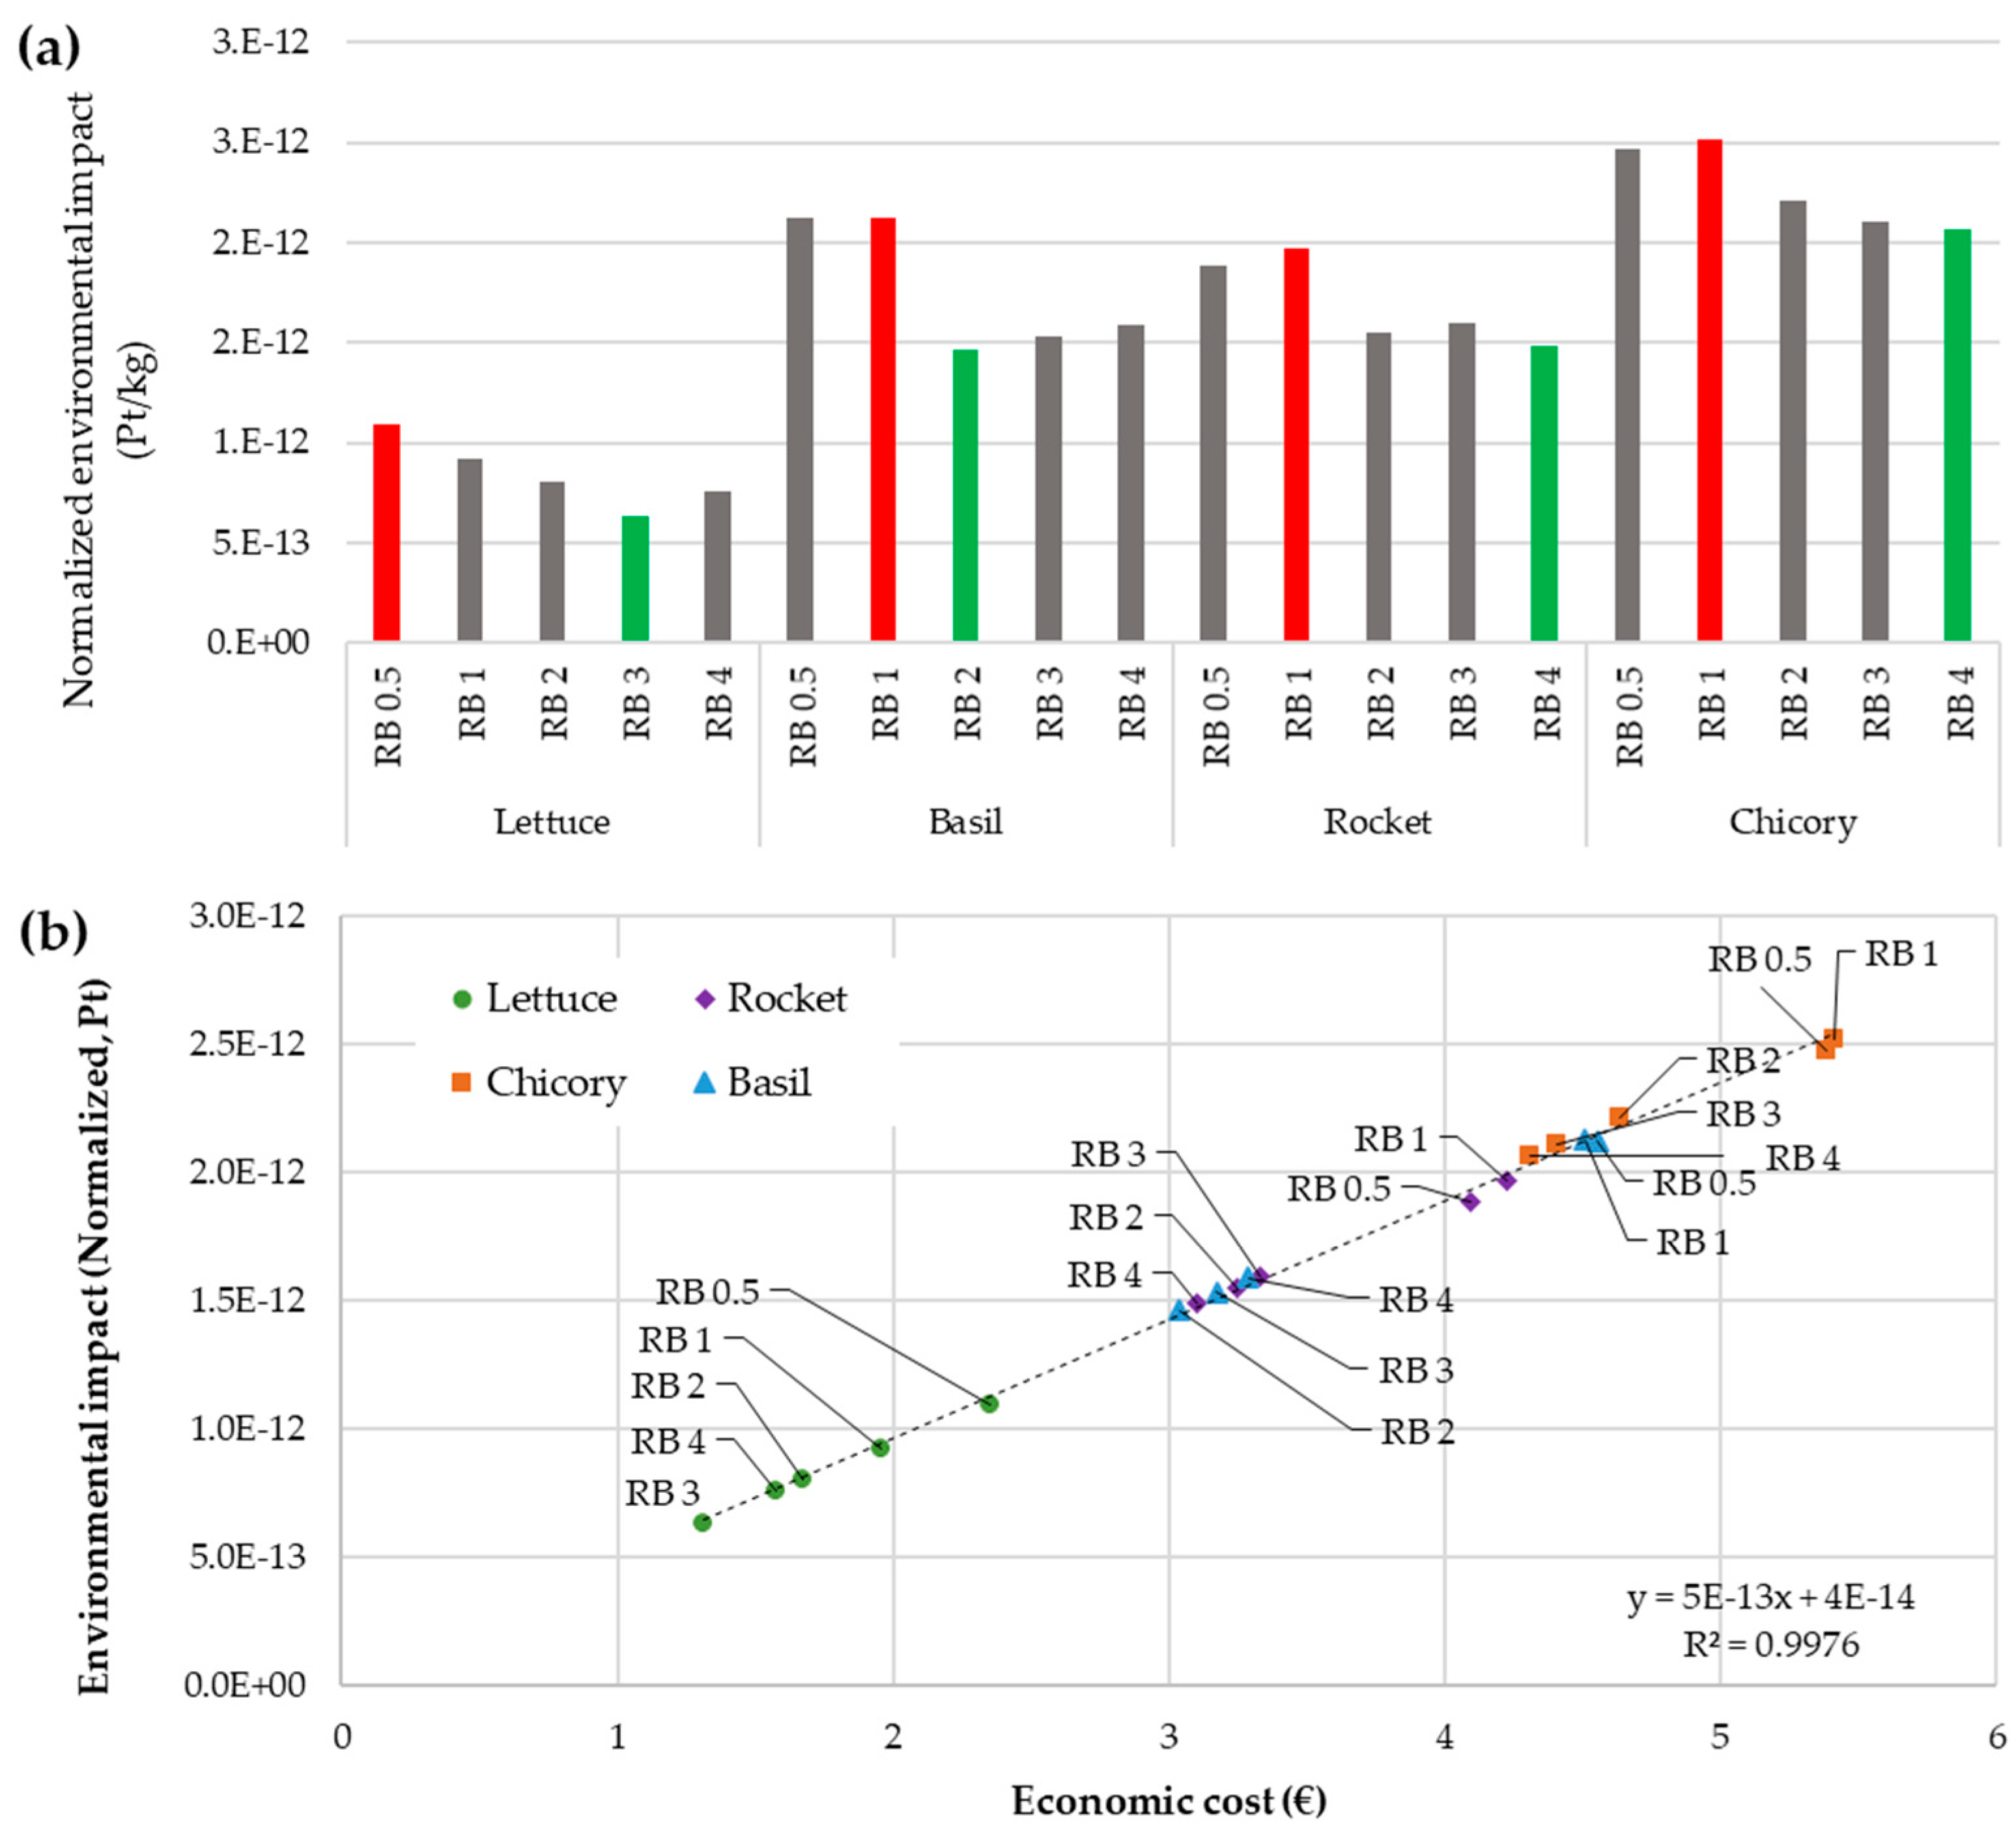
3.2. Environmental and Economic Assessment of Indoor Farming with LED Systems

According to the results, the most environmentally impacting LED treatment was the RB1 for chicory, while the least impacting one was RB3 for lettuce production (Figure 3a). The difference in the environmental impacts resulted from the characteristics of the crop (i.e., yield vs. duration of the crop cycle) and the necessary crop inputs related to the different light treatments (i.e., electricity and uptake of nutrient solution). The different red-blue light ratios were associated with a different total electricity consumption. The total electricity consumption ranged between 30.6 (lettuce, RB0.5) and 51.7 kWh (basil, RB3 and RB4) and consumption was mainly due to illumination (66%–77%).
When one also considers the economic cost of each crop and treatment option, the eco-efficiency highlights the differences between crops and treatments (Figure 3b). Lettuce was the most eco-efficient crop, in contrast to chicory, which had the worst results. Basil and rocket obtained similar eco-efficiency results that depended on the LED treatment. Among red-blue ratios, RB2, RB3 and RB4 were the most eco-efficient treatments within each crop. No clear pattern was found that could be used to identify the best option, as it varied depending on the crop. While RB3 was the most eco-efficient option for lettuce, for basil it was RB2, and for chicory and rocket production it was RB4. Life cycle cost and environmental impact showed a positive correlation in the eco-efficiency assessment, indicating that both variables increased at the same pace. Although the slope seemed small (5 × 10⁻¹³), this was only related to the low value of the normalized environmental impact.
Improving energy efficiency has been pointed out as a very common technological innovation in the environmental dimension of urban agriculture [51]. The results of this study allowed for exploring how the energy efficiency of the different lighting treatments affected the final environmental impact. At the LED treatment level, the analysis unveiled that not only was the energy electricity consumption of the LED lamp a determinant factor of the environmental impact but also of the associated physiological effects on the plant and the resulting crop yield and water consumption. Therefore, although the treatment RB0.5 was the one consuming the lowest amount of electricity, it was also the one that obtained the poorest values of crop yield. As the environmental impact was calculated per the functional unit of mass of the product (1 kg of vegetable), other LED treatments had a better performance even with a relatively higher electricity consumption.

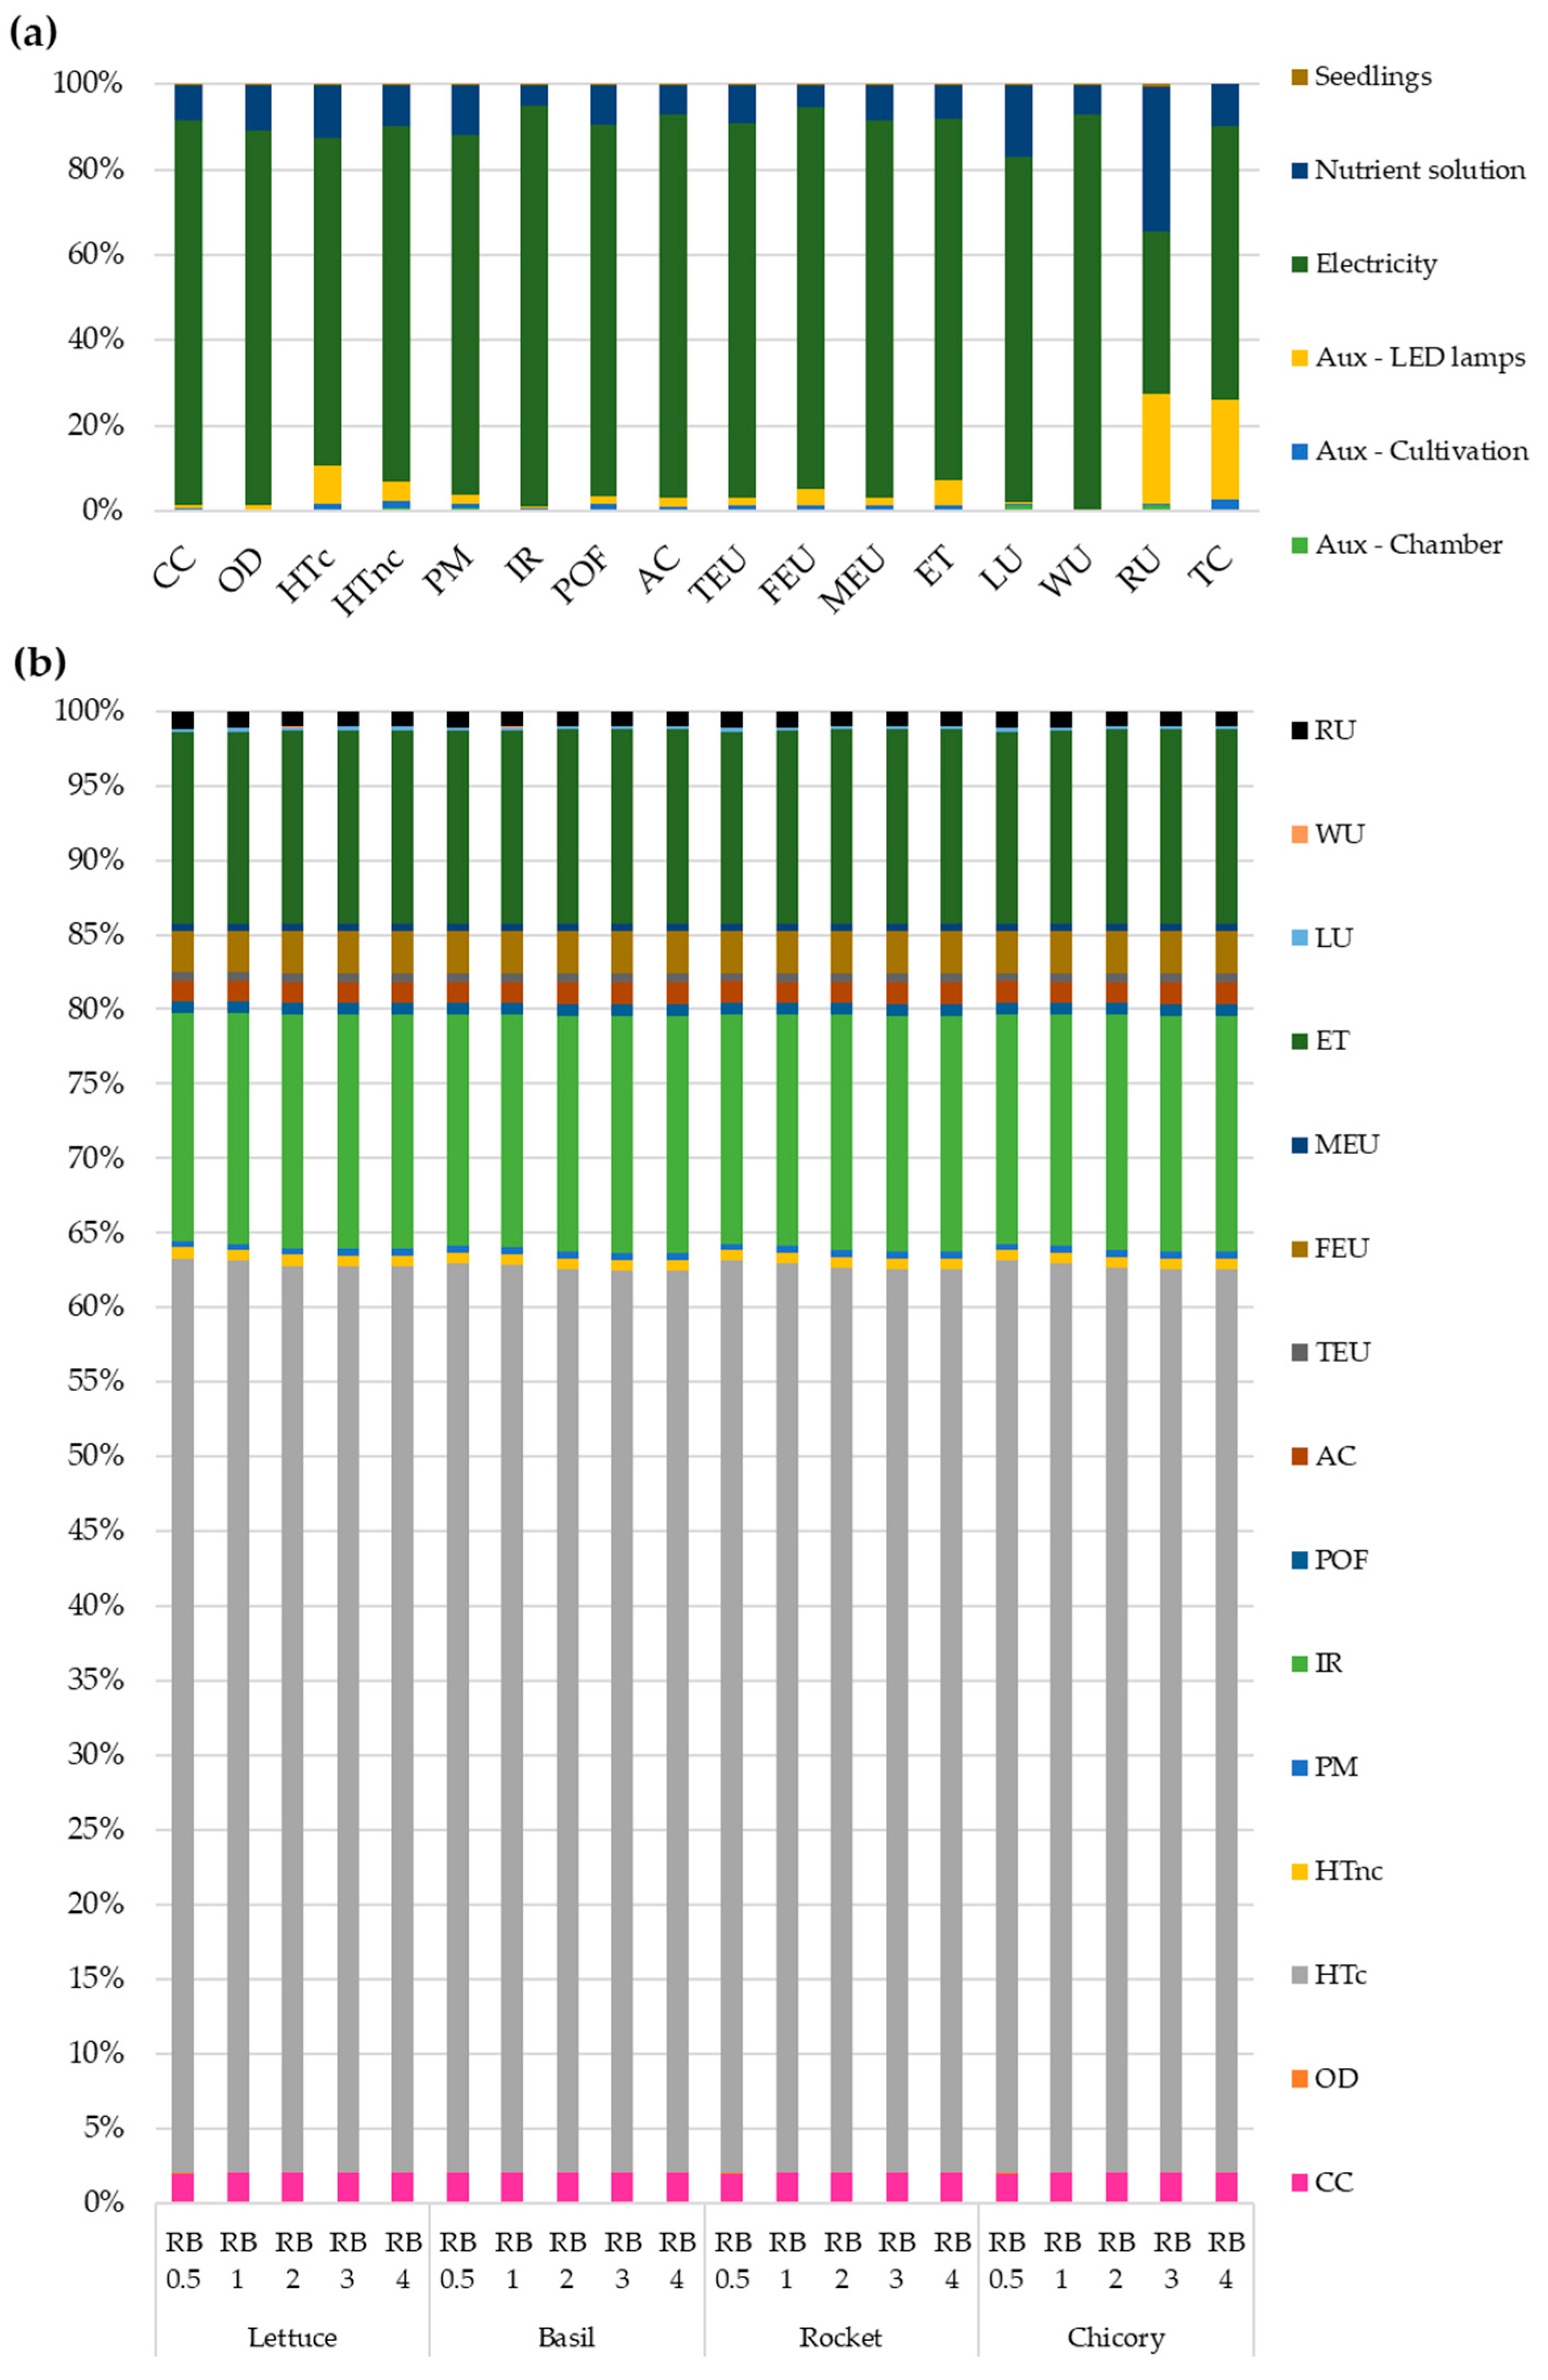
3.2.1. Contribution to the Environmental Impact and Economic Cost

Differentiating between the life cycle stages and the elements of the crop production, the contributions to the environmental impact and economic cost were mainly related to the electricity consumption (Figure 4a shows the analysis for the lettuce production with RB0.5 treatment as an example). The electricity consumption was responsible for 77 and 93% of the environmental impact in the different midpoint categories, with the exception of the resources use impact category where it only represented 38%. With reference to the economic cost of production, the electricity consumption represented 64% of it, followed by the cost of the LED lamps (23%), the cost of the nutrient solution (10%) and the cost of the auxiliary equipment for cultivation (3%). The nutrient solution was the second element of the inventory that played a relevant role, contributing to the impacts with 5 to 34% of the different categories. The main role of the nutrient solution was in the resources use category as the nutrient solution included minerals to fertilize the crops (particularly micronutrients) (See Appendix A). Also, the use of metals and minerals in the electronics of the LED lamps showed a significant contribution to the resources use impact (26%).
As multiple environmental impact categories are included in the ILCD method, the contribution of the different categories to the normalized environmental impact was analyzed (Figure 4b). The category of “human toxicity with cancer effects” was the most relevant one, contributing approximately 60% of the normalized impact. The environmental impacts to this category were mainly related to emissions of chromium VI (to water and soil), chromium (to water and air), nickel (to water), arsenic (to water) and mercury (to air) from electricity production. The nutrient solution contributed to the emissions of chromium to water (31%) and to air (18%). The second most relevant category was ionizing radiation (approximately 16%). Two-thirds (66%) of the impact was caused by emissions of Radon-222 to air and 33% by emissions of Carbon-14 to air. The other air and water emissions contributing to this impact category accounted for less than 1%. Most of the emissions (>87%) also originated from electricity production that was required by the LED lighting. And the third most contributing impact category to the normalized impact was terrestrial eutrophication (13%). Nitrogen oxides and ammonia emissions to air caused by electricity consumption were the main contributors to this impact category. Therefore, environmental impact was driven by the emissions originating in the electricity production and some flows related to the nutrient solution also played a relevant role in human toxicity. The absolute results of the midpoint impact categories are shown for each crop and LED treatment in Appendix C.

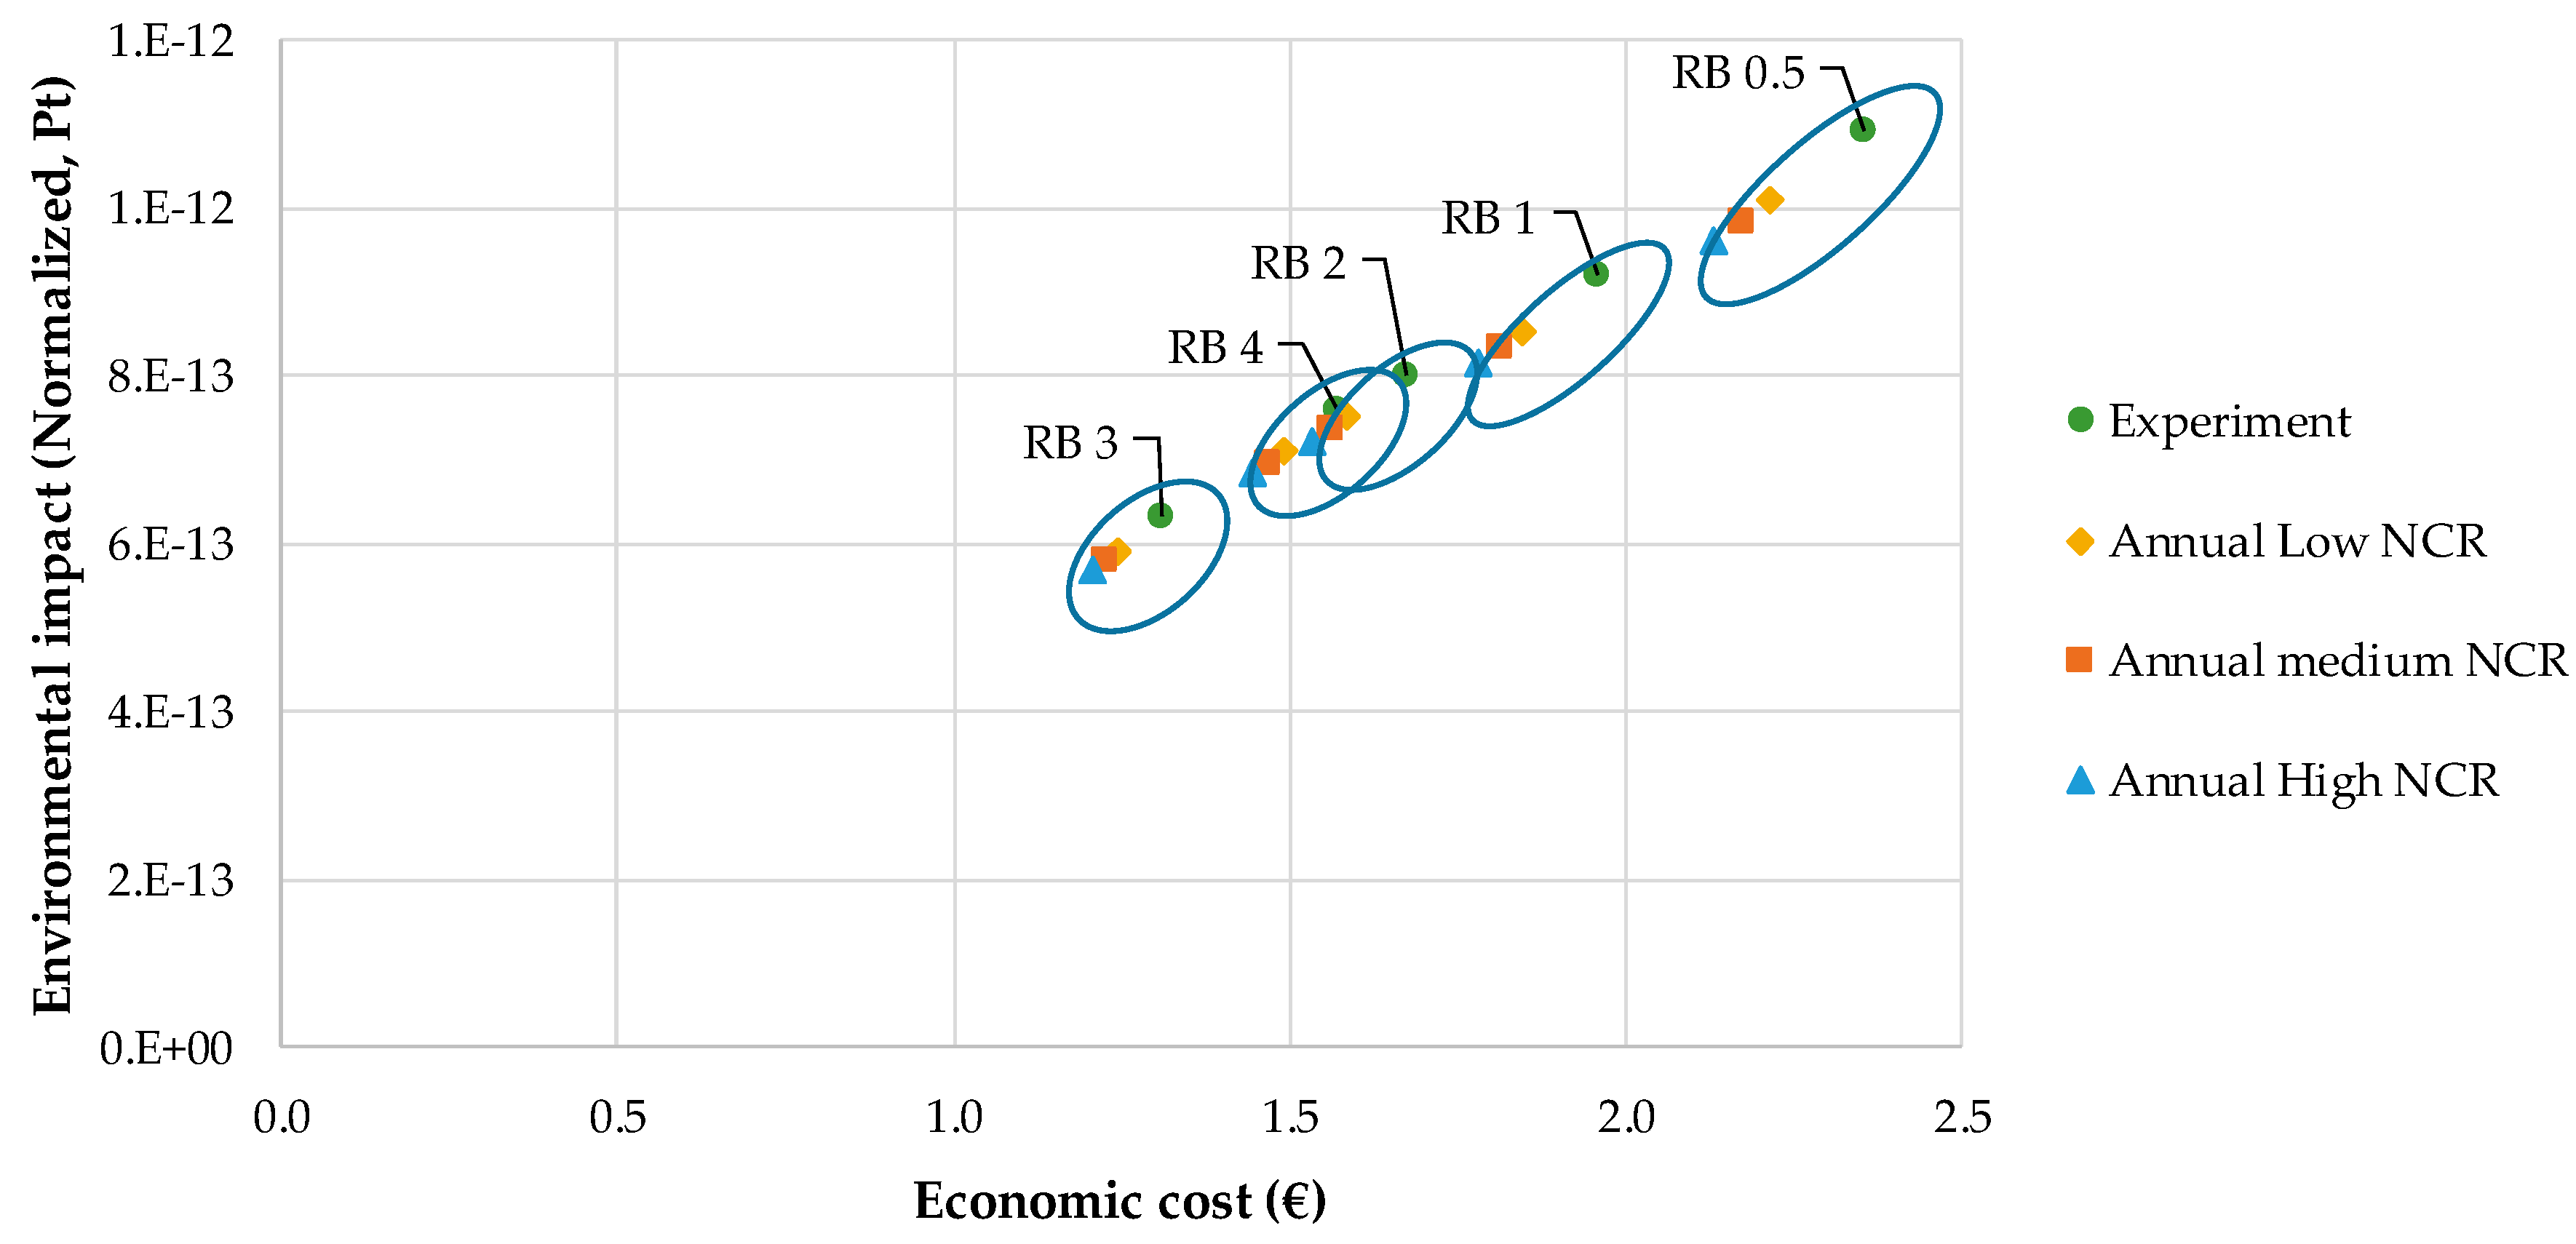
3.2.2. From Experiment to Production: Estimating Annual Eco-Efficiency

Table 4 shows the difference between the environmental impact and the economic cost of the annual production scenarios (low, medium and high NCR) with the results of the experimental data. All the scenarios showed a decrease of both the economic cost and the environmental impact. As expected, the higher the NCR, the lower the environmental impact. This is related to the lower resources consumption, such as the materials for the nursery chamber or the electricity used for this growing phase.
Three main trends were observed in the results. First, the environmental impact was more sensitive to NCR than the economic cost, showing a larger decrease for all the crops and LED treatments. Second, basil had the largest potential reduction in the environmental impact (up to 14%) and the economic cost (up to 11%), as the nursery period was the longest one (21 days). On the contrary, rocket and chicory were the crops with the least sensitivity to NCR, with reductions in the environmental impact limited to 10 and 8% in the economic cost. Third, the LED treatments RB0.5 and RB1 were the most sensitive in the NCR scenarios, obtaining the largest reductions in both the environmental impact and the economic cost for all the crops evaluated.
As for the resulting eco-efficiency of the scenarios, Figure 5 displays the results for lettuce production, which was the most eco-efficient crop at the experimental level. For all the LED treatments, the annual production scenarios were more eco-efficient than the short-term experimental ones. While the difference between the experimental and the annual production results was notable, the three scenarios (low, medium and high NCR) slightly diverged in the eco-efficiency results.

3.3. Comparing Led Indoor Farming to Other Forms of Urban Agriculture

LED farming has been indicated as a possible technological solution for transforming abandoned buildings into indoor farms in cities where urban agriculture is spreading. In terms of climate change (kg CO2 eq per kg), lettuce was the vegetable with a lower environmental impact, ranging between 9.52 (RB3) and 16.1 (RB0.5) (Appendix C).
Previous estimations of the climate change impact associated with urban cultivation of lettuce in the literature showed an elevated variability, between 0.02 and 26.51 kg CO2 eq per kg. The hereby presented results for LED farming were positioned within this range and were always lower than those measured in a ground-based greenhouse (heated) case in the USA (26.51 kg CO2 eq per kg [52]). Furthermore, the best performing LED treatment (RB3; 9.23 kg CO2 eq per kg) was also shown to perform better than lettuce produced in an open-air rooftop garden in Paris (France) (11.63 kg CO2 eq per kg, [53]), or in a ground-based conditioned hydroponics system analyzed in the USA (8.65 kg CO2 eq per kg, [52]). On the other hand, it had a higher environmental impact than other urban agriculture growing systems, including when lettuce was grown on a floating system in an open-air rooftop garden in Bologna, Italy (0.95 kg CO2 eq per kg, [54]), in a building-integrated open air garden in the USA (0.40 kg CO2 eq per kg, [52]), or in open-air cultivation on soil in Italy (0.33-0.39 CO2 eq per kg, [55]) and USA (0.02 kg CO2 eq per kg, [52]), where the impact was dramatically reduced by avoiding electricity needs [54]. Such a comparative analysis is, however, difficult, due to the elevated variability in both the growing solutions adopted and the boundaries of the system considered for each study [54]. Furthermore, the hereby shown results were based on experimental lamp prototypes, the efficiency of which may easily be higher (up to 1.6 μmol J−1, as compared with the hereby considered 0.98 μmol J−1) when the commercial versions of the lamps produced by the same manufacturer were used (Orsini F., personal communication).
Given the relevance of electricity consumption on the environmental impact, a sensitivity assessment to evaluate how much the efficiency of the lamps affected the environmental impact and the cost was performed (Table 5). Considering the best LED treatments for each crop in environmental terms, the use of commercial-level efficient lamps could reduce the environmental impact between 11 and 12%, depending on the crop. The most sensitive environmental category was ionizing radiation, due to the importance of nuclear energy in the European electricity market. On the contrary, the least sensitive category was resources use, due to the relevance of the nutrient solution and the materials of the LED lamps (Figure 4a). The cost of electricity could be reduced between 9 and 10%. Lastly, rocket and chicory were the crops showing the highest potential for reducing the environmental impact and the cost due to the larger electricity consumption used for their production.

4. Conclusions

This paper evaluates the environmental impact, the economic cost and the resulting eco-efficiency of leafy vegetables and herbs production in indoor farming with LED lamps from a life cycle perspective. Different LED treatment options that vary the red-blue ratio were analyzed to individuate the most eco-efficient treatment by crop. The best options for improved eco-efficiency were identified respectively for lettuce (RB3), basil (RB2), rocket (RB4) and chicory (RB4). Although RB0.5 was the treatment with the lowest electricity consumption, the lowest crop yield of the mentioned treatments resulted in a poorer performance when evaluating the environmental impact and economic cost per kg of product. The electricity consumption was the main driver of the different environmental impact categories evaluated (>77% of the impact), apart from the resources use category, where the minerals and metals employed in the nutrient solution and the LED lamp were also relevant. Accordingly, the electricity consumption was also the most expensive element of the life cycle, followed by the price of the LED lamp.
In order to overcome the limitations associated with the experimental scale of the assessed system, scenarios with greater similarities with commercial, year-round production were also analyzed. The higher the Number of Cuttings and Regrowth (NCR) applied to the same plant, the higher the eco-efficiency due to a lower requirement of seedling preparation in the nursery and the related environmental impacts and economic costs. Indeed, data estimated for these scenarios should be supported with dedicated experimentation, allowing for defining the optimal NCR value based on measured production and qualitative features. Furthermore, the resulting climate change impact of lettuce production was higher when compared to other forms of urban agriculture found from the literature, apart from cases of ground-based greenhouse (heated) in the USA, open-air rooftop farming in Paris or ground-based conditioned hydroponics systems in the USA. Again, the experimental level of the system under assessment and the use of low efficient LED lamps played a major role in these differences with real case studies of urban agriculture. To test the relevance of the efficiency of the LED lamps, a sensitivity scenario was calculated using the parameters of commercial LED lamps showing that reductions between 6 and 13% could be achieved. Further research may assess commercial-scale indoor faming systems to provide further environmental and economic data of LED systems for urban food production.

Author Contributions

G.P. designed and performed all experiments and drafted the manuscript. E.S.-M. analysed the LCA data and contributed to manuscript preparation; F.O. contributed to the experimental design and the drafting of the manuscript; A.C. coordinated the manufacturing of the lamps used in the experiments and collected data for LCI; S.N., J.A.F., J.O. and G.G. contributed to the literature review, supervised the research and critically revised the manuscript.

Acknowledgments

This project received funding from the European Union’s Horizon 2020 research and innovation programme under the Marie Sklodowska-Curie grant agreement No. 708672. The elaboration of the manuscript was also supported by a grant from the Fundacion Séneca (reference 20555/IV/18, Call for Fellowships for Guest Researcher Stays at Universities and OPIS of the Region of Murcia) awarded to Francesco Orsini.

Conflicts of Interest

Andrea Crepaldi was employed by company Flytech s.r.l. The remaining authors declare that the research was conducted in the absence of any commercial or financial relationships that could be construed as a potential conflict of interest.

Appendix A. Composition and Cost of the Nutrient Solution

Table A1 Details of the composition and the cost of the fertilizers that were integrated into the nutrient solution. The microelements included 13.4% of iron, 0.9% of boron, 0.2% of molybdenum, 5.2% of manganese, 2.2% of zinc, and 0.6% of copper.
Table A1. Composition and cost of nutrients included in the nutrient solution.
FertilizersConcentration (g L−1)Cost (€·kg−1)
Calcium nitrate0.250.49
Potassium sulphate10.84
Magnesium nitrate1.50.85
Potassium nitrate0.10.93
Micro-elements0.02521
Ammonium phosphate0.51.3

Appendix B. ILCD 2011 Impact Assessment Method

Table A2 details the midpoint indicators included in the ILCD 2011 impact assessment method.
Table A2. Environmental impact categories of the ILCD method, abbreviation, units and underpinning method.
IndicatorAbbreviationUnitUnderpinning Method
Climate changeCCkg CO2 eq[56]
Ozone depletionODkg CFC-11 eq[57]
Human toxicity, cancerHTcCTUh[58]
Human toxicity, non-cancerHTncCTUh[58]
Particulate matter PMkg PM2.5 eq[59]
Ionizing radiationIRkBq U-235 eq. [60]
Photochemical ozone formationPOFkg NMVOC eq.[61]
AcidificationACmol H+ eq[62,63]
Eutrophication, terrestrialTEUmol N eq[62,63]
Eutrophication, freshwater FEUkg P eq[64]
Eutrophication, marineMEUkg N eq[64]
Land useLUkg C deficit[65]
Ecotoxicity freshwaterETCTUe[58]
Water useWUm3 water use related to local scarcity of water[66]
Resource useRUkg Sb eq[67]

Appendix C. Detailed Environmental and Economic Results

Table A3 and Table A4 details the results of the analysis by ILCD midpoint indicator, normalized values and total economic cost. Results are shown according to crop and light treatment.
Table A3. Environmental Impact and Economic Cost of Lettuce and Basil Treatments
LettuceBasil
RB 0.5RB 1RB 2RB 3RB 4RB 0.5RB 1RB 2RB 3RB 4
CC16.113.712.19.5211.431.531.822.123.224.1
OD2.13 × 10−61.80 × 10−61.59 × 10−61.25 × 10−61.50 × 10−64.15 × 10−64.17 × 10−62.90 × 10−63.04 × 10−63.16 × 10⁻⁶
HTc3.38 × 10−62.84 × 10−62.46 × 10−61.94 × 10−62.32 × 10−66.53 × 10−66.53 × 10−64.47 × 10−64.68 × 10−64.85 × 10⁻⁶
HTnc6.77 × 10−75.70 × 10−74.99 × 10−73.93 × 10−74.72 × 10−71.32 × 10−61.32 × 10−69.11 × 10−79.56 × 10−79.91 × 10⁻⁷
PM6.99 × 10−35.90 × 10−35.17 × 10−34.08 × 10−34.89 × 10−31.35 × 10−21.36 × 10−29.41 × 10−39.87 × 10−31.02 × 10⁻²
IR2.392.031.801.421.704.704.753.323.493.62
POF3.56 × 10−23.01 × 10−22.65 × 10−22.09 × 10−22.51 × 10−26.94 × 10−26.99 × 10−24.85 × 10−25.09 × 10−25.28 × 10⁻²
AC8.69 × 10−27.36 × 10−26.50 × 10−25.13 × 10−26.15 × 10−21.70 × 10−11.72 × 10−11.19 × 10−11.25 × 10−11.30 × 10⁻¹
TEU1.15 × 10−19.73 × 10−28.57 × 10−26.76 × 10−28.11 × 10−22.24 × 10−12.26 × 10−11.57 × 10−11.65 × 10−11.71 × 10⁻¹
FEU5.01 × 10−34.25 × 10−33.75 × 10−32.96 × 10−33.55 × 10−39.87 × 10−39.94 × 10−36.90 × 10−37.25 × 10−37.52 × 10⁻³
MEU1.14 × 10−29.64 × 10−38.50 × 10−36.70 × 10−38.04 × 10−32.23 × 10−22.24 × 10−21.56 × 10−21.63 × 10−21.69 × 10⁻²
ET1.21 × 10+21.02 × 10+290.070.985.02.37 × 10+22.38 × 10+21.65 × 10+21.73 × 10+21.79 × 10+2
LU33.528.224.619.423.264.164.244.346.448.1
WU1.41 × 10−11.19 × 10−11.06 × 10−18.37 × 10−21.00 × 10−12.76 × 10−12.79 × 10−11.95 × 10−12.05 × 10−12.12 × 10⁻¹
RU7.16 × 10−45.83 × 10−44.80 × 10−43.73 × 10−44.47 × 10−41.30 × 10−31.26 × 10−38.23 × 10−48.53 × 10−48.84 × 10⁻⁴
Norm2.351.961.671.311.574.554.513.043.173.29
TC1.09 × 10−129.19 × 10−138.02 × 10−136.32 × 10−137.58 × 10−132.12 × 10−122.12 × 10−121.46 × 10−121.53 × 10−121.59 × 10⁻¹²
Table A4. Environmental impact and economic cost of rocket and chicory.
RocketChicory
RB 0.5RB 1RB 2RB 3RB 4RB 0.5RB 1RB 2RB 3RB 4
CC27.929.323.324.122.436.637.633.331.931.2
OD3.67 × 10−63.86 × 10−63.06 × 10−63.16 × 10−62.95 × 10−64.82 × 10−64.94 × 10−64.37 × 10−64.18 × 10−64.10 × 10⁻⁶
HTc5.82 × 10−66.06 × 10−64.74 × 10−64.88 × 10−64.54 × 10−67.64 × 10−67.76 × 10−66.76 × 10−66.45 × 10−66.32 × 10⁻⁶
HTnc1.17 × 10−61.22 × 10−69.65 × 10−79.94 × 10−79.26 × 10−71.53 × 10−61.57 × 10−61.38 × 10−61.31 × 10−61.29 × 10⁻⁶
PM1.20 × 10−21.26 × 10−29.96 × 10−31.03 × 10−29.56 × 10−31.58 × 10−21.61 × 10−21.42 × 10−21.36 × 10−21.33 × 10⁻²
IR4.154.383.503.623.375.455.614.994.784.68
POF6.15 × 10−26.46 × 10−25.12 × 10−25.29 × 10−24.92 × 10−28.08 × 10−28.27 × 10−27.31 × 10−26.99 × 10−26.85 × 10⁻²
AC1.51 × 10−11.58 × 10−11.26 × 10−11.30 × 10−11.21 × 10−11.98 × 10−12.03 × 10−11.80 × 10−11.72 × 10−11.69 × 10⁻¹
TEU1.99 × 10−12.09 × 10−11.66 × 10−11.71 × 10−11.59 × 10−12.61 × 10−12.67 × 10−12.37 × 10−12.26 × 10−12.22 × 10⁻¹
FEU8.73 × 10−39.17 × 10−37.29 × 10−37.53 × 10−37.01 × 10−31.15 × 10−21.17 × 10−21.04 × 10−29.95 × 10−39.75 × 10⁻³
MEU1.97 × 10−22.07 × 10−21.64 × 10−21.70 × 10−21.58 × 10−22.59 × 10−22.65 × 10−22.35 × 10−22.24 × 10−22.20 × 10⁻²
ET2.10 × 10+22.21 × 10+21.74 × 10+21.80 × 10+21.67 × 10+22.76 × 10+22.82 × 10+22.49 × 10+22.38 × 10+22.33 × 10+2
LU57.059.646.948.345.074.876.366.963.962.6
WU2.44 × 10−12.57 × 10−12.05 × 10−12.12 × 10−11.98 × 10−13.20 × 10−13.29 × 10−12.93 × 10−12.81 × 10−12.75 × 10⁻¹
RU1.19 × 10−31.20 × 10−38.87 × 10−49.02 × 10−48.40 × 10−41.56 × 10−31.53 × 10−31.27 × 10−31.19 × 10−31.17 × 10⁻³
Norm4.104.233.253.333.105.385.414.634.404.31
TC1.88 × 10−121.97 × 10−121.55 × 10−121.59 × 10−121.49 × 10−122.47 × 10−122.52 × 10−122.21 × 10−122.11 × 10−122.07 × 10⁻¹²

References

  1. Specht, K.; Siebert, R.; Hartmann, I.; Freisinger, U.B.; Sawicka, M.; Werner, A.; Thomaier, S.; Henckel, D.; Walk, H.; Dierich, A. Urban agriculture of the future: An overview of sustainability aspects of food production in and on buildings. Agric. Hum. Values 2014, 31, 33–51. [Google Scholar] [CrossRef]
  2. United Nations, Department of Economic and Social Affairs, Population Division. World Urbanization Prospects: The 2014 Revision, (ST/ESA/SER.A/366). 2015. Available online: https://esa.un.org/unpd/wup/publications/files/wup2014-report.pdf (accessed on 14 June 2019).
  3. Sanyé-Mengual, E.; Oliver-Solà, J.; Montero, J.I.; Rieradevall, J. An environmental and economic life cycle assessment of Rooftop Greenhouse (RTG) implementation in Barcelona, Spain. Assessing new forms of urban agriculture from the greenhouse structure to the final product level. Int. J. Life Cycle Assess. 2015, 20, 350–366. [Google Scholar] [CrossRef]
  4. Thomaier, S.; Specht, K.; Henckel, D.; Dierich, A.; Siebert, R.; Freisinger, U.B.; Sawicka, M. Farming in and on urban buildings: Present practice and specific novelties of Zero-Acreage Farming (ZFarming). Renew. Agric. Food Syst. 2015, 30, 43–54. [Google Scholar] [CrossRef]
  5. Specht, K.; Sanyé-Mengual, E. Risks in urban rooftop agriculture: Assessing stakeholders’ perceptions to ensure efficient policymaking. Environ. Sci. Policy 2017, 69, 13–21. [Google Scholar] [CrossRef]
  6. Kozai, T. PFAL business and R&D in the world: Current status and perspectives. In Plant Factory: An Indoor Vertical Farming System for Efficient Quality Food Production; Kozai, T., Niu, G., Takagaki, M., Eds.; Academic Press: Cambridge, MA, USA, 2015; pp. 35–68. [Google Scholar]
  7. MarketsandMarkets. Vertical Farming Market by Growth Mechanism (Hydroponics, Aeroponics, and Aquaponics), Structure (Building Based and Shipping Container), Offering (Hardware, Software, and Service), Crop Type, and Geography—Global Forecast to 2022; MarketsandMarkets: Northbrook, IL, USA, 2017. [Google Scholar]
  8. Cıceklı, M.; Barlas, N.T. Transformation of today greenhouses into high technology Vertical Farming Systems for metropolitan regions. J. Environ. Protect. Ecol. 2014, 15, 1779–1785. [Google Scholar]
  9. Piovene, C.; Orsini, F.; Bosi, S.; Sanoubar, R.; Bregola, V.; Dinelli, G.; Gianquinto, G. Optimal red: Blue ratio in led lighting for nutraceutical indoor horticulture. Sci. Hortic. 2015, 193, 202–208. [Google Scholar] [CrossRef]
  10. Kozai, T.; Niu, G. Plant Factory as a Resource-Efficient Closed Plant Production System. In Plant Factory: An Indoor Vertical Farming System for Efficient Quality Food Production; Kozai, T., Niu, G., Takagaki, M., Eds.; Academic Press: Cambridge, MA, USA, 2015; pp. 69–90. [Google Scholar]
  11. Gasperi, D.; Pennisi, G.; Rizzati, N.; Magrefi, F.; Bazzocchi, G.; Mezzacapo, U.; Centrone Stefani, M.; Sanyé-Mengual, E.; Orsini, F.; Gianquinto, G. Towards regenerated and productive vacant areas through urban horticulture: Lessons from Bologna, Italy. Sustainability 2016, 8, 1347. [Google Scholar] [CrossRef]
  12. Pennisi, G.; Blasioli, S.; Cellini, A.; Maia, L.; Crepaldi, A.; Braschi, I.; Spinelli, F.; Nicola, S.; Fernandez, J.A.; Stanghellini, C.; et al. Unraveling the role of red: Blue LED lights on resource use efficiency and nutritional properties of indoor grown sweet basil. Front. Plant Sci. 2019, 10, 305. [Google Scholar] [CrossRef]
  13. Kalantari, F.; Tahir, O.M.; Joni, R.A.; Fatemi, E. Opportunities and challenges in sustainability of vertical farming: A review. J. Landscape Ecol. 2018, 11, 35–60. [Google Scholar] [CrossRef]
  14. Gómez, C.; Izzo, L.G. Increasing efficiency of crop production with LEDs. AIMS Agric. Food 2018, 3, 135–153. [Google Scholar] [CrossRef]
  15. Massa, G.D.; Kim, H.H.; Wheeler, R.M.; Mitchell, C.A. Plant productivity in response to LED lighting. HortScience 2008, 43, 1951–1956. [Google Scholar] [CrossRef]
  16. Craig, D.S.; Runkle, E.S. A moderate to high red to far-red light ratio from light-emitting diodes controls flowering of short-day plants. J. Am. Soc. Hortic. Sci. 2013, 138, 167–172. [Google Scholar] [CrossRef]
  17. Yeh, N.; Chung, J.P. High-brightness LEDs—Energy efficient lighting sources and their potential in indoor plant cultivation. Renew. Sustain. Energy Rev. 2009, 13, 2175–2180. [Google Scholar] [CrossRef]
  18. Olle, M.; Viršile, A. The effects of light-emitting diode lighting on greenhouse plant growth and quality. Agric. Food Sci. 2013, 22, 223–234. [Google Scholar] [CrossRef]
  19. Johkan, M.; Shoji, K.; Goto, F.; Hashida, S.N.; Yoshihara, T. Blue light-emitting diode light irradiation of seedlings improves seedling quality and growth after transplanting in red leaf lettuce. HortScience 2010, 45, 1809–1814. [Google Scholar] [CrossRef]
  20. Son, K.H.; Oh, M.M. Leaf shape, growth, and antioxidant phenolic compounds of two lettuce cultivars grown under various combinations of blue and red light-emitting diodes. HortScience 2013, 48, 988–995. [Google Scholar] [CrossRef]
  21. Kuno, Y.; Shimizu, H.; Nakashima, H.; Miyasaka, J.; Ohdoi, K. Effects of irradiation patterns and light quality of red and blue light-emitting diodes on growth of leaf lettuce (Lactuca sativa L. “Greenwave”). Environ. Control Biol. 2017, 55, 129–135. [Google Scholar] [CrossRef]
  22. Bliznikas, Z.; Þukauskas, A.; Samuoliene, G.; Virðile, A.; Brazaityte, A.; Jankauskiene, J.; Duchovskis, P.; Novièkovas, A. Effect of supple-mentary pre-harvest LED lighting on the antioxidant and nutritional prop-erties of green vegetables. Acta Hortic. 2012, 939, 85–91. [Google Scholar] [CrossRef]
  23. Lee, S.G.; Choi, C.S.; Lee, J.G.; Jang, Y.A.; Lee, H.J.; Lee, H.J.; Chae, W.B.; Um, Y.C. Influence of air temperature on yield and phytochemical content of red chicory and garland chrysanthemum grown in plant factory. Hortic. Environ. Biotechnol. 2013, 54, 399–404. [Google Scholar] [CrossRef]
  24. Ohashi-Kaneko, K.; Ogawa, E.; Ono, E.; Watanabe, H. Growth and essential oil content of perilla, rocket and coriander plants grown under different light quality environments. J. Sci. High Technol. 2013, 25, 132–141. [Google Scholar] [CrossRef]
  25. Taulavuori, K.; Pyysalo, A.; Taulavuori, E.; Julkunen-Tiitto, R. Responses of phenolic acid and flavonoid synthesis to blue and blue-violet light depends on plant species. Environ. Exp. Bot. 2018, 150, 183–187. [Google Scholar] [CrossRef] [Green Version]
  26. Taulavuori, E.; Taulavuori, K.; Holopainen, J.K.; Julkunen-Tiitto, R.; Acar, C.; Dincer, I. Targeted use of LEDs in improvement of production efficiency through phytochemical enrichment. J. Sci. Food Agric. 2017, 97, 5059–5064. [Google Scholar] [CrossRef] [PubMed]
  27. Amoozgar, A.; Mohammadi, A.; Sabzalian, M.R. Impact of light-emitting diode irradiation on photosynthesis, phytochemical composition and mineral element content of lettuce cv. Grizzly. Photosynthetica 2017, 55, 85–95. [Google Scholar] [CrossRef]
  28. Nelson, J.A.; Bugbee, B. Economic analysis of greenhouse lighting: Light emitting diodes vs. high intensity discharge fixtures. PLoS ONE 2014, 9, e99010. [Google Scholar] [CrossRef] [PubMed]
  29. Wallace, C.; Both, A.J. Evaluating operating characteristics of light sources for horticultural applications. Acta Hortic. 2016, 1134, 435–443. [Google Scholar] [CrossRef]
  30. Park, Y.; Runkle, E.S. Spectral effects of light-emitting diodes on plant growth, visual color quality, and photosynthetic photon efficacy: White versus blue plus red radiation. PLoS ONE 2018, 13, e0202386. [Google Scholar] [CrossRef]
  31. Shiina, T.; Hosokawa, D.; Roy, P.; Nakamura, N.; Thammawong, M.; Orikasa, T. Life cycle inventory analysis of leafy vegetables grown in two types of plant factories. Acta Hortic. 2010, 919, 115–122. [Google Scholar] [CrossRef]
  32. International Organization for Standardization (ISO). ISO 14040: Life Cycle Assessment—Principles and Framework. Environ. Manag. 2006, 3, 28. [Google Scholar]
  33. International Organization for Standardization (ISO). ISO 14044: Environmental Management—Life Cycle Assessment—Requirements and Guidelines; ISO: Geneva, Switzerland, 2006. [Google Scholar]
  34. International Organization for Standardization (ISO). ISO 15686-5: Buildings and constructed Assets—Service-Life Planning—Part 5: Life-Cycle Costing; International Organization for Standardization: Geneva, Switzerland, 2008. [Google Scholar]
  35. European Commission—Joint Research Centre—Institute for Environment and Sustainability (EC-JRC). International Reference Life Cycle Data System (ILCD) Handbook: General Guide for Life Cycle Assessment—Detailed Guidance; Publications Office of the European Union: Luxembourg, 2010. [Google Scholar] [CrossRef]
  36. Nadal, A.; Llorach-Massana, P.; Cuerva, E.; López-Capel, E.; Montero, J.I.; Josa, A.; Rieradevall, J.; Royapoor, M. Building-integrated rooftop greenhouses: An energy and environmental assessment in the mediterranean context. Appl. Energy 2017, 187, 338–351. [Google Scholar] [CrossRef] [Green Version]
  37. Institute for Environment and Sustainability. Swiss Center for Life Cycle Inventories. Ecoinvent Database v3.0, 2014. [Google Scholar]
  38. European Commission, Joint Research Centre (EC-JRC). Characterisation Factors of the ILCD Recommended Life Cycle Impact Assessment Methods. Database and Supporting Information, 1st ed.; EUR 25167; Publications Office of the European Union: Luxembourg, 2012. [Google Scholar]
  39. Benini, L.; Mancini, L.; Sala, S.; Manfredi, S.; Schau, E.M.; Pant, R. Normalisation Method and Data for Environmental Footprints; European Commission, Joint Research Center, Institute for Environment and Sustainability, Publications Office of the European Union: Luxemburg, 2014; ISBN 978-92-79-40847-2. [Google Scholar]
  40. European Commission. Environmental Footprint Pilot Guidance Document—Guidance for the Implementation of the EU Product Environmental Footprint (PEF) During the Environmental Footprint (EF) Pilot Phase, v. 4.0. 2016. Available online: https://ec.europa.eu/environment/eussd/smgp/pdf/Guidance_products.pdf (accessed on 20 May 2019).
  41. PRé Consultants. SimaPro Software Version 8.3; PRé Consultants: Amersfoort, The Netherlands, 2017. [Google Scholar]
  42. Takagaki, M.; Amuka, S.; Maruo, T.; Sukprahan, S.; Shinohara, Y. Application of reaping method for harvesting leafy vegetables grown in capillary Hydroponic system. Acta Hortic. 2002, 620, 71–76. [Google Scholar] [CrossRef]
  43. Hall, M.K.D.; Jobling, J.J.; Rogers, G.S. Factors affecting growth of perennial wall rocket and annual garden rocket. Int. J. Veg. Sci. 2012, 18, 393–411. [Google Scholar] [CrossRef]
  44. Vazquez, A.; Sanchez, E.; Van Baren, C.; Frezza, D. Agronomic performance and essential oil composition of Ocimum basilicum L.: Effect of genotype and date of harvest. Adv. Hortic. Sci. 2013, 27, 166–172. [Google Scholar]
  45. Maboko, M.M.; Du Plooy, C.P. Effect of plant spacing and harvesting frequency on the yield of Swiss chard cultivars (Beta vulgaris L.) in a closed hydroponic system. Afr. J. Agric. Res. 2013, 8, 936–942. [Google Scholar] [CrossRef]
  46. Maboko, M.M.; Du Plooy, C.P. Yield response of hydroponically grown mustard spinach and non-heading Chinese cabbage to frequency of leaf harvest and flower removal. Int. J. Veg. Sci. 2019, 25, 185–195. [Google Scholar] [CrossRef]
  47. Kang, J.H.; KrishnaKumar, S.; Atulba, S.L.S.; Jeong, B.R.; Hwang, S.J. Light intensity and photoperiod influence the growth and development of hydroponically grown leaf lettuce in a closed-type plant factory system. Hortic. Environ. Biotechnol. 2013, 54, 501–509. [Google Scholar] [CrossRef]
  48. Chen, X.L.; Wang, L.C.; Li, T.; Yang, Q.C.; Guo, W.Z. Sugar accumulation and growth of lettuce exposed to different lighting modes of red and blue LED light. Sci. Rep. 2019, 9, 6926. [Google Scholar] [CrossRef] [PubMed]
  49. Hogewoning, S.W.; Trouwborst, G.; Maljaars, H.; Poorter, H.; van Ieperen, W.; Harbinson, J. Blue light dose–responses of leaf photosynthesis, morphology, and chemical composition of Cucumis sativus grown under different combinations of red and blue light. J. Exp. Bot. 2010, 61, 3107–3117. [Google Scholar] [CrossRef] [PubMed]
  50. Lin, K.H.; Huang, M.Y.; Huang, W.D.; Hsu, M.H.; Yang, Z.W.; Yang, C.M. The effects of red, blue, and white light-emitting diodes on the growth, development, and edible quality of hydroponically grown lettuce (Lactuca sativa L. var. capitata). Sci. Hortic. 2013, 150, 86–91. [Google Scholar] [CrossRef]
  51. Sanyé-Mengual, E.; Specht, K.; Grapsa, E.; Orsini, F.; Gianquinto, G. How can innovation in urban agriculture contribute to sustainability? A characterization and evaluation study in Western Europe. Sustainability 2019. under review. [Google Scholar]
  52. Goldstein, B.; Hauschild, M.; Fernández, J.; Birkved, M. Testing the environmental performance of urban agriculture as a food supply in northern climates. J. Clean. Prod. 2016, 135, 984–994. [Google Scholar] [CrossRef] [Green Version]
  53. Dorr, E.; Sanyé-Mengual, E.; Gabrielle, B.; Grard, B.J.-P.; Aubry, C. Proper selection of substrates and crops enhances the sustainability of Paris rooftop garden. Agron. Sustain. Dev. 2017, 37, 51. [Google Scholar] [CrossRef] [Green Version]
  54. Sanyé-Mengual, E.; Orsini, F.; Oliver-Solà, J.; Rieradevall, J.; Montero, J.; Gianquinto, G. Techniques and crops for efficient rooftop gardens in Bologna, Italy. Agron. Sustain. Dev. 2015, 35, 1477–1488. [Google Scholar] [CrossRef] [Green Version]
  55. Sanyé-Mengual, E.; Gasperi, D.; Michelon, N.; Orsini, F.; Ponchia, G.; Gianquinto, G. Eco-efficiency assessment and food security potential of home gardening: A case study in Padua, Italy. Sustainability 2018, 10, 2124. [Google Scholar] [CrossRef]
  56. IPCC. IPCC Climate Change Fourth Assessment Report: Climate Change 2007. 2007. Available online: http://www.ipcc.ch/ipccreports/assessments-reports.htm (accessed on 30 October 2018).
  57. WMO. Scientific Assessment of Ozone Depletion: 1998. Global Ozone Research and Monitoring Project—Report No. 44; World Meteorological Organization: Geneva, Switzerland, 1999; ISBN 92-807-1722-7. [Google Scholar]
  58. Rosenbaum, R.K.; Bachmann, T.M.; Gold, L.S.; Huijbregts, M.A.J.; Jolliet, O.; Juraske, R.; Köhler, A.; Larsen, H.F.; MacLeod, M.; Margni, M.; et al. USEtox—The UNEPSETAC toxicity model: Recommended characterisation factors for human toxicity and freshwater ecotoxicity in Life Cycle Impact Assessment. Int. J. Life Cycle Assess. 2008, 13, 532–546. [Google Scholar] [CrossRef]
  59. Rabl, A.; Spadaro, J.V. The RiskPoll software, version is 1.051. 2004. Available online: http://www.externe.info/externe_2006/tools.html (accessed on 30 October 2018).
  60. Frischknecht, R.; Braunschweig, A.; Hofstetter, P.; Suter, P. Human health damages due to ionizing radiation in life cycle impact assessment. Environ. Impact Assess. 2000, 20, 159–189. [Google Scholar] [CrossRef]
  61. Van Zelm, R.; Huijbregts, M.A.J.; Den Hollander, H.A.; Van Jaarsveld, H.A.; Sauter, F.J.; Struijs, J.; Van Wijnen, H.J.; Van de Meent, D. European characterization factors for human health damage of PM10 and ozone in life cycle impact assessment. Atmos. Environ. 2008, 42, 441–453. [Google Scholar] [CrossRef]
  62. Seppälä, J.; Posch, M.; Johansson, M.; Hettelingh, J.P. Country-dependent Characterisation Factors for Acidification and Terrestrial Eutrophication Based on Accumulated Exceedance as an Impact Category Indicator. Int. J. Life Cycle Assess. 2006, 11, 403–416. [Google Scholar] [CrossRef]
  63. Posch, M.; Seppälä, J.; Hettelingh, J.P.; Johansson, M.; Margni, M.; Jolliet, O. The role of atmospheric dispersion models and ecosystem sensitivity in the determination of characterisation factors for acidifying and eutrophying emissions in LCIA. Int. J Life Cycle Assess. 2008, 13, 477–486. [Google Scholar] [CrossRef]
  64. Struijs, J.; Beusen, A.; van Jaarsveld, H.; Huijbregts, M.A.J.; Goedkoop, M.; Heijungs, R.; Huijbregts, M.A.J.; De Schryver, A.; Struijs, J.; Van Zelm, R. ReCiPe 2008 A life cycle impact assessment method which comprises harmonised category indicators at the midpoint and the endpoint level. Report I: Characterisation factors, 1st ed.; Aquatic Eutrophication Chapter 6; Ministerie van VROM: Den Haag, The Netherlands, 2009. [Google Scholar]
  65. Milài Canals, L. LCA methodology and modeling considerations for vegetable production and consumption; Centre for Environmental Strategy, University of Surrey: Guilford, UK, 2007; ISSN 1464-8083. [Google Scholar]
  66. Frischknecht, R.; Steiner, R.; Jungbluth, N. The Ecological Scarcity Method—Eco-Factors 2006. A method for impact assessment in LCA (Methode der ökologischen Knappheit–Ökofaktoren 2006-Methode für die Wirkungsabschätzung in Ökobilanzen; Federal Office for the Environment FOEN: Bern, Switzerland, 2008. [Google Scholar]
  67. van Oers, L.; de Koning, A.; Guinee, J.B.; Huppes, G. Abiotic Resource Depletion in LCA; Road and Hydraulic Engineering Institute, Ministry of Transport and Water: Amsterdam, The Netherlands, 2002. [Google Scholar]
Figure 1. Images of the growing system used for the experiment. Plants (a) are grown on individual deep-water culture hydroponic systems where the root system (b) floats into the nutrient solution (c), contained in a plastic jar and screened from light by a black cloth (d). Constant aeration of the nutrient solution is provided by air pumps and distributed to individual growing systems through tubes (e). Each light treatment is allocated to a light-insulated compartment (f) of a climate-controlled chamber, with white-painted walls and fans allowing for air recirculation.
Sustainability 11 04063 g001
Figure 2. System boundaries of the Life Cycle Assessment (LCA) and Life Cycle Costing (LCC) analyses, detailing the life cycle stages and elements included in the assessment.
Sustainability 11 04063 g002
Figure 3. (a) Normalized and weighted environmental impacts of the different crops and LED treatments. For each crop, the least environmental impact (green) and the most environmental impact (red) LED treatments are indicated. (b) Eco-efficiency assessment of crops and LED treatments in indoor farming with reference to the production of 1 kg of fresh product.
Sustainability 11 04063 g003
Figure 4. Contribution to the environmental impacts and economic costs of lettuce production with RB0.5 treatment as example. (a) Contribution of the different elements of the life cycle inventory to the impact for lettuce production in RB0.5 treatment. (b) Contribution of the different midpoint categories to the normalized environmental impact for lettuce production in the RB0.5 treatment. Midpoint categories are climate change (CC), ozone depletion (OD), human toxicity, cancer effects (HTc), human toxicity, non-cancer effects (HTnc), particulate matter (PM), ionizing radiation (IR), photochemical ozone formation (POF), acidification (AC), terrestrial eutrophication (TEU), freshwater eutrophication (FEU), marine eutrophication (MEU), ecotoxicity (ET), land use (LU), water use (WU), resources use (RU).
Sustainability 11 04063 g004
Figure 5. Eco-efficiency assessment of the different annual production scenarios of lettuce production, by LED treatment.
Sustainability 11 04063 g005
Table 1. Date of sowing, transplanting and harvesting of lettuce, basil, rocket and chicory for the two growing cycles examined.
Growing CycleSpeciesSowingTransplantingHarvesting
1Lettuce28/02/201814/03/201828/03/2018
Basil01/02/201822/02/201812/03/2018
Rocket04/06/201818/06/201802/07/2018
Chicory25/06/201809/07/201823/07/2018
2Lettuce16/03/201830/03/201813/04/2018
Basil16/04/201807/05/201828/05/2018
Rocket10/09/201824/09/201808/10/2018
Chicory01/10/201815/10/201829/10/2018
Table 2. Life Cicle Inventory (LCI) for one Light Emitting Diodes (LED) lamp employed in the system: Materials, amount and unit.
MaterialAmountUnit
Electric wire0.1kg
Glass fiber0.0175kg
Aluminum (50% recycled)0.3034kg
Polycarbonate0.0246kg
Aluminum oxide 0.00011kg
Silicon0.00015kg
Sanitary ceramic0.00024kg
Steel0.0008kg
Polypropylene0.00025kg
Polyethylene terephthalate0.00025kg
Copper0.00041kg
Tantalum0.0003kg
Nylon0.00088kg
Road transport111.253kg km
Sea transport1743.28kg km
Table 3. Crop yield, electricity consumption and nutrient solution uptake from transplant to harvest per unit of crop and LED treatment (differentiating between the consumption from LED lights, aeration and vent pumps). Different letters indicate significant differences at p ≤ 0.05.
CropRB RatioCrop Yield (kg m−2 year−1) Electricity Consumption (kWh·kg−-1) Nutrient Solution Uptake (L kg−1)
Lettuce0.548.7d25.5a21.3a
161.6c21.9b16.9b
279.4b20.3b16.4b
3103.6a14.8d12.9c
486.4b18.1c15.4b
Basil0.532.3b48.5a29.6a
134.3b50.6a26.2b
256.1a34.0b22.7c
355.0a36.4b23.3c
453.0a39.5b25.2bc
Rocket0.534.6b47.3a55.6a
134.8b48.5a51.6a
251.6a36.5b38.3b
350.4a39.7b43.5b
454.9a35.8b38.8b
Chicory0.525.8b61.5-49.6a
127.0b63.0-47.5a
235.8a53.4-40.8b
338.8a53.8-39.4b
436.6a54.8-39.4b
Table 4. Difference of the total cost and environmental impact of annual production scenarios compared to results from the experimental data.
CropTreatmentLow NCRMedium NCRHigh NCR
TCNormTCNormTCNorm
PtPtPt
LettuceRB 0.5−6%−8%−8%−10%−10%−12%
RB 1−6%−7%−7%−9%−9%−11%
RB 2−5%−6%−7%−8%−8%−10%
RB 3−5%−6%−7%−8%−8%−10%
RB 4−5%−6%−7%−8%−8%−10%
BasilRB 0.5−7%−9%−9%−11%−11%−14%
RB 1−7%−8%−9%−11%−11%−13%
RB 2−6%−7%−8%−10%−10%−12%
RB 3−6%−7%−8%−9%−9%−11%
RB 4−6%−7%−8%−9%−9%−11%
RocketRB 0.5−5%−6%−6%−8%−8%−10%
RB 1−5%−6%−6%−8%−7%−9%
RB 2−4%−5%−5%−7%−7%−8%
RB 3−4%−5%−5%−6%−7%−8%
RB 4−4%−5%−5%−6%−7%−8%
ChicoryRB 0.5−5%−6%−6%−8%−8%−10%
RB 1−5%−6%−6%−8%−7%−9%
RB 2−4%-5%−5%−7%−7%−8%
RB 3−4%−5%−5%−6%−7%−8%
RB 4−4%−5%−5%−6%−7%−8%
Table 5. Differences between the experimental results (0.98 μmol J−1) (Figure 3a) and the efficient lamps (1.60 μmol J−1) for the least environmental impacting LED treatment, according to crop and indicator. Contribution of the different midpoint categories to the normalized environmental impact. Midpoint categories are climate change (CC), ozone depletion (OD), human toxicity, cancer effects (HTc), human toxicity, non-cancer effects (HTnc), particulate matter (PM), ionizing radiation (IR), photochemical ozone formation (POF), acidification (AC), terrestrial eutrophication (TEU), freshwater eutrophication (FEU), marine eutrophication (MEU), ecotoxicity (ET), land use (LU), water use (WU), resources use (RU).
IndicatorUnitsLettuceBasilRocketChicory
RB 3RB 2RB 4RB 4
CCkg CO2 eq−12%−12%−13%−13%
ODkg CFC-11 eq−12%−12%−13%−13%
HTcCTUh−11%−11%−11%−11%
HTncCTUh−12%−11%−12%−12%
PMkg PM2.5 eq−12%−11%−12%−12%
IRkBq U235 eq−13%−12%−13%−13%
POFkg NMVOC eq−12%−12%−13%−13%
ACmolc H+ eq−12%−12%−13%−13%
TEUmolc N eq−12%−12%−13%−13%
FEUkg P eq−12%−12%−13%−13%
MEUkg N eq−12%−12%−13%−13%
ETCTUe−12%−11%−12%−12%
LUkg C deficit−11%−11%−12%−12%
WUm3 water eq−13%−12%−13%−13%
RUkg Sb eq−6%−6%−6%−6%
NormalizedPt−11%−11%−12%−12%
TC−9%−9%−10%−10%

