The Reverse Supply Chain of the E-Waste Management Processes in a Circular Economy Framework: Evidence from Italy


1
Engineering Ingegneria Informatica SPA, Energy & Utility Division, Centro Direzionale Milanofiori, Palazzo D3, 20090 Assago (MI), Italy
2
Department of Engineering (DI), University of Naples Parthenope, Centro Direzionale di Napoli, Isola C4, 80143 Naples, Italy
3
Department of Industrial Engineering, University of Naples Federico II, 80, Piazzale Tecchio, 80125 Naples, Italy
*
Author to whom correspondence should be addressed.
Sustainability 2019, 11(8), 2430; https://doi.org/10.3390/su11082430
Submission received: 15 January 2019
/
Revised: 14 April 2019
/
Accepted: 16 April 2019
/
Published: 24 April 2019
(This article belongs to the Section Economic and Business Aspects of Sustainability)
Abstract
:In the last several decades, Waste Electrical and Electronic Equipment (WEEE) reverse supply chain management has increasingly gained more attention due to the development of an environmental awareness, the rapid raise of e-wasted products and the EU regulations. In particular, although the new EU WEEE collection target has not been reached by many EU countries, several studies show that an optimized WEEE wastes management processes could represent a relevant way to achieve economic, environmental and social benefits expected by the adoption of circular economy approaches. According to this, the paper aims to evaluate the extent to which the current Italian organization of the WEEE management system and the related legislation are able to support the achievement of the targets defined by EU with a specific focus on the collection centers (CCs) which play a key role being the initial point of the WEEE reverse logistic cycle. An illustrative analysis based on the transition probability matrix regarding both the e-waste collecting performance and the distribution of collecting centers in the Italian provinces is illustrated. Furthermore, we have analyzed the presence of a correlation between the WEEE collection rate and the presence of the CCs in different provinces in order to better comprehend the role that can play both the investments in CC system and other soft measures in achieving the WEEE collection targets. Results show that the current Italian organization of the WEEE management system and the related legislations are not so effective in supporting the achievement of EU WEEE collection targets at the national level, although some geographical areas and provinces outperform the EU targets.
1. Introduction
In the last two decades, an increasing environmental awareness has strongly influenced the relationship between production-consumption of products, environment protection and sustainability. Based on the diffusion of green management approaches, great attention was paid by producers to the environmental consequences of production processes as well as waste prevention, recycling, reuse and minimization of final disposal of end-of-life products. By providing products and services able to reduce their environmental impact, manufacturers discovered further opportunities for strengthening their competitive advantage according to the circular economy (CE) approaches [1,2,3]. CE is considered as a new business model able to support a more sustainable development by retaining, as much possible, products, resources, energy and materials. This could be achieved by reusing, refurbishing, remanufacturing and recycling products, materials and waste [4].
Specifically, several studies show that optimized waste management processes could represent a relevant way to achieve economic, environmental and social benefits expected by the adoption of CE approaches. In fact, the diffusion of the processes of recycling and reuse of end-of-life products, supported by specific government’s regulations, has generated new economic markets and new entrepreneurial activities that are growing in many developed and developing countries [5].
In such a context, the Reverse logistic processes of collection, recycling and reuse of Waste of Electronic and Electrical Equipment (WEEE or e-waste) plays a critical role [6] for different reasons. Firstly, WEEE is one of the fastest growing streams of waste in the world with the highest growth rate per year (3–5%). In fact, while in 2016 about 45 million tons of e-waste were generated globally (6.1 Kg per capita or Kgpc) [7], it will achieve about 52.2 million tons in 2021 (6.8 Kgpc) [8,9]. The increase of e-waste is strongly fueled by the growing Electronic and Electrical Equipment (EEE) market demand which has in 2016 resulted in a 2.9% increase in the millions of tons of EEE put on the market [10].
Secondly, within e-wastes, there are different critical, valuable and hazardous substances which requires specific recycling processes and practices in order to avoid both environmental and health problems [11,12]. Thirdly, the recycling and the recovery of the e-waste represents an opportunity to reduce greenhouse gas emissions and environmental impact [13]. Furthermore, as a large quantity of precious and special metals are in WEEEs, their recovery represents a relevant economic opportunity as it allows for saving scarce and expensive resources necessary for the production of EEE itself and other devices [14,15]. The economic convenience deriving from the reuse of materials embedded into e-wastes is indicated nowadays as one of the most important sustainability challenges able to ensure the development of the proper CE approaches [6,16].
Accordingly, the European Union (EU) have issued regulations, policies and actions to deal with the post-consumption phase of such EEEs. Despite the great efforts made, the collection of e-waste is very limited (after 10 years, the volume of WEEE collected in the period 2010–2016 is about 40% of EEE put on market) and is highly unbalanced across EU Member States (the WEEE collection rate per capita ranges from 1.6 kg in Romania to 16.5 kg in Sweden) [10]. Moreover, the more recent EU directives (2012/19/EU) has increased the collection target, thus enlarging the unbalances among different European countries. At the same time, the WEEEs that are treated coherently with the EU regulations (and then recycled and reused) are about the 90% of the WEEE collected. This data highlights that the collection system represents a critical element of the WEEE management system and in particular of the WEEE reverse logistic system. Moreover, the collection centers (CCs) represent a key element of the WEEE management system as a whole, being the initial point of the reverse logistic cycle. Its efficiency and effectiveness have a strong impact on all the performance of the WEEE management system and on the CE perspective that the EU intends to pursue [17]. Moreover, WEEE collection plays an important role since it has a large effect on the actual recovery of critical raw materials (CRMs) [18]. For this reason, the European Commission individuates the increase of the collection centers as one out of four main activities to put in place the infrastructure needed [19] and to improve the efficiency of the WEEE management system according to a CE perspective.
Therefore, within the context of the EU policy, the objective of this work is to evaluate the extent to which the Italian WEEE collection system is able to support the achievement of the collection targets with a specific focus on the provincial level. Since Italian reality is characterized by the existence of well-known strong territorial socio-economic differences, we expect that this could be reflected in the WEEE collection system organization. Such an analysis is necessary in order to grasp the specific strengthens and weaknesses at province-specific level in order to support the decision-makers about the more effective customized measures to be adopted (e.g., hard measures, such as investments in collection infrastructures soft measures such as initiatives having an impact on citizen behaviors) to improve the collection performance.
In this view, although there are some studies on the Italian WEEE collection system, they explore different aspects and adopt different levels of analysis (e.g., [6,17,20]). However, no research specifically evaluates the effectiveness of the current management of the WEEE collection process at the provincial level. In this view, the paper adopts the transition probability matrix method that is novel for e-waste analysis being adopted to analyze municipal separate wastes [21]. The capillarity of a data analysis at the provincial level on the collection of the WEEE provides both a substantial internal homogeneity and the possibility of effectively interpreting the deviations and the heterogeneity of the data limiting the influences of the territorial and demographic dimension.
Based on these premises, a descriptive data analysis, the paper aims to evaluate the extent to which the current Italian organization of the WEEE collection system is able to support the achievement of the targets defined for the e-waste collection by European and Italian authorities with a specific focus on the role played by the CCs. In particular, this study aims to verify the presence of territorial divide about the WEEE collection performance, the correlation between collection performance and the presence of CCs, and the impact of external events on the trends of the collection results. Our analysis focuses both on the amount of WEEE collected and on the infrastructure represented by the distribution of CCs in the 110 Italian provinces (NUTS-3). In this view, we use data provided by the national clearing house “CdCRAEE” about e-waste collection and CC system for the period 2008–2017.
Following this introduction, the paper is structured as follows. Section 2 outlines the theoretical framework, while Section 3 describes the European and national regulations about the management of e-waste. Section 4 presents the methodological approach. An overview of the results is shown in Section 5, Section 6 and Section 7. Section 8 focuses on the discussion of the results, while Section 9 presents conclusion, limitations and implications.
2. The Theoretical Background
The circular economy concept is increasingly gaining great relevance in academic research and on the agenda of policy-makers [5]. The main aim of the CE framework is to create a regenerative system able to ensure optimal reuse, renovation, remanufacturing and recycling of products, materials and waste by handling them in closed loops [5,22]. Such restorative economic system should be intentionally developed and designed [22] through the adoption of strategies that close and narrow resource loops [23].
From the CE perspective, the reverse supply chain and the reverse logistic can be considered necessary approaches to “close the loops” of end-of-life (EOL) products. In literature, several definitions of Reverse Logistics exist (Table 1), which, although emphasizing different aspects, all highlight the importance of the recovery and reuse processes of EOL products and/or their disposal. In other words, the scholars aim to underline the environmental sustainability view of reverse logistics.
According to [24], a strong relationship between RL and CE exists. The relationship between CE and RL can be seen from their general purpose, their main focus, and some characteristics. In particular, both of the approaches aim to: (i) support a more sustainable socio-economic development, (ii) focus on environmental, economic and ecological aspects and on the proper management of used product, waste and EOL, and so on (e.g., [25]), and (iii) have several similar characteristics, such as the repair, refurbishing, recycling and disposal cycles (e.g., [25]). Nevertheless, some of the CE principles (e.g., leakage minimization) are considerably broader than the RL activities [24].
As shown in Table 1, some definitions of RL include also manufacturing activities in the Reverse Logistics definitions, such as recycling or recovery of EOL products [26,27]. Notwithstanding, scholars claim that, when there are also manufacturing activities, it is more appropriate to adopt a Reverse Supply Chain (RSC) framework [32,33].
The RSC definition considered in this work is the efficient and effective management of a series of necessary activities to recuperate a product from the consumer to dispose of it or recover the residual value [34]. A RSC is composed of five activities, namely Collection or acquisitions; Reverse logistics; Inspection and arrangement; Reconditioning; Distribution and sale [34].
The collection is, therefore, a critical activity for the whole WEEE management cycle being: (a) the initial phase which effectiveness influences the performance of the remaining phases, and (b) the WEEE collected represents only the 40% of EEE put on the market in the period 2010–2016 in EU after 10 years of regulations. Moreover, among the various EOL products identified in RSC research, WEEE is considered as one of most appropriate [35], especially if we consider that the growth of the EEE market segment is one of the fastest [36].
According to this, an extensive literature about the WEEE management exists that focuses on several different aspects. It is important to underline that WEEE collection phase is very critical for the effectiveness and efficacy of the whole WEEE management process [6] and, if properly managed, it can lead to improvements in the quantity and the quality of collected waste [37,38].
Within the literature on the topic, some authors analyze the contribute of different socio-economic and technical variables on the collection performance at a regional level [6], or compared the technical efficiency of dynamic logistic models with traditional ones in a local context [17]. Biganzoli et al. [20] evaluated the environmental performance of the overall WEEE collection system associated with e-waste management in a specific Italian region, while Favot et al. [39] studied if EPR fees on WEEE stimulate proactive behaviour and impact on the e-waste collection performance in Italy. Other authors compared the overall waste management performance and the adoption of proper practices between developed and developing European countries [40]. Many scholars proposed quantitative models for the optimization of e-waste CCs, e.g., [41,42,43] or new costing methodologies to support decision making processes [44]. Another important result in literature is that the increasing of the number of collection centers corresponds to a positive variation in the waste collection performance [45,46,47]. This result is confirmed also by [48]; in particular, they show that the highest scores in term of WEEE collection performance is achieved in those municipalities which set the collection centers. On the contrary, Bouvier and Wagner [49] found that the WEEE collection performance are not affecting by driving distance and, thus, number of CCs. As a consequence, it is important to note that empirical findings about the effect of techno-organisational variables (e.g., presence of CCs) are not always consistent [6]. Waste collection has been analyzed for the stream of municipal waste in Italy, highlighting that legislative measures have both improved the national results and increased the gap among different areas [21].
However, to our knowledge, few papers specifically evaluated: (a) the impact of the European and national regulatory system on the achievement of e-waste collection targets; (b) the organizational structure and the territorial distribution of the WEEE collection system. To contribute to shedding light on this aspect, a first step is to provide a synthesis of specific aspects of the EU regulatory system that are illustrated in the next section.
3. The EU and National Law Basics of E-Waste Management
In the last few years, the European Union has issued various Directives aimed at supporting a correct and effective treatment and disposal of e-waste. The Directive 2002/96/EC aimed to promote the recycling, recovery and reuse of WEEE in order to reduce its disposal in landfills. To this aim, the main elements introduced by the 2002 Directive are: (a) the adoption of the Extended Producer Responsibility (EPR) principle, which is imposed on the producers to finance the WEEE collection activities; and (b) the adoption of the one-to-one principle which allows for consumers to deliver for free their WEEE if they buy an equivalent EEE. Moreover, such Directive defines a rate of WEEE collection equal to four Kgpc per year by 2008. In 2012, the EU Directive 2012/19/EU modified the collection thresholds and introduced a more severe target such that any State has to collect at least 45% (about 8 kgpc) of the total weight of the WEEE defined as a percentage of average weight of the EEE placed on the market (POM) from 2016, and 65% (about 12 kgpc) from 2019 (alternatively 85% of WEEE which has been generated). Finally, in 2017, the European Commission issued the Circular Economy Package [19], which gives further rise to the development of a reverse supply chain from consumers to producers where EPR plays a critical role in accomplishing the defined quantitative targets.
In Italy, the EU Directive 2002/96 was implemented through the Legislative Decree 2005/151 and the Ministerial Decree 185/2007 that regulated the management of WEEE by promoting the recycle, reuse and recovery and by restricting the use of certain hazardous substances contained in EEE.
Specifically, the first decree regulated the management of WEEE collection system and adopted the Clearing House Model as its own national system. The second decree focuses, instead, on the actors of the WEEE collection system. The Clearing House is a national system, whereas the end product manufacturers are grouped in organizations named Collective systems which are responsible for the entire WEEE management cycle. These actors cooperate with various operators (collectors, logistic operators, recyclers, waste management organizations, etc.) to provide WEEE management services. The government supervises the various Collective systems by means of the Coordination center (CdCRaee) which operates as a clearing house among the Collective systems to which they have to adhere. The Coordination center realizes the supervision of the entire system.
Finally, the legislative Decree 2005/151 has introduced efficiency awards for the Municipal CCs when they are able to reach a certain collection performance.
In 2014, Italy has issued the Legislative Decree 2014/49, drawn on the Directive 2012/19/EU, that (a) adopts the new and higher collection target since 2016; (b) establishes appropriate measures and procedures to prevent the WEEE generation; and (c) promotes reuse, recycling and other forms of WEEE recovery also by introducing efficiency bonuses.
To conclude, it is worth underlining that, in 2012, the Italian WEEE management system also has to be influenced by another legislative and technological event represented by the digital switchover which caused a strong and rapid increase of the WEEE (TV sets, screens and monitors) in the CCs.
4. Methodological Approach
Following the Agovino et al. [21] approach, we proceed in three steps. First, we analyze the transition probabilities of Italian provinces among three different e-waste collection states. Second, we investigate the state of the e-waste collection points in the Italian provinces. To perform these analyses, the probability transition matrix methodology was adopted. Thirdly, we have analysed the presence of a correlation between the WEEE collection rate and the dynamics of the CCs in different areas and provinces in order to better comprehend the role that can play both the investments in the CC system and other soft measures (e.g.,: communication, information and education campaigns)in achieving the WEEE collection targets.
In particular, the transition matrix is a methodology to measure the probability of moving an element from initial state (at time t) to a new state at time t + 1. Ina transition probability matrix (P), the generic term is defined as , where as aij represents the number of elements moving from an initial i state to a final j state (Table 2).The rows and columns of the matrix describe, respectively, the initial state and the final state, while the terms on the main diagonal represent the steady state, namely the probability of an element to remain in the same condition during a given unit of time. Furthermore, it is possible to recognize an “absorbing state” which occurs, in general, whenever the probability that an element exits at t + 1 from that state is zero. In other words, when one of the diagonal transition probabilities of the matrix is unity.
The elements of matrix P are probability that they are subject to the following axioms of probability:
The data about WEEE’s management system have been extracted from the records of the Italian Coordination center [50] which is the institution set by WEEE Legislative Decree 151/05 (art. 13) for “the optimization of the activities of competence of the collective systems, to guarantee common, homogeneous and uniform operating conditions”.
In particular, we used data about kg of WEEE collected and about the CCs related to the 110 Italian provinces, corresponding to the European level NUTS-3 over the period 2009–2017. Level NUTS-3 represents a more widespread WEEE collection data, having substantial internal homogeneity and the possibility to interpret the data deviations caused by limiting the influences of the territorial and demographic dimension.
Data about the provinces population in the 2008–2017 period were extracted by ISTAT (Italian National Institute of Statistics) [51] records.
5. The Field Analysis: WEEE Collection Targets
5.1. WEEE Collection State
The WEEE collected in Europe is measured through the kg of WEEE pro capite (kgpc) which is the index adopted by the European Union as the target of the collection efficacy. The target was 4 kgpc per year until 2015 (Directive 2002/96/EU, art. 5). Then, the new Directive (2012/19/EU) has introduced stricter measures that correspond to a target of about8kgpcfrom 2016 and about 10 kgpc from 2019.
As described in Section 4, to set up the probability transition matrix, we have defined three states based on the value of the kgpc of WEEE collected: low (LWC), medium (MWC) and high (HWC). Considered that the HWC state contains several provinces, it was further divided into three secondary states: H1WC, H2WC and H3WC (Table 3).
5.2. Descriptive Results
Table 4 reports the percentage of Italian provinces according to the first three defined states (LWC, MWC, HWC) of WEEE collection statistics by macro areas for the period 2008–2017. The HWC state (mainly related to Northern provinces) ranges from 5.1 to 12.1 kg.
From a general point of view, we can observe that ten years after the introduction of the WEEE regulation system, 70% of provinces shows a relevant collection performance being in the HWC state (kgpc ≥ 4). Only 17.3% and 10.9% of these provinces are respectively in Southern and Central Italy. Consistently, the percentage of provinces in LMC and MWC states at the end of the period is low and mainly concentrated in the South and Central area. Moreover, Northern provinces progressively moved both from LWC (2008 = 28.2; 2017 = 0) and MWC (2008 = 13.6; 2017 = 0.9) states state (2008 = 0.9; 2017 = 41.8).
It is worth highlighting the huge growth in the HWC state in the first four years of the period (2008–2011), whereas North, Central and South provinces increase respectively of41.8, 13.6, and 9.1. In particular, by observing the trend of the HWC state, it is worth highlighting the presence of two different dynamics for the three territorial areas. In fact, a first increase is visible for the period 2008–2012, then, after a slight decline, a new increase is registered in the period 2014–2017. Probably the first increase is derived from the impact of the digital switchover, which involved the replacement of televisions sets and the increase of the R3 group of WEEE that includes televisions sets, screens and monitors. While the second is caused by the entry into force of LD 49/14 that receipts Directive 2012/19/EU and produced a new impetus on the collection process. In the following section, both of these regulatory effects are more deeply analyzed.
5.3. Transition Probability Matrix Results
In this section, the results deriving from the transition matrix analysis are presented.
Table 5 shows the transition probabilities for all the provinces for the years 2008–2017. At the time of introduction of the WEEE’s management system (2008), as expected, the probability of a province being in LWC state was very high (80%). At the end of the period (2017), such probability dropped to 13.6%, while the probability of a province to evolve into the MWC state was pretty high (20.5%), as for moving to HWC (H1WC + H2WC + H3WC = 63.6%).
The MWC state was quite stable. The probability to remain in an MCW state is low (4.8%), while it is very high for evolving in the HWC states (in particular, 42.9% in H1WC, 38.1% in H2WC and 9.5% in H3WC). Thus, we can say that provinces that have overcome the initial obstacles in organizing the WEEE collection system have reached relevant performance.
Looking at the initial HWC state, as expected, the probability of being in this state is almost null (0.9%), while the probability to move in the higher states (69.1%) is very high in the period considered. In particular, only one province evolved from H1WC (4.2 kgpc) toH2WC (6.2 kgpc) state after ten years. As well as the probability to remain in the HWC state being 1 (100%), thus this can be considered the sole absorbing state for the period under analysis, even if limited by the presence of only one province.
Carrying out a more detailed analysis (Table 5), we have identified three groups of provinces on the basis of the best and worst WEEE collection performance. Table 6 reports the three groups according to the number of positions gained or lost in the states of the probability transition matrix. The first two groups are the groups of provinces that have collected more than 8kgpc and gained more positions. In particular, the best performing provinces group contains six provinces which have gained 5 positions starting conditional on being in the LWC state. This group includes two Southern provinces (Nuoro an Isernia, this last in 2017 was the best WEEE collector with 14.57 kgpc) and four Northern provinces (among these was Bologna, which collected 12.1 kgpc in 2017 with a growth of 35% compared to 2016). These provinces are referred to as the “most virtuous” ones and considered that their collection performance is more than three times the 4 kgpc EU target.
The second-best performing provinces group is that of the second highest provinces, which improved their state of 4 positions conditional on being in the MWC state. This group includes only two provinces, Sassari (Southern Italy) and Trento (Northern Italy), which in 2017 collected more than 8 kgpc. They are indicated as “virtuous”.
The last group includes the worst performing provinces of the class. In 2008, these provinces were in the LWC and after ten years still remain in the same last position. Eleven provinces belong to this group, which are almost all located in Southern Italy. They are labeled as “structurally blocked” because of their consolidated inability to progress in the WEEE collection.
The data in Table 6 highlights the important feature of the transition matrix method which provides the possibility of having information on the dynamics of any specific province in order to identify customized initiatives and policy actions to improve the efficiency of the WEEE collection system.
The next step in the analysis of the transition matrices was addressed to shed light on the reasons of two different dynamics for the three areas in the periods 2008–2012 and 2013–2017. As mentioned in the descriptive results (Section 5.2.), an interpretation of these trends was the impact of two legislative events occurred in the period 2012–2014 on the performance of the WEEE collection system. Table 7 shows the transition matrices for the two sub-periods considered (2008–2012; 2013–2017) the first event is the digital switchover occurred in 2012, which, by law, decreed the technological obsolescence and the replacement of a large part of the installed base of televisions sets. The second event is the entry into force of the Legislative Decree 49/2014 which followed the introduction of the EU directive 2012/19/EU, thus providing a potential impulse to the e-waste collection.
The transition probability matrix highlights that the first period is featured by a higher mobility probability since the principal diagonal probabilities are lower when compared with the second period (Table 7). Moreover, when we consider the mean of the sum of probabilities which are over the principal diagonal (which represents the improvement trend), we can see that this mean is slightly higher for the first period (20.1%) than for the second period (15.2%). Furthermore, the probability of moving to the MWC a final time was moderately higher (34.1% vs. 31.3%) for the first period. Similarly, the probability of moving to the HWC a final time, conditional on being in the LWC at initial time, was very relevant for the first period (51.1% vs. 6.3%). Focusing on the MWC state, we can observe that the probability of moving to the HWC a final time, was appreciably higher for the first period (95.2% vs. 51.4%), while the probability of moving back to the LWC a final time, conditional on being in the MWC at the initial time was higher for the second period (+8.6%). Thus, we can conclude that the legislative/technological event represented by the digital switchover has provoked a higher positive impact on the 2008–2012 period when compared with the effect of the legislative event represented by the introduction of the LD 49/2014 on the period 2013–2017.
6. The Field Analysis: WEEE Collection Center Analysis
6.1. Definition of the Collection Centers
The collection centers are key components of WEEE’s management system. The effectiveness of the CC system (the amount of WEEE collected per inhabitant per CC) depends on several factors, among which we can mainly indicate the distribution of the CCs in an area, the relative number of inhabitants and the management of the single CC. In this section, we adopt the transaction matrix methodology to analyze the dynamics of the contribution of the CCs of the Italian provinces at the WEEE collection process. In particular, we consider the number of CCs per 50,000 inhabitants for the Italian provinces in order to take into account the dimension of the province’s population. In this way, we intend to analyze the role played by the appropriateness of the structure (in terms of number of CCs per province and their distribution) of the collecting system.
The model of Transaction matrix studied adopts three states: Low (LPC), Medium (MPC) and High (LPC) Presence of CCs. These three states correspond at three different levels of CCs per 50,000 inhabitants that have been calculated by means the standard deviation (2.7) of the distribution of the CCs across the Italian provinces. Table 8 summarizes the three states used in the analysis.
6.2. Descriptive Results
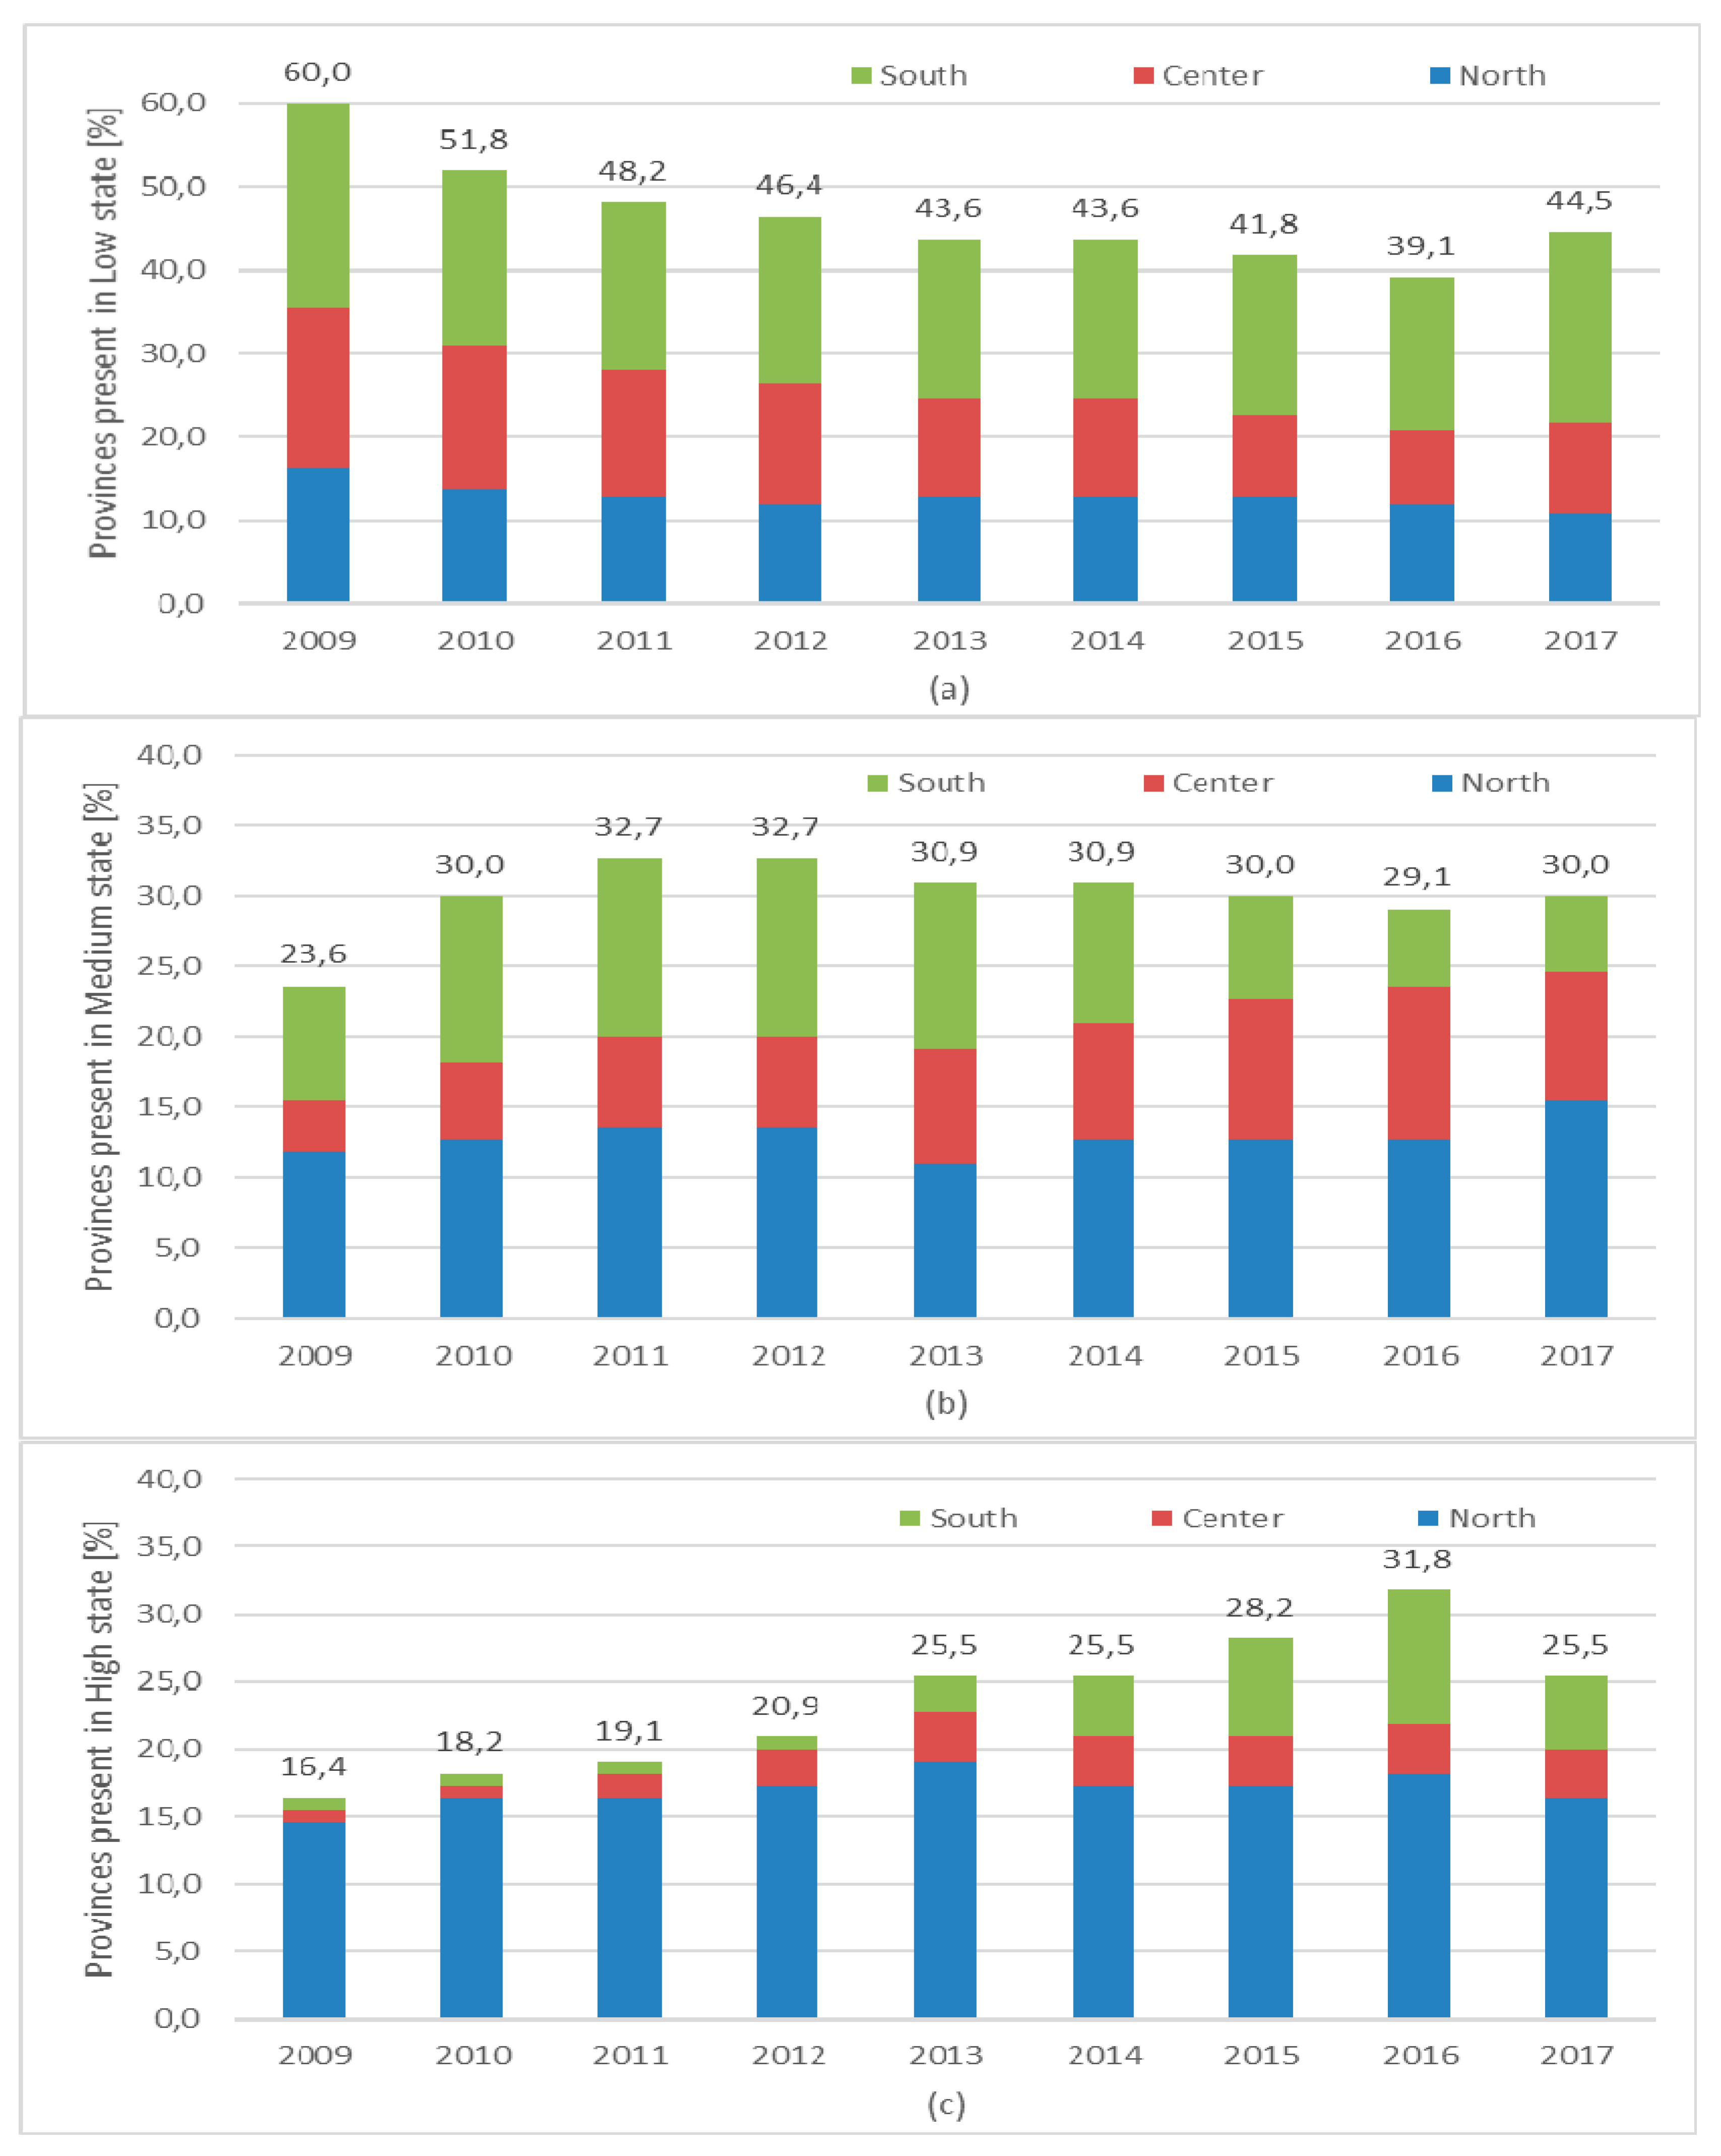
The presence of WEEE CCs on the Italian territory is at the same time dynamic and inhomogeneous as can be seen in Figure 1. In fact, in the nine years since the introduction of the WEEE management system, while the number of provinces in the MPC (Figure 1b) and HPC (Figure 1c) states increased (respectively +27% and +56%) and the percentage of those in LPC (Figure 1a) diminished (−26%), the percentage of Southern Italy provinces positioned in the LPC state increased from 40% to more than 50%. The trends for the North and Central areas are completely different. As for the MPC, while the percentage of CCs increased at a national level (+27%) those of Southern Italy decreased 33%. At the same time, the HPC state registered a relevant overall increase (+56%) in the period that was almost entirely due to the increase of Central (from 1 to 4 provinces) and Southern Italy (from 1 to 6 provinces). Nevertheless, at the end of the period, the share of the three areas considered in HPC state was still uneven (North: 64%; Central: 14%; South: 21%). This territorial distribution of the CCs seems to correspond in some way to the uneven picture of the WEEE system collecting performance in the three areas that we have previously observed.
6.3. Transition Probability Matrix Results
In this section, the results deriving from the transition matrix analysis are presented. In particular, we aim to study the behavior of the Italian provinces in setting up an appropriate infrastructural system to support the WEEE management system. In general terms, a high probability of permanence emerges in the same state in the period. In fact, data shows (Table 9) that provinces in a steady state condition are 75 (46, 14 and 15 in LWC, MWC and HWC states, respectively) which account for 68% of the total. Only 25% have registered an improvement of state. The higher steady state condition is related to HWC (83.3% of probability to remain in this state) while, for LWC, it is almost 70%. These figures highlight the probable presence of difficulties in carrying out structural investments for the opening of new CCs.
7. Correlation between WEEE Collection Performance and Collection Center Distribution
In order to verify the existence of a relationship between WEEE collection and CC distribution national, we have analyzed the correlation between the quantity (kg) of e-waste collected and the number of WEEE’s CCs for the period 2009–2017 for the Italian provinces.
The analysis confirms that a correlation exists being the average correlation coefficient equal to 0.67. Moreover, analyzing the time series of the distribution of the correlation coefficient by territorial areas, it emerges that it decreases for all of the areas (North: −9.5%, Central: −6.3%; South: −8.7%.). Thus, we can suppose that, even though the weight of the role of the collecting infrastructure is becoming less crucial, it still remains a critical aspect of the Italian WEEE management system, which requires further analysis.
Table 10 is a representation at a glance of the comparison of the two dimensions considered: positive, negative or null variation (+, −, =) of WEEE collection performance and CCs. The matrix considers each year of the period 2009–2017 and the cells represent the number of times in which the provinces have registered a positive (+), negative (−) and null (=) variation. For example, the cell “++” shows the times the provinces have incremented both WEEE’s collection and CCs (37.6% for all the Italian provinces). This matrix permits acquiring useful information to compare the behavior of provinces by territorial area in the considered period. In particular, we can distinguish both the presence/absence of the correlation and to obtain information of the trends of specific areas and provinces (this last aspect is not considered in this paper).
From the analysis about the two dimensions considered, we can draw three different areas featured by different relationships between the two dimensions considered:
- AREA 1-Groups (++) and (−−). These groups have a positive even though opposite relation. The Group (++) is the highest (37.6%). The Group (−−) which represents a contemporary reduction of the two dimensions is the lowest (6.9%). Both of these results are in line with the high correlation coefficient mentioned above. We can guess that the first group have carried out structural investments; meanwhile, the second have reduced the number of CCs. The Southern provinces are the most represented in the Group (++) (14.5%)
- AREA 2-Groups (+−) and (+=). The provinces in these groups (9.9% + 17.4%) are not in line with the correlation hypothesis. They have showed an increase in the WEEE collection together with a reduced or stable number of CCs. These results are probably due to the investment in the promotion (information and education campaigns, media awareness initiatives, etc.) or to the improvement of e-waste management processes since the CC investments were made previously. The Northern provinces are the most represented (total 15.7%)
- AREA 3-Groups (−=) and (−+). These groups show a worsening of the collection result even though have increased or unchanged the number of CCs, Thus, they are not coherent with the correlation hypothesis. They both represent the 28.2% of the total and denote an area of ineffectiveness since investment in CCs do not result in collection improvements. We can guess that different problems affect the WEEE management system for these provinces. The Northern provinces show the higher presence (11.3%) even though Southern provinces are the highest in the group (−+), which is the most effective.
A further deepening of the correlation about WEEE’s collection and CCs in Italian provinces is realized by observing the CC transition matrix behavior of those provinces that have obtained the best and worst performances in the transition matrix of the WEEE collection (Table 6). In this view, Table 11 shows a comparison between the three groups of provinces as definite previously.
Furthermore, the related population is indicated with the aim to acquire information about the influence of the size of the provinces on the correlation.
In “Best performing provinces” group, it is possible to find those provinces (4 out of 6) that have invested and increased the number of CCs (+1). These provinces are also the less populated of the group. The two more populated best performing provinces show a stable condition in terms of CCs. Thus, while the localization and the population do not seem to matter, it seems to confirm the presence of correlation between the two dimensions.
The “second-best performing provinces” group, improved their state (+1) in the CC transition matrix. Both are intermediate in terms of population when compared with those of the best performing group. The correlation between WEEE collection and CCs seems to matter.
The “worst performing provinces” group is featured by two elements: (a) it is made up almost entirely of provinces that remain in LPC state (less than 2.7 centers every 50,000 inhabitants) except the province of Foggia, which is also the more populated of the group; (b) all the provinces are in Southern Italy, except one. In this view, we can say that, for this group, the correlation is strongly confirmed and that the localization does matter. Nevertheless, different sizes of population are present in this group, it does not seem to matter.
8. Discussion of the Results
This study is focused on the collection activity of the reverse supply chain of the WEEE since it represents a critical phase impacting the overall performance [6,41,42,52].
(1) A first result of this research has underlined that a territorial divide exists in Italy about the e-waste collection rate. In fact, even though the 70% of provinces have moved in the HWC, almost ¾ of these provinces are localized in Northern Italy. Furthermore, even though the provinces in the LWC and MWC states have decreased over ten years, those that still remain in these states are mainly Southern and Central of Italy provinces. This divide is also confirmed by the fact that almost all the provinces of the worst (“structurally blocked”) group are located in Southern Italy. It is interesting to underline that such territorial divide could depend on the existence of a socio-economic gap among Southern and Northern provinces. This finding confirms the results of other authors [6] about the Italian territorial divide even though this study shows more detailed evidences at provincial level. On the contrary, the results about the best performers are not confirmed since only one province of this study is consistent with the best performing regions found by [6].
Similarly, the divide is confirmed with regard to the Collection Centers. After 10 years, in a context of a general shift towards medium and high states, Southern provinces are more than half of those in the LPC state, although they remarkably decrease in MPC. Even though some positive elements emerge (more southern presence in higher state), the territorial distribution is still uneven. This result is coherent with other research that aims to optimize the distribution of the CCs in the territorial areas [41,42]. Moreover, the results concerning the presence of a territorial divide in the Italian WEEE collection are also consistent with those of other contributions, even if for a different stream of waste. In fact, Agovino M. et al. [21] highlights that the legislative measures on a separate municipal waste collection in Italy in the period 1999–2011, while increasing collection rates at the national level, do not reduce the gap among provinces of different areas.
Moreover, the transition probability matrix analysis provides an explanation of this divide since it shows the presence of a remarkable steady state condition which mirrors the difficulty to carry out structural investments aimed to increase the CCs. It is possible to claim that this is particularly true for those provinces that, at the beginning of the introduction of a new EU WEEE management system, halfway through the 2000–2010 decade, did not already have a WEEE collection infrastructure.
(2) As for the impact of external legislative events on the WEEE collection performance, a second result emerged from the transition probability matrix analysis. In fact, the matrix shows that the increase of provinces in the HWC state happened in two different periods due to two diverse external events caused by legislative changes (the digital switchover and the entry into force of LD 49/2014). These events shocked the system provoking a rapid positive reaction. This result is consistent with the contribution of [21].
Moreover, we have verified that the first event caused a higher mobility probability toward the best states than the second one. The sole absorbing state for the entire period 2008–2017 was related to the HWC state and worked mainly during the first sub-period under consideration.
(3) A third result highlights the presence of a correlation between the WEEE collection and the CC distribution among provinces. This finding appears to be in line with several research works despite being in different territorial contexts and with diverse methodologies (e.g., [6,45,46,47,48]). The correlation value is high for the entire period for all the Italian provinces. Deepening the analysis by groups of provinces, it emerges that Southern provinces have the higher share among those that have invested in the CCs. By exploiting this positive correlation, these virtuous provinces have also raised the collection results. Specifically, according to the empirical results, Isernia, Nuoro and Sassari could represent an important model of the WEEE collection system to imitate. Indeed, in a few years, these Italian provinces of Southern of Italy were able to outperform the WEEE collection target defined by EU. By focusing on each province, we can try to understand the factors that strongly affect their WEEE collection performance in order to consider them in the definition of future measures and initiatives for different Italian provinces. Specifically, it is possible to underline that the main factors are: (i) a wider diffusion of CCs at the provincial level; and (ii) the organization of several events to sensitize citizens to adopt virtuous behaviours.
In fact, Isernia, Nuoro and Sassari in the last several years have strongly improved the network of CCs in the Southern area; specifically, in 2017, they have respectively 17, 21 and 12 CCs for 100,000 inhabitants. This data is very important if we consider that, on average, there are 5 CCs for 100,000 habitants in the Southern of Italy. Additionally, in the considered provinces, several events, initiatives and information campaign were organized in the last few years.
At the same time, more than 1/4 of other Italian provinces (namely Area 2, Group +− and Group +=) were able to improve their collection performance without increasing the number of CCs, but probably by adopting soft information/communication measures affecting the citizens behaviors or by improving the management and effectiveness of the previously established WEEE management system. Moreover, provinces of the different areas are among those not able to improve the WEEE collection, even though they have increased the CCs number (area 3 – Group −+). Thus, they denote management problems (e.g., inefficiencies, decision making faults, etc.). We have also underlined that, in the meantime, the group of best performing provinces comprehend provinces from the three territorial areas, and the worst performing group of collectors is almost entirely made up of provinces in Southern of Italy also showing the worst CCs infrastructure.
9. Conclusions
This paper has shed light on the extent to which the current Italian e-waste collection system has been able to achieve the targets defined by European and Italian authorities. The research, which has a basic descriptive nature, has focused on the role played by the collection centers by analyzing both the performance of the provincial collection system and the infrastructure represented by the provincial distribution of CCs in Italy in the period 2008–2017. In particular, the work has aimed to verify the presence of territorial divide about the WEEE collection at the provincial level and the presence of the correlation between collection performance and distribution of CCs. Three main results emerged from the adoption of the transition probability matrix methodology, which is novel for the WEEE waste stream.
The first result is that a territorial divide exists in Italy between different areas of the country about the e-waste collection rate and the e-waste Collection Centers infrastructure. Nevertheless, some Southern provinces show positive WEEE collection performance so that it is possible to claim that viable solutions can be found by adopting appropriate local policy measures (actions, investments, initiatives, etc.) which could be replicated by other lagging provinces. A second result is the existence of a positive relationship between the WEEE collection and the distribution of CCs among Italian provinces which, in turn, contributes to feeding the territorial divide. Moreover, we have found that external legislative events have had impact in different periods of time on the Collection results of the WEEE management system.
The transition probability matrix has resulted in being an effective methodology able to recognize specific province behaviors for both the WEEE collection performance and the CC distribution. Additionally, more absorbing states of different intensity emerged in the analysis. These absorbing states are more intense for the CC distribution than for the WEEE collection coherently with the higher constraints characterizing the investments in CC infrastructure. A summary of main findings is shown in Table 12.
Therefore, based on the results, it is possible to claim that the organization of the Italian WEEE collection system could play a very critical role if accompanied by awareness-raising initiatives. It is important to underline that findings prove that the WEEE collection management is a critical step of the overall WEEE management processes according to the circular economy approach [6,53]. Moreover, results show that national and European regulations have a strong impact on WEEE collection performance as we observed a higher mobility probability in the first period than the second one.
Finally, both the territorial divide and the presence of the correlation are confirmed. Indeed, those provinces (often located in the Southern of Italy) that did not possess a WEEE collection system prior to the introduction of the EU management system, and have not carried out early investments in setting up an appropriate infrastructure, have faced relevant problems and impediments to improve the collection performance and to support the WEEE national system. On the contrary, provinces with an initial collection system and ability to realize early investments, improved their position and benefited from the presence of absorbing states operating there.
This paper suffers from some limitations. About the field results, the first limit regards the country specific context analyzed. In this view, a confirmation of the correlation between WEEE collection results and CC diffusion requires further country-based research. Indeed, this research can be carried out easily considering that the transition probability matrix methodology can be adopted straightforwardly for different countries, thus favoring comparisons. A second limit regards the fact that it is focused on the collection part of the WEEE management system, without considering other processes (e.g., WEEE treatments) of the WEEE reverse supply chain.
Implications
Lights and shadows emerge from this study. Results highlight that the WEEE management system in Italy has improved since its introduction in 2004. Nevertheless, Southern and Central Italian provinces have to improve their WEEE collection performance and collection centers infrastructure. In fact, as expected, the national reality is very heterogeneous both at regional and macro-regional levels.
Drawing on the discussed results, some implications can be derived. First of all, policy-makers could exploit this analysis to identify properly the Italian provinces where there appears to be more effective investments in reinforcement of the WEEE collection infrastructures. At the same time, we have seen that, in other provinces, the adoption of the so-called soft measure (e.g., communication, information, educational campaigns to affect the citizens behaviors with regards to the e-waste management) can be more effective. In other words, our results can be adopted to support the development of effective policies and measures able to improve the Italian WEEE collection performance and the WEEE management system as a whole.
Furthermore, this research could provide insights and guidelines about the definition of customized province-oriented policies to support the achievement of a balanced e-waste collection performance at national level, which play a key role in the feeding of the WEEE management system. The customization of measures and initiatives deriving from these policies can result in a robust practical applicability being tailored on the specific features of the local territorial systems. At the same time, we can claim that the results and the transition probability matrix method can be adopted in different studies to analyze other country contexts, thus allowing European and international comparison among different geographical areas with similar and/or different patterns of WEEE collection performance and CC infrastructure. This is particularly true in the context of the EU regulation framework, whereas the practical applicability of the transition matrixes is also guaranteed by the manageable availability of the data set feeding the methodology adopted. In the context of the EU regulation framework, the practical applicability is also guaranteed by the manageable availability of the data feeding the methodology adopted. This in turn can support the effectiveness of the reverse supply chain of the WEEE management system and putting into practice the Circular Economy perspective.
Author Contributions
Conceptualization, R.P. and I.Q.; methodology, R.I.; validation, R.I., I.Q., and R.P.; formal analysis, R.I.; data curation, R.I. and I.Q.; writing—original draft preparation, R.I., I.Q., and R.P.; writing—review and editing, R.I., R.P., I.Q., and A.T.; supervision, R.P.
Funding
This research received no external funding.
Conflicts of Interest
The authors declare no conflict of interest.
References
- Genovese, A.; Morris, J.; Piccolo, C.; Koh, S.L. Assessing redundancies in environmental performance measures for supply chains. J. Clean. Prod. 2017, 167, 1290–1302. [Google Scholar] [CrossRef] [Green Version]
- Lacy, P.; Rutqvist, J. Waste to Wealth: The Circular Economy Advantag; Palgrave Macmillan: Basingstoke, UK, 2016. [Google Scholar]
- Tukker, A. Product services for a resource-efficient and circular economy–a review. J. Clean. Prod. 2015, 97, 76–91. [Google Scholar] [CrossRef]
- Lieder, M.; Rashid, A. Towards circular economy implementation: A comprehensive review in context of manufacturing industry. J. Clean. Prod. 2016, 115, 36–51. [Google Scholar] [CrossRef]
- Ghisellini, P.; Cialani, C.; Ulgiati, S. A review on circular economy: The expected transition to a balanced interplay of environmental and economic systems. J. Clean. Prod. 2016, 114, 11–32. [Google Scholar] [CrossRef]
- Favot, M.; Grassetti, L. E-waste collection in Italy: Results from an exploratory analysis. Waste Manag. 2017, 67, 222–231. [Google Scholar] [CrossRef] [PubMed]
- Baldé, C.P.; Kuehr, R.; Blumenthal, K.; Fondeur Gill, S.; Kern, M.; Micheli, P.; Magpantay, E.; Huisman, J. E-Waste Statistics: Guidelines on Classifications, Reporting and Indicators; United Nations University: Tokyo, Japan, 2015; p. 52. [Google Scholar]
- Afroz, R.; Masud, M.M.; Akhtar, R.; Duasa, J.B. Survey and analysis of public knowledge, awareness and willingness to pay in Kuala Lumpur, Malaysia—a case study on household WEEE management. J. Clean. Prod. 2013, 52, 185–193. [Google Scholar] [CrossRef]
- Cucchiella, F.; D’Adamo, I.; Lenny Koh, S.C.; Rosa, P. Recycling of WEEEs: An economic assessment of present and future e-waste streams. Renew. Sustain. Energy Rev. 2015, 51, 263–272. [Google Scholar] [CrossRef] [Green Version]
- Eurostat. Waste Statistics; Eurostat: Brussels, Belgium, 2019. [Google Scholar]
- Tsydenova, O.; Bengtsson, M. Chemical hazards associated with treatment of waste electrical and electronic equipment. Waste Manag. 2011, 31, 45–58. [Google Scholar] [CrossRef]
- Oguchi, M.; Sakanakura, H.; Terazono, A. Toxic metals in WEEE: Characterization and substance flow analysis in waste treatment processes. Sci. Total Environ. 2012, 463–464, 1124–1132. [Google Scholar] [CrossRef]
- Menikpura, S.N.M.; Santo, A.; Hotta, Y. Assessing the climate co-benefits from Waste Electrical and Electronic Equipment (WEEE) recycling in Japan. J. Clean. Prod. 2014, 74, 183–190. [Google Scholar] [CrossRef]
- Chancerel, P.; Meskers, C.E.M.; Hagelüken, C.; Rotter, V.S. Assessment of Precious Metal Flows During Preprocessing of Waste Electrical and Electronic Equipment. J. Ind. Ecol. 2009, 13, 791–810. [Google Scholar] [CrossRef] [Green Version]
- Ramoni, M.; Zhang, H.-C. End-of-life (EOL) issues and options for electric vehicle batteries. Clean Technol. Environ. Policy 2013, 15, 881–891. [Google Scholar] [CrossRef]
- Qu, Y.; Zhu, Q.; Sarkis, J.; Geng, Y.; Zhong, Y. A review of developing an e-wastes collection system in Dalian, China. J. Clean. Prod. 2013, 52, 176–184. [Google Scholar] [CrossRef]
- Elia, V.; Gnoni, M.; Tornese, F. Improving logistic efficiency of WEEE collection through dynamic scheduling using simulation modeling. Waste Manag. 2018, 72, 78–86. [Google Scholar] [CrossRef] [PubMed]
- Collectors. Critical Raw Materials in Our Everyday Life. Available online: https://www.collectors2020.eu/events/critical-raw-materials-in-our-everyday-life/ (accessed on 18 December 2018).
- European Commission. Report from the Commission to the European Parliament and the Council on the New WEEE Directive; European Commission: Brussels, Belgium, 2017. [Google Scholar]
- Biganzoli, L.; Falbo, A.; Forte, F.; Grosso, M.; Rigamonti, L. Mass balance and life cycle assessment of the waste electrical and electronic equipment management system implemented in Lombardia Region (Italy). Sci. Total Environ. 2015, 524–525, 361–375. [Google Scholar] [CrossRef]
- Agovino, M.; Garofalo, A.; Mariani, A. Effects of environmental regulation on separate waste collection dynamics: Empirical evidence from Italy. J. Clean. Prod. 2016, 124, 30–40. [Google Scholar] [CrossRef]
- Geissdoerfer, M.; Savaget, P.; Bocken, N.M.P.; Hultink, E.J. The Circular Economy—A new sustainability paradigm? J. Clean. Prod. 2017, 143, 757–768. [Google Scholar] [CrossRef]
- Bocken, N.M.P.; de Pauw, I.; Bakker, C.; van der Grinten, B. Product design and business model strategies for a circular economy. J. Ind. Prod. Eng. 2016, 33, 308–320. [Google Scholar] [CrossRef]
- Ripanti, E.F.; Tjahjono, B.; Fan, I.S. Circular economy in reverse logistics: Relationships and potential applications in product remanufacturing. In Proceedings of the 21st LRN Annual Conference, Derby, UK, 9–11 September 2015. [Google Scholar]
- MacArthur, E. Towards the Circular Economy 1: Economic and Business Rationale for an Accelerated Transition; Ellen MacArthur Foundation: Cowes, UK, 2013. [Google Scholar]
- Stock, J.R.; Council of Logistics Management (U.S.). Reverse logistics: White Paper; Council of Logistics Management: Oak Brook, IL, USA, 1992. [Google Scholar]
- Carter, C.R.; Ellram, L.M. Reverse Logistics: A Review of the Literature and Framework for Future Investigation. J. Bus. Logist. 1998, 19, 85–102. [Google Scholar]
- Rogers, D.S.; Tibben-Lembke, R.S. Going Backwards: Reverse Logistics Trends and Practices; Reverse Logistics Executive Council: Pittsburgh, PA, USA, 1999. [Google Scholar]
- Fleischmann, M. Quantitative Models for Reverse Logistics; Springer: Berlin, Germany, 2000. [Google Scholar]
- de Brito, M.P.; Dekker, R. A Framework for Reverse Logistics; Springer: Berlin/Heidelberg, Germany, 2004; pp. 3–27. [Google Scholar] [CrossRef]
- Ayvaz, B.; Bolat, B.; Aydin, N. Stochastic reverse logistics network design for waste of electrical and electronic equipment. Resour. Conserv. Recycl. 2015, 104, 391–404. [Google Scholar] [CrossRef]
- He, Y. Acquisition pricing and remanufacturing decisions in a closed-loop supply chain. Int. J. Prod. Econ. 2015, 163, 48–60. [Google Scholar] [CrossRef]
- Aliberti, G.; Passaro, R. Reverse supply chain e sostenibilità nel ciclo di gestione dei Raee. Logist. Manag. 2015, 48–54. Available online: https://www.researchgate.net/publication/300260349_Reverse_supply_chain_e_sostenibilita_nel_ciclo_di_gestione_dei_Raee (accessed on 18 April 2019).
- Prahinski, C.; Kocabasoglu, C. Empirical research opportunities in reverse supply chains. Omega 2006, 34, 519–532. [Google Scholar] [CrossRef]
- Islam, M.T.; Huda, N. Reverse logistics and closed-loop supply chain of Waste Electrical and Electronic Equipment (WEEE)/E-waste: A comprehensive literature review. Resour. Conserv. Recycl. 2018, 137, 48–75. [Google Scholar] [CrossRef]
- Cui, J.R.; Forssberg, E. Mechanical recycling of waste electric and electronic equipment: A review. J. Hazard. Mater. 2003, 99, 243–263. [Google Scholar] [CrossRef]
- Gallardo, A.; Carlos, M.; Peris, M.; Colomer, F.J. Methodology to design a municipal solid waste pre-collection system. A case study. Waste Manag. 2015, 36, 1–11. [Google Scholar] [CrossRef] [PubMed]
- Vicente, P.; Reis, E. Factors influencing households’ participation in recycling. Waste Manag. Res. 2008, 26, 140–146. [Google Scholar] [CrossRef] [PubMed]
- Favot, M.; Veit, R.; Massarutto, A. The ratio of EPR compliance fees on sales revenues of electrical and electronic equipment in Italy. A circular economy perspective. Resour. Conserv. Recycl. 2018, 135, 34–37. [Google Scholar] [CrossRef]
- Ibanescu, D.; Cailean Gavrilescu, D.; Teodosiu, C.; Fiore, S. Assessment of the waste electrical and electronic equipment management systems profile and sustainability in developed and developing European Union countries. Waste Manag. 2018, 73, 39–53. [Google Scholar] [CrossRef]
- de Oliveira, J.A.P.; Doll, C.N.H.; Kurniawan, T.A.; Geng, Y.; Kapshe, M.; Huisingh, D. Promoting win win situations in climate change mitigation, local environmental quality and development in Asian cities through co-benefits. J. Clean. Prod. 2013, 58, 1–6. [Google Scholar] [CrossRef]
- Guerra, L.; Murino, T.; Romano, E. Reverse Logistics for Electrical and Electronic Equipment: A modular simulation model. In Proceedings of the 8th Wseas International Conference on System Science and Simulation in Engineering (Icossse ’09), Genova, Italy, 17–19 October 2009; pp. 307–312. [Google Scholar]
- Carvalho, J.; Ribeiro, S.; Pereira, J.; Oliveira, J.; Telhada, J.; Dias, L.; Figueiredo, M. Spatio-Temporal conceptual model for a WEEE GIS application. In Proceedings of the METMAV-International Workshop on Spatio-Temporal Modelling, Santiago de Compostela, Spain, 30 June–2 July 2010. [Google Scholar]
- Tsai, W.H.; Hung, S.J. Treatment and recycling system optimisation with activity-based costing in WEEE reverse logistics management: An environmental supply chain perspective. Int. J. Prod. Res. 2009, 47, 5391–5420. [Google Scholar] [CrossRef]
- Gonzalez-Torre, P.L.; Adenso-Diaz, B. Influence of distance on the motivation and frequency of household recycling. Waste Manag. 2005, 25, 15–23. [Google Scholar] [CrossRef] [PubMed]
- Hage, O.; Soderholm, P. An econometric analysis of regional differences in household waste collection: The case of plastic packaging waste in Sweden. Waste Manag. 2008, 28, 1720–1731. [Google Scholar] [CrossRef]
- Zen, I.S.; Noor, Z.Z.; Yusuf, R.O. The profiles of household solid waste recyclers and non-recyclers in Kuala Lumpur, Malaysia. Habitat Int. 2014, 42, 83–89. [Google Scholar] [CrossRef]
- Corsini, F.; Rizzi, F.; Frey, M. Extended producer responsibility: The impact of organizational dimensions on WEEE collection from households. Waste Manag. 2017, 59, 23–29. [Google Scholar] [CrossRef] [PubMed]
- Bouvier, R.; Wagner, T. The influence of collection facility attributes on household collection rates of electronic waste: The case of televisions and computer monitors. Resour. Conserv. Recycl. 2011, 55, 1051–1059. [Google Scholar] [CrossRef]
- Centro di Coordinamento RAEE. Annual Report of WEEE Collection in Italy. Available online: https://www.cdcraee.it (accessed on 1 September 2018).
- ISTAT. Popolazione al 1° Gennaio; ISTAT: Rome, Italy, 2008–2018. [Google Scholar]
- Ene, S.; Ozturk, N. Open loop reverse supply chain network design. Procedia Soc. Behav. Sci. 2014, 109, 1110–1115. [Google Scholar] [CrossRef]
- Rotter, V.S.; Chanceler, P.; Schill, W.P. Practicalities of individual producer responsibility under the WEEE directive: Experiences in Germany. Waste Manag. Res. 2011, 29, 931–944. [Google Scholar] [CrossRef]
Figure 1.
Distribution of WEEE Collection Centers by state and area (2009–2017) (%). Note: we can look the distribution of WEEE Collecting Centers in Italian area for the period in the exam where (a) reports the percentage of provinces in low state; (b) reports the percentage of provinces in medium state and (c) reports the percentage of provinces in high state.


Table 1.
Some principal definitions of Reverse Logistics present in literature.
| Authors | Definition of Reverse Logistics |
|---|---|
| [26] | «… The term often used to refer the role of logistics in recycling, waste disposal and management of harzadous materials, a broader perspective includes all relating to logistics activities carried out in source reduction, recycling, substitution, reuse of materials and disposal.» |
| [27] | «…The process whereby companies can become environmentally efficient through recycling, reusing, and reducing the amount of materials used.» |
| [28] | «The process of planning, implementing, and controlling the efficient, cost-effective flow of raw materials, in-process inventory, finished goods, and related information from the point of consumption to the point of origin for the purpose of recapturing value or proper disposal.» |
| [29] | «… Reverse Logistics is the process of planning, implementing, and controlling the efficient, effective inbound flow and storage of secondary goods and related information opposite to the traditional supply chain direction for the purpose of recovering value or proper disposal.» |
| [30] | «The process of planning, implementing and controlling backward flow of row materials, in process inventory, packaging and finished goods, from a manufacturing, distribution or use point of proper disposal.» |
| [31] | «As an aspect of sustainable supply chain management (SSCM), Reverse Logistics can be regarded as a business strategy in which recovery activities are imposed for the purpose of increasing sustainability» |
Table 2.
Transition probability matrix.
| (t + 1) | … | … | Total (a) | ||||
|---|---|---|---|---|---|---|---|
| t | |||||||
| … | … | ||||||
| … | … | … | … | … | … | … | |
| … | … | ||||||
| … | … | … | … | … | … | … | |
| … | … | ||||||
| Total (b) | … | … | |||||
Table 3.
Summary of state about WEEE performance.
| State. | Range of WEEE kgpc |
|---|---|
| LWC | 0–2 |
| MWC | 2–4 |
| HWC | >4 |
| -H1WC | 4–6 |
| -H2WC | 6–8 |
| -H3WC | ≥8 |
Table 4.
WEEE statistics by collection states, macro-area and years (2008–2017): % of provinces.
| Years | |||||||||||
|---|---|---|---|---|---|---|---|---|---|---|---|
| 2008 | 2009 | 2010 | 2011 | 2012 | 2013 | 2014 | 2015 | 2016 | 2017 | ||
| LWC (%) | North | 28.2 | 1.8 | 0 | 0 | 0 | 0 | 0 | 0 | 0 | 0 |
| Central | 20.0 | 5.5 | 2.7 | 2.7 | 2.7 | 0.9 | 1.8 | 1.8 | 0.9 | 0.9 | |
| South | 31.8 | 23.6 | 13.6 | 10.9 | 9.1 | 13.6 | 16.4 | 14.5 | 10.0 | 11.8 | |
| Italy | 80.0 | 30.9 | 16.4 | 13.6 | 11.8 | 14.5 | 18.2 | 16.4 | 10.9 | 12.7 | |
| MWC (%) | North | 13.6 | 13.6 | 1.8 | 0 | 5.5 | 8.2 | 4.5 | 1.8 | 1.8 | 0.9 |
| Central | 3.6 | 10.9 | 10.0 | 7.3 | 5.5 | 10.0 | 10.9 | 7.3 | 5.5 | 5.5 | |
| South | 1.8 | 6.4 | 12.7 | 13.6 | 17.3 | 13.6 | 10.9 | 10.9 | 12.7 | 10.9 | |
| Italy | 19.1 | 30.9 | 24.5 | 20.9 | 28.2 | 31.8 | 26.4 | 20.0 | 20.0 | 17.3 | |
| HWC (%) | North | 0.9 | 27.3 | 40.9 | 42.7 | 37.3 | 34.5 | 38.2 | 40.9 | 40.9 | 41.8 |
| Central | 0 | 7.3 | 10.9 | 13.6 | 15.5 | 12.7 | 10.9 | 14.5 | 17.3 | 17.3 | |
| South | 0 | 3.6 | 7.3 | 9.1 | 7.3 | 6.4 | 6.4 | 8.2 | 10.9 | 10.9 | |
| Italy | 0.9 | 38.2 | 59.1 | 65.5 | 60.0 | 53.6 | 55.5 | 63.6 | 69.1 | 70.0 | |
Table 5.
Collection Centers: transition probabilities matrix of Italian provinces, 2008–2017.
| 2008–2017 | LWC | MWC | H1WC | H2WC | H3WC | Total (a) |
|---|---|---|---|---|---|---|
| LWC | 14 (15.9%) * | 18 (20.5%) | 35 (39.8%) | 15 (17%) | 6 (6.8%) | 88 (80%) |
| MWC | 1 (4.8%) ** | 1 (4.8%) | 9 (42.9%) | 8 (38.1%) | 2 (9.5%) | 21 (19.1%) |
| HWC | 0 (0%) | 0 (0%) | 0 (0%) | 1 (100%) | 0 (0%) | 1 (0.9%) |
| Total (b) | 15 (13.6%) | 19 (17.3%) | 44 (40%) | 24 (21.8%) | 8 (7.3%) | 110 (100%) |
Note: integer indicates the number of provinces that passed from i state to j state, while % indicates the transition probability, which is measured by the ratio between the number of new provinces that passed from i state to j state and the total number of provinces in the i state. (a)=Probabilities of provinces being in a state at the beginning of the period (2009); (b)=Probabilities of provinces being in a state at the end of the period (2017). * Includes three Sardinia provinces reorganized in 2017. In 2016, Carbonia-Iglesias, Medio Campidano and Ogliastra were, respectively, in H1WC, MWC and H2WC. ** Olbia-Tempio province (Sardinia) reorganized in 2017, in 2016 was in H3WC state.
Table 6.
Group of best and worst performing provinces.
| Group | Description | States Gained | Province (Area) | |
|---|---|---|---|---|
| Best performing provinces (6) | Collection rate > 8 kgpc and moved from LWC state to H3WC state. (More than virtuous provinces) | 5 | Aosta (N) | Gorizia (N) |
| Bologna (N) | Isernia (S) | |||
| Como (N) | Nuoro (S) | |||
| Second-best performing provinces (2) | Collection rate > 8 kgpc and moved from MWC state to H3WC state. (Virtuous provinces) | 4 | Sassari (S) | Trento (N) |
| Worst performing provinces * (11) | After ten years remained or recedes in LWC (Structurally blocked provinces) | 0 | Agrigento (S) Barletta-A-T (S) Caltanissetta (S) Cosenza (S) Crotone (S) Enna (S) | Foggia (S) Pescara (C) Siracusa (S) Taranto (S) Vibo V. (S) |
*: The three Sardinia provinces Carbonia-Iglesias, Medio Campidano and Ogliastra were in this group, but have been deleted because they were reassigned in 2017.
Table 7.
Transition matrix in Italy, 2008–2012 and 2013–2017.
| LWC | MWC | H1WC | H2WC | H3WC | Total (a) | ||
|---|---|---|---|---|---|---|---|
| 2008–2012 | LWC | 13 (14.8%) | 30 (34.1%) | 35 (39.8%) | 9 (10.2%) | 1 (1.1%) | 88 (80%) |
| MWC | 0 (0%) | 1 (4.8%) | 13 (61.9%) | 6 (28.6%) | 1 (4.8%) | 21 (19.1%) | |
| H1WC | 0 (0%) | 0 (0%) | 1 (100%) | 0 (0%) | 0 (0%) | 1 (0.9%) | |
| Total (b) | 13 (11.8%) | 31 (28.2%) | 49 (44.5%) | 15 (13.6%) | 2 (1.8%) | 110 (100%) | |
| 2013–2017 | LWC | 10 (62.5%) | 5 (31.3%) | 0 (0%) | 0 (0%) | 1 (6.3%) | 16 (14.5%) |
| MWC | 3 (8.6%) | 14 (40%) | 17 (48.6%) | 1 (2.9%) | 0 (0%) | 35 (31.8%) | |
| H1WC | 1 (2.1%) | 0 (0%) | 27 (57.4%) | 16 (34%) | 3 (6.4%) | 47 (42.7%) | |
| H2WC | 0 (0%) | 0 (0%) | 0 (0%) | 7 (77.8%) | 2 (22.2%) | 9 (8.2%) | |
| H3WC | 1 (33.3%) | 0 (0%) | 0 (0%) | 0 (0%) | 2 (66.7%) | 3 (2.7%) | |
| Total (b) | 14 (12.7%) | 19 (17.3%) | 44 (40%) | 20 (18.2%) | 13 (11.8%) | 110 | |
Note: integer indicates the number of provinces that passed from i state to j state, while % indicates the transition probability, which is measured by the ratio between the number of new provinces that passed from i state to j state and the total number of provinces in the i state. (a) Provinces present in state at the beginning of the period, (b) Provinces present in state at the end of the period.
Table 8.
Number of collection centers per 50,000 inhabitants.
| State | WEEE CC |
|---|---|
| LPC | 0–2.7 |
| MPC | 2.7–5.4 |
| HPC | ≥5.4 |
Table 9.
WEEE Collection Centers: transition probabilities matrix of Italian provinces, 2009–2017.
| 2009–2017 | LWC | MWC | HWC | Total (a) |
|---|---|---|---|---|
| LWC | 46 (69.7%) ** | 17 (25.8%) | 3 (4.5%) | 66 (60%) |
| MWC | 2 (7.7%) * | 14 (53.8%) | 10 (38.5%) | 26 (23.6%) |
| HWC | 1 (5.6%) * | 2 (11.1%) | 15 (83.3%) | 18 (16.4%) |
| Total (b) | 49 (44.5%) | 33 (30%) | 28 (25.5%) | 110 (100%) |
Note: integer indicator the number of provinces that passed from i state to j state, while % indicates the transition probability, which is measured by the ratio between the number of new provinces that passed from i state to j state and the total number of provinces in the i state. (a) Provinces in a state in 2009, (b) Provinces in state in 2017. * Includes a Sardinia province reorganized in 2017. ** Includes two Sardinia provinces reorganized in 2017
Table 10.
WEEE Collection and Collection Centers by variation correlation groups.
| COLLECTION | + | Area 2 - Group (+ −) | Area 2 - Group (+ =) | Area 1 - Group (+ +) |
| Central - (1.4%) | Central - (4%) | Central - (10.5%) | ||
| North - (6.3%) | North - (9.4%) | North - (12.6%) | ||
| South - (2.3%) | South - (4%) | South - (14.5%) | ||
| Italy - (9.9%) | Italy - (17.4%) | Italy - (37.6%) | ||
| - | Area 1 - Group (−−) | Area 3 - Group (− =) | Area 3 - Group (− +) | |
| Central - (1.5%) | Central - (2.7%) | Central - (3.6%) | ||
| North - (3.1%) | North - (5.3%) | North - (6%) | ||
| South - (2.4%) | South - (3.3%) | South - (7.2%) | ||
| Italy - (6.9%) | Italy - (11.4%) | Italy - (16.8%) | ||
| − | = | + | ||
| COLLECTION CENTERS | ||||
Table 11.
Best and worst provinces in terms of WEEE Collection Centers: Italian provinces, 2009–2017.
Table 11.
Best and worst provinces in terms of WEEE Collection Centers: Italian provinces, 2009–2017.
| Groups by WEEE Collected Transition Matrix | Province (Area) | Population in 2017 | Transition Behavior of CC State |
|---|---|---|---|
| Best performing provinces(6) | Aosta (N) | 126,883 | MPC to HPC (+1) |
| Bologna (N) | 1,009,210 | MPC to MPC (-) | |
| Como (N) | 600,190 | MPC to MPC (-) | |
| Gorizia(N) | 139,673 | LPC to MPC (+1) | |
| Isernia (S) | 85,805 | MPC to HPC (+1) | |
| Nuoro(S) | 156,096 | MPC to HPC (+1) | |
| Second-best performing provinces(2) | Sassari (S) | 333,116 | MPC to HPC (+1) |
| Trento (N) | 538,604 | HPC to HPC (+1) | |
| Worst performing provinces ** (11) | Agrigento (S) | 442,049 | LPC to LPC (-) |
| Barletta-Andria-Trani (S) | 392,546 | LPC to LPC (-) | |
| Caltanissetta (S) | 269,710 | LPC to LPC (-) | |
| Cosenza (S) | 711,739 | LPC to LPC (-) | |
| Crotone(S) | 175,566 | LPC to LPC (-) | |
| Enna (S) | 168,052 | LPC to LPC (-) | |
| Foggia (S) | 628,556 | LPC to MPC (+1) | |
| Pescara (C) | 321,309 | LPC to LPC (-) | |
| Siracusa (S) | 402,822 | LPC to LPC (-) | |
| Taranto (S) | 583,479 | LPC to LPC (-) | |
| ViboValentia (S) | 161,619 | LPC to LPC (-) |
**: The three Sardinia province s Carbonia-Iglesias, Medio Campidano and Ogliastra were in this group, but have been deleted because they were reassigned in 2017.
Table 12.
Summary of findings.
| Variable | Results |
|---|---|
| WEEE collected rate | - A territorial divide exists among different geographical area in Italy - Generally, provinces of Northern of Italy perform better than ones of Southern and Central Italy - The worst performing provinces are all in Southern Italy - In the period 2008–2012, there is a higher mobility probability than in the period 2013–2017 (probably caused by external legislative events) - In Southern Italy, there are two virtuous provinces, namely Isernia and Nuoro |
| WEEE Collection Centers | - High probability of permanence in a same state in the entire period. - The higher steady state condition is related to HWC (83.3%), followed by LWC (70%) - Difficulty to make infrastructural investments (e.g., opening of new CCs) - Higher number of CCs in Northern Italy |
| Correlation analysis between WEEE collected rate and WEEE collection Centers | - A correlation between WEEE collection and distribution of CCs exists - High number of CCs could explain different WEEE collection performance - Although the role of the CCs is becoming less crucial, it still remains a critical aspect of the Italian WEEE management system - Three different groups of provinces have been identified on the basis of the two considered dimensions (WEEE collection rate and CCs) |
© 2019 by the authors. Licensee MDPI, Basel, Switzerland. This article is an open access article distributed under the terms and conditions of the Creative Commons Attribution (CC BY) license (http://creativecommons.org/licenses/by/4.0/).
Share and Cite
MDPI and ACS Style
Isernia, R.; Passaro, R.; Quinto, I.; Thomas, A. The Reverse Supply Chain of the E-Waste Management Processes in a Circular Economy Framework: Evidence from Italy. Sustainability 2019, 11, 2430. https://doi.org/10.3390/su11082430
AMA Style
Isernia R, Passaro R, Quinto I, Thomas A. The Reverse Supply Chain of the E-Waste Management Processes in a Circular Economy Framework: Evidence from Italy. Sustainability. 2019; 11(8):2430. https://doi.org/10.3390/su11082430
Chicago/Turabian StyleIsernia, Raffaele, Renato Passaro, Ivana Quinto, and Antonio Thomas. 2019. "The Reverse Supply Chain of the E-Waste Management Processes in a Circular Economy Framework: Evidence from Italy" Sustainability 11, no. 8: 2430. https://doi.org/10.3390/su11082430
Note that from the first issue of 2016, this journal uses article numbers instead of page numbers. See further details here.