Lipid-Extracted Algae as a Soil Amendment Can Increase Soil Salinization and Reduce Forage Growth


1
Texas A&M AgriLife Research, 1102 E. FM 1294, Lubbock, TX 79403, USA
2
Texas A&M AgriLife Research, 3507 U.S. 59 E., Beeville, TX 78102, USA
3
Department of Soil and Crop Sciences, Texas A&M University, 370 Olsen Blvd., 2474 TAMU, College Station, TX 77843-2474, USA
*
Author to whom correspondence should be addressed.
Sustainability 2019, 11(7), 1946; https://doi.org/10.3390/su11071946
Submission received: 5 February 2019
/
Revised: 18 March 2019
/
Accepted: 25 March 2019
/
Published: 2 April 2019
(This article belongs to the Special Issue Biofuels–Bioenergy Waste to Value Added Feedstock)
Abstract
:Algae as a biodiesel feedstock are more productive per unit area than traditional feedstock options, but currently algae production is not economical without high-value co-products. Lipid-extracted algae (LEA) may be useful as a soil amendment; however, research is needed to determine the feasibility and management strategies required. The objective was to determine salinity-associated effects of LEA as a soil amendment on a range of salt tolerant forages [foxtail millet (Setaria italica L.), pearl millet (Pennisetum glaucum L.), and a sorghum-sudangrass hybrid (Sorghum bicolor L. Moench)]. Forage seed were planted in columns containing sandy clay loam soil amended with the following: (1) control [nitrogen (N) and phosphorus (P) fertilizer added], (2) 1.5% LEA by weight, (3) 3.0% LEA, (4) 1.5% LEA + 1.5% wheat straw (WS), and (5) 1.5% WS (+N, +P). Seedling emergence and total herbage mass (HM) from sequential harvests was determined, along with forage mineral uptake. Soil pH and electrical conductivity (EC) were analyzed after the final harvest. Seedling emergence of pearl millet was negatively affected by LEA application, but not foxtail millet or sorghum-sudangrass. Pearl millet emergence was most reduced in 3.0% LEA treated soil, however, this treatment produced greater HM by the third harvest. Soil pH and EC were greater in 3.0% LEA-treated soil than the control and 1.5% WS treatment. Production of salt tolerant forages such as sorghum-sudangrass is possible in LEA-amended soil; however, with repeated applications soil salinity may reduce productivity and sustainability.
1. Introduction
Compared to traditional biodiesel feedstocks, algae offer greater productivity per unit area, and thus have received considerable interest as a sustainable biofuel feedstock [1]. As much as 100 times more biodiesel can be produced per unit area with algae than with soybean [Glycine max (L.) Merr.], and algae can be produced utilizing brackish water. However, algae production currently is not economical without high-value coproducts. If algae were cultivated and harvested in sufficient quantity to provide significant biodiesel for the U.S., then large quantities of lipid-extracted algae (LEA) would be available for use as animal feeds and soil amendments. Estimates are that 3.6 to 4.5 million metric tons of LEA would result from approximately 4 billion liters of algal-produced biofuels. Although LEA from salt-water algae is a potential source of N and other plant essential nutrients [2], there may be negative effects associated with salinity on soil productivity, plant growth and development, and ultimately a loss in crop yield. Lipid extracted algae has a high salt content because it is grown in brackish water. This research aims to explore the negative effects that may be associated with LEA application to soil, and to identify appropriate rates and time of application that will reduce salt associated effects.
In a long-term incubation study (392 d), greater organic C accumulation and stabilization and N availability were observed for LEA-treated soil compared to soil amended with wheat straw (WS) [2]. Lipid-extracted algae originating from Nannochloropsis salina contained a larger stable C fraction compared to lignin in WS, and likely originated from aliphatic macromolecules known as algaenans which are more resistant to decay than other macromolecular compounds derived from proteins, polysaccharides, and even lignin [3,4]. Potential detrimental effects of LEA applications to soil were also demonstrated, with soil pH increasing from 5.1 in untreated soil to 8.0 in LEA-treated soil (3.0% application rate on dry weight basis), which was likely due to the high concentration of basic cations (Ca2+, Mg2+, and Na+) in LEA [2]. These cations also contributed to an increase in soil salinity, with electrical conductivity (EC) being nearly 5 times greater in LEA-treated soil compared to untreated soil 14 d following LEA application.
Two major threats opposing agricultural sustainability are increasing human population and a reduction in productive available land for cultivation, with one reason being the accumulation of soluble salts [5]. Soil salinity is a major environmental factor and abiotic stress restricting plant growth and productivity, especially in arid and semi-arid climates. Salinity can negatively impact soil physical and chemical properties, resulting in soil compaction and erosion. Excess salinity negatively affects approximately 20% of irrigated arable land, and is responsible for damage to plant development, particularly at the seedling stage [6]. The deleterious effects of salinity on plant growth may be associated with plant metabolism, nutrient deficiencies, osmotic stress, specific ion toxicities, or the combination of these factors [7,8]. Once inside plant cell, salts can cause ionic stresses, largely by Na (and Cl) inhibiting major processes such as photosynthesis, protein synthesis, and energy and lipid metabolism [9].
Plants can be divided into two broad groups based on their responses to high concentrations of salt: halophytes (salinity tolerant) and glycophytes (not tolerant and eventually die). Most major crop species are classified as glycophytes but exhibit substantial genetic variation for salt tolerance. Plants with greater salt tolerance are able to exclude uptake of Na and Cl by the roots and/or avoid ion toxicity and maintain water uptake through osmotic adjustments in the presence of high salt concentrations [10,11]. For some plants, soil salinity influences growth at all developmental stages, but for many crops, sensitivity varies with growth stage. For example, sugarbeet (Beta vulgaris), safflower (Carthamus tinctorius), and soybean are especially sensitive during germination. In contrast, grain crops such as rice (Oryza sativa), wheat (Triticum spp.), corn (Zea mays), and barley [Hordeum vulgare (L.)] are relatively salt tolerant at germination and maturity, but are very sensitive during early seedling, and in some cases, vegetative growth stages.
Forage crops can range from highly sensitive to salt tolerant; wheatgrass (Agropyron elongatum) and perennial ryegrass (Lolium perenne) have greater salt tolerance than sudangrass (Sorghum sudanese) and lovegrass (Eragrostis sp.) [12]. Two widely produced food and fodder grain crops, foxtail millet (Setaria italica L.) and pearl millet (Pennisetum glaucum L.), are grown in arid and semi-arid regions where salinity can be a major concern. Pearl millet and its wild relatives are rated as fairly salinity tolerant [13], but at the germination stage have been reported to be sensitive at soil EC > 16 dS m−1 [14]. Ravikovitch and Yoles demonstrated that as soil salinity increased from 3 to 7 dS m−1, the relative yield of foxtail millet decreased sharply from approximately 95% to 40% of the control yield [15]. At EC of 9 dS m−1, yield decreased to 20% of the control. Thus, compared to pearl millet, foxtail millet would be considered much more salt sensitive. Both sorghum [Sorghum bicolor (L.) Moench] and sudangrass are considered moderately salt tolerant species, with EC thresholds of 6.8 and 2.8 dS m−1, respectively, where salinity does not reduce yield below that obtained under non-saline conditions [16,17].
The objective of this glasshouse experiment was to determine the effect of LEA application on: (a) seedling emergence of foxtail millet, pearl millet, and a sorghum-sudangrass hybrid, (b) plant development, yield, and mineral concentration and uptake, and (c) soil EC and pH.
2. Materials and Methods
2.1. Soil and Amendment Characterization
Soil used for this research was collected from the Texas A&M Agrilife Research Station near Beeville, TX, (28°27′30″, 97°42′21.78″, 75.9 m) and was mapped as Weesatche sandy clay loam soil. The average temperature and precipitation for this semi-arid environment is 21 °C and 810 mm, respectively, as reported by the U.S. Climate Data Service [18]. This site was previously planted to Kleingrass (Panicum coloratum L.) and grazed for greater than 50 years. The Weesatche soil is classified as a fine-loamy, mixed, superactive, hyperthermic Typic Argiustoll with a pH of 6.1 [19]. The soil was air-dried for approximately 28 days, thoroughly mixed, and stored until further use. The LEA source was Nannochloropsis salina, a marine microalgae cultivated in open ponds near Pecos, TX. Microalgae were harvested and dewatered by flocculation and centrifugation, and then solvent extracted, resulting in the LEA used in this study. Wheat straw (WS) was collected from local research plots near College Station, TX.
Soil, LEA, and WS were analyzed for organic C and total N by a combustion procedure [20,21,22]. Soil was analyzed for extractable P, K, Ca, Mg, S, and Na using the Mehlich III procedure [23] with analysis by inductively coupled plasma (ICP); micronutrients (Cu, Fe, Mn, and Zn) were extracted with diethylenetriaminepentaacetic acid-triethanolamine DTPA-TEA, followed by ICP analysis [24]. Lipid-extracted algae and WS mineral concentrations (Ca, Cu, Fe, K, Mg, Mn, Na, P, S, and Zn) were determined by ICP analysis of nitric acid digests [25,26]. The electrical conductivity (EC) and pH of soil, LEA, and WS were determined in a 1:2 soil or residue to water mixture using deionized water, with the actual determination made using a conductivity probe [27].
2.2. Experimental Design and Treatment Preparation
The experiment was arranged as a randomized complete block design within forage type. Sample size was 60 growth columns, including: 3 grasses, 4 treatments (and control), and 4 replications. Growth columns (33 cm length) were constructed using a PVC pipe with an inner diameter of 10 cm. Columns were split longitudinally in half and taped back together to facilitate soil sampling at the completion of the study. Bottoms of columns were capped to prevent soil loss, but drainage holes were drilled in caps to allow water drainage to prevent soil becoming anaerobic. Weights of both empty and soil filled columns were measured and recorded.
Unamended, air-dried Weesatche soil was added to the bottom 15 cm of all columns and packed to a bulk density of 0.8 g cm−3. The upper 15 cm of columns was filled with dry soil amended with one of the following on a dry weight basis: (1) control (plus N and P fertilizer), (2) 1.5% LEA, (3) 3.0% LEA, (4) 1.5% LEA + 1.5% WS, and (5) 1.5% WS plus N and P fertilizer, with LEA and WS added on a weight basis to respective treatments. Inorganic N (NH4NO3) and P [Ca(H2PO4)2·H2O] (561 kg N ha−1 and 112 kg P ha−1), LEA, and WS were added and incorporated by mixing thoroughly in dry soil. Fertilizer was added to the control and 1.5% WS treatment in order to prevent N and P limitations and possible immobilization effects. Nitrogen was applied as a split application; 280.5 kg N ha−1 were added initially and then the same amount was applied 14 days after the first forage harvest of foxtail millet and the second forage harvest of pearl millet and sorghum-sudangrass. The upper portions of columns were filled with amended soil and again packed to a bulk density of approximately 0.8 g cm−3. Deionized H2O was added to each column so that soil gravimetric water content was approximately 0.28 g g−1 which corresponded to 50% water-filled pore space; constant weight was maintained over time by water addition.
2.3. Forage Seedling Emergence, Herbage Mass, and Mineral Content
Soil-filled columns were left to incubate undisturbed in a glasshouse, except when water was added, at 32–35 °C for 14 days, at which time foxtail millet, pearl millet, and sorghum-sudangrass were planted (20, 10, and 10 seed per column, respectively) at 1 cm depth. Emergence was monitored and recorded daily for 14 days, and then plants were thinned to two plants per column. At 49 days after planting (DAP), plants were uniformly cut to 7 cm stubble height. Sorghum-sudangrass and pearl millet were again harvested at 89 and 127 DAP (harvests 2 and 3, respectively). Foxtail millet was replanted immediately after the initial cutting as this species exhibits little to no regrowth after cutting [28] and harvested again at 61 days after the second planting (harvest 2). Harvested plant material was weighed prior to and after oven-drying to constant weight at 65 °C, ground (0.5 mm) in a cyclone mill (Udy Cyclone Sample Mill 3010-030; Fort Collins, CO, USA), and then analyzed for mineral concentrations following acid digestion by the previously described methods. Plant nutrient/mineral uptake was calculated by multiplying plant concentrations by plant dry weights.
2.4. Soil Collection and Characterization after Forage Harvest
Since treatments were applied to only the top 15 cm of soil in columns, all soil to a 15 cm depth was removed after the final harvest by splitting the taped seams of columns, separating columns and removing soil. Soil samples were then oven-dried at 65 °C to constant weight, ground (<2 mm) with a flail grinder, and soil pH, EC, and extractable Ca, Mg, S, and Na were measured by the same previously described methods.
2.5. Statistical Analyses
Statistical analysis was conducted using SAS version 9.3 [29]. Effects were analyzed using a linear mixed analysis of variance (ANOVA) procedure at a significance level of p < 0.1 for seedling emergence and p < 0.05 for all other analyses. Means of significant effects were separated using Fisher’s protected least significant difference (LSD).
3. Results
3.1. Soil and Amendment Characterization
Characteristics of Weesatche sandy clay loam used in this study included particle size distribution of 61.5% sand, 28.1% clay, and 10.4% silt, pH 6.1 and EC 0.27 dS m−1 (Table 1; [2]). Organic C in Weesatche soil (25 g kg−1) and total N (1.8 g kg−1 soil) were slightly greater than for the average Texas soil, likely because the sample location was grazed pasture for more than 50 years. Weesatche soil was low in extractable P (13 mg kg−1) and Na (36 mg kg−1), but moderate to high in extractable K (358 mg kg−1), Ca (3333 mg kg−1), Mg (237 mg kg−1), S (24 mg kg−1), Fe (21 mg kg−1), Zn (4 mg kg−1), Mn (15 mg kg−1), and Cu (4 mg kg−1). Soil test ratings were based on those of the Soil, Water and Forage Testing Laboratory of the Texas A&M AgriLife Extension Service, an agency within The Texas A&M University System (College Station, TX, USA). Other than K, LEA contained greater mineral concentrations than WS. Calcium, Mg, S, and Na concentrations of LEA ranged from 9 to approximately 100 times greater than the respective concentrations of WS. The Na concentration of LEA (52,922 mg kg−1) was nearly 100 times greater than that of WS (533 mg kg−1). The quantity of these cations added to soil with the addition of LEA was of concern as it relates to salinity and sodicity and subsequent effects on plant germination, growth and development.
3.2. Forage Seedling Emergence and Herbage Mass
No treatment differences were observed for foxtail millet or sorghum-sudangrass seedling emergence, but pearl millet seedling emergence was negatively affected (p < 0.1) by LEA application (Table 2). Pearl millet seedling emergence was most reduced in soil treated with 3.0% LEA (65.0% emergence), while that for all other treatments was not statistically different from one another (82.5% to 90.0%). Foxtail millet emergence ranged from 27.5% in soil amended with 1.5% LEA + 1.5% WS to 43.8% for the 3.0% LEA treatment and was much less than sorghum-sudangrass (72.5% to 97.5%) or pearl millet emergence (65.0% to 90.0%). Also, the coefficient of variation for foxtail millet emergence (32.5%) was twice that of the other forages (average 16.2%).
No treatment differences were observed for yields from either harvest (p = 0.29 and p = 0.39, respectively) or total HM (p = 0.37) of foxtail millet (Figure 1a). Pearl millet HM from harvests 1 and 2 (p = 0.78 and p = 0.27, respectively) was not different among treatments or the control (Figure 1b). Herbage mass from harvest 3 of pearl millet in 3.0% LEA-amended soil (5.3 g), however, was greater (p = 0.01) than that of other treatments (range of 3.4 g to 4.0 g) or the control (3.2 g).
Treatment differences were observed for sorghum-sudangrass HM at harvest 2 (p = 0.02) and for total HM (p = 0.01), but not within harvest 1 (p = 0.07) or 3 (p = 0.09) (Figure 1c). At harvest 2, greater sorghum-sudangrass HM was produced with 3.0% LEA-amended soil (14.0 g) compared to the control (10.6 g) and all other treatments (9.1 g to 10.1 g) except 1.5% LEA (13.4 g). Total sorghum-sudangrass HM from 1.5% and 3.0% LEA-amended soil (25.8 g and 28.3 g, respectively) was significantly greater than the other amendment treatments (19.8 g to 20.1 g), but not the control (24.0 g), which received N and P fertilization.
3.3. Plant Mineral Concentrations and Uptake
The 3.0% LEA treatment resulted in the greatest foxtail millet Ca concentration for harvest 2 but was only significantly greater than that for 1.5% WS at the first harvest (Figure 2a). Foxtail millet Mg and Na herbage concentrations from 3.0% LEA-amended soil were greater compared to that from all other treatments for both harvests (Figure 2b,d). Plant Na concentrations were greater for all treatments receiving 1.5% LEA compared to the control and 1.5% WS for harvest 1 but not for harvest 2 (Figure 2d). The 3.0% LEA treatment resulted in the significantly greatest plant S concentration for harvest 2 but was similar to 1.5% LEA in harvest 1 (Figure 2c).
Calcium, Mg, S, and Na uptake by foxtail millet differed among treatments in harvest 1, whereas only Na uptake was different in harvest 2 (Figure 3). Calcium and S uptake were similar for the control and 1.5% and 3.0% LEA treatments and greater for the latter two than the 1.5% LEA + 1.5% WS and 1.5% WS treatments in harvest 1 (Figure 3a,c). Magnesium uptake in the first harvest and Na uptake in both harvests was greatest with 3.0% LEA (Figure 3b,d). In the first and second harvests, approximately 2.5 and 3.5 times more Na, respectively, were taken up with 3.0% compared to 1.5% LEA (Figure 3d). Even though Na uptake was greatest with 3.0% LEA for both harvests, it was slightly more than 2 times less with this treatment in the second (17.2 mg column−1) than the first harvest (36.4 mg column−1) (Figure 3d). Wheat straw applied with LEA (1.5% LEA + 1.5% WS treatment) did not reduce Na concentrations or uptake compared to the 1.5% LEA treatment at either harvest. Since no treatment differences for foxtail millet HM were observed for either harvest, uptake differences were associated primarily with concentration differences.
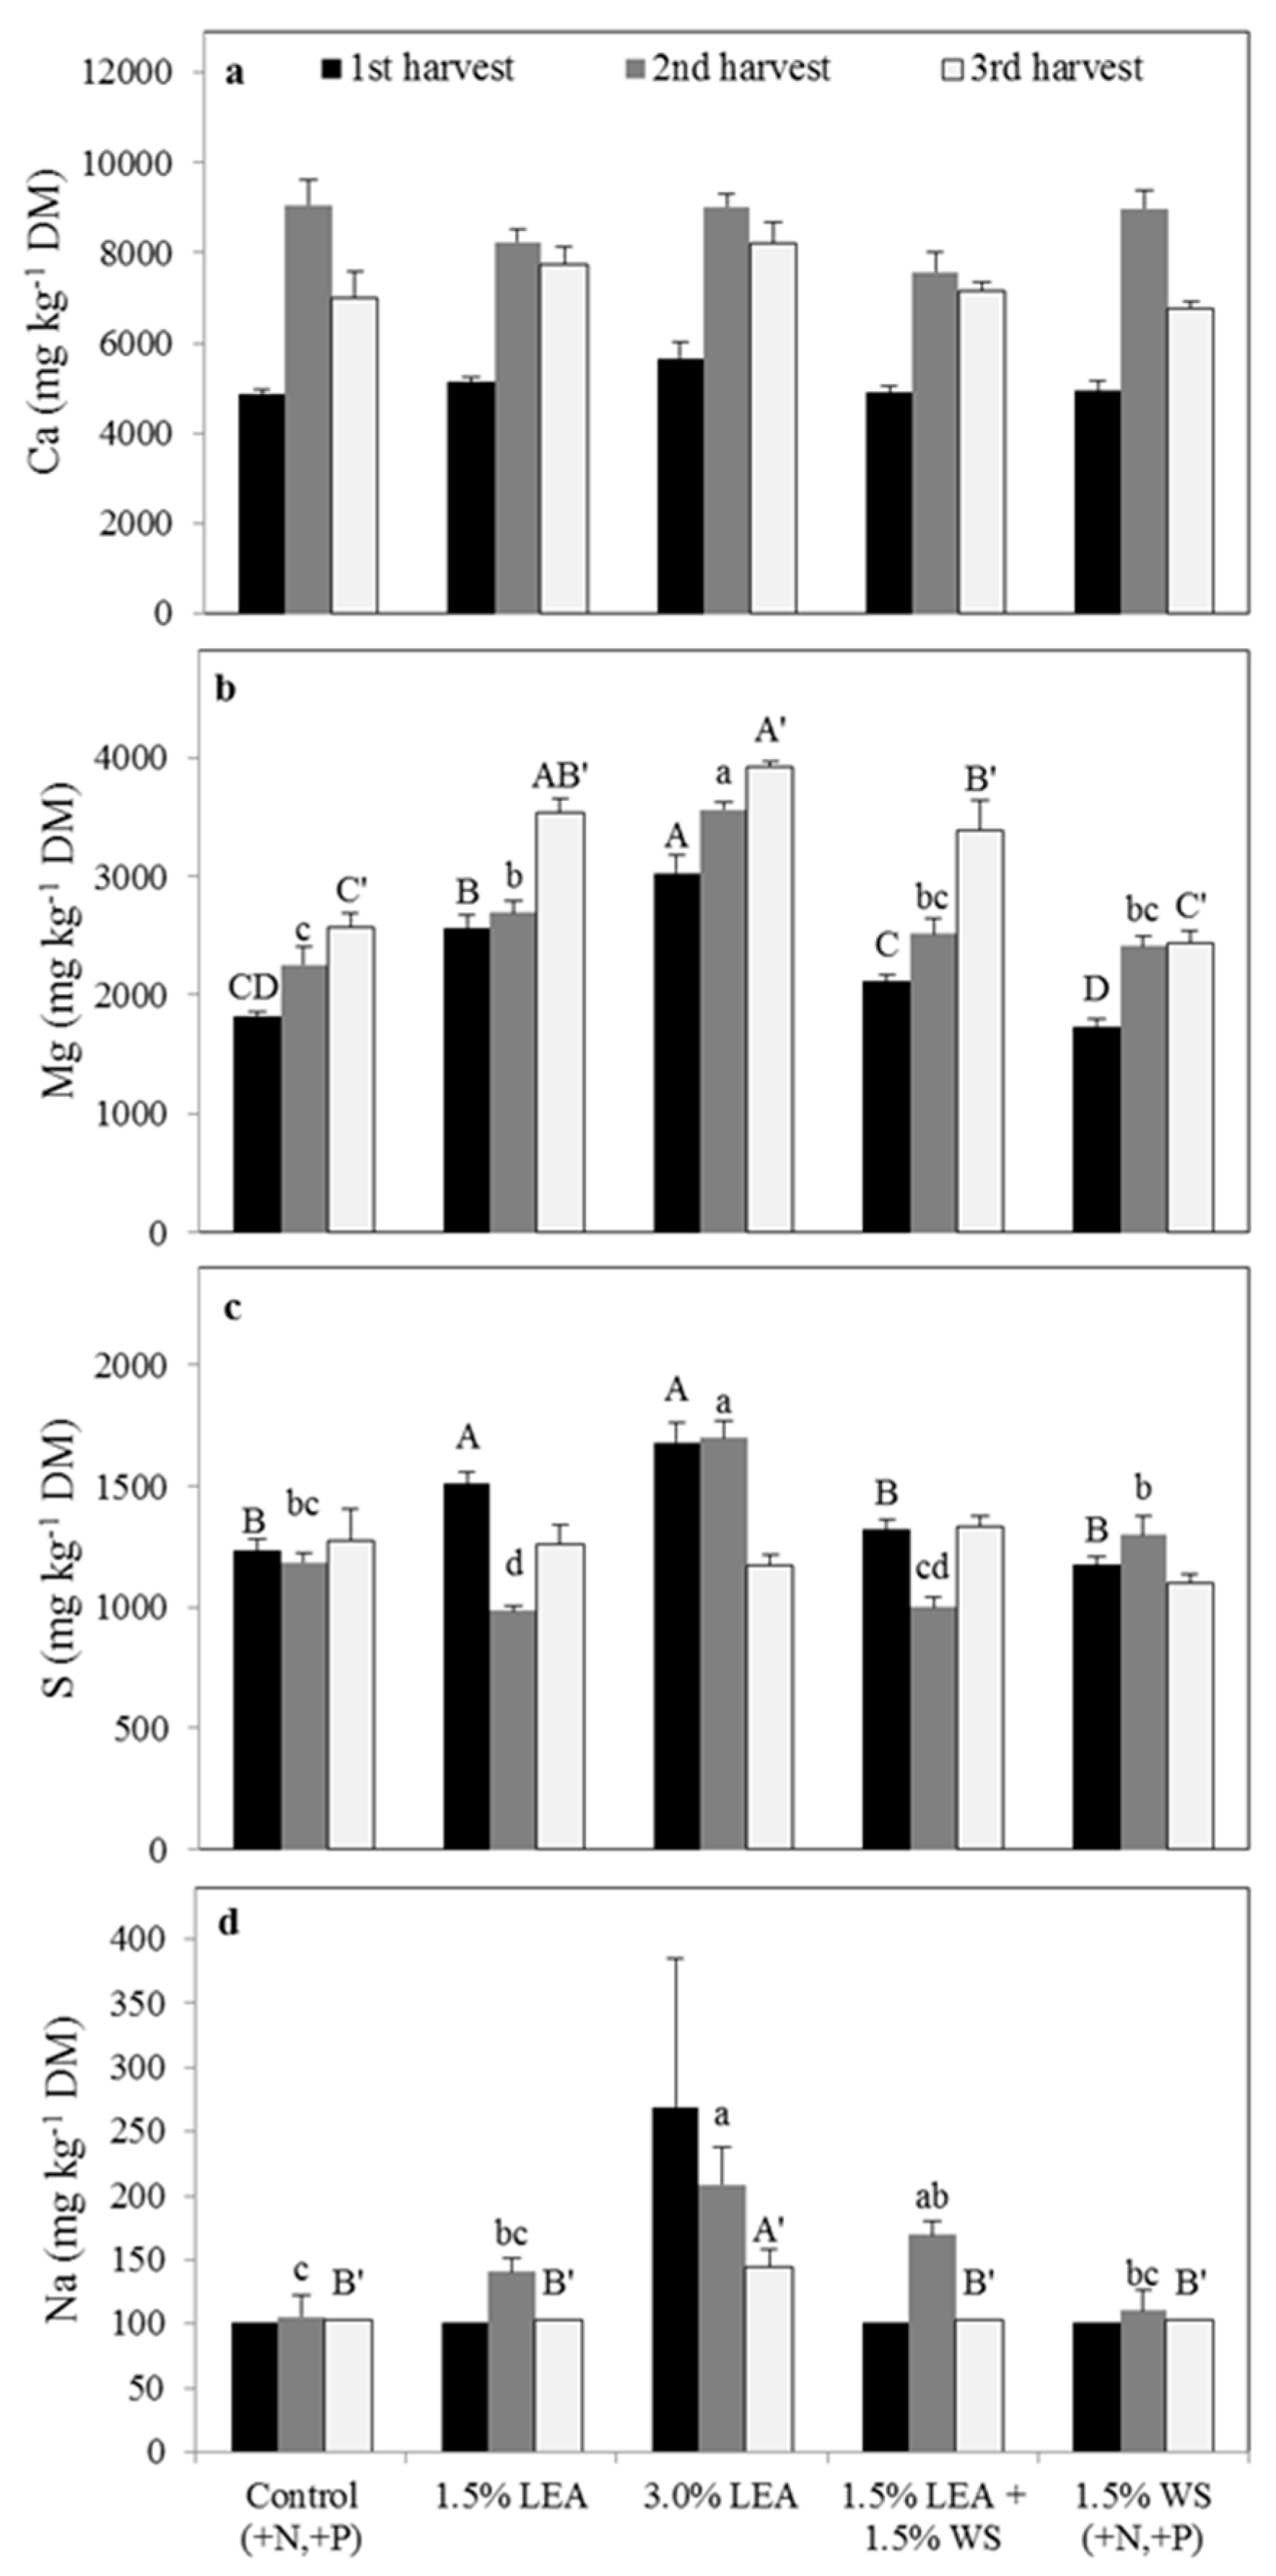
Lipid-extracted algae applied at 1.5% and 3.0% did not affect the concentration of Ca in pearl millet from all three harvests compared to the control (Figure 4a), which was similar to results observed for foxtail millet (Figure 2a), and likely was due to the high amount of extractable Ca present in Weesatche soil (Table 1). Soil amended with 1.5% LEA + 1.5% WS resulted in the lowest pearl millet Ca concentration at harvest 1, but the highest in harvest 2. For harvests 1 and 3, pearl millet herbage Mg and S concentrations were greatest with 3.0% LEA, and Na concentrations were greatest with this treatment for all three harvests (Figure 4b,d). By the third harvest, the concentrations of Ca, Mg, S, and Na in pearl millet were not different between the control, 1.5% LEA, 1.5% LEA + 1.5% WS, and 1.5% WS treatments, but all were significantly greater with 3.0% LEA (Figure 4).
Sodium concentrations of pearl millet receiving 3.0% LEA in harvests 1, 2 and 3 were 13, 9, and 43 times greater than for the control, respectively, whereas Na was at most 7 times greater in the other LEA treatments compared to the control (Figure 4d). Unlike foxtail millet, pearl millet Na concentrations increased with each harvest in the 3.0% LEA treatment. Concentrations of all studied elements tended to be greater in pearl compared to foxtail millet.
Calcium uptake by pearl millet was not different between treatments in the first and third harvests, but was different in harvest 2, being greatest with 3.0% LEA and least with 1.5% WS (Figure 5a). Magnesium uptake was greatest with the 3.0% LEA treatment in the harvest 1, followed by 1.5% LEA and then all other treatments (Figure 5b). In harvests 2 and 3, Mg uptake again was greatest with 3.0% LEA, with all other treatments giving similar concentrations. No differences for S uptake were noted in the second harvest but were greatest in harvests 1 and 3 with 3.0% LEA addition (Figure 5c). Sodium uptake by pearl millet was also greatest for 3.0% LEA for all harvests and increased with sequential harvests in this treatment (Figure 5d). For all other treatments, Na uptake by pearl millet tended to decrease from the second to third harvest (Figure 5d).
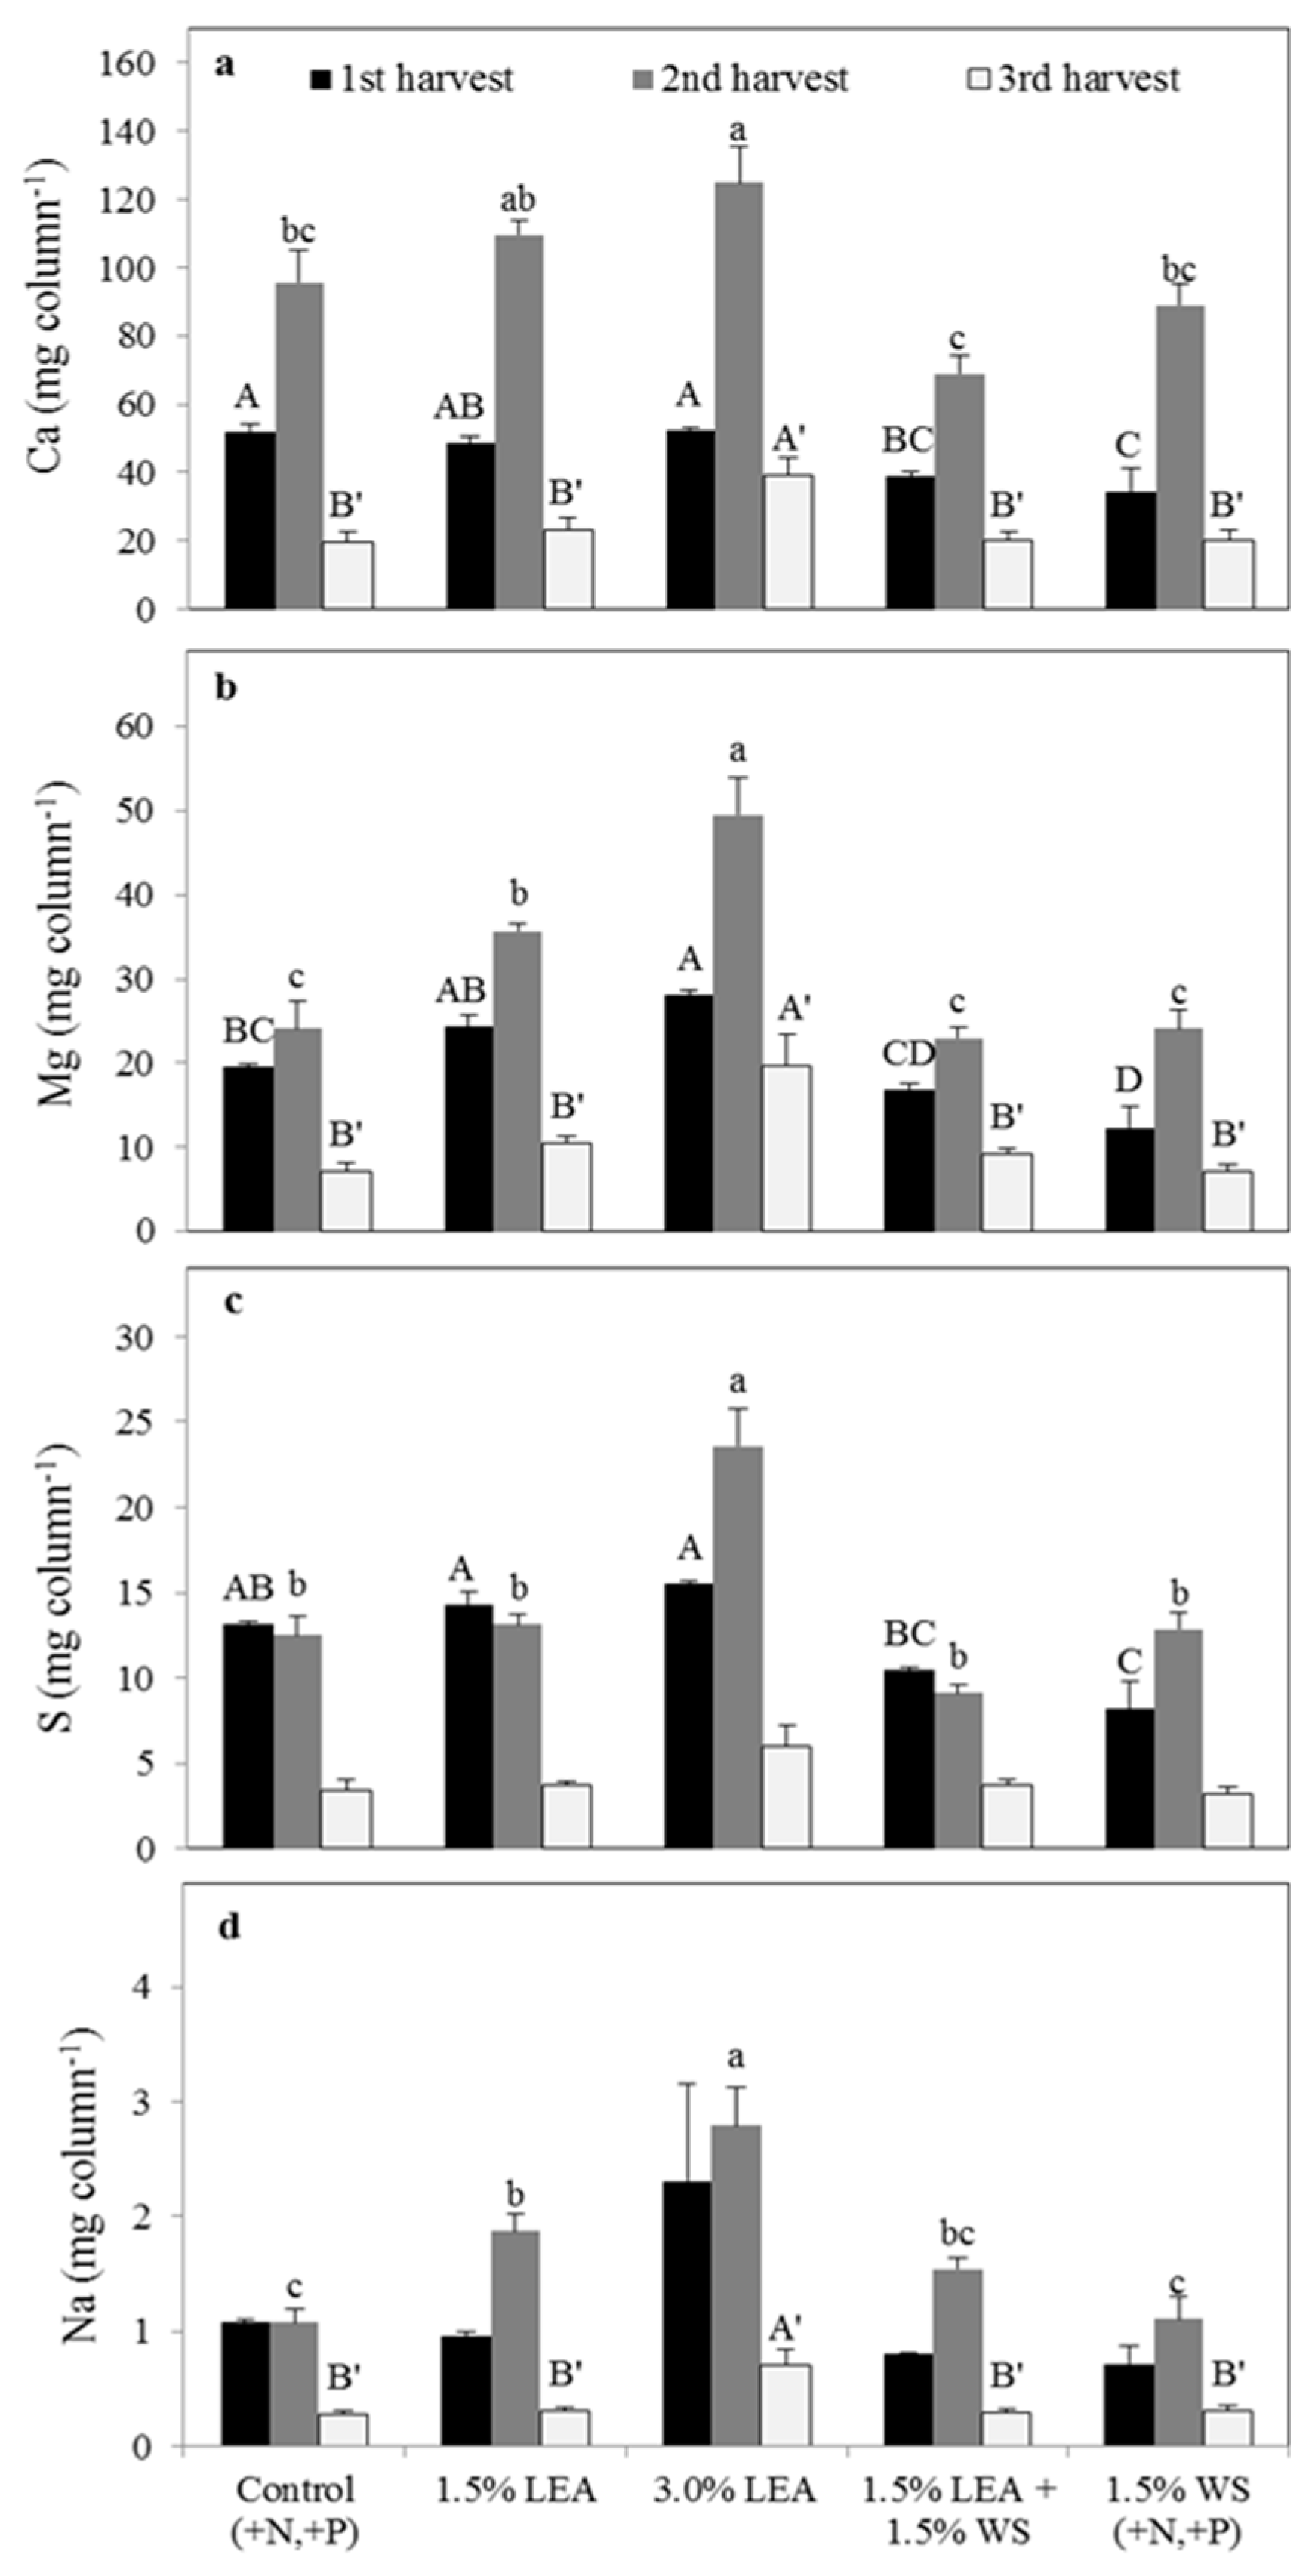
Calcium concentrations in sorghum-sudangrass were not affected by treatment at any harvest, but concentrations increased for all treatments in the second and third harvests compared with the first (Figure 6a). Addition of 3.0% LEA resulted in the greatest Mg concentrations in sorghum-sudangrass herbage from all three harvests, followed by the 1.5% LEA treatment (Figure 6b). Control and 1.5% WS generally resulted in the lowest Mg concentrations. Plant Mg concentrations generally increased for all treatments with each successive harvest. Sulfur concentrations in sorghum-sudangrass from harvest 1 were greatest for 3.0% and 1.5% LEA treatments and continued to be greatest for 3.0% LEA at harvest 2 (Figure 6c). No differences in concentrations were noted in the third harvest. Sulfur concentrations tended to decrease over harvests for LEA addition, especially for the 3.0% LEA treatment.
Sorghum-sudangrass Na concentrations from harvest 1 were not statistically influenced by treatment but was numerically greatest for 3.0% LEA (Figure 6d). Sodium concentrations in herbage from harvest 2 were greatest for 3.0% LEA and 1.5% LEA + 1.5% WS treatments, with 3.0% LEA again resulting in the highest concentration in the harvest 3. Sodium concentrations decreased with successive harvests only with the 3.0% LEA treatment.
Calcium, Mg, and Na uptake by sorghum-sudangrass were similar in that greatest uptake generally occurred in harvest 2 (Figure 7). Minimal treatment differences in Ca accumulation were generally observed for the first harvest, but amounts were generally less for treatments with WS, possibly because of immobilization (Figure 7a). Calcium uptake was greatest with 1.5% and 3.0% LEA additions in harvest 2 and with 3.0% LEA in harvest 3. Magnesium uptake by sorghum-sudangrass generally was greater with 1.5% and 3.0% LEA treatments in harvest 1 and was greatest for 3.0% LEA in subsequent harvests (Figure 7b). As noted with Ca, S uptake in the first harvest showed relatively little treatment difference, except that uptake again tended to be less with treatments receiving WS (Figure 7c). In harvest 2, 3.0% LEA resulted in the greatest S uptake, while treatment did not influence uptake in harvest 3. No significant treatment effect was observed with Na accumulation by sorghum-sudangrass in harvest 1, although 3.0% LEA was numerically greater (Figure 7d). This treatment resulted in the most Na accumulation in harvest 2, followed by treatments receiving 1.5% LEA, while 3.0% LEA again gave the greatest Na uptake in harvest 3.
Forage Ca concentrations were usually greatest in pearl millet followed by sorghum-sudangrass then foxtail millet (Figure 2, Figure 4 and Figure 6). Magnesium and S concentrations were similar in foxtail millet and sorghum-sudangrass, but considerably less than in pearl millet. Forage Na concentrations were similar to slightly lower in foxtail compared with pearl millet, while sorghum-sudangrass exhibited concentrations that were about 10-fold lower.
Calcium uptake by the three forages was lowest for foxtail millet, but similar for pearl millet and sorghum-sudangrass (Figure 3, Figure 5 and Figure 7). Both Mg and S accumulations were relatively the same for all three forages, while Na uptake was similar for both millet species, but much less for sorghum-sudangrass.
3.4. Soil Calcium, Magnesium, Sulfur, and Sodium Concentrations and pH and Electrical Conductivity (EC)
Residual extractable soil Na was approximately eight to ten times greater in soil amended with 3.0% LEA compared to the control or 1.5% WS regardless of forage species and was statistically greater than all other treatments (Table 3). Extractable Na in soil amended with 1.5% LEA and 1.5% LEA + 1.5% WS was significantly less than that of 3.0% LEA, but greater than remaining treatments. Relatively similar treatment effects were observed for extractable Ca and Mg as noted for Na, with greatest concentrations with 3.0% LEA, followed by treatments with 1.5% LEA, and then those without any LEA. Relative differences, however, were much greater with Na. Extractable soil S was also greatest for 3.0% LEA, but with fewer differences between treatments receiving 1.5% LEA and those receiving none.
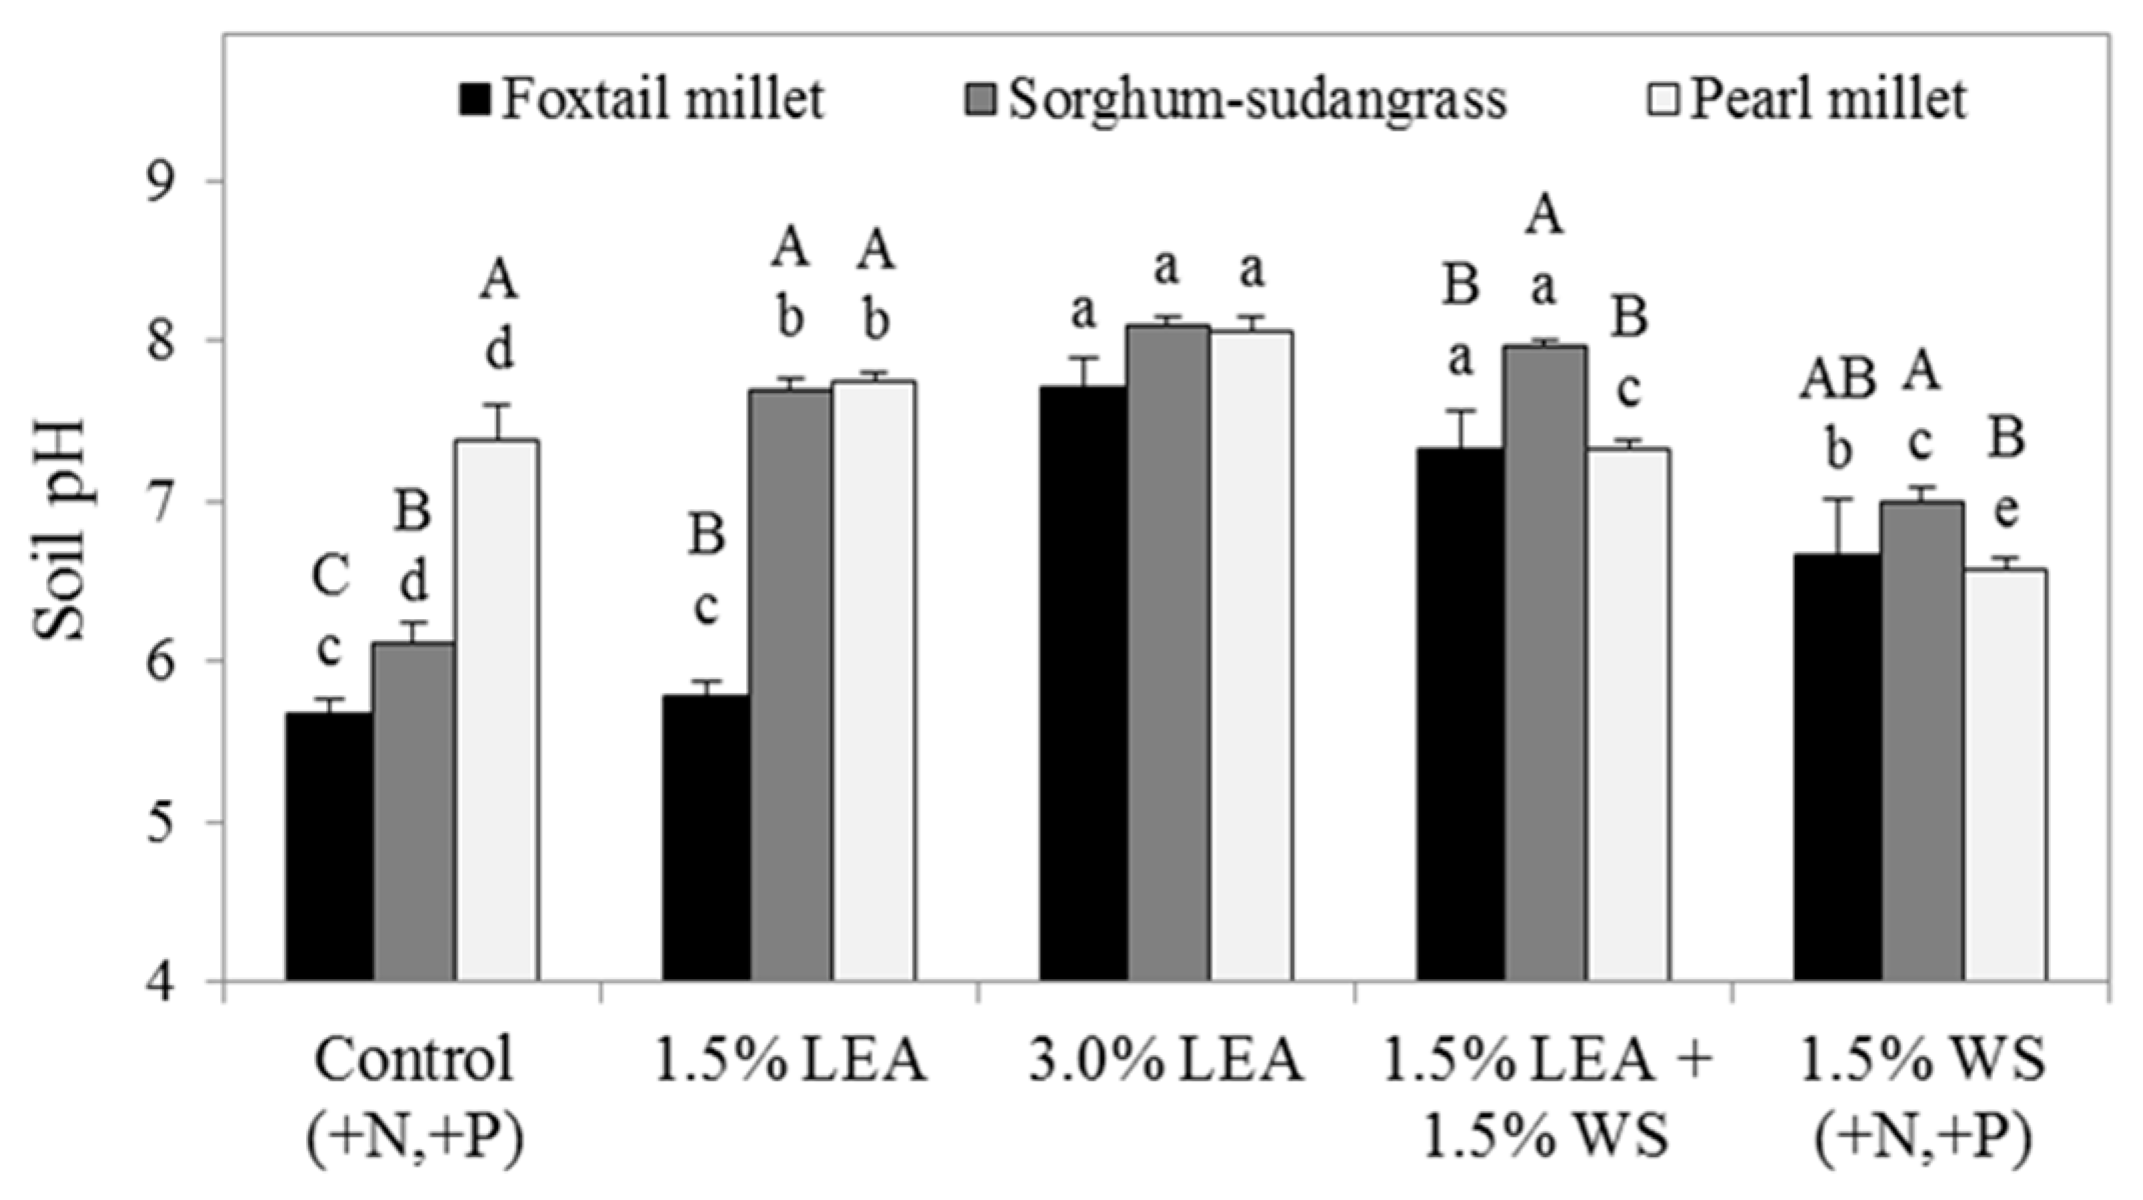
Soil pH determined after final forage harvests was also affected by both treatment and forage species (Figure 8). Soil amended with 3.0% LEA or 1.5% LEA + 1.5% WS for all forages generally resulted in more alkaline soil pH compared to the control or other treatments. The 1.5% LEA treatment also resulted in greater pH in soil planted to pearl millet and sorghum-sudangrass, but not foxtail millet, compared to the control. Forage effects on soil pH were significant within all treatments except 3.0% LEA (Figure 8), with sorghum-sudangrass and/or pearl millet generally elevating pH compared to foxtail millet. Soil pH for the control was most alkaline for pearl millet, followed by sorghum-sudangrass, and lowest for foxtail millet. Forage effects within both 1.5% and 3.0% LEA treatments were not different between sorghum-sudangrass and pearl millet. For the 1.5% LEA + 1.5% WS treatment, sorghum-sudangrass resulted in the most alkaline soil pH, whereas for 1.5% WS, soil pH following sorghum-sudangrass was greater than that following pearl millet, but not foxtail millet.
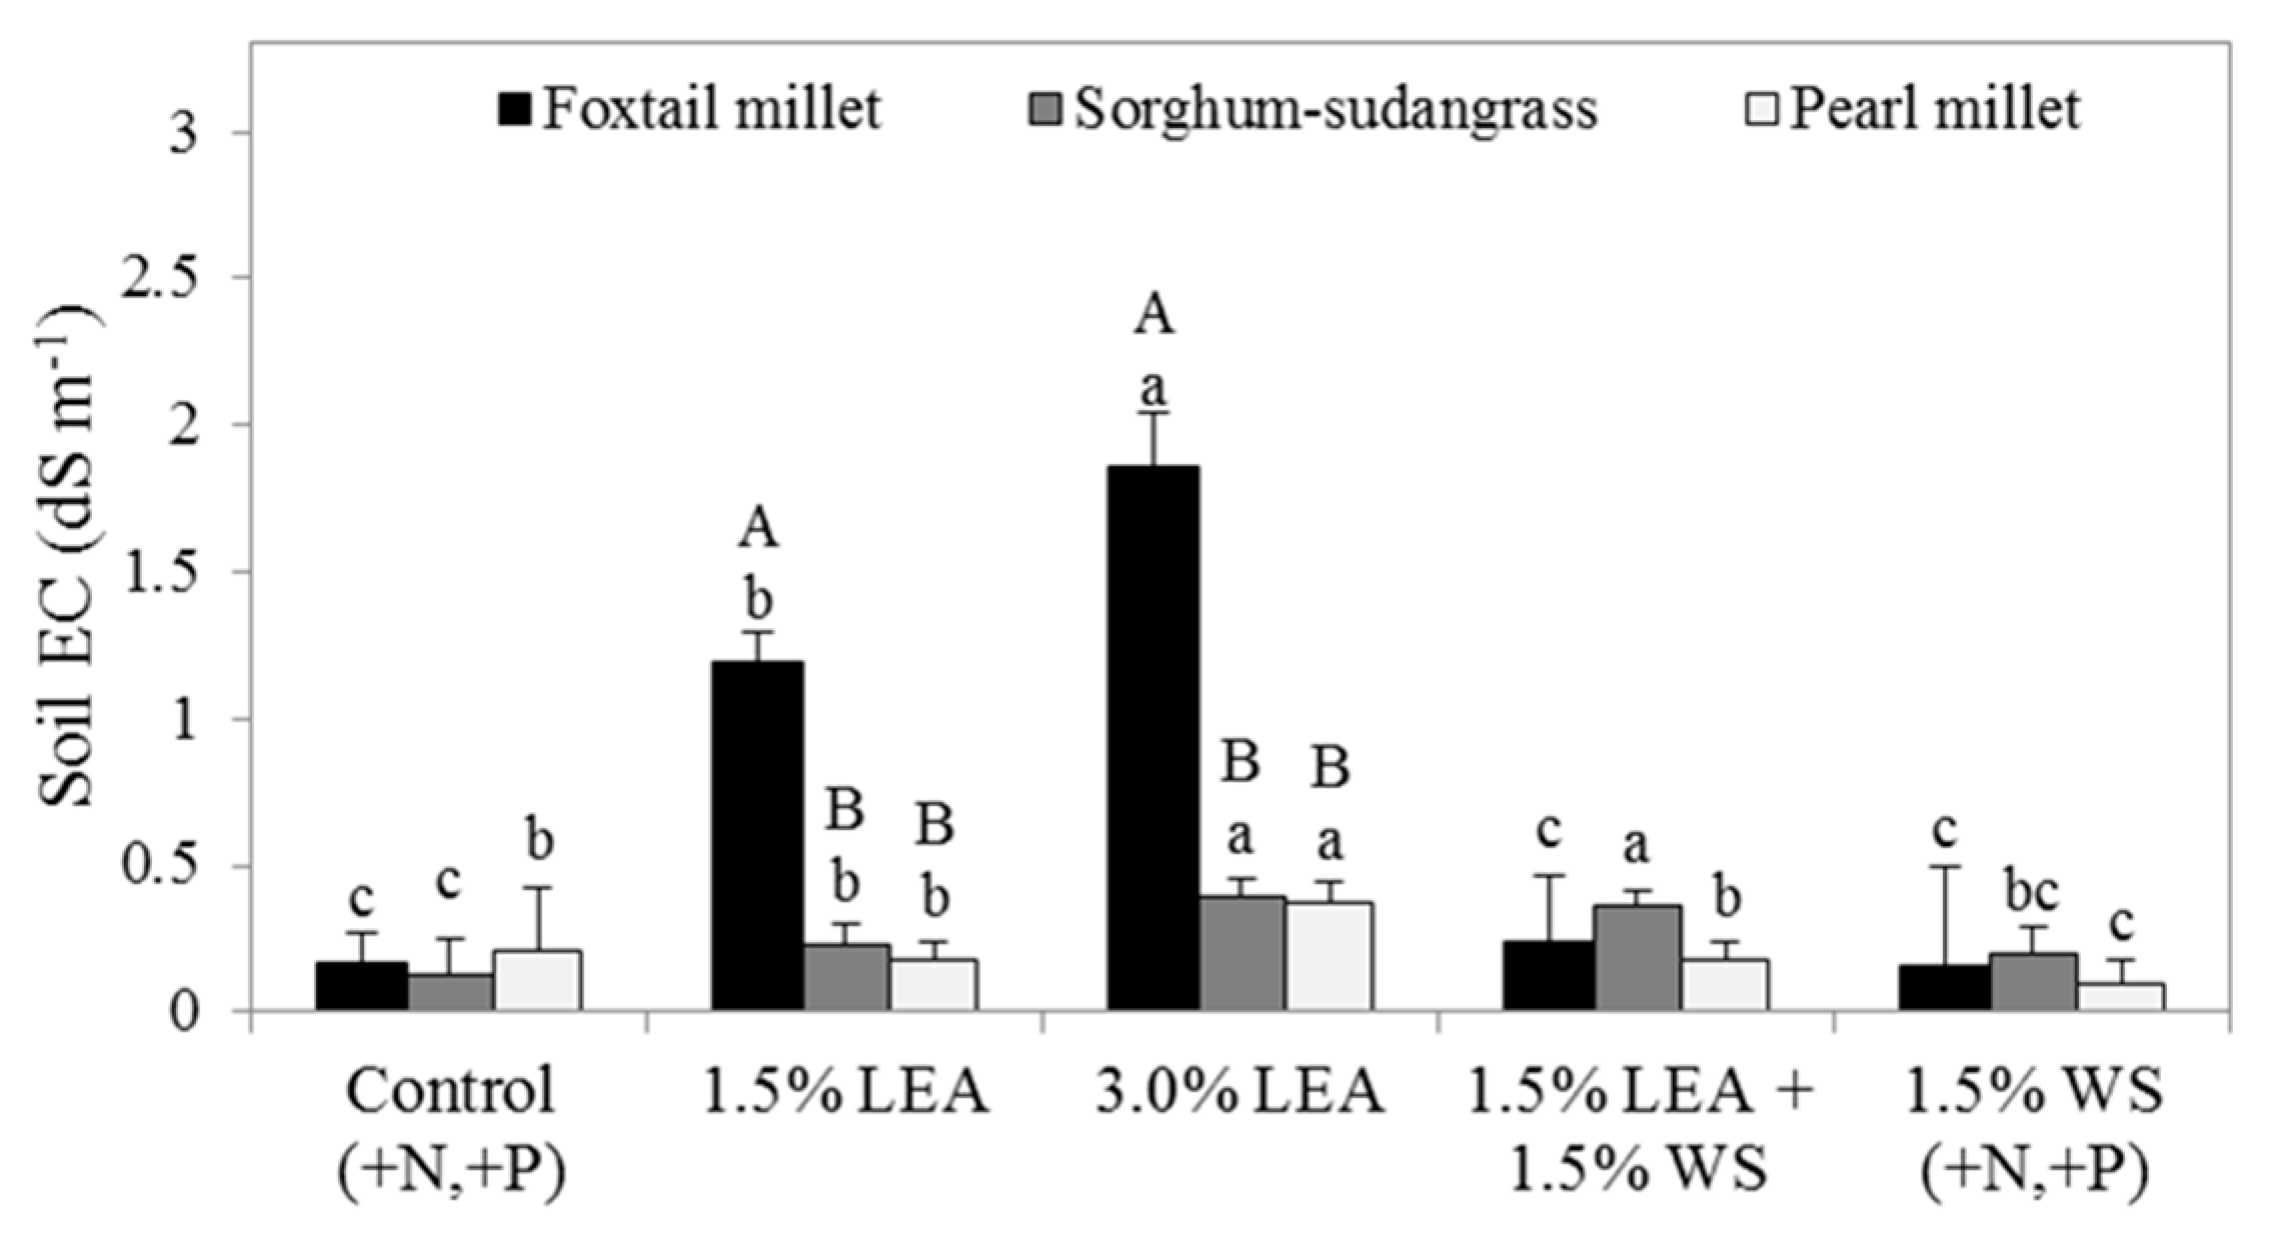
Soil EC within forage species was significantly affected by amendment, while forage only affected EC within the 1.5% and 3.0% LEA treatments (Figure 9). Soil EC measured following foxtail millet was greatest for the 3.0% LEA amendment (1.8 dS m−1) followed by 1.5% LEA (1.1 dS m−1). Similar to treatment effects on pH, soil EC values following sorghum-sudangrass were similar between 3.0% LEA and 1.5% LEA + 1.5% WS, and both were greater than the EC for 1.5% LEA and remaining treatments. Within 1.5% and 3.0% LEA treatments, soil EC was greatest following foxtail millet, with no forage effects on soil EC for other treatments.
4. Discussion
Poor seedling emergence of foxtail millet, regardless of soil treatment, along with a rather high coefficient of variation, likely indicated comparatively poor seed quality, and thus germination rate was less for this species compared to both pearl millet and sorghum-sudangrass (Table 2). Sorghum-sudangrass demonstrated a tendency to be more tolerant to LEA application, and its associated salinity than foxtail and pearl millet as demonstrated by greater seedling emergence with sorghum-sudangrass in soil treated with 3.0% LEA. Wheat straw applied in addition to LEA (1.5% LEA + 1.5% WS) did not increase emergence compared to the 1.5% LEA treatment, and thus did not reduce any deleterious salt-associated effects of LEA. Greater tolerance was expected for sorghum-sudangrass compared to foxtail millet but not necessarily pearl millet [14,17]. Our findings agree with studies by Dua and Francois et al., who reported grain sorghum to be significantly more salt tolerant at germination than at later stages of growth, and pearl millet to be more salt sensitive at germination rather than at later stages of growth [14,17]. The Na concentration of pearl millet increased with each succeeding harvest for the 3.0% LEA treatment, a trend opposite of that observed with the other forages and was possibly indicative of this plant’s ability to cope with excess external Na (Figure 4).
The lack of treatment differences for foxtail millet HM can be explained by the equally poor seedling emergence amongst treatments (Figure 1a, Table 2); this was not the case for pearl millet or sorghum-sudangrass. Pearl millet HM was not affected by any treatment compared to the control during harvests 1 and 2, but by harvest 3, 3.0% LEA enhanced HM compared to the control or other treatments (Figure 1b). Pearl millet has been reported to be moderately salt tolerant [13], and greater nutrient availability in 3.0% LEA-amended soil may have resulted in the greater HM produced for this treatment at the third harvest. Sorghum-sudangrass produced less total HM with 1.5% LEA + 1.5% WS compared to the 1.5% and 3.0% LEA treatments, possibly because of nutrient immobilization due to WS (Figure 1c).
Plants use multiple strategies to reduce salt stress such as ion exclusion and compartmentalization. Pearl millet and sorghum-sudangrass likely use different mechanisms as indicated by approximately 10-fold lower Na concentrations for sorghum-sudangrass compared to foxtail and pearl millet and less total Na accumulated for the three harvests by sorghum-sudangrass (6 mg column−1) compared to that by pearl millet (82 mg Na column−1). Sorghum species (S. halepense and S. bicolor) have been reported to possess the capacity for Na exclusion [30,31] which either reduces Na taken up by roots or increases translocation of Na from leaves back to roots. The mechanism used by pearl millet may likely involve compartmentalizing Na ions into the vacuole or actively pumping it outside the cell to the apopolast.
Extractable soil Ca, Mg, and Na following final forage harvests were still significantly greater in 3.0% LEA-treated soil (Table 3), even though the total amounts of Ca, Mg, S, and Na taken up and accumulated by all forages were generally greatest for this treatment (Figure 2, Figure 3, Figure 4, Figure 5, Figure 6 and Figure 7). This is the result of greater Ca, Mg, S, and Na being added to the soil with the 3.0% LEA treatment compared to the 1.5% LEA treatment. In soil treated with 3.0% LEA, residual soil Na was greater following foxtail millet compared to pearl millet. Excessive Ca and Na may have contributed to increased soil salinity and alkalinity associated with LEA treatments (Table 1, Figure 8 and Figure 9) [2]. The hypothesis for the 1.5% LEA + 1.5% WS treatment used in this experiment was that WS may reduce some of the negative aspects associated with LEA, specifically salinity. However, similar soil EC values with this treatment and 1.5% LEA as well as similar extractable Na implied that WS generally did not aid in mitigating salinity generated with LEA amendment. Compared to soil following foxtail millet, EC was significantly less following pearl millet and sorghum-sudangrass in 1.5% and 3.0% LEA treatments, possibly because of greater Ca and Mg uptake by these latter species. These results may indicate that pearl millet and sorghum-sudangrass might be more effective at remediating LEA-associated salinity than foxtail millet.
5. Conclusions
At the 1.5% LEA rate, production of salt tolerant forages, such as pearl millet and sorghum-sudangrass, appeared feasible. Production of salt-tolerant species following LEA application as high as 3.0% by weight to soil with initially low EC may be possible, especially in locations where rainfall would encourage leaching of salt. However, repeated large applications of LEA over the long-term is not likely a viable option because of high salt concentrations of LEA, especially Na, reducing productivity.
Author Contributions
Supervision, J.L.F. and F.M.H.; Writing—original draft, K.L.L.; Writing—review & editing, J.L.F. and F.M.H.
Funding
Funding for this research was provided by the U.S. Department of Energy through contract DE-EE003046 to the National Alliance for Advanced Biofuels and Bioproducts (NAABB).
Conflicts of Interest
The authors declare no conflict of interest.
References
- Slade, R.; Bauen, A. Micro-algae cultivation for biofuels: Cost, energy balance, environmental impacts and future prospects. Biomass Bioenergy 2013, 53, 29–38. [Google Scholar] [CrossRef] [Green Version]
- Rothlisberger-Lewis, K.L.; Foster, J.L.; Hons, F.M. Soil carbon and nitrogen dynamics as affected by lipid-extracted algae application. Geoderma 2015, 262, 140–146. [Google Scholar] [CrossRef]
- Gelin, F.; Volkman, J.; Largeau, C.; Derenne, S.; Damste, J.; De Leeuw, J. Distribution of aliphatic, nonhydrolyzable biopolymers in marine microalgae. Org. Geochem. 1999, 30, 147–159. [Google Scholar] [CrossRef]
- Poirier, N.; Derenne, S.; Rouzaud, J.; Largeau, C.; Mariotti, A.; Balesdent, J.; Maquet, J. Chemical structure and sources of the macromolecular, resistant, organic fraction isolated from a forest soil (Lacadee, south-west France). Org. Geochem. 2000, 31, 813–827. [Google Scholar] [CrossRef]
- Cassman, K.G.; Dobermann, A.; Walters, D.T.; Yang, H. Meeting cereal demand while protecting natural resources and improving environmental quality. Annu. Rev. Environ. Resour. 2003, 28, 315–358. [Google Scholar] [CrossRef]
- Flowers, T.J.; Yeo, A.R. Breeding for salinity resistance in crop plants: Where next? Aust. J. Plant Physiol. 1995, 22, 875–884. [Google Scholar] [CrossRef]
- Ashraf, M. Breeding for salinity tolerance in plants. Crit. Rev. Plant Sci. 1994, 13, 17–42. [Google Scholar] [CrossRef]
- Hasegawa, B.; Bressan, A.; Zhu, J.K.; Bohnert, H.J. Plant cellular and molecular responses to high salinity. Annu. Rev. Plant Biol. 2000, 51, 463–499. [Google Scholar] [CrossRef]
- Parida, A.K.; Das, A.D. Salt tolerance and salinity effects on plants: A review. Ecotoxicol. Environ. Saf. 2005, 60, 324–349. [Google Scholar] [CrossRef] [PubMed]
- Greenway, H.; Munns, R. Mechanisms of salt tolerance in nonhalophytes. Annu. Rev. Plant Physiol. 1980, 31, 149–190. [Google Scholar] [CrossRef]
- Munns, R. Comparative physiology of salt and water stress. Plant Cell Environ. 2002, 25, 239–250. [Google Scholar] [CrossRef] [PubMed] [Green Version]
- Ayers, R.S.; Westcot, D.W. Water Quality for Agriculture; Irrigation and Drainage Paper 29; FAO: Rome, Italy, 1985. [Google Scholar]
- Ashraf, M.; McNeilly, T. Salinity effects on five cultivars/lines of pearl millet (Pennisetum americanum [L.] leeke). Plant Soil 1987, 103, 13–19. [Google Scholar] [CrossRef]
- Dua, R.P. Salinity tolerance in pearl millet. Indian J. Agric. Res. 1989, 23, 9–14. [Google Scholar]
- Ravikovitch, S.; Yoles, D. The influence of phosphorus and nitrogen on millet and clover growing in soils affected by salinity I. Plant development. Plant Soil 1971, 15, 555–567. [Google Scholar] [CrossRef]
- Bower, C.A.; Ogata, G.; Tucker, J.M. Growth of sudan and tall fescue grasses as influenced by irrigation water salinity and leaching fraction. Agron. J. 1970, 62, 793–794. [Google Scholar] [CrossRef]
- Francois, L.E.; Donovan, T.J.; Maas, E.V. Salinity effects on seed yield, growth, and germination of grain sorghum. Agron. J. 1984, 76, 741–744. [Google Scholar] [CrossRef]
- U.S. Climate Data. 2016. Available online: http://www.usclimatedata.com/climate/beeville/texas/united-states/ustx0095 (accessed on 14 September 2016).
- Natural Resources Conservation Service, United States Department of Agriculture, Official Soil Series Descriptions. 2010. Available online: https://soilseries.sc.egov.usda.gov/OSD_Docs/W/WEESATCHE.html (accessed on 14 September 2016).
- Storer, D.A. A simple high volume ashing procedure for determining soil organic matter. Commun. Soil Sci. Plant Anal. 1984, 15, 759–772. [Google Scholar] [CrossRef]
- McGeehan, S.L.; Naylor, D.V. Automated instrumental analysis of carbon and nitrogen in plant and soil samples. Commun. Soil Sci. Plant Anal. 1988, 19, 493–505. [Google Scholar] [CrossRef]
- Schulte, E.E.; Hopkins, B.G. Estimation of soil organic matter by weight by weight loss-on-ignition. In Soil Organic Matter: Analysis and Interpretation; Magdoff, F.R., Tabatabai, M.A., Hanlon, E.A., Jr., Eds.; SSSA: Madison, WI, USA, 1996; p. 21. [Google Scholar] [CrossRef]
- Mehlich, A. Mehlich-III soil test extractant: A modification of Mehlich-II extractant. Commun. Soil Sci. Plant Anal. 1984, 15, 1409–1416. [Google Scholar] [CrossRef]
- Lindsay, W.L.; Norvell, W.A. Development of a DTPA soil test for zinc, iron, manganese, and copper. Soil Sci. Soc. Am. J. 1978, 42, 421–428. [Google Scholar] [CrossRef]
- Isaac, R.A.; Johnson, W.C. Collaborative study of wet and dry ashing techniques for the elemental analysis of plant tissue by atomic absorption spectrophotometry. J. Assoc. Off. Anal. Chem. 1975, 58, 436–440. [Google Scholar]
- Havlin, J.L.; Soltanpour, P.N. A nitric acid and plant digest method for use with inductively coupled plasma spectrometry. Commun. Soil. Sci. Plant Anal. 1980, 11, 969–980. [Google Scholar] [CrossRef]
- Rhoades, J.D. Soluble salts. In Methods of Soil Analysis: Part 2, Agronomy Monogr 9, 2nd ed.; Page, A.L., Miller, R.H., Keeney, D.R., Eds.; SSSA: Madison, WI, USA, 1982; p. 167. [Google Scholar]
- Baltensperger, D.D. Foxtail and proso millet. In Progress in New Crops; Janick, J., Ed.; ASHS Press: Alexandria, VA, USA, 1996; p. 182. [Google Scholar]
- SAS Institute. The SAS System for Windows; SAS Version 9.3; SAS Inst.: Cary, NC, USA, 2011. [Google Scholar]
- Weimberg, R.; Lerner, H.R.; Poljakoff-Mayber, A. Changes in growth and water-soluble solute concentrations in Sorghum bicolor stressed with sodium and potassium salts. Physiol. Plant. 1984, 62, 472–480. [Google Scholar] [CrossRef]
- Yang, Y.W.; Newton, R.J.; Miller, F.R. Salinity tolerance in sorghum. I. Whole plant response to sodium chloride in S. bicolor and S. halepense. Crop Sci. 1988, 30, 775–781. [Google Scholar] [CrossRef]
Figure 1.
Herbage mass (HM) from two harvests of foxtail millet (a), and three harvests of pearl millet (b) and sorghum-sudangrass (c). Total HM was calculated as the sum of separate harvests and is represented by the total height of treatment columns. Means followed by the same letter within harvest (within shaded area representing harvest) or for total HM (above bars) are not significantly different at p < 0.05 by Fisher’s protected LSD. Lipid-extracted algae and wheat straw amendments are denoted as LEA and WS, respectively.

Figure 2.
Foxtail millet calcium (a), magnesium (b), sulfur (c), and sodium (d) concentrations on a dry matter basis for the first and second harvests. Means followed by the same letter within harvest and element (uppercase letters for first harvest and lowercase letters for second harvest) are not significantly different at p < 0.05 by Fisher’s protected LSD. LEA and WS denote lipid-extracted algae and wheat straw, respectively.

Figure 3.
Uptake of calcium (a), magnesium (b), sulfur (c), and sodium (d) by foxtail millet in the first and second harvests. Means followed by the same letter within harvest (uppercase letters for first harvest and lowercase letters for second harvest) and element are not significantly different at p < 0.05 by Fisher’s protected LSD. LEA and WS denote lipid-extracted algae and wheat straw, respectively.

Figure 4.
Pearl millet calcium (a), magnesium (b), sulfur (c), and sodium (d) concentrations on a dry matter basis for the first through third harvests. Means followed by the same letter within harvest and element (uppercase letters for first, lowercase letters for second, and uppercase prime letters for the third harvest) are not significantly different at p < 0.05 by Fisher’s protected LSD. LEA and WS denote lipid-extracted algae and wheat straw, respectively.

Figure 5.
Uptake of calcium (a), magnesium (b), sulfur (c), and sodium (d) by pearl millet in the first through third harvests. Means followed by the same letter within harvest and element (uppercase letters for first, lowercase letters for second, and uppercase prime letters for the third harvest) are not significantly different at p < 0.05 by Fisher’s protected LSD. LEA and WS denote lipid-extracted algae and wheat straw, respectively.

Figure 6.
Sorghum-sudangrass calcium (a), magnesium (b), sulfur (c), and sodium (d) concentrations on a dry matter basis for the first through harvests. Means followed by the same letter within harvest and element (uppercase letters for first, lowercase letters for second, and uppercase prime letters for third harvest) are not significantly different at p < 0.05 by Fisher’s protected LSD. LEA and WS denote lipid-extracted algae and wheat straw, respectively.

Figure 7.
Uptake of calcium (a), magnesium (b), sulfur (c), and sodium (d) by sorghum-sudangrass for the three harvests. Means followed by the same letter within harvest and element (uppercase letters for first, lowercase letters for second, and uppercase prime letters for third harvest) are not significantly different at p < 0.05 by Fisher’s protected LSD. LEA and WS denote lipid-extracted algae and wheat straw, respectively.

Figure 8.
Soil pH measured after the final harvests of foxtail millet, sorghum-sudangrass, and pearl millet. Means followed by the same letter within forage (lowercase letters for treatment effect) or treatment (uppercase letters for forage effect) are not significantly different at p < 0.05 by Fisher’s protected LSD. Lipid-extracted algae and wheat straw amendments are denoted as LEA and WS, respectively.

Figure 9.
Electrical conductivity (EC) measured following the final harvests of foxtail millet, sorghum-sudangrass, and pearl millet. Means followed by the same letter within forage (lowercase letters for treatment effect) or treatment (uppercase letters for forage effect) are not significantly different at p < 0.05 by Fisher’s protected LSD. Lipid-extracted algae and wheat straw amendments are denoted as LEA and WS, respectively.


Table 1.
Soil, lipid-extracted algae (LEA), and wheat straw (WS) chemical characteristics. Soil nutrients (P, K, Ca, Mg, and S) and Na are Mehlich III extractable and DTPA extractable (Fe, Zn, Mn, and Cu) [2]. LEA and WS were analyzed for total mineral concentrations.
Table 1.
Soil, lipid-extracted algae (LEA), and wheat straw (WS) chemical characteristics. Soil nutrients (P, K, Ca, Mg, and S) and Na are Mehlich III extractable and DTPA extractable (Fe, Zn, Mn, and Cu) [2]. LEA and WS were analyzed for total mineral concentrations.
| pH | EC | Organic | Total | Soil Extractable Elements and LEA/WS Total Minerals | ||||||||||
|---|---|---|---|---|---|---|---|---|---|---|---|---|---|---|
| C | N | P | K | Ca | Mg | S | Na | Fe | Zn | Mn | Cu | |||
| dS m−1 | g kg−1 | mg kg−1 | ||||||||||||
| Soil | ||||||||||||||
| Weesatche | 6.1 | 0.27 | 25 | 1.8 | 13 | 358 | 3333 | 237 | 24 | 36 | 21 | 4 | 15 | 4 |
| Amendments | ||||||||||||||
| LEA | 9.9 | 32.5 | 343 | 32 | 4339 | 6997 | 62,666 | 7212 | 9282 | 52,922 | 3664 | 29 | 79 | 14 |
| WS | 6.6 | 3.43 | 404 | 8.0 | 800 | 14,400 | 3200 | 800 | 992 | 533 | 39 | 20 | 17 | 5 |
Table 2.
Foxtail millet, pearl millet, and sorghum-sudangrass seedling emergence 14 days after planting as a percent of the seed planted and the corresponding test statistics within forage type. LEA denotes lipid-extracted algae and WS denotes wheat straw.
Table 2.
Foxtail millet, pearl millet, and sorghum-sudangrass seedling emergence 14 days after planting as a percent of the seed planted and the corresponding test statistics within forage type. LEA denotes lipid-extracted algae and WS denotes wheat straw.
| Treatment | Foxtail Millet | Sorghum-Sudangrass | Pearl Millet |
|---|---|---|---|
| % of Seed Planted | |||
| Control (+N, +P) | 37.5 | 90.0 | 90.0 a * |
| 1.5% LEA ** | 36.3 | 72.5 | 85.0 ab |
| 3.0% LEA | 43.8 | 82.5 | 65.0 b |
| 1.5% LEA + 1.5% WS | 27.5 | 80.0 | 90.0 a |
| 1.5% WS (+N, +P) | 30.0 | 97.5 | 82.5 ab |
| Test Statistics | |||
| p-value | 0.32 | 0.15 | 0.098 |
| CV, % | 32.47 | 16.24 | 16.19 |
* Means followed by the same letter within element and forage are not significantly different at p < 0.05 by Fisher’s protected LSD. ** LEA and WS denote lipid-extracted algae and wheat straw, respectively.
Table 3.
Extractable soil calcium, magnesium, sulfur, and sodium after the final harvests of foxtail millet, sorghum-sudangrass, and pearl millet.
Table 3.
Extractable soil calcium, magnesium, sulfur, and sodium after the final harvests of foxtail millet, sorghum-sudangrass, and pearl millet.
| Treatment | Ca | Mg | S | Na |
|---|---|---|---|---|
| mg kg−1 | ||||
| Foxtail millet soil | ||||
| Control (+N, +P) | 3279 b * | 224 cd | 12 bc | 67 c |
| 1.5% LEA ** | 3414 b | 240 b | 19 b | 380 b |
| 3.0% LEA | 3808 a | 274 a | 30 a | 690 a |
| 1.5% LEA + 1.5% WS | 3406 b | 236 bc | 17 b | 404 b |
| 1.5% WS (+N, +P) | 3104 c | 223 d | 8 c | 59 c |
| p-value | <0.0001 | <0.0001 | 0.0001 | <0.0001 |
| Sorghum-sudangrass soil | ||||
| Control (+N, +P) | 3208 c | 218 c | 9 b | 88 c |
| 1.5% LEA | 3462 b | 235 b | 11 b | 390 b |
| 3.0% LEA | 3809 a | 264 a | 17 a | 669 a |
| 1.5% LEA + 1.5% WS | 3544 b | 238 b | 11 b | 354 b |
| 1.5% WS (+N, +P) | 3267 c | 225 c | 9 b | 86 c |
| p-value | <0.0001 | <0.0001 | 0.001 | <0.0001 |
| Pearl millet soil | ||||
| Control (+N, +P) | 3351 bc | 216 b | 6 b | 68 c |
| 1.5% LEA | 3747 a | 225 b | 7 b | 298 b |
| 3.0% LEA | 3923 a | 249 a | 13 a | 615 a |
| 1.5% LEA + 1.5% WS | 3491 b | 226 b | 9 ab | 221 b |
| 1.5% WS (+N, +P) | 3215 c | 221 b | 5 b | 71 c |
| p-value | <0.0001 | 0.0004 | 0.0100 | <0.0001 |
* Means followed by the same letter within element and forage are not significantly different at p < 0.05 by Fisher’s protected LSD. ** LEA and WS denote lipid-extracted algae and wheat straw, respectively.
© 2019 by the authors. Licensee MDPI, Basel, Switzerland. This article is an open access article distributed under the terms and conditions of the Creative Commons Attribution (CC BY) license (http://creativecommons.org/licenses/by/4.0/).
Share and Cite
MDPI and ACS Style
Lewis, K.L.; Foster, J.L.; Hons, F.M. Lipid-Extracted Algae as a Soil Amendment Can Increase Soil Salinization and Reduce Forage Growth. Sustainability 2019, 11, 1946. https://doi.org/10.3390/su11071946
AMA Style
Lewis KL, Foster JL, Hons FM. Lipid-Extracted Algae as a Soil Amendment Can Increase Soil Salinization and Reduce Forage Growth. Sustainability. 2019; 11(7):1946. https://doi.org/10.3390/su11071946
Chicago/Turabian StyleLewis, Katie L., Jamie L. Foster, and Frank M. Hons. 2019. "Lipid-Extracted Algae as a Soil Amendment Can Increase Soil Salinization and Reduce Forage Growth" Sustainability 11, no. 7: 1946. https://doi.org/10.3390/su11071946
Note that from the first issue of 2016, this journal uses article numbers instead of page numbers. See further details here.