Emergency Evacuation Simulation and Management Optimization in Urban Residential Communities


1
School of Environmental and Geographical Sciences, Shanghai Normal University, Shanghai 200234, China
2
Shanghai Environmental Monitoring Center, Shanghai 200233, China
3
CSIRO Land and Water, Canberra 2601, Australia
*
Author to whom correspondence should be addressed.
Sustainability 2019, 11(3), 795; https://doi.org/10.3390/su11030795
Submission received: 15 December 2018
/
Revised: 24 January 2019
/
Accepted: 30 January 2019
/
Published: 2 February 2019
(This article belongs to the Special Issue Sustainable Urban and Regional Management)
Abstract
:Timely and secure evacuation of residents in communities is of great importance during unexpected disasters or emergency events. This study proposes a framework of evacuation simulation for optimizing emergency management in urban residential communities. Compared to traditional methods, the advantage of our framework lies in three aspects: (1) The method highlights easy-crowded areas in both indoor and outdoor evacuations. (2) Family behaviors are considered and implemented in evacuations. (3) Detailed measures on management optimization are spatially mapped based on a multi-level analysis and the comparison of evacuation simulation results in different scenarios. A case study in Changhongfang residential community, Xuhui District, Shanghai, China, was conducted to demonstrate the method feasibility. Simulation results have exposed potential evacuation problems in the community. A series of detailed recommended measures have been generated. These measures can help to create better emergency management for the community.
1. Introduction
Timely and secure evacuation of residents is of great importance during unexpected disaster events [1]. In recent years, there has been an acceleration in urbanization and rapid increase in population rapidly in expanding cities of China. Evacuation in urban residential communities under emergencies is a critical issue [2]. Casualties can be reduced or prevented if people evacuate from dangerous areas to safe areas timely in disasters or emergency events [3]. Serious consequences may result if residents exposed to a disaster or emergency do not evacuate effectively. For example, a stampede occurred in Shanghai Bund in 31 December 2014, which resulted in 36 people died and 49 people injured [4]. To mitigate the adverse effects of emergencies on urban residents, better evacuation planning is critical in emergency management [5].
In general, an emergency evacuation can be considered as a traditional routing problem. Many improved classical algorithms have been proposed to solve this problem, for example, Depth-First-Search algorithm [6], dynamic programming [7], Dijkstra’s algorithm [8] and ant colony optimization [9]. However, human evacuation is a complex process. Aforementioned algorithms have no considerations for factors such as psychology, age and human relations, which have significant impacts on an evacuation. At present, researchers generally use the computer models to simulate the evacuation processes. Isobe et al. [10] carried out a walking simulation and found that human behaviors in evacuation were obviously different owing to different environment. Yang et al. [11] used a computer simulation to find that the human-flow confluence occurred in stairs during evacuation, which can influence the whole evacuation process. Helbing’s Social force model [12] and Adler’s Cellular automata model [13] were applied in evacuation simulation widely. The simulation can show the whole procedure of an emergency evacuation. Yu et al. [1] developed a model which integrated multi-agent system and multi-criteria evaluation for spatial allocation of urban emergency shelters. A case study in Jing’an District, Shanghai, China was conducted to demonstrate the feasibility of the model. New shelters were spatially allocated and a detailed recommended plan of shelters and related facilities was generated. However, these studies were restricted to a number of limited scenes, such as office building, subway, factory building or other single buildings. They did not include outdoor situations and evacuation processes. In addition, most studies just presented the dynamic processes of evacuation. There is a lack of analysis and comparison of different scenarios for further evacuation management optimization.
Considering the limitation of the existing studies literature, this paper presents a new framework of emergency evacuation simulation and management optimization. The framework takes account of family behaviors and integrates indoor and outdoor evacuation simulation. Through analyzing the evacuation simulation process, it can easily present spatial analysis and statistics results, such as evacuation time, cumulative number of people on roads, easy-crowded stairways and easy-congested road sections. Moreover, comparisons between different scenarios are also provided in the framework. With such a multi-level analysis of evacuation simulation results, the framework can provide detailed management optimization measures of emergency evacuation for improving the efficiency of evacuation and reducing evacuation risks. A case study in Changhongfang Residential Community, Xuhui District, Shanghai, China, is conducted to demonstrate the feasibility and applicability of the framework.
2. The Framework
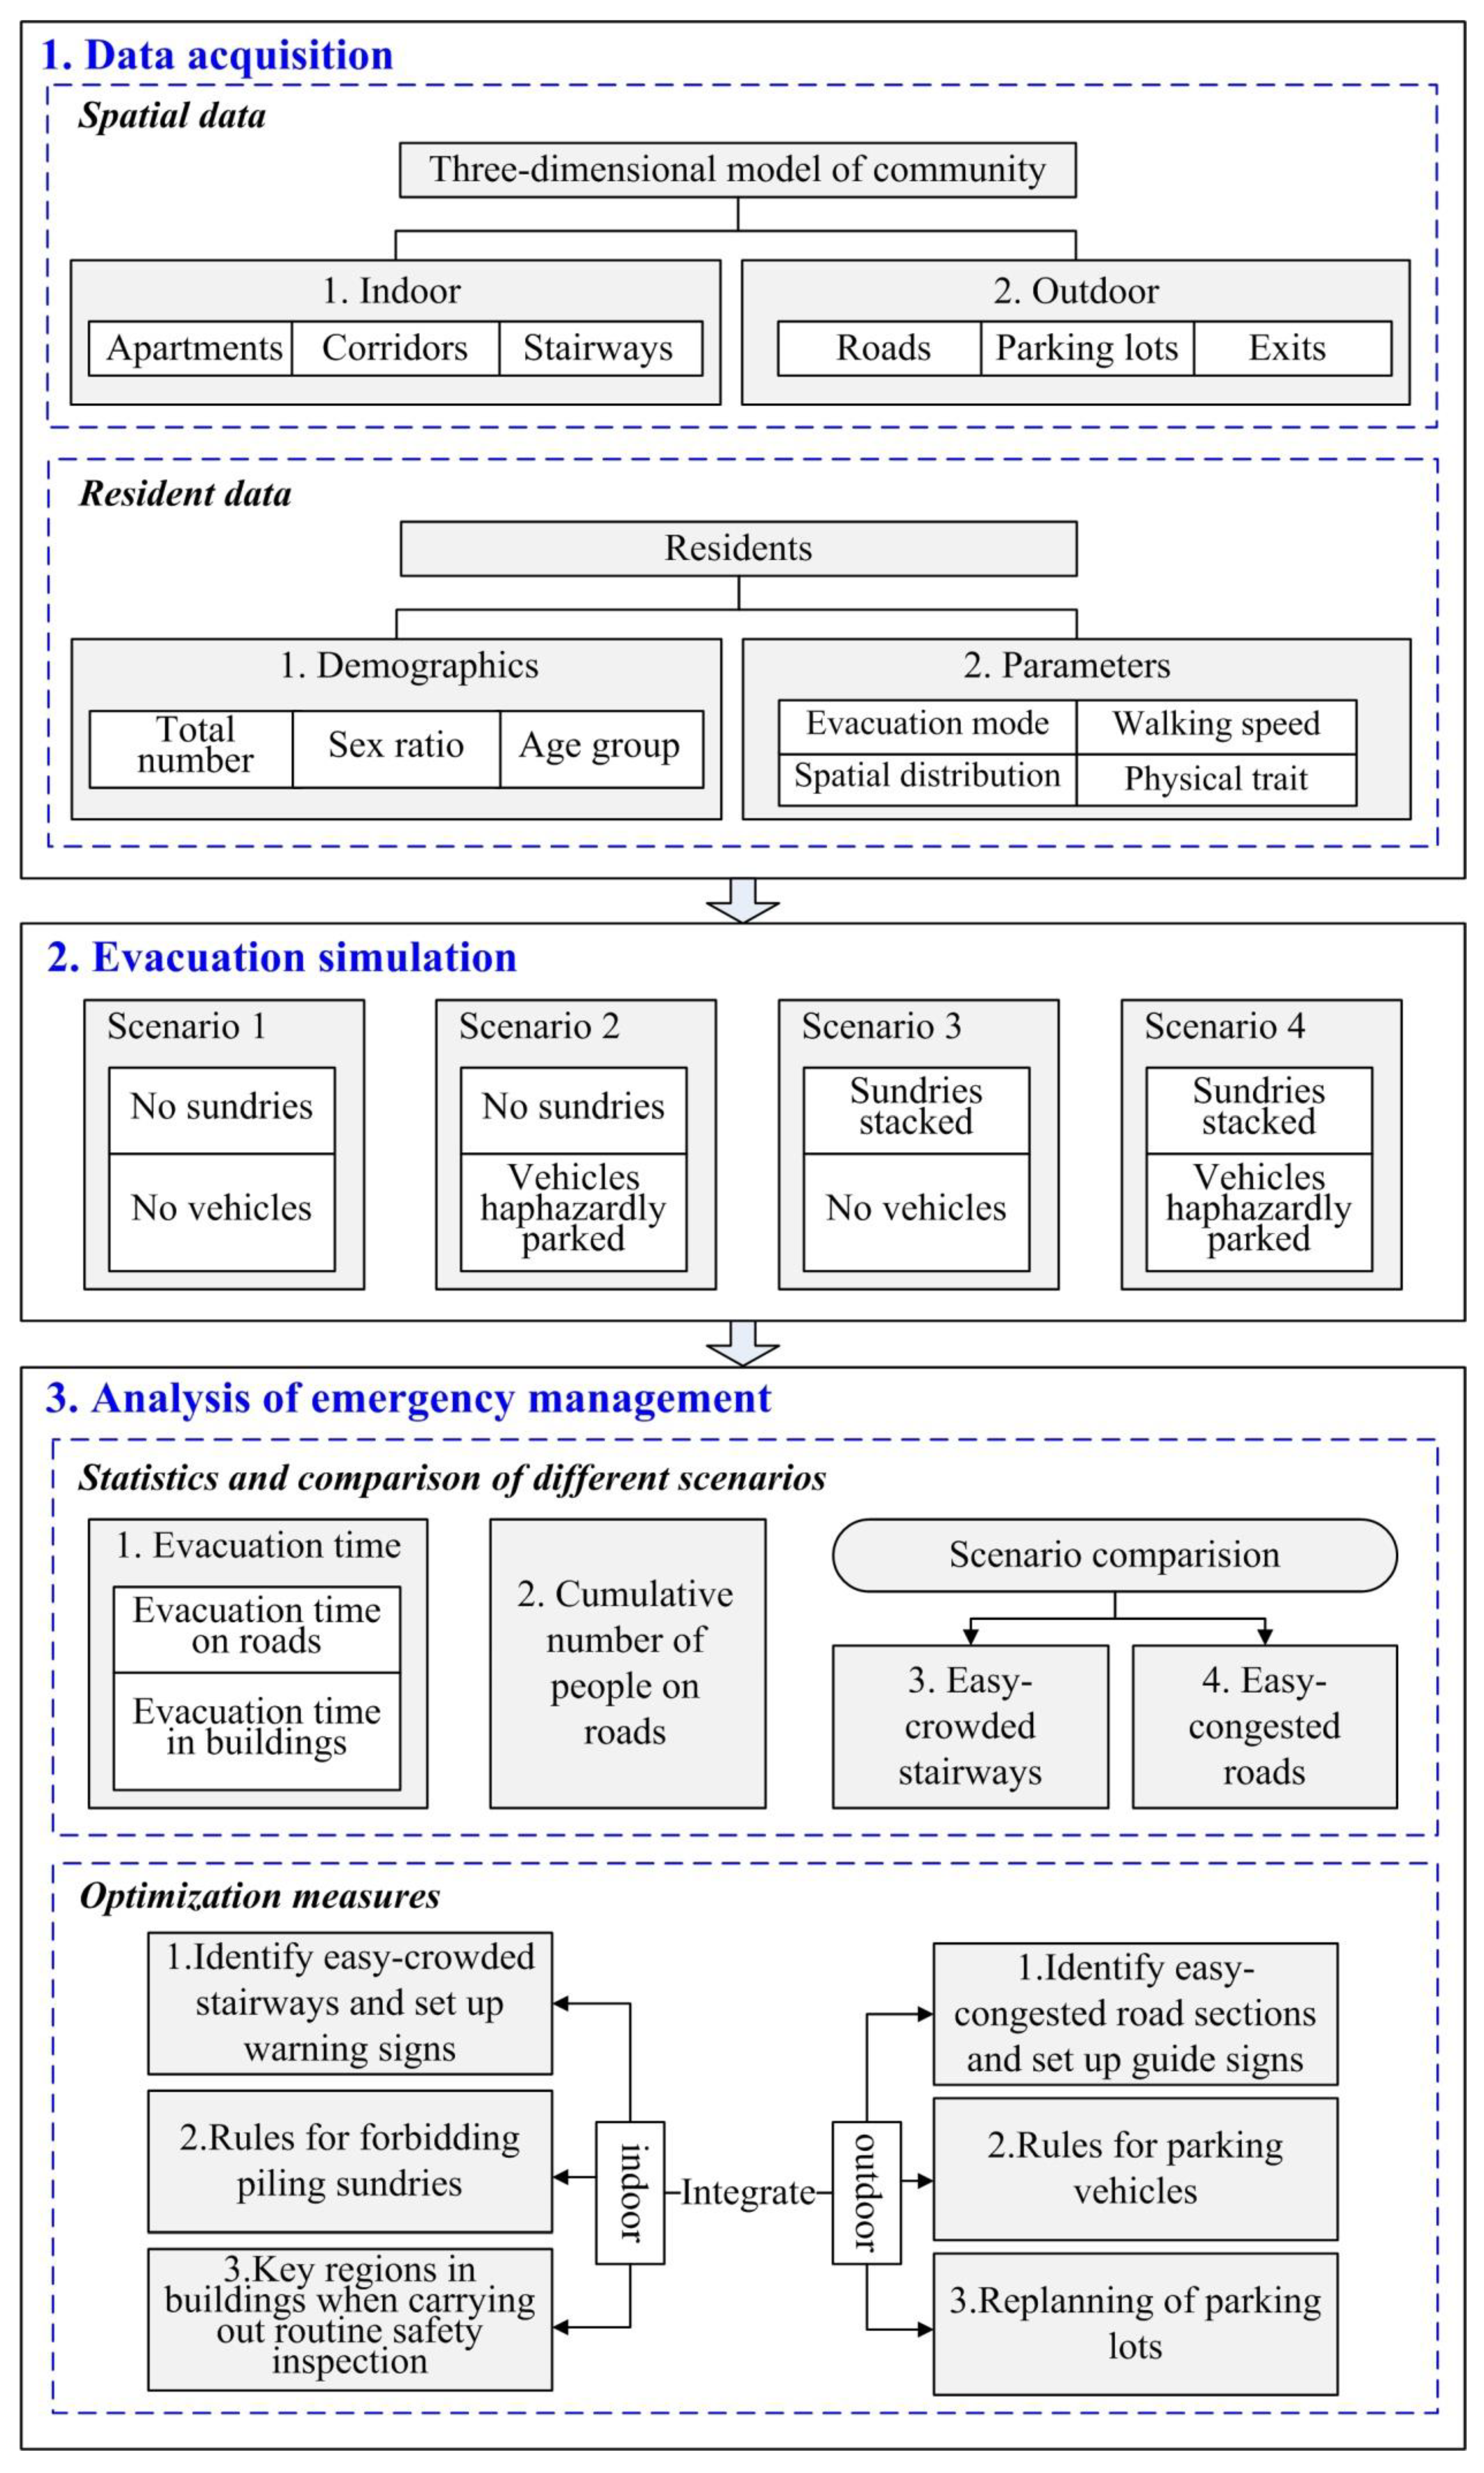
The proposed method in this paper is a new evacuation simulation method for optimizing emergency management in urban residential communities. It can be implemented as follows. Firstly, spatial data and resident data of residential communities are collected to establish the indoor and outdoor three-dimensional evacuation space. Secondly, major obstacles during evacuation are identified and scenarios are set up for evacuation simulation. With the evacuation simulations and comparison of different scenarios, statistical results can be obtained, such as easy-crowded stairways and easy-congested roads. Finally, analyzing the statistical results and revealing the potential problems in emergency managements, detailed optimization measures are spatially described on maps to help making better emergency managements for the community. After taking these measures, residents in communities can be evacuated more quickly and securely in disasters or emergency events.
Figure 1 illustrates the proposed framework, which integrates a simulation procedure of residential communities under different scenarios, and emergency management optimization. The framework includes three modules as follows.
2.1. Data Acquisition
2.1.1. Spatial Data
Two types of spatial data, building data and road data, are the basics of simulation in the framework (Figure 1). Building data contain apartments, corridors and stairways, which are the vital segments of indoor evacuation simulation and can be obtained by on-the-spot investigation or design drawings from the property companies. Road data include roads in residential community, parking lots and exits, which are pivotal sections of outdoor evacuation simulation and can be acquired by interpreting remote sensing images or images captured by an unmanned aerial vehicle.
A complete evacuation simulation of a residential community is ended when all the residents reach the safe zone. In general, a safe zone is an area which is not affected by a disaster or emergency event [14]. In this paper, the safe area is set as the outside area of a community, which means the whole simulation will be completed when all the residents go out from the exits of the community.
2.1.2. Resident Data
Resident data contain demographic data and characteristics of different residents.
The population in residential communities is markedly different from those in public spaces such as office buildings or subways. Residents in communities have their private space. The number, sex ratio and age structure of residents have significant influence on evacuation simulation results. Therefore, detailed demographic data is necessary. Demographic data can be obtained from the property companies or census data of the community. The data must include important factors, such as the total number, the sex ratio and the age group of residents.
In a process of emergency evacuation at a community scale, walking is the main evacuation method. When people are in evacuation, their behavioral characteristics have a direct impact on the evacuation process. To accurately simulate the evacuation process and predict the evacuation time in communities, it is necessary to analyze residents’ behavioral characteristics during emergencies. In this paper, four behavioral characteristics of residents are proposed as follows:
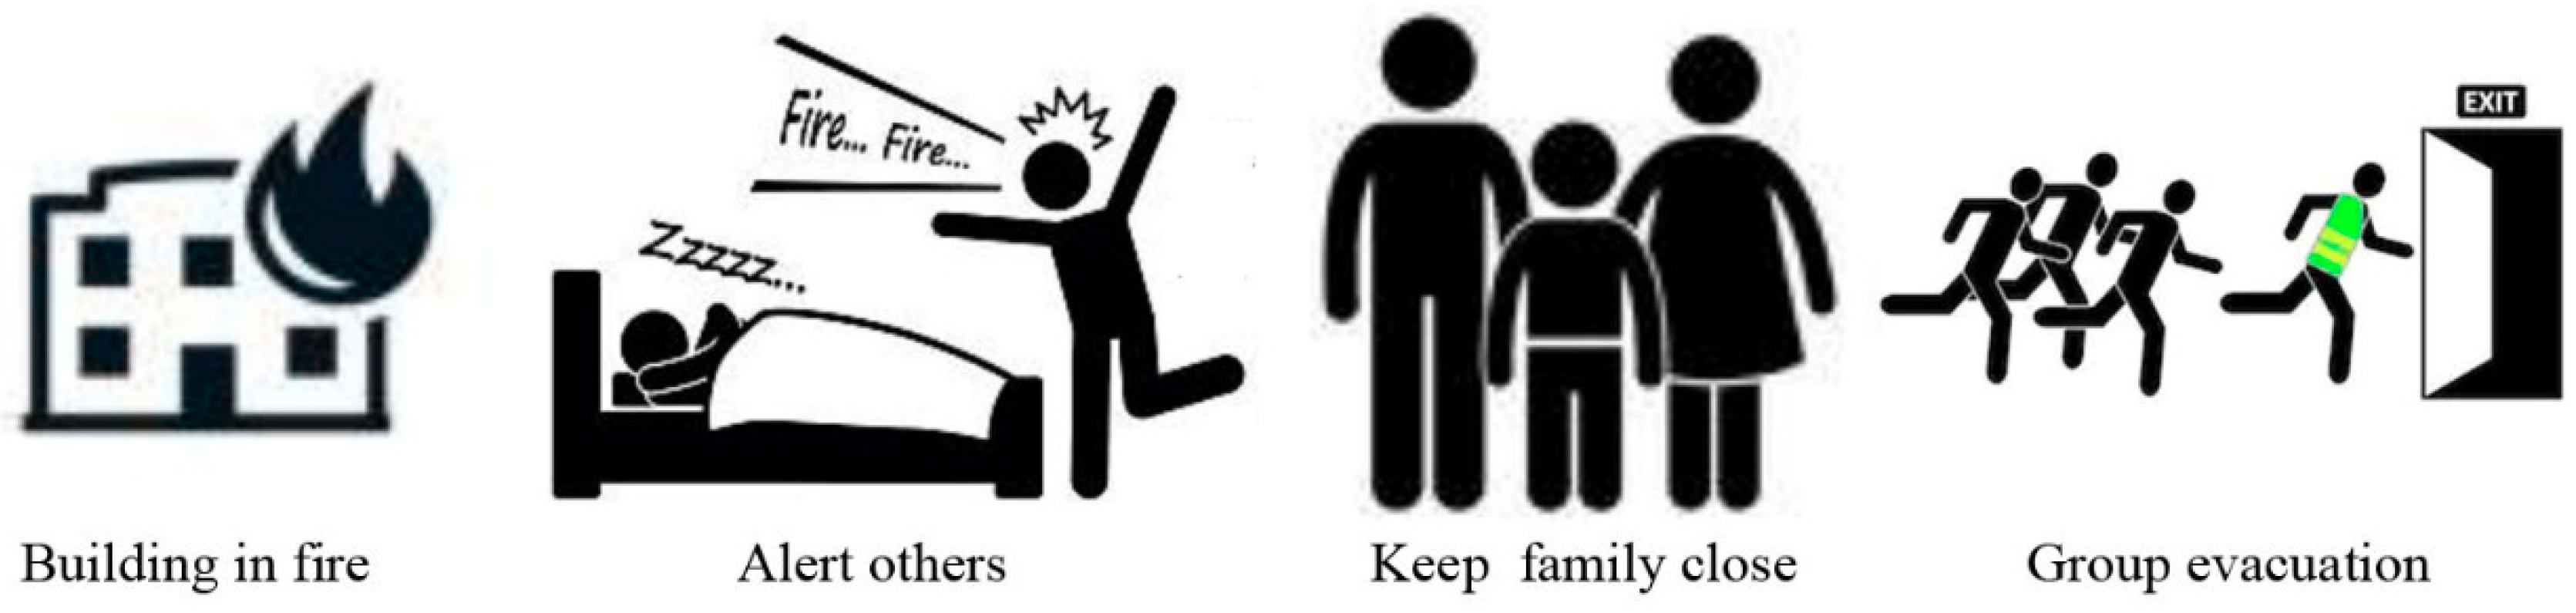
a. Evacuation mode: Families in communities are special groups that depend on family relationships. A family is a group of people united by marriage, blood, or adoption [15]. A member in a family trusts each other, and has a high degree of dependence and strong sense of responsibility and cohesion. Consequently, in an emergency event, residents are less likely to run alone without their family members. They will evacuate their home after all family members getting together. Such behavior is called “family teamwork mode” [16], which is a specific evacuation mode just for resident evacuation.
b. Walking speed: The evacuation capabilities of residents varies due to differences in gender, age, and physical conditions. When setting the simulation parameters in evacuation simulation, the difference is reflected by the walking speed in evacuation. The workload is quite heavy if analyzing the behavior and estimate the walking speed of each resident. Therefore, in this study, the walking speeds of residents are classified in accord with the age and gender group to simplify the task of walking speed setting.
c. Spatial distribution: The spatial distribution of residents in buildings has a great influence on evacuation results. However, the detailed information of residents of each household in communities is kept confidentially. It is not easy to obtain the household data of residents by investigating property companies or conducting field surveys. Therefore, the spatial distribution of residents in communities can only be acquired by other data sources, such as demographic data and reasonable estimation methods of population in buildings [17].
What needs to be further clarified is that our proposed method relies on the ultra-detailed micro-scale data for the characterization of buildings and residents. In studies which is involving larger urban areas, these data are usually not easily available for large areas and then the applicability of the model may be limited only to small communities. For larger scale studies, we suggest possible partial solutions with some simplifying assumptions to downscale census data regarding both population and building features (where available), as shown for instance in Molinari and Scorzini (2017) [18] and Yu et al. (2018) [1].
d. Physical trait: A resident in a building occupies a certain area at the beginning of evacuation. At that time, the resident is in a static state. The given area is called “pedestrian static space” [19], which means the vertical projection area of the body of this resident. Shoulder width determines the vertical projection area of a resident in emergency evacuation. The shoulder widths of residents vary according to age and gender. It is necessary to obtain the shoulder width of residents depend on body measurement or experiential data of previous studies. When a resident moves, in order to maintain a certain speed of movement, the resident must keep a certain distance from the surrounding environment. Therefore, the space which a resident really needs is called “pedestrian dynamic space” [19], which is a larger space than the vertical projection area of the resident.
2.2. Scenario Developing and Evacuation Simulation
After acquiring spatial data and resident data, the evacuation process can be simulated to show the whole dynamic process of residents’ evacuation from rooms in buildings to the exits of a community.
2.2.1. Scenario Development
The spatial distribution, walking speeds and physical traits of residents may affect the evacuation time. Meanwhile, unreasonable management problems in a community also have a great negative impact on evacuation efficiency. To quantitatively analyze the impact of the management problems on evacuation process, this framework develops four different scenarios for evacuation simulations. These scenarios are relative to two representative unreasonable management problems in communities: (1) sundries stacked on stairways, and (2) vehicles haphazardly parked on roads.
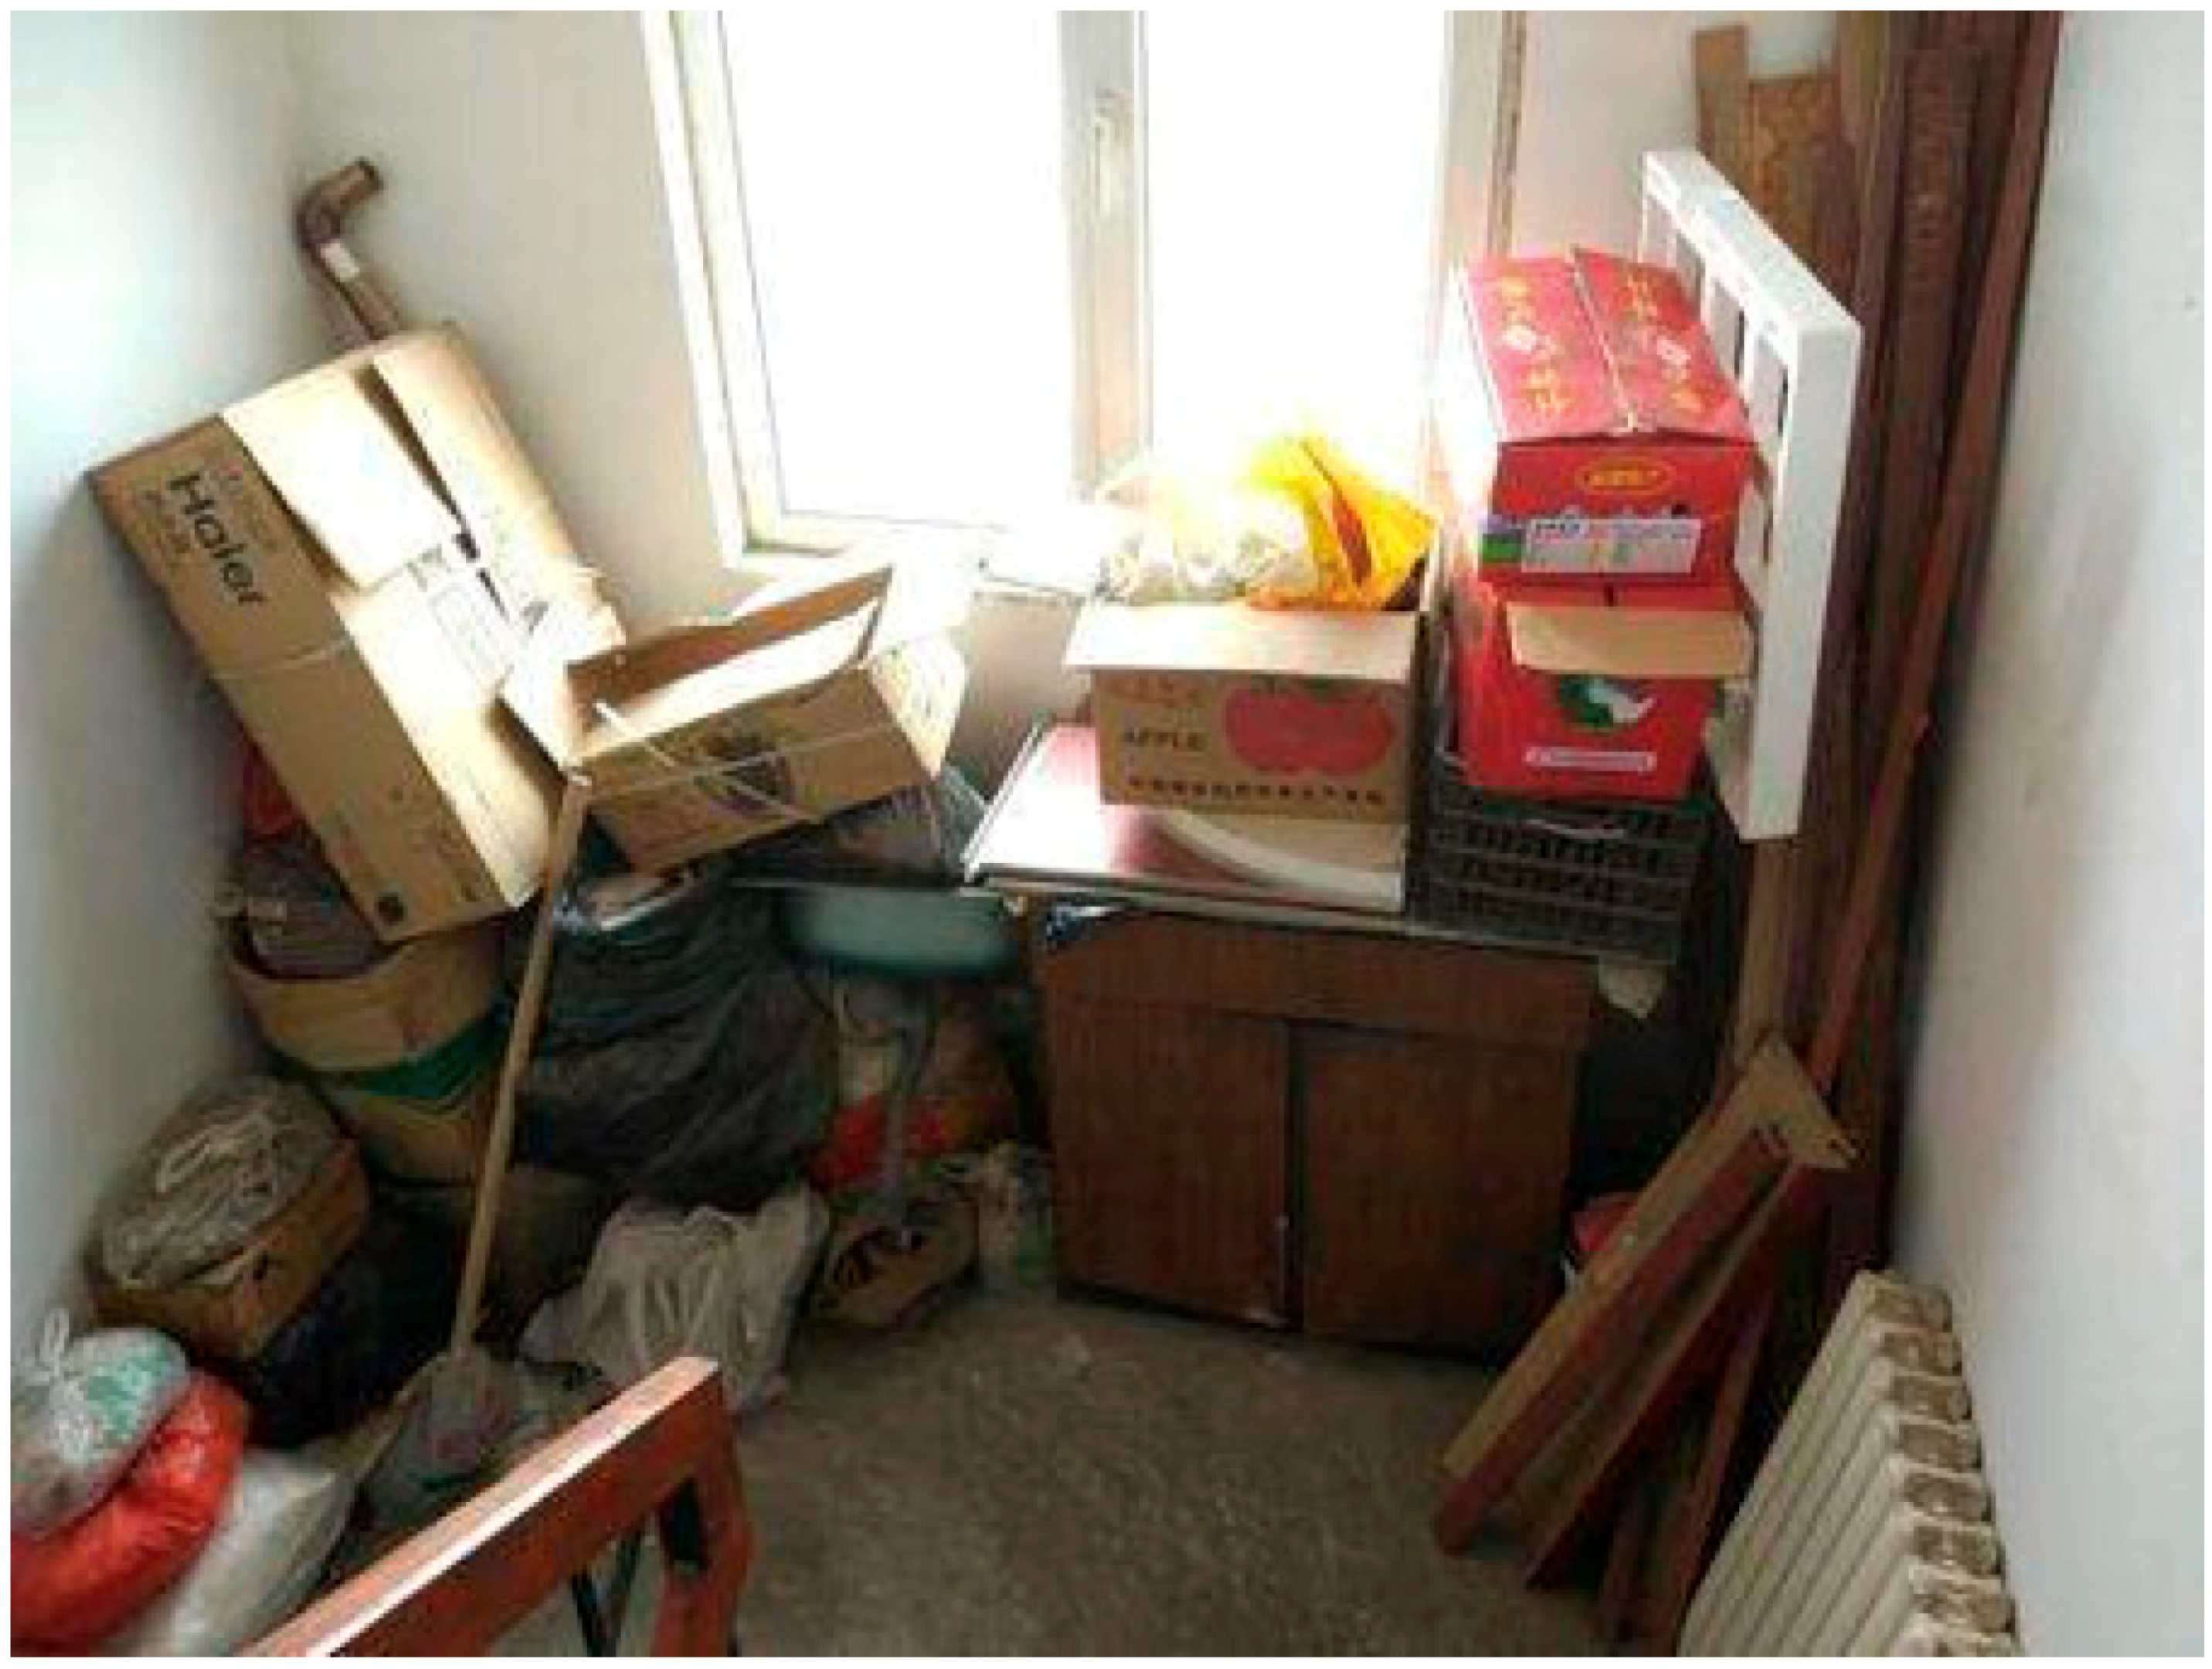
Sundries on stairways are personal items which are piled up by residents on stairs of buildings. Sundries include wood products, cotton fabrics, paper products and other combustibles. Stairways of residential buildings are the only passageways for residents. Sundries on stairways block the way to exit of a building and may also cause potential safety hazards. Under a state of an emergency event, such as a fire, sundries on stairways can seriously affect the evacuation process of residents. In February 17, 2017, a fire caused by sundries occurred in a residential community, Wuxi City, Jiangsu Province, China. Six people were trapped because of the sundries on stairways [20]. In January 11, 2013, a fire broke out in a residential building in Dalian City, Liaoning Province, China. A woman and her daughter were stumbled by sundries and were badly injured during their evacuation [21]. Stacking sundries on the stairways in the buildings of Changhongfang community is also very common. As shown in Figure 2, the sundries occupy more than half of the area of the passage. When an emergency event happens, such stacked sundries will inevitably and severely affect the evacuation of residents.
Judging from the authentic cases above, once an emergency happens, the existence of sundries on stairways will directly threaten the safety of the residents in the buildings during evacuation.
With the increasing usage of cars in old residential communities in cities, the problem of haphazardly parked vehicles on roads in residential areas is intensifying. In case of an emergency, especially a fire hazard, if the roads are blocked, it will directly affect the evacuation efficiency of residents and stop the firefighters and fire engine from entering the community.
The reason why the above two kinds of problems must be avoided in evacuation management can be further illustrated by the reports of some emergency events as follows:
The first report is of a huge fire that broke out in a residential area in Xigang District, Dalian City, China in 11 January 2013 [22]. The fire broke out on the stairway, and one woman and her daughter were stumbled by stacked sundries in evacuation and were badly burned. Another similar report is a fire caused by garbage which occurred in Luqu primary school, Jiangsu Province, China in 17 February 2017. Six people were trapped because of sundries in a burning building [23]. The other two reports are relative to road occupation by parked vehicles. At 9 pm on 14 March 2018, a fire broke out on the first floor of a unit building of a community in Hefei City, China. The fire engines were unable to enter the community because of the disorderly parking of the vehicles. The fire was burned from the first floor to the third floor, causing great losses [24]. Another fire event which caused in a residential community in Haidian District, Beijing, China was characterized by a similar situation, with the fire engine blocked outside the community because of the occupation of fire passages [25].
Judging from the above reports, it could be found that crucial stairways of residential buildings and roads in residential areas must be unobstructed in emergency events. If they were blocked by sundries or vehicles, the residents’ evacuation process will be seriously hampered. Therefore, to find out the crucial parts of stairways and roads in residential communities, this study develops four scenarios for evacuation simulations in Figure 1.
In Figure 1, Scenario 1 is an ideal situation which can be compared with other scenarios to estimate the influence degree of stacked sundries and haphazardly parked vehicles. Scenario 2 mainly shows the influence of haphazardly parked vehicles to the evacuation process. Scenario 3 demonstrates the influence of stacked sundries to the evacuation process. Scenario 4 is a reality situation, which can illustrate the influence of both stacked sundries and haphazardly parked vehicles to the evacuation procedure.
2.2.2. Evacuation Simulation
There are mainly two kinds of evacuation simulation software: commercial evacuation simulation software, such as Pathfinder, STEPS and open source evacuation simulation software, such as Repast, NetLogo, Swarm [26]. These software products have been widely utilized in evacuation simulation and disaster prevention. Wang et al. [27] used Pathfinder software to establish a high-rise building evacuation model in fire scene. Li et al. [28] utilized STEPS to calculate the required safe evacuation time under different conditions in a subway transfer station. Mas et al. [29] applied Netlogo to develop an evacuation model under Tsunami hazard in La Punta, Peru. The model can support decision-making in disaster management and disaster prevention education. Ren et al. [30] made use of Repast software to conduct crowd evacuations for emergency response under a fire. Yang et al. [31] utilized Swarm platform to build the individual movement model under an emergency evacuation. Because it is not an easy task to develop an evacuation model from scratch, the aforementioned software products can greatly improve the modeling and simulation efficiency of evacuation researches.
Table 1, Table 2 and Table 3 provide the comparison of the most representative five kinds of evacuation simulation software: STEPS, Pathfinder, Netlogo, Swarm and Repast. The STEPS software is based on cellular automata model. It can provide a fully 3D modelling environment [32]. However, the cellular automata model in STEPS has simple evacuation rules, low intelligence degree and the evacuation behaviors are not completely consistent with reality [33]. In contrast, in an Agent-based model such as Pathfinder, an individual has various attributes and a complete set of walking rules and collision-avoiding mechanism between this individual and others or obstructions. Although NetLogo, Swarm or Repast use the programming language to support programming function [34], it can only simulate evacuation process in 2D environment. With the comparison of the characteristics of this software, Pathfinder can provide 3D UI and its available material, rules and type of agent are specialized for evacuation. Therefore, Pathfinder software is utilized in this study to conduct the evacuation simulation. Pathfinder is an agent-based emergency egress and human movement simulator. It provides a graphical user interface for simulation design and execution as well as 2D and 3D visualization tools for simulation result analysis. Pathfinder uses a 3D geometry model. Within this geometric model, a continuous 2D triangulated surface referred to as a “navigation mesh.” The “navigation mesh” is an irregular one-sided surface represented by adjacent triangles. Resident’s movement takes place on this navigation mesh.
To generate evacuation paths, Pathfinder uses the A* search algorithm [36] and the triangulated navigation mesh. The resulting path is represented as a series of points on edges of mesh triangles. These points generated from A* create a jagged path to the destination of the resident.
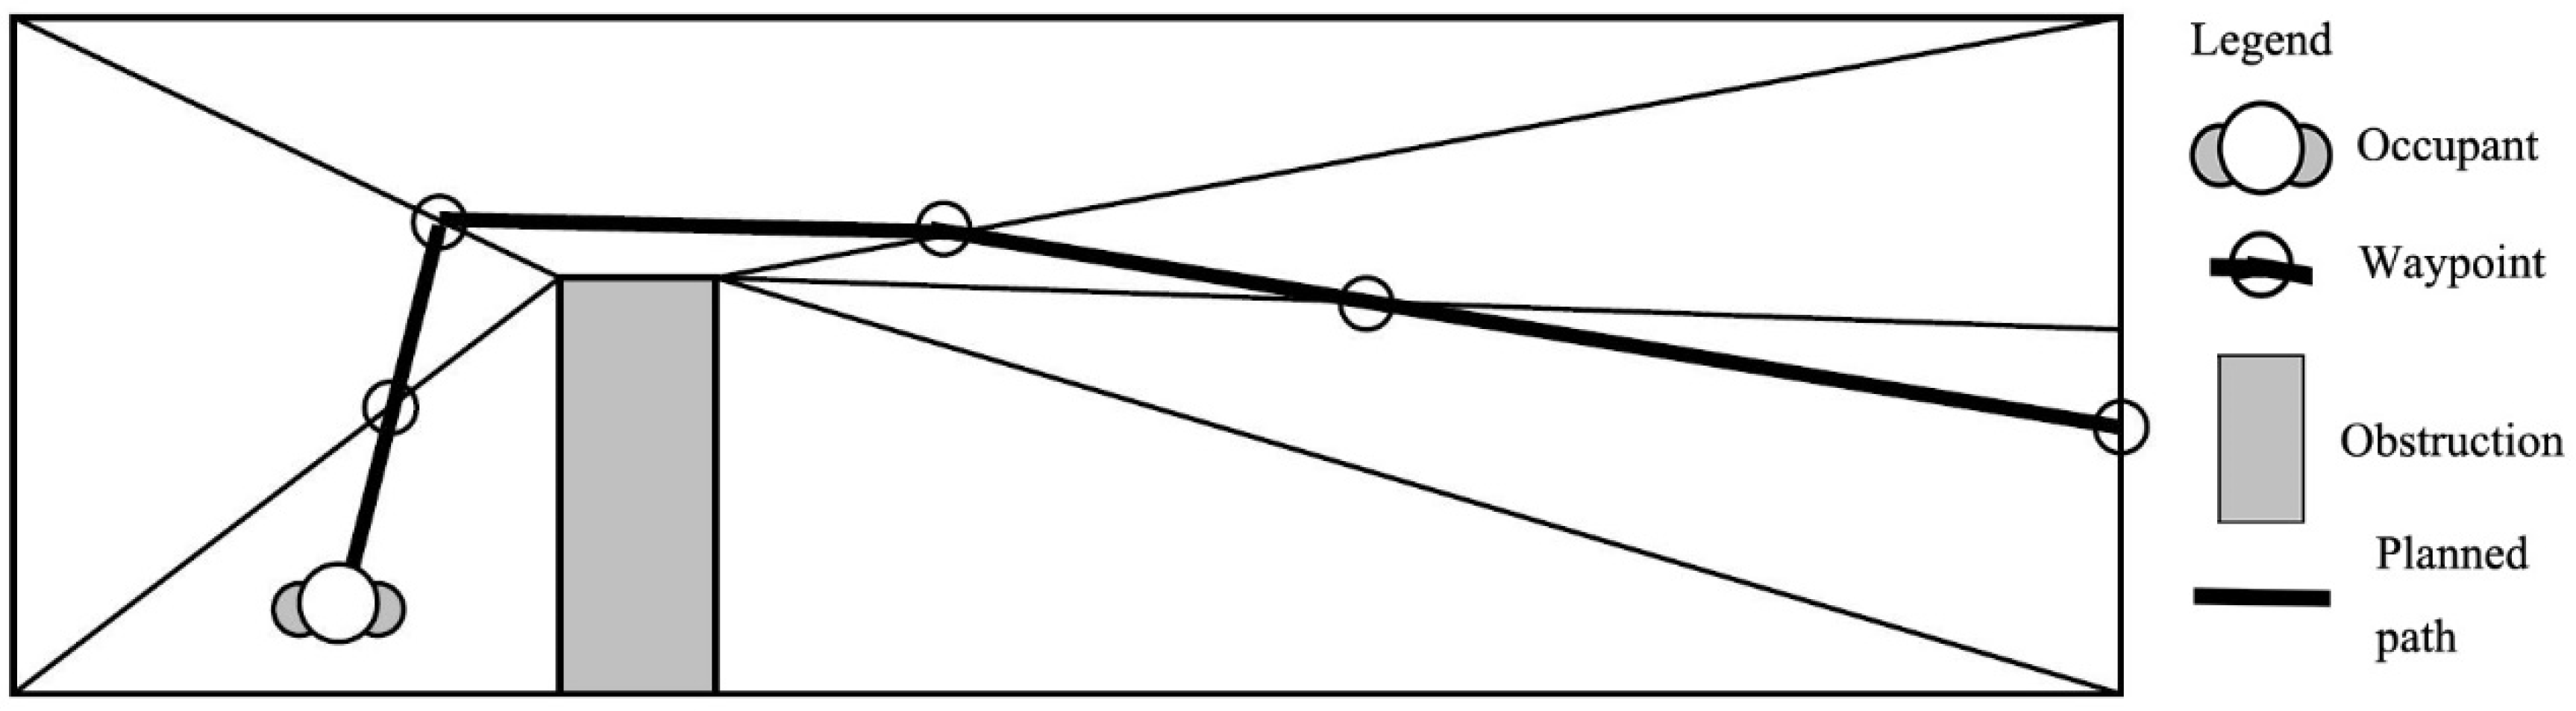
The walking path of a resident will bend when this resident meets obstructions. In order to avoid the collision between the resident and the obstructions, the path remains at least a minimum distance away from those obstructions. The minimum distance is the shoulder width of the resident. Examples of these points, called waypoints, are shown in Figure 3, which depicts the projected path. This figure shows the projected path of a resident in a simple rectangular room. The resident stands in the lower-left corner of the room and plans to walk to the lower-right corner. The navigation mesh is represented by the thin lines that form triangles inside the rectangular area. An obstruction prevents the resident from walking straight to the destination. The planned path of the resident is shown in Figure 3 as the dark line and the waypoints are shown as the small circles. A waypoint is generated for each edge that intersects the path. Once these waypoints are found, Pathfinder removes intermediate points that lie between two waypoints in a straight line. This creates a series of waypoints only where the directions of walking change.
After the paths are obtained, residents can respond to a changing environment. Pathfinder can define four steering behaviors: seek, separate, avoid walls, and avoid other residents.
To use Pathfinder software, users should sign up for a trial evaluation or purchase a license to receive an email containing a link to download Pathfinder:
URL for trial evaluation:
URL for a license: https://www.thunderheadeng.com/pathfinder/pathfinder-licensing/
2.3. Analysis of Emergency Management
In this section, statistics results of simulation include evacuation time, cumulative number of people on roads, easy-crowed stairways and easy-congested roads under four scenarios are discussed. According to the statistics results, optimization measures of emergency management can be proposed to improve evacuation efficiency.
2.3.1. Statistics and Comparison of Different Scenarios
When an emergency occurs, there are many different factors that can cause casualties and losses. To minimize the casualties, ensuring the safe evacuation of people is the most important prerequisite for firefighting design, and the most important criterion in fire safety is the evacuation time [37]. In this section, the evacuation time is an important indicator of evacuation effectiveness, which includes the evacuation time on road and evacuation time in building. Both of them can be obtained from the emergency evacuation simulation result. Moreover, evacuation time in building can be compared with prescribed time made by fire prevention standard for building design, such as the Architectural Design Code for Fire Protection of China [38] which stipulates that the allowable time for safe evacuation of general residential buildings should be less than 6 minutes.
The cumulative number of people on roads represents the number of residents who have passed the roads during the entire evacuation process. When residents are evacuated under emergencies, they are more accustomed to finding familiar roads for evacuation. The cumulative number of people on roads quantifies the abstract concept of people’s familiarity with roads. Roads with more cumulative number of people have higher congestion possibility.
Easily-crowded stairways can be analyzed by comparison with different distribution of stacked sundries in buildings. For different floors in a building, distributions of stacked sundries were generated. The evacuation simulations can be executed on the basis of different distributions of stacked sundries to find the stairways on which the evacuation process is most affected. In this study, easy-crowded stairways are analyzed by Scenario 3 and Scenario 4.
Easily-congested roads can be analyzed from the different spatial distribution of haphazardly parked vehicles on roads. During the emergency evacuation process, these vehicles may occupy fire-fighting passages, hinder residents’ evacuation and block the entry of fire engines and rescue vehicles. Through field surveys, spatial distribution of haphazardly parked vehicles in a community can be generated. The evacuation simulation can be run on the basis of this spatial distribution to find the road sections on which the evacuation process is most affected. In this study, easy-congested roads are analyzed in Scenario 2 and Scenario 4.
The influences of stacked sundries in stairways and haphazardly parked vehicles on roads to emergency evacuation process can be quantified by the Regional Congestion Index (RCI) in this study. RCI represents the degree of crowdedness/congestion in a specific region in evacuation. It can be estimated in the region by calculating the proportion of people whose speeds reduce more than a specific percentage at a certain moment. The speed reduction rate of a person at the moment can be expressed as:
where VR represents the speed reduction rate, VT represents the real-time speed of a person, Vmax represents the maximum speed of the person during the whole evacuation process. The RCI at this moment can be calculated as follows:
where NPVR represents the number of people with a specific value of the speed reduction rate in the estimated region, NPT represents the total number of people in the region.
2.3.2. Optimization Measures
In this section, optimization measures can be deduced based on the statistics results of simulation in Section 2.3.1, providing a scientific basis to adopt measures to reduce casualties and losses as much as possible.
1. Inside the residential buildings, the following measures need to be undertaken after identifying the easy-crowded stairways:
(1) Set up warning signs:
In emergencies, warning signs can be setup at the location of easy-crowded stairways in buildings to remind residents not to be panic, to slow down and avoid crowding, and to be evacuated orderly.
(2) Establish rules for forbidding piling sundries:
In emergencies, the stairways in buildings are the only evacuation passages for residents. Piling sundries in stairways will hinder the normal use of stairways and increase the possibility of crowdedness. Therefore, it is very necessary to establish rules to remind residents not to pile sundries in the stairways.
(3) Identify key regions in buildings when carrying out routine safety inspection:
Through comparing evacuation simulation results in different scenarios, the key regions/floors in buildings can be found. When carrying out routine safety inspection, they need to be emphatically inspected.
2. On the roads of the community, the following measures need to be taken after identifying the easy-congested roads:
(1) Set guide signs:
The identification of the most proper locations for guide signs is very crucial for improving evacuation efficiency. Guide signs can instruct residents, especially those who are not familiar with the community.
(2) Re-plan parking lots:
In order to avoid the haphazardly parked vehicles on roads caused by inadequate parking plots, property companies need to re-plan the parking lots in the community and make more parking spaces on non-easy-congested roads to meet the parking needs of residents.
(3) Establish rules for parking vehicles:
Once the roads, especially the easy-congested roads, are blocked by private cars, it may make rescue vehicles cannot enter and residents cannot be evacuated effectively. Therefore, rules are necessary to be built to avoid residents parking vehicles on easy-congested roads.
3. Case Study
3.1. Study Area
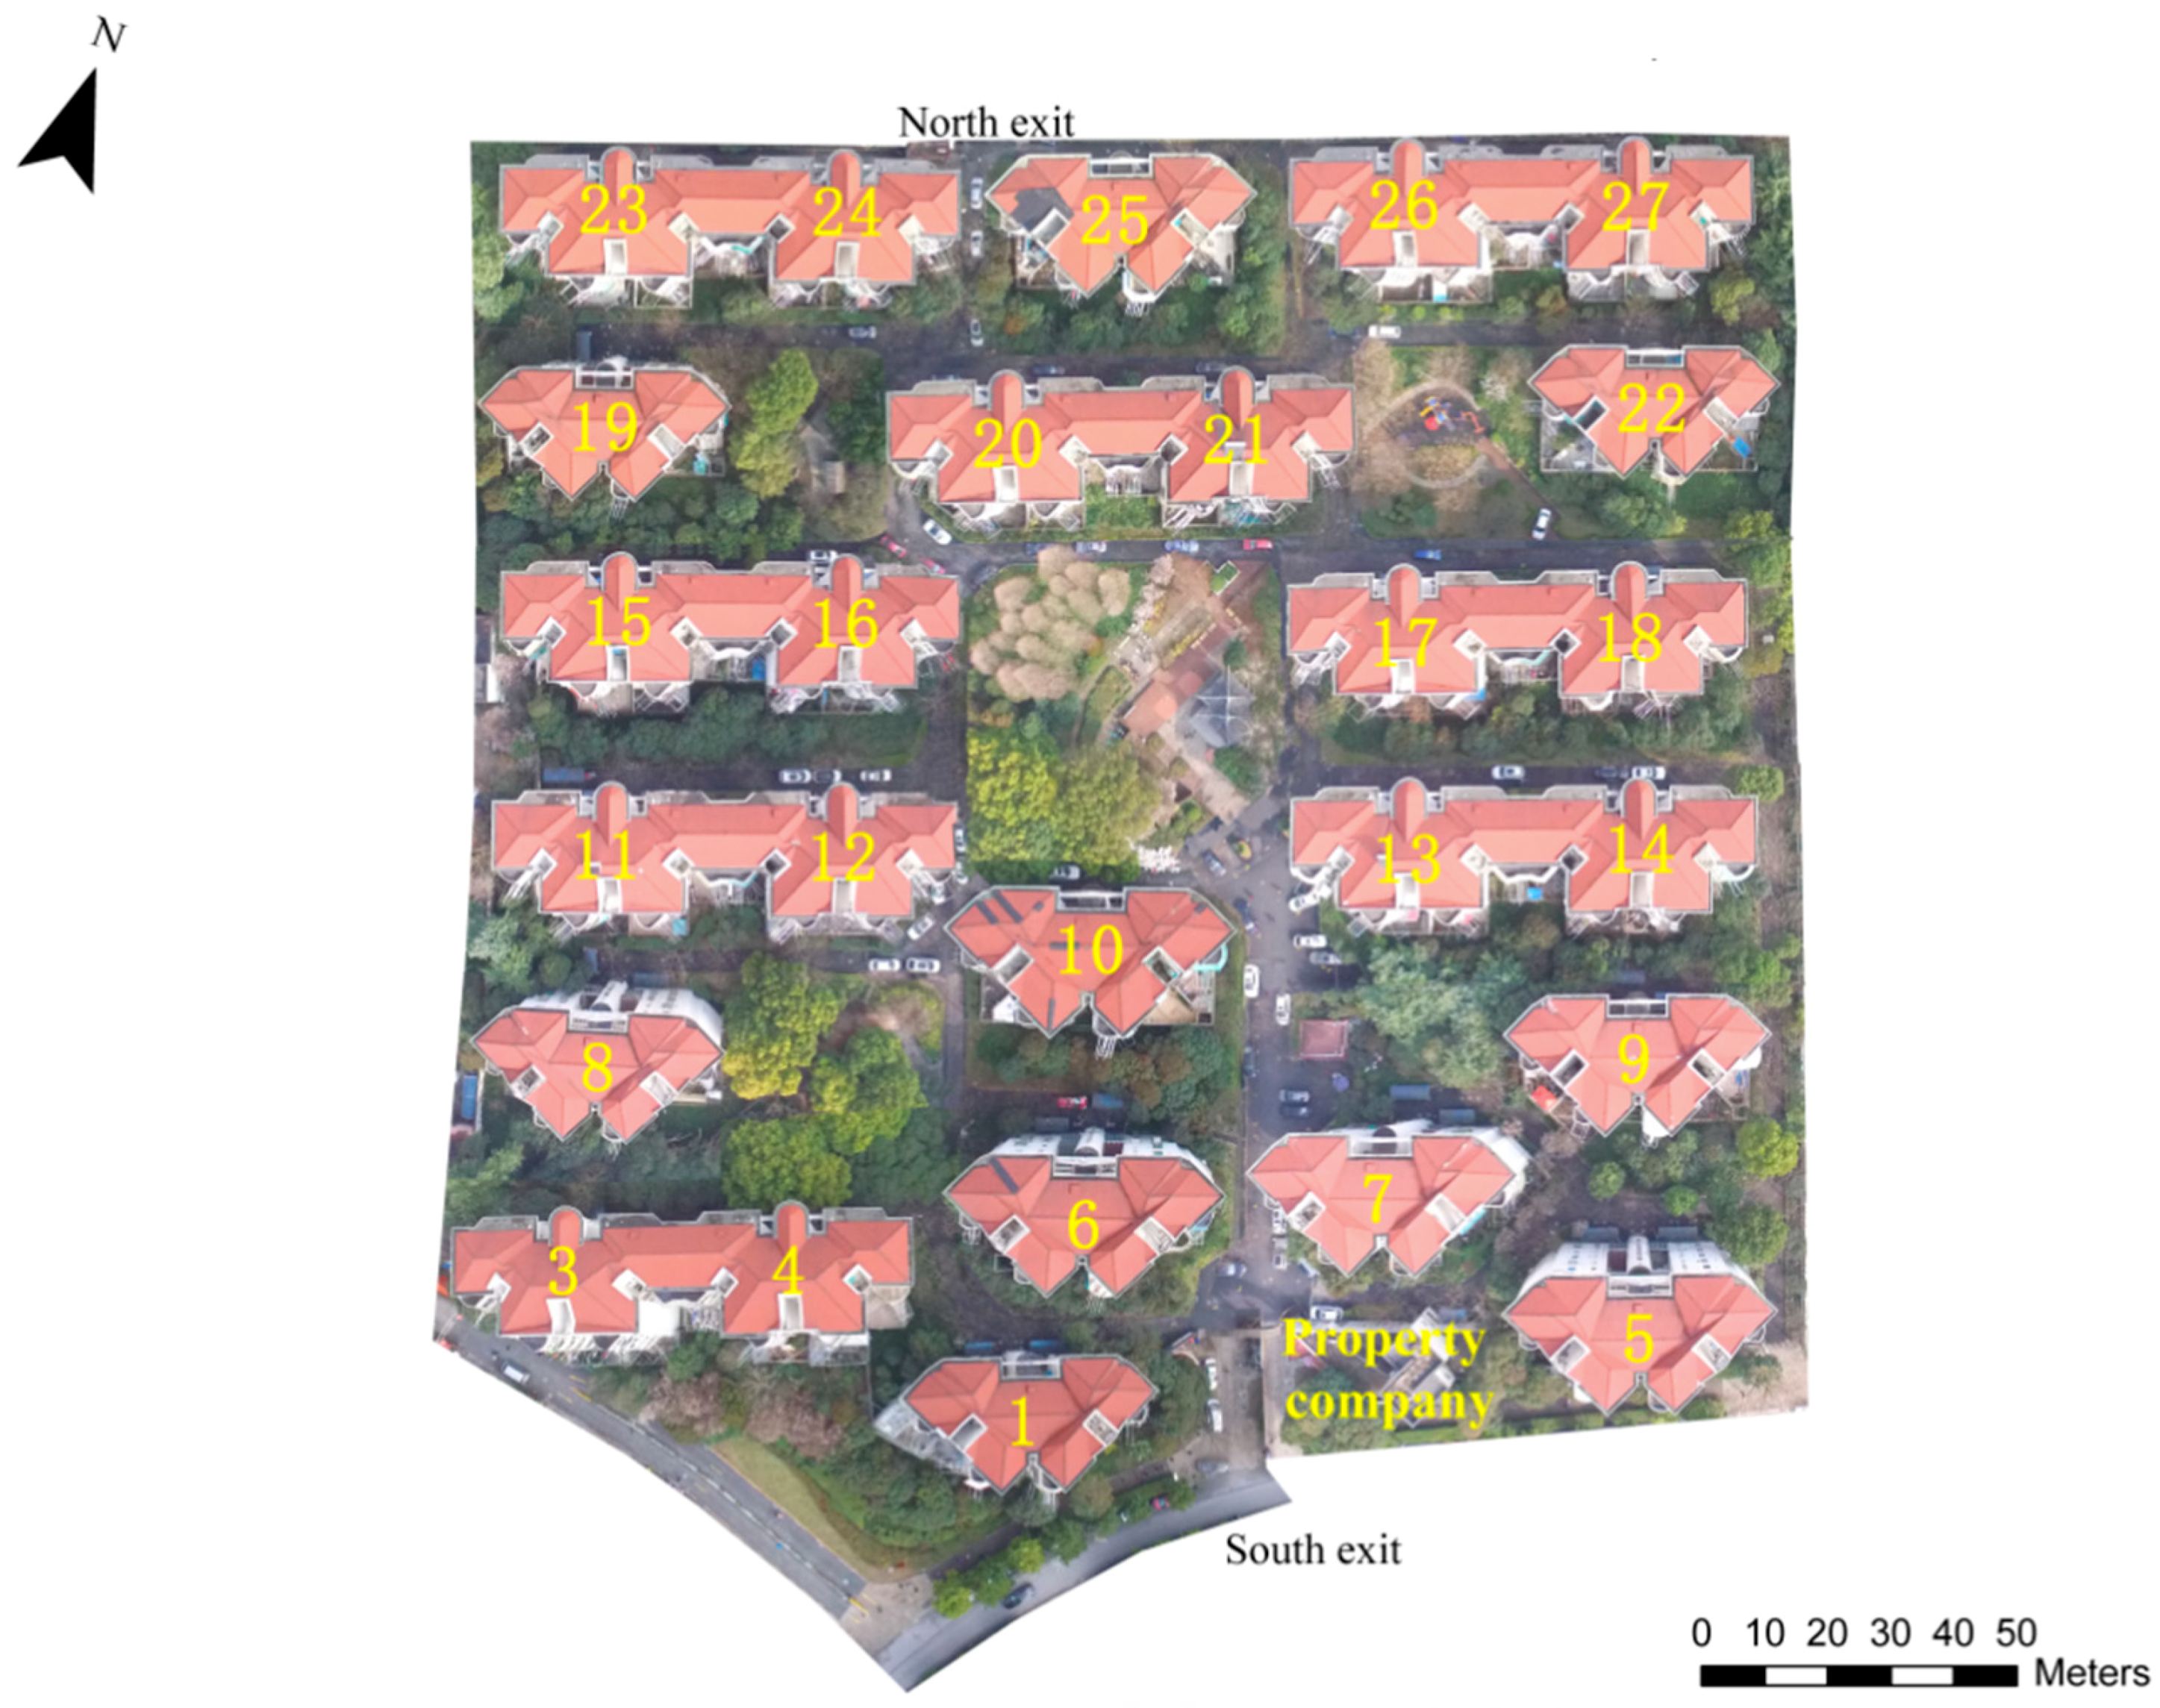
A case study was conducted to illustrate the feasibility of the framework. The study area is located in Changhongfang, a residential community located in Xuhui District, Shanghai, China. Figure 4 is the aerial photo of Changhongfang, which was taken by unmanned aerial vehicle in 2017 with a resolution of 30 cm.
Changhongfang is an old community built in 1991. In 1990s, the private car ownership per capita in Shanghai, China was relatively low. Therefore, there are much fewer parking lots in the communities built in that era than the communities built in recent years. Meanwhile, the stairways of these communities have relative narrow width. Although the Changhongfang community was built only less than 20 years, it is quite different from the communities newly built in recent years. Therefore, it is called “old” community. There are no high-rise buildings in this community, total 18 residential buildings, including 4 four-story buildings, 3 five-story and 11 six-story buildings. Two exits of the community are separately located in the north and south of it. There are 1654 residents in this community, which includes 1495 permanent residents and 159 external residents. In the Changhongfang Community, sundries are often piled in stairways inside the buildings. At present, the community is also facing the plight of the number of parking lots not being able to meet the increasing demand of private cars. The contemporary situation of the study area is suitable for our case study.
3.2. Spatial Data for Simulation
3.2.1. Layout Data of the Community
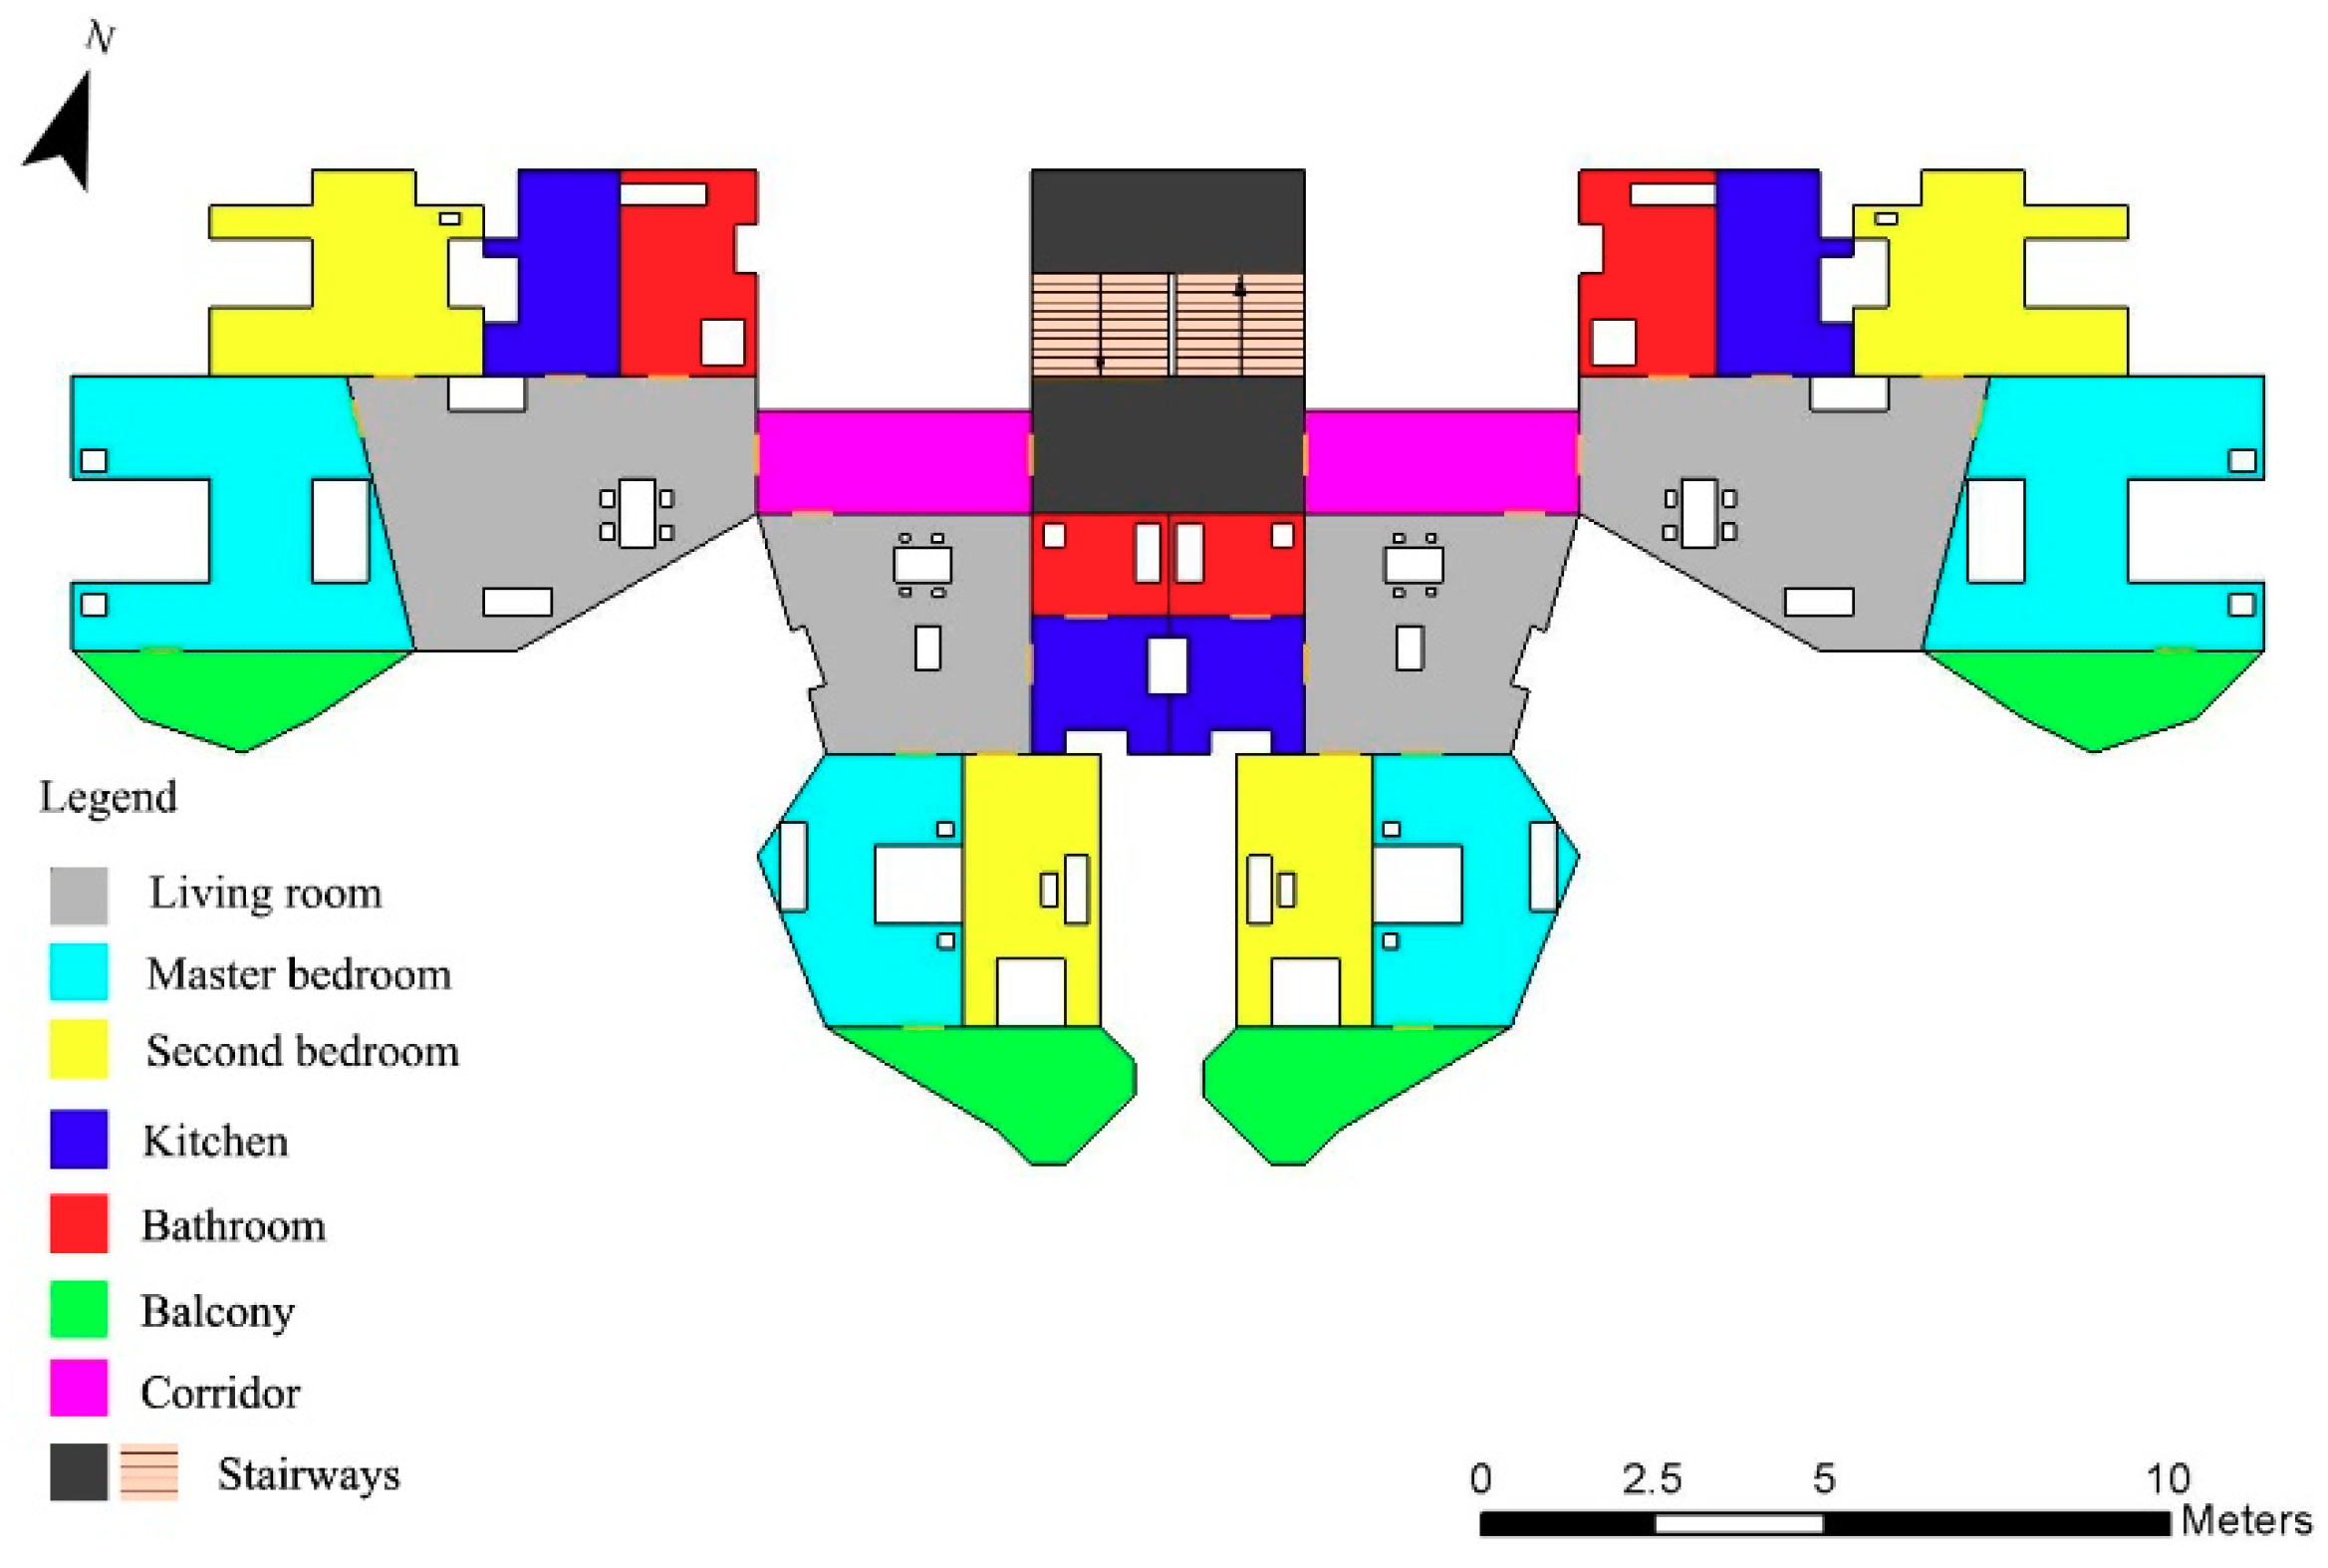
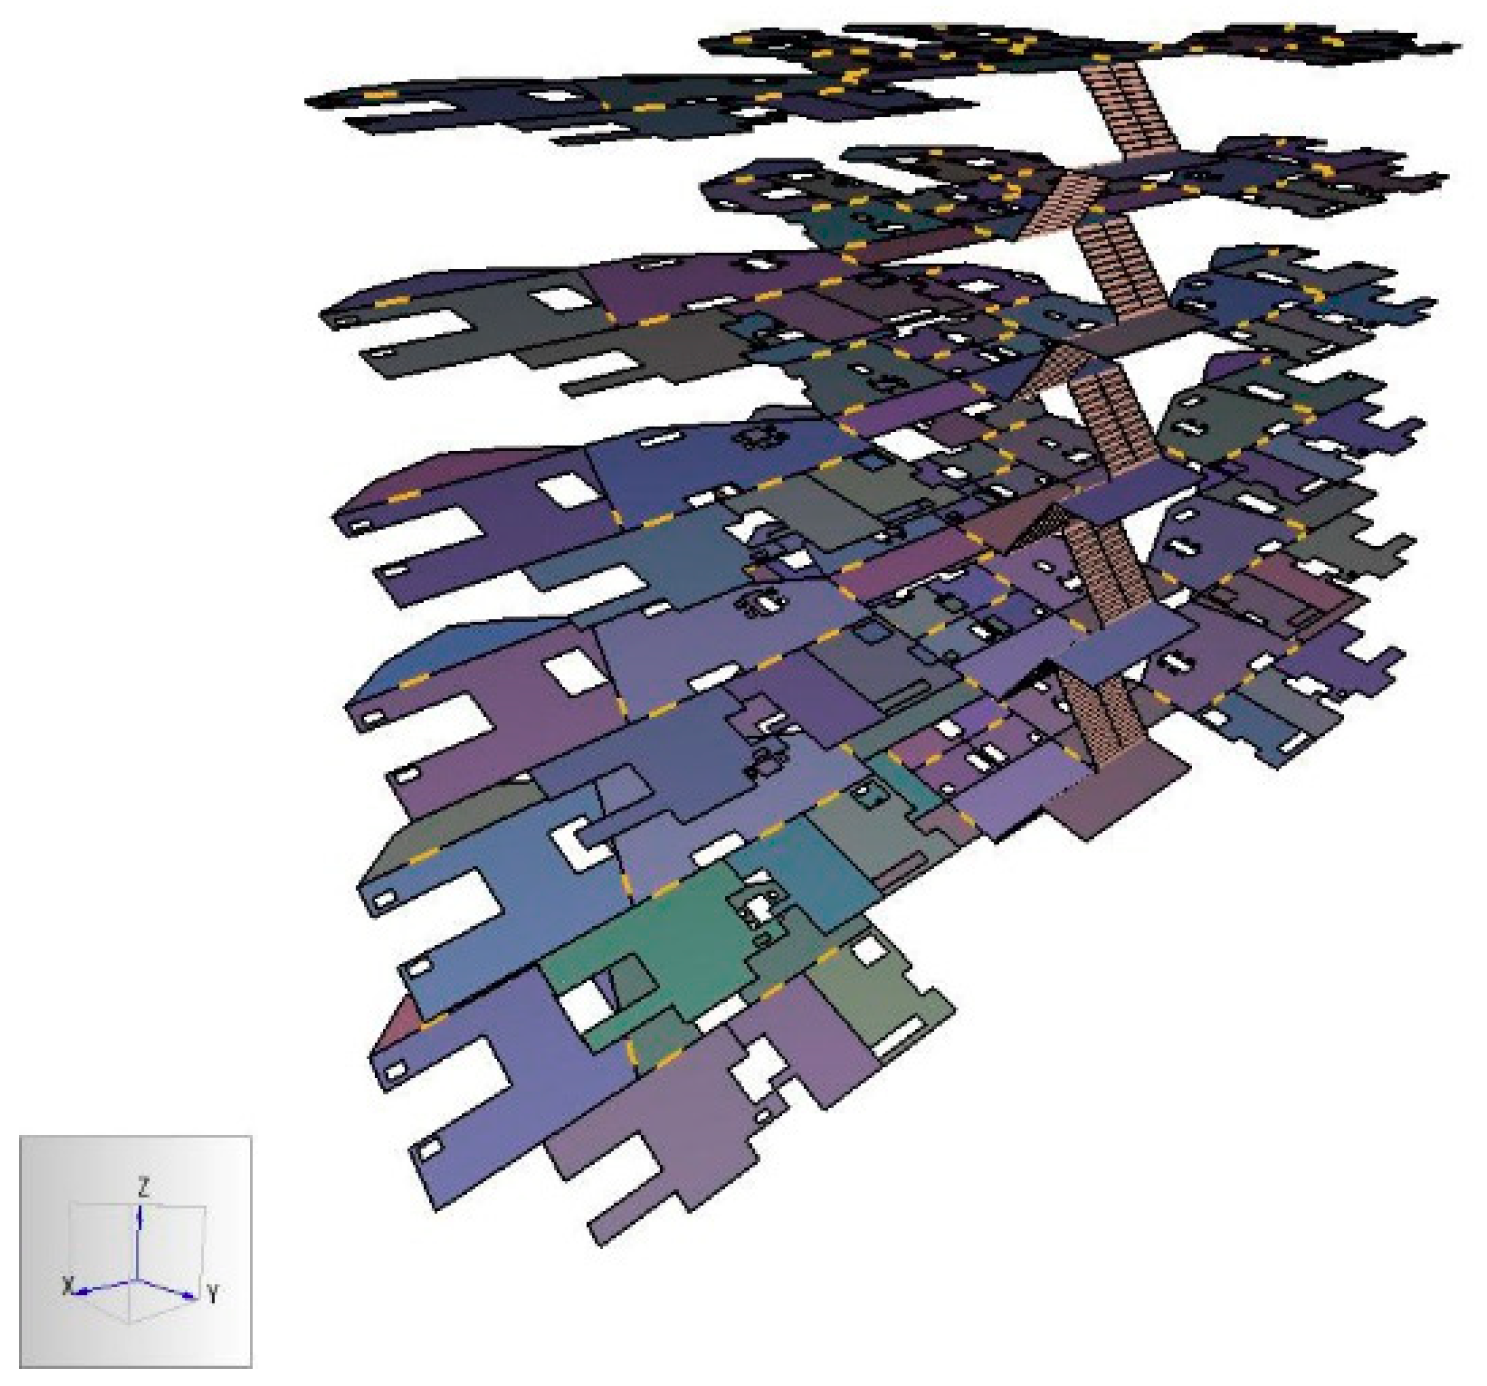
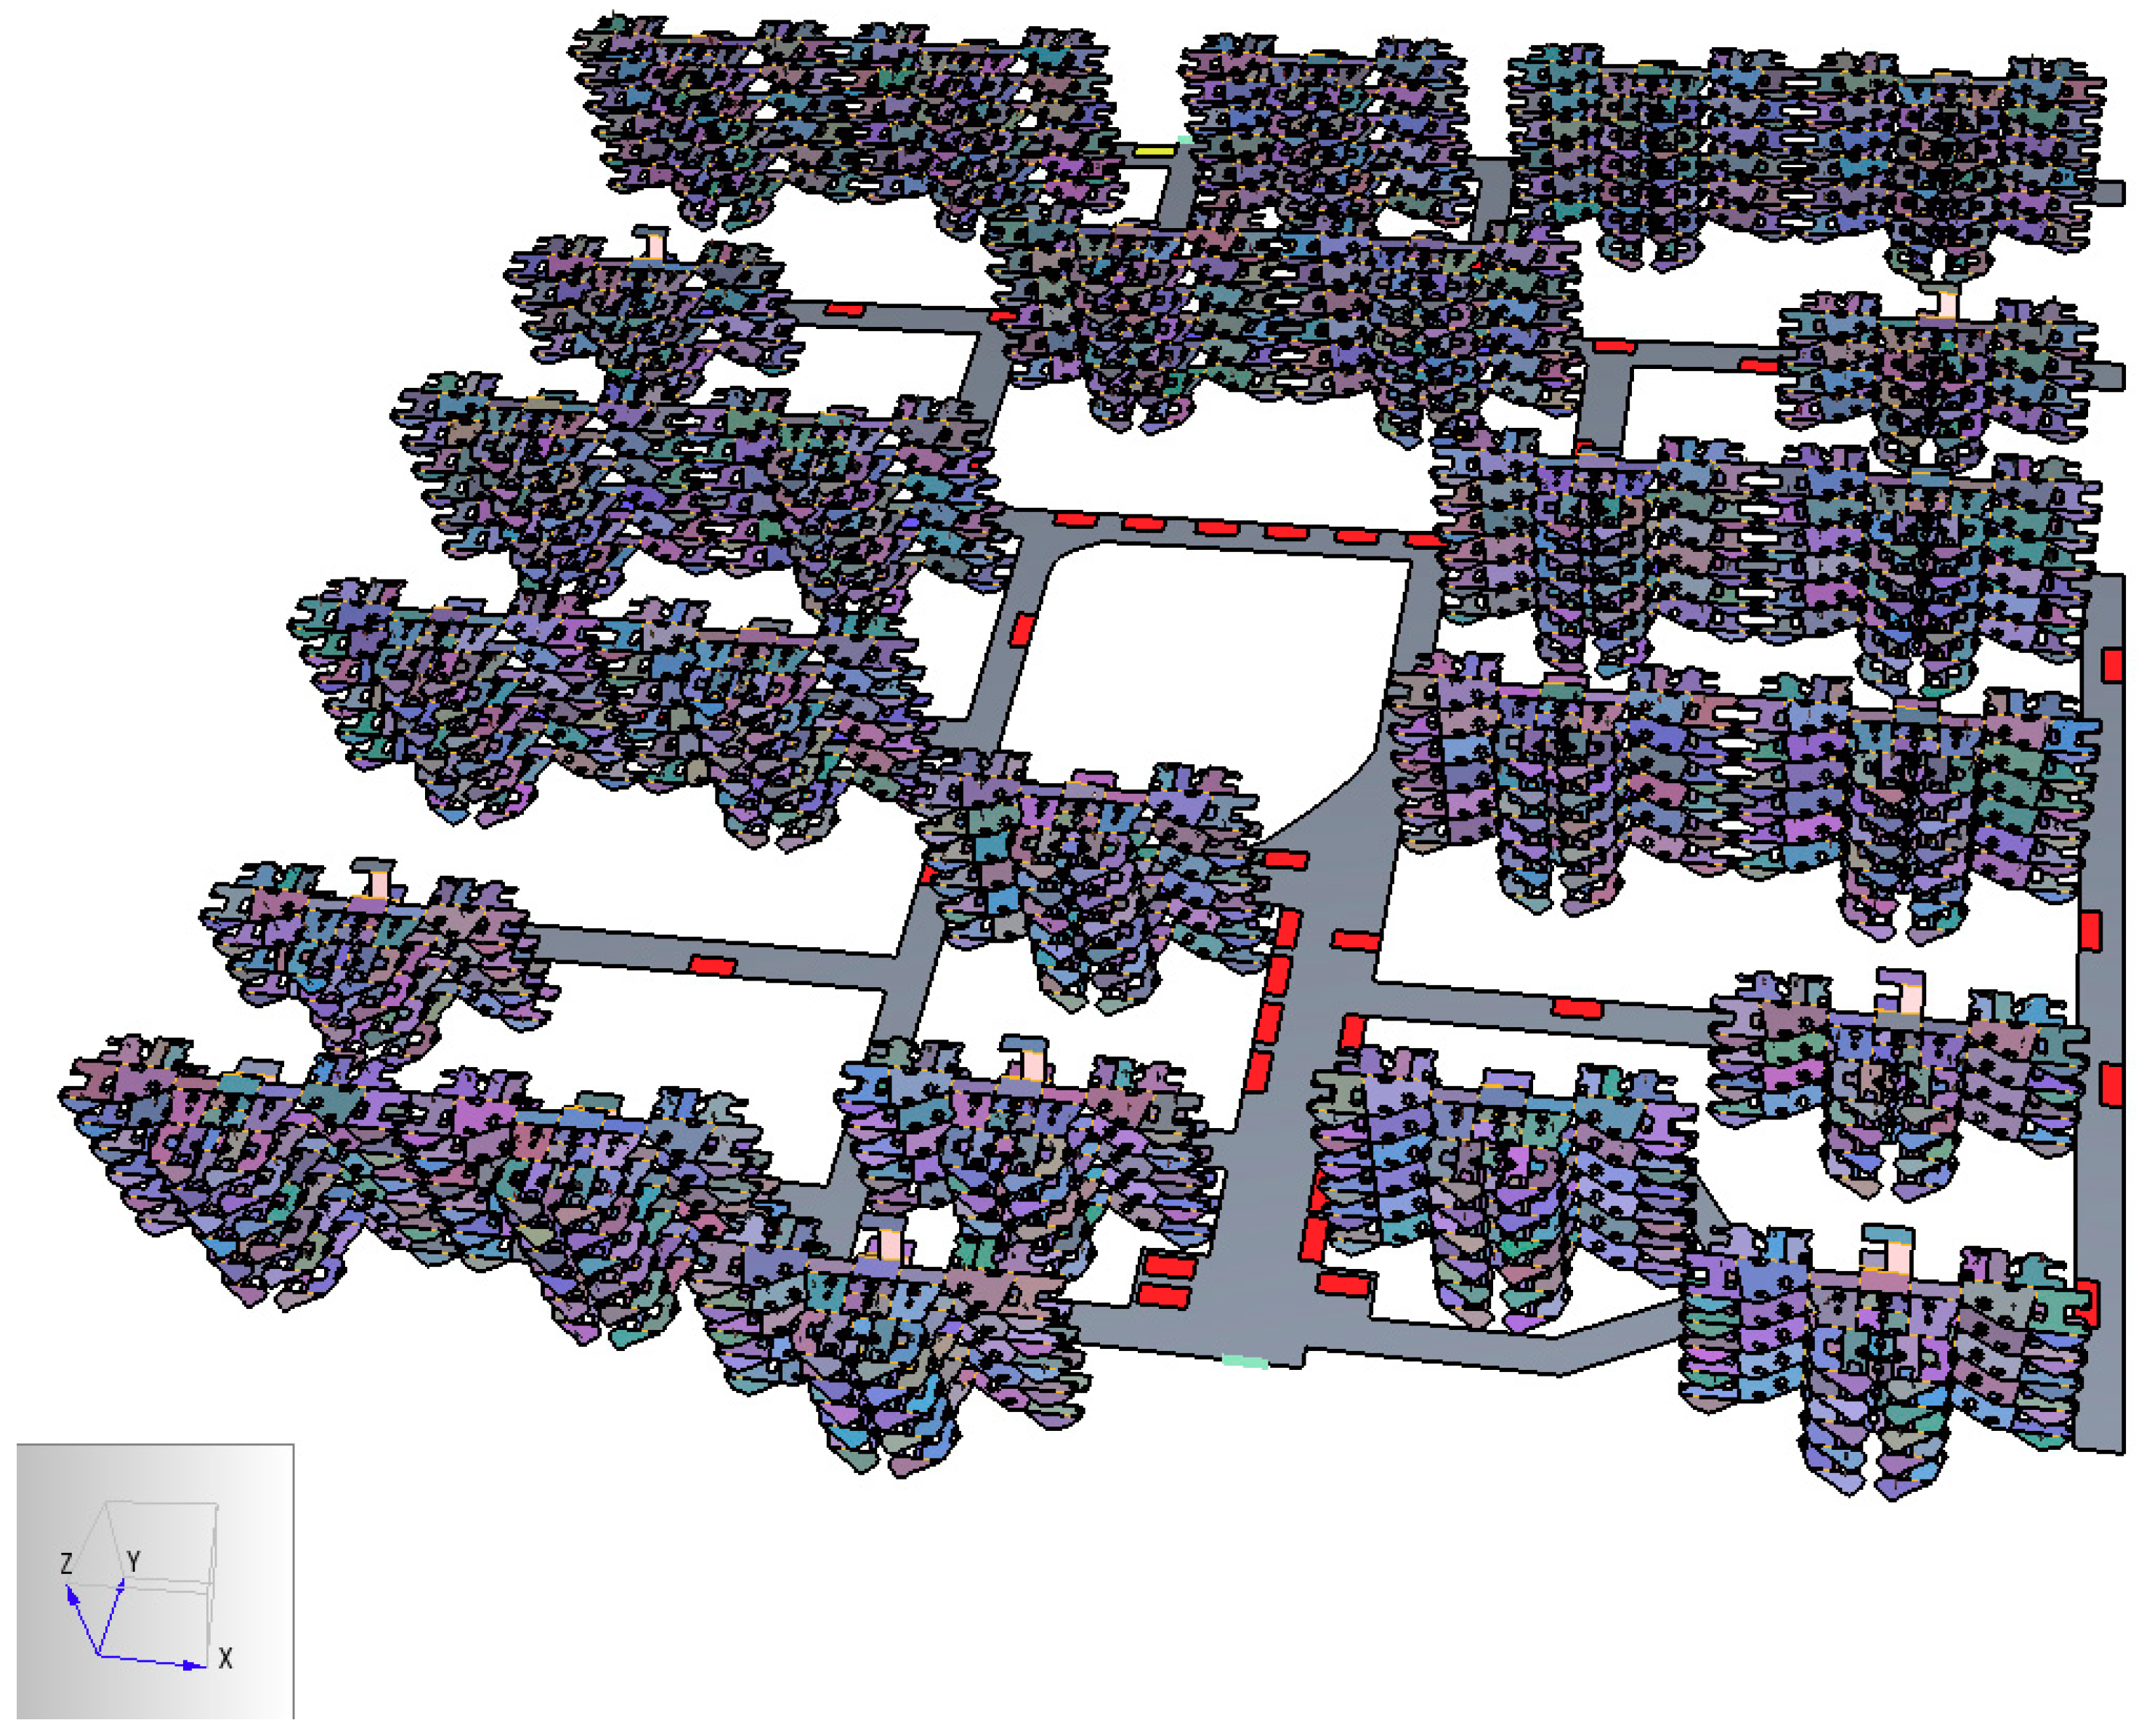
The three-dimensional layout data of the community divides into the indoor data and outdoor data. The key indoor structure includes apartments, corridors and stairways in buildings, Indoor data were obtained by architectural drawing and field surveys, as exemplified in Figure 5 and Figure 6. Figure 5 presents an example of the detailed interior structure of an individual floor of the six-story building represented in Figure 6. The outdoor data contains roads, parking lots and exits. The outdoor data were acquired by field measurement under the help of an unmanned aerial vehicle. Finally, integrating the indoor data and outdoor data, a complete three-dimensional model of the community was built, as Figure 7 shows.
3.2.2. Resident Data of the Community
The resident data in this case study includes two parts: demographic data and characteristics of residents.
(1) Demographic data
According to the Sixth Population Census of China, there were totally 1654 residents lived in the community. Among these people, there are 843 males and 811 females. Moreover, there were 64 children who couldn’t walk well and need at least one adult accompany during evacuation, and 111 teenagers whose ages were under 18 years old. There were 219 old people whose ages were over 70 years old and also need at least one adult accompany during evacuation as same as the children.
(2) Characteristics of residents
a. Evacuation mode: Evacuations in communities have a particular mode rather than in public areas such as subways or office buildings. Figure 8 shows that residents in a family will gather as a unit to evacuate together [16].
b. Walking speed: During the whole evacuation process, the speed of residents differs by ages and sexes. Table 4 shows the average walking speed of different sex and age groups. The speed data were adopted from a pedestrian speed measurement in Shanghai, 2003 [39].
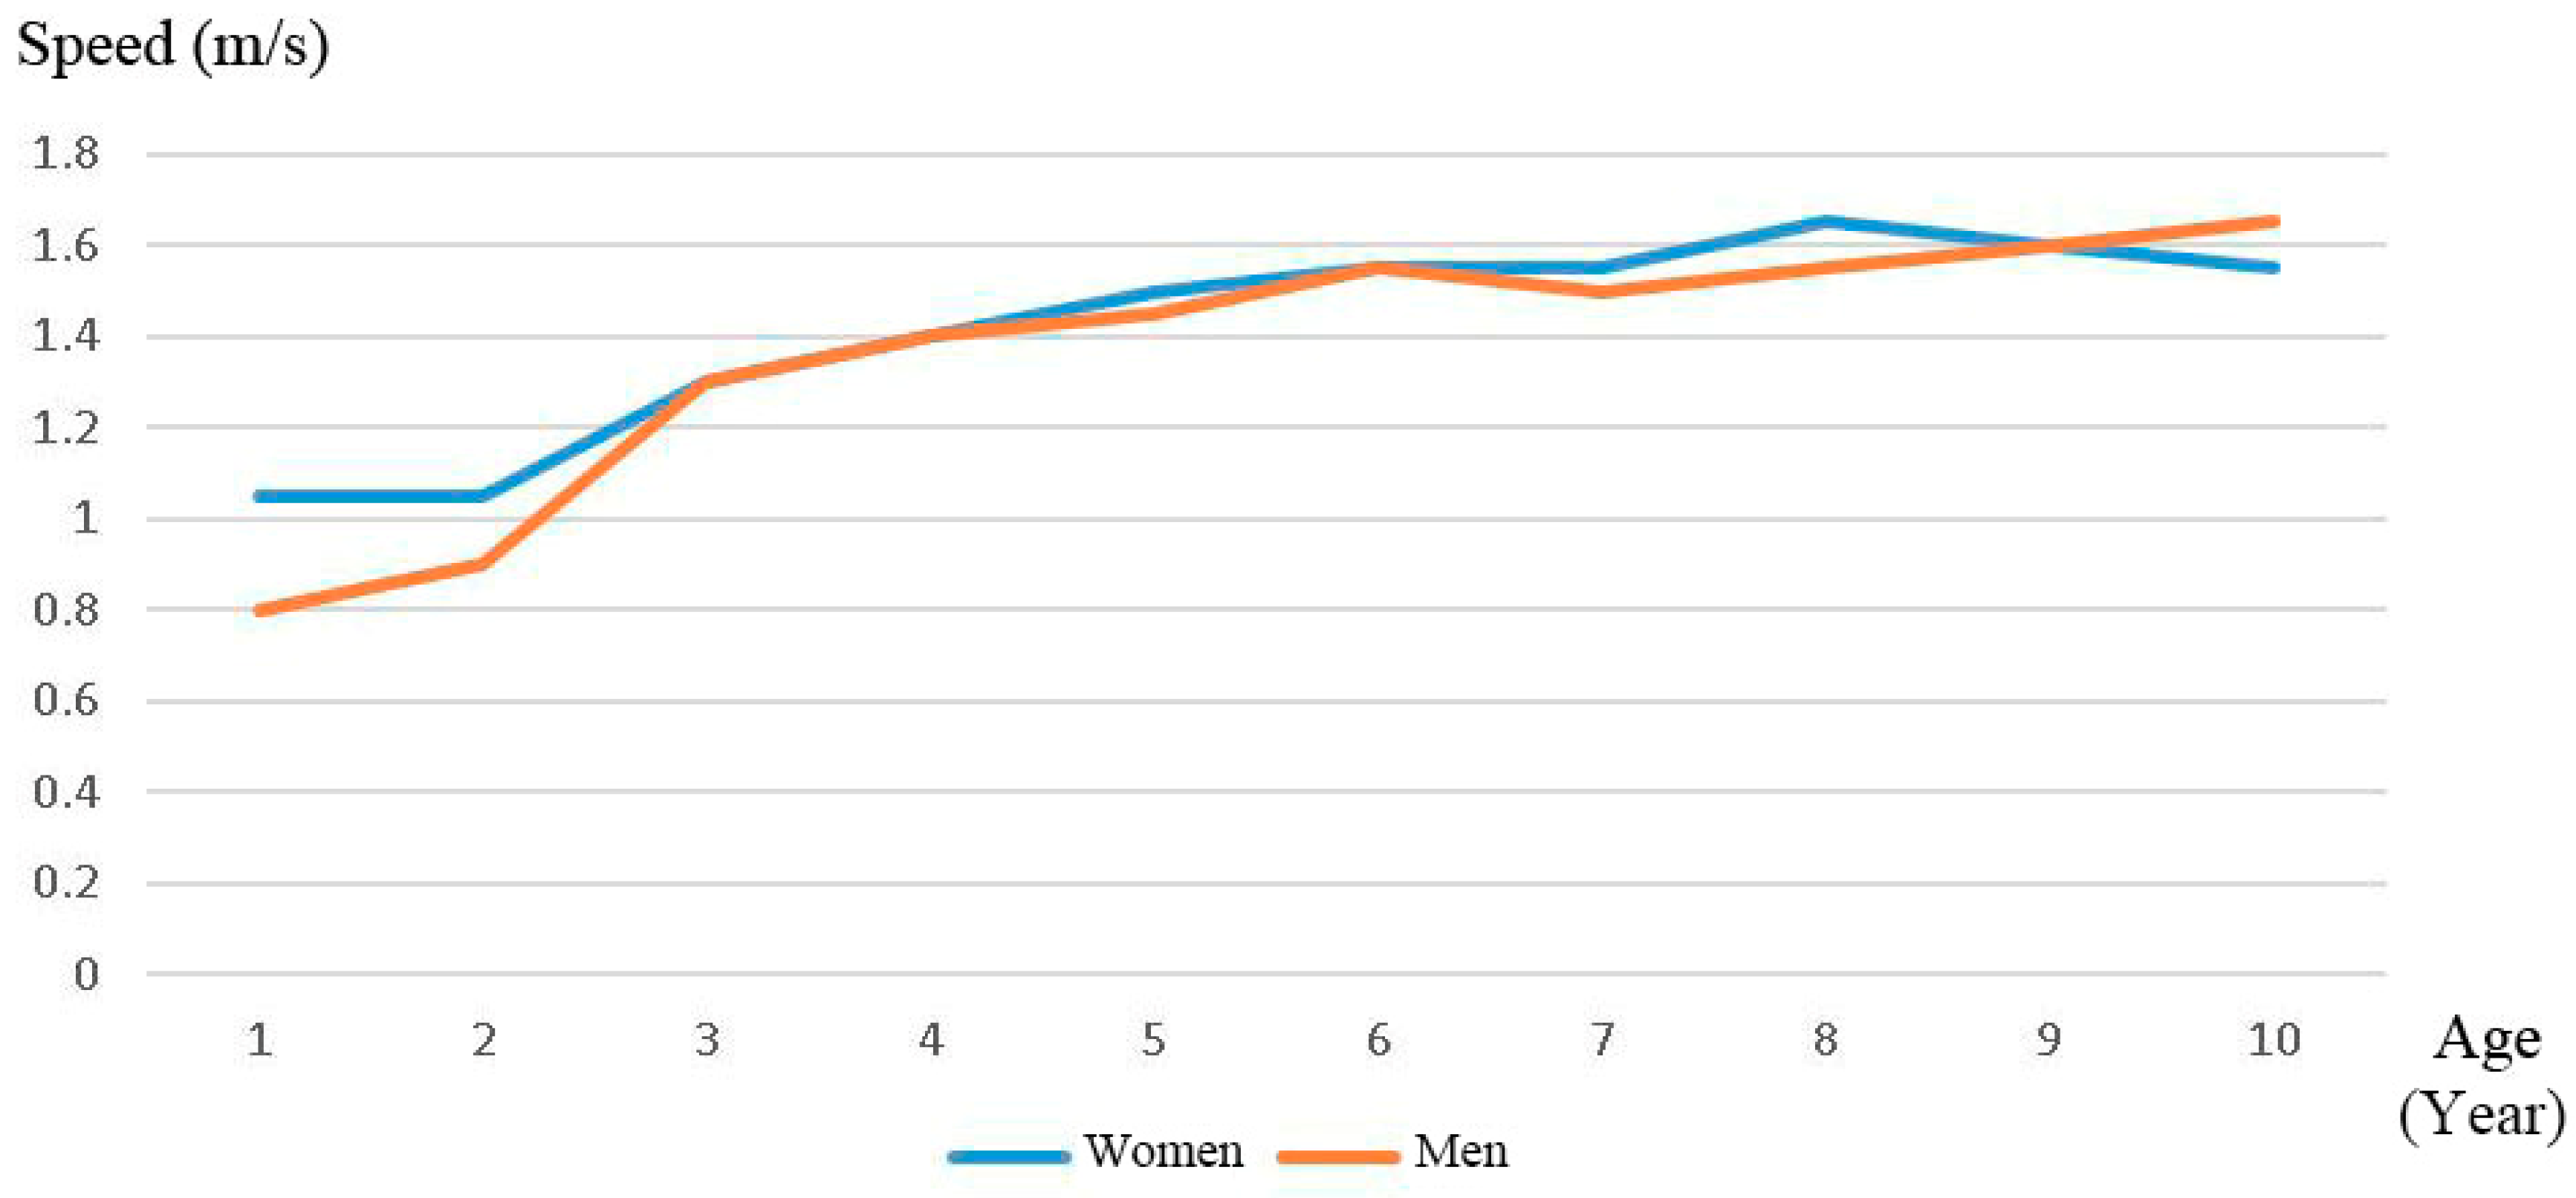
The average speeds of children (age ≤ 10), which were set by referencing previous research results [40], are shown in Figure 9.
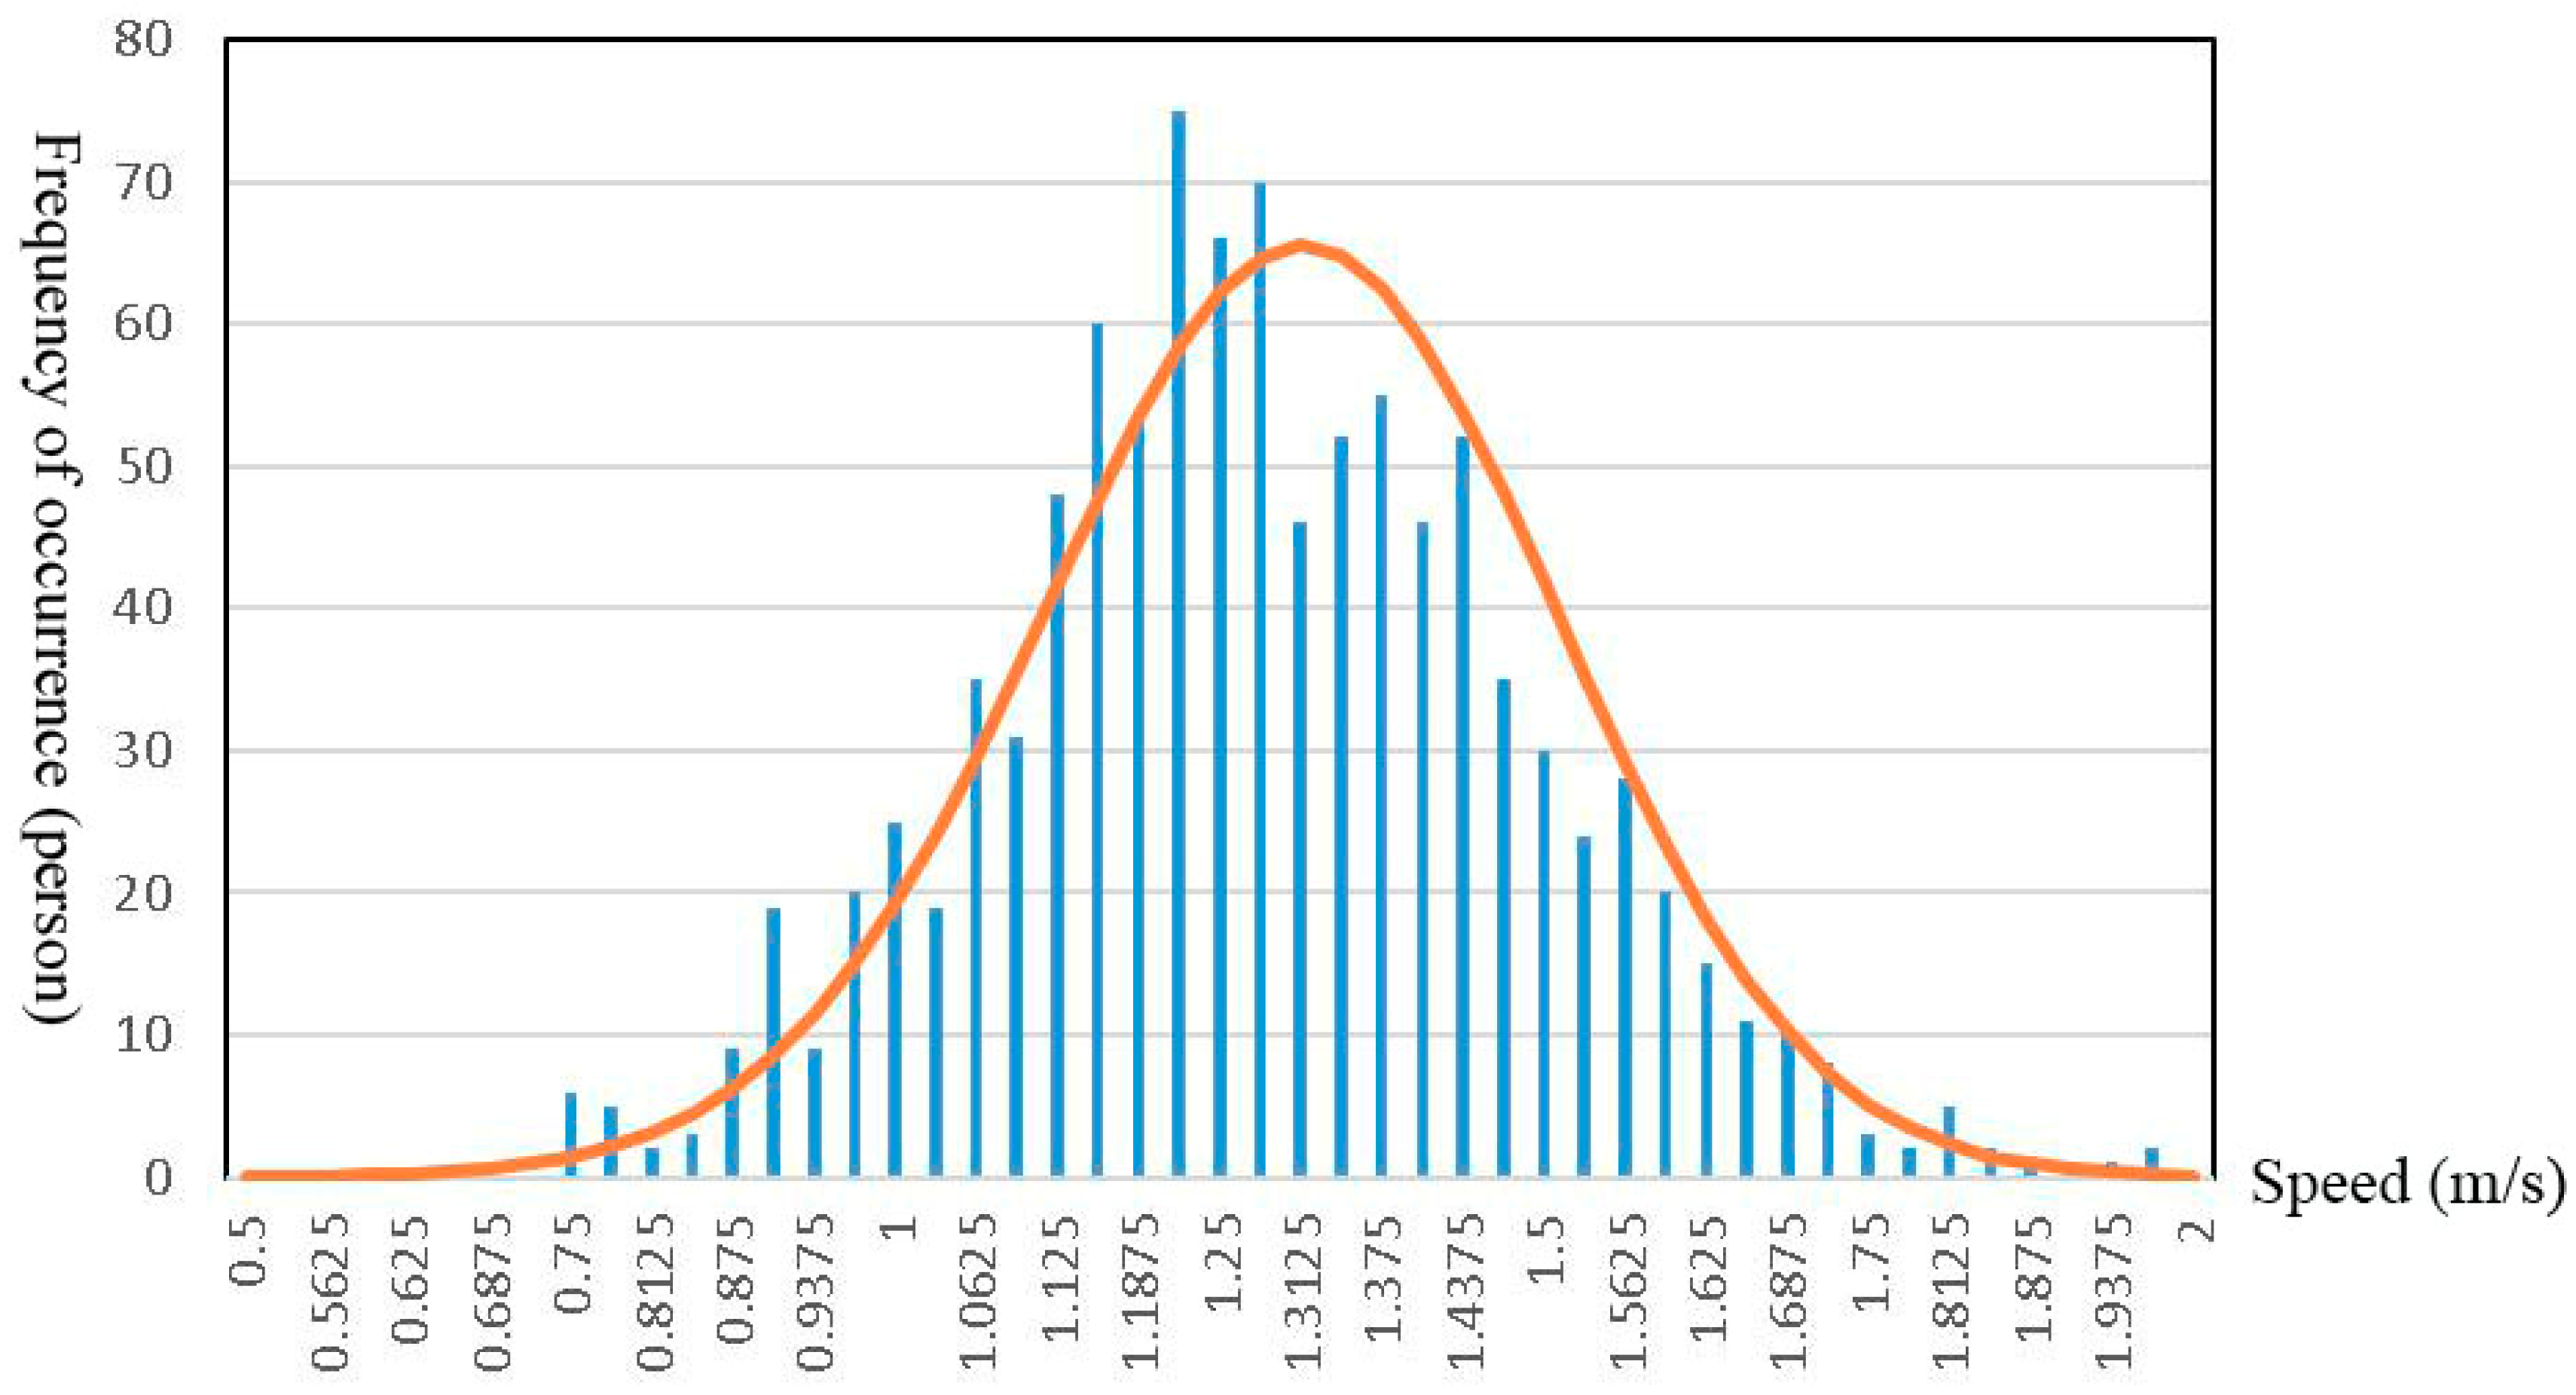
Previous studies pointed out that the pedestrian speeds are Gauss (normal) distributed. The deviation factor is 0 and the kurtosis factor is 3 [41]. Therefore, the walking speeds of residents in each sex and age group in this study are also Gauss distributed. For example, Figure 10 shows the Gauss distributed speed of young women.
c. Spatial distribution of residents: The residents of the study area are distributed in different residential buildings and live with their families. Population, age structure and sex ratio can be obtained from the census data. However, the composition of each family is not available in the census data. Therefore, the spatial distribution of the residents was estimated by the accommodation capacity of each apartment in buildings and field surveys.
Sensitivity analysis on different resident distributions was made to show the influence on the evacuation time. For example, we selected a six-story residential building whose building number is 25 (Figure 3). Then, we alternated all the residents of each floor in simulation to elderly people, respectively. Children usually don’t live alone in apartments. Therefore, the sensitivity analysis was not conducted for children. After sensitivity analysis for elderly people, six different evacuation time were obtained, respectively, as shown in Table 5.
The sensitivity analysis results show that a little longer evacuation time is needed if the elderly people are supposed to live in the higher floors of the buildings. Furthermore, sensitivity analysis was also made for the four-story buildings and five-story buildings, the analysis results are similar to the result in this example.
d. Physical trait: Pathfinder uses a cylinder to represent the occupied area of a resident. The shoulder width of the resident is the diameter of the cylinder and this parameter is important for collision testing and path planning during the simulation. The shoulder widths of residents were set based on the previous researches about Chinese physical traits [37]. Accordingly, the shoulder widths of different age-groups were set in Table 6 [19,42].
3.3. Simulation Results
There are many influencing factors in an evacuation simulation. In order to simplify the simulation, the following assumptions are made for this study:
a. The emergency does not or has not caused physical damage or other adverse effects on road facilities when the residents are evacuating. The roads in the community can be fully utilized.
b. To ensure the safety of the residents, all residents in the residential buildings are required to be evacuated out of the community, and all the residents are at home before the emergency occurs.
c. The emergency will not cause personal injury of the residents.
d. The residents will immediately start moving when the emergency occurs and all residents will walk without using vehicles.
e. There are no disabled people in the building.
f. All residents are not in panics and can be evacuated orderly.
The time from the occurrence of danger to start of movement is called pre-evacuation time. This time is influenced by internal and external factors [43]. The internal factors are related to the physical and socio-psychological characteristics of the residents: their emotional states [44], cultural background or training [45], past fire-related experience and knowledge of the environment and safety devices [46]. External factors include social interactions, environmental conditions, such as alarm systems and visibility conditions.
Compared with an open space or office space, residents in a residential area are in their closed environments, and the evacuation may not begin immediately when an emergency occurs. However, due to the differences in gender, age, health status, familiarity with the community environment, relationship with others, and education level, each resident’s pre-evacuation time is different and not easy to be accurately set. The pre-evacuation time is not considered in this study, as assumption (d) stated. In our future study, field surveys will be conducted to collect the information of residents and utilize artificial intelligence methods to estimate the pre-evacuation time of residents.
Based on the layout data and residential data of the study area, a three-dimensional model of the community was built. After simulating the evacuation process under four scenarios designed in the proposed method, four evacuation simulation results were generated.
3.3.1. Evacuation time
Table 7 lists the average evacuation time of all buildings with the same number of floors under four scenarios. For example, average evacuation time in 6-story buildings is 99.8s in Scenario 1. Evacuation time on roads starts from the moment when the first resident goes into the roads, and ends at all residents evacuate from the exits.
Compared with Scenario 1, the total evacuation time in Scenario 2 (with haphazardly parked vehicles on roads) increases by 13.5%; A 10.8% and 24.4% increase is observed in Scenario 3 with stacked sundries on stairways and in Scenario 4, respectively. When Scenario 4 is compared with Scenario 1, it could be found that the haphazardly parked vehicles increase the evacuation time on roads by 24.9% (88.7s). The stacked sundries make the evacuation time in buildings increase 32.6% (32.4s).
3.3.2. The Cumulative Number of People on Roads
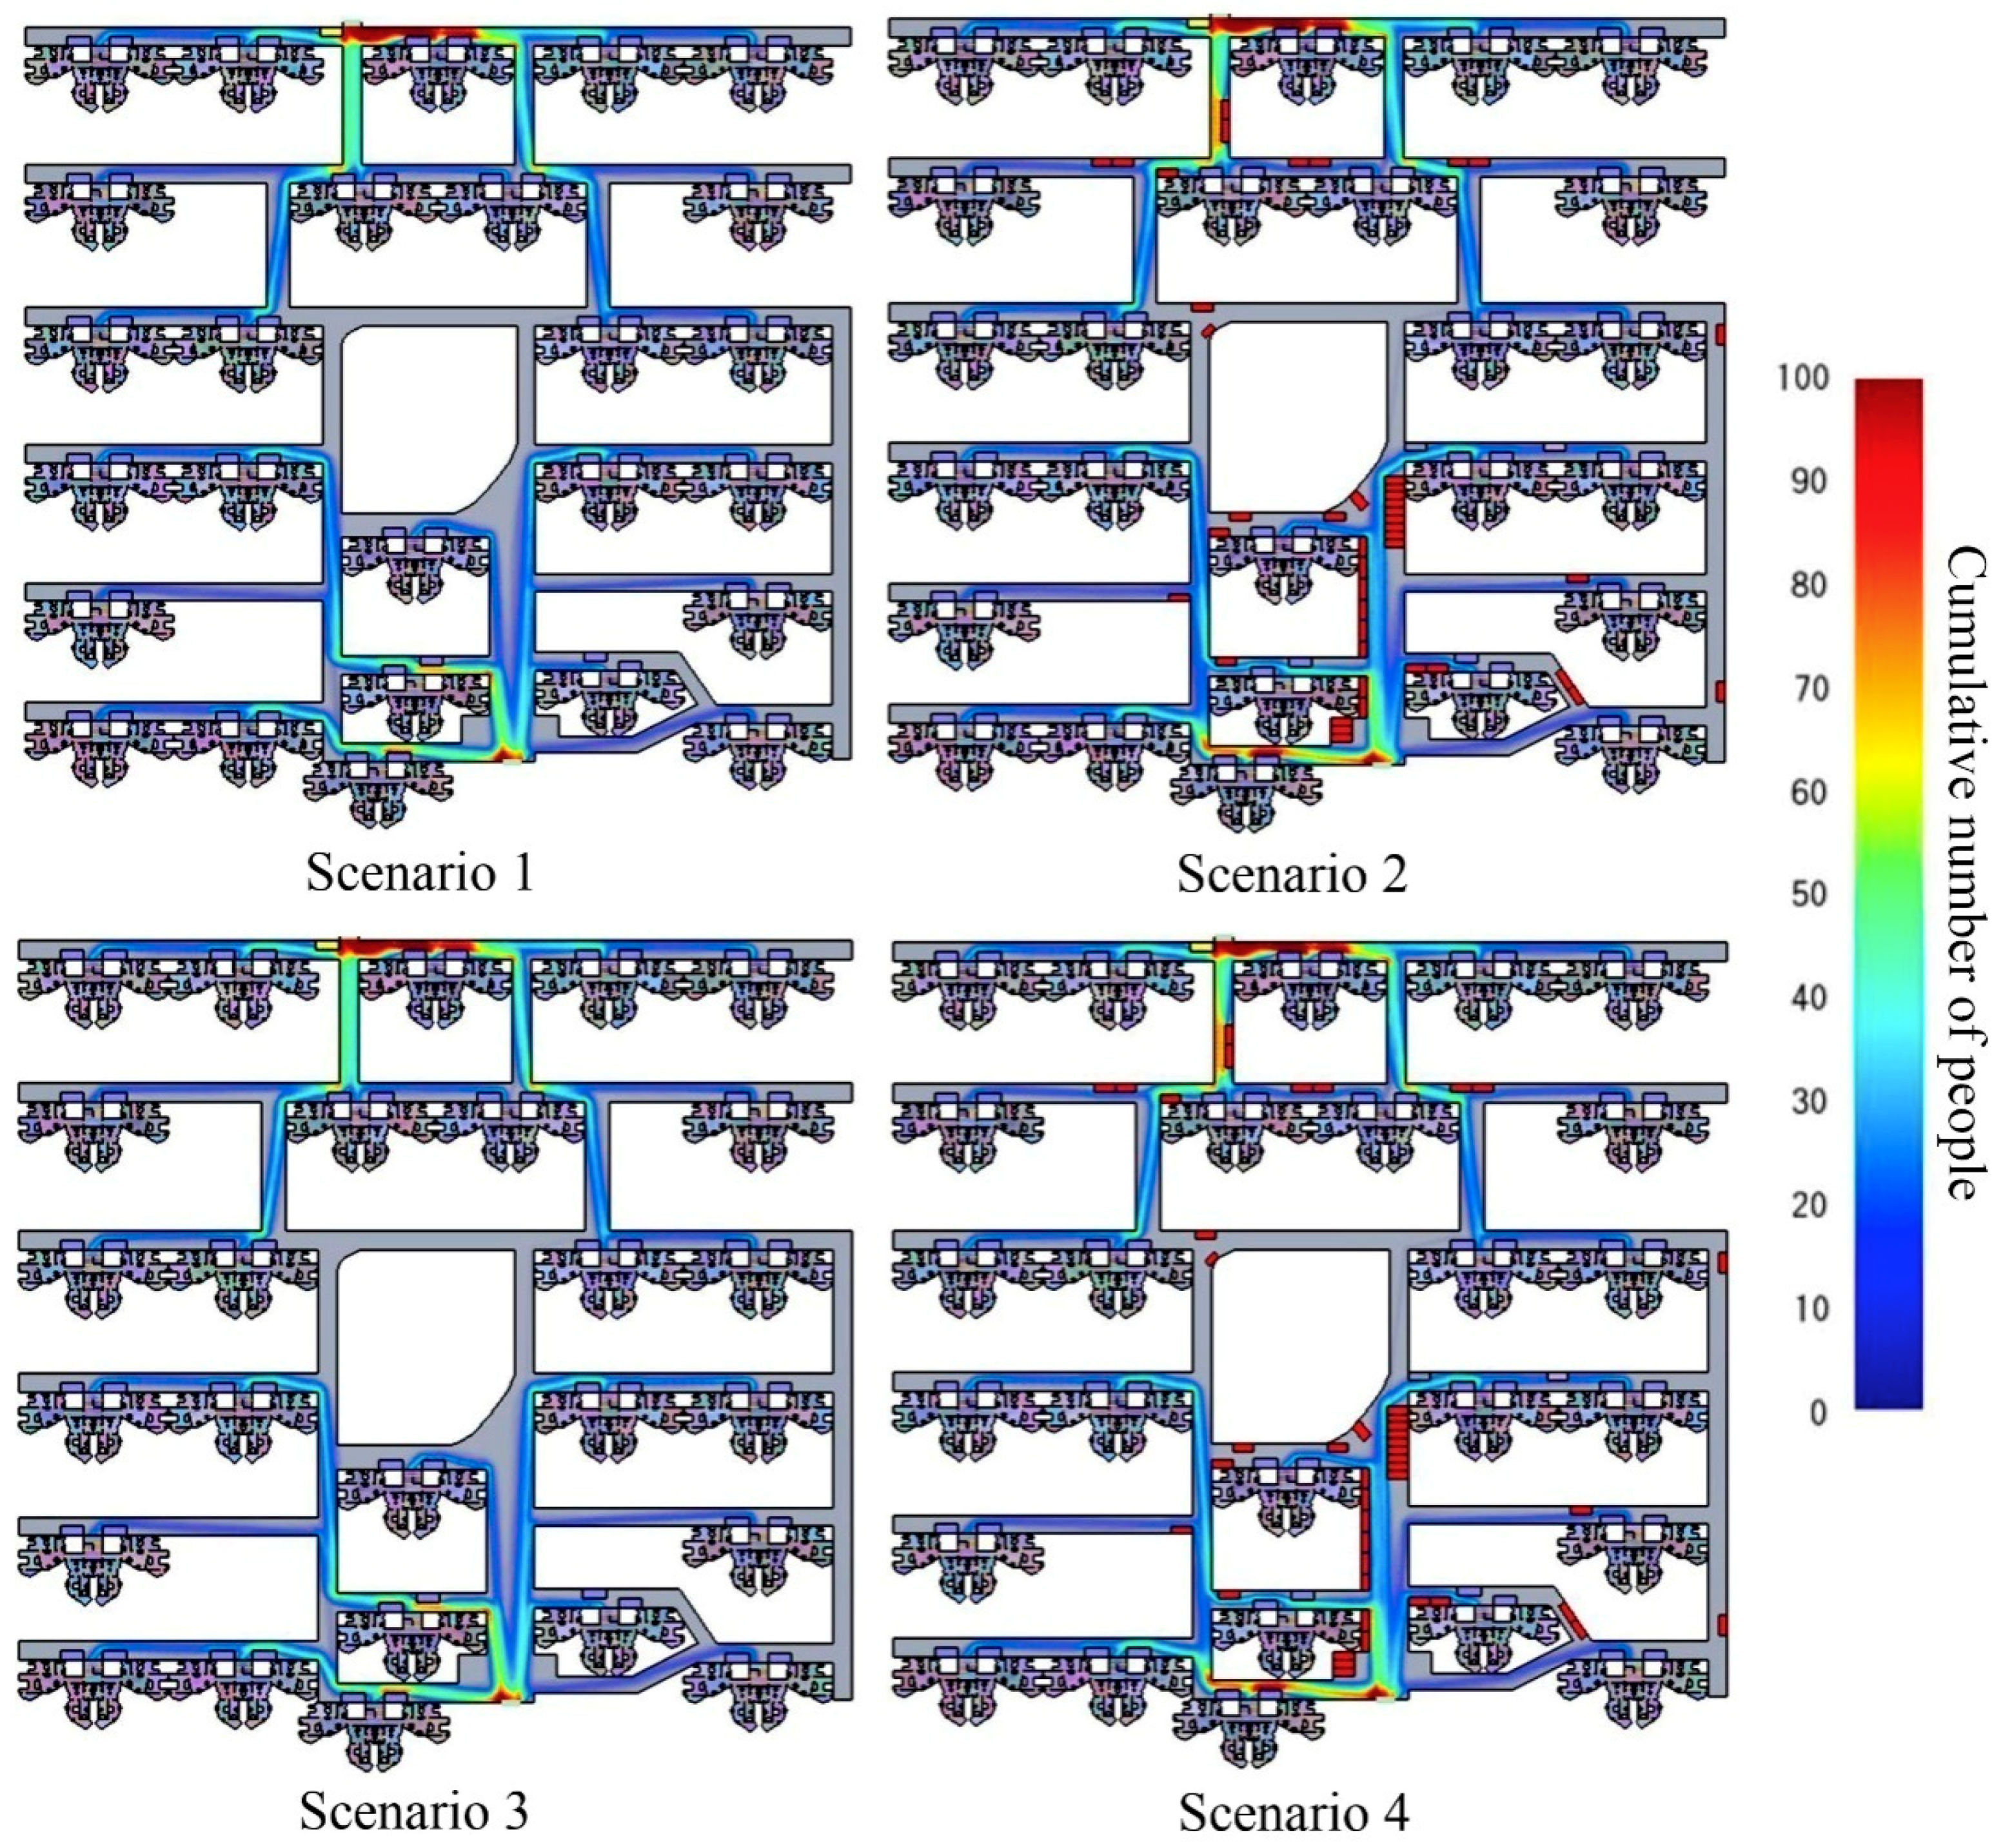
Figure 11 shows the cumulative number of people on roads under the four scenarios. Based on the spatial distribution of cumulative number of people in Figure 10, the cumulative number of people on different road sections can be counted and mapped by Figure 11.
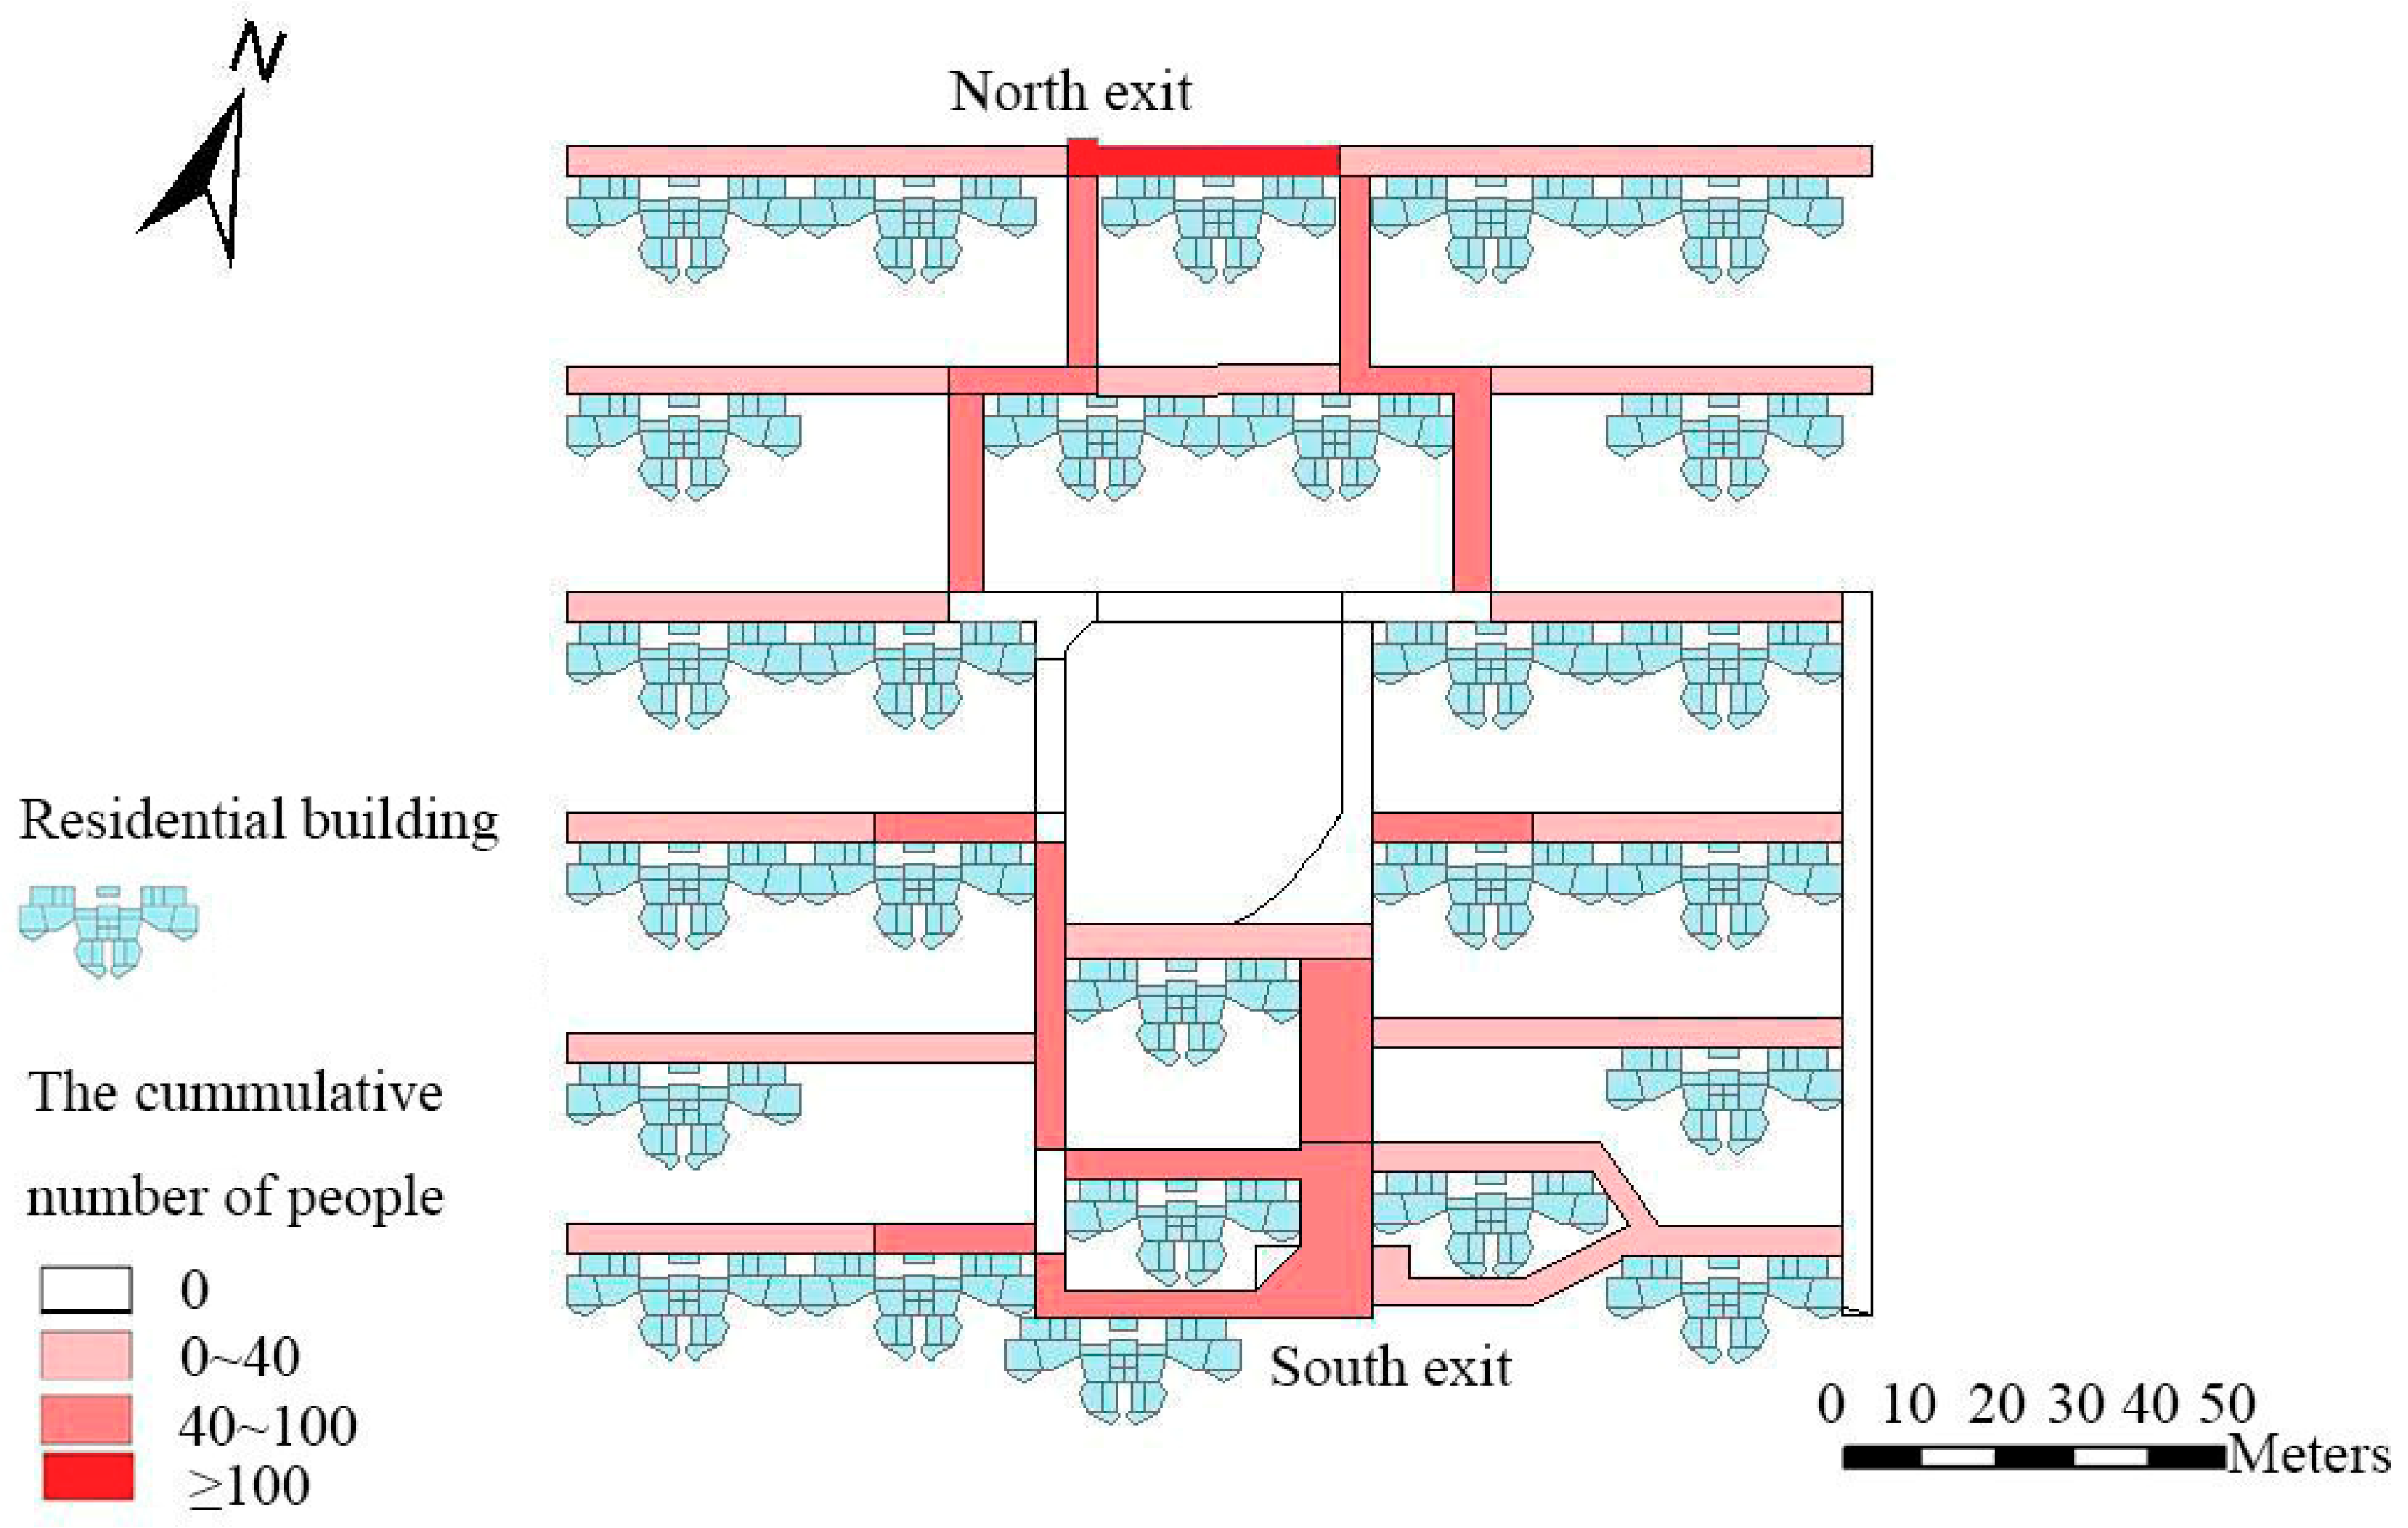
In Figure 12, the road sections around the two exits and some T-shaped or L-shaped road sections are areas with high cumulative number of people. This figure can help the managers of the community identify the critical road sections in evacuation.
3.3.3. Easy-Crowded Stairways
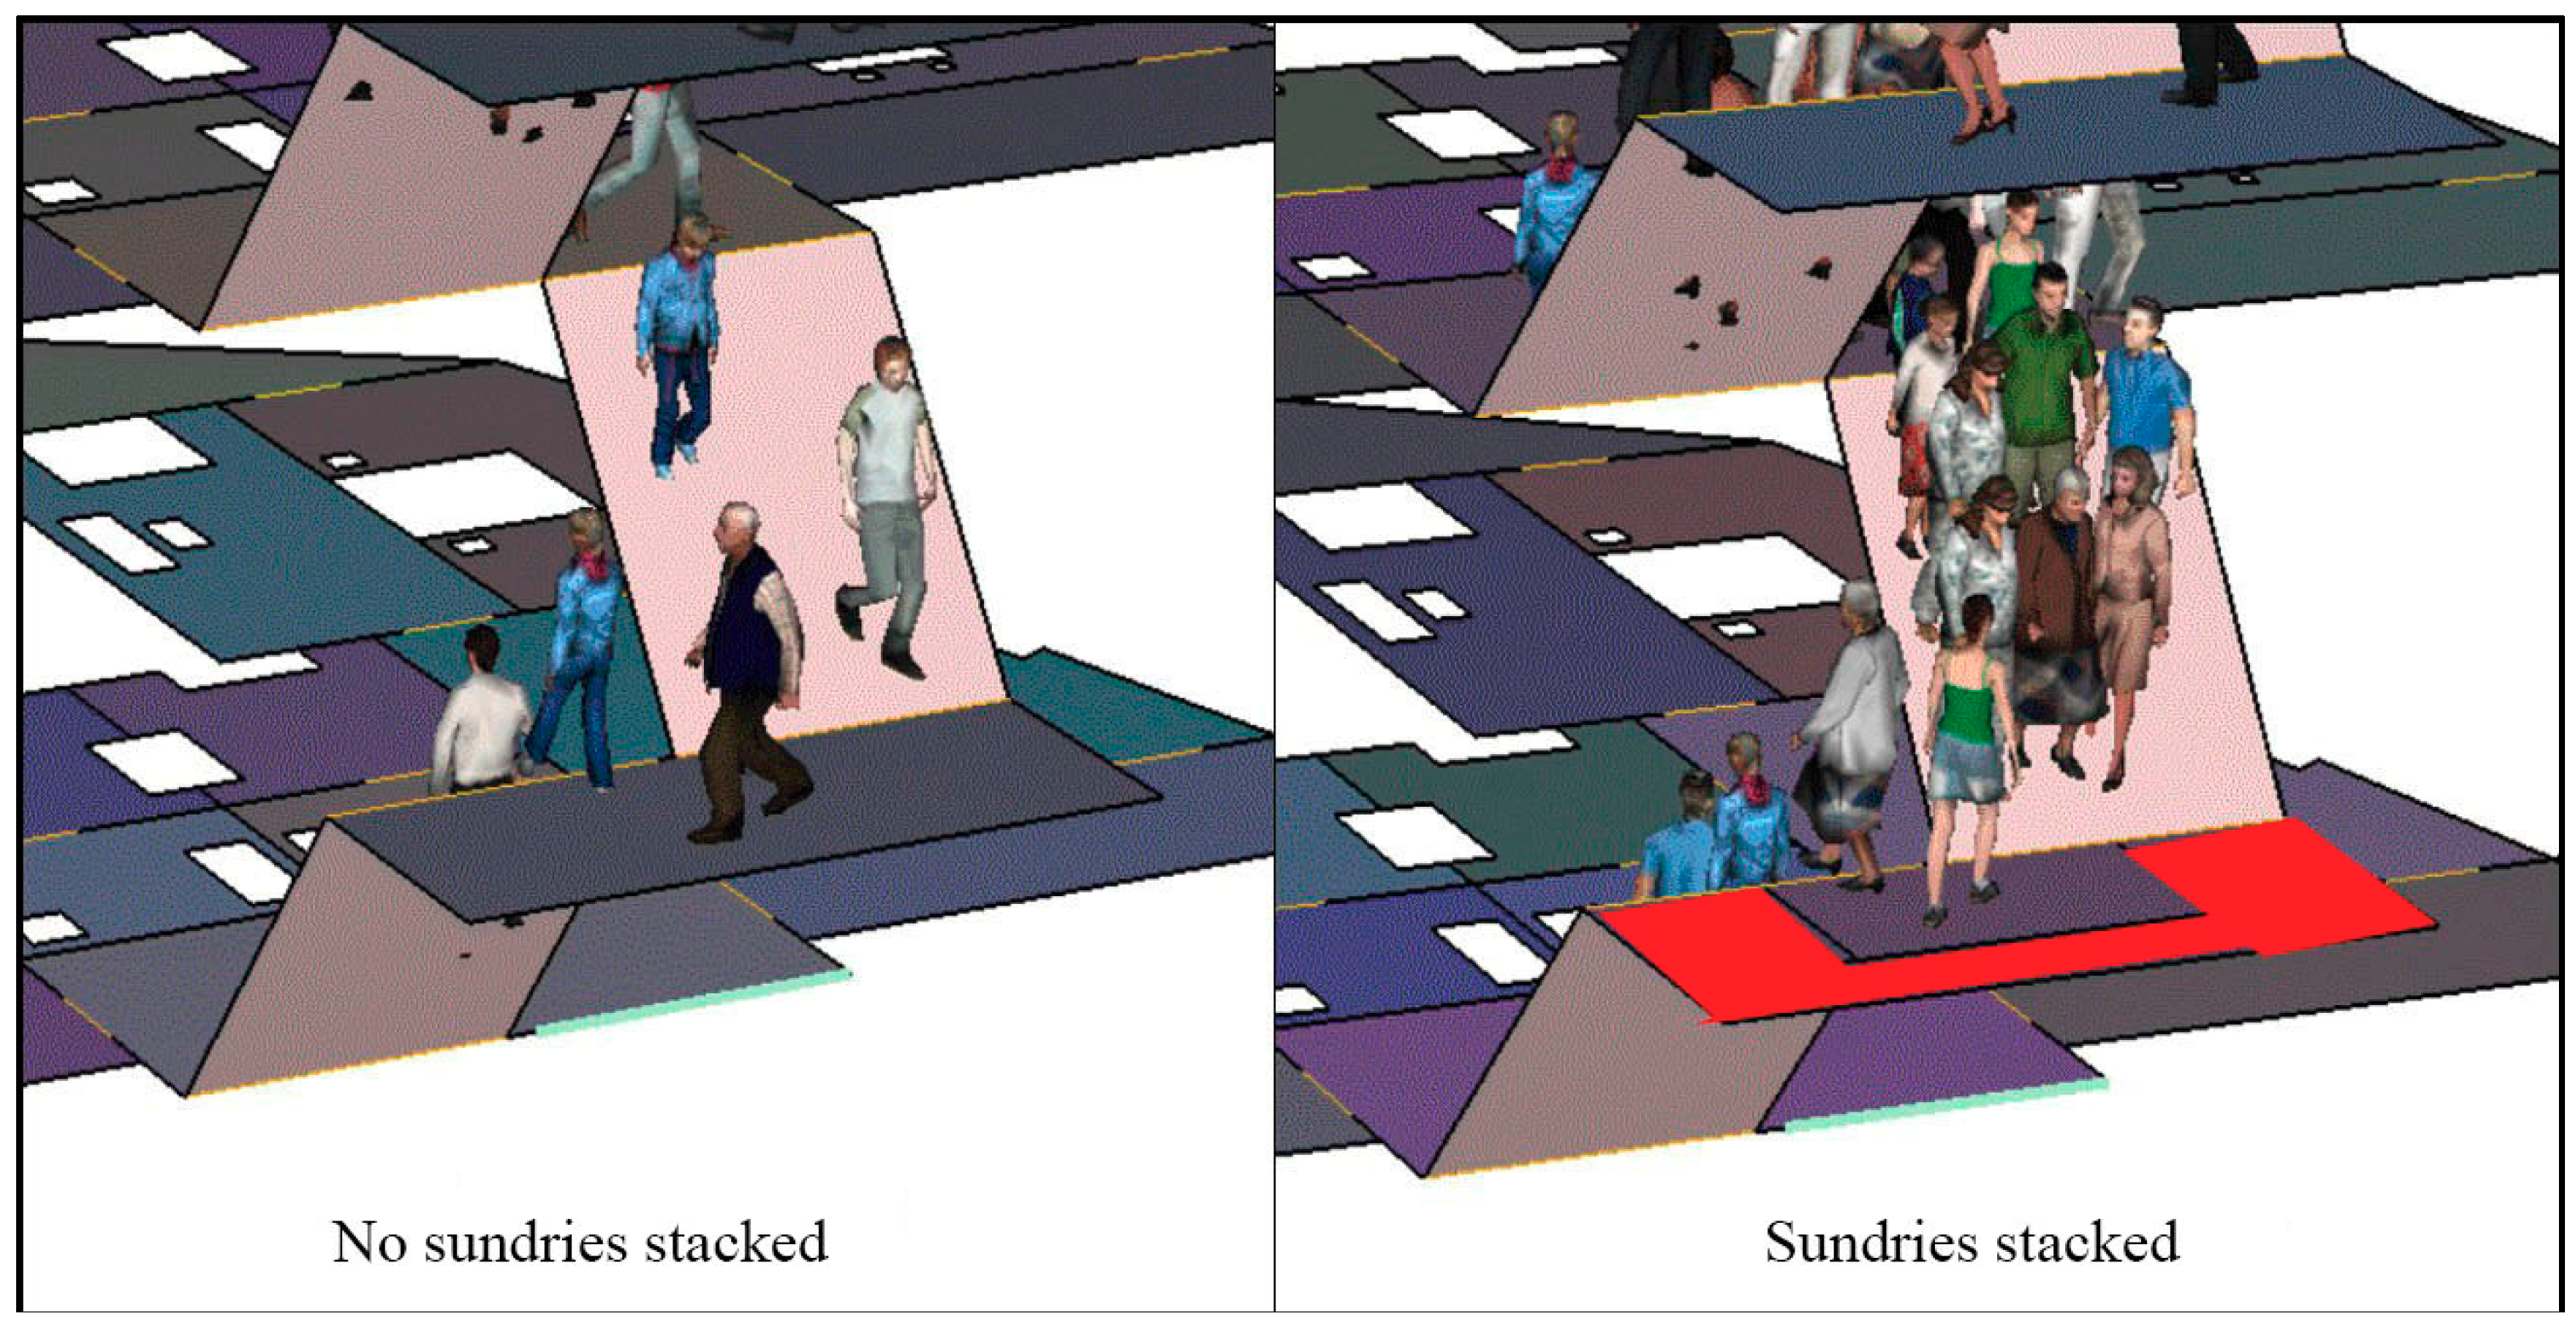
Easy-crowded stairways were also identified on the basis of the analysis of simulation results. Taking a 6-story residential building as an example, we assumed five situations where stacked sundries are placed only at the exits of stairways between 6th and 5th floors, between 5th and 4th floors, between 4th and 3rd floors, between 3rd and 2nd floors, between 2nd and 1st floors, respectively. Then as Figure 13 shows, comparative simulation experiments were made between the five situations and no sundries stacked situation.
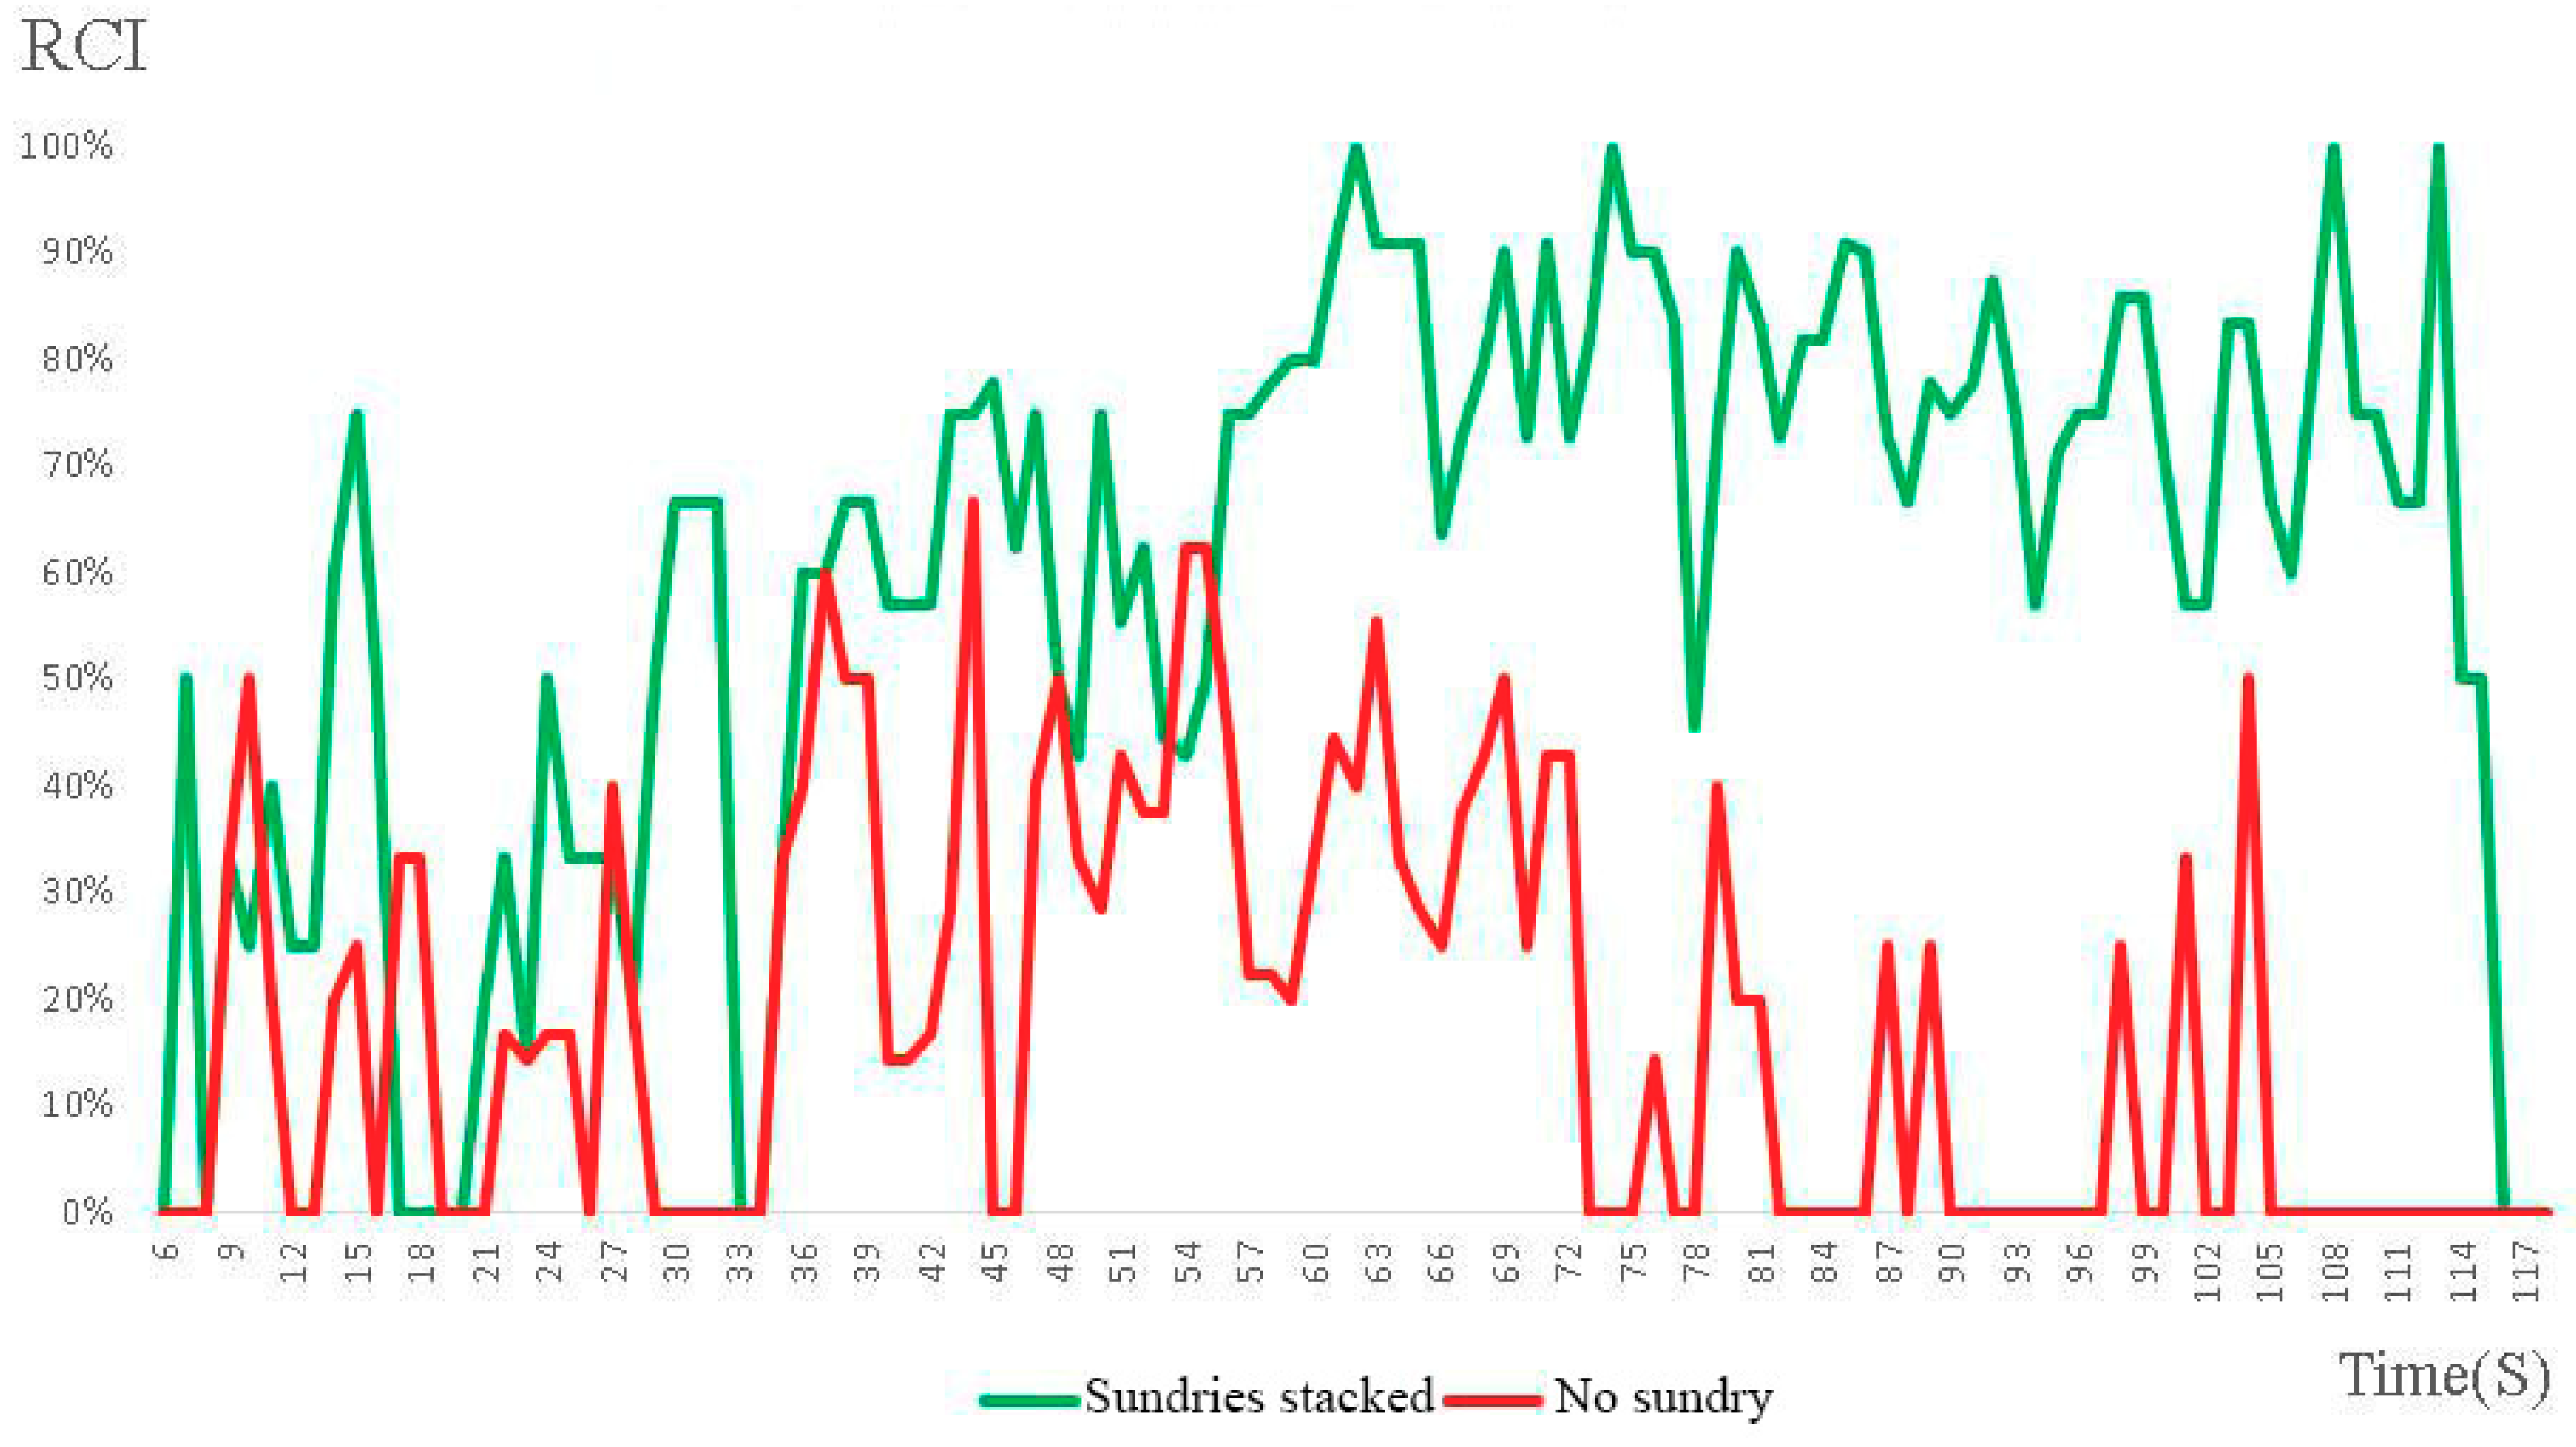
In Section 2.3.1, we have mentioned that the RCI is an index which represents the degree of congestion in a specific region in evacuation. Here we used the RCI to analyze the degree of crowdedness in buildings. To compare the RCIs under different situations, the significance test method was also used. For example, Figure 14 presents the comparison of RCIs in the stairway between the 2nd and 1st floors of a 6-story building under two different situations: sundries stacked and no sundry. p-value is an important index of the significance test method. The smaller the P-value the more significant difference between the compared situations. In Table 8, the stairway between the 2nd and 1st floors has a smallest p-value, which means the evacuation process is most impeded if sundries are stacked on stairways between 2nd and 1st floors.
Further analysis showed that, for all the buildings, if the lower floors are stacked with sundries, it will have a larger impact on the evacuation of residents than the situation that the sundries stacked on higher floors. After analyzing the RCIs in the stairways between different floors, we found that if the sundries are stacked in the stairways on specific floors, the evacuation process will be significantly affected. These easy-crowded stairways are listed as follows:
(1) In 6-story buildings: stairways between the 2nd and 1st floors, between the 3rd and 2nd floors.
(2) In 5-story buildings: stairways between the 3rd and 2nd floors.
(3) In 4-story buildings: stairways between the 2nd and 1st floors.
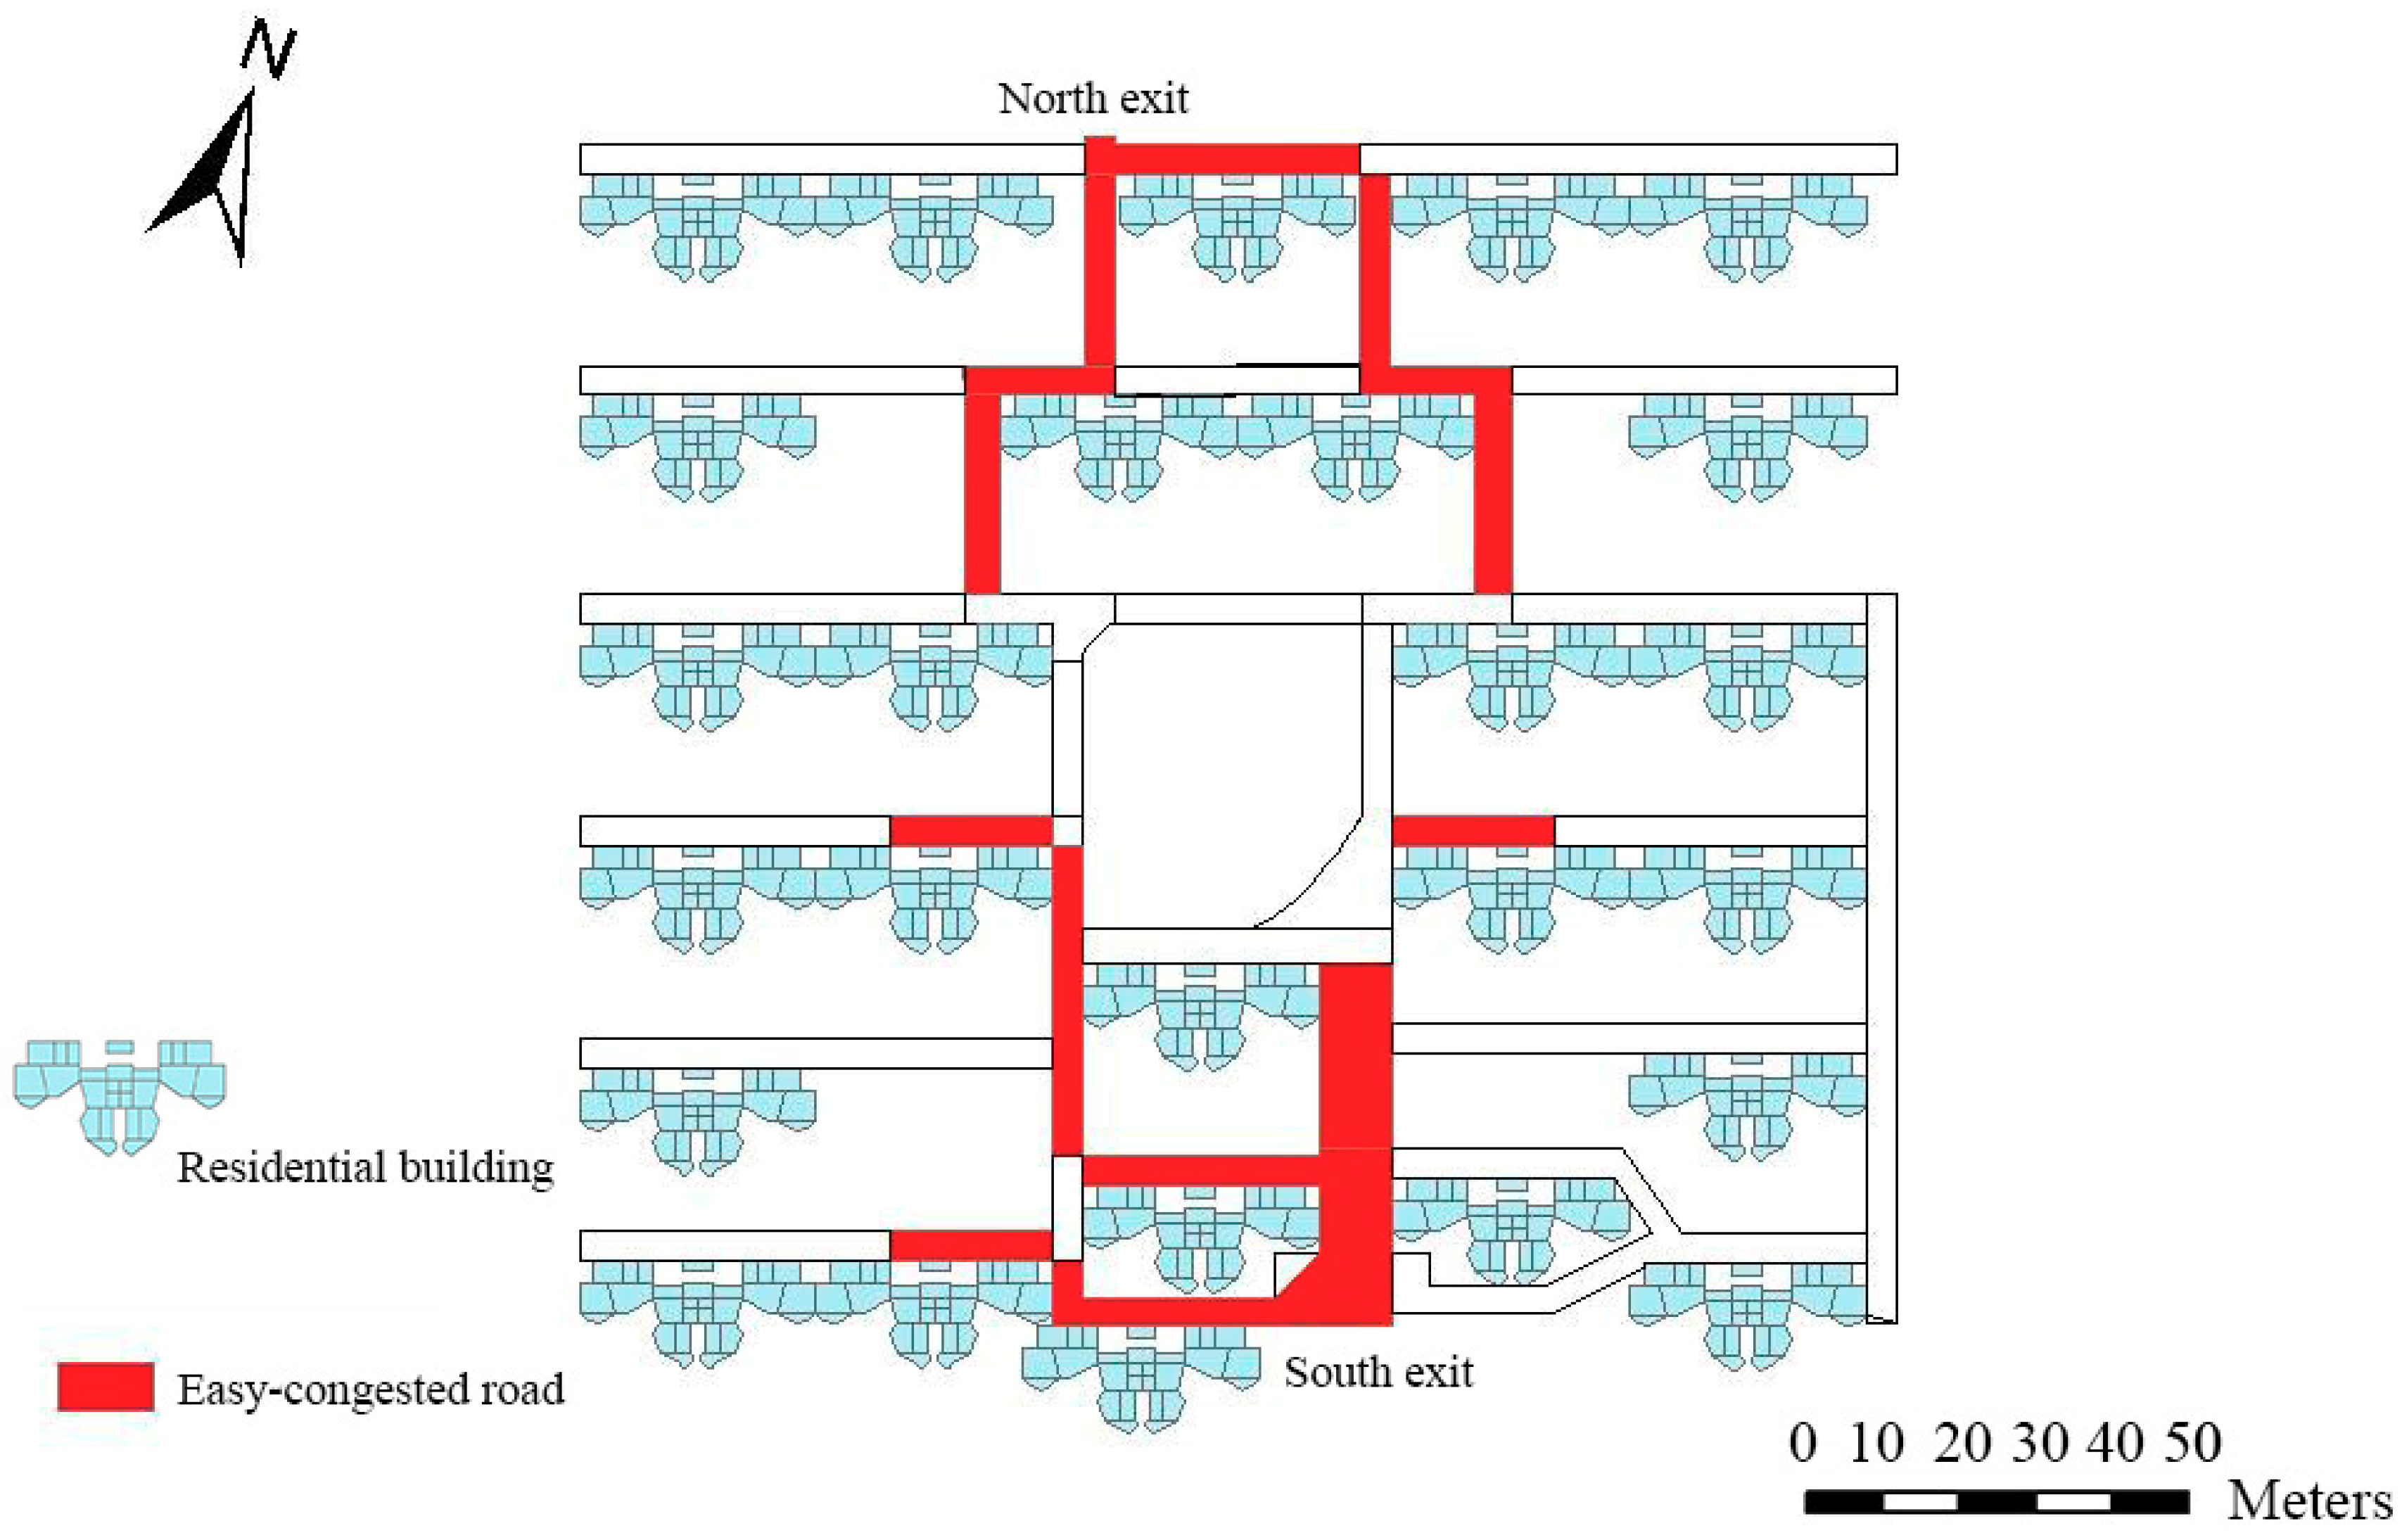
3.3.4. Easy-Congested Roads
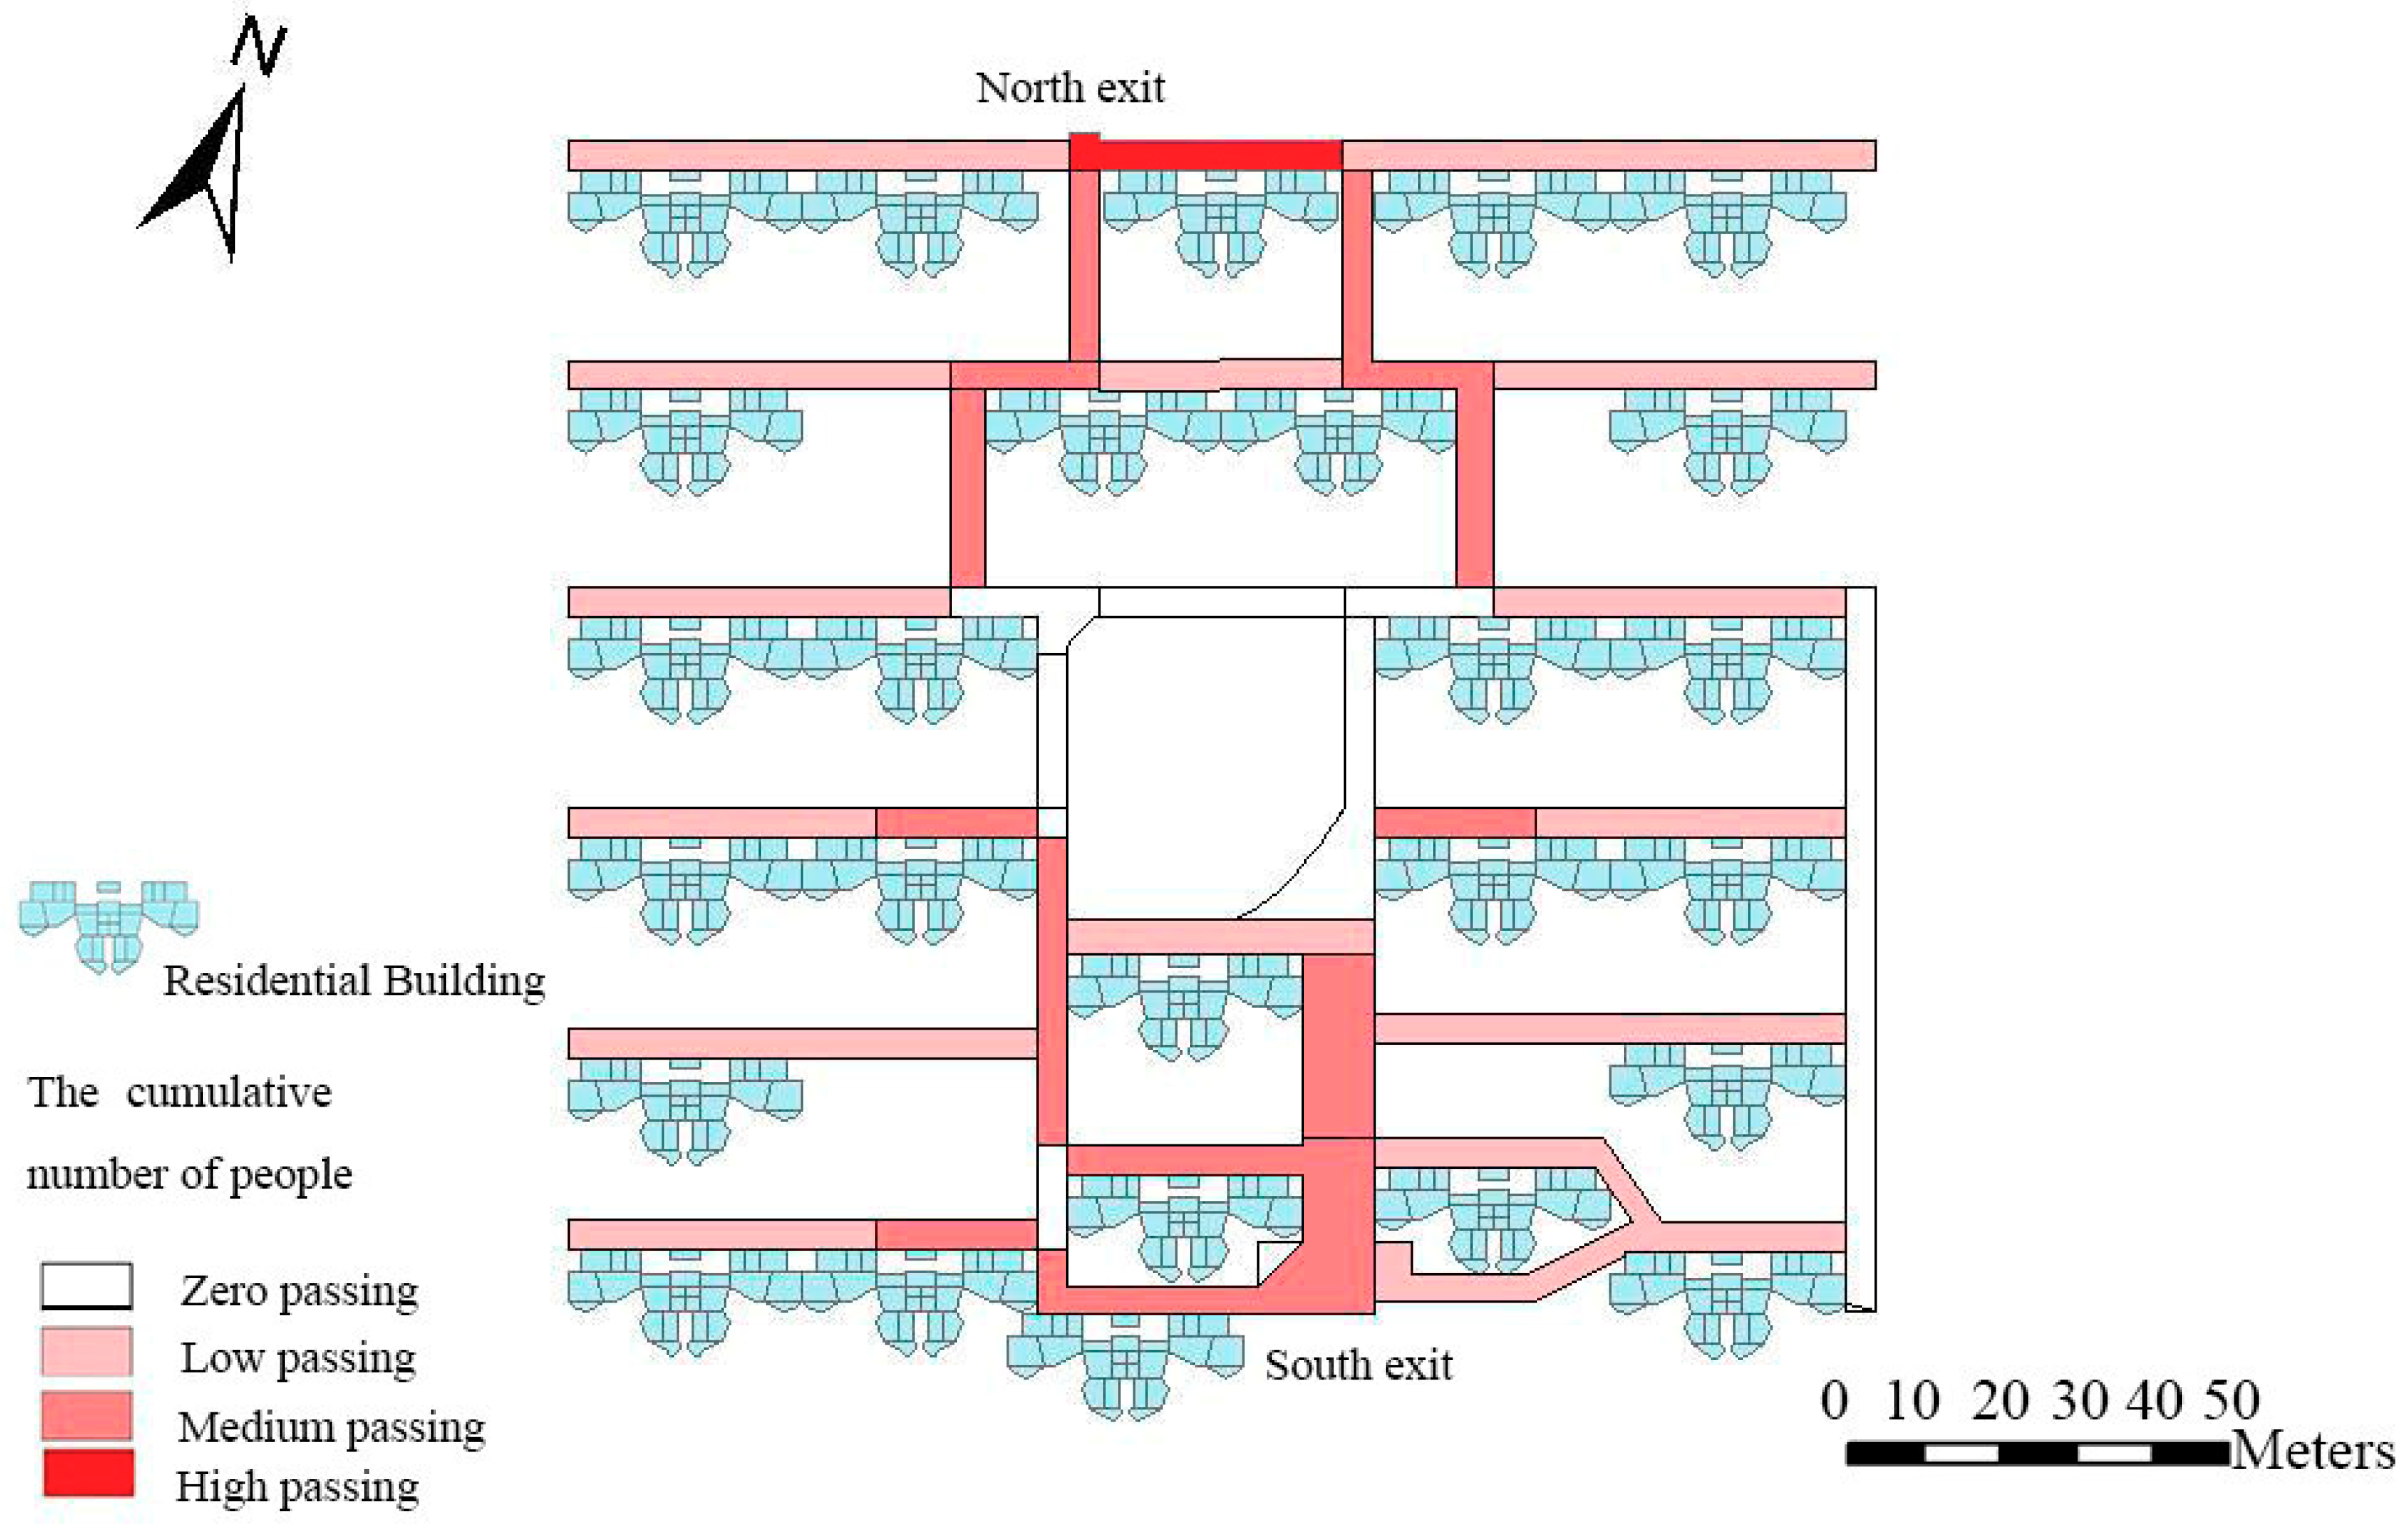
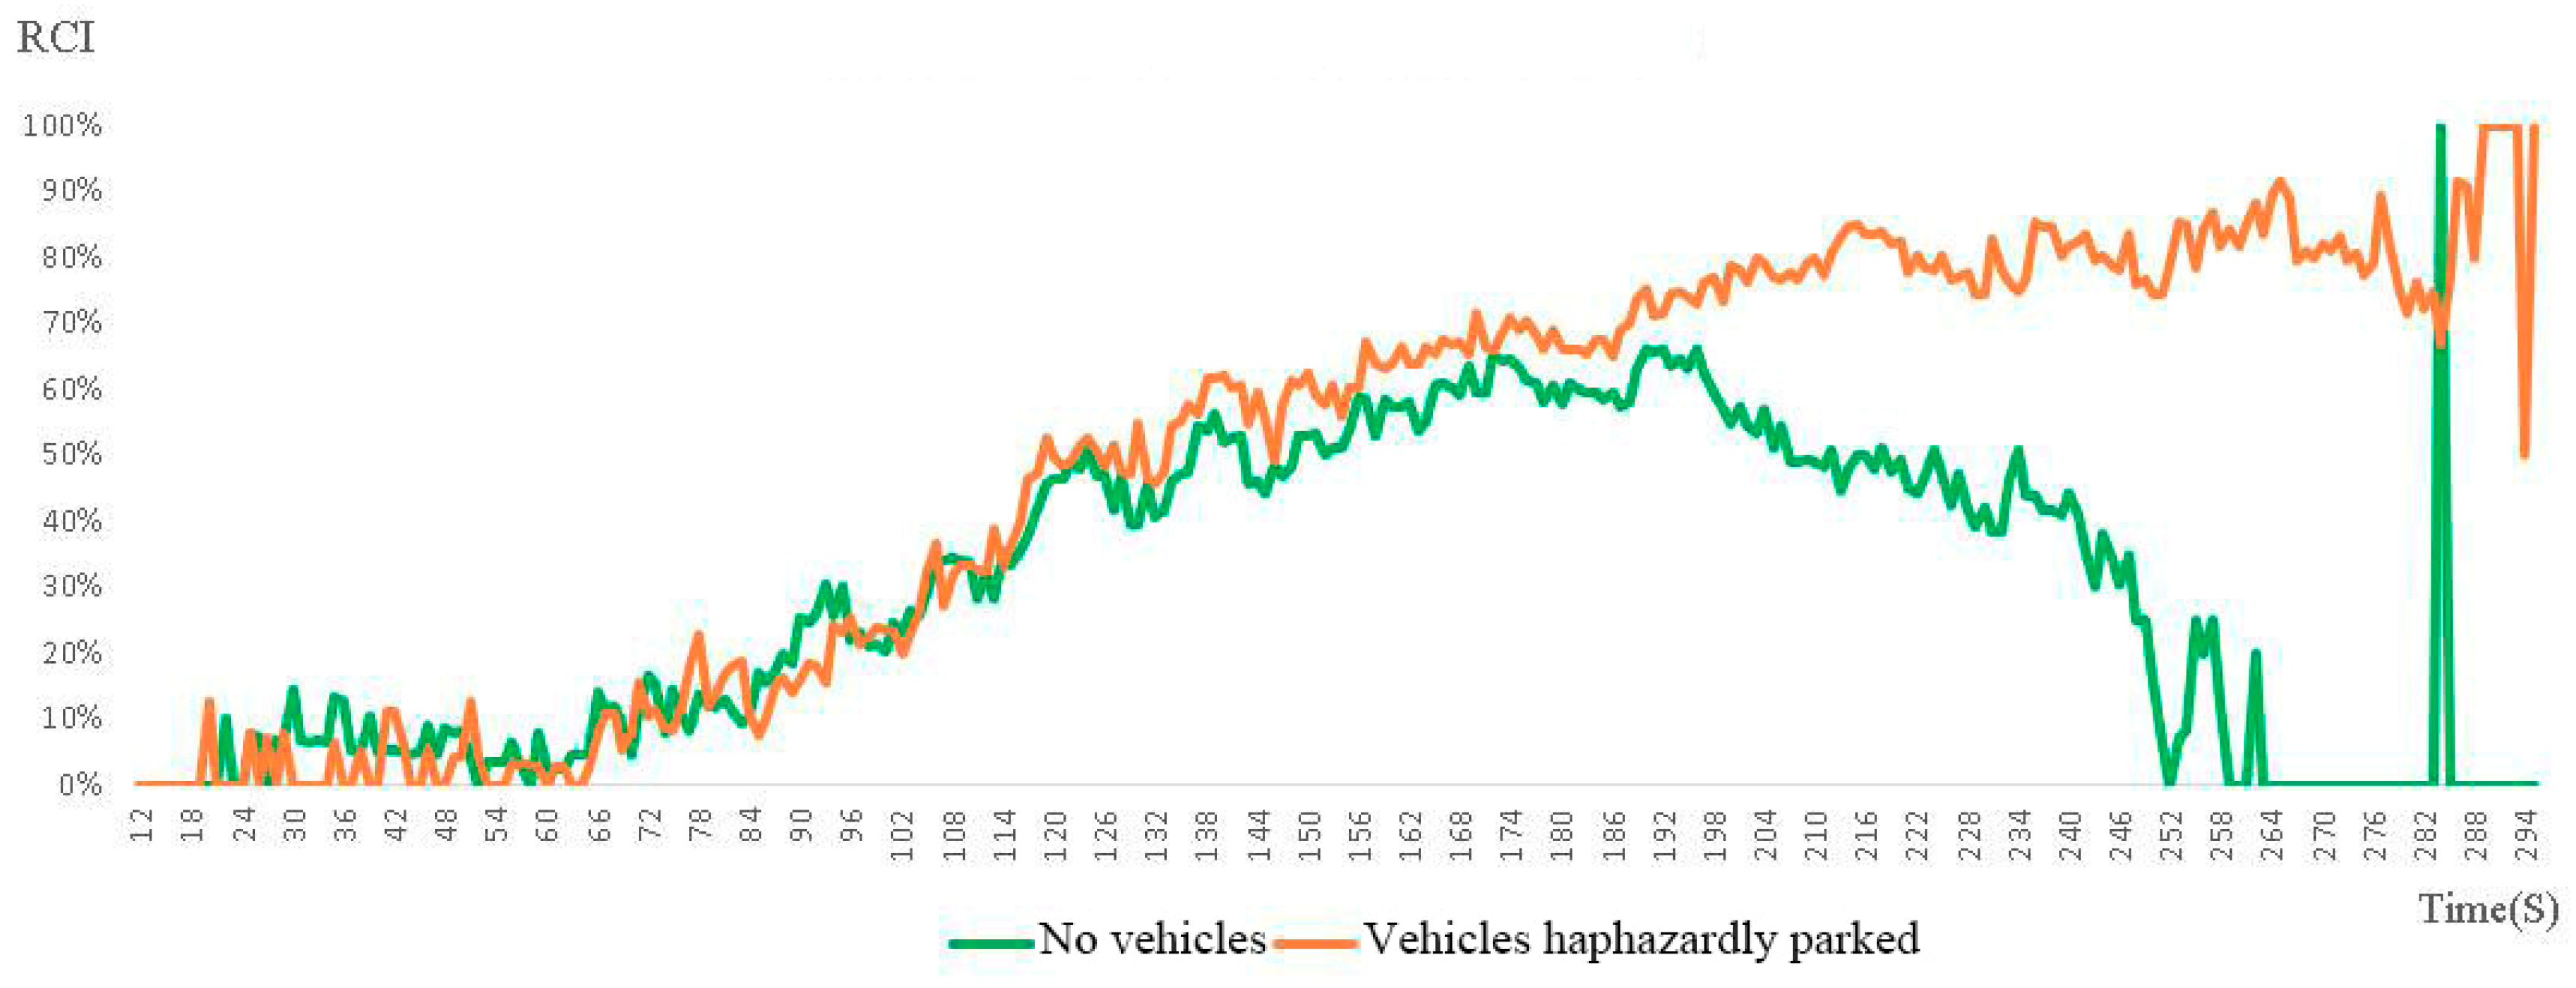
Once an emergency happens, the haphazardly parked vehicles on roads in the community will directly threaten the safety of the residents in evacuation. Before analyzing the easy-congested roads, to simplify the analysis procedure, the roads are classified into four levels in advance based on the cumulative number of people on road sections (Figure 12). These four levels are: zero-passing, low-passing, medium-passing and high-passing (Figure 15). We only simulated the scenario of vehicles haphazardly parked on low-passing, medium-passing and high-passing roads to reduce the workload. The RCI and the significance test method of road congestion are utilized to quantify the impact of the haphazardly parked vehicles on the road congestion and identify the easy-congested roads. Figure 16 presents the comparison of RCIs on high-passing roads under two different scenarios: “no vehicles” and “vehicles haphazardly parked”. The higher RCI value means higher degree of congestion on roads at a specific moment. After the evacuation process started about 200s, the high-passing roads became more and more congested in the “vehicles haphazardly parked” scenario. However, for the “no vehicles” scenario, the congesting situation was greatly reduced for these roads after 200s. Table 9 is the results of the significant test for the roads of different levels. It can be found that, on high-passing roads, the evacuation process will be more significantly impeded by the haphazardly parked vehicles than on other roads.
We integrated analyzing the cumulative number of people on different road sections and the influence of haphazardly parked vehicles on roads. The road sections have been classified into three different types after analyzing the cumulative number of people (Figure 15). In these three types, medium-passing and high-passing roads have much smaller p-value as shown in Table 9, which means these roads are easier to be congested during the evacuation process if haphazardly parked vehicles exist on these roads. After such analyzing, the “easy-congested roads can be found out. The spatial distribution of these roads is shown in Figure 17. These easy-congested roads need to be paid more attentions in emergency management.
3.4. Optimization Measures for Emergency Evacuation Management
1. Inside the residential buildings, the following measures need to be undertaken for the identified easy-crowded stairways:
a. Warning signs such as “No Sundries” should be set on the wall alongside the easy-crowded stairways to caution the evacuees. In the study area, three, four and five warning signs are needed in 4-story, 5-story and 6-story buildings, respectively. Totally 79 warning signs are needed to be set in the community.
b. The property company needs to post punishment measures for piling sundries on stairways. Residents will be fined if their behavior of piling sundries is reported by other residents or found by the routine safety inspection at the first time. If sundries are still piled after penalty, the property company has right to remove the sundries by force.
c. Key regions in buildings need to be paid close attentions when carrying out routine safety inspection. The property company should concentrate on stairways between the 3rd and 1st floors in eleven 6-story buildings. In three 5-story buildings, the stairways between the 3rd and 2nd floors should be emphatically checked. For four 4-story buildings in the study area, the stairways between the 2nd and 1st floors need to be firstly inspected during the routine safety inspection.
Taking the above measures, the average evacuation time of the 6-story, 5-story, and 4-story buildings can be reduced by 23s (18.7%), 1.8s (2.3%), and 21.1s (25.2%), respectively.
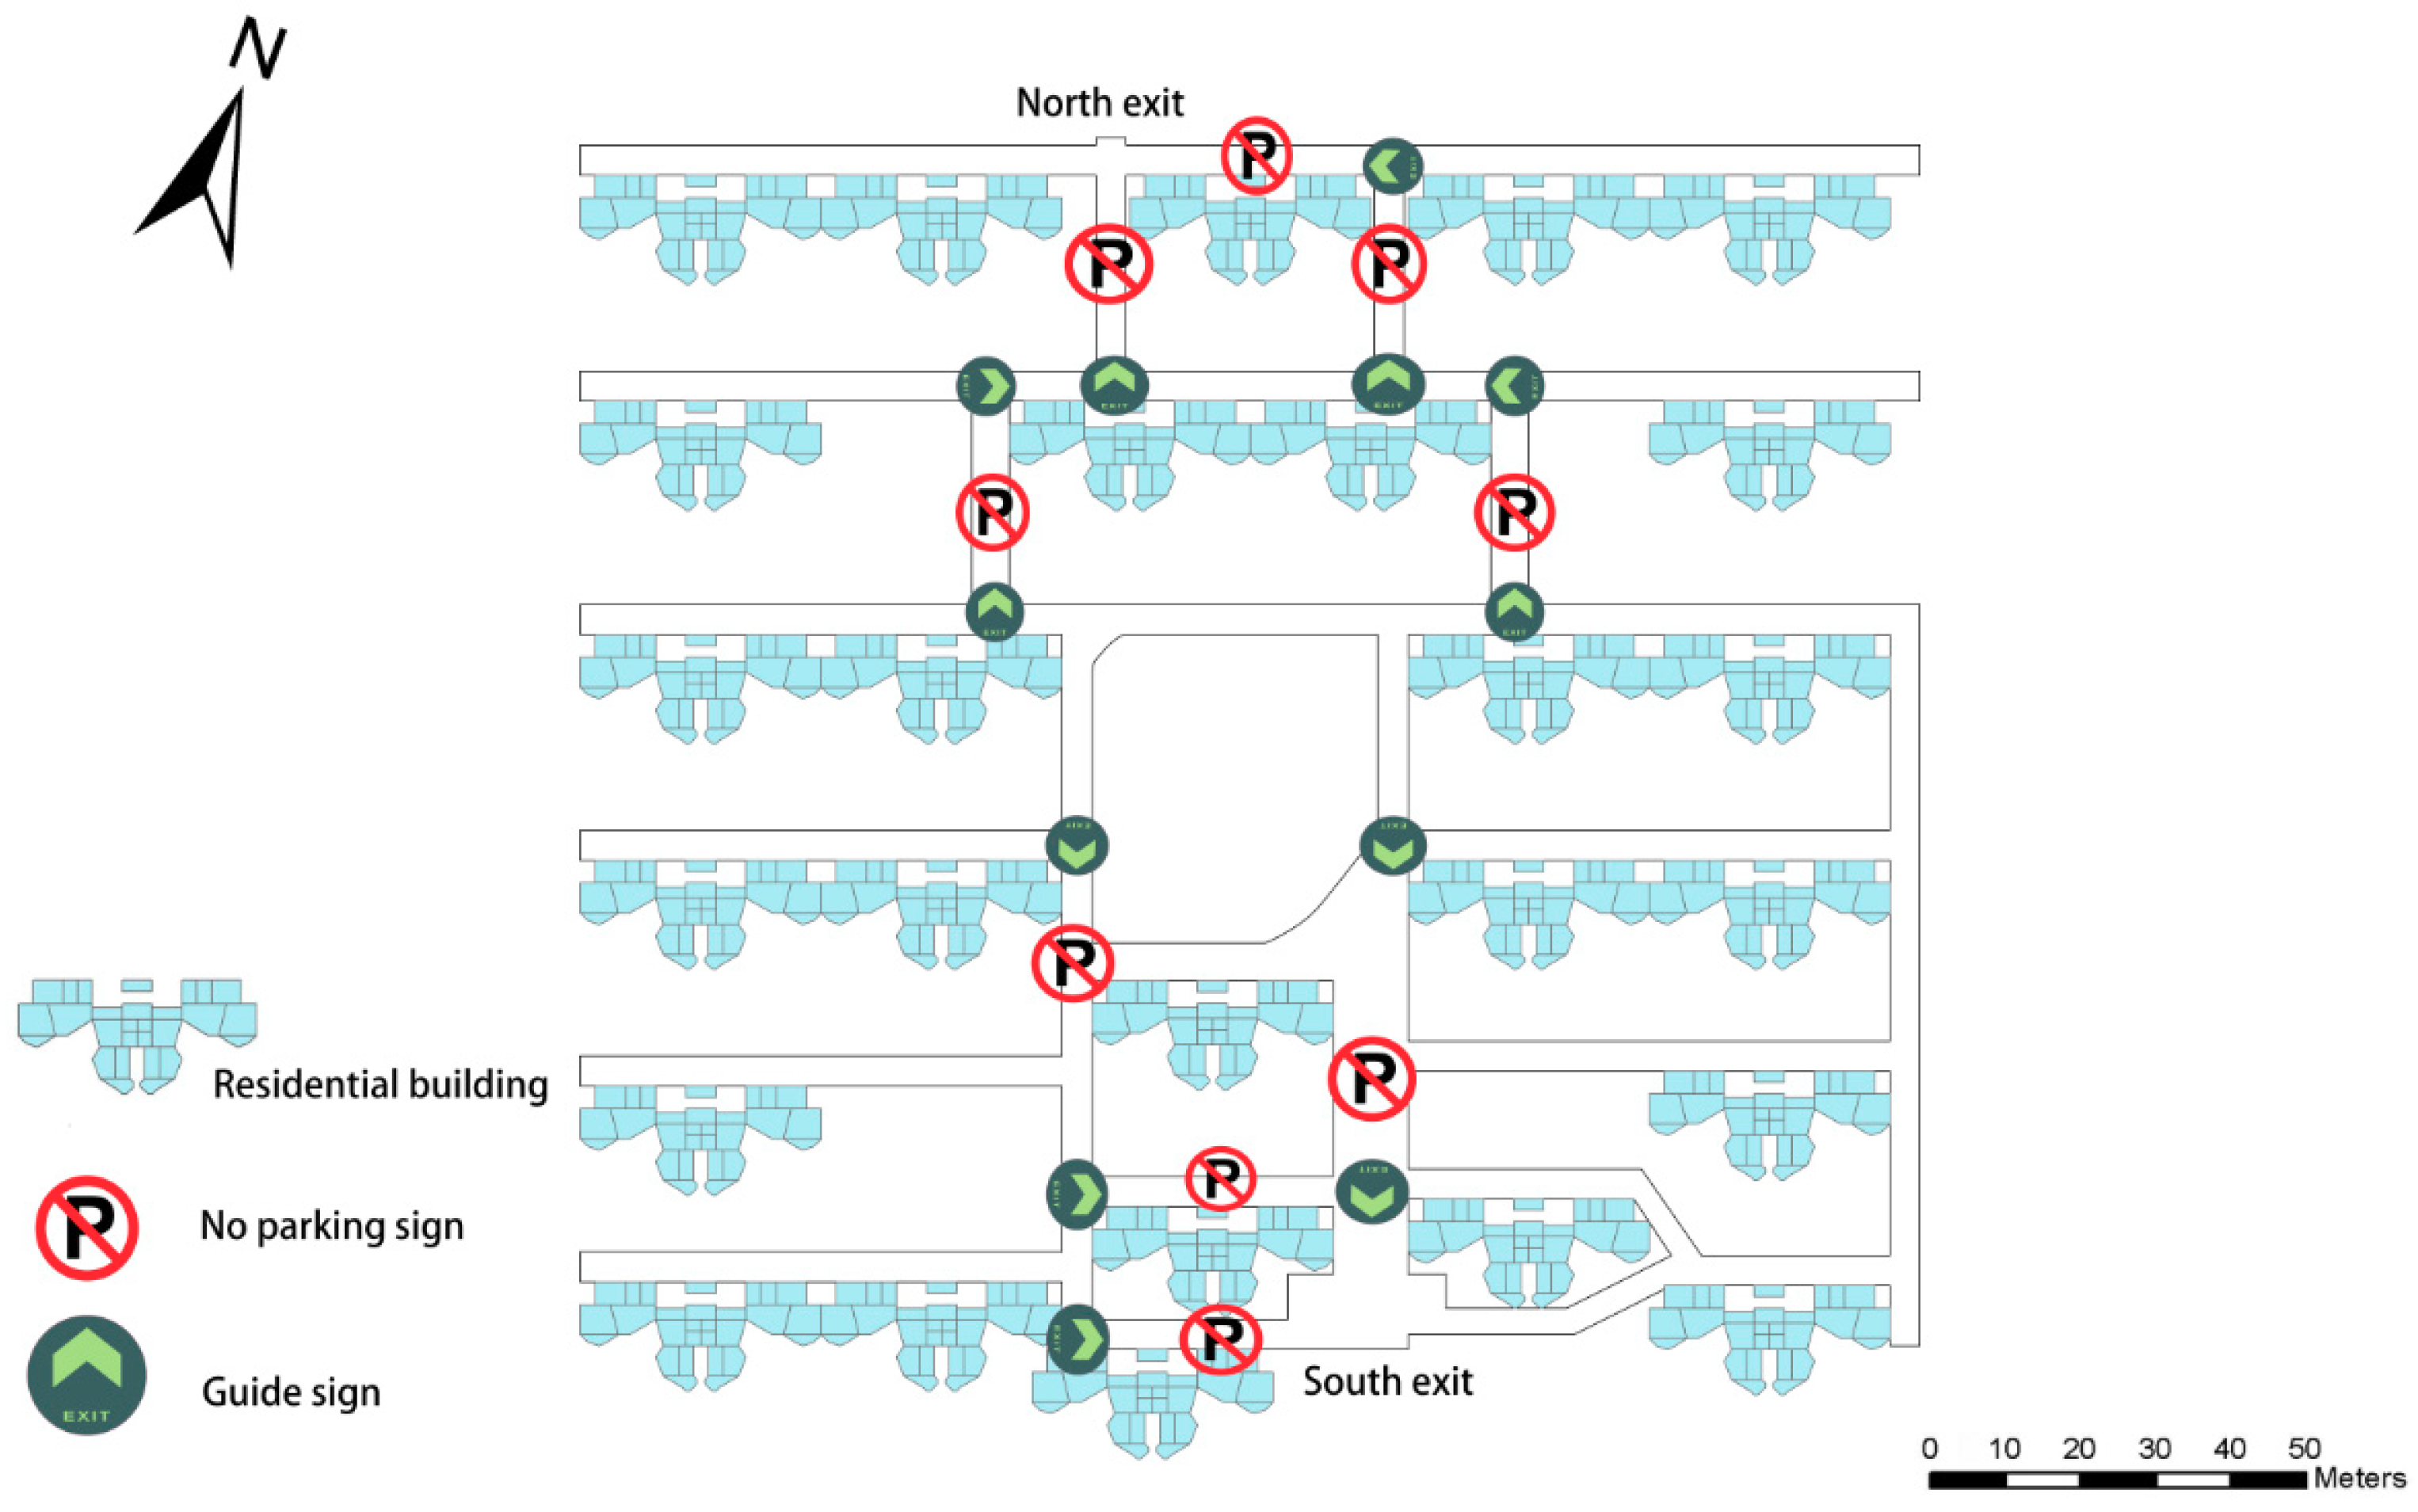
2. For the roads of the community, the following optimization measures need to be taken after identifying the easy-congested roads:
a. Twelve guide signs need to be established adjacent the road junctions and nine “No parking” signs are necessary to be set for the easy-congested roads (Figure 18).
In addition, the south exit is the main exit in the community. The property company should also remind the residents that the north exit can be the optimal selection for the residents who live in the north area, such as posting up an evacuation map in front of each building.
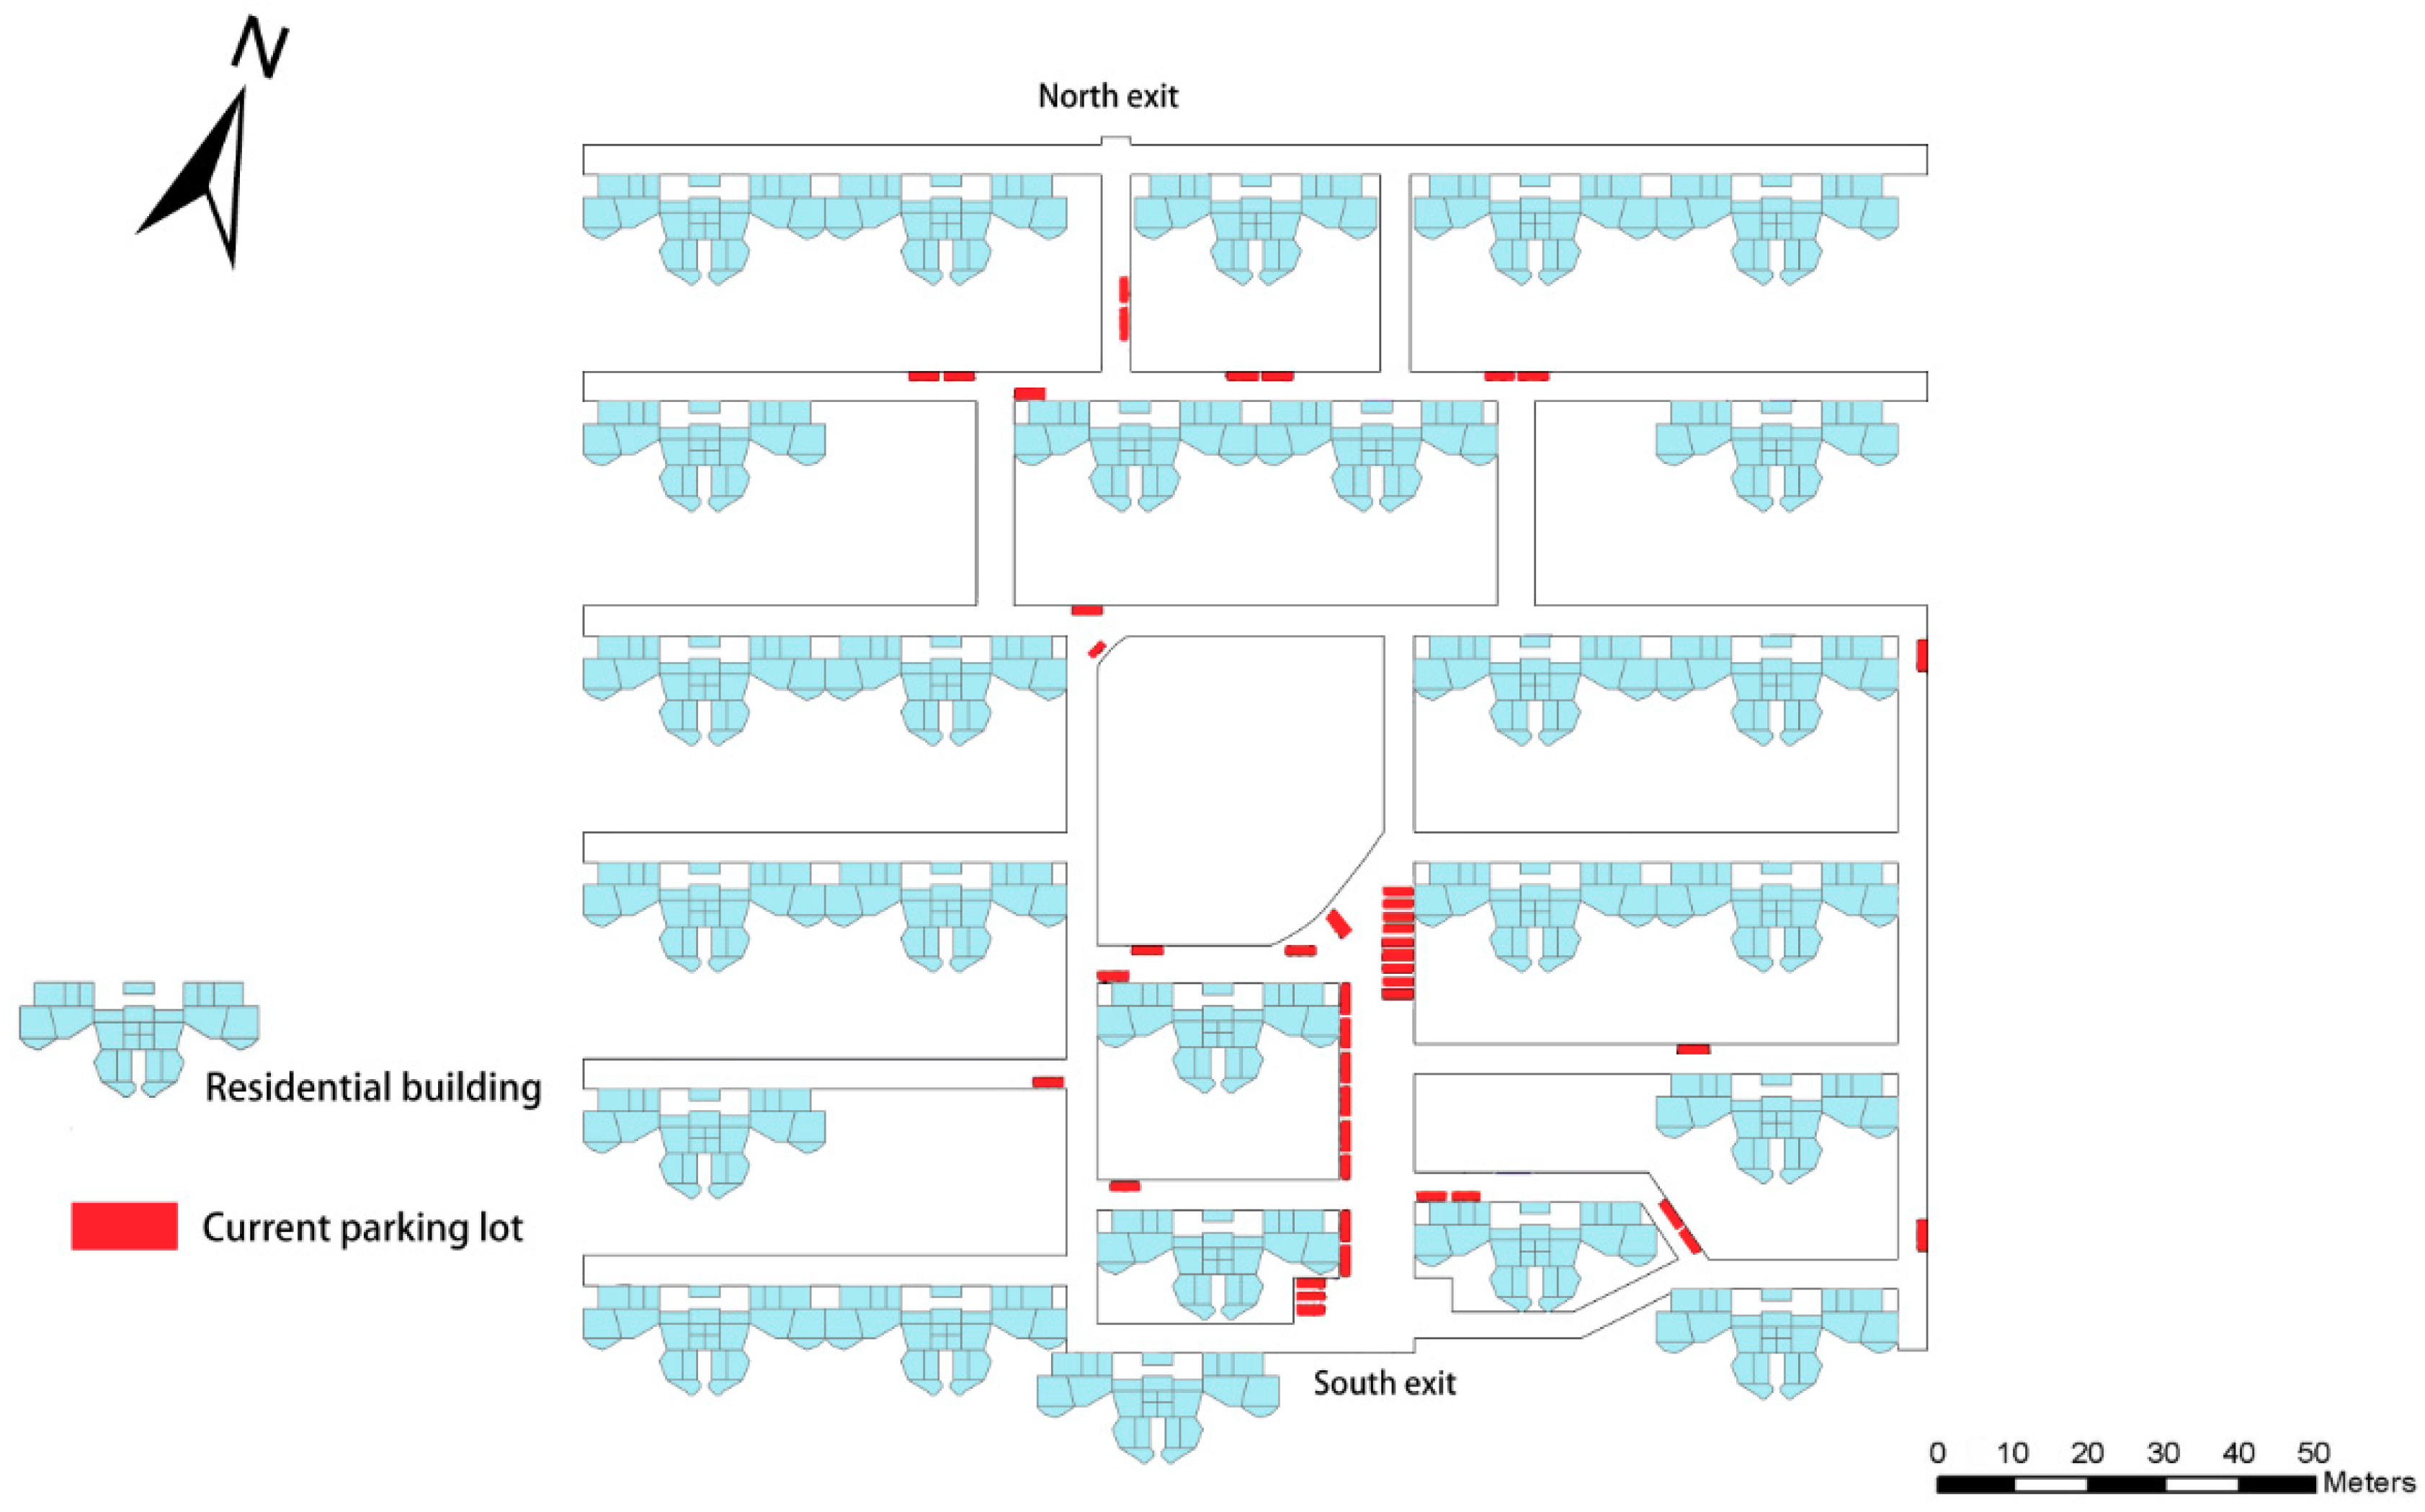
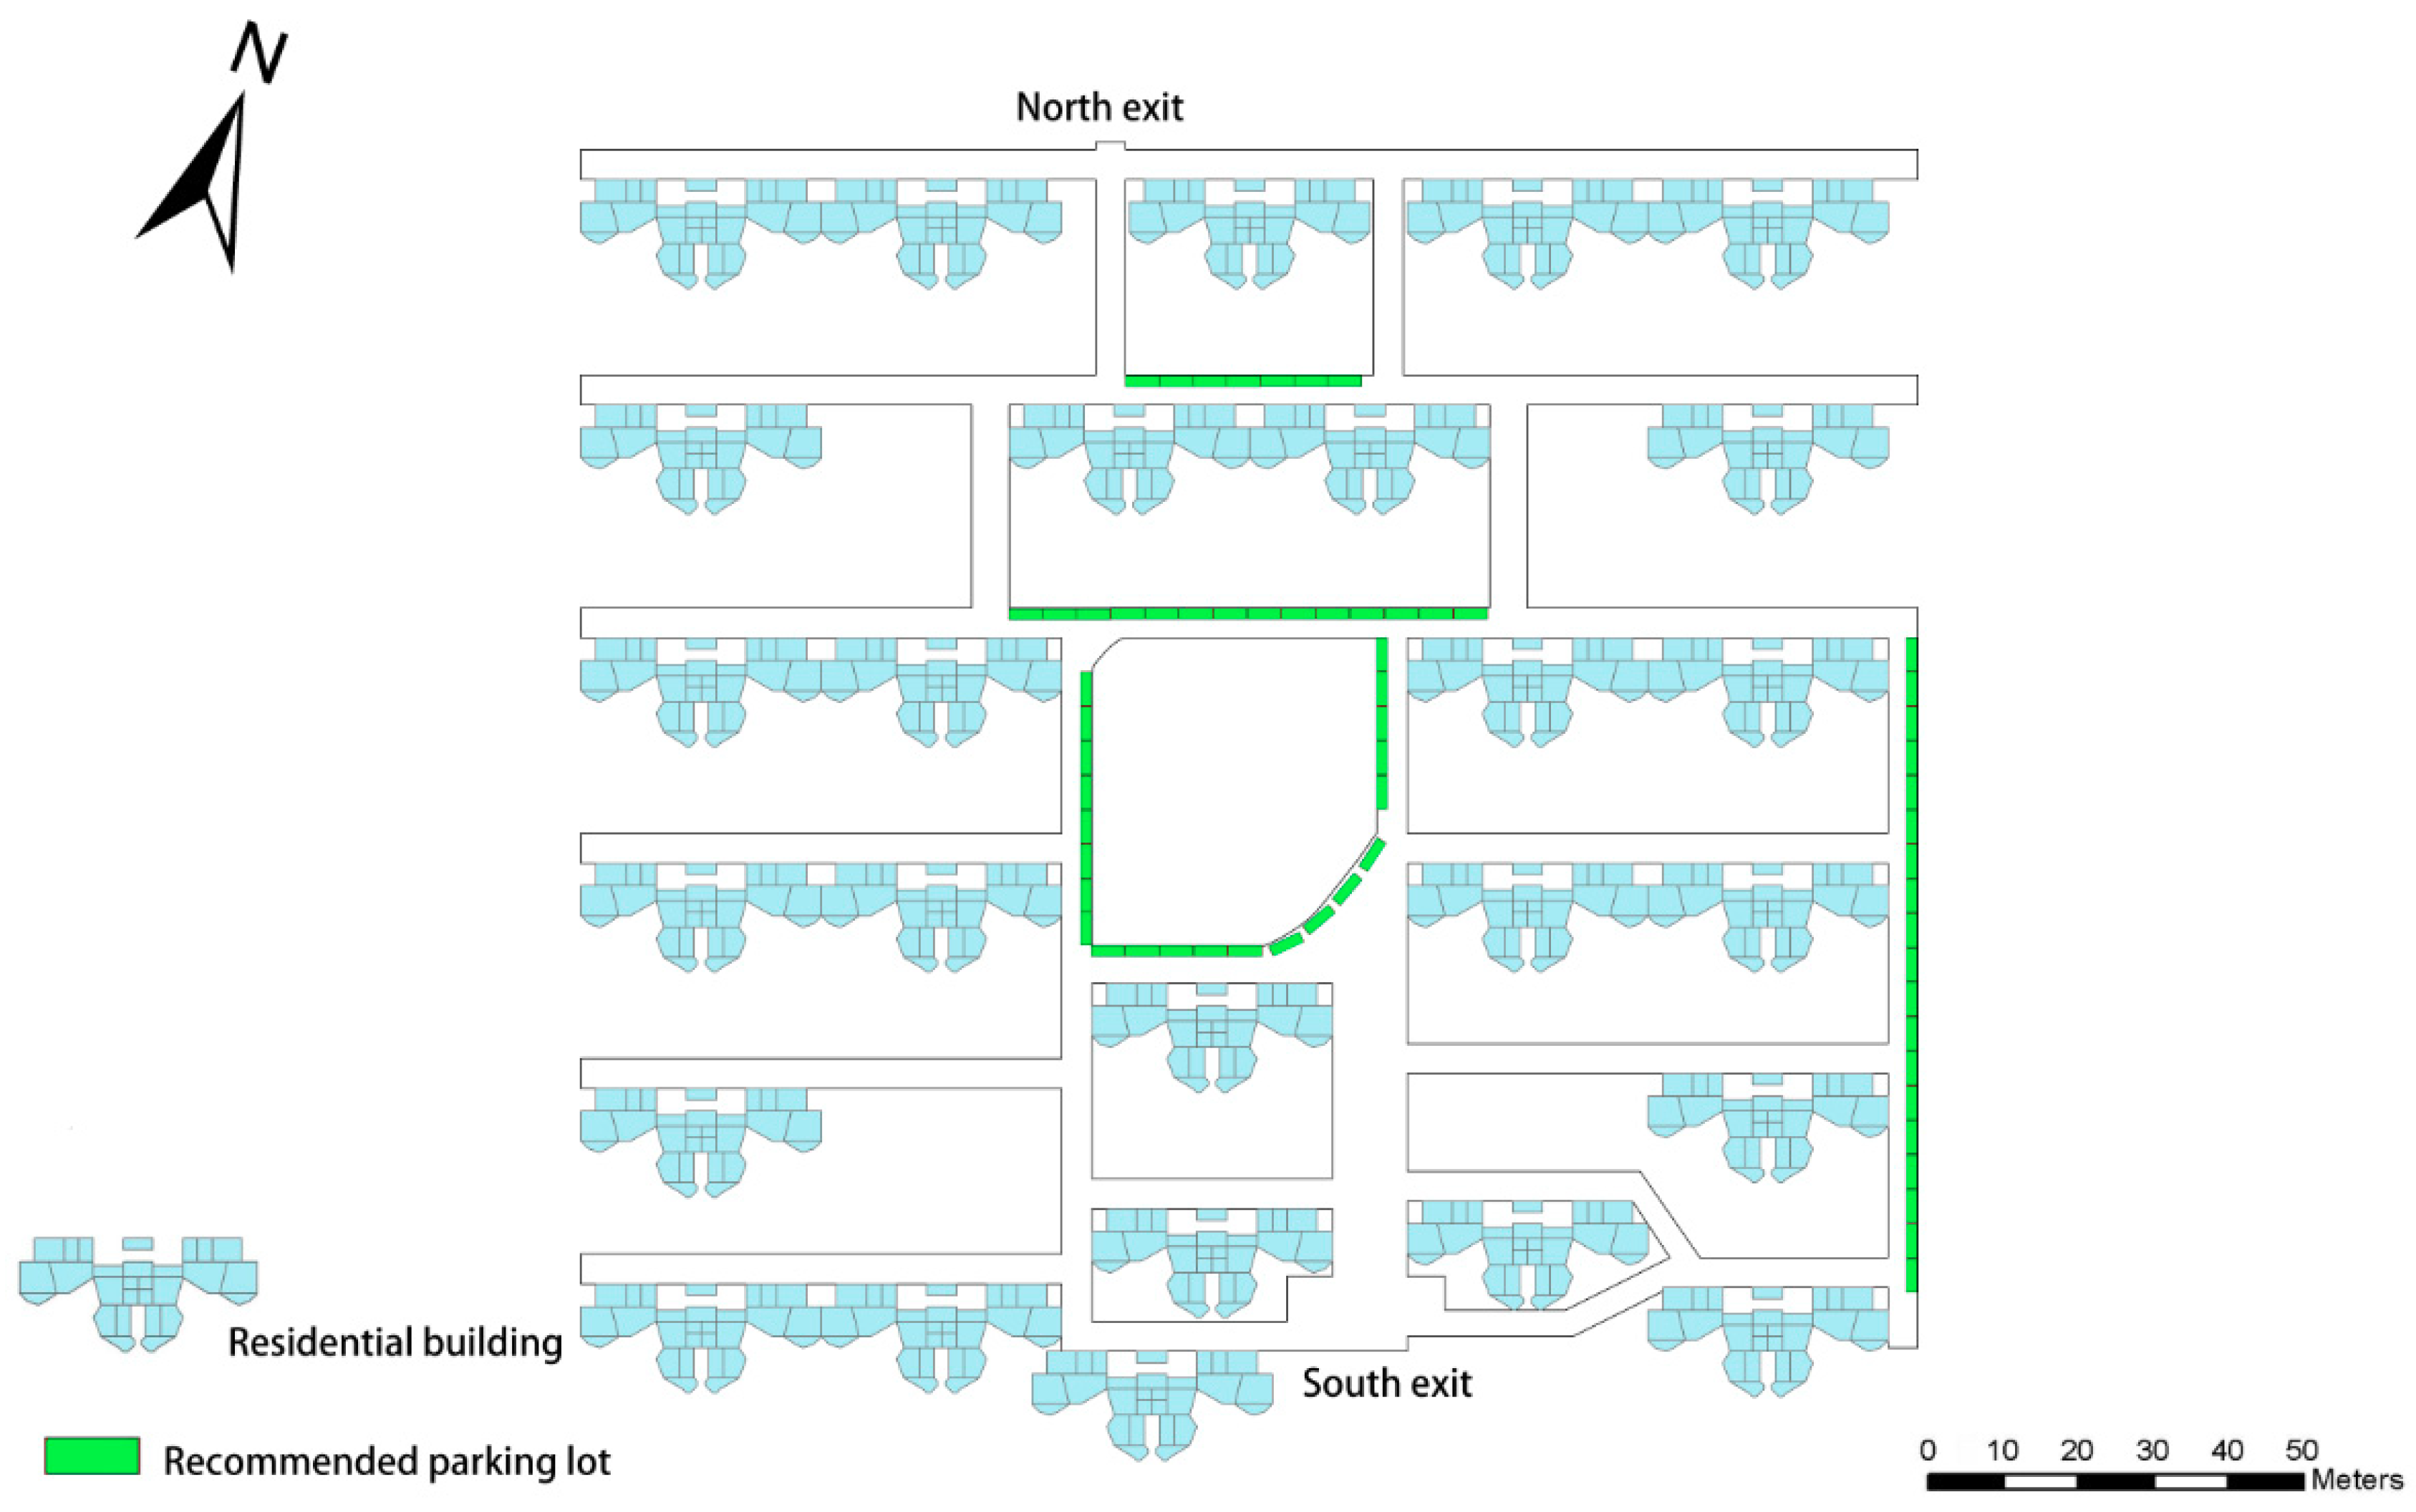
b. Currently, there are 42 parking lots in the community. Most of them are located on the easy-congested roads (Figure 19). This current situation of parking lots may impede the evacuation of residents. Therefore, the property company should re-plan new parking lots to avoid the easy-congested roads. We designed and distributed 62 new parking lots shown in Figure 20, which can be used to help re-planning the parking lots.
c. The property company of the community need to issue an announcement that residents cannot park vehicles haphazardly, especially on the easy-congested roads. Vehicles should be parked according to the recommended parking lots.
Taking the above optimization measures, the evacuation time can be reduced by 48.9s (12%), which will greatly increase the evacuation efficiency of residents.
4. Conclusions
This study proposes a new method for evacuation simulation and emergency management optimization in urban residential communities. The novelty and contribution of this study mainly lies in that it utilizes evacuation simulations in different scenarios to help finding potential problems in emergencies and can provide detailed measures for optimizing emergency management of residential communities. The method highlights the importance of a quick and secure evacuation and integrates indoor and outdoor evacuation processes of a residential community as a whole for evacuation simulations. Through analyzing the simulation results under different scenarios, potential evacuation problems could be revealed. Several optimization measures of both indoor and outdoor are also preset in the framework of the method for solving these evacuation problems and improving evacuation process. The advantage of this study is mainly in three aspects: (1) The method can identify easy-crowded stairways in indoor evacuation and easy-congested roads in outdoor evacuation after comprehensive simulations under different scenarios, such as sundries stacked and vehicles haphazardly parked. (2) Family evacuation behaviors of residents, which are quite different from the evacuation behaviors in public places (such as office buildings, subways or parks), can be simulated in this method. (3) Detailed management optimization measures can be spatially described on maps based on the multi-level analysis and comparison of the evacuation simulation results in different scenarios. These optimization measures can be useful for improving emergency evacuation management of urban communities. The spatiality of these measures makes them more visualized and intelligible than text description. Such management optimization measures provided in our study are usually neglected in previous evacuation simulation studies.
A case study in Changhongfang Community, Xuhui District, Shanghai, China was conducted to demonstrate the feasibility of the proposed method. After evacuation simulations and simulation result analysis, detailed evacuation time in buildings and on roads, were got for each scenario. Other critical spatial indicators, such as cumulative number of people on roads, easy-crowded stairways and easy-congested roads, were also generated to reveal the potential evacuation problems. For resolving these problems, detailed optimization measures were put forward to improve evacuation efficiency and to reduce evacuation risks. The proposed method can be easily applied in other similar case studies. It provides a scientific and technical support for emergency evacuation management for urban residential communities. The optimization measures can help residents in communities to be evacuated more efficiently in disasters or emergency events.
The method proposed in this study also has the following two main limitations: (1) The method relies on ultra-detailed micro-scale data of buildings and residents which may not easily available for larger areas. (2) PathFinder is a commercial software, which is not open-sourced and does not support programming. Therefore, it cannot set more evacuation behaviors for residents. We will improve our method to break the limitation and support larger study areas and more evacuation behaviors in the future study.
Author Contributions
Conceptualization, J.Y. and H.C.; Methodology, H.C.; Validation, J.Y., H.C. and M.Y.; Formal Analysis, H.C.; Investigation, H.C.; Resources, J.W. and J.Y.; Data Curation, H.C.; Writing-Original Draft Preparation, H.C.; Writing-Review & Editing, J.Y. and Y.C.; Visualization, H.C.; Supervision, J.Y.; Project Administration, J.Y.; Funding Acquisition, J.Y.
Funding
The study was funded by the National Natural Science Foundation of China (Grant No. 41201548, 5161101688 and 71603168), and National Social Science Foundation of China (Grant No. 18ZDA105).
Conflicts of Interest
The authors declare no conflict of interest.
References
- Yu, J.; Zhang, C.R.; Wen, J.H.; Li, W.D.; Liu, R.; Xu, H. Integrating Multi-agent Evacuation Simulation and Multi-criteria Evaluation for Spatial Allocation of Urban Emergency Shelters. Int. J. Geogr. Inf. Sci. 2018, 32, 1884–1910. [Google Scholar] [CrossRef]
- Lin, Y.; Ding, C.; Wu, C.; Ma, T.; Jiang, X. Analysis on high density community emergency evacuation behavior. Planners 2013, 29, 105–109. [Google Scholar]
- Elba, U.; Brian, W. National review of hurricane evacuation plans and policies: A comparison and contrast of state practices. Transp. Res. Part A Policy Pract. 2003, 37, 257–275. [Google Scholar]
- Zhu, Z.; Peng, Z.C. Shared Situation Awreness in Crises and Multi-agent Collaboration Performance during Emergencies—A Case Study of Shanghai New Year Eve Stampede Incident. J. Risk Disaster Crisis Res. 2017, 3, 152–172. (In Chinese) [Google Scholar]
- Lim, H.R.; Lim, M.B.B.; Piantanakulchai, M. Determinants of household flood evacuation mode choice in a developing country. Nat. Hazards 2016, 84, 507–532. [Google Scholar] [CrossRef]
- Nordbeck, S. Computer cartography, shortest route programs. Lund Stud. Geogr. Ser. C 1969, 9, 53. [Google Scholar]
- Parr, S.A.; Kaisar, E. Critical intersection signal optimization during urban evacuation utilizing dynamic programming. J. Transp. Saf. Secur. 2011, 3, 59–76. [Google Scholar] [CrossRef]
- Knuth, D. A generalization of Dijkstra’s algorithm. Inf. Proc. Lett. 1977, 6, 1–7. [Google Scholar] [CrossRef]
- Dorigo, M. Ant colony optimization. Scholarpedia 2007, 2, 1461. [Google Scholar] [CrossRef]
- Isobe, M.; Adachi, T.; Nagatani, T. Experiment and simulation of pedestrian counter flow. Physica. A 2004, 336, 638–650. [Google Scholar] [CrossRef]
- Yang, L.; Zhao, D.; Li, J.; Fang, T. Simulation of the kin behavior in building occupant evacuation based on cellular automaton. Build. Environ. 2005, 40, 411–415. (In Chinese) [Google Scholar] [CrossRef]
- Helbing, D.; Molnar, P. Social force model for pedestrian dynamics. Phys. Rev. E 1995, 51, 4282. [Google Scholar] [CrossRef]
- Blue, V.; Adler, J. Cellular automata microsimulation of bidirectional pedestrian flows. Transport. Res. Rec. 1995, 1678, 135–141. [Google Scholar] [CrossRef]
- Li, S. Reserch on Simulation of Individual Emergency Evacuation in Residential. Ph.D. Thesis, Harbin Institute of Technology, Harbin, China, 2007. (In Chinese). [Google Scholar]
- Bengtson, V.L. Beyond the Nuclear Family: The Increasing Importance of Multigenerational Bonds: The burgess award lecture. J. Marriage Fam. 2001, 63, 1–16. [Google Scholar] [CrossRef]
- Wu, D. Study on Safety Evacuation of High-Rise Residential Building in Fire Condition. Ph.D. Thesis, Tianjin University of Technology, Tianjin, China, 2009. (In Chinese). [Google Scholar]
- Yu, J.; Wen, J. Multi-criteria satisfaction assessment of the spatial distribution of urban emergency shelters based on high-precision population estimation. Int. J. Disaster Risk. Sci. 2006, 7, 413–429. [Google Scholar] [CrossRef]
- Molinari, D.; Scorzini, A.R. On the Influence of Input Data Quality to Flood Damage Estimation: The Performance of the INSYDE Model. Water 2017, 9, 688. [Google Scholar] [CrossRef]
- Shields, T.; Boyce, K. A study of evacuation from large retail stores. Fire Saf. J. 2000, 35, 25–49. [Google Scholar] [CrossRef]
- Zhen, J. Passway for Escaping Was Blocked When Fire Occured. Available online: http://wx.sina.com.cn/news/wxnews/2017-02-28/detail-ifyavvsk3862675.shtml (accessed on 27 December 2018). (In Chinese).
- Bai, L.J. Sundries Piled on Stairways of Residential Buildings Is Universal. Available online: http://www.xinhuanet.com//house/sjz/2015-02-02/c_1114214577.htm (accessed on 27 December 2018). (In Chinese).
- Du, Q. It Is Dangerous to Pile up Sundries in Stairways. Available online: http://yzwb.sjzdaily.com.cn/html/2015-02/02/content_1138719.htm (accessed on 5 December 2018). (In Chinese).
- Yang, N. The Sundries on the Stairways Caught Fire and 6 People Were Injured. Available online: http://ehsb.hsw.cn/shtml/hsb/20180104/672672.shtml (accessed on 5 December 2018). (In Chinese).
- People’s Net. The Fire Engine Could Not Enter the Community Because Some People Occupied the Fire Road Parking. Available online: http://leaders.people.com.cn/n1/2018/0418/c178291-29933138.html (accessed on 5 December 2018). (In Chinese).
- Gao, Y. On Fire, but the Fire Engine Can’t Come in. Available online: http://newspaper.jcrb.com/html/2015-11/25/content_200647.htm (accessed on 5 December 2018). (In Chinese).
- Hu, M.W.; Shi, Q.X. Comparative study of pedestrian simulation model and related software. J. Transp. Inf. Saf. 2009, 27, 122–127. [Google Scholar]
- Wang, H.R.; Chen, Q.G.; Yan, J.B.; Yuan, Z.; Liang, D. Emergency guidance evacuation in fire scene based on pathfinder. In Proceedings of the 2014 7th International Conference on Intelligent Computation Technology and Automation (ICICTA), Changsha, China, 25–26 October 2014; pp. 226–230. [Google Scholar]
- Li, Y.; Sun, X.; Feng, X. Study on evacuation in subway transfer station fire by STEPS. Procedia Eng. 2012, 45, 735–740. [Google Scholar] [CrossRef]
- Mas, E.; Bruno, A.; Shunichi, K. An integrated simulation of tsunami hazard and human evacuation in La Punta, Peru. J. Disaster Res. 2013, 8, 285–295. [Google Scholar] [CrossRef]
- Ren, C.R.; Yang, C.H.; Jin, S.Y. Agent-based modeling and simulation on emergency evacuation. In Proceedings of the International Conference on Complex Sciences, Shanghai, China, 23–25 February 2009. [Google Scholar]
- Yang, B.; Wu, Y.G.; Wang, C. A multi-agent and GIS based simulation for emergency evacuation in park and public square. In Proceedings of the International Conference on Computational Intelligence and Security, Beijing, China, 11–14 December 2009; Volume 1. [Google Scholar]
- MacDonald, M. STEPS Simulation of Transient and Pedestrian movements User Manual; Mott MacDonald Ltd.: Croydon, UK, 2007. [Google Scholar]
- Du, C.B.; Zhu, G.Q.; Li, J.Y. Comparative study on evacuation simulation software STEPS and pathfinder. Fire Sci. Technol. 2015, 34, 456–460. (In Chinese) [Google Scholar]
- NetLogo Official Website [EB/OL]. Available online: http://ccl.northwestern.edu/netlogo/ (accessed on 1 February 2019).
- The NetLogo User Manual. Available online: http://ccl.northwestern.edu/netlogo/docs/NetLogo%20User%20Manual.pdf (accessed on 1 February 2019).
- Hart, P.E.; Nilsson, N.J.; Raphael, B. A formal basis for the heuristic determination of minimum cost paths. IEEE Trans. Cybern. 1968, 4, 100–107. [Google Scholar] [CrossRef]
- Zhen, C. Calculation principle of fire safety evacuation time. Constr. Budg. 2015, 10, 20–22. (In Chinese) [Google Scholar]
- Ministry of Public Security. Architectural Design Code for Fire Protection, GB2014; Ministry of Public Security: Beijing, China, 2014. (In Chinese)
- Chen, R.; Dong, L.-Y. Observations and preliminary analysis of characteristics of pedestrian traffic in Chinese metropolis. J. Shanghai Univ. 2005, 11, 93–97. (In Chinese) [Google Scholar]
- Dewar, R.E.; Olson, P.L.; Gerson, J. Human Factors in Traffic Safety. Available online: https://pdfs.semanticscholar.org/b741/85c28244163e6cff4881be4cdd19a47441f2.pdf (accessed on 5 December 2018).
- Hoogendoorn. Pedestrian Dynamics-Presentation. Available online: http://vkkcitg.tudelft.nl/verkeerskunde/staff/hoogen-doorn (accessed on 5 December 2018).
- Liang, Y.L.; Zhang, X.; He, S.H. Measurement and analyses on the body date of 6~12 school age children. J. Xi’an Univ. Eng. Sci. Technol. China 2004, 18, 115–120. [Google Scholar]
- Colonna, P.; Berloco, N.; Ronchi, E. Optimising fire protection and safety in road tunnels by readjusting risk analysis strategy. In Proceedings of the Conference on Fire Protection & Safety, Paris, France, 1 January 2009. [Google Scholar]
- Worm, E. Human Behaviour Influencing Tunnel Safety; Dutch Ministry of Transport: The Hague, The Netherlands, 2006.
- Colonna, P.; Pascazio, R.; Sinatra, M. Road safety and user behavior. In Proceedings of the 2007 International Congress of Psychotechnics, Bari, Italy, 14–16 March 2007. [Google Scholar]
- Gandit, M.; Kouabenan, D.R.; Caroly, S. Road-tunnel fires: Risk perception and management strategies among users. Saf. Sci. 2008, 47, 105–114. [Google Scholar] [CrossRef]
Figure 1.
Framework of the proposed method.

Figure 2.
Sundries on the stairway in a building of Changhongfang community.

Figure 3.
A resident’s planned path with waypoints.

Figure 4.
Aerial photo of Changhongfang Community, Xuhui District, Shanghai, China.

Figure 5.
Layout of indoor apartments, corridors and stairways in Changhongfang Community, Xuhui District, Shanghai, China.
Figure 5.
Layout of indoor apartments, corridors and stairways in Changhongfang Community, Xuhui District, Shanghai, China.

Figure 6.
Three-dimensional model of a six-story building in Changhongfang Community, Xuhui District, Shanghai, China.
Figure 6.
Three-dimensional model of a six-story building in Changhongfang Community, Xuhui District, Shanghai, China.

Figure 7.
Three-dimensional model of Changhongfang Community, Xuhui District, Shanghai, China.

Figure 8.
Sketches of evacuation mode in buildings (in case of a fire emergency).

Figure 9.
Line chart of children’s average walking speeds at different ages.

Figure 10.
Gauss (normal) distribution of walking speeds of young women.

Figure 11.
Cumulative number of people on roads under the four scenarios.

Figure 12.
Cumulative number of people on different road sections.

Figure 13.
A contrastive case whether sundries exits or not in stairways between the 1st and 2nd floor (the red part represents stacked sundries).
Figure 13.
A contrastive case whether sundries exits or not in stairways between the 1st and 2nd floor (the red part represents stacked sundries).

Figure 14.
Comparison of regional congestion index (RCI) in the stairway between the 1st and 2nd floors of a 6-story building under the situation of sundries stacked and no sundry.
Figure 14.
Comparison of regional congestion index (RCI) in the stairway between the 1st and 2nd floors of a 6-story building under the situation of sundries stacked and no sundry.

Figure 15.
Four levels of roads of Changhongfang Community, Shanghai, China.

Figure 16.
Comparison of regional congestion index (RCI) on high-passing roads between two scenarios of vehicles haphazardly parked and no vehicles.
Figure 16.
Comparison of regional congestion index (RCI) on high-passing roads between two scenarios of vehicles haphazardly parked and no vehicles.

Figure 17.
Spatial distribution of easy-congested roads in Changhongfang Community, Shanghai, China.
Figure 17.
Spatial distribution of easy-congested roads in Changhongfang Community, Shanghai, China.

Figure 18.
“No parking” sign and guide sign on roads.

Figure 19.
Current parking lots in Changhongfang community.

Figure 20.
Recommended parking lots.


Table 1.
Comparison of STEPS, Pathfinder, Netlogo, Swarm and Repast. Comparison of three categories: “principle”, “user interface” and “support programming” [30,35].
| Software | Principle | User Interface | Support Programming |
|---|---|---|---|
| STEPS | CA model | 3D | No |
| Pathfinder | Agent-based model | 3D | No |
| Netlogo | Agent-based model | 2D | Yes |
| Swarm | Agent-based model | Non-graphical | Yes |
| Repast | Agent-based model | 2D | Yes |
Table 2.
Comparison of STEPS, Pathfinder, Netlogo, Swarm and Repast. Comparison of two categories: “rules that can be imposed on the agent” and “types of agents”.
Table 2.
Comparison of STEPS, Pathfinder, Netlogo, Swarm and Repast. Comparison of two categories: “rules that can be imposed on the agent” and “types of agents”.
| Software | Rules that Can Be Imposed on the Agent | Types of Agents |
|---|---|---|
| STEPS | ||
| Pathfinder | Support two movement simulation modes: “Steering” and “SFPE”. In “Steering” mode, individuals use the steering system to maintain a reasonable distance with others or obstructions. In SFPE mode, individuals do not attempt to avoid others and are allowed to interpenetrate with others. The velocity of movement is controlled by the density of individuals. | Individuals and movement space |
| Netlogo | NetLogo has a models library, a large collection of pre-written simulations that can be used and modified, and allows developers to create their own models. Developers can give instructions to hundreds or thousands of “agents” all operating independently. | Turtles, patches, links and the observer |
| Swarm | The class library of Swarm builds a simulation system that allows agents and elements in the system to interact through discrete events. | Customizable agents |
| Repast | The visual point-and-click tools in Repast are provided for designing agent model, specifying agent behavior, executing model, and examining results | Customizable agents |
Table 3.
Comparison of STEPS, Pathfinder, Netlogo, Swarm and Repast. Comparison of three categories: “characteristics”, “available materials” and “usage”.
Table 3.
Comparison of STEPS, Pathfinder, Netlogo, Swarm and Repast. Comparison of three categories: “characteristics”, “available materials” and “usage”.
| Software | Characteristics | Available materials | Usage |
|---|---|---|---|
| STEPS | Evacuation simulation software | Architectural geometric model and personnel parameter options | Specialized for evacuation simulation |
| Pathfinder | Evacuation simulation software | Floors, rooms, obstructions, doors, etc | Specialized for evacuation simulation |
| NetLogo | Free simulation platform | Objects and environment | Natural/Social system simulation |
| Swarm | Object-oriented framework | Model Swarm, observer Swarm, individual Agent and environment | Any physical, economic or social system simulation |
| Repast | Free simulation platform | Agent, model, behavior and data source | Natural/Social system simulation |
Table 4.
Walking speeds of different sex and age groups.
| Category | Average Speed (m/s) | Number of Samples |
|---|---|---|
| Elderly woman | 1.08 | 246 |
| Middle-aged woman | 1.20 | 621 |
| Young woman | 1.27 | 1002 |
| Elderly man | 1.10 | 286 |
| Middle-aged man | 1.25 | 829 |
| Young man | 1.32 | 949 |
Table 5.
Different evacuation times result from sensitivity analysis for No. 25 residential building.
Table 5.
Different evacuation times result from sensitivity analysis for No. 25 residential building.
| Floor where Residents are all Alternated to Elderly People | Evacuation Time (s) | Initial Evacuation Time (s) |
|---|---|---|
| 1st floor | 115.8 | 117 |
| 2nd floor | 115.8 | |
| 3rd floor | 115.8 | |
| 4th floor | 116 | |
| 5th floor | 117.3 | |
| 6th floor | 118.5 |
Table 6.
Shoulder widths of different age groups.
| Age Group | Shoulder Width (cm) |
|---|---|
| Children | 35.0 |
| Young men | 41.0 |
| Young women | 38.0 |
| Middle-aged men | 41.9 |
| Middle-aged women | 39.5 |
| Elderly men | 40.5 |
| Elderly women | 39.0 |
Table 7.
Evacuation time under four scenarios.
| Scenario | Total Time (s) | Average Evacuation Time in Buildings (s) | Evacuation Time on Roads (s) | ||
|---|---|---|---|---|---|
| 6-story | 5-story | 4-story | |||
| Scenario 1 | 361.6 | 99.8 | 76.5 | 62.5 | 356.4 |
| Scenario 2 | 410.5 | 106.9 | 65.6 | 61.9 | 405.3 |
| Scenario 3 | 400.8 | 122.8 | 78.3 | 83.6 | 395.6 |
| Scenario 4 | 450.0 | 132.2 | 78.3 | 83.6 | 445.1 |
Table 8.
Results of significant test of different stairways.
| Stairway | between 2nd and 1st Floors | between 3rd and 2nd Floors | between 4th and 3rd Floors | between 5th and 4th Floors | between 6th and 5th Floors | |
|---|---|---|---|---|---|---|
| Significance test | p-value | 1.97 × 10⁻³⁰ | 2.17 × 10⁻²⁵ | 3.17 × 10⁻²³ | 0.00016 | 7.64 × 10⁻⁹ |
Table 9.
Results of significant test for the roads of different levels.
| Road Level | Low-Passing | Medium-Passing | High-Passing | |
|---|---|---|---|---|
| Significant test | p-value | 0.943005 | 6.58 × 10⁻¹⁵ | 3.61 × 10⁻¹⁷ |
© 2019 by the authors. Licensee MDPI, Basel, Switzerland. This article is an open access article distributed under the terms and conditions of the Creative Commons Attribution (CC BY) license (http://creativecommons.org/licenses/by/4.0/).
Share and Cite
MDPI and ACS Style
Chu, H.; Yu, J.; Wen, J.; Yi, M.; Chen, Y. Emergency Evacuation Simulation and Management Optimization in Urban Residential Communities. Sustainability 2019, 11, 795. https://doi.org/10.3390/su11030795
AMA Style
Chu H, Yu J, Wen J, Yi M, Chen Y. Emergency Evacuation Simulation and Management Optimization in Urban Residential Communities. Sustainability. 2019; 11(3):795. https://doi.org/10.3390/su11030795
Chicago/Turabian StyleChu, Hao, Jia Yu, Jiahong Wen, Min Yi, and Yun Chen. 2019. "Emergency Evacuation Simulation and Management Optimization in Urban Residential Communities" Sustainability 11, no. 3: 795. https://doi.org/10.3390/su11030795
Note that from the first issue of 2016, this journal uses article numbers instead of page numbers. See further details here.