Compression Molded Thermoplastic Composites Entirely Made of Recycled Materials


Fiber Composite Laboratory, Department of Mechanical Engineering, LUT University, P.O. Box 20, 53850 Lappeenranta, Finland
*
Author to whom correspondence should be addressed.
Sustainability 2019, 11(3), 631; https://doi.org/10.3390/su11030631
Submission received: 4 December 2018
/
Revised: 16 January 2019
/
Accepted: 23 January 2019
/
Published: 25 January 2019
(This article belongs to the Section Sustainable Engineering and Science)
Abstract
:Recycled post-consumer high-density polyethylene pipe plastic was agglomerated into composite samples with wood, glass fiber, mineral wool, gypsum, and soapstone as recycled particulate fillers. The tensile strength, tensile modulus, impact strength, and hardness were the mechanical properties evaluated. Scanning electron microscopy was performed on the broken surfaces of tensile strength samples to study the interfacial interactions between the composite matrix and the filler materials. Heat build-up, water absorption, and thickness swelling were the physical properties measured from the composites. The addition of particulate fillers demonstrated the weakening of the tensile and impact strength but significantly improved the rigidity of the post-consumer plastic. The composites filled with minerals had mechanical properties comparable to compression molded wood plastic composites but higher resistance to moisture. A lack of hot-melt mixing affected the mechanical properties adversely.
1. Introduction
The addition of organic and inorganic fillers to polymers has been an important industrial method in creating new materials with tailored properties for specific applications. The legislative pressure pertaining to waste materials in Europe reinforces the need for identifying new uses for previously discarded wastes as recycled materials. The use of selected recycled particulates from post-consumer and industrial by-product waste currents as property changing fillers for polymers could be a way to reuse such materials in the manufacturing of new products. Properties of polymers such as corrosion resistance, light weight, and ease of processing into a variety of shapes can be combined with the unique properties of fillers to form composites with modified appearance, cost, mechanical strength, thermal and electrical conductivity, thermal stability, magnetic characteristics, flame retardant, electromagnetic shielding, dielectric, and barrier properties [1,2]. Productivity can also be increased with particulate fillers due to decreased specific heat and increased heat conductivity [3,4]. The filler addition affects the composite system also by introducing new interfaces, imperfections, impurities, and flaws, which in turn affect the thermal properties and can interfere the processability [5]. Particulate fillers have traditionally benefitted polymers by decreasing the amount of costs of production, which can best be achieved by using the largest amount of filler possible, while retaining the integrity of the polymer matrix holding the product together. The most common fillers for thermoplastics are calcium carbonate, talc, silica flour, clay and wood fiber. To change the properties of polymers, the use of high filler rates is often required, which will lower most of the mechanical properties of the material, reducing the possible field applications. If the filler content of the recycled particulates was high, the environmental, cost, and property-changing effects would potentially be greater in the composite. The high filling rate has often a negative effect on the impact strength, elongation to break, tensile strength, and flexural strength [2]. Improvements by particulate fillers are most likely to take place in the elastic modulus of the composite. The use of low-cost filler content decreases the costs in thermoplastic composites when the relatively virgin plastic is replaced [6]. It could also be an economical way to change the properties of the recycled thermoplastics.
The main aim of this paper is to study mechanical, moisture resistance, and heat build-up properties of compression molded high-density polyethylene (HDPE) composites filled with recycled wood fiber, glass fiber, mineral wool, gypsum, and soapstone particles by empirical testing in order to evaluate the effect of recycled low-cost fillers on the recycled plastic. The analytical methods presented by Halpin-Tsai [7] or Mori-Tanaka [8], which are often used to evaluate the effects of filler geometry, stiffness and orientation were not used in this study due to diverse types of materials used, expected variance in the recycled material and the strong particle–particle interactions caused by the high filler content. For more information about the issues related to analytical method the reader is referred to the work of Fornes & Paul [9]. The comparison of composite properties achieved with different recycled materials could help potential users to rate materials for a variety of open loop recycling thermoplastic based applications such as plastic lumber [10], packaging material, pallets [11], green space and outdoor construction, agriculture and livestock, public construction and traffic barriers [12]. Previously, the compression molding of recycled material composites with a high filler content has been done using kinetic mixing to heat the material [13], a heated mold [14,15], and pressing extruded re-heated composite sheets [16]. In this study, the material is heated in an oven without pressure or mixing.
2. Materials and Methods
2.1. Materials
Recycled high-density polyethylene (rHDPE) from a construction waste sewer pipe was supplied by the Destaclean company and used as matrix material with all the samples. The plastic was identified by manual sorting and recycled mechanically, after which it was crushed to smaller fractions using Untha LR 630. Spruce (Picea abies) was prepared into two particle sizes, fine wood flour of 20 mesh (0.85 mm) and rough hammer milled wood flour of over 20 mesh (max 4.00 mm). The specific gravity of wood flour is 1.3–1.4 g/cm3 [17]. The size of the wood was reduced with a chipper combined with a hammer mill after which it was sieved to the designated size. Glass fiber was the by-product reject from the glass fiber mat production of the Ahlstrom Corporation. The glass fiber reject was chopped to a size of 25 mm with the density 2.5 g/cm3, which became even smaller in the agglomeration phase. Recycled rock wool from construction waste was crushed and milled to powder. The Paroc Group provided by-product grinding dust from rock wool manufacturing, which was collected with a vacuum used in the process. Rock wool consists mainly of silicon dioxide (40–52%, SiO2, 2.65 g/cm3), calcium oxide (10–12%, CaO, 3.35 g/cm3), magnesium oxide (8–15%, MgO, 3.58 g/cm3), and aluminum oxide (8–13%, Al2O3, 3.95 g/cm3) [18]. Recycled construction and demolition waste gypsum was provided by the material handling facility Etelä-Karjalan Jätehuolto. The gypsum waste was ground to powder, and the powdered gypsum wall board specific gravity is 1.76 g/cm3 [19]. Tulikivi provided the by-product soapstone powder from its stone sawing process. Soapstone consists primarily of talc (40–50%, 2.98 g/cm3) Mg3Si4O10(OH)2 and magnesium carbonate (40–50%, 2.96 g/cm3) MgCO3 in almost equal quantities. In addition, there are small proportions of chlorite (2–10%, 2.42 g/cm3) H4(Mg,Fe)2Al2SiO11 and magnetite (0–15%, 5.15 g/cm3) (Fe3O4) [20]. As a coupling agent, 3% of DuPont™ Fusabond® E226 anhydride modified polyethylene was used with the density of 0.93 g/cm3, the melt flow rate (190 °C/2.16kg) 1.75 g/10min, and the declared melting point 120 °C. Maleic anhydride modified polyethylene has been used to improve the interfacial adhesion between the organic fillers and polymer matrix [21,22,23,24]. Processing additive Struktol® TPW 113—a blend of complex modified fatty acid ester—was used with all of the samples, with a density of 1.005 g/cm3 and a dropping point of 70–88 °C.
2.2. Agglomeration of Composites
The filler material, recycled HDPE, coupling agent and processing additive were compounded using a TRL 100/FV/W turbomixer combined with an RFV-200 cooler. The wood materials for NFF and NFR recipes were not pre-dried. The composites were prepared into 14 different formulations. Table 1 and Table 2 present the composition of the prepared composite agglomerates. The density by rule of mixture (RoM) was calculated according to the materials used. After the composites were produced, the density was estimated using the weight and the molded volume of the samples.
2.3. Composite Manufacturing
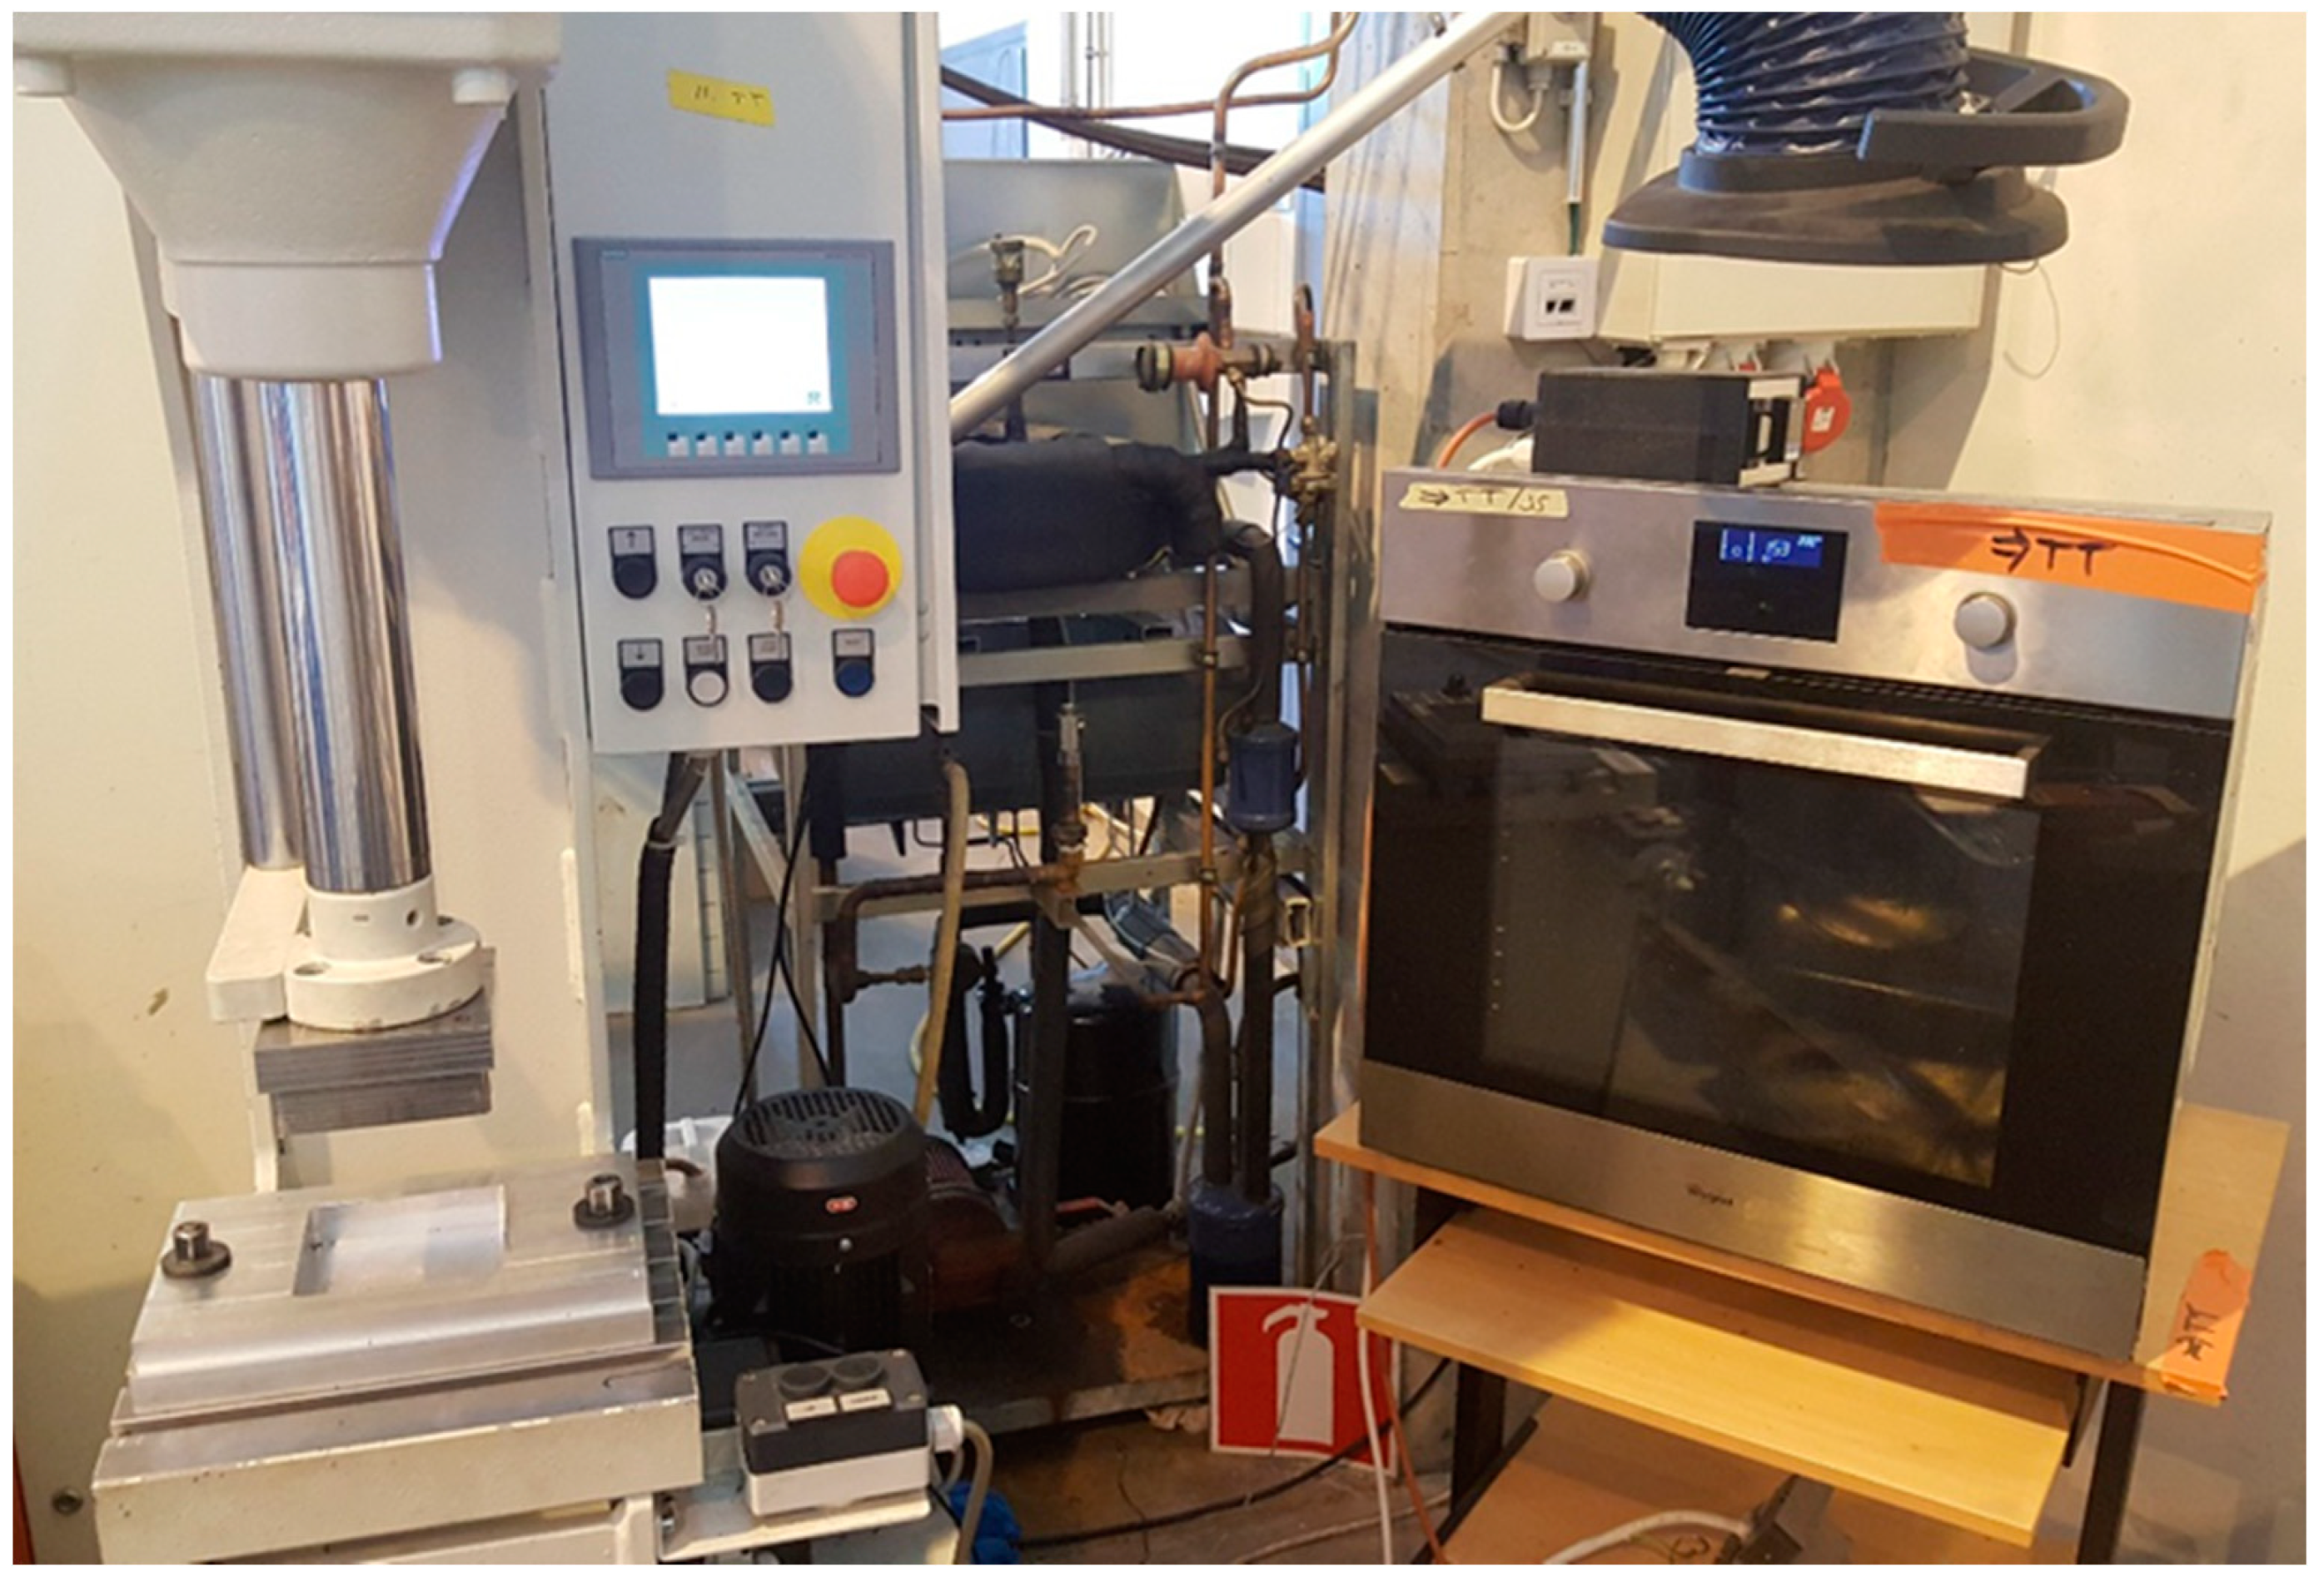
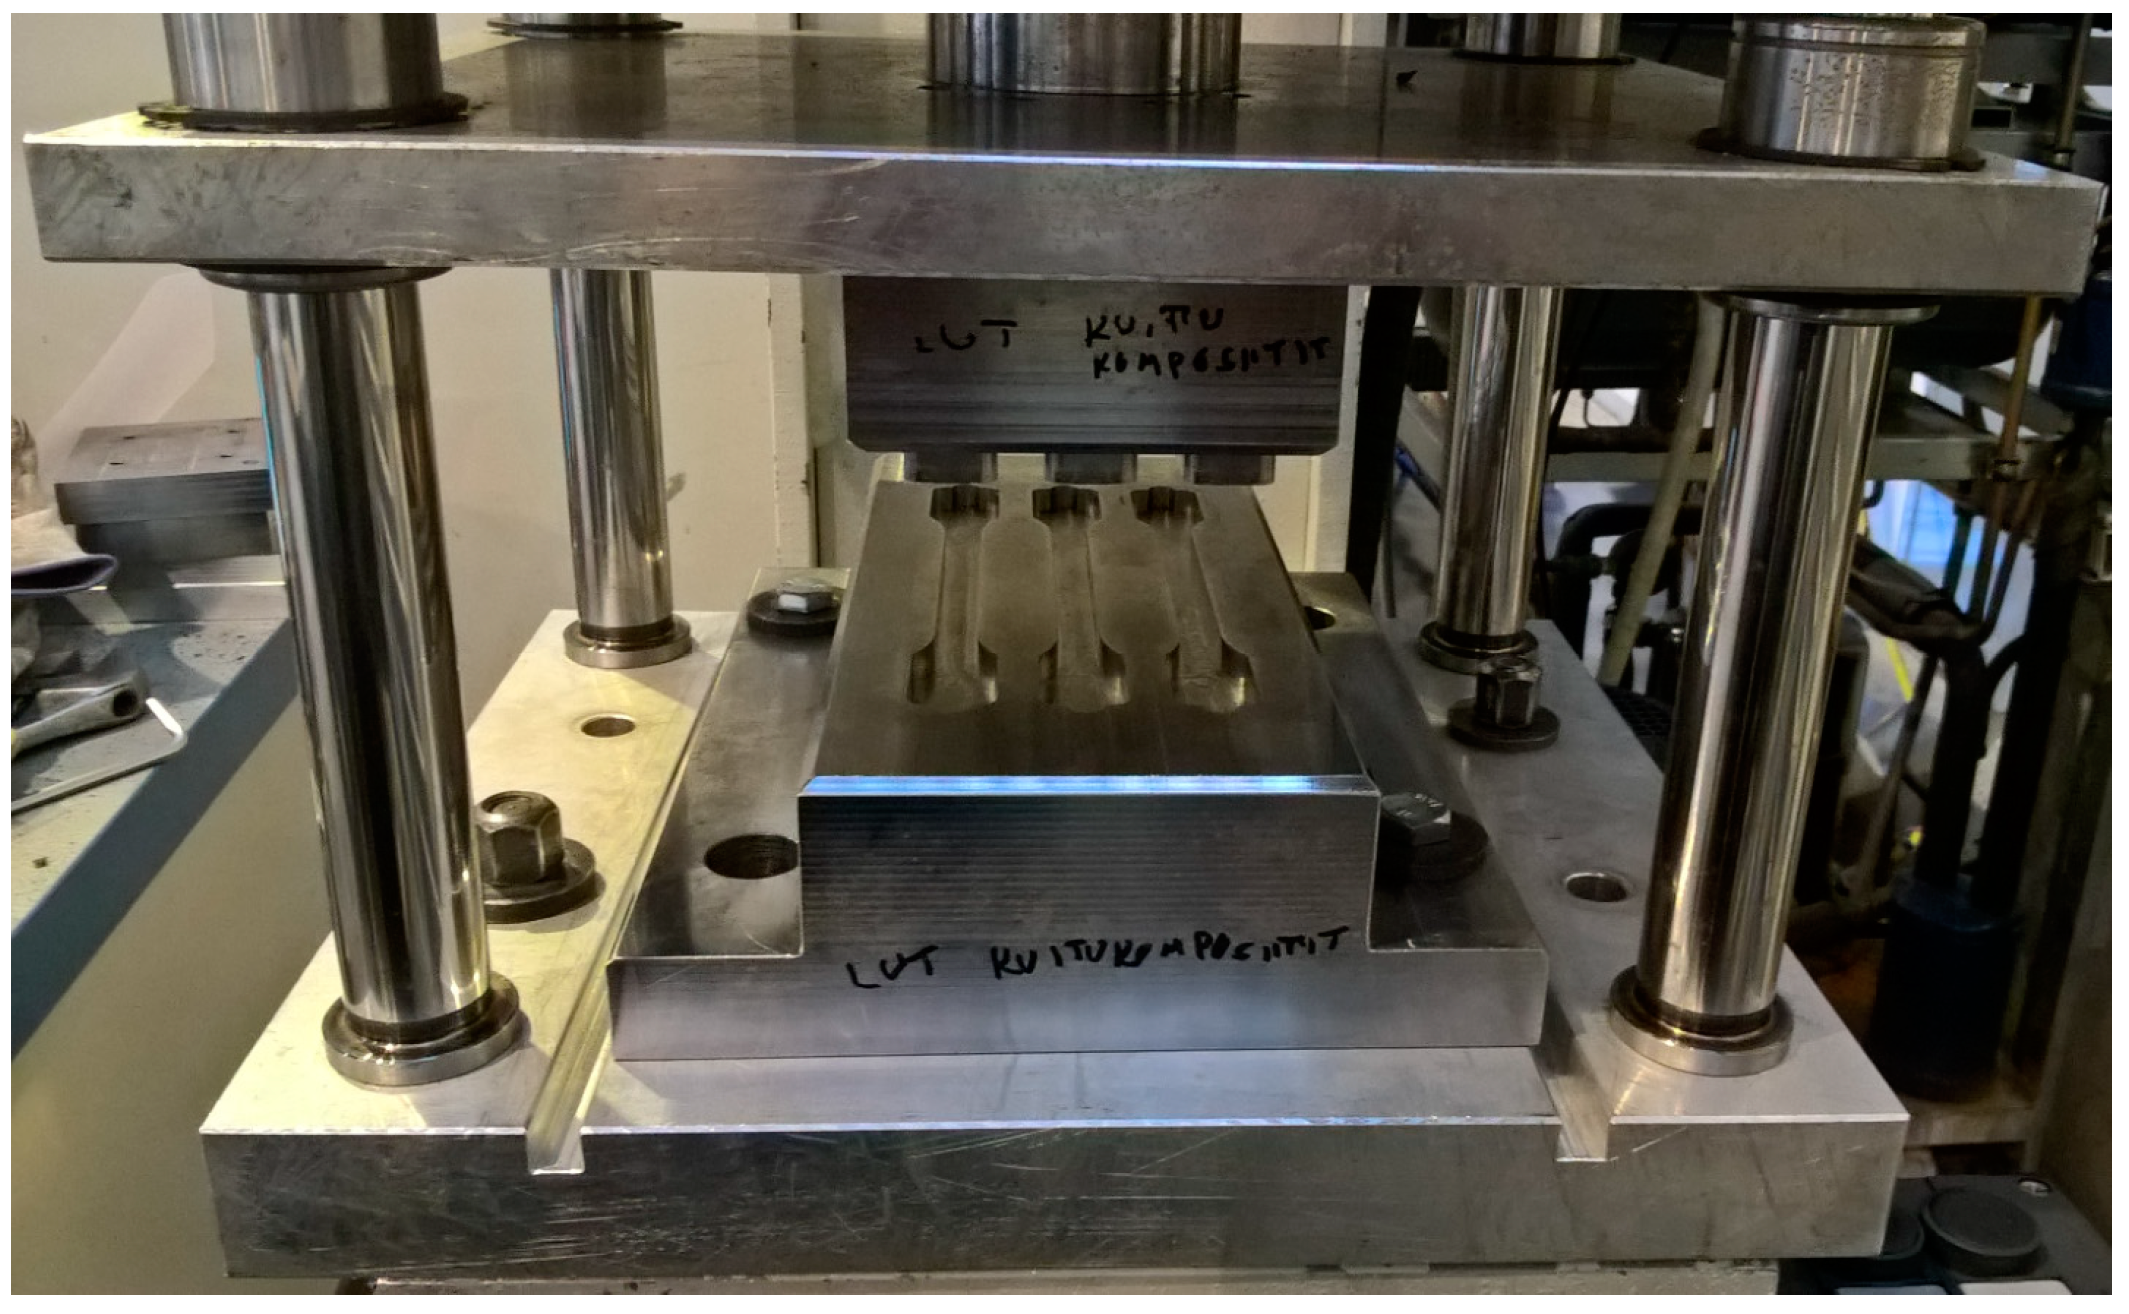
A compression molding tool was used to make 110 × 110 × 10 mm square plates for the manufacturing of impact strength and water absorption samples. The composite agglomerate was heated in an oven to 165–200 °C, after which it was manually transferred to the compression molding tool see Figure 1 for the set-up. A pressure of 24.3 MPa was applied for 60 s to mold the samples. The temperature of the material inside the oven before compression and immediately before demolding was measured with Mastercool Infrared Thermometer OUTPUT <1 mW AT 630~670 nm CLASS II and documented. The tensile strength specimens were prepared with a compression molding tool see Figure 2. The tool and the press had no heating or cooling capability. The mold had channels to regulate overfilling caused by the manual transfer of heated material into the mold. The tools were mounted on a hydraulic C-frame press made by Stenhøj A/S coupled with CA-1000 connector accessory with VI Logger version 2.01 made by National Instruments. The processing of 110 × 110 × 10 mm plates was successful with all the materials, but the thinner tensile strength specimens were not possible to process with the GF60 composition as the specimens broke during demolding.
2.4. Mechanical Property Measurements
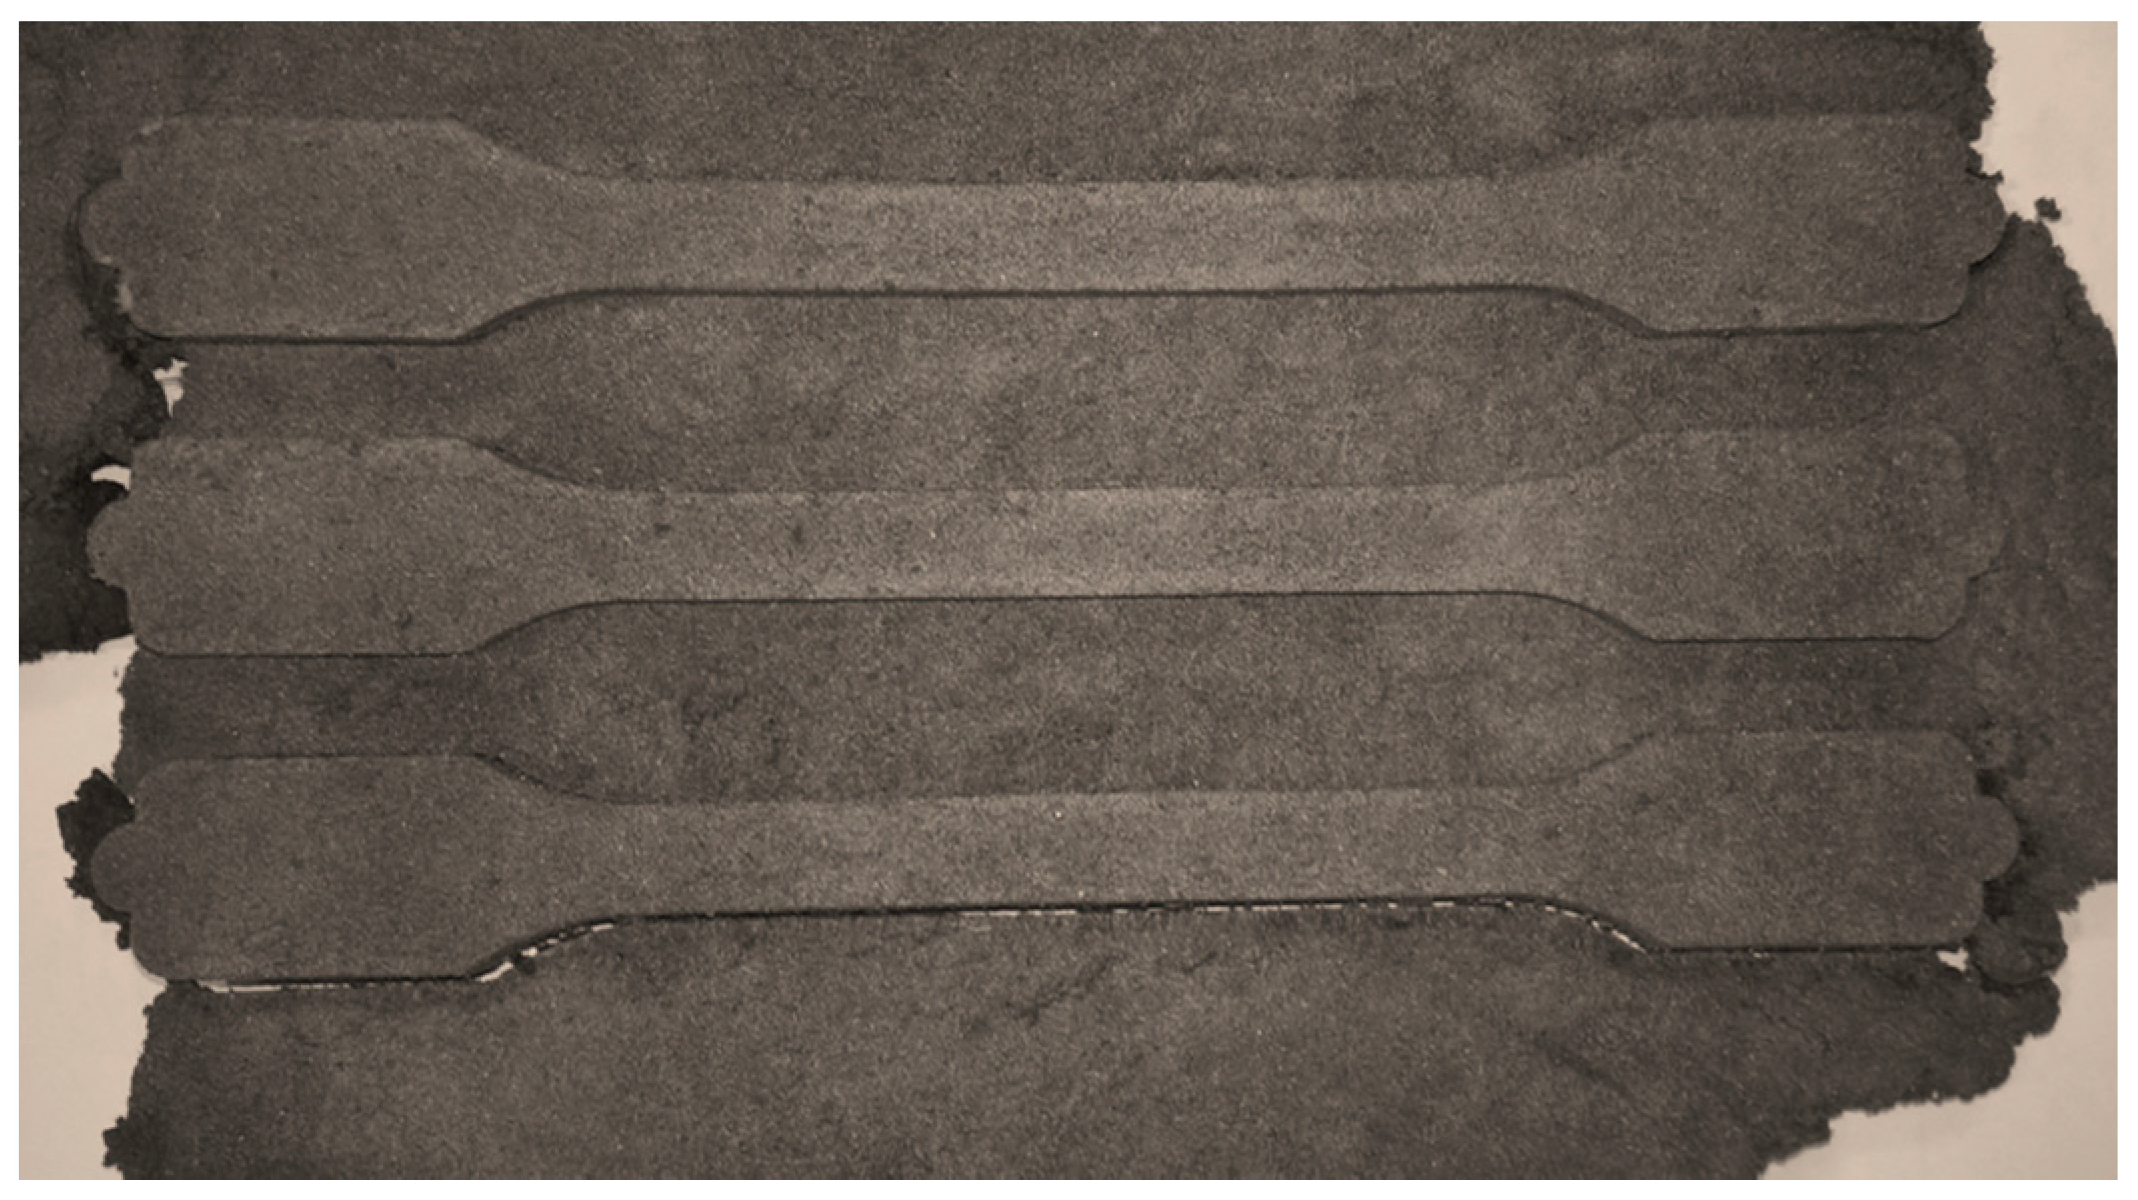
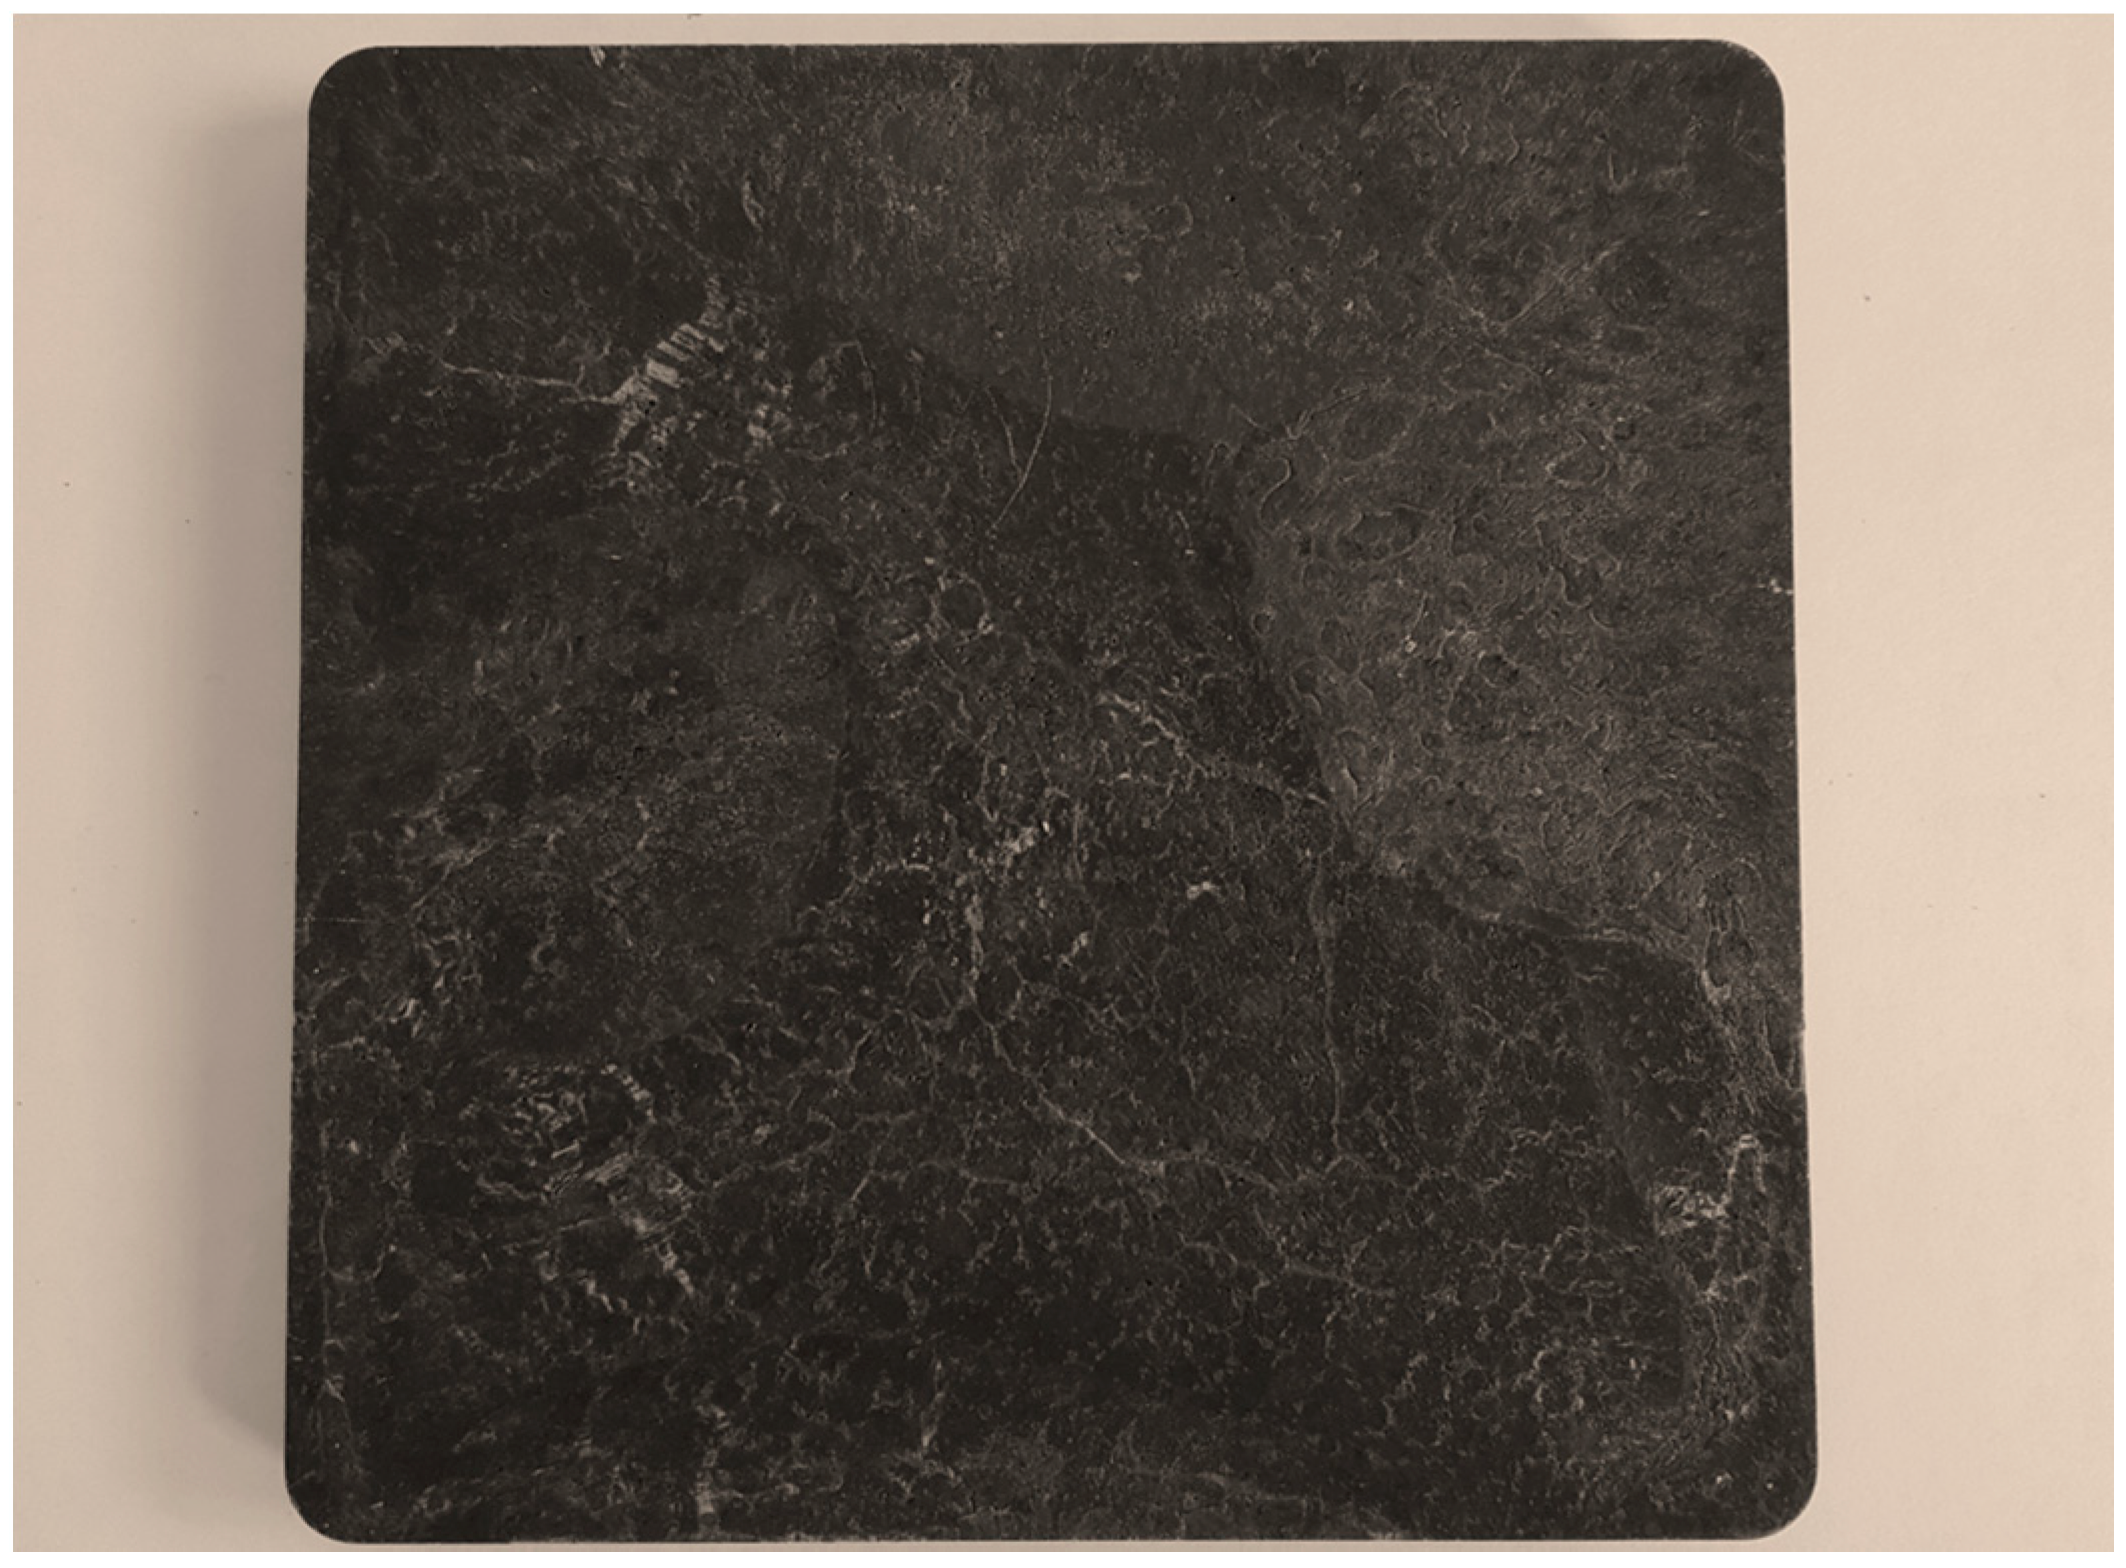
The tensile properties strength and elastic modulus were measured with a Zwick Roell Z020 testing machine. The measurement of the tensile modulus was performed according to ISO 527-1 [25] with a testing speed of 1 mm/min. The compression mold specimens were of the ISO 527-2/1A/1 type, and 12 specimens were prepared for each sample see Figure 3. The samples for the Charpy impact strength were sawn from molded 110 × 110 × 10 mm square plates (see Figure 4) into the length 80 ± 1 mm, width 10 ± 1 mm, and thickness 4 ± 1 mm; 12 samples of each material were prepared. The Charpy impact strength was measured at 21 °C with the Zwick 5102 impact tester. The impact velocity of the pendulum was 2.93 m/s, the pendulum length 225 mm, and the angle of deflection 160 degrees. Brinell hardness was tested with Zwick Roell indentation testing equipment. The diameter for the pressing ball was 10 mm and the pressing force of 1 kN was applied for 25 s. The dent was measured with a caliber after the minimum wait time of 2 min. The fracture morphology of the broken tensile strength samples was studied with a Hitachi SU3500 scanning electron microscope (SEM).
2.5. Moisture Absorption and Thickness Swelling
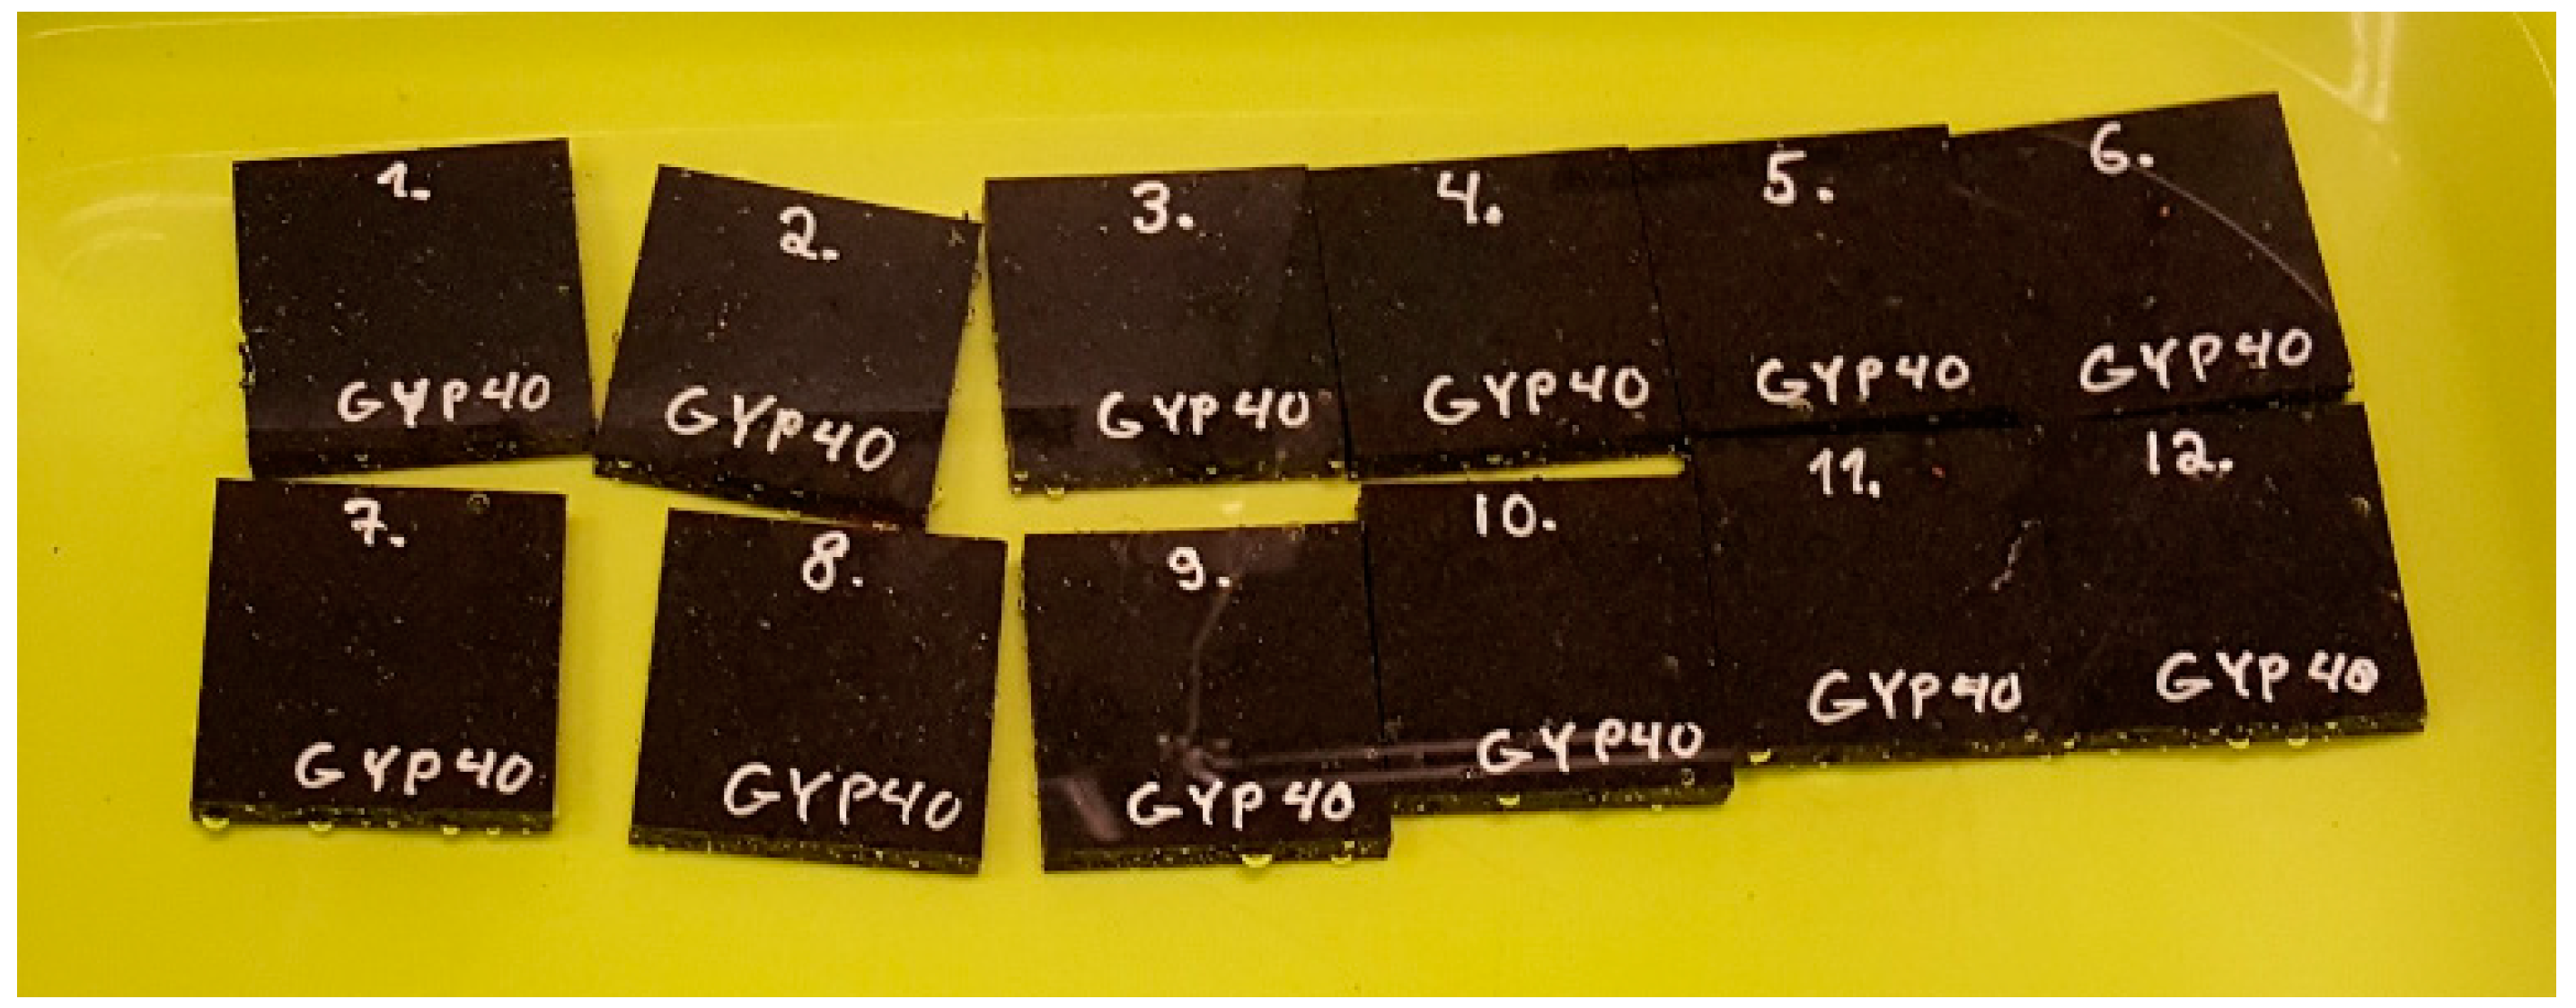
The moisture absorption and thickness swelling of the composites were determined according to EN 317:1993 [26]. For each material, 12 samples were manufactured by compression molding see an example in Figure 5. Moisture absorption (MA) and thickness swelling (TS) were calculated with the following equations
where mo and mt are the mass of the sample in grams before and after immersion.
where To and Tt are the thickness of the sample in millimeters before and after immersion.
2.6. Heat Build-up and Color Measurements
The heat build-up of the composites was tested according to EN 15534-1 [27]. The samples with dimensions 100 × 10 × 4 mm were tested. Three specimens for each type of composite were measured with the black control specimen. An infrared heat lamp with 250 W nominal power was used to heat up the samples. The distance from the lowest part of the lamp to the bottom of the box was 375 mm. The method measured the relative value of heat build-up compared with a black control specimen under the defined conditions and does not predict the application temperature in real situations. The used black control specimen was made of the same material as the reference (REF) so that the test results would show the possible changes caused by the application of filler materials.
A Minolta CM-2600d spectrophotometer was used to determine the colors of the composite samples according to the CIE (Commission Internationale de l’Eclairage) L*a*b color system.
3. Results and Discussion
3.1. Mechanical Properties of Composites
3.1.1. Impact Strength
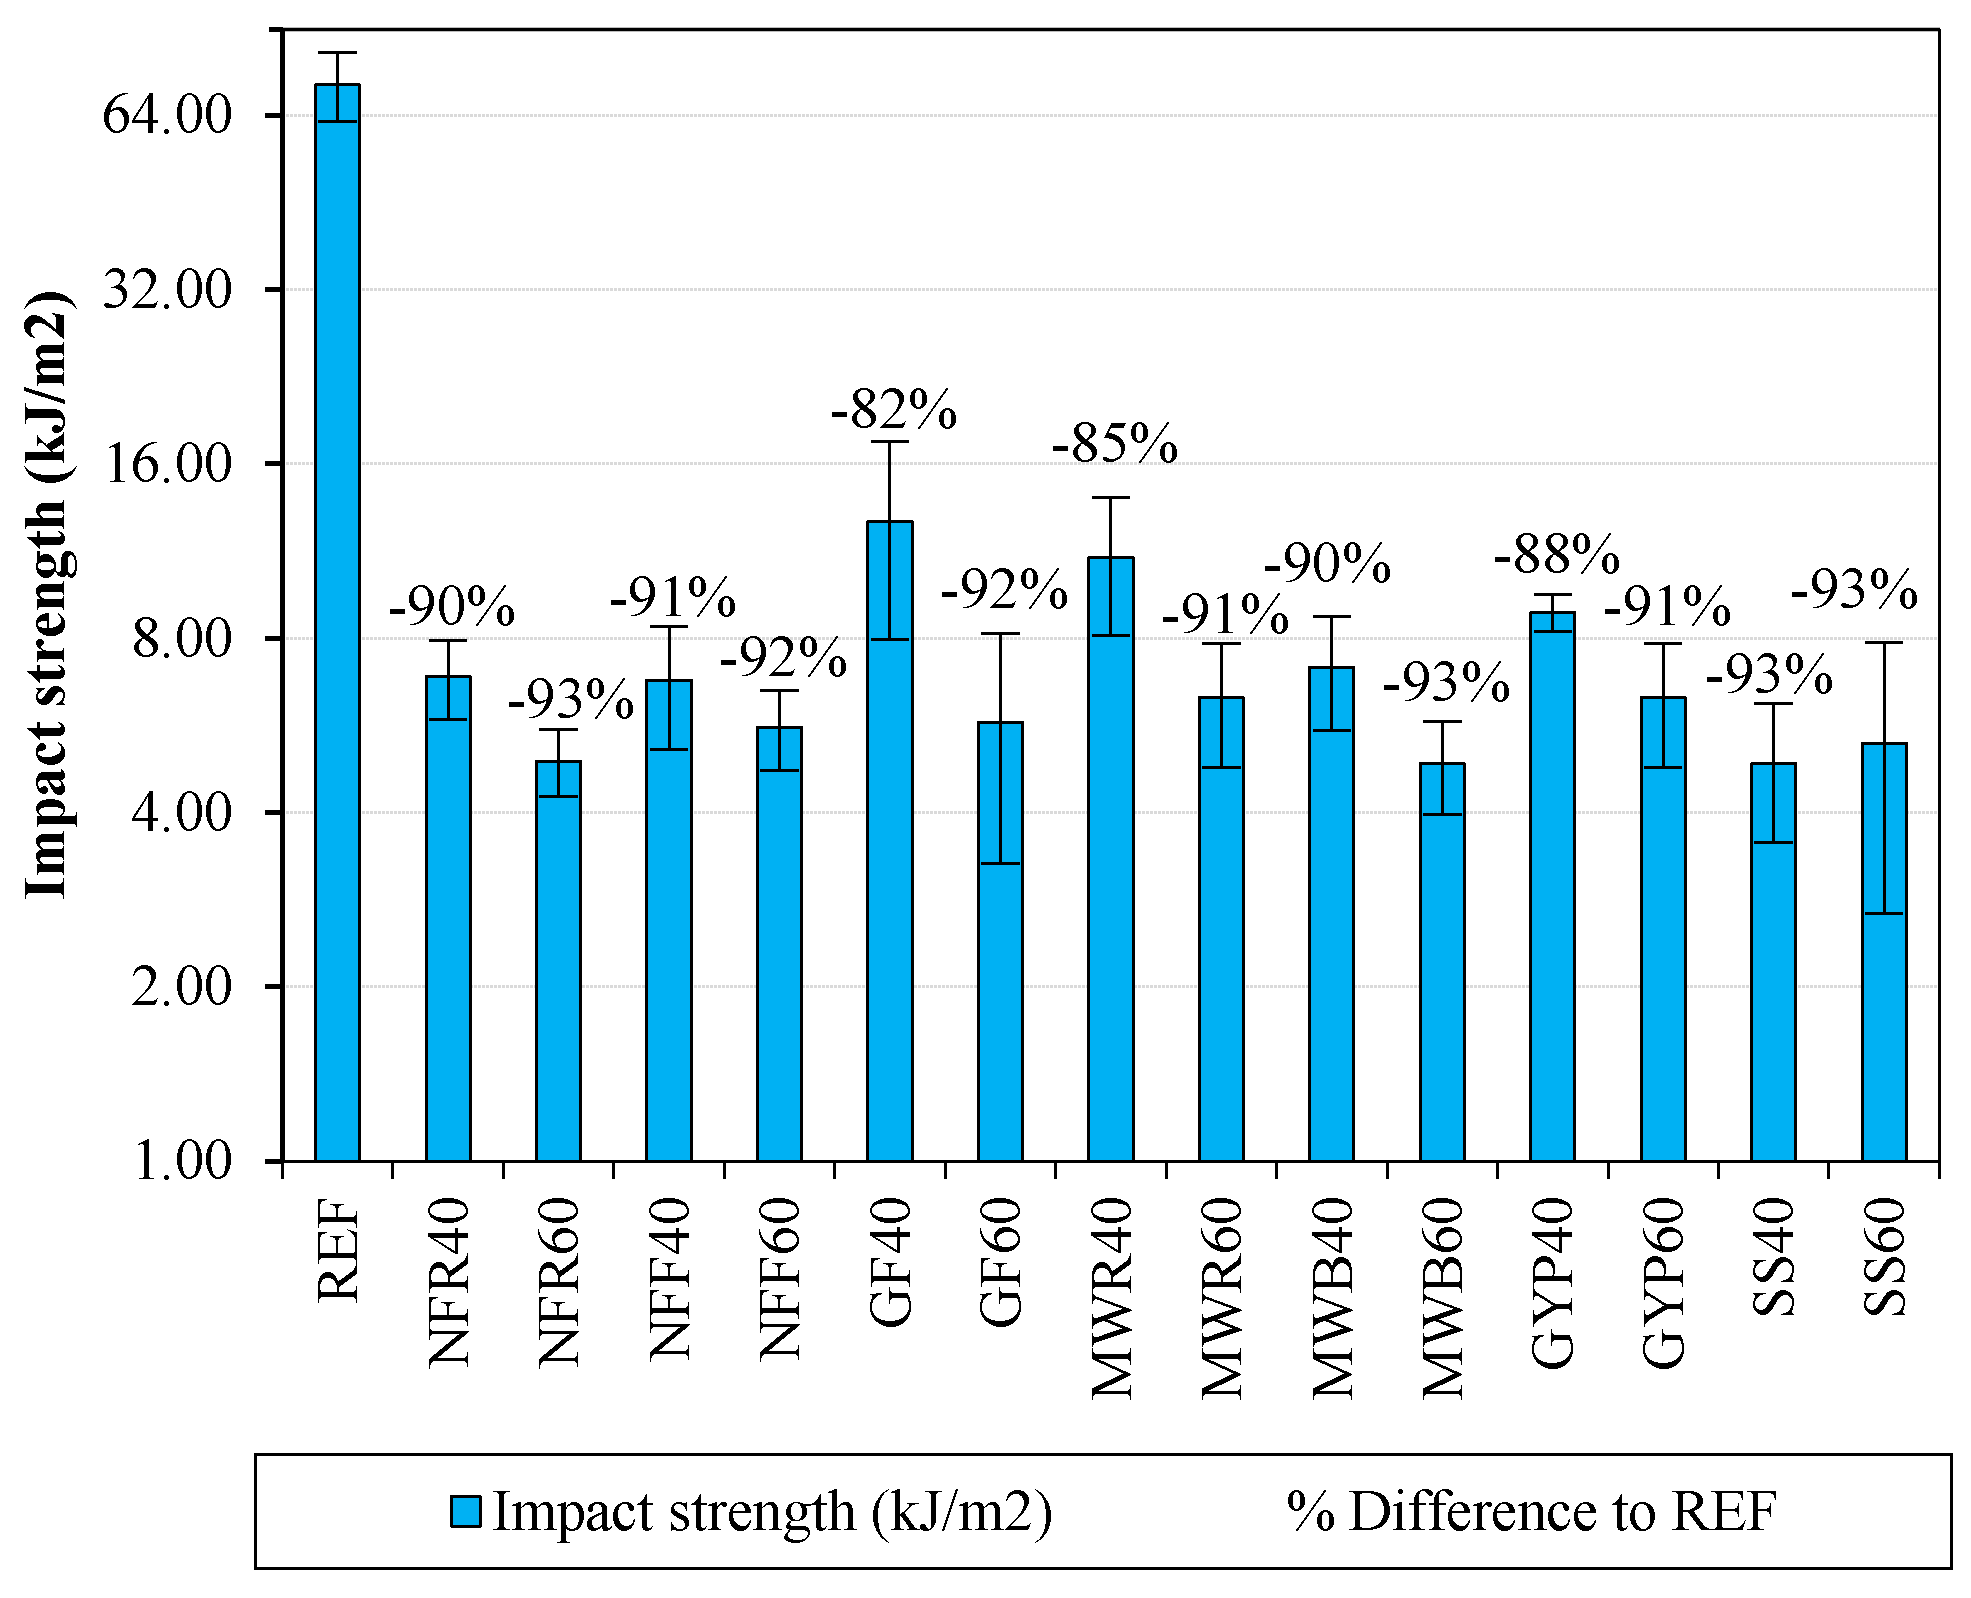
The impact resistance of polymers depends on geometry, the mode of loading, the load application rate, the loading environment, and polymer properties such as chain length, packing, chemical arrangement units in the polymer chain, alignment, and bonding forces. Therefore, the strength is the sum of properties that contribute to the dissipation of the forces of impact [28]. The effects of a high fill rate on the Charpy impact strength of the recycled plastic were significant (see Figure 6). The impact strength’s decreasing effect with an increased particle content [29] was found across the studied materials, with an exception in SS40 (4.86 ± 1.31 kJ/m2) and SS60 (5.27 ± 2.59 kJ/m2), where the mean value with a 60% fill rate was higher. Compared to the REF (72.31 ± 9.94 kJ/m2) material, the drop-in impact strength was on average 90%, as Figure 6 shows. Glass fiber GF40 had the highest impact strength of the measured composites with filler (12.71 ± 4.76 kJ/m2). According to previous studies, the high impact test results with glass fiber thermoplastic composites have attributed to strong interaction between the silanol groups of the glass surface and the anhydride group of the coupling agent [30,31]. The standard deviation in GF40 results was the highest of all tested materials, which was likely caused by the agglomeration phase where the fibers were broken into random lengths and clustered heavily together, creating discontinuities and porosity in the thermoplastic matrix. This same reason might be the cause of the higher results in GF40, as the clustering of fibers also created zones where the tough thermoplastic was the dominant material. This seems to be supported by the SEM. This effect was not as strong in the composite GF60 (5.72 ± 2.45 kJ/m2), which could be related to the plastic zones being smaller with a higher glass fiber content. The use of rough or fine saw flour did not seem to have a significant difference in the impact resistance properties in the wood plastic composite samples NFR40 (6.87 ± 1.07 kJ/ m2) and NFF40 (6.77 ± 1.63 kJ/m2) with a 40% fill rate. Both of the particle types decreased the impact strength compared to unfilled REF, which is in line with the previous studies [14,32]. The composite NFF60 (5.61 ± 0.89 kJ/m2) with fine wood flour performed better than the sample with rough wood flour NFR60 (4.91 ± 0.65 kJ/m2). The variance in the impact strength was generally higher in samples with a 60% fill rate. Without the bonding effect of the matrix, the high aggregation of fillers leads to insufficient homogeneity, rigidity, and low impact strength, and the aggregated particles act as crack initiation sites in impact [1]. The mineral wool composites with recycled raw material MWR40 (11.04 ± 2.94 kJ/m2) and MWR60 (6.32 ± 1.53 kJ/m2) had higher impact strength than the MWB40 (7.13 ± 1.59 kJ/m2) and MWB60 (4.86 ± 0.89 kJ/m2) made of by-product mineral wool, which is surprising as the tensile properties in MWB cases were superior. However, MWR40 had quite a high value for elongation at break 2.81%. The composite GYP40 performed well in impact testing with a small deviation in results 8.86 ± 0.65 kJ/m2, but as the gypsum content was increased, the results dropped as in other tested samples GYP60 6.32 ± 1.53 kJ/m2.
3.1.2. Tensile Strength
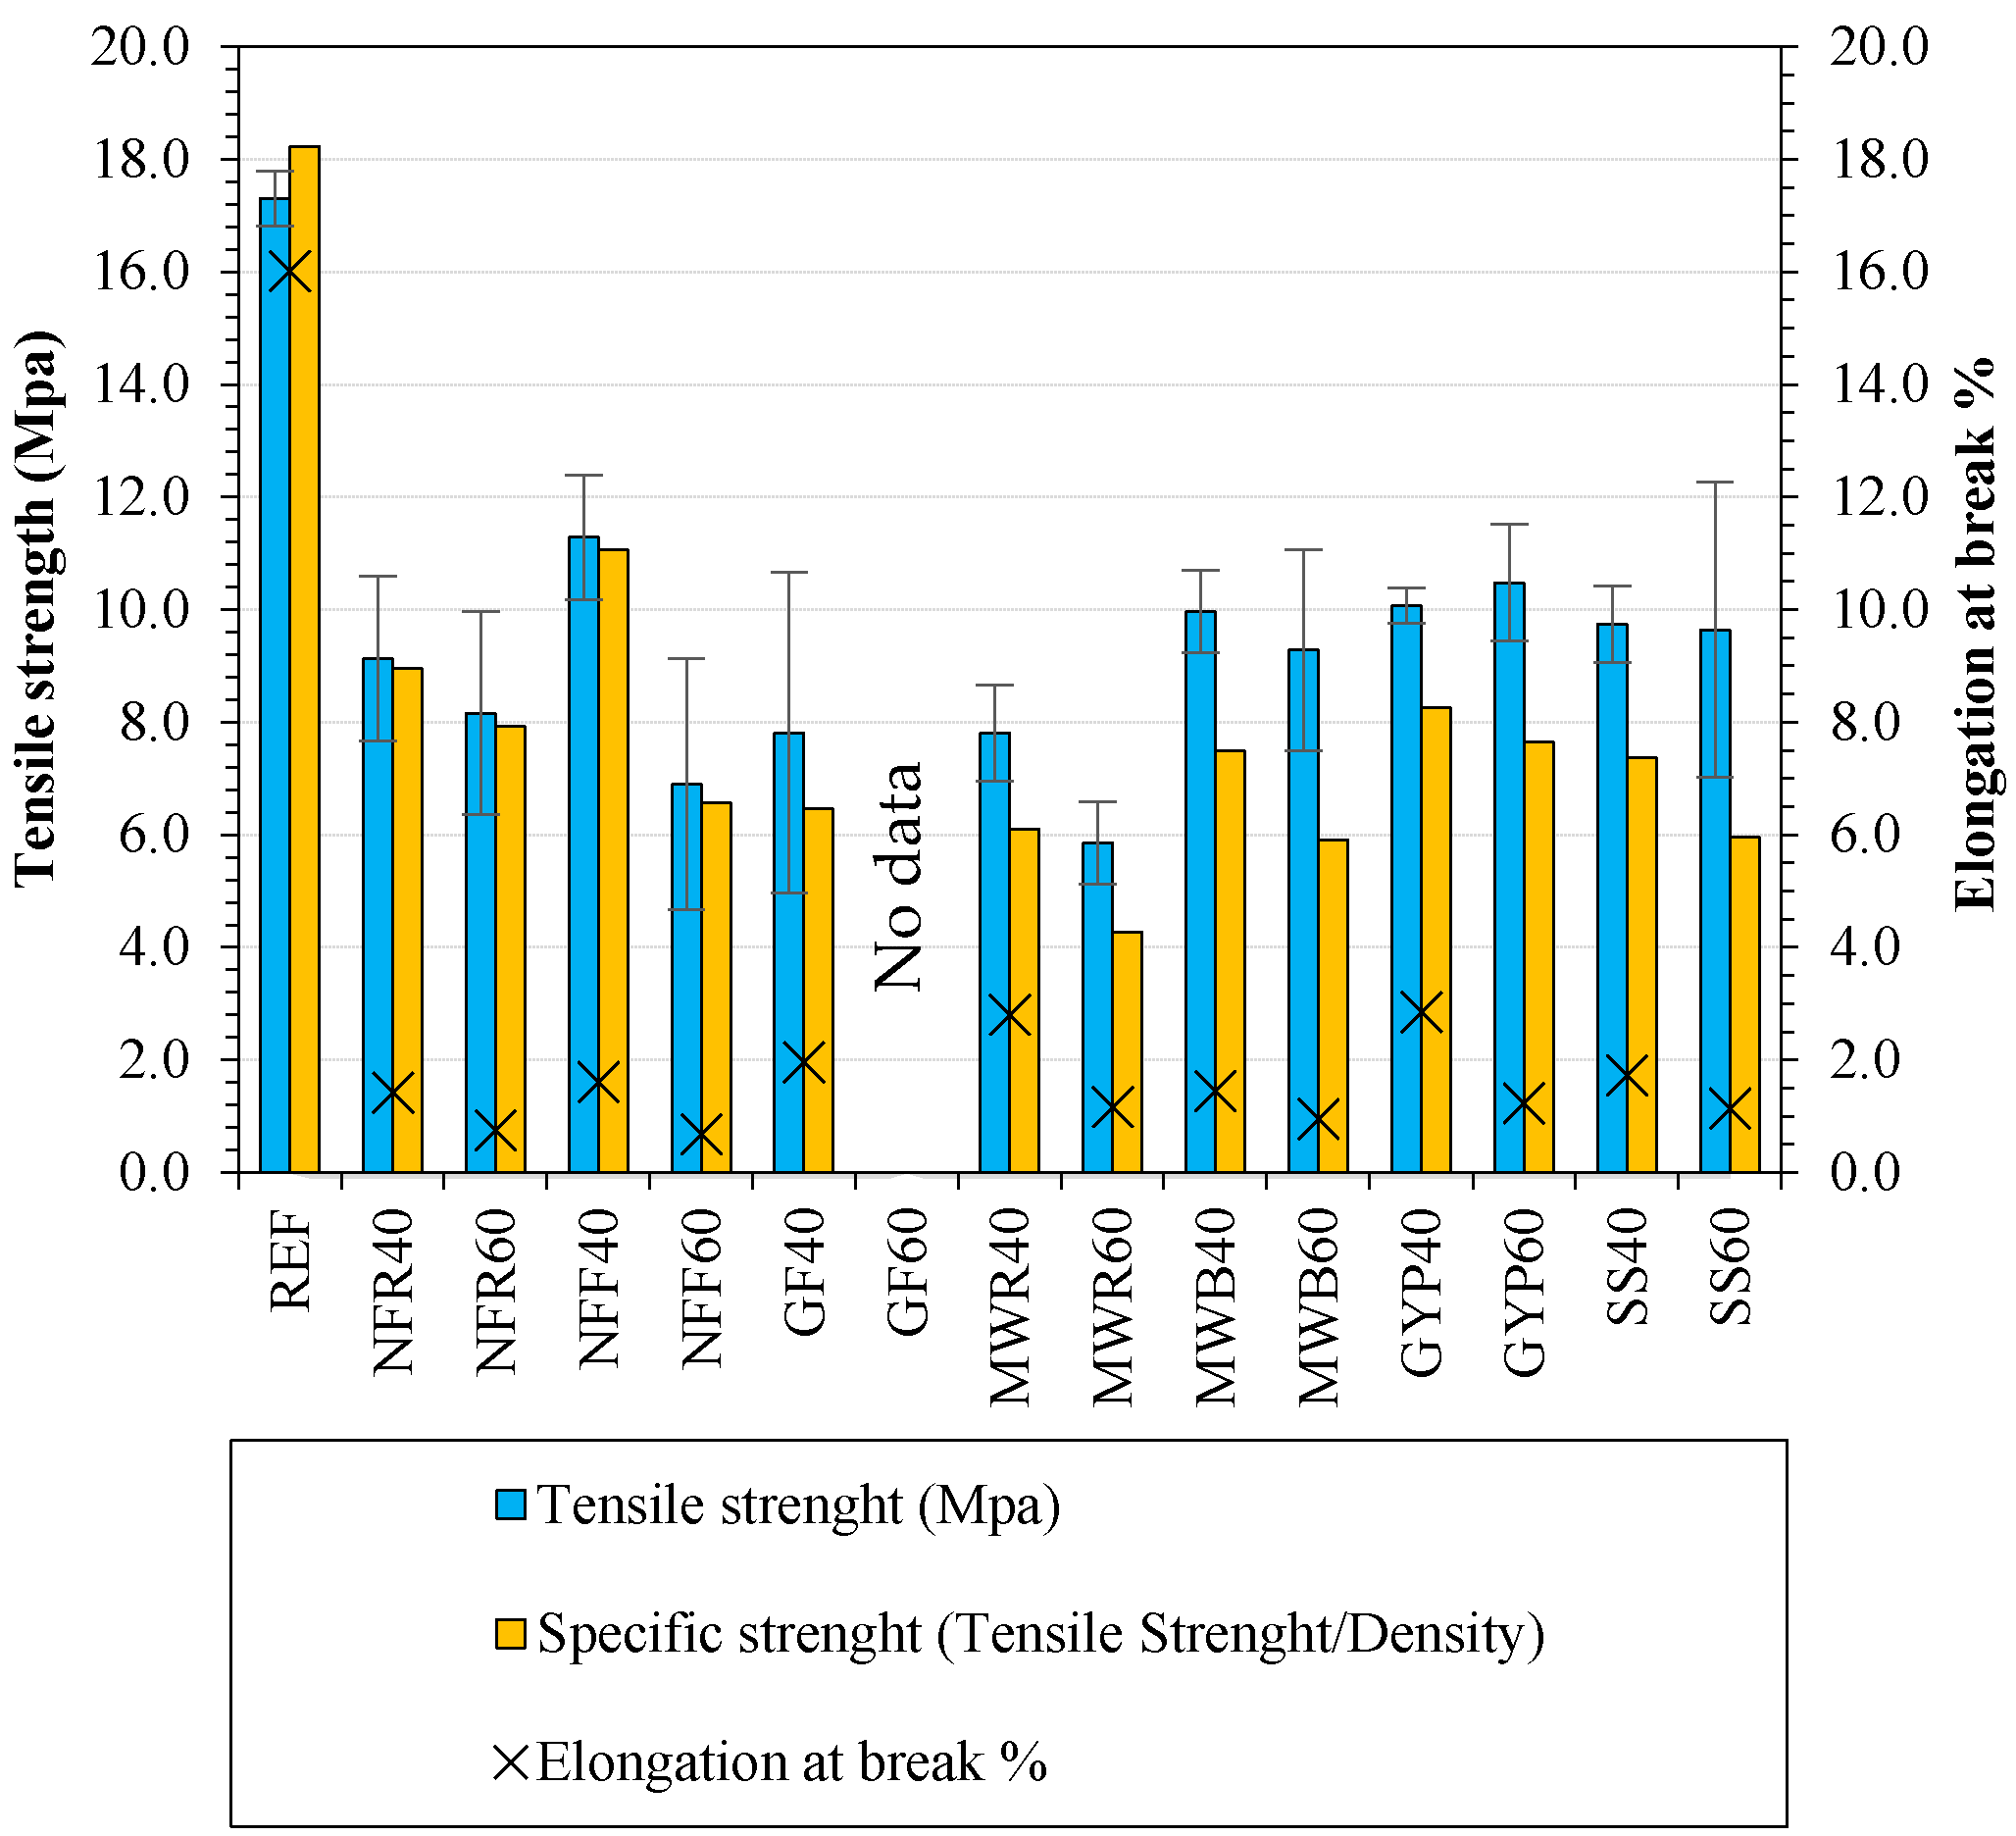
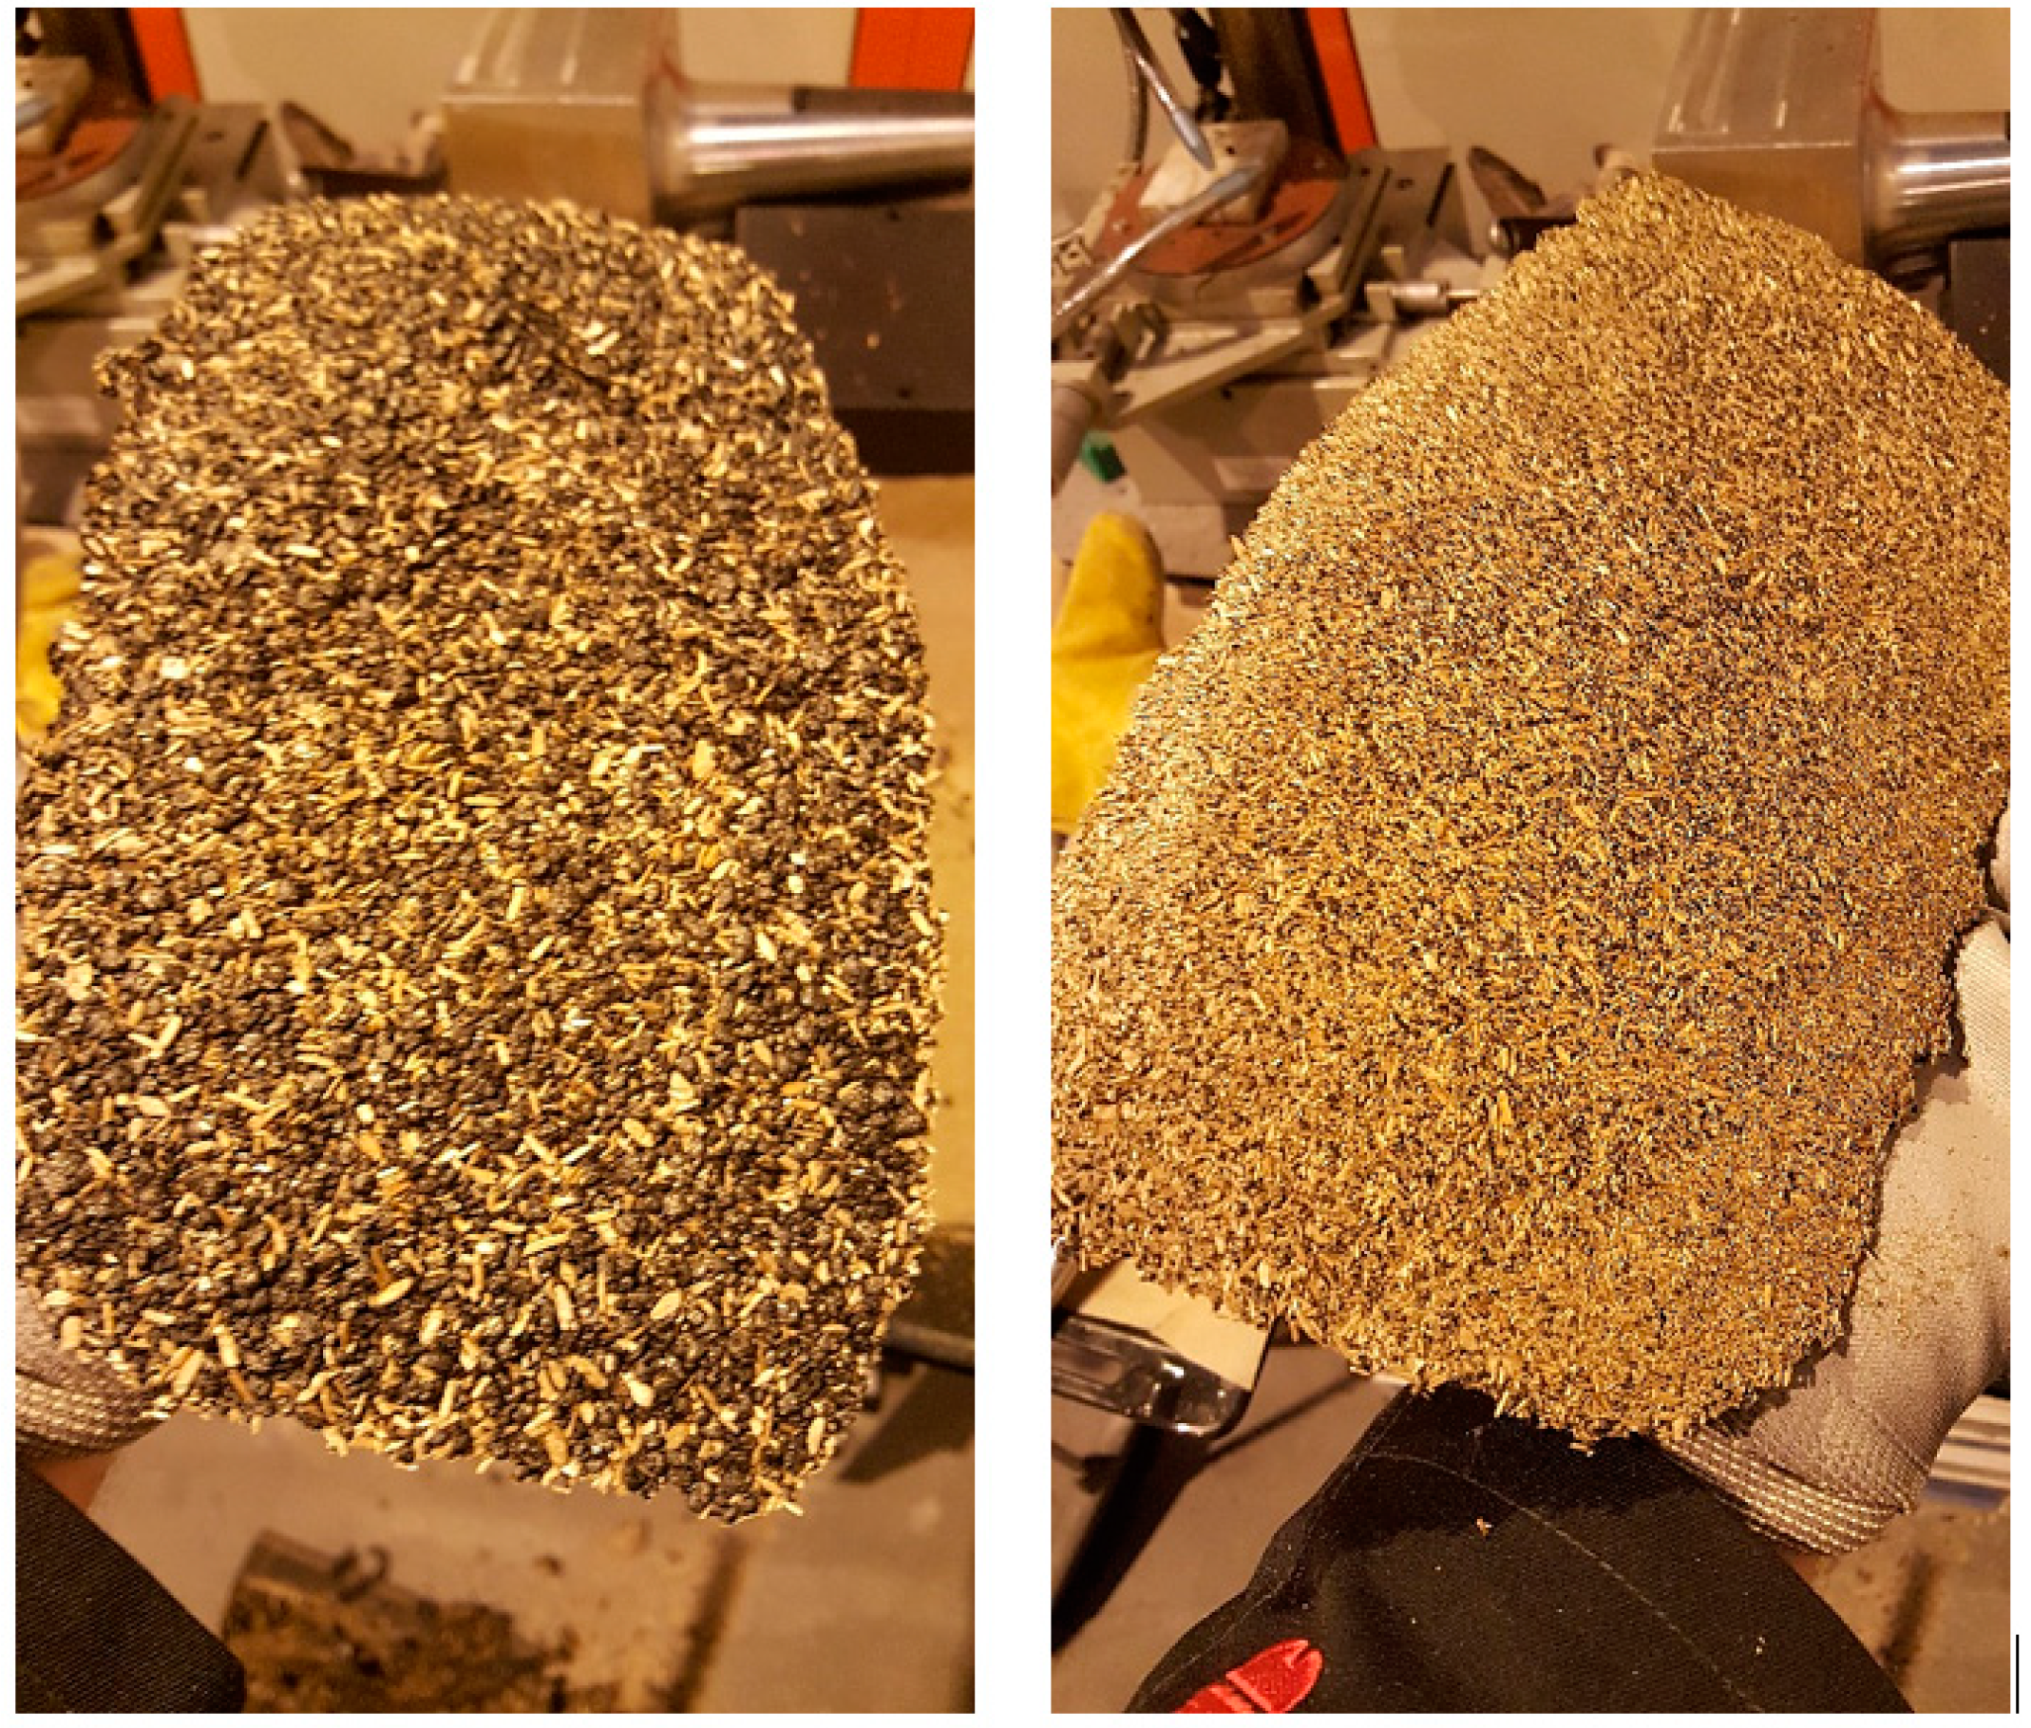
The tensile strength decreased with the addition of filler material compared to fully plastic REF (17.31 ± 0.48 MPa) due to weak interphase adhesion in the filler interface (see Figure 7). The calculated specific strength shows that although the tensile properties of MWB, GYP, and SS filled composites were similar, the GYP40 performs better when considering the material weight. The tensile strengths of the compression molded wood plastic composite samples were significantly below the previously reported values [14,33]. The composite NFF40 (11.29 ± 1.11 MPa) had 18% higher tensile strength than the composite NFR40 (9.13 ± 1.47 MPa), which would seem to suggest some influence by the fiber size. However, the wood plastic composite samples with a 60% fill rate demonstrated the opposite affect, and the NFF60 (6.90 ± 2.24 MPa) had 18% smaller tensile strength compared with NFR60 (8.16 ± 1.81 MPa). This seems to be in conflict with previous reports where the increased fiber size and fiber ratio has improved both the modulus of elasticity and maximum strength although in these studies the fiber size has previously been significantly smaller [33,34]. Wood plastic composite samples NFR40, NFR60, NFF40, and NFF60 all had relatively high variance in results. In the NFF60 with 20 mesh natural fiber filling of 60%, the deviation in results was over 30% of the results average. The measured densities in NFR40, NFR60, NFF40, and NFF60 were close to each other despite the different fill rate, and while NFF60 composite samples were the heaviest, NFR60 performed better both in strength and in the modulus. The agglomerate heating method and relatively low (24.3 MPa) mold pressure might also have affected the results of the tensile strength negatively in composites with a high natural fiber content. The blanket created by the wood fibers in Figure 8 acted as insulation to the thermoplastic, leading to a longer heating time and uneven temperature in the plastic matrix. The mineral filled composites performed better as group compared to the fiber filled composites; an exception to this are the samples MWR40 (7.81 ± 0.86 MPa) and MWR60 (5.85 ± 0.73 MPa). The difference between recycled and by-product mineral wool composites MWB40 (9.96 ± 0.73 MPa) and MWB60 (9.28 ± 1.79 MPa) might be in the non-hardened resin component in the by-product material. The composites with by-product mineral wool filling tensile properties are close to the previously reported 9.00 MPa with a recycled HDPE matrix and 40% rock wool filling [35]. Wood plastic composites with 40% fiber fill have previously had significantly higher tensile strengths [36]. Similarly, there was a significant variance in the results of glass fiber composite GF40 (7.81 ± 2.84 MPa) with 40% filling. While processing the GF60 tensile strength and elastic modulus samples the matrix was not able to hold the material together and they broke during demolding. In this study, the cut glass fiber also reduced significantly in size. In a study conducted in the same laboratory [37], the glass fiber was agglomerated with the same method, and the size of processed glass fibers ranged from 20 to 460 µm with the mean size of about 100 µm. Processing is known to affect the fiber length and distribution, and likewise, anisotropic particle fillers cleave and experience considerable delamination in processing [1]. In both natural and glass fiber composites, the aggregation of fibers created weak spots in the matrix leading to crack propagation. In general, the mineral fillers with a small particle size performed better in the tensile strength test, which suggests better dispersion in the matrix than with the fiber fillers. The tensile strength of mineral wool composites MWR and MWB ranged between 5.85–9.96 MPa. The lowest result was with MWR60 and the highest with MWB40. Both MWB samples performed better than the samples with post-consumer recycled mineral wool. This could be due to the reinforcing effect of the non-hardened resin in by-product mineral wool which was activated in the processing of the composite. The materials with the least variation in the mineral filled composites group where the samples with recycled gypsum GYP40 (10.07 ± 0.31 MPa) and GYP60 (10.48 ± 1.04), and a good dispersion into the matrix is visible in the SEM analysis. The tensile strength SS40 (9.74 ± 0.68 MPa) and SS60 (9.64 ± 2.62 MPa) were similar, but there was greater variation in the results of SS60 probably caused by the higher probability of local concentrations of soapstone in the mixture with a 60% fill rate.
3.1.3. Tensile Modulus
The addition of mineral and fiber fillers increased the tensile modulus of recycled HDPE in all samples except in GYP40 (0.89 ± 0.05 GPa) (see Figure 9). The standard deviation in samples NFR60 (1.78 ± 0.28 GPa), NFF60 (1.58 ± 0.51 GPa), GF40 (1.39 ± 0.38 GPa), and MWR60 (1.37 ± 0.73 GPa) was high due to the clustering of particulates to high concentrations in the tensile specimens. With the 60% recycled mineral wool fill MWR60 some individual tests resulted in a lower tensile modulus than in the REF material (0.94 ± 0.04 GPa). Also, the tensile modulus of MWR40 (1.16 ± 0.16 GPa) was quite close to the REF material. Mineral wool by-product MWB40 (1.38 ± 0.09 GPa) and MWB60 (1.72 ± 0.07 GPa) performed generally better than the recycled mineral wool probably due to the activated non-hardened resin in the by-product component. Wood plastic composites NFR40 (1.40 ± 0.17 GPa) and NFF40 (1.51 ± 0.10 GPa) had smaller variance in results than the other fiber composites due to the good dispersion of wood particles into the plastic matrix and the effect of the compatibilizer. Composites filled with by-product mineral wool (MWB40 and MWB60), gypsum GYP40 and GYP60 (1.65 ± 0.11 GPa) and soapstone SS40 (1.17 ± 0.12 GPa) and SS60 (1.86 ± 0.10 GPa) all had small variation in the results because of their relatively good dispersion in the matrix. The particulate and fiber filling increased the stiffness of the composites with the exception of GYP40. A great deal of variation is visible in the tensile modulus of NFR60, NFF60, GF40, and MWR60. A common factor for all of these is the large amount of porosity revealed by the SEM analysis and the calculated difference between the supposed and calculated density. Both GF40 and MWR60 exhibit heavy clustering of small fibers without proper adhesion to the matrix, which explains the variation in the tensile modulus.
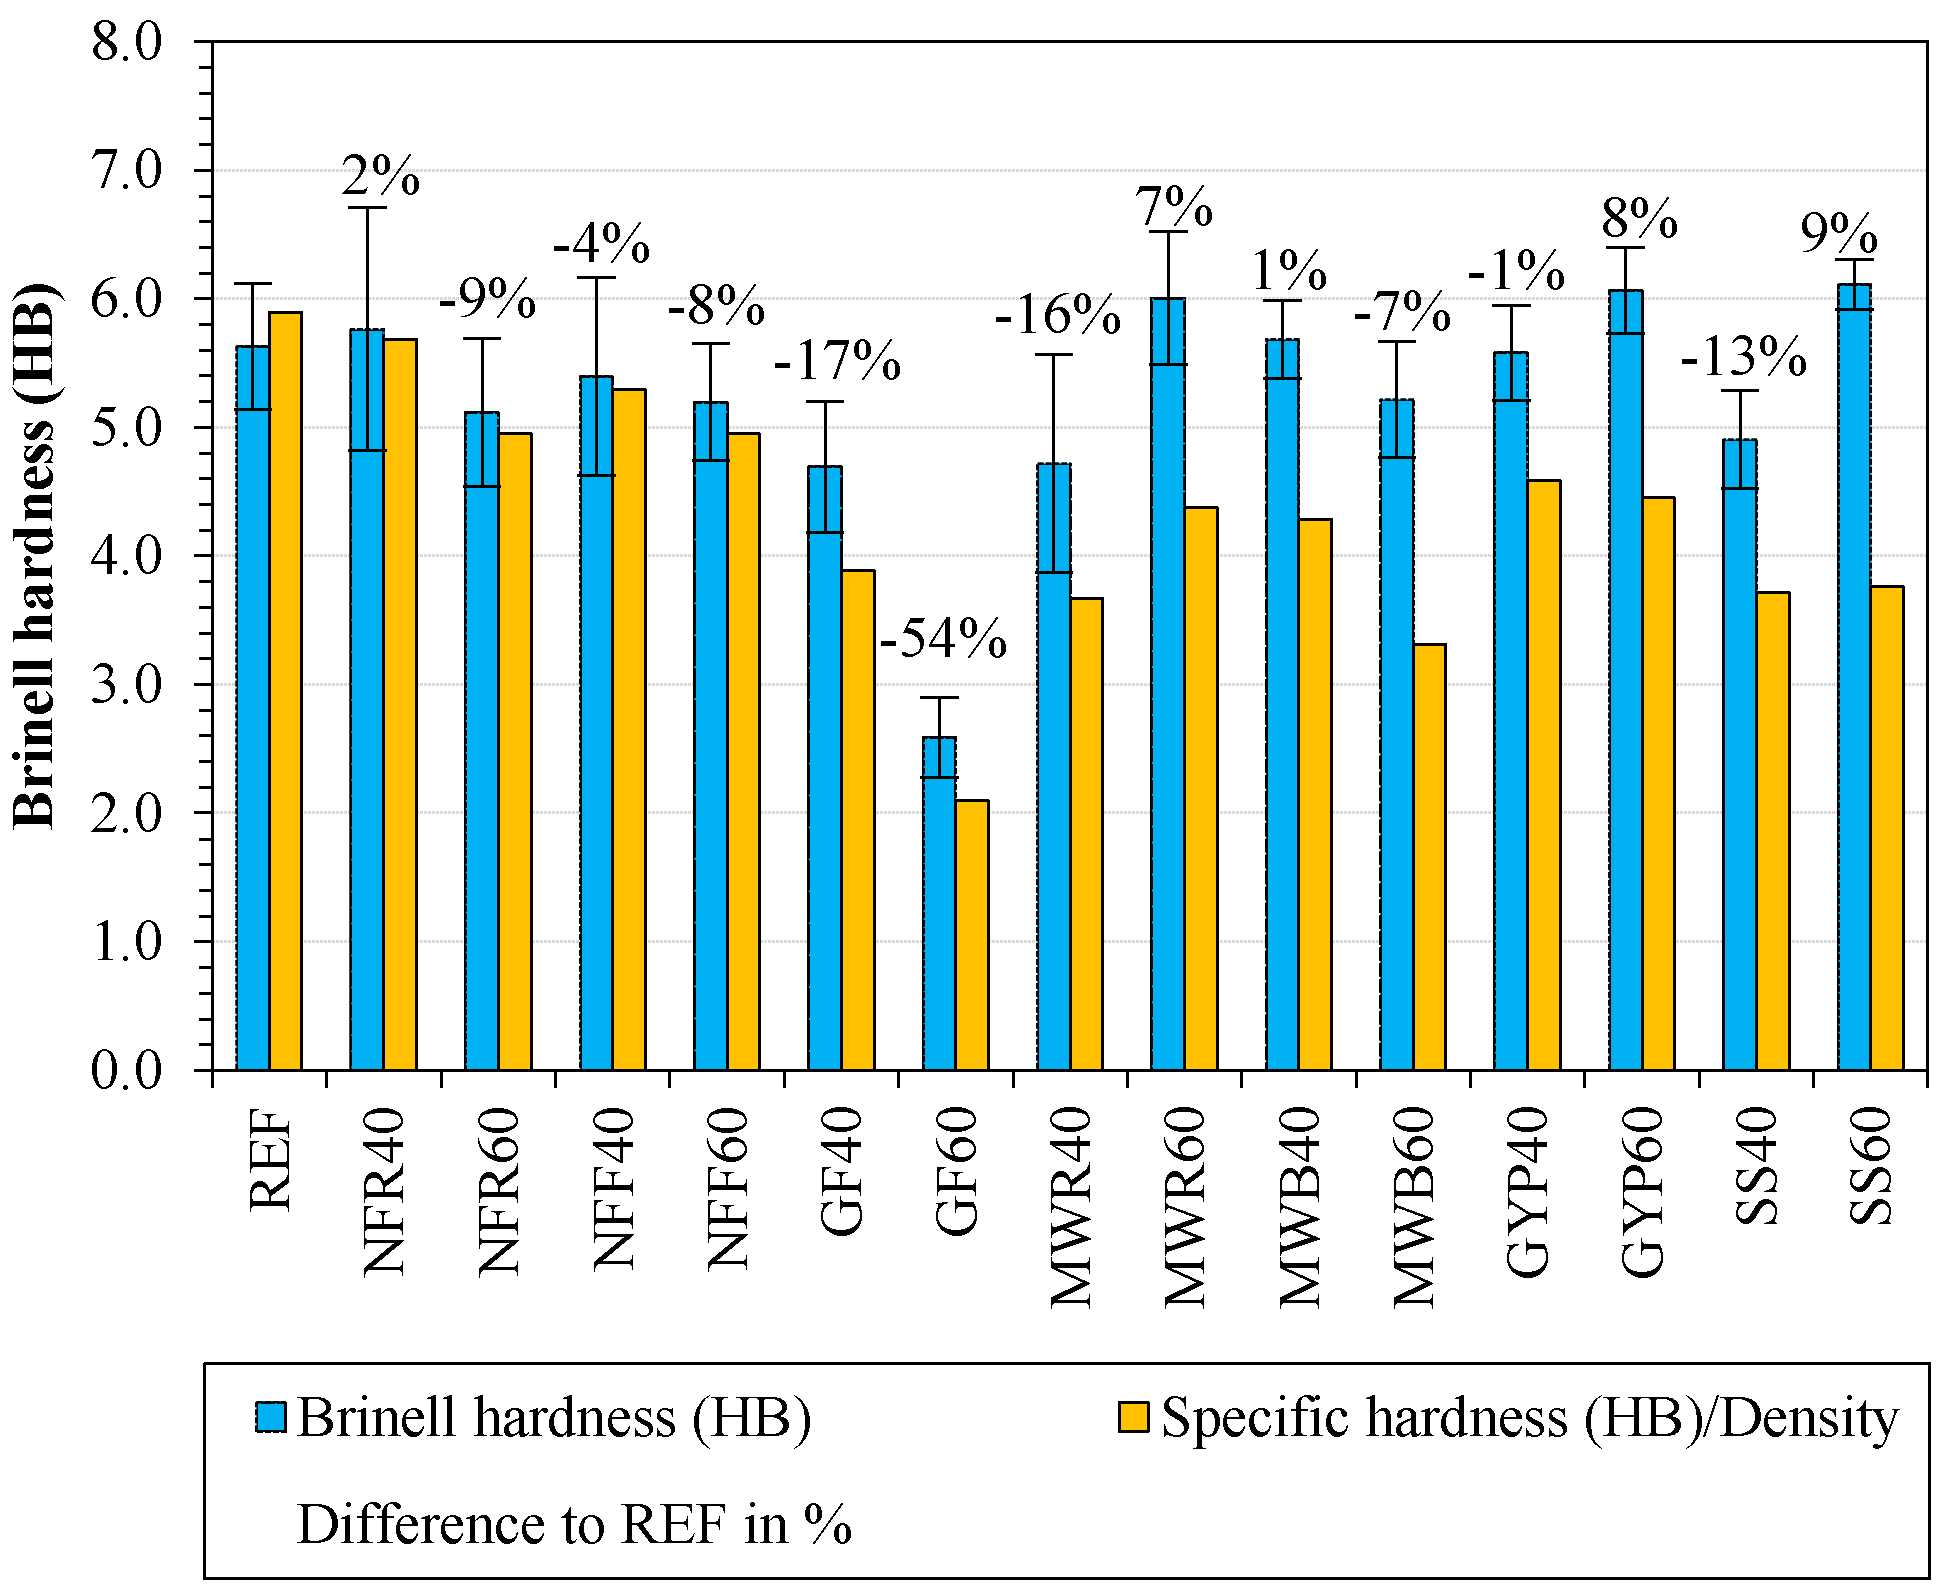
3.1.4. Brinell Hardness
Hardness is the degree of permanent deformation of a material under an applied force. Figure 10 displays the results for the measured Brinell and the hardness in relation to density. There was a small increase in the Brinell hardness in the composites MWR60 (6.0 ± 0.5 HB), GYP60 (6.1 ± 0.3 HB), and SS60 (6.1 ± 0.2 HB) compared with the REF (5.6 ± 0.5 HB) material. However, when the increase in density is taken into consideration, soapstone is not a very efficient filler for increasing the surface hardness of the composite. In a previous study, the addition of mineral wool (40 wt %) to the recycled HDPE increased the Brinell hardness by 37% [35]. Another study reported that composites with 20, 30, and 40% of recycled mineral had 10.5, 16.5, and 20.6% lower Brinell hardness, respectively, than the reference [18]. The smaller content of the filler and better interfacial adhesion of particles to the polymer matrix was used to explain the greater hardness in the lower filler content [18]. Here, the filling effect of mineral wool lowered the Brinell hardness in MWR40 (4.7 ± 0.8 HB) by 16% and in MWB60 (5.2 ± 0.5 HB) by 7%. However, in the MWB40 (5.7 ± 0.3 HB) and MWR60 samples, the hardness increased by 1% and 7%, respectively. It would seem that the influence of mineral wool filling on hardness is not completely predictable with high fill rates. The highest hardness value was obtained in the SS60 composite; it had the least amount of variation in results. This is surprising, as soapstone mainly consists of talc, of which the Mohs hardness is lower than that of gypsum or silicon dioxide, which is one of the main components in mineral wool [38]. The composite SS40 (4.9 ± 0.4 HB) had a significantly lower hardness than SS60 and REF. This could be due to the fill rate decreasing the elastic properties of plastic but not creating highly packed zones of mineral material. GYP60 (6.1±0.3 HB) had the same hardness value as SS60 and the result for GYP40 (4.9 ± 0.4 HB) was higher than for SS40, which might be due to better packing of material, as the density comparison in Table 1 shows. Composites that had natural fiber filling demonstrated elastic behavior and spring-back, which explains the rather high values for hardness compared with the composites with mineral fillers. Both glass fiber samples GF40 (4.7 ± 0.5 HB) and GF60 (2.6 ± 0.3 HB) had the poorest results for hardness due to their soft fiber bundles on the surface of the material that gave way during the indentation test. In the GF60 samples, there was an approximately 1 mm layer of loose and soft fiber material. Previously, when glass fiber has been added as reinforcement to a wood plastic composite, a small increase in hardness has been reported [37]. However, the previous studies used only 10% of glass fiber, which dispersed more homogenously into the matrix and did not create soft fiber bundles. The hardness for wood plastic composite samples NFF40 (5.4 ± 0.8 HB), NFF60 (5.2 ± 0.5 HB), NFR40 (5.8 ± 0.9 HB), and NFR60 (5.1 ± 0.6 HB) was lower than in the REF material, probably because of the wood fibers close to the surface that gave way under pressure. When taking into consideration the increase in density and the lowering effect of the tested fillers, it can be stated that they are not advantageous for hardening the plastic. The reference material HDPE is better protected from permanent deformation by its uncompromised elasticity.
3.2. Morphology of Fractured Surfaces
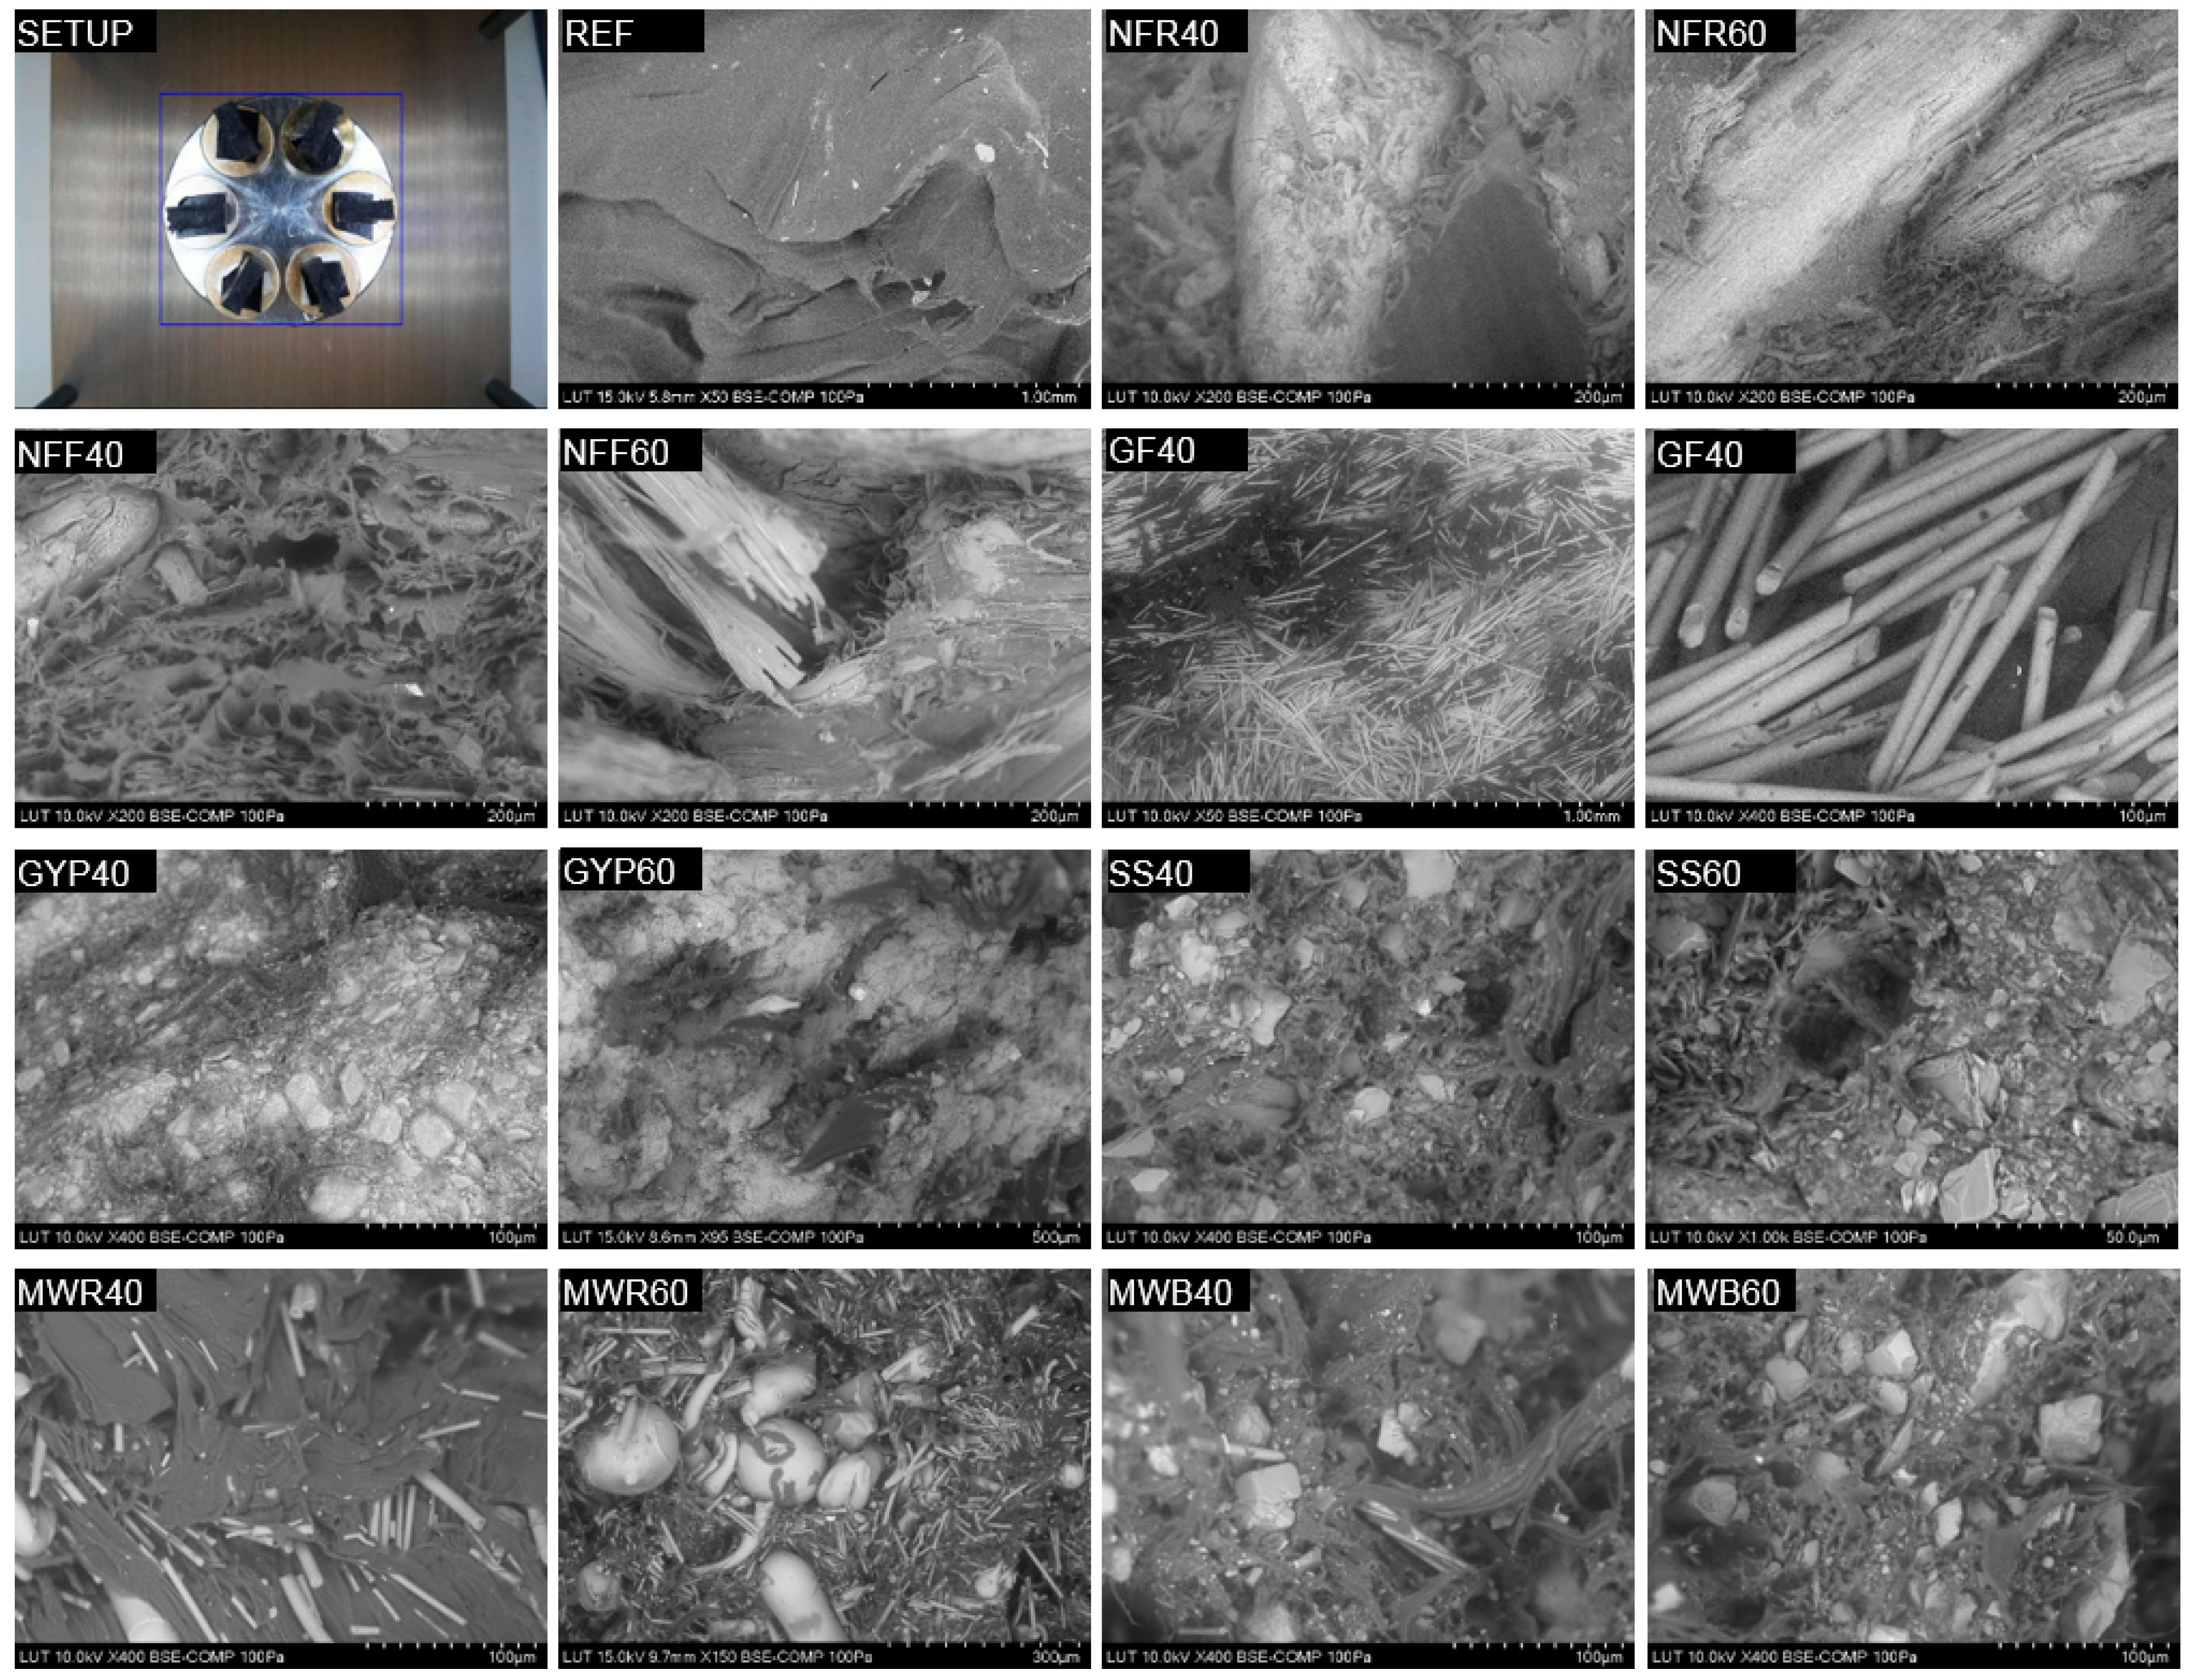
The scanning electronic microscopy can be used to analyze the topography of the broken tensile strength samples to determine fracture mechanisms and the dispersion of filler materials in the matrix. Figure 11 displays the SEM images for selected specimens. The broken surface of the REF material shows small impurities. It is unlikely that these small particles would have had a major effect on the mechanical properties, as they seem to be just on the surface of the material. Small bits of unmelted plastic of different colors were visible on the surface of processed HDPE samples. Small quantities of impurities are often carried to the plastic material from the recycling process. The wood fibers seem to have been clustered in some parts of the broken surface; the concentrations of wood without the plastic matrix are weak points in the composite. Signs of fiber pullouts are visible in parts of the wood plastic composite. Debonding and fiber pullouts are dominant deformation processes when adhesion between the fiber and the matrix is poor [1]. The GF40 sample shows a small amount of plastic material on the glass fiber surface suggesting weak bonding between the matrix and the fiber. The scanning electron microscopy indicates the heavy clustering of glass fibers, which has probably impeded the flow of plastic during molding, likely causing the relatively high variation in the GF40 tensile strength results. Surprisingly, the impact strength results of GF40 were the second highest after REF. The glass fiber samples with 40% and 60% had both relatively high fill rates, and it is likely that with a smaller fill rate, the matrix would have a more heterogeneous structure and better processing quality. The fiber surface in MWR40 is clean of plastic material, suggesting weak bonding of the filler to the thermoplastic matrix. In the mineral wool based MWB40 and MWB60, the broken surfaces of the composite samples show the dislocations of the filler from the matrix. The matrix in both MWB40 and MWB60 shows signs of a tear by stretching; there are also grooves which show signs of fiber pull-outs. In the GYP60, the gypsum particulates have dispersed well into the material, which is demonstrated also by smaller deviation in the test results for mechanical properties in the samples. The gypsum filler in GYP40 and GYP60 displays clean surfaces without plastic to create proper adhesion in the points of break. The porosity and dislocation of the particulates from the matrix can be seen in the fracture scans of SS40 and SS60, but more in SS60. The large deviation in the tensile strength results of SS60 samples is related to the strong cavity formation around the soapstone particles.
3.3. Effects of Porosity in Mechanical Properties
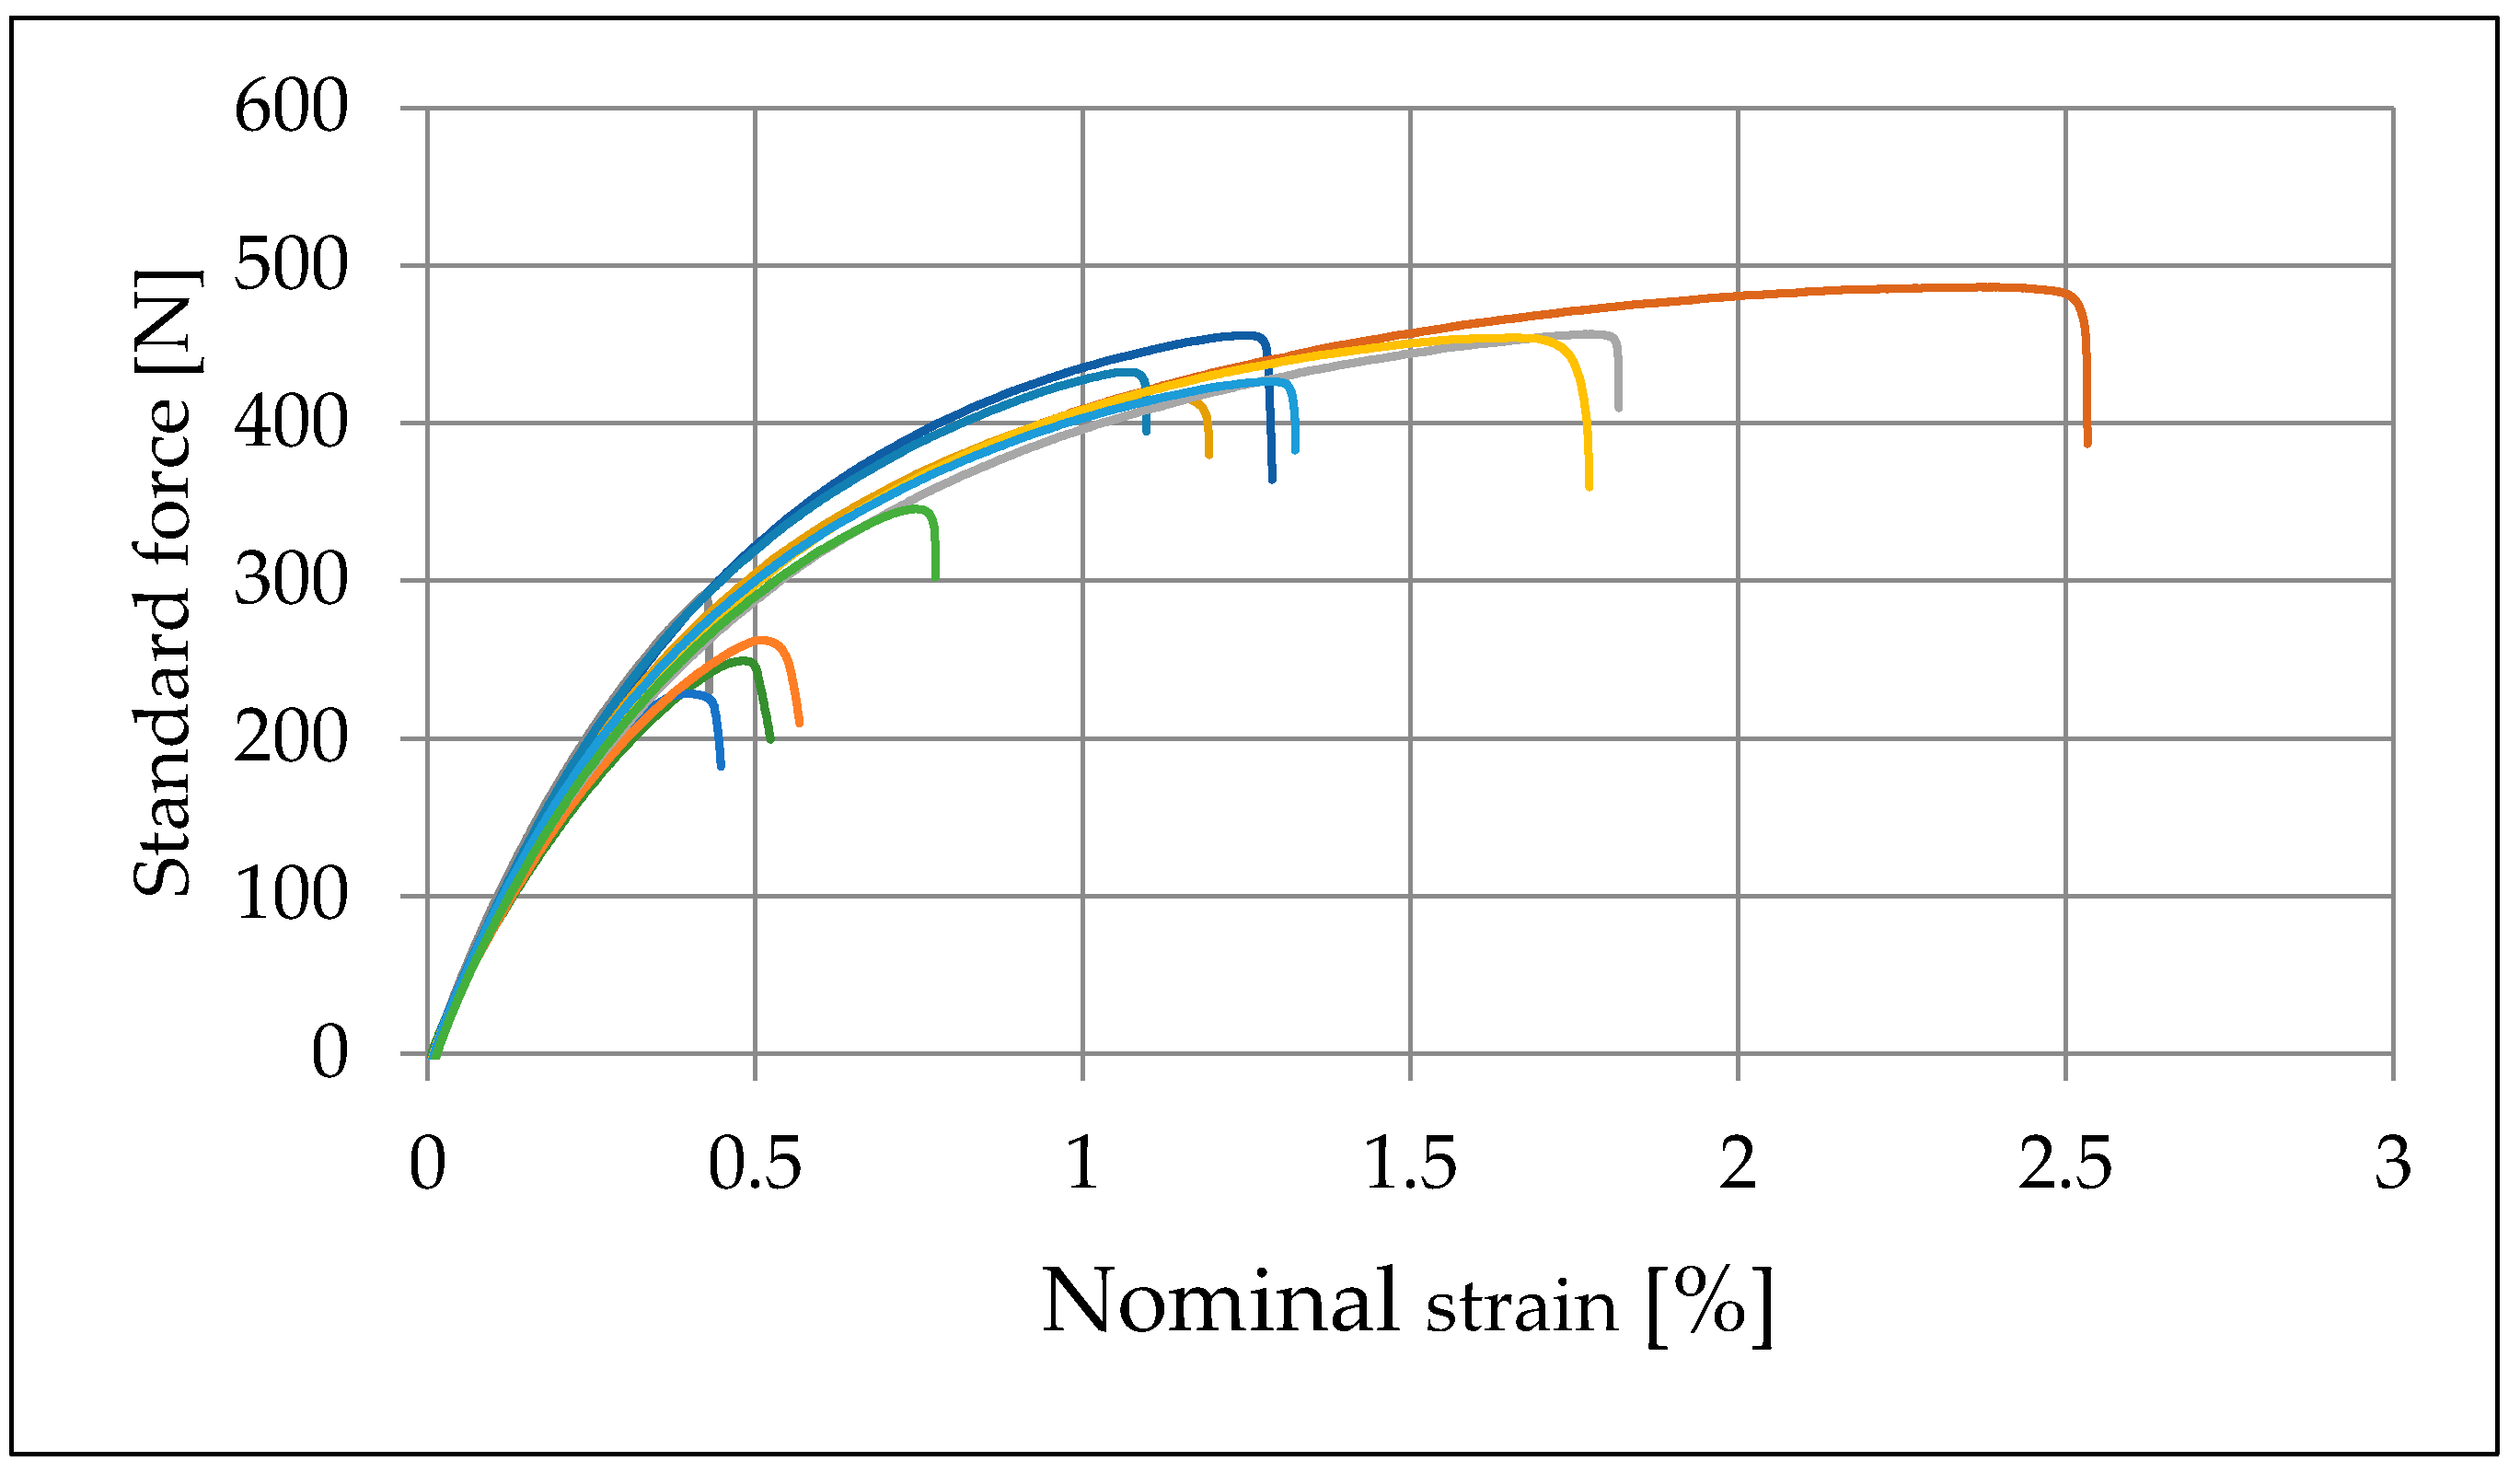
The porosity for the tested composites is presented in Table 1 and Table 2. The strength of the particulate filled composite depend strongly on the stress transfer between the filler and the matrix [39]. The void content and their shape, size, and location effect on the mechanical properties and to the mechanisms leading to mechanical failure stress/strain concentration effects [40]. This phenomenon is visible in the strain curves of composite SS60 which had relatively high porosity (25.3%) see Figure 12. Similar behavior could be seen in the composites with lower volume of porosity suggesting also irregularity in the dispersion of filler material. The presence of both resin and interlaminar voids is verified in the SEM of broken tensile samples see Figure 11. The influence of high porosity is most clearly seen in the soapstone filled composites SS40 and SS60. Both SS40 and SS60 had high variance in impact and tensile strength properties, whereas GYP40 and GYP60 had little porosity and small variance. The lack of heating in the mold probably affected adversely the properties of the composite as the trapped air had not enough time to move through the channel before the solidification of material.
3.4. Moisture Absorption and Thickness Swelling
Moisture absorption and thickness swelling divided the tested materials into two distinct categories by performance: fiber and particle filled composites (see Table 3). The reference material REF did not absorb water during the immersion time of 28 days. The wood plastic composites NFR60 and NFF60 absorbed approximately 13 wt % of water during the test period. The difference in performance between the 40% and 60% mixture was considerable as the NFR40 and NFF40 absorbed 5 wt % of water. The thickness swelling in wood plastic composites NFR60 and NFF60 was 4%, while the NFR40 and NFF40 had only 1%. The fiber mesh size had only a minimal effect on the moisture absorption, as shown also in previous studies [33]. It is notable that the wood plastic composite samples with both mesh sizes had significantly smaller thickness swelling than reported previously for compression molded wood plastics [41]. This can be attributed to the used coupling agent maleic anhydride modified polyethylene, which has been shown to improve the water absorption resistance of wood plastic composites [42]. The glass fiber 60% composite GF60 absorbed approximately 10 wt % of water during the immersion, performing more weakly than the hydrophilic wood plastic composites NFR40 and NFF40. In both of the glass fiber compositions, the poor surface quality, lack of plastic film on the surface, clustering of fibers and weak bonding formed pathways for the water to enter into the composite increasing the water absorption to a relatively high level considering the hydrophobicity of the materials used. The poor quality of the glass fiber samples was evident also in the thickness swelling measurement as the material was actually separated from the samples during the immersion period.
The water absorption and thickness swelling of the particle based composites was negligible. The highest value for thickness swelling in particle-filled composites was approximately 1% in the MWR60 and GYP60 composites. A small amount of filler material was separated during the immersion time, which would seem to suggest an incomplete covering of the particulates by the matrix on the surface of the composite samples. This could be seen from the visible mineral particles in the water container after drying the tested samples.
3.5. Evaluation of Heat Build-Up and Color Measurements
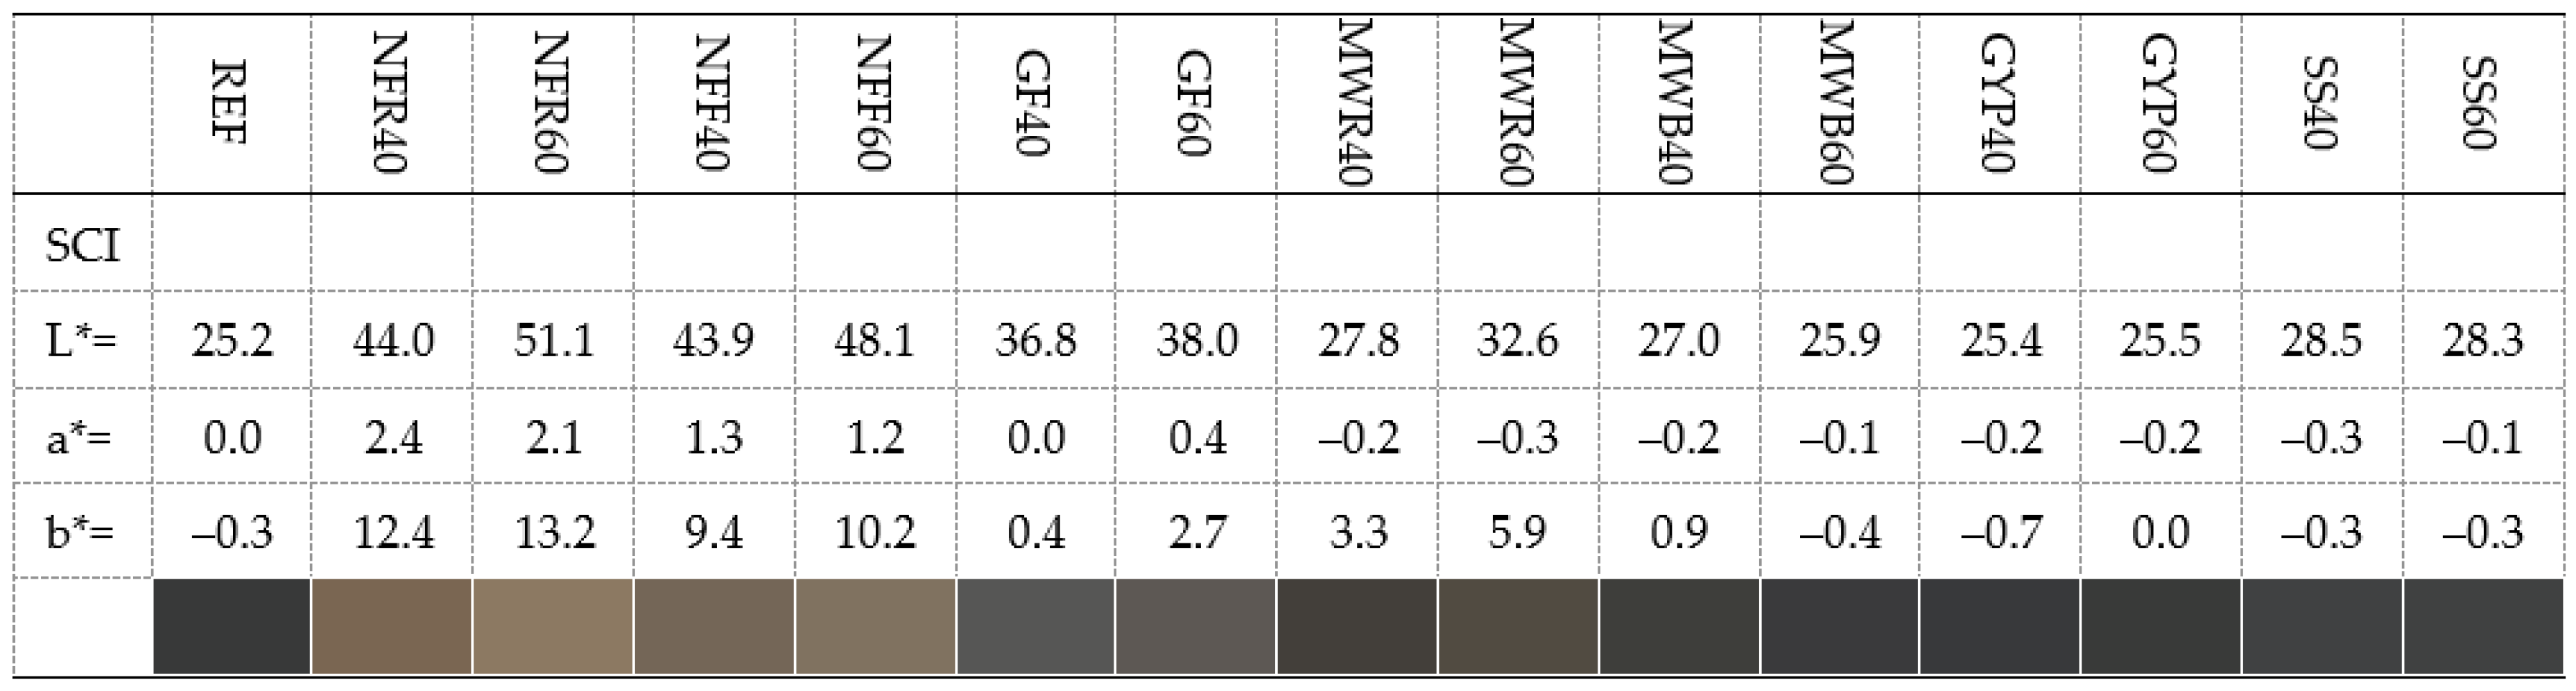
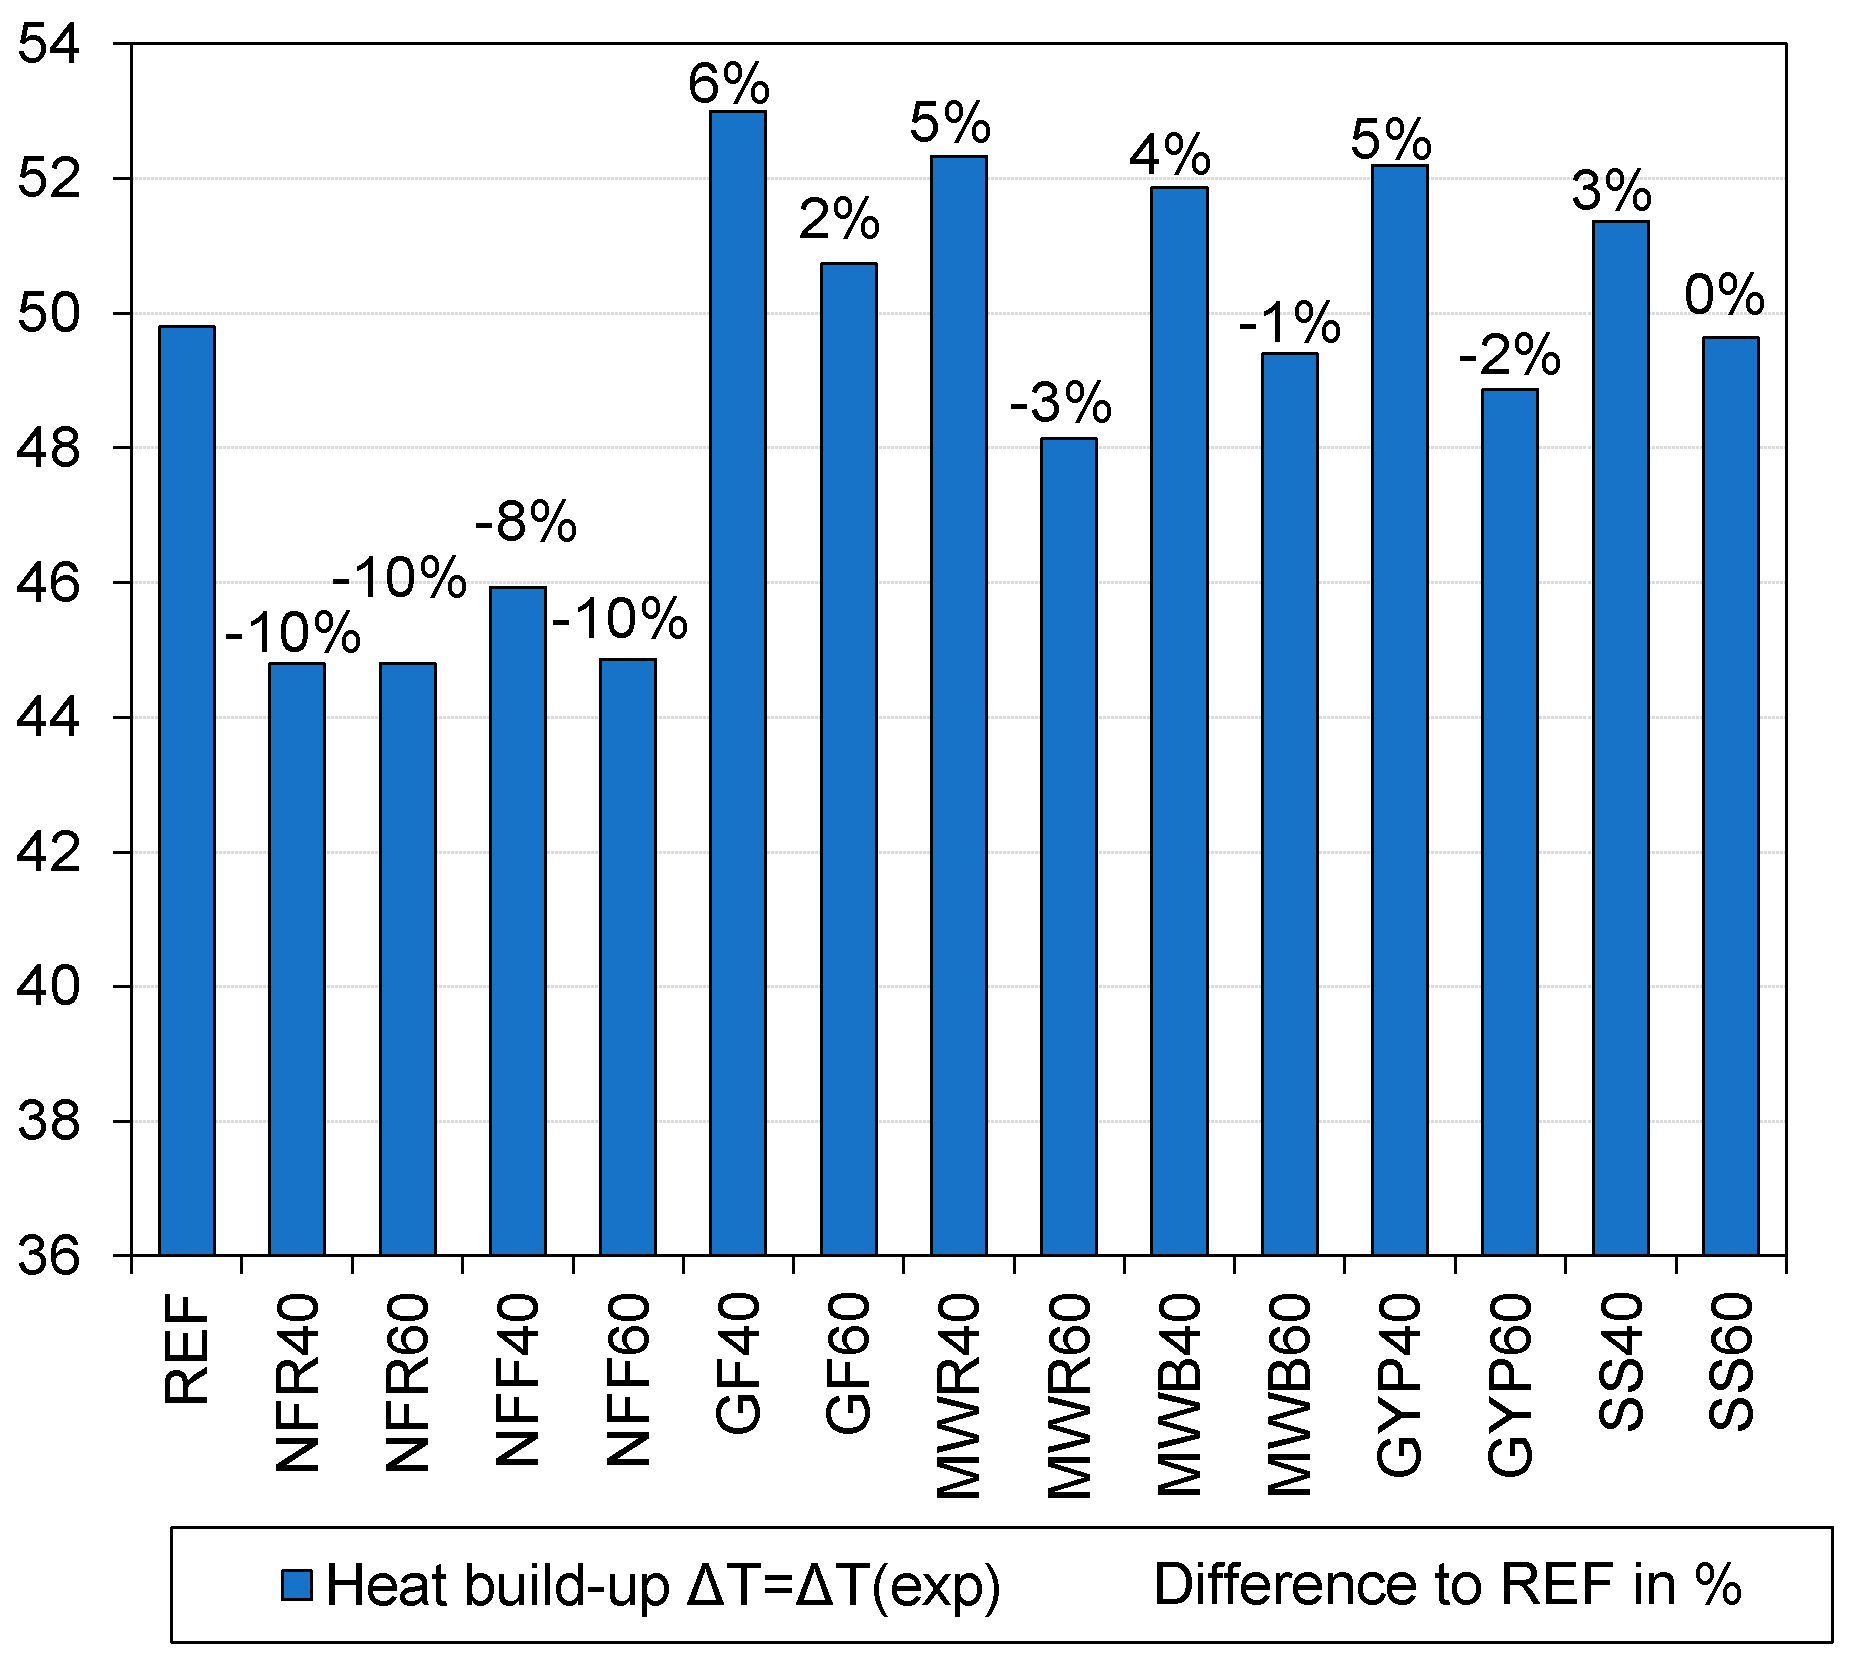
The rise of temperature in the composite material exposed to thermal radiation is related to the optical properties [43]. Figure 13 presents the measured CIE L*, a*, and b* color values, with specular component included (SCI) and specular component excluded (SCE). The lightness *L represents the darkest black at *L = 0, and bright white at *L = 100. The measured values for a* and b* represent the true neutral grey value at a* = 0 and b* = 0. The green color is represented at negative a* values and red at positive a* values. The b* negative values represent blue and the positive b* values represent yellow color. The composite CIE-LAB values were estimated using Colorizer [44]. The black reference sample REF had an *L value of 25.20, whereas the results for the mineral filled samples were in the range 25.50–28.26. The exception to this was MWR60 with *L 32.61. For the wood plastic samples, the *L value ranged between 44.01 and 51.06, resulting in decreased heat build-up. The composites with the mineral fill rate 40% increased the heat build-up by 4.5% compared with the reference material REF. The samples with a 60% mineral fill rate had no significant change in heat build-up compared with REF. The addition of wood fibers had on average a 10% decrease in heat build-up. The use of wood particles resulted in lighter colors than the black REF material. The results for wood plastic composite samples were close to previously reported ones with recycled materials [14]. Both wood and glass fiber filling had the greatest impact on the optical properties compared with the reference material. The mineral filled composites had relatively low values for reflectance compared with wood plastic and glass fiber samples. This can lead to higher heat build-up values, as Figure 14 shows. The carbon black originally used to color the recycled sewer pipe plastic had the greatest influence on the optical properties of the composite. The addition of mineral and fiber fillers, however, decreased the reflectance of the plastic, giving it more of a dull type appearance. The filler particulate size could also have affected the results of the color measurements, as the wood fibers were several times larger than any of the other filler type particles that were milled into dust in the agglomerating stage. The importance of color depends on the application and market trends; therefore, the effect of filler on the visual look of the product should be assessed case by case.
4. Conclusions
In this study, compression-molded composites were made of recycled materials, and their mechanical properties were examined. The morphology of the HDPE/recycled material composites was analyzed by observing the tensile pull-fracture surface. The recycled filler materials were able to significantly improve the tensile modulus of the recycled HDPE but had a decreasing effect on impact strength, tensile strength and elasticity. The Brinell hardness of the plastic did not improve with the addition of mineral fillers even with 60% fill rates, and most of the composites had lower values for hardness with the exception of MWR60 and GYP60. The measured densities of the composites did not follow the rule-of-mixture, which would seem to suggest uneven mixing in the processing phase and porosity in the samples. This was supported by voids and clustered particles found in the SEM analysis and in the variance in the tensile strength and tensile modulus properties especially in composites with fiber filling. Porosity and clustering of filler material were identified as major causes for variance in mechanical properties. The lack of hot-melt mixing during material processing probably had a negative effect on the final composite mechanical properties. The hot-melt mixing would have improved the dispersion of the filler materials into the matrix. The tested mineral particle filled composites could be used in a variety of compression molded products previously made of recycled plastic, especially where a large volume of material is needed. The composites with mineral fillers had better resistance to moisture compared to wood plastic composites, which would be beneficial especially in outdoor applications. The heat built-up in composites with mineral fillers was higher than in the ones with wood, which suggest that natural fibers are still a better option for producing decking products. The recycled glass fiber did not function optimally with the used recycled plastic as it did not mix properly into the matrix, therefore, the combination as such is not advisable due to the risk of fiber separation. The use of filler type specific coupling agents and improved mixing during processing could further improve the properties throughout the tested material range. Future studies on the methodology of designing products with recycled material composites are required. Furthermore, the economics and carbon footprint of such production should be verified to better understand the potential of the recycled materials in composites.
Author Contributions
P.S. designed tooling, produced the samples, tested the materials, performed the analysis and investigation part and prepared the paper; T.K. provided supervision for the project and contributed to the methodology selection.
Funding
This research did not receive any specific grant from funding agencies in the public, commercial, or non-profit sectors.
Conflicts of Interest
The authors declare that they have no conflict of interest in this work.
References
- Móczó, J.; Pukánszky, B. Polymer micro and nanocomposites: Structure, interactions, properties. J. Ind. Eng. Chem. 2008, 14, 535–563. [Google Scholar] [CrossRef]
- Rueda, M.M.; Auscher, M.C.; Fulchiron, R.; Périé, T.; Martin, G.; Sonntag, P.; Cassagnau, P. Rheology and applications of highly filled polymers: A review of current understanding. Prog. Polym. Sci. 2017, 66, 23–53. [Google Scholar] [CrossRef]
- Weidenfeller, B.; Höfer, M.; Schilling, F.R. Thermal conductivity, thermal diffusivity, and specific heat capacity of particle filled polypropylene. Compos. Part A Appl. Sci. Manuf. 2004, 35, 423–429. [Google Scholar] [CrossRef]
- Weidenfeller, B.; Höfer, M.; Schilling, F.R. Cooling behaviour of particle filled polypropylene during injection moulding process. Compos. Part A Appl. Sci. Manuf. 2005, 36, 345–351. [Google Scholar] [CrossRef]
- Hussain, A.R.J.; Alahyari, A.A.; Eastman, S.A.; Thibaud-Erkey, C.; Johnston, S.; Sobkowicz, M.J. Review of polymers for heat exchanger applications: Factors concerning thermal conductivity. Appl. Therm. Eng. 2017, 113. [Google Scholar] [CrossRef]
- Keskisaari, A.; Kärki, T. The use of waste materials in wood-plastic composites and their impact on the profitability of the product. Resour. Conserv. Recycl. 2018, 134, 257–261. [Google Scholar] [CrossRef]
- Tsai, H.; Kardos, J.L. The Halpin-Tsai Equations. Polym. Eng. Sci. 1976, 16, 344–352. [Google Scholar]
- Mori, T.; Tanaka, K. Average stress in matrix and average elastic energy of materials with misfitting inclusions. Acta Metall. 1973, 21, 571–574. [Google Scholar] [CrossRef]
- Fornes, T.D.; Paul, D.R. Modeling properties of nylon 6/clay nanocomposites using composite theories. Polymer (Guildf) 2003, 44, 4993–5013. [Google Scholar] [CrossRef]
- Adhikary, K.B.; Pang, S.; Staiger, M.P. Dimensional stability and mechanical behaviour of wood-plastic composites based on recycled and virgin high-density polyethylene (HDPE). Compos. Part B Eng. 2008, 39, 807–815. [Google Scholar] [CrossRef]
- Khoo, T.S.; Ratnam, M.M.; Khalil, H.P.S.A. Wood Filler(WF)-recycled Polypropylene (RPP) Composite Pallet: Study of Static Deformation using FEA and Shadow Moire. J. Reinf. Plast. Compos. 2008, 27, 1733–1744. [Google Scholar] [CrossRef]
- Fortum Oyj. Recycled Plastics and Products. Available online: https://www.fortum.com/products-and-services/recycling-waste/welcome-waste-solutions/recycled-plastics-and-products (accessed on 12 January 2019).
- Valente, M.; Sarasini, F.; Marra, F.; Tirillò, J.; Pulci, G. Hybrid recycled glass fiber/wood flour thermoplastic composites: Manufacturing and mechanical characterization. Compos. Part A Appl. Sci. Manuf. 2011, 42, 649–657. [Google Scholar] [CrossRef]
- Sommerhuber, P.F.; Welling, J.; Krause, A. Substitution potentials of recycled HDPE and wood particles from post-consumer packaging waste in Wood-Plastic Composites. Waste Manag. 2015, 46, 76–85. [Google Scholar] [CrossRef] [PubMed]
- Zampaloni, M.; Pourboghrat, F.; Yankovich, S.A.; Rodgers, B.N.; Moore, J.; Drzal, L.T.; Mohanty, A.K.; Misra, M. Kenaf natural fiber reinforced polypropylene composites: A discussion on manufacturing problems and solutions. Compos. Part A Appl. Sci. Manuf. 2007, 38, 1569–1580. [Google Scholar] [CrossRef]
- Toghyani, A.E. Effect of Temperature on the Shaping Process of an Extruded Wood-Plastic Composite (WPC) Profile in a Novel Post-Production Process; Lappeenranta University of Technology: Lappeenranta, Finland, 2017. [Google Scholar]
- Klyosov, A.A. Wood-Plastic Composites; John Wiley & Sons, Inc.: Hoboken, NJ, USA, 2007; ISBN 9780470148914. [Google Scholar]
- Väntsi, O.; Kärki, T. Utilization of recycled mineral wool as filler in wood-polypropylene composites. Constr. Build. Mater. 2014, 55, 220–226. [Google Scholar] [CrossRef]
- Raghavendra, T.; Udayashankar, B.C. Engineering properties of controlled low strength materials using flyash and waste gypsum wall boards. Constr. Build. Mater. 2015, 101, 548–557. [Google Scholar] [CrossRef]
- Tulikivi. Available online: https://www.tulikivi.com/usa-can/tulikivi/Mineral_Composition_of_soapstone (accessed on 21 August 2018).
- Maldas, D.; Kokta, B.V. Role of coupling agents on the performance of woodflour-filled polypropylene composites. Int. J. Polym. Mater. Polym. Biomater. 1994, 27, 77–88. [Google Scholar] [CrossRef]
- Lai, S.-M.; Yeh, F.-C.; Wang, Y.; Chan, H.-C.; Shen, H.-F. Comparative study of maleated polyolefins as compatibilizers for polyethylene/wood flour composites. J. Appl. Polym. Sci. 2002, 87, 487–496. [Google Scholar] [CrossRef]
- Bengtsson, M.; Oksman, K. The use of silane technology in crosslinking polyethylene/wood flour composites. Compos. Part A Appl. Sci. Manuf. 2006, 37, 752–765. [Google Scholar] [CrossRef]
- Kazayawoko, M.; Balatinecz, J.J.; Matuana, L.M. Surface modification and adhesion mechanisms in woodfiber-polypropylene composites. J. Mater. Sci. 1999, 34, 6189–6199. [Google Scholar] [CrossRef]
- British Standards Institute. Plastics—Determination of Tensile Properties—Part 1: General Principles; ISO Standard, BS ISO 527-1; ISO: Geneva, Switzerland, 2012. [Google Scholar]
- EN317:1993. Particleboards and Fibreboards. Determination of Swelling in Thickness after Immersion in Water; British Standards Institute: London, UK, 1993. [Google Scholar]
- EN15534-1:2014. Composites Made from Cellulose-Based Materials and Thermoplastics (Usually Called Wood-Polymer Composites (WPC) or Natural Fibre Composites (NFC)). Part 1: Test Methods for Characterisation of Compounds and Products; CEN-CENELEC Management Centre: Brussels, Belgium, 2017. [Google Scholar]
- Perkins, W.G. Polymer toughness and impact resistance. Polym. Eng. Sci. 1999, 39, 2445–2460. [Google Scholar] [CrossRef]
- Lapčík, L.; Maňas, D.; Lapčíková, B.; Vašina, M.; Staněk, M.; Čépe, K.; Vlček, J.; Waters, K.E.; Greenwood, R.W.; Rowson, N.A. Effect of filler particle shape on plastic-elastic mechanical behavior of high density poly(ethylene)/mica and poly(ethylene)/wollastonite composites. Compos. Part B Eng. 2018, 141, 92–99. [Google Scholar] [CrossRef]
- Xanthos, M. Polymers and Polymer Composites. In Functional Fillers for Plastics; John Wiley & Sons, Inc.: Hoboken, NJ, USA, 2005; ISBN 9783527605095. [Google Scholar]
- Cui, Y.-H.; Tao, J. Fabrication and Mechanical Properties of Glass Fiber-Reinforced Wood Plastic Hybrid Composites. J. Appl. Phys. 2009, 112, 1250–1257. [Google Scholar] [CrossRef]
- Migneault, S.; Koubaa, A.; Perré, P. Effect of fiber origin, proportion, and chemical composition on the mechanical and physical properties of wood-plastic composites. J. Wood Chem. Technol. 2014, 34, 124–261. [Google Scholar] [CrossRef]
- Bouafif, H.; Koubaa, A.; Perré, P.; Cloutier, A. Effects of fiber characteristics on the physical and mechanical properties of wood plastic composites. Compos. Part A Appl. Sci. Manuf. 2009, 40, 1975–1981. [Google Scholar] [CrossRef]
- Migneault, S.; Koubaa, A.; Erchiqui, F.; Chaala, A.; Englund, K.; Wolcott, M.P. Effects of processing method and fiber size on the structure and properties of wood-plastic composites. Compos. Part A Appl. Sci. Manuf. 2009, 32, 619–629. [Google Scholar] [CrossRef]
- Bredikhin, P.A.; Kadykova, Y.A. Waste stone wool as an effective filler for polyethylene. Int. Polym. Sci. Technol. 2016, 44, 31–33. [Google Scholar] [CrossRef]
- Migneault, S.; Koubaa, A.; Perré, P.; Riedl, B. Effects of wood fiber surface chemistry on strength of wood-plastic composites. Appl. Surf. Sci. 2015, 343, 11–18. [Google Scholar] [CrossRef]
- Turku, I.; Kärki, T. The effect of carbon fibers, glass fibers and nanoclay on wood flour-polypropylene composite properties. Eur. J. Wood Wood Prod. 2014, 72, 73–79. [Google Scholar] [CrossRef]
- Kappel, G.W. An Updated and Extended Mohs Mineral Hardness Scale. Available online: https://www.sedonagemandmineral.org/resources/Updated_Mohs_Scale.pdf (accessed on 24 September 2018).
- Fu, S.-Y.; Feng, X.-Q.; Lauke, B.; Mai, Y.-W. Effects of particle size, particle/matrix interface adhesion and particle loading on mechanical properties of particulate–polymer composites. Compos. Part B Eng. 2008, 39, 933–961. [Google Scholar] [CrossRef]
- Mehdikhani, M.; Gorbatikh, L.; Verpoest, I.; Lomov, S.V. Voids in fiber-reinforced polymer composites: A review on their formation, characteristics, and effects on mechanical performance. J. Compos. Mater. 2018. [Google Scholar] [CrossRef]
- Kazemi Najafi, S.; Kiaeifar, A.; Tajvidi, M.; Hamidinia, E. Hygroscopic thickness swelling rate of composites from sawdust and recycled plastics. Wood Sci. Technol. 2008, 42, 161–168. [Google Scholar] [CrossRef]
- Adhikary, K.B.; Pang, S.; Staiger, M.P. Long-term moisture absorption and thickness swelling behaviour of recycled thermoplastics reinforced with Pinus radiata sawdust. Chem. Eng. J. 2008, 142, 190–198. [Google Scholar] [CrossRef]
- Martikka, O.; Huuhilo, T.; Butylina, S.; Kärki, T. The effect of mineral fillers on the thermal properties of wood-plastic composites. Wood Mater. Sci. Eng. 2012, 5, 34–40. [Google Scholar] [CrossRef]
- Colorizer. Color Picker and Converter (RGB HSL HSB/HSV CMYK HEX LAB). Available online: http://colorizer.org/ (accessed on 24 September 2018).
Figure 1.
The setup for the compression molding of samples.

Figure 2.
A tool constructed for the compression molding of tensile strength samples.

Figure 3.
Tensile strength samples after molding.

Figure 4.
Compression molded square plate before cutting.

Figure 5.
Moisture absorption samples immersed in water.

Figure 6.
Charpy unnotched impact strength.

Figure 7.
Tensile strength of HDPE-based composites.

Figure 8.
Top and bottom view of heated wood plastic agglomerate.

Figure 9.
Tensile modulus of HDPE-based composites.

Figure 10.
Brinell hardness of HDPE-based composites.

Figure 11.
Scanning electron microscopy of broken tensile sample surfaces.

Figure 12.
Strain curve of SS60 composite samples.

Figure 13.
CIE L*, a*, and b* color coordinates of the studied composites.

Figure 14.
Heat build-up of the studied composites.


Table 1.
Composite formulations, part I (the proportion of material by weight).
| REF | NFR40 | NFR60 | NFF40 | NFF60 | GF40 | GF60 | |
|---|---|---|---|---|---|---|---|
| HDPE, recycled | 94% | 54% | 34% | 54% | 34% | 54% | 34% |
| Wood flour, rough recycled | 0% | 40% | 60% | 0% | 0% | 0% | 0% |
| Wood flour, fine recycled | 0% | 0% | 0% | 40% | 60% | 0% | 0% |
| Glass fiber, by-product | 0% | 0% | 0% | 0% | 0% | 40% | 60% |
| Coupling agent | 3% | 3% | 3% | 3% | 3% | 3% | 3% |
| Processing additive | 3% | 3% | 3% | 3% | 3% | 3% | 3% |
| Density by Rule-of-mixture g/cm3 | 0.95 | 1.09 | 1.16 | 1.13 | 1.22 | 1.57 | 1.88 |
| Measured density g/cm3 | 0.95 ± 0.00 | 1.02 ± 0.01 | 1.03 ± 0.02 | 1.02 ± 0.02 | 1.05 ± 0.01 | 1.21 ± 0.03 | 1.24 ± 0.10 |
| Porosity | 0.1% | 6.5% | 11.3% | 9.8% | 14.0% | 23.0% | 34.1% |
Table 2.
Composite formulations, part II (the proportion of material by weight).
| MWR40 | MWR60 | MWB40 | MWB60 | GYP40 | GYP60 | SS40 | SS60 | |
|---|---|---|---|---|---|---|---|---|
| Mineral wool, recycled | 40% | 60% | 0% | 0% | 0% | 0% | 0% | 0% |
| Mineral wool, by-product | 0% | 0% | 40% | 60% | 0% | 0% | 0% | 0% |
| Gypsum, recycled | 0% | 0% | 0% | 0% | 40% | 60% | 0% | 0% |
| Soap-stone, by-product | 0% | 0% | 0% | 0% | 0% | 0% | 40% | 60% |
| Coupling agent | 3% | 3% | 3% | 3% | 3% | 3% | 3% | 3% |
| Processing additive | 3% | 3% | 3% | 3% | 3% | 3% | 3% | 3% |
| Density by rule-of-mixture g/cm3 | 1.62 | 1.95 | 1.62 | 1.95 | 1.28 | 1.44 | 1.76 | 2.17 |
| Measured density g/cm3 | 1.28 ± 0.02 | 1.37 ± 0.01 | 1.33 ± 0.01 | 1.57 ± 0.01 | 1.22 ± 0.01 | 1.37 ± 0.03 | 1.32 ± 0.01 | 1.62 ± 0.02 |
| Porosity | 20.8% | 29.7% | 17.7% | 19.4% | 4.3% | 4.7% | 25.1% | 25.3% |
Table 3.
Moisture absorption and thickness swelling after immersion of 28 days.
| REF | NFR40 | NFR60 | NFF40 | NFF60 | GF40 | GF60 | MWR40 | MWR60 | MWB40 | MWB60 | GYP40 | GYP60 | SS40 | SS60 | |
|---|---|---|---|---|---|---|---|---|---|---|---|---|---|---|---|
| MA wt % | 0.4 | 5.0 | 13.5 | 5.0 | 12.9 | 2.3 | 9.7 | 0.3 | 0.8 | 0.3 | 0.3 | 0.2 | 1.1 | 0.3 | 0.1 |
| TS % | 0.0 | 1.2 | 4.4 | 1.2 | 4.3 | −0.3 | −1.1 | −0.4 | 1.2 | −0.1 | −1.2 | 0.0 | 1.0 | −0.2 | −0.4 |
© 2019 by the authors. Licensee MDPI, Basel, Switzerland. This article is an open access article distributed under the terms and conditions of the Creative Commons Attribution (CC BY) license (http://creativecommons.org/licenses/by/4.0/).
Share and Cite
MDPI and ACS Style
Sormunen, P.; Kärki, T. Compression Molded Thermoplastic Composites Entirely Made of Recycled Materials. Sustainability 2019, 11, 631. https://doi.org/10.3390/su11030631
AMA Style
Sormunen P, Kärki T. Compression Molded Thermoplastic Composites Entirely Made of Recycled Materials. Sustainability. 2019; 11(3):631. https://doi.org/10.3390/su11030631
Chicago/Turabian StyleSormunen, Petri, and Timo Kärki. 2019. "Compression Molded Thermoplastic Composites Entirely Made of Recycled Materials" Sustainability 11, no. 3: 631. https://doi.org/10.3390/su11030631
Note that from the first issue of 2016, this journal uses article numbers instead of page numbers. See further details here.