Sustainable Knowledge Management and Its Impact on the Performances of Biotechnology Organizations
by
 ,
,
Alexandra Zbuchea
1,* ,
,
Florina Pînzaru
1,
Mihail Busu
2, 
Sergiu-Octavian Stan
1 and
Alina Bârgăoanu
1 1
National University of Political Studies and Public Administration, Bucharest, 012104, Romania
2
Bucharest University of Economic Studies, Bucharest, 010374, Romania
*
Author to whom correspondence should be addressed.
Sustainability 2019, 11(2), 359; https://doi.org/10.3390/su11020359
Submission received: 11 December 2018
/
Revised: 6 January 2019
/
Accepted: 7 January 2019
/
Published: 11 January 2019
(This article belongs to the Special Issue Innovation and Sustainability in a Turbulent Economic Environment–Selected Papers from the 12th International Conference on Business Excellence)
Abstract
:Starting from the findings of specialized studies on knowledge management in the field of biotechnology, this paper aims to present the factors that underline sustainable performances of Romanian biotechnology organizations. Particularly, descriptive analysis of these factors has outlined a picture of the current situation of biotechnology in Romania. The design of an exploratory knowledge management model for organizations in the biotechnology sector was achieved and validated through a panel data model. Starting from a model of growth based on productivity, capital inflow, and human capital, three statistical hypotheses were validated by a time series data panel regression model using EViews 9.0 software. The data were collected for the enterprises active in the field of biotechnology for a period of nine years. The paper highlights the fact that the economic performance of biotechnology organizations is determined by the flow of capital, productivity, and the workforce. Knowledge-based growth strategies are essential in the econometric model presented. Nevertheless, in terms of knowledge management strategies, the sector has not reached its maturity, and full sustainability is not a norm.
1. Introduction
In the past decade, there has seemed to be a scientific consensus on the importance of sustainability, both at an organizational level [1,2] and at national and global levels [3,4]. Within this framework, organizations are not only expected to be sustainable, but it is also in their interest to be so [5]. New business opportunities and models are emerging, related both to this sustainable drive and technological development, and also to shifts in society and mentalities. Knowledge is at the center of this evolution.
Nowadays, society is experiencing a new era where proper capitalization of knowledge determines competitiveness and long-term sustainability. As a clear sign of this trend, knowledge management has emerged as a key interest in both academia and practice, being immersed into various fields and disciplines. What was once thought to be a fashionable approach to current phenomena has rapidly turned into a multilevel reality: Both at the macro and micro levels, the imperative for knowledge-based processes is becoming topical and compelling.
At a macro level, more and more economic growth strategies are knowledge-driven, thus displaying the decision makers’ propensity toward harvesting, storing, generating, and leveraging both the existing and novel sources of knowledge. Here, developing new knowledge, as well as building capacity to access and adapt global knowledge to specific contexts, set themselves up as drivers of sustainable growth. Organically linked to this evolution, at a micro level, a wide array of organizations sustains strategies and practices leading to effective knowledge management systems, hence acknowledging their impact on business performance and, implicitly, on sustainable growth. By corroborating these perspectives, new economic and business models give way to a thorough enhancement of the ability of societies, communities, companies, and individuals to wisely use and benefit from this knowledge. Even more, they place knowledge at the core of their existence and survival while addressing it as a strategic resource or as a key business asset.
Biotechnology is an innovative domain that embeds knowledge in its DNA and creates knowledge and networks based on knowledge. Therefore, knowledge management should be an organic approach to the sustainable development of such organizations. Nevertheless, studies dedicated to the peculiarities of knowledge management in this field are limited in terms of number and approaches [6,7,8,9,10,11,12].
In the above-presented framework, knowledge management has emerged in the past decades as a relevant domain of investigation [13]. Most of the studies referring to this topic either have investigated the phenomenon in a general manner [14,15,16,17], or have focused on all types of pro-profit organizations [18,19,20,21]. Nevertheless, also attention has been given to public organizations [22,23], educational institutions (especially higher education institutions [24,25,26]), and nonprofit organizations [27,28,29,30,31]: This allows contemplation of a complex framework of reference focusing on the internal processes associated with knowledge management [32] (such as knowledge management systems or knowledge sharing), as well as with intellectual capital [33]. Therefore, more attention should be given to inter-organizational processes, including open knowledge transfers inside a certain sector or among different sectors [34], aiming to a more inclusive sustainable development.
Biotechnology organizations are peculiar in terms of knowledge management and business performance. Previous studies have shown that the high-performing companies are small entrepreneurial organizations, rather than large organizations [8]. Knowledge retention is another key aspect for the successful organizations in the biotechnology field, where knowledge is one of the most valuable assets [12].
In order to be effective, knowledge management practice has to rely on a sound set of principles, which leads to increased innovation capabilities [35]. Therefore, in biotechnology organizations, the effectiveness of overall activity is mediated by knowledge management strategies through enhanced innovation. Nevertheless, knowledge management is part of the strategic equation. In a high-technologic environment, it complements the leadership and strategic management in business performance [36].
A transfer of knowledge in the biotechnology sector done between different types of organizations facilitates innovation to a large degree [8]. This has been supported by other studies showing that inter-organizational cooperation along the value chain is key to knowledge creation and innovation [7]. Therefore, sharing knowledge, cooperation, and retention of knowledge should coexist in a balanced way [9].
Knowledge sharing is a complex phenomenon. Knowledge could represent added value for an organization, a valuable resource that contributes to the organizational development [16,37]. Therefore, knowledge transfer is a sensitive issue. In addition, knowledge sharing is associated with knowledge absorption and integration [38]. Understanding knowledge sharing facilitates an increase of the transfer intensity [39,40].
The sharing of knowledge is influenced by a large number of factors that can be clustered into several dimensions: Human factors, organizational traits, and the environmental context [41,42]. Human factors are connected to individuals involved in the sharing processes, such as the individual’s motivations, trust, personality, technology literacy, attitude, and peer influence [43,44,45,46]. Organizational factors are connected to the characteristics and inner dynamics of the organization, such as structure, technological infrastructure, reward and recognition systems, work processes, leadership, and organizational cultural and social interaction relationships [39,40,45,46,47,48,49,50]. Environmental factors refer to the economic situation, competitive cultures, and public policies [48].
Knowledge transfers have been investigated by researchers in all types of organizations, both economic and nonprofit [51,52,53]. Several items can be observed when mapping knowledge transfers, such as value creation in the chain, enablers, and partners [54]; barriers [51,55]; and intensity [39]. We stress that this framework is set having cognitive knowledge in mind. Facilitating and tracing the sharing of cognitive knowledge is also easy to perform since a set of processes and supports can be operationalized [56]. The sharing of knowledge in this framework can be facilitated by social interaction among the actors, which is harder to observe [57]. During this process, emotional, spiritual, and tacit knowledge can also be transferred, both within the organization and among organizational partners. Strategic alliances facilitate this process. Strategic alliances give organizations a competitive advantage. At the core of these alliances is knowledge transfer among members [58].
Innovative capabilities depend on the knowledge and intellectual capital of companies [10]. In order to be a dynamic asset, knowledge has to be shared, leading to increased intellectual capital. This is a valuable asset of any organization, and in biotechnology companies it is even more relevant.
Having in mind the above-depicted framework, the present study investigates the economic factors that underline the performances of Romanian biotechnology organizations, highlighting their degree of sustainability and their particular contribution of knowledge sharing to their sustainable economic outcomes.
This paper is structured as follows. First, we present an exploratory model of knowledge management for organizations in the Romanian biotechnology sector. Then, a description of the regression model is discussed. After that, the research hypotheses are presented and tested. The econometric model is an improvement of the growth model developed by Aghion and Howitt [59] and is based on a Cobb–Douglas production function with a constant scale rate. The application results show the promising computational advantage of the regression model over the Aghion and Howitt model. Conclusions, limits, and possible future developments are summarized in the last part of the paper.
2. Materials and Methods
The present study aimed to understand the performances of biotechnology organizations filtered through the knowledge management strategies adopted, highlighting the sustainability of these business endeavors. The study aimed to understand better the processes associated to knowledge transfers toward third parties in the case of companies in the biotechnology industry, having in mind their sustainability and economic performances and setting. Only external processes were considered, bearing in mind access to information, which consists of financial and economic data, as well as the knowledge management practices mediated by the websites of the companies considered. The following aspects were considered: Mapping of the knowledge made available (open knowledge promoted), how strategic knowledge transfers are considered to be, and what are the relationships between knowledge transfer, intellectual capital, and the economic setting in the case of the investigated industry, as well as the impact of intellectual capital on performances.
The analysis consisted of two investigations: An exploratory evaluation of the knowledge management strategies mediated by the communication strategy of the organizations in the framework of the economic setting, and an estimation of a model for a performance evaluation of the organizations.
2.1. Designing an Exploratory Model of Knowledge Management for Organizations in the Biotechnology Sector
The first step of the study consisted of an exploratory evaluation of the two main components of the knowledge management strategy of an organization: Intellectual capital and knowledge transfers. This allowed us to better understand the economic performance of the observed organization in relation to their knowledge management practices, allowing the pinpointing of some insights into the way knowledge management strategies operate in this industry.
Considering the type of information and the sample considered, partial least squares (PLS) was recommended. This technique allowed us to identify relationships and their strengths between several variables based on a structural equation model [55,59] in the context of a small sample of organizations, considering that previous studies did not focus on identifying the specific links between the variables considered [60,61]. Nevertheless, the application of SmartPLS3 revealed no viable model, due to a lack of some inside information and a more extended set of variables that would have been associated with such data.
In this framework, the analysis was based on crosstab queries and radar charts in order to map the strategies disclosed. The contingency tables considered allowed to observe relationships that were not easy to notice otherwise and that also could not be identified through some statistical investigation, such as the one offered by EViews, due to the small sample available.
The database was generated by the observation of the website of the companies active in the biotechnology industry in Romania. Fourteen variables, grouped in 3 main areas, were considered. Each variable was evaluated on a scale from 1 to 5, where 1 generically indicated “nothing at all”, while 5 reflected “to a very large degree”. For each variable, a 5-level scale was designed to better measure the respective item.
The three main areas considered were knowledge transfers, intellectual capital, and economic setting.
2.1.1. Knowledge Transfers
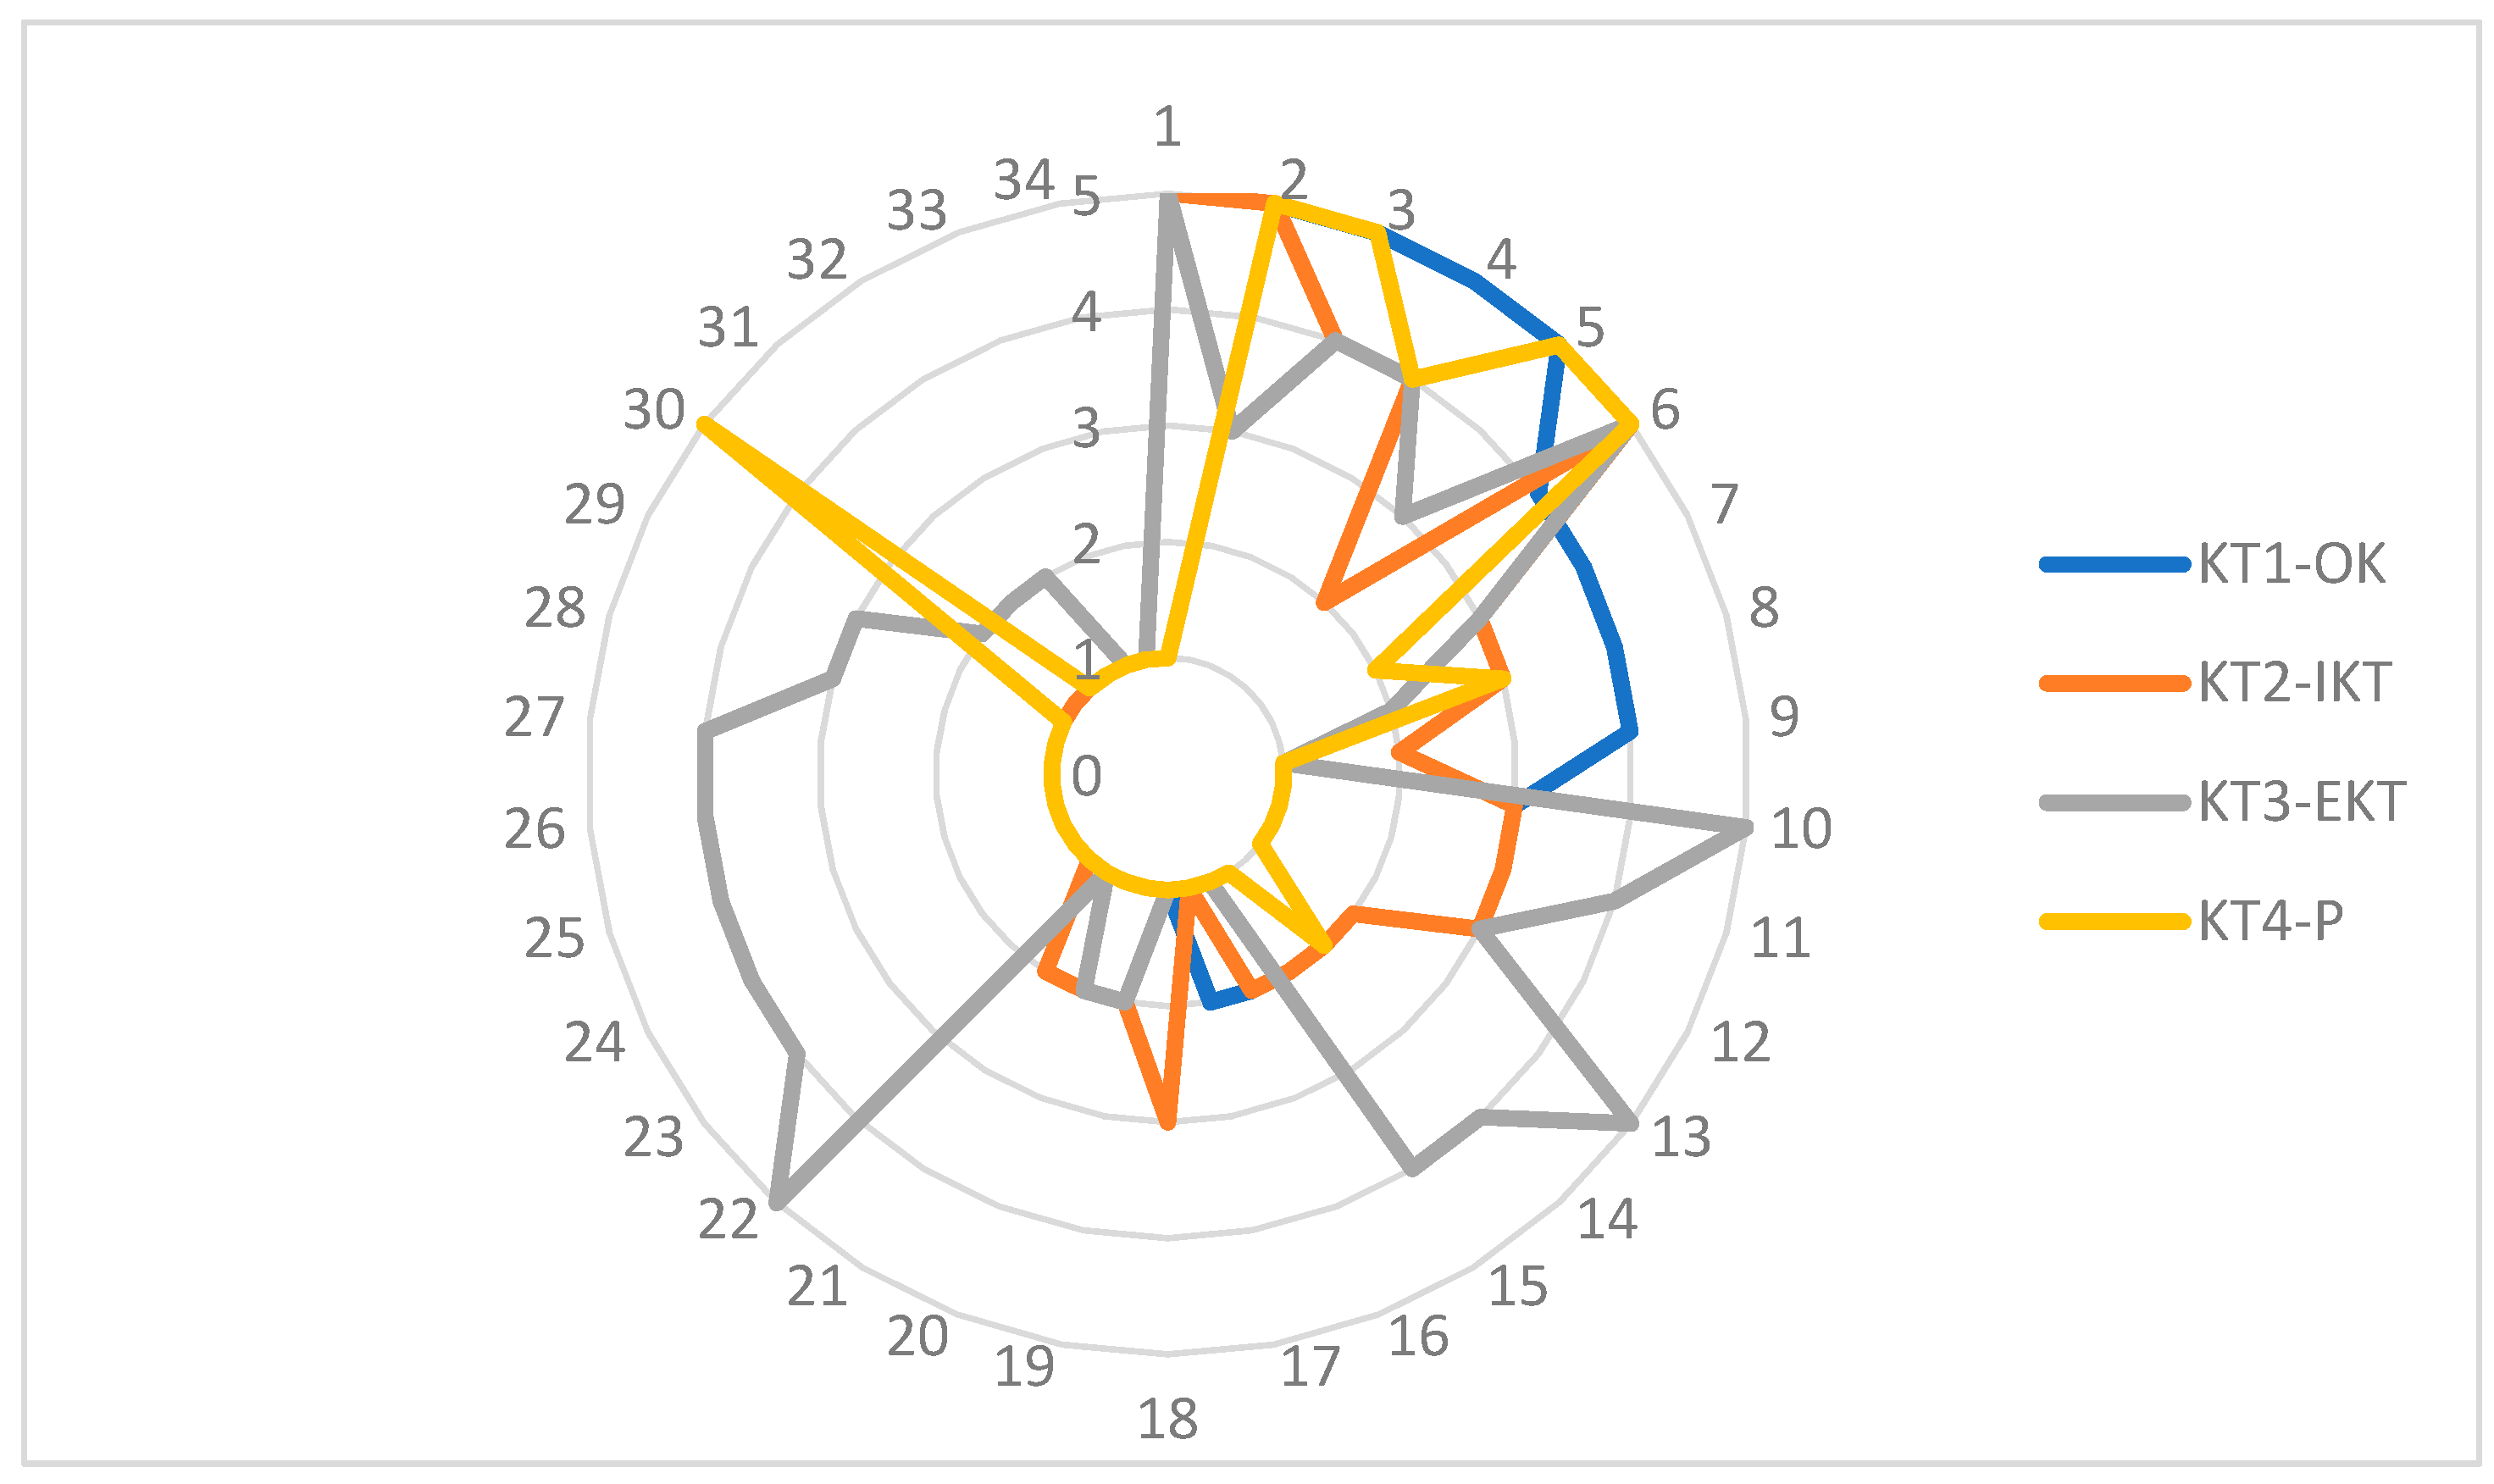
This construct contained a set of 4 variables associated with processes and factors influencing knowledge transfers outside the organization. Open knowledge (KT1-OK) referred to knowledge openly disclosed by organizations in the biotechnology industry, allowing free online access for use, modification, and sharing by third parties. Open knowledge is an indicator of how strategic and principial is the sharing of knowledge to the investigated industry [62,63,64]. It was measured on a scale registering from no open disclosure toward full disclosure of activities and partners, encouragement of further sharing, as well as the provision of guides and tools for knowledge use. The intensity of knowledge transfers (KT2–IKT) was a scale measuring both the frequency of knowledge transfers (from “not at all” and “accidental” to “very frequent updates”) and the scale connected to the variety of knowledge shared. Enablers of knowledge transfers (KT3–EKT) was a complex construct, which could have been observed from a wide variety of perspectives. For the purpose of this study, we considered only external factors, such as strategic alliances and networking and interdisciplinary perspectives on knowledge processes [54,58]. International organizations had a competitive advantage in this respect, since they were both older and more connected organizations, part of large business and research networks. Therefore, they would score much better than the local companies. Publications (KT4-P) was another relevant indicator of knowledge transfer toward third parties [65].
2.1.2. Intellectual Capital
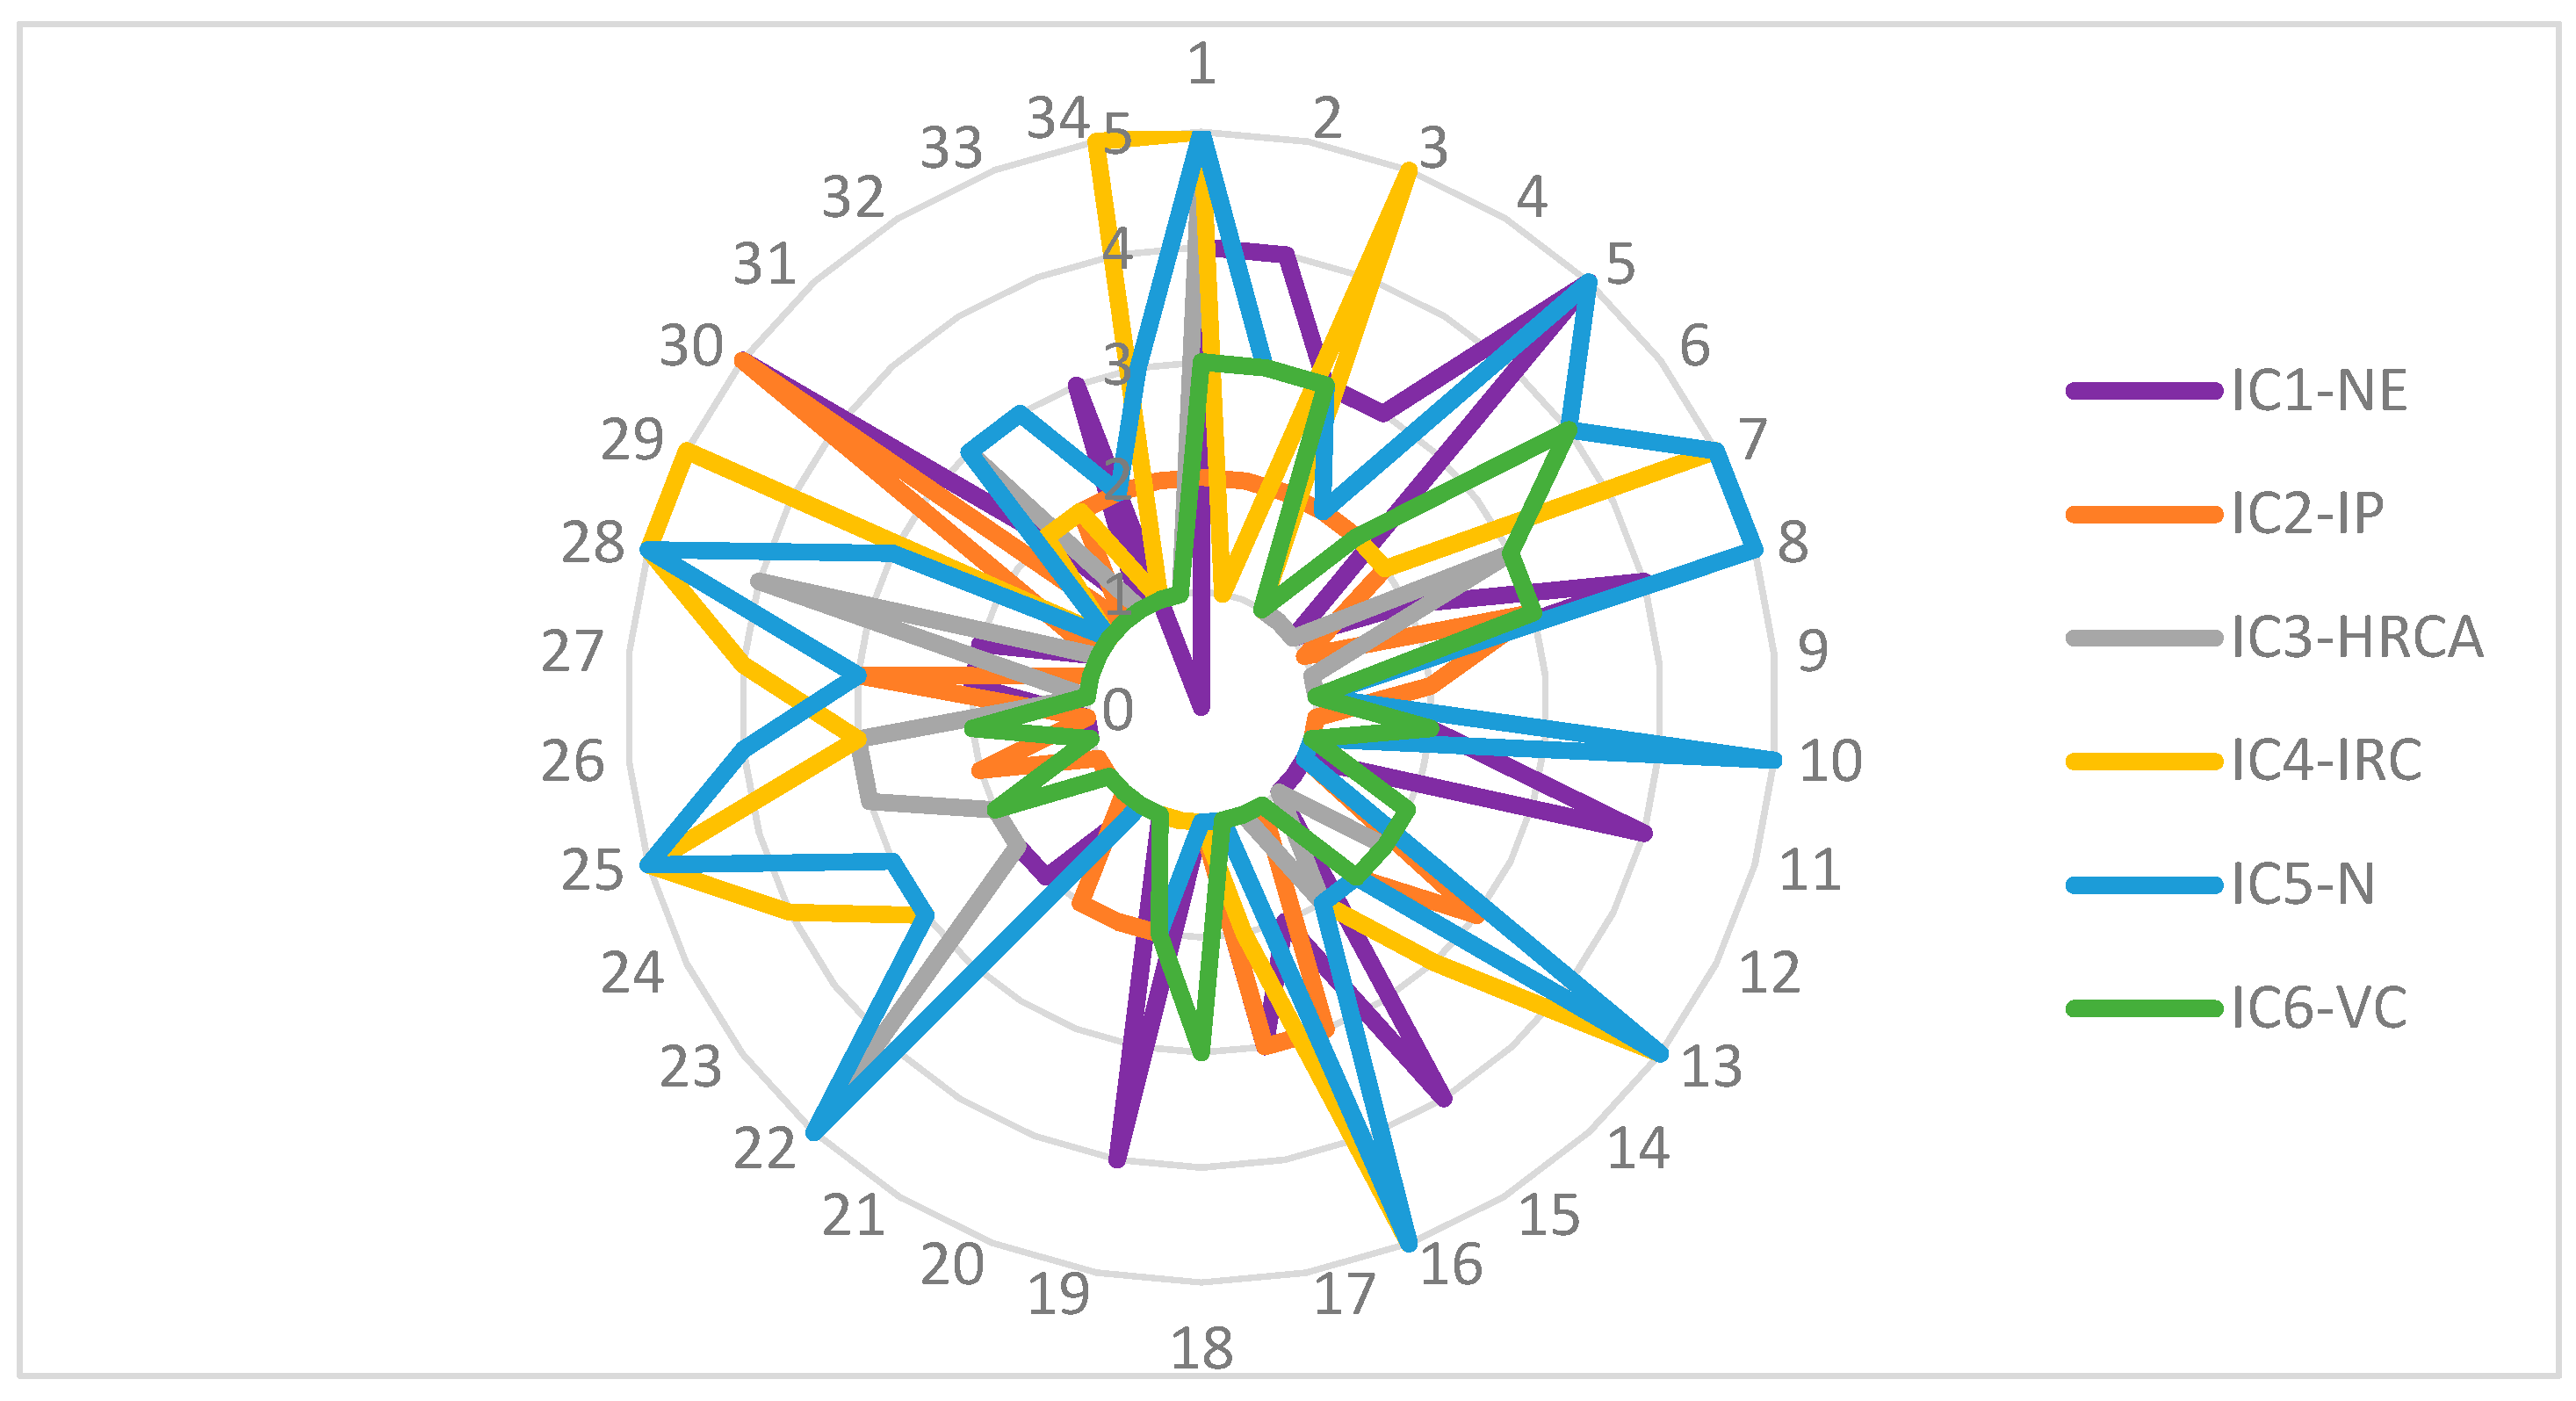
Considering the wide significance of intellectual capital within the framework and limits of the present study, we proposed six items. The number of employees (IC1–NE) was evaluated on a 5-level scale (1–3, 4–9, 10–19, 20–50, and more than 50 employees). The larger the number of employees, the stronger the intellectual capital was. Intellectual property (IC2–IP) considered the types of intellectual assets and their diversity. The items considered ranged from certificates and external recognition to patents. A large portfolio of intellectual property was a positive setting for more intense knowledge transfers. Human-related competitive advantage (IC3–HRCA) referred to a wide range of approaches related to the development of human resources, such as providing training opportunities and human and knowledge exchanges, awards, and recognition for employees. All these issues were considered only through their reflection on companies’ websites. Relational capital is a complex variable [66,67,68,69,70,71]. Considering the purposes and the limitations of the information available, the present study divided relational capital into two areas, internal and external. Internal relational capital (IC4–IRC) was associated with the network developed inside the organization, among its branches. It referred to the mechanism of enhancing intellectual capital inside the organization or group. External relational capital referred to the network (IC5–N) of partners with which the company cooperates. Value creation (IC6-VC) was a prerequisite for knowledge sharing, and it depended on intellectual capital. It was also embedded in the DNA of the organizations of the biotechnology industry, since R&D activities are at their core processes. Previous studies have indicated that knowledge management facilitates value creation and develops intangible assets of companies [72]. The present study aimed to see if value creation strategies lead to the development of intellectual capital, as well as to more intense knowledge transfers. Since we did not have inner data, this subconstruct was measured to track the enablement of value development in communities and third parties through knowledge dissemination. In this framework, the value created by the biotechnology companies would be shared and used by partners and communities to further value development. This construct was evaluated as a facilitator of further value creation. The scale went from no online value provision toward some support for value creation and disclosure, getting to the creation of frameworks for the social use of outcomes, including knowledge. The upper level referred to the enablement of value development in communities through extensive and complex knowledge dissemination. The value created could be therefore freely shared and used by partners and communities, including in frameworks facilitated by the organization investigated.
2.1.3. Economic Setting
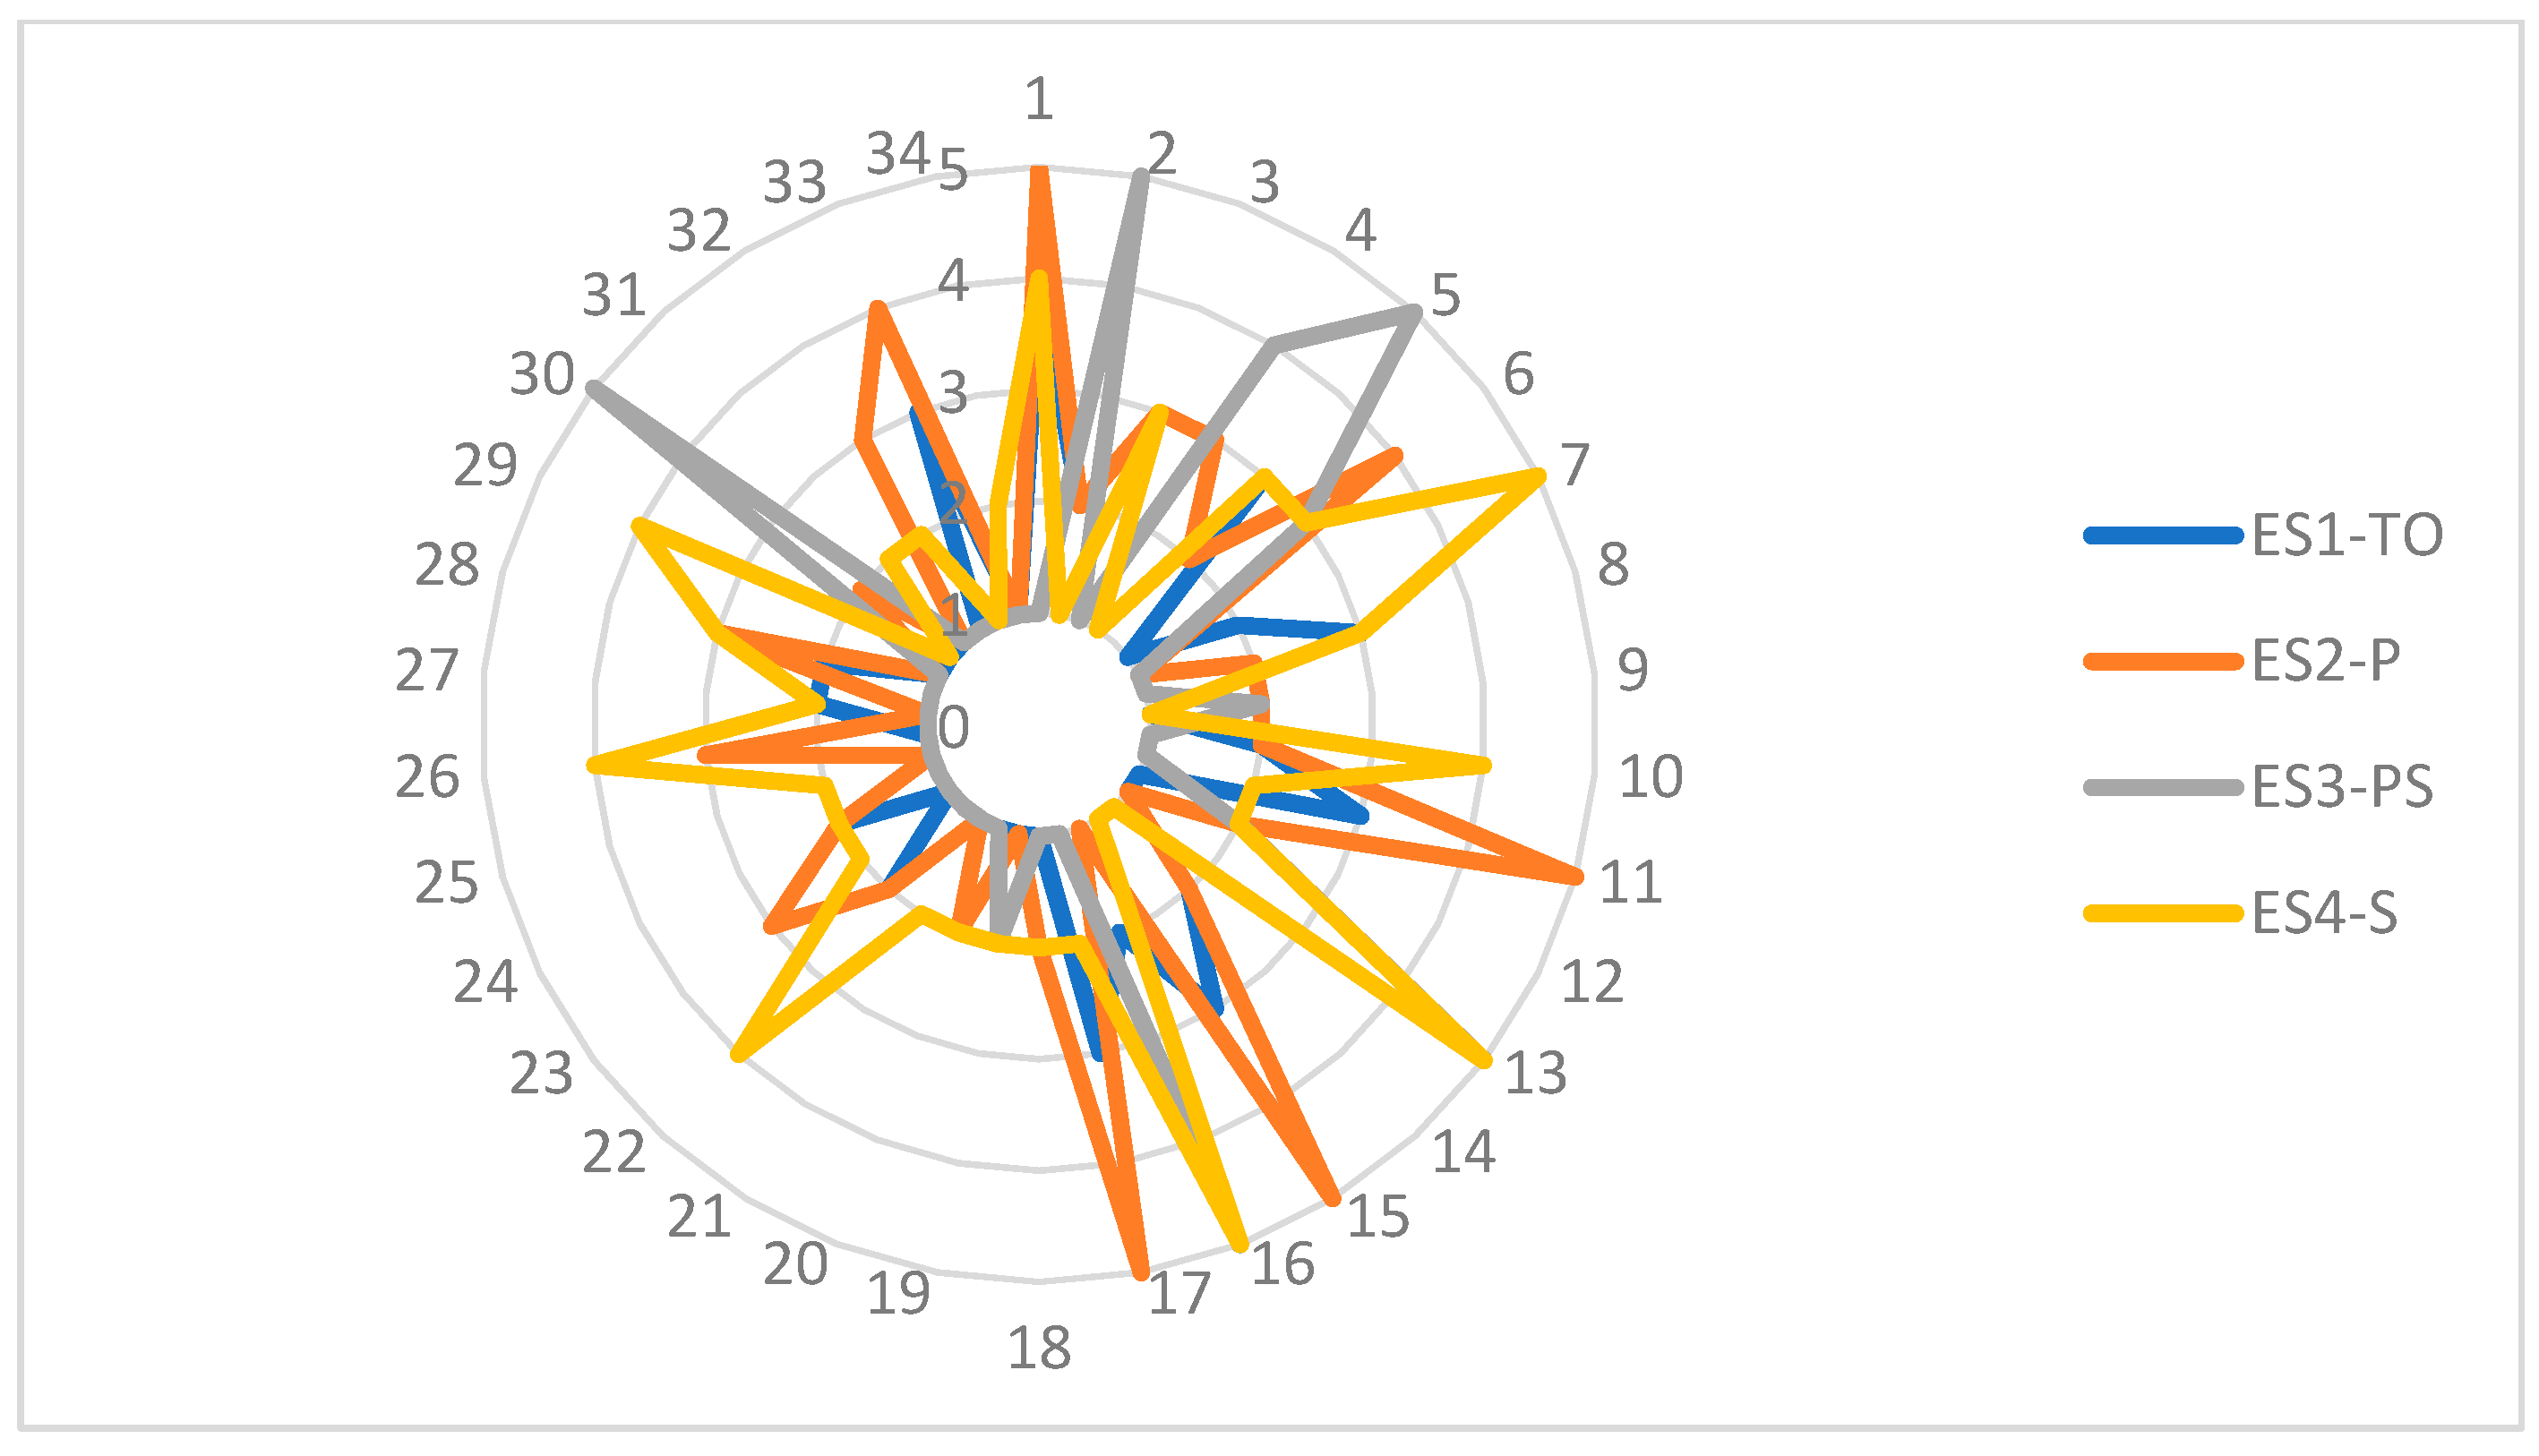
We mostly investigated companies set up in order to generate profit for their shareholders, where economic aspects influence the entire activity of these organizations, including knowledge management and transfer approaches. The extent of the knowledge transfer is influenced by economic perspectives. On the other hand, economic perspectives and business objectives influence the intensity and profile of knowledge transfers. The relationship between intellectual capital and economic setting seemed to be clear. The more extended the intellectual capital, the better the economic performances expected. On the other hand, better economic results would lead to increased resources for R&D, leading to more intellectual capital as well as making the company more attractive to valuable employees. The items considered under this construct were turnover (ES1-TO), profit (ES2-P), project scale (ES3-PS), and stakeholder acknowledged (ES4-S). The project scale variable measured the number of projects developed in the past five years by the companies evaluated (and presented online). Stakeholder acknowledged referred to the diversity of the stakeholders recognized as such on the website. This recognition was an indicator of some form of stakeholder management, which also had a component of knowledge transfers.
In Romania, there are 123 companies currently operating in the field of biotechnology with CAEN code 7211 (research and development in biotechnology). A large number, 51, do not have any employees, and therefore they hardly operate. Half of them, 25 companies, were established over the past 3 years. A similar number of organizations reported a zero-business figure. Organizations with no activity were excluded from our sample. Another precondition set was the existence of a functional website for the organization, to make data mining possible. In the end, the sample of our research included 34 companies. Twelve of them are part of international organizations. One is a Romanian company that opened a branch in Bulgaria. Most of them are active in the medical or pharmaceutical industries or in bio-agriculture.
3. Estimating a Model for Computing the Performance of Enterprises in the Biotechnology Sector
In this section of the study, we performed a quantitative analysis of all the enterprises active in the field of biotechnology since the year 2008, one year after Romania joined the European Union. This longitudinal evaluation gave us a dynamic perspective on evolution in the sector.
Improving the performance of businesses active in the field of research and biotechnology has been analyzed in a number of research articles. It has been shown that this performance indicator is closely linked to the flow of capital and productivity [73,74]. Other authors [75,76] have concluded that innovation and human capital have a positive impact on the economic performance of biotech companies.
Starting from these empirical studies mentioned above, we focused our research on the question: “What are the factors that increase the performance of research and biotechnology enterprises in Romania and what is the impact of these three factors in raising this indicator?” Starting from the literature, we tried to estimate which of the three independent factors of impact in biotechnology, namely productivity, capital flow, and intellectual capital, have the greatest impact in terms of increasing the economic performance of enterprises that do primarily research and development in biotechnology. The performance of an organization is, nevertheless, influenced by a larger number of factors [77].
In order to carry out this impact analysis, three research hypotheses (Table 1) were considered.
To test the three above-mentioned statistical hypotheses, we built an econometric model starting with the Aghion and Howitt production function [59], which will be described in the next chapter. To this function, we added a dummy control exogenous variable and used the return on assets (ROA) as a proxy variable for an economic performance endogenous variable. Hence, the so-created multilinear regression model has economic performance as the dependent variable, and the independent variables are productivity, capital flow, the number of enterprises with research and development activities in biotechnology, and stakeholder capital. The model has a multiple parametric structure, but can be used for a wide range of applications, for average estimate, covariance, and also for the parameters of the equation.
Given that the analysis was carried out for a period of nine years, the statistical study included a panel-type data analysis. Thus, the exogenous variables used in this model are variables of prediction (productivity) and control variables (capital flow and intellectual capital, for which the proxy variable is the number of employees used in the model), and for the endogenous variable a proxy variable is used for the calculation of economic performance, namely ROA.
Using ROA as a key performance metric, the attention of the management is drawn to the assets required to run the business. Some economists [78] consider ROA to be a better metric of analyzing financial performance than the income statement profitability measured by return on sales. ROA explicitly considers the assets used to support management activities. It determines whether an undertaking is able to generate a suitable return on these assets instead of showing a robust return on sales.
The regression analysis used panel data. The results obtained by panel analysis were consistent [79]. Thus, we can say that the database used in the regression analysis was large enough.
An econometric model that has economic performance as an endogenous variable should use both control variables and predictive variables as exogenous variables [80]. The model has a simple parametric structure, but can be used for a wide range of applications, for average estimation, covariance, and constraints on equation parameters. Thus, the exogenous variables used in this model were divided into control variables (foreign stakeholders and human capital in R&D businesses in biotechnology) and prediction variables (productivity and capital flow).
In conclusion, the regression model [81] is defined as follows:
where i = a cross-section dimension (transversal section), N = 34 is the number of companies in our model, t = time (time series dimension–longitudinal section), T = 9 is the number of years, = a dependent variable, = the it observation of the independent variables, = special effects (fixed or random), = the equation’s coefficients, and = a residual variable.
Using the exogenous and endogenous variables described above, our regression equation becomes
ROA = β0 + β1(Prod) + β2(Capital) + β3(Empl) + β(Dummy),
where:
- ROA = return on assets (the dependent variable), which is calculated as the ratio of net profit to fixed assets;
- Prod = productivity, defined as the ratio of turnover and number of employees to research and development activities in biotechnology. We expected this variable to have a positive coefficient in the regression model;
- Capital = capital flow, representing the amount of funds invested by enterprises for research and biotechnology. In this case, we also expected the value of the coefficient in the regression model to be positive;
- Empl = the number of employees, representing the total number of employees in R&D businesses in biotechnology, for each enterprise in the analyzed period;
- Dummy = it, which shows whether the company has a foreign or domestic stakeholder.
The data collected for these variables was based on National Institute of Statistics (NIS) reports.
Estimation of the Econometric Model
Our econometric model is based on AK theory, which explains productivity growth resulting from innovations. In AK models, the sustainability of production growth results from intertemporal externalities between firms that accumulate human or physical capital. When different types of capital are accumulated, then reduced returns would cut the marginal product of the firms to zero, since part of their accumulation is based on the technological progress needed to balance the reduced returns.
The economists Philippe Aghion and Peter Howitt [59] created an economic model for calculating long-term economic growth, ranging from economic variables such as capital and human capital accumulation, to productivity and capital inflows, to variance in strength as an expression of technological innovation and entrepreneurship. The model uses a Cobb–Douglas production function:
where t is the time frame to be analyzed; α is the coefficient of elasticity, 0 < α < 1; Y(t) is total production; X(t) is input (factors of production); and A(t) is labor force.
Y(t) = A(t)(X(t))α,
For the input function, we used the total capital of the bioeconomy enterprises (K(t)). Thus, Equation (1) can be rewritten as:
Y(t) = A(t) K(t)α.
To linearize this exponential equation, we logged both members of the equation above:
ln(Y(t)) = ln(A(t)) + α ln(K(t)).
To obtain the Y growth rate, we calculated the first-order differential of the previous equation, and we got:
∆ln(Y(t)) = ∆ln(A(t)) + α[∆ ln((K(t)].
In addition, we considered that total productivity (A(t)) is a linear function between productivity (Prod) and number of employees (Emp):
∆ln(A(t)) = B + β(Prod) + γ(Emp).
By substituting Equation (6) into Equation (5), we obtained
∆ln(Y(t)) = B + β1(Prod) + β2[∆ ln((K(t)] + β3(Emp).
In the regression model, analyzed using the statistical software EViews 9.0, Englewood Cliffs, Prentice Hal, NJ, US, we used:
- ∆ln (Y(t)), the percentage increase of ln (Y(t));
- ∆ln (K(t)), the percentage increase of ln (K(t)).
A description of the variables included in our regression model can be seen in Table 2. For the cases where the data had a standard normal distribution, the median and mean values approximated each other [82]. As we can see in the following table, the mean and median values of all variables were very close to each other. For this reason, it was assumed that all variables in the model were close to the standard normal distribution.
A correlation table was used to investigate the existence of multicollinearity among the exogenous variables used in the model. Since the correlation coefficients in Table 3 were smaller than ±0.70, it was assumed that there were multicollinearity problems among the variables [83].
An F-test and the Lagrange multiplier Breusch–Pagan test were performed to determine whether the method used in our analysis of the research model in Equation (1) was fixed effects, random effects, or pooled data, after reporting descriptive statistics for the variables used in the model.
The aim of using the F-test was to test the validity of the pooled model from the intended static panel data models against the fixed effect model [84]. Unrestricted and restricted models were required to perform this test:
If the null hypothesis H0 was not rejected, it would be βi = β. In such a case, a classical model would be accepted and a solution made by using the pooled data technique. Otherwise, the fixed effect model would be valid.
Table 4 shows the F-test statistical results. The null hypothesis H0 was rejected, since the probability value was lower than the error according to these results. It was determined that the pooled model was not suitable for our analysis.
The Lagrange multiplier Breusch–Pagan test was used to choose between the pooled method and the random effect models [85]. The null hypothesis that the variance of random effects was zero and the alternative hypothesis that it was not zero were as follows:
In a case where the variance of the unit effects was zero, this indicated that the model would be analyzed with a pooled model. The results of the Breusch–Pagan Test are shown in Table 5.
When we examined the test results in Table 5, the H0 hypothesis was rejected when the probability value was greater than 0.05. In this case, it was concluded that the pooled Ordinal Least Square (OLS) model was rejected. Now it was necessary to test which of the fixed and random effect models should be preferred. The choice between the fixed effects and random effects model would be given by the Hausman test.
The hypothesis as to the Hausman test was established as follows [86].
- H0: There is no correlation between explanatory variables and unit effects.
- H1: There is a correlation between explanatory variables and unit effects.
The Hausman test is a statistic which, under the null hypothesis (H0), has asymptotically the ℵ2 (chi-square) distribution. The Hausman test is shown in Table 6.
Since the probability value (0.897) in the above table was greater than 0.05, we conclude that H0 was accepted at a 95% level of confidence. According to this analysis, the fixed effects estimator was effective and consistent.
4. Communication Behavior of Romanian Biotechnology Organizations
Through their activity, organizations in the biotechnology sector are active researchers and generate new knowledge on a regular basis. Dissemination of the outcomes of this research could contribute to knowledge transfer and would accelerate its use in various contexts. Only nine of the organizations in our sample present the publications associated with their results on their website and assume the role of active agents of knowledge development across the industry. Most of these organizations are research institutes and/or are active in large-scale research projects.
Other forms of knowledge transfer that we observed were webinars (one company) and training offered to third bodies (five companies).
Summing up the above presented approaches, we conclude that the companies in biotechnology are not open to free knowledge transfer toward industry and society. This behavior seems to contradict the previously published literature relating knowledge transfer to innovation [8]. This framework is also a restraining factor to further knowledge sharing. As previously shown [9], it depends on human, organizational, and environmental factors. The last aspects do not provide a stimulating context in Romania, as we observed.
4.1. Mapping Knowledge Management Approaches and Their Economic Relevance
The variables monitored varied in all cases from 1 to 5, showing a wide range of approaches to knowledge management. The mean of these variables revealed the average in the sector, considering knowledge sharing practices, intellectual capital approaches, and the economic setting provided by organizations in the biotechnology sector.
The mean values of the variables associated with knowledge management practices can be observed in Table 7.
The above table reveals rather low values for all indicators evaluated, showing a low interest in knowledge management and/or a lack of transparency when communicating the knowledge and innovative dimension of the activity. The highest values were registered in the case of enablers of knowledge transfer (KT3-EKT) as the main facilitator of knowledge transfer, networking (IC5-N) as a key component of intellectual capital, and stakeholder recognition (ES4-S) as the core of the economic setting of the investigated organizations. One observes that all these factors were related to relational capital. Therefore, the data suggest that relational capital is at the core of the knowledge management strategies of these organizations.
The first set of comparative scrutiny addresses the strategies and capabilities disclosed inside each main variable: Knowledge transfer practices, intellectual capital disclosed, and economic setting.
Investigating knowledge transfer practices—facilitated by the websites of the organizations—one observes a small cluster of organizations that are open to such approaches and actively disseminate the results of their work, as well as recourses in the field. This cluster comprises 9 organizations out of 34.
The above radar chart (Figure 1) allowed us to identify a relatively widespread interest in presenting the enablers of knowledge transfer. Organizations tend to present their most important partners and the extension of their network online in order to stress their reputation. This gives us some insights into the dynamics of knowledge across these networks of enablers. In most cases, organizations choose to share knowledge via private channels, including with financial mediation, rather than to freely present the outcomes of their research activity, as reports, as condensed forms of presentation or as full publications.
The analysis of the disclosure of intellectual capital showed an opaquer approach (Figure 2). Biotechnology organizations rely on research, on high-quality intellectual capital, and on value creation. All these aspects contribute to their competitive advantage and success. The investigation we developed showed that Romanian biotechnology organizations do not explicitly relate their success to knowledge sharing. They prefer not to present these assets except for a few that are tightly related to reputation and trust, such as prestigious partners and certificates obtained.
These misty strategies were confirmed by the analysis of the economic setting (Figure 3). While competitive knowledge management strategies recommend personalized project approaches, stimulating human resources approaches, stakeholder cooperation, facilitation of tacit knowledge exchange, and value creation [87,88], all these aspects are not transparent from the way Romanian biotechnology organizations communicate and seem to operate. The sustainability of the knowledge advantage [6,89,90] seems not to be exploited by these companies, considering both the variations and inconsistencies between the sub-items considered as well as the deviations in time of economic turnout, number of employees, and such. We recommend more transparency in order to transform knowledge sharing into a competitive advantage for the investigated organizations. This approach would also facilitate their image development and would develop stakeholder relationships (meaning also relational capital) as well as perceived intellectual capital.
Benchmarking the above investigation to the study of Alegre, et al. [6] on biotechnology firms in France, one can observe a gap. While the mentioned study showed positive relationships between knowledge management and innovation performance, the data offered by the Romanian companies showed a loose relationship between knowledge management and knowledge capabilities and innovation, as well as performance. On the one hand, this is explained largely by the type of information available: Online, filtered by the communication strategies of the organizations. On the other hand, the relative lack of transparency of the biotechnology organizations in Romania cannot fully cover an insufficiency in the development of a knowledge management strategy of these organizations. They still have to find a strategic balance [9] between knowledge sharing, cooperation, and knowledge retention. The third aspect seems to be in the focus of the investigated organizations, while the first two are not.
4.2. The Pattern of Knowledge Transfers in Romanian Biotechnology Organizations
Starting from the observation that an interest in knowledge management and a more complex approach to knowledge management strategies lead to a more open presentation of knowledge capabilities, of knowledge dynamics, and to an openness to knowledge sharing within and outside organizations, the dataset on the organizations most open to knowledge transfers reveal the profile of the most proficient organizations in terms of knowledge management. As mentioned before, we isolated a cluster of nine organizations operating in Romania that are open to knowledge transfers outside their organizations (KT1-OK = 5, 4). A smaller cluster, of five organizations, was also isolated, considering its active approach to the human resources management connected to knowledge management, as well as to stimulation of knowledge development among employees (IC3-HRCA = 5, 4). Two of the organizations belonged to both clusters. A third cluster we isolated was associated with the best performances in value creation (knowledge-wise). This cluster included seven organizations. We mentioned that the item used for selection was IC6-VC, and the highest values considered were 4 and 3. This showed either a lack of transparency and/or a performance oriented toward financial outcomes rather than value creation. Six of the organizations in the third cluster were included in the first one, too.
The profiles of the organizations in the first cluster were diverse: Five are international companies, one is a local company, two are publicly funded research centers, and one is a private company encompassing a research institute and a factory. All of the organizations in the second cluster are international companies, and thus the practices related to human resources and integration of knowledge management into Human Resources strategies are transferred from the head organization. Five of the organizations in the third cluster are international companies, one is a Romanian one, and one is a public research institute.
The profile of the organizations with best practices can be seen in Table 8.
Therefore, the maturity of the knowledge management approaches, including knowledge sharing strategies, depends on the maturity of the organization. International companies bring know-how and effective practices, as well as a framework to stimulate value creation, transfers of knowledge, and presentation and transparency.
5. Results and Discussions
The exploratory investigation of the websites showed a relative lack of transparency in relation to knowledge management, intellectual capital, and performances of the biotechnology organizations operating in Romania. The best practices in the field are offered by international organizations, which also present better economic and sustainable performances. Although creating value and innovation are at the core of the investigated organizations, the strategies they adopt in the field of knowledge management and sharing, as well as in that of the intellectual capital, are very pragmatic in nature, very strictly subordinate to economic performance. Even more, knowledge is not considered an asset of primary value compared to the processes associated with service provision to customers. Adopting an appropriate knowledge management model might improve organizational performances and would enhance the knowledge capital as a competitive advantage [91]. In the same vein, more convenient human resources management strategies would lead to more effective knowledge sharing [92] and better performances.
The model of knowledge sharing revealed by our analysis has several points of reference. Mostly the large organizations, mainly international companies, openly provide the outcomes of their R&D activity. This might be connected to their reputation building strategy, as well as to a more elaborate knowledge management strategy. Networking and stakeholder acknowledgment are also points of reference for such organizations.
The dynamics of the activities of biotechnology organizations in the past years have shown a large fluctuation in terms of projects and financial outcomes. Therefore, we observed an immature market, determining oscillations in the business outcomes of most organizations. An explanation might be a lesser knowledge management dynamic capability. The study of Alegre et al. [6] showed that in mature markets, knowledge management dynamic capabilities help to improve knowledge management processes, and to cope with market variations being connected to innovation and financial performance. Therefore, a low level of knowledge management dynamic capability would make companies more vulnerable to external factors. Nevertheless, we draw attention to specific factors, such as stakeholders, business practices, and marketing strategies, maybe also impacting this process. In addition, this longitudinal perspective confirms the competitive advantage that international companies possess. This gap was nuanced in our study in the field of knowledge management and sharing practices.
The results also are connected to a study by Biber-Freudenberger et al. [93], which highlighted that sustainability is not improved by a simple shift to renewable resources or materials. Innovation and responsible transfers of knowledge are key to sustainable development (in the field of biotechnology, too). The investigation undergone suggests that the companies operating in Romania still have to design effective strategies in this vein. The situation could be further clarified by an investigation highlighting the specific relationships between environmental/external factors and internal ones (human and organizational). Social interactions are also relevant [58], and therefore understanding them would add to the puzzle’s solving.
The parameters of the simple linear regression model used in this study were estimated by a time series panel data regression, and the software used in this analysis was EViews 9.0 statistical software.
As can be observed in Table 9, all model parameters were statistically significant at a significance level of 95% for all three independent variables in the model.
Analyzing the evolution of economic growth at the level of all organizations in Romania during the period of 2008–2016 through independent variables (productivity, capital flow, and number of employees), the following results were obtained from the perspective of a multifactorial regression analysis: Y = −2.003 + 0.00027X1 + 0.00033X2 + 9.369X3 + 0.2843X4 with standard error coefficients (1.920), (1.430), (1.072), and (0.204).
In addition, the variation in the independent variables included in the multiple linear regression model explained 73.6% of the change in return on assets of the enterprises in the sector (R2 = 0.736), the 26.4% difference being explained by other factors. The results of our analysis were consistent with the work of Sofian et al. [94], which developed a regression model to increase the economic performance of businesses, partly explained by environmental factors and intellectual capital.
The accuracy of the multiple linear regression model was calculated using the Fisher test. From Table 6, we can see that the value of this test was (prob. = 0.0001) less than 0.05, which led us to the conclusion that the regression model was valid at a significance level of 95%. It is also noted that the independent variables included in the model had a significant impact on the variance of the dependent variable (contributing to the average annual economic growth of the enterprises in the sector). Thus, the main conclusion of the regression model was that the independent variables explained a significant share of 73.6% of the economic performance of the enterprises active in the field of research and biotechnology.
Hence, all three research hypotheses were validated.
6. Conclusions and Recommendations
In conclusion, following this analysis, we can state that the economic model on performance was valid and accurately specified, and that the factors of production, capital, and number of firms were significant in increasing the economic performance of the enterprises in the bioeconomy sector in Romania. This was due to the fact that they registered significant values for the estimated coefficients, which were significantly different from zero, and that the model explained most of the variation in the economic performance of bioeconomy enterprises in Romania. This paper adds to the recent studies of the performance analysis of biotechnology organizations in Romania [95,96].
Considering that the calculation of the macroeconomic indicators used in the regression analysis was covered for a period of nine years, the main limitation of this research is given by the narrow database used in the factorial analysis. Future research will be carried out over longer periods of time, which could provide a larger picture of the Aghion and Howitt model applied to the microeconomic indicators of the research and development enterprises in biotechnology in Romania.
The exploratory investigation was limited to the data offered by the organizations in the sample online. Therefore, the inputs were filtered by the communication strategy of these organizations. This information is relevant, because the need to increase the trust and reputation of the organization leads to a better disclosure of intellectual capital and the competencies of these organizations. Nevertheless, it also depends on the level of professionalism they have.
The investigation revealed that relational capital is viewed as a main resource, while open knowledge strategies are not common for biotechnology companies in Romania. Human resources knowledge development also is not at the core of the knowledge management strategies. Corroborating all the findings, one observes that the performances of the biotechnology organizations are not coherent with a formal sustainable development strategy: The knowledge management strategies are rather immature and self-centric. Their performances are economic in essence, with the organizations being oriented toward financial outcomes without a strong focus on value creation and sharing. This indicates a concentration on the economic aspects of sustainability and an immature market from this perspective. International companies operating in Romania have more consistent strategies of knowledge management.
Another aspect to be considered is that the exploratory investigation is relevant for the present moment in time, not having in mind the inner dynamics of the organizations, while the economic model has in mind a dynamic perspective over nine years. Nevertheless, the two perspectives complement each other, in the sense that they can provide a view on the industry that reflects both the evolution of the activity and the development stage at the present moment. Only by cumulating these perspectives can one observe the immaturity of the market considered.
As for the practical implications of the previous investigations, we recommend for these companies to have in mind all three aspects of sustainability. Communicating all of these could also be beneficial, not only to them, but also to the members of their networks. This transparency could also contribute more consistently to their reputation. Another aspect to be considered by the biotechnology organizations operating in Romania is a more consistent focus on interorganizational cooperation along the value chain. Adapting their business models to more sustainable approaches might increase their performances, both economic and social [97]. The human factors should also be enhanced in order to be part of an effective knowledge management and a sustainable development of these organizations.
Author Contributions
All authors had relevant contributions to the conception of the paper, according to their research interests and expertise. Conceptualization, A.Z., F.P., and S.-O.S.; data curation, A.Z., M.B., and S.-O.S.; formal analysis, A.Z., F.P., and M.B.; investigation, A.Z., F.P., and M.B.; methodology, A.Z. and M.B.; project administration, A.Z.; resources, S.-O.S. and A.B.; supervision, A.Z.; validation, M.B. and A.B.; visualization, A.Z. and M.B.; writing—original draft, A.Z.; writing—review and editing, A.Z., F.P., and M.B.
Funding
This research received no external funding.
Conflicts of Interest
The authors declare no conflicts of interest.
References
- Salvioni, D.M.; Gennari, F.; Bosetti, L. Sustainability and convergence: The future of corporate governance systems? Sustainability 2016, 8, 1203. [Google Scholar] [CrossRef]
- Śmigielska, G. A business case for sustainable development. Cent. Eur. Stud. (Ces) Work. Pap. 2018, 10, 49–66. [Google Scholar]
- Clayton, T.; Radcliffe, N. Sustainability: A Systems Approach; Routledge: New York, NY, USA, 2015. [Google Scholar]
- Drexhage, J.; Murphy, D. Sustainable development: From Brundtland to Rio 2012. Background paper prepared for consideration by the High-Level Panel on Global Sustainability at its first meeting 19 September 2010. Adv. Appl. Sociol. 2015, 5, 12. [Google Scholar]
- Zbuchea, A. Are customers rewarding responsible businesses? An overview of the theory and research in the field of CSR. Manag. Dyn. Knowl. Econ. 2014, 1, 367–386. [Google Scholar]
- Alegre, J.; Sengupta, K.; Lapiedra, R. Knowledge management and innovation performance in a high-tech SMEs industry. Int. Small Bus. J. 2013, 31, 454–470. [Google Scholar] [CrossRef] [Green Version]
- Chang, Y.C. Benefits of co-operation on innovative performance: Evidence from integrated circuits and biotechnology firms in the UK and Taiwan. Rd Manag. 2003, 33, 425–437. [Google Scholar] [CrossRef]
- Gittelman, M. National institutions, public-private knowledge flows, and innovation performance: A comparative study of the biotechnology industry in the US and France. Res. Policy 2006, 35, 1052–1062. [Google Scholar] [CrossRef]
- Kumar, A.A. Knowledge Retention: A Key attribute in Organizational growth. Adv. Appl. Sci. Res. 2017, 8, 1–9. [Google Scholar]
- Martín-de Castro, G. Knowledge management and innovation in knowledge-based and high-tech industrial markets: The role of openness and absorptive capacity. Ind. Mark. Manag. 2015, 47, 143–146. [Google Scholar] [CrossRef]
- Palacios, D.; Garrigos, F. A measurement scale for knowledge management in the biotechnology and telecommunications industries. Int. J. Technol. Manag. 2005, 31, 358–374. [Google Scholar]
- Palacios, D.; Gil, I.; Garrigos, F. The impact of knowledge management practices on innovation and entrepreneurship in the biotechnology and telecommunications industries. Small Bus. Econ. 2009, 32, 291–301. [Google Scholar] [CrossRef]
- Wiig, K.M. Knowledge management: An emerging discipline rooted in a long history. In Knowledge Horizons: The Present and the Promise of Knowledge Management; Elsevier: New York, NY, USA, 2000; pp. 3–26. [Google Scholar]
- Desouza, K.C.; Paquette, S. (Eds.) Knowledge Management: An Introduction; Neal-Schuman Publishers: New York, NY, USA, 2011. [Google Scholar]
- Hislop, D. Knowledge management as an ephemeral management fashion? J. Knowl. Manag. 2010, 14, 779–790. [Google Scholar] [CrossRef]
- Omotayo, F.O. Knowledge Management as an important tool in Organisational Management: A Review of Literature. Libr. Philos. Pr. 2015, 1, 1–23. [Google Scholar]
- Serban, A.M.; Luan, J. Overview of knowledge management. New Dir. Inst. Res. 2002, 113, 5–16. [Google Scholar] [CrossRef]
- Centobelli, P.; Cerchione, R.; Esposito, E. Knowledge management in startups: Systematic literature review and future research agenda. Sustainability 2017, 9, 361. [Google Scholar] [CrossRef]
- Cerchione, R.; Esposito, E.; Spadaro, M. A literature review on knowledge management in SMEs. Knowl. Manag. Res. Pr. 2016, 14, 169–177. [Google Scholar] [CrossRef]
- Durst, S.; Runar Edvardsson, I. Knowledge management in SMEs: A literature review. J. Knowl. Manag. 2012, 16, 879–903. [Google Scholar] [CrossRef]
- Gao, F.; Li, M.; Clarke, S. Knowledge, management, and knowledge management in business operations. J. Knowl. Manag. 2008, 12, 3–17. [Google Scholar] [CrossRef]
- De Vasconcelos, J.B.; Seixas, P.C.; Lemos, P.G.; Kimble, C. Knowledge management in non-governmental organisations. In Enterprise Information Systems VII; Springer: Dordrecht, Germany, 2007; pp. 121–130. [Google Scholar]
- Massaro, M.; Dumay, J.; Garlatti, A. Public sector knowledge management: A structured literature review. J. Knowl. Manag. 2015, 19, 530–558. [Google Scholar] [CrossRef]
- Kidwell, J.J.; Vander Linde, K.; Johnson, S.L. Applying corporate knowledge management practices in higher education. Educ. Q. 2000, 23, 28–33. [Google Scholar]
- Rowley, J. Is higher education ready for knowledge management? Int. J. Educ. Manag. 2000, 14, 325–333. [Google Scholar] [CrossRef]
- Sunalai, S.; Beyerlein, M. Exploring knowledge management in higher education institutions: Processes, influences, and outcomes. Acad. Educ. Leadersh. J. 2015, 19, 289–308. [Google Scholar]
- Corfield, A.; Paton, R.; Little, S. Does knowledge management work in NGOs? A longitudinal study. Int. J. Public Adm. 2013, 36, 179–188. [Google Scholar] [CrossRef]
- Guldberg, K.R.; Mackness, J.; Makriyannis, E.; Tait, C. Knowledge management and value creation in a third sector organisation: Knowledge management and value creation in an NGO. Knowl. Process Manag. 2013, 20, 113–122. [Google Scholar] [CrossRef]
- Hume, C.; Hume, M. The strategic role of knowledge management in nonprofit organisations. Int. J. Nonprofit Volunt. Sect. Mark. 2008, 13, 129–140. [Google Scholar] [CrossRef]
- Hurley, T.A.; Green, C.W. Knowledge management and the nonprofit industry: A within and between approach. J. Knowl. Manag. Pr. 2005, 6, 1–10. [Google Scholar]
- Zbuchea, A.; Petropoulos, S.; Partyka, B. Knowledge Management Practices in NGOs. In Strategica. Shift. Major Challenges of Today’s Economies; Pînzaru, F., Zbuchea, A., Brătianu, C., Vătămănescu, E.M., Mitan, A., Eds.; Tritonic: Bucharest, Romania, 2017; pp. 467–476. [Google Scholar]
- Bănacu, C.S.; Buşu, C.; Nedelcu, A.C. Tacit Knowledge Management–Strategic Role in Disclosing the Intellectual Capital. In Proceedings of the 7th International Management Conference “New Management for the New Economy”, Bucharest, Romania, 7–8 November 2013. [Google Scholar]
- Petty, R.; Guthrie, J. Intellectual capital literature review: Measurement, reporting and management. J. Intellect. Cap. 2000, 1, 155–176. [Google Scholar] [CrossRef]
- Zbuchea, A.; Romanelli, M. The Role of NGOs in Urban Development. In Societal Impact of Knowledge and Design, Proceedings of the IFKAD 2018, Delft, The Netherlands, 4–6 July 2018; van der Meer, H., Enthoven, G., Schiuma, G., Eds.; acpi: Sonning Common, UK, 2018; pp. 637–648. [Google Scholar]
- Palacios, M.D.; Garrigós, S.F.J. The effect of knowledge management practices on firm performance. J. Knowl. Manag. 2006, 10, 143–156. [Google Scholar] [CrossRef]
- Mohannak, K.; Matthews, J. Knowledge integration within innovation process: A technoparanoia perspective. Int. J. Techno Entrep. 2015, 3, 17–36. [Google Scholar] [CrossRef]
- Jeon, S.; Kim, Y.; Koh, J. An integrative model for knowledge sharing in communities-of-practice. J. Knowl. Manag. 2011, 15, 251–269. [Google Scholar] [CrossRef]
- Nooteboom, B.; Van Haverbeke, W.; Duysters, G.; Gilsing, V.; van den Oord, A. Optimal cognitive distance and absorptive capacity. Res. Policy 2007, 36, 1016–1034. [Google Scholar] [CrossRef] [Green Version]
- Chiu, C.M.; Hsu, M.H.; Wang, E.T.G. Understanding knowledge sharing in virtual communities: An integration of social capital and social cognitive theories. Decis. Support Syst. 2006, 42, 1872–1888. [Google Scholar] [CrossRef]
- Jo, S.J.; Joo, B.K. Knowledge Sharing: The Influences of Learning Organization Culture, Organizational Commitment, and Organizational Citizenship Behaviors. J. Leadersh. Organ. Stud. 2012, 18, 353–364. [Google Scholar]
- Teng, J.T.C.; Song, S. An exploratory examination of knowledge-sharing behaviors: Solicited and voluntary. J. Knowl. Manag. 2011, 15, 104–117. [Google Scholar] [CrossRef]
- Wang, S.; Noe, R.A. Knowledge sharing: A review and directions for future research. Hum. Resour. Manag. Rev. 2010, 20, 115–131. [Google Scholar] [CrossRef]
- Cabrera, E.; Cabrera, A. Fostering knowledge sharing through people management practices. Int. J. Hum. Resour. Manag. 2005, 16, 720–735. [Google Scholar] [CrossRef] [Green Version]
- Gururajan, V.; Fink, D. Attitudes towards knowledge transfer in an environment to perform. J. Knowl. Manag. 2010, 14, 828–840. [Google Scholar] [CrossRef]
- Ipe, M. Knowledge sharing in organizations: A conceptual framework. Hum. Resour. Dev. Rev. 2003, 2, 337–359. [Google Scholar] [CrossRef]
- Yusof, Z.M.; Ismail, M.B.; Ahmad, K.; Yusof, M.M. Knowledge sharing in the public sector in Malaysia: A proposed holistic model. Inf. Dev. 2012, 28, 43–54. [Google Scholar] [CrossRef]
- Inkpen, A.C.; Dinur, A. Knowledge management processes and international joint ventures. Organ. Sci. 1998, 9, 454–468. [Google Scholar] [CrossRef]
- Lee, C.K.; Al-Hawamdeh, S. Factors impacting knowledge sharing. J. Inf. Knowl. Manag. 2002, 1, 49–56. [Google Scholar] [CrossRef]
- Supar, N.; Ibrahim, A.A.; Mohamed, Z.A.; Yahya, M.; Abdul, M. Factors affecting knowledge sharing and its effects on performance: A study of three selected higher academic institutions. In Proceedings of the International Conference on Knowledge Management (ICKM), Kuala Lumpur, Malaysia, 7–9 July 2005. [Google Scholar]
- O’Dell, C.; Grayson, C. If only we knew what we know: Identification and transfer of internal best practice. Calif. Manag. Rev. 1998, 40, 154–174. [Google Scholar] [CrossRef]
- Hasnain, S.S.; Jasimuddin, S.M. Barriers to knowledge transfer: Empirical evidence from the NGO (non-governmental organizations)-sector in Bangladesh. World J. Soc. Sci. 2012, 2, 135–150. [Google Scholar]
- Zbuchea, A.; Leon, R. Knowledge sharing barriers in cultural organizations. In Proceedings of the IFKAD, Bari, Italy, 10–12 June 2015; pp. 1716–1727. [Google Scholar]
- Rathi, D.; Given, L.; Forcier, E. Interorganisational partnerships and knowledge sharing: The perspective of non-profit organisations (NPOs). J. Knowl. Manag. 2014, 18, 867–885. [Google Scholar] [CrossRef]
- Kamhawi, E.M. Knowledge management fishbone: A standard framework of organizational enablers. J. Knowl. Manag. 2012, 16, 808–828. [Google Scholar] [CrossRef]
- Sun, P.Y.-T.; Scott, J.L. An investigation of barriers to knowledge transfer. J. Knowl. Manag. 2005, 9, 75–90. [Google Scholar]
- Cacciatori, E.; Tamoschus, D.; Grabher, G. Knowledge transfer across projects: Codification in creative, high-tech and engineering industries. Manag. Learn. 2012, 43, 309–331. [Google Scholar] [CrossRef]
- Alvesson, M.; Kanneman, D. Odd couple: Making sense of the curious concept of knowledge management. J. Manag. Stud. 2001, 38, 995–1018. [Google Scholar] [CrossRef]
- Badaracco, J.L. The Knowledge Link: How Firms Compete through Strategic Alliances; Harvard Business Press: Boston, MA, USA, 1991. [Google Scholar]
- Aghion, P.; Howitt, P. A model of growth through creative destruction. Econometrica 1992, 60, 323–351. [Google Scholar] [CrossRef]
- Hair, J.F.; Ringle, C.M.; Sarstedt, M. PLS-SEM: Indeed, a silver bullet. J. Mark. Theory Pract. 2011, 19, 139–152. [Google Scholar] [CrossRef]
- Sarstedt, M.; Ringle, C.M.; Hair, J.F. Treating unobserved heterogeneity in PLS-SEM: A multi-method approach. In Partial Least Squares Path Modeling. Basic Concepts, Methodological Issues and Applications; Latan, H., Noonan, R., Eds.; Springer: Cham, Switzerland, 2017; pp. 197–217. [Google Scholar]
- Bogers, M. The open innovation paradox: Knowledge sharing and protection in R&D collaborations. Eur. J. Innov. Manag. 2011, 14, 93–117. [Google Scholar]
- García-Peñalvo, F.J.; García de Figuerola, C.; Merlo, J.A. Open knowledge: Challenges and facts. Online Inf. Rev. 2010, 34, 520–539. [Google Scholar] [CrossRef]
- Ramírez, M.S.; García-Peñalvo, F.J. Co-creation and open innovation: Systematic literature review. Comunicar 2018, 26, 9–18. [Google Scholar] [CrossRef] [Green Version]
- European Commission. Metrics for Knowledge Transfer from Public Research Organisations in Europe Report from the European Commission’s Expert Group on Knowledge Transfer Metrics Expert Group Report. European Commission, Bruxelles, 2009. Available online: http://ec.europa.eu/invest-in-research/pdf/download_en/knowledge_transfer_web.pdf (accessed on 14 May 2018).
- Lennox, H. Intellectual capital in a recession: Evidence from UK SMEs. J. Intellect. Cap. 2013, 14, 84–101. [Google Scholar]
- Leon, R.; Pînzaru, F.; Zbuchea, A. Corporate Reputation—An input or an output of Intellectual Capital? In Proceedings of the 7th European Conference on Intellectual Capital Hosted by Technical University of Cartagena, Cartegena, Spain, 9–10 April 2015; Cegarra Navarro, J.G., Ed.; Academic Conferences & Publishing International (ACPI): Reading, UK, 2015; pp. 227–236. [Google Scholar]
- Nahapiet, J.; Ghoshal, S. Social capital, intellectual capital, and the organizational advantage. Acad. Manag. Rev. 1998, 23, 242–266. [Google Scholar] [CrossRef]
- Ortiz, B.; Donate, M.J.; Guadamillas, F. Relational and Cognitive Social Capital: Their Influence on Strategies of External Knowledge Acquisition. Procedia Comput. Sci. 2016, 99, 91–100. [Google Scholar] [CrossRef] [Green Version]
- Vătămănescu, M.; Zbuchea, A.; Pinzaru, F.; Andrei, A.G. The impact of relational capital on SMEs Internationalization. Leveraging online versus offline business networking. In Proceedings of the 17th European Conference on Knowledge Management; Moffett, S., Galbraith, B., Eds.; Academic Conferences & Publishing International (ACPI): Reading, UK, 2016; pp. 926–935. [Google Scholar]
- Zbuchea, A.; Pînzaru, F.; Antonoici, C. Networked social enterprises. In Responsible Entrepreneurship; Zbuchea, A., Nikolaidis, D., Eds.; Comunicare.ro: Bucharest, Romania, 2016; pp. 210–217. [Google Scholar]
- Edvardsson, I.R.; Kristjan Oskarsson, G. Knowledge management and value creation in service firms. Meas. Bus. Excell. 2011, 15, 7–15. [Google Scholar] [CrossRef]
- Birch, K.; Levidow, L.; Papaioannou, T. Sustainable capital? The neoliberalization of nature and knowledge in the European “knowledge-based bio-economy”. Sustainability 2010, 2, 2898–2918. [Google Scholar] [CrossRef]
- Gonzalez, C.A.Z. Total Factor Productivity and the Bio Economy Effects. J. Agric. Stud. 2012, 1, 1–29. [Google Scholar] [CrossRef]
- Kircher, M. The transition to a bio-economy: National perspectives. Biofuels Bioprod. Biorefining 2012, 6, 240–245. [Google Scholar] [CrossRef]
- Pyka, A.; Prettner, K. Economic Growth, Development, and Innovation: The Transformation towards a Knowledge-Based Bioeconomy. In Bioeconomy; Springer: Cham, Switzerland, 2018; pp. 329–340. [Google Scholar]
- Busu, C.; Busu, M. The Impact of Applying the Total Quality Management Model on the Performance of the Telecom Organizations in Romania. Amfiteatru Econ. 2017, 19, 1035–1049. [Google Scholar]
- Bohl, M.T.; Kaufmann, P.; Stephan, P.M. From hero to zero: Evidence of performance reversal and speculative bubbles in German renewable energy stocks. Energy Econ. 2013, 37, 40–51. [Google Scholar] [CrossRef]
- Cappa, F.; Laut, J.; Nov, O.; Giustiniano, L.; Porfiri, M. Activating social strategies: Face-to-face interaction in technology-mediated citizen science. J. Environ. Manag. 2016, 182, 374–384. [Google Scholar] [CrossRef] [PubMed]
- Mankiw, N.G.; Romer, D.; Weil, D.N. A contribution to the empirics of economic growth. Q. J. Econ. 1992, 107, 407–437. [Google Scholar] [CrossRef]
- Schmidheiny, K. Panel data: Fixed and Random Effects. Basel Universität, 2016. Available online: http://www.schmidheiny.name/teaching/panel2up.pdf (accessed on 18 December 2017).
- Pett, A.M. Nonparametric Statistics in Health Care Research: Statistics for Small Samples and Unusual Distributions; SAGE Publications: London, UK, 1997. [Google Scholar]
- Weinberg, D.; Carmeli, A. Exploring the antecedents of relationship commitment in an import–export dyad. In New Perspectives in International Business Research; Feldman, M.P., Santangelo, G.D., Eds.; Emerald: London, UK, 2008; pp. 113–136. [Google Scholar]
- Urban, M. The Influence of Blockholders on Agency Costs and Firm Value an Empirical Examination of Blockholder Characteristics and Interrelationships for German Listed Firms; Springer: Berlin/Heidelberg, Germany, 2015. [Google Scholar]
- Block, J. Long-term Orientation of Family Firms: An Investigation of R&D; Springer: Berlin/Heidelberg, Germany, 2009. [Google Scholar]
- Wang, W.; Cao, W.J.; Chen, J.M. Dynamic Relation Analysis on Employment, Wages and Income Gap of Urban Residents in China for Panel Data Model as The Tool. In Sustainable Development, Proceedings of the 2015 International Conference, Belgrade, Serbia, 12–15 November 2015; Zhu, L., Ouadha, A., Eds.; World Scientific Publications: Singapore, 2015; pp. 435–443. [Google Scholar]
- Alavi, M.; Leidner, D.E. Knowledge management and knowledge management systems: Conceptual foundations and research issues. Mis Q. 2001, 25, 107–133. [Google Scholar] [CrossRef]
- Hansen, M.T.; Nohria, N.; Tierney, T. What’s Your Strategy for Managing Knowledge. The Harvard Business Review, March–April 1999. Available online: https://hbr.org/1999/03/whats-your-strategy-for-managing-knowledge (accessed on 17 May 2018).
- DeNisi, A.; Hitt, M.A.; Jackson, S.E. The knowledge-based approach to sustainable competitive advantage. In Managing Knowledge for Sustained Competitive Advantage: Designing Strategies for Effective Human Resource Management; Jackson, S.E., DeNisi, A., Hitt, M.A., Eds.; Wiley: New York, NY, USA, 2003; pp. 3–33. [Google Scholar]
- Zack, M.H. Developing a knowledge strategy. Calif. Manag. Rev. 1999, 41, 125–145. [Google Scholar] [CrossRef]
- Elezi, E.; Bamber, C. A Guiding Conceptual Framework for Individualized Knowledge Management Model Building. Manag. Dyn. Knowl. Econ. 2018, 6, 343–369. [Google Scholar] [CrossRef]
- Matošková, J.; Směšná, P. Human resource management practices stimulating knowledge sharing. Manag. Mark. 2017, 12, 614–632. [Google Scholar] [Green Version]
- Biber-Freudenberger, L.; Basukala, A.; Bruckner, M.; Börner, J. Sustainability Performance of National Bio-Economies. Sustainability 2018, 10, 2705. [Google Scholar] [CrossRef]
- Sofian, S.; Tayles, M.; Pike, R. The implications of intellectual capital on performance measurement and corporate performance. J. Kemanus. 2017, 4, 13–24. [Google Scholar]
- Negoi, R.M.; Ragazzi, M.; Apostol, T.; Rada, E.C.; Marculescu, C. Bio-drying of Romanian Municipal Solid Waste: An analysis of its viability. UPB Sci. Bull. Ser. C 2009, 71, 193–204. [Google Scholar]
- Bogdan, A.; Istudor, N.; Gruia, R.; Tobă, G.F.; Bulz, N.; Gâf-Deac, I.; Paşalău, C. New holistic approach of bioeconomics and ecoeconomics theories, practical bridging from the green economy to blue economy, trough new integrated and innovative paradigm about “bio-eco-geo-economy”. Procedia Econ. Financ. 2014, 8, 83–90. [Google Scholar] [CrossRef]
- Maassen, M.A. Sustainable Business Models: An Imperative in the Strategic Management of Companies and Organizations. Manag. Dynam. Knowl. Econ. 2018, 6, 323–335. [Google Scholar] [CrossRef]
Figure 1.
Knowledge transfer practices of biotechnology organizations. Source: Based on processed data by the authors.
Figure 1.
Knowledge transfer practices of biotechnology organizations. Source: Based on processed data by the authors.

Figure 2.
Intellectual capital disclosure in biotechnology organizations. Source: Based on processed data by the authors.
Figure 2.
Intellectual capital disclosure in biotechnology organizations. Source: Based on processed data by the authors.

Figure 3.
The economic setting of biotechnology organizations. Source: Based on processed data by the authors.
Figure 3.
The economic setting of biotechnology organizations. Source: Based on processed data by the authors.


Table 1.
Formulation of statistical hypotheses.
| Hypothesis 1 | Hypothesis 2 | Hypothesis 3 |
|---|---|---|
| Productivity is a significant factor with direct impact factor for increasing the economic performance of enterprises that have primary activity research and development in biotechnology. | The flow of capital has a significant and positive impact on the economic performance of biotechnology enterprises. | The intellectual capital of enterprises whose primary activity is research and development in biotechnology is a significant factor in the economic performances of the enterprises in the model. |
Table 2.
Statistical description of the variables in the model.
| Variable | Mean | Median | Standard Deviation | N |
|---|---|---|---|---|
| Y | 67.19 | 68 | 119.29 | 34 |
| X1 | 249,965.05 | 249,966 | 403,359.66 | 34 |
| X2 | 788,093.30 | 788,095 | 4,089,737.30 | 34 |
| X3 | 5.31 | 5 | 14.2534 | 34 |
| X4 | 0.35 | 0 | 0.59 | 34 |
Source: Data analysis was conducted by the authors using EViews 9.0 software.
Table 3.
Correlation matrix of the variables used in the model.
| Variable | Y | X1 | X2 | X3 | X4 |
|---|---|---|---|---|---|
| Y | 1 | 0.69 | 0.58 | 066 | 0.45 |
| X1 | 0.69 | 1 | 0.18 | 0.14 | 0.21 |
| X2 | 0.58 | 0.18 | 1 | 0.09 | 0.28 |
| X3 | 0.66 | 0.14 | 0.09 | 1 | 0.07 |
| X4 | 0.45 | 0.21 | 0.28 | 0.07 | 1 |
Source: Data analysis was conducted by the authors using EViews 9.0 software.
Table 4.
Fixed effect test.
| F-Statistics | F-Stat. Prob. |
|---|---|
| 10.516 | 0.0007 |
Table 5.
Random effects test.
| Cross-Section | Time | Both | |
|---|---|---|---|
| Coefficient | 324.23 | 74.324 | 402.76 |
| Probability | 0.00001 | 0.00001 | 0.00001 |
Table 6.
Hausman test.
| Chi-Square Statistic | Chi-Square Statistic Prob. |
|---|---|
| 11506 | 0.897 |
Table 7.
The mean values of the variables associated with knowledge management practices.
| KT1-OK | KT2-IKT | KT3-EKT | KT4-P | IC1-NE |
| 2.26 | 2.15 | 3.00 | 1.79 | 2.24 |
| IC2-IP | IC3-HRCA | IC4-IRC | IC5-N | IC6-VC |
| 1.85 | 1.94 | 2.94 | 3.03 | 1.68 |
| ES1-TO | ES2-P | ES3-PS | ES4-S | |
| 1.76 | 2.35 | 1.82 | 2.50 |
Shading refers to the highest values.
Table 8.
Profile of the organizations with best practices.
| Area | International Company | Romanian Company | Research Institute |
|---|---|---|---|
| Open knowledge sharing | 5 | 2 | 2 |
| Human resources knowledge development | 5 | 0 | 0 |
| Value creation | 5 | 1 | 1 |
Table 9.
Analysis of the results a.
| Variables | Coefficient | Std. Error | Prob. |
|---|---|---|---|
| C | −2.0023 | 1.920 | 0.0001 * |
| PROD | 0.00027 | 1.430 | 0.023 ** |
| CAPITAL | 0.00033 | 1.320 | 0.038 ** |
| EMPL | 9.36923 | 1.072 | 0.045 ** |
| DUMMY | 0.28430 | 0.204 | 0.038 ** |
| R2 = 0.736 | Adj. R2 = 0.718 | ||
| F-Statistic | Prob. = 0.0001 |
a Dependent variable: Return on assets (ROA); * significant at 1%; ** significant at 5%.
© 2019 by the authors. Licensee MDPI, Basel, Switzerland. This article is an open access article distributed under the terms and conditions of the Creative Commons Attribution (CC BY) license (http://creativecommons.org/licenses/by/4.0/).
Share and Cite
MDPI and ACS Style
Zbuchea, A.; Pînzaru, F.; Busu, M.; Stan, S.-O.; Bârgăoanu, A. Sustainable Knowledge Management and Its Impact on the Performances of Biotechnology Organizations. Sustainability 2019, 11, 359. https://doi.org/10.3390/su11020359
AMA Style
Zbuchea A, Pînzaru F, Busu M, Stan S-O, Bârgăoanu A. Sustainable Knowledge Management and Its Impact on the Performances of Biotechnology Organizations. Sustainability. 2019; 11(2):359. https://doi.org/10.3390/su11020359
Chicago/Turabian StyleZbuchea, Alexandra, Florina Pînzaru, Mihail Busu, Sergiu-Octavian Stan, and Alina Bârgăoanu. 2019. "Sustainable Knowledge Management and Its Impact on the Performances of Biotechnology Organizations" Sustainability 11, no. 2: 359. https://doi.org/10.3390/su11020359
Note that from the first issue of 2016, this journal uses article numbers instead of page numbers. See further details here.