Carbon Footprint of Academic Air Travel: A Case Study in Switzerland


1
School of Basic Sciences, École Polytechnique Fédérale de Lausanne (EPFL), 1015 Lausanne, Switzerland
2
School of Life Sciences, École Polytechnique Fédérale de Lausanne (EPFL), 1015 Lausanne, Switzerland
3
School of Computer and Communication Sciences, École Polytechnique Fédérale de Lausanne (EPFL), 1015 Lausanne, Switzerland
*
Authors to whom correspondence should be addressed.
†
These authors contributed equally to this work.
Sustainability 2019, 11(1), 80; https://doi.org/10.3390/su11010080
Submission received: 31 October 2018
/
Revised: 2 December 2018
/
Accepted: 15 December 2018
/
Published: 24 December 2018
(This article belongs to the Special Issue Sustainable Development and Higher Education Institutions: Acting with a purpose)
Abstract
:Relatively low travel costs and abundant opportunities for research funding in Switzerland and other developed countries allow researchers large amounts of international travel and collaborations, leading to a substantial carbon footprint. Increasing willingness to tackle this issue, in combination with the desire of many academic institutions to become carbon-neutral, calls for an in-depth understanding of academic air travel. In this study, we quantified and analyzed the carbon footprint of air travel by researchers from the École Polytechnique Fédérale de Lausanne (EPFL) from 2014 to 2016, which is responsible for about one third of EPFL’s total CO2 emissions. We find that the air travel impact of individual researchers is highly unequally distributed, with 10% of the EPFL researchers causing almost 60% of the total emissions from EPFL air travel. The travel footprint increases drastically with researcher seniority, increasing 10-fold from PhD students to professors. We found that simple measures such as restricting to economy class, replacing short trips by train and avoiding layovers already have the potential to reduce emissions by 36%. These findings can help academic institutions to implement travel policies which can mitigate the climate impact of their air travel.
1. Introduction
Aviation is one of the fastest growing sources of greenhouse gas (GHG) emissions. Over the last four decades, the number of passenger-kilometers in worldwide civil aviation increased at an average rate of 5% per year, while the corresponding carbon dioxide (CO2) emissions have increased by 2% per year on average [1]. The emissions are increasing at a slower rate than the number of passenger-kilometers due to improvements in fuel efficiency. This continuous increase has brought global annual civil aviation CO2 emissions up to 900 Mt in 2016, which is 2.8% of the world’s total CO2 emissions [2]. Besides the global warming effect through the emission of greenhouse gasses such as CO2 and NOx, airplanes cause additional radiative forcing (RF) through the generation of condensation trails (contrails), which eventually form cirrus or altocumulus clouds, and the formation of tropospheric ozone by NOx. At the same time, NOx facilitates the destruction of methane, lowering the RF. The total RF from aviation is therefore estimated to be two to four times higher than that induced by GHG emission alone [3]. In 2005, aviation was responsible for 4.9% of anthropogenic global warming [4]. A three- to four-fold increase in aviation RF is expected by 2050, compared to the year 2000 [4]. Despite the ever-increasing environmental impact of air travel, these emissions, together with international shipping, are not regulated under the 2015 Paris climate agreement.
Globally, only a small fraction of people participate in air travel. It was estimated that only about 2% to 3% of the world population take an international flight over the course of a year [5]. This illustrates that air travel is very unequally distributed with a small number of high-footprint hypermobile travelers. One group of people with a particularly high air travel footprint are academics. Indeed, many researchers are frequent travelers due to the importance of conferences, workshops, international collaborations, visiting positions, etc., for their career advancement. At the École Polytechnique Fédérale de Lausanne (EPFL) in Switzerland, air travel accounts for one third of the institute’s total CO2 emissions (corresponding to at least half of the total RF), similar to the CO2 emissions of electricity and heating, and daily commuting.
In many academic institutions worldwide, awareness of these issues has increased, but a detailed quantitative analysis of academic air travel behavior is challenging due to the lack of comprehensive datasets. Therefore, in this study we retrospectively quantify the air travel habits of EPFL researchers and we identify carbon footprint reduction opportunities. This work is limited to air travel performed by EPFL academic staff in the period of 2014 to 2016.
2. Materials and Methods
In order to describe the professional travel habits of EPFL’s academic staff, flight data from 2014 to 2016 was retrospectively collected from Carlson Wagonlit Travel (CWT), the official EPFL travel agency [6]. This dataset comprises approximately 80% of all travel made by EPFL researchers during the specified time period. The remaining 20% of air travel was booked directly by the researchers. For the latter category, only ticket price and airline company are known, and these air travels are therefore excluded from the present analysis. A coverage of 80% is sufficiently large to draw representative quantitative conclusions from this data. The dataset was anonymized and includes GHG emissions, distance, price, exact flight route, and service class for every trip. GHG emissions were calculated using the yearly DEFRA metrics [7] and include CO2 and NOx. These annual metrics provide average emissions of the aviation industry. This allows us to make a good estimate of a flight’s GHG emissions, without knowing the technical details of the airplane, which are not provided upon booking. Here, we only consider the direct GHG emissions from the airplane, which are well-known. The additional RF related to the formation of contrails, which eventually form cirrus or altocumulus clouds, the generation of ozone by NOx, and the negative RF from the destruction of methane by NOx are not included since the exact magnitudes of these impacts are still under debate. The overall RF generated by the air travel discussed here will therefore be two to four times larger than the GHG emissions quoted in this work [3]. The GHG emissions are expressed in kg of CO2 with an equivalent global warming power, which is noted CO2e. The CO2e emission of a flight is calculated as
where the distance is determined as the great circle distance between the airport locations, i.e., the shortest path between two points on the surface of a sphere. The distance flown is multiplied with the uplift parameter, to account for takeoff, circling and non-direct routes and it represents 1.09. The year and service class of the flight determines the CO2e intensity. Note that business and first class flights cause two to four times more emissions per person, compared to economy class due to the increased floorspace requirements, as can be seen in Supplementary Table S1. Note also that the CO2e intensity of a flight in a given year is determined by flights from the previous year. The quantitative analysis was performed using the Python language and the NumPy package. The data was loaded from a .csv file.
3. Results
3.1. General Aspects of the Data
During the examined time period, 3334 members of academic staff (of which 46% PhD students, 29% postdocs, 1.7% senior scientists and 8.3% professors) took 14,949 flights over a total of 100 million km. This led to 14.6 kt CO2e emitted, which represents 27% of EPFL’s total GHG emissions. More detailed statistics can be found in Table 1. Supplementary Figure S1 shows the distribution of trips as a function of distance. We see that most trips are continental, with a second intercontinental peak. Continental travel is mostly direct, whereas intercontinental travel is mostly indirect.
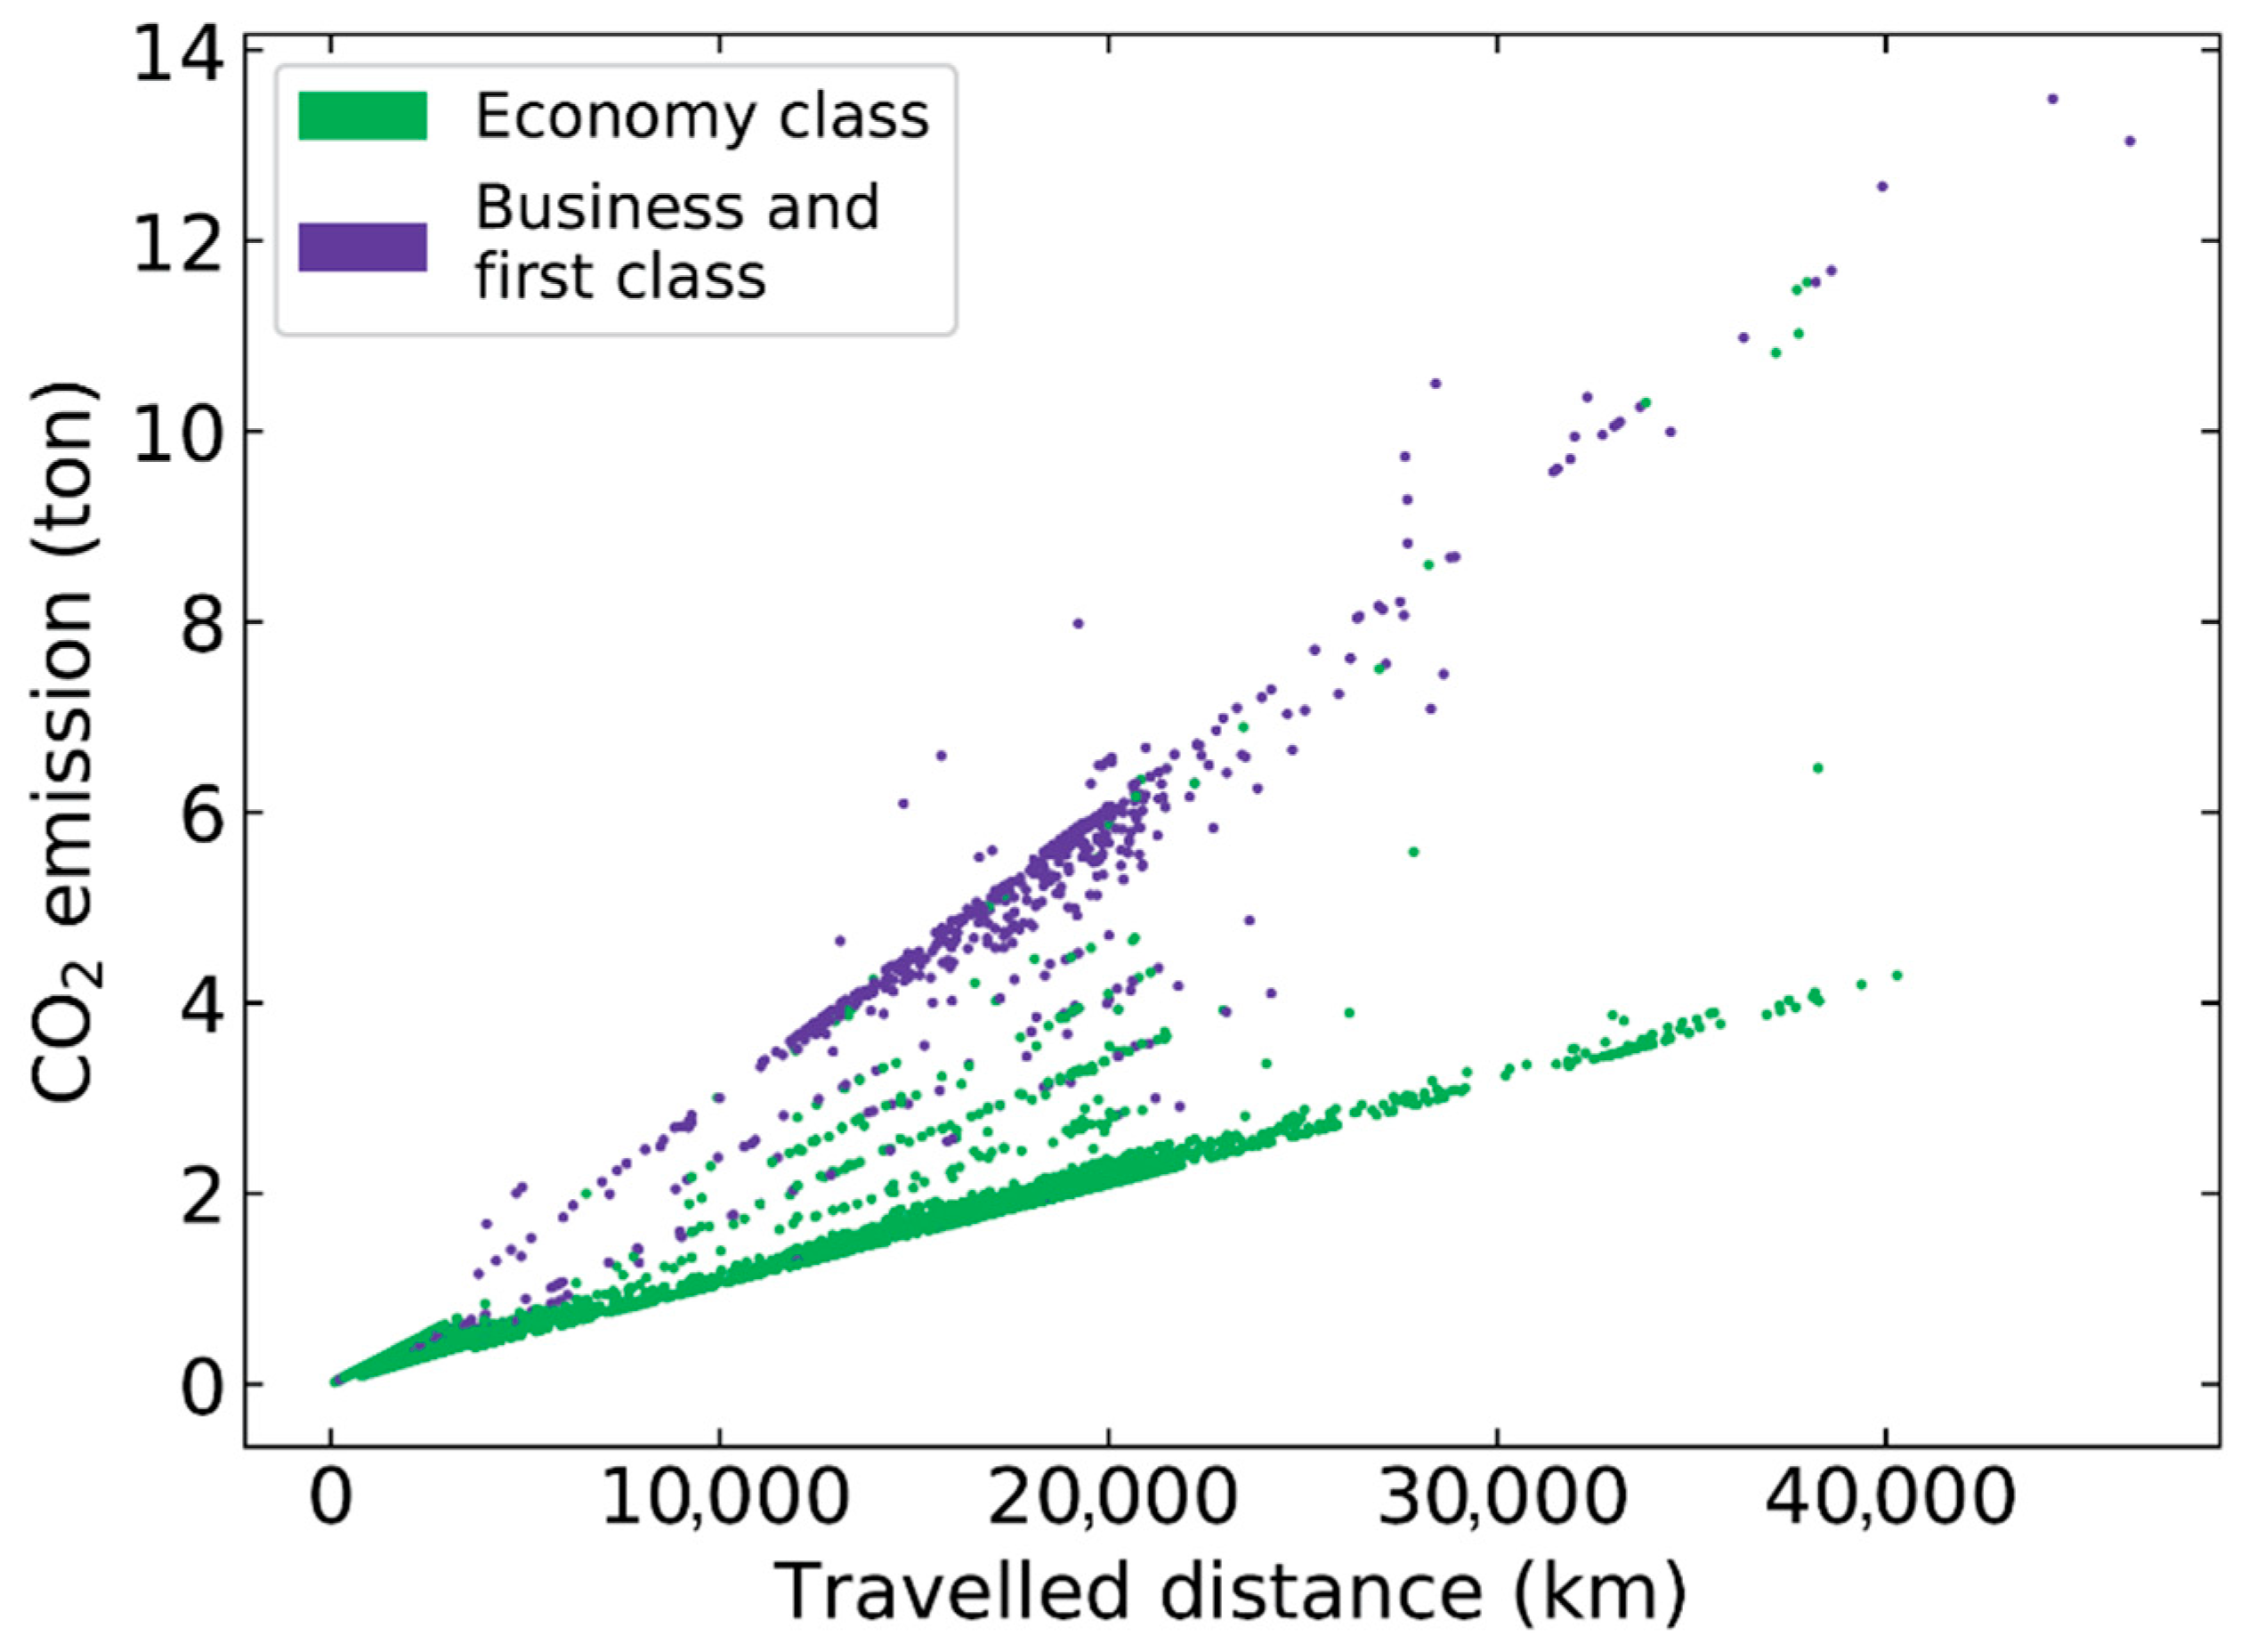
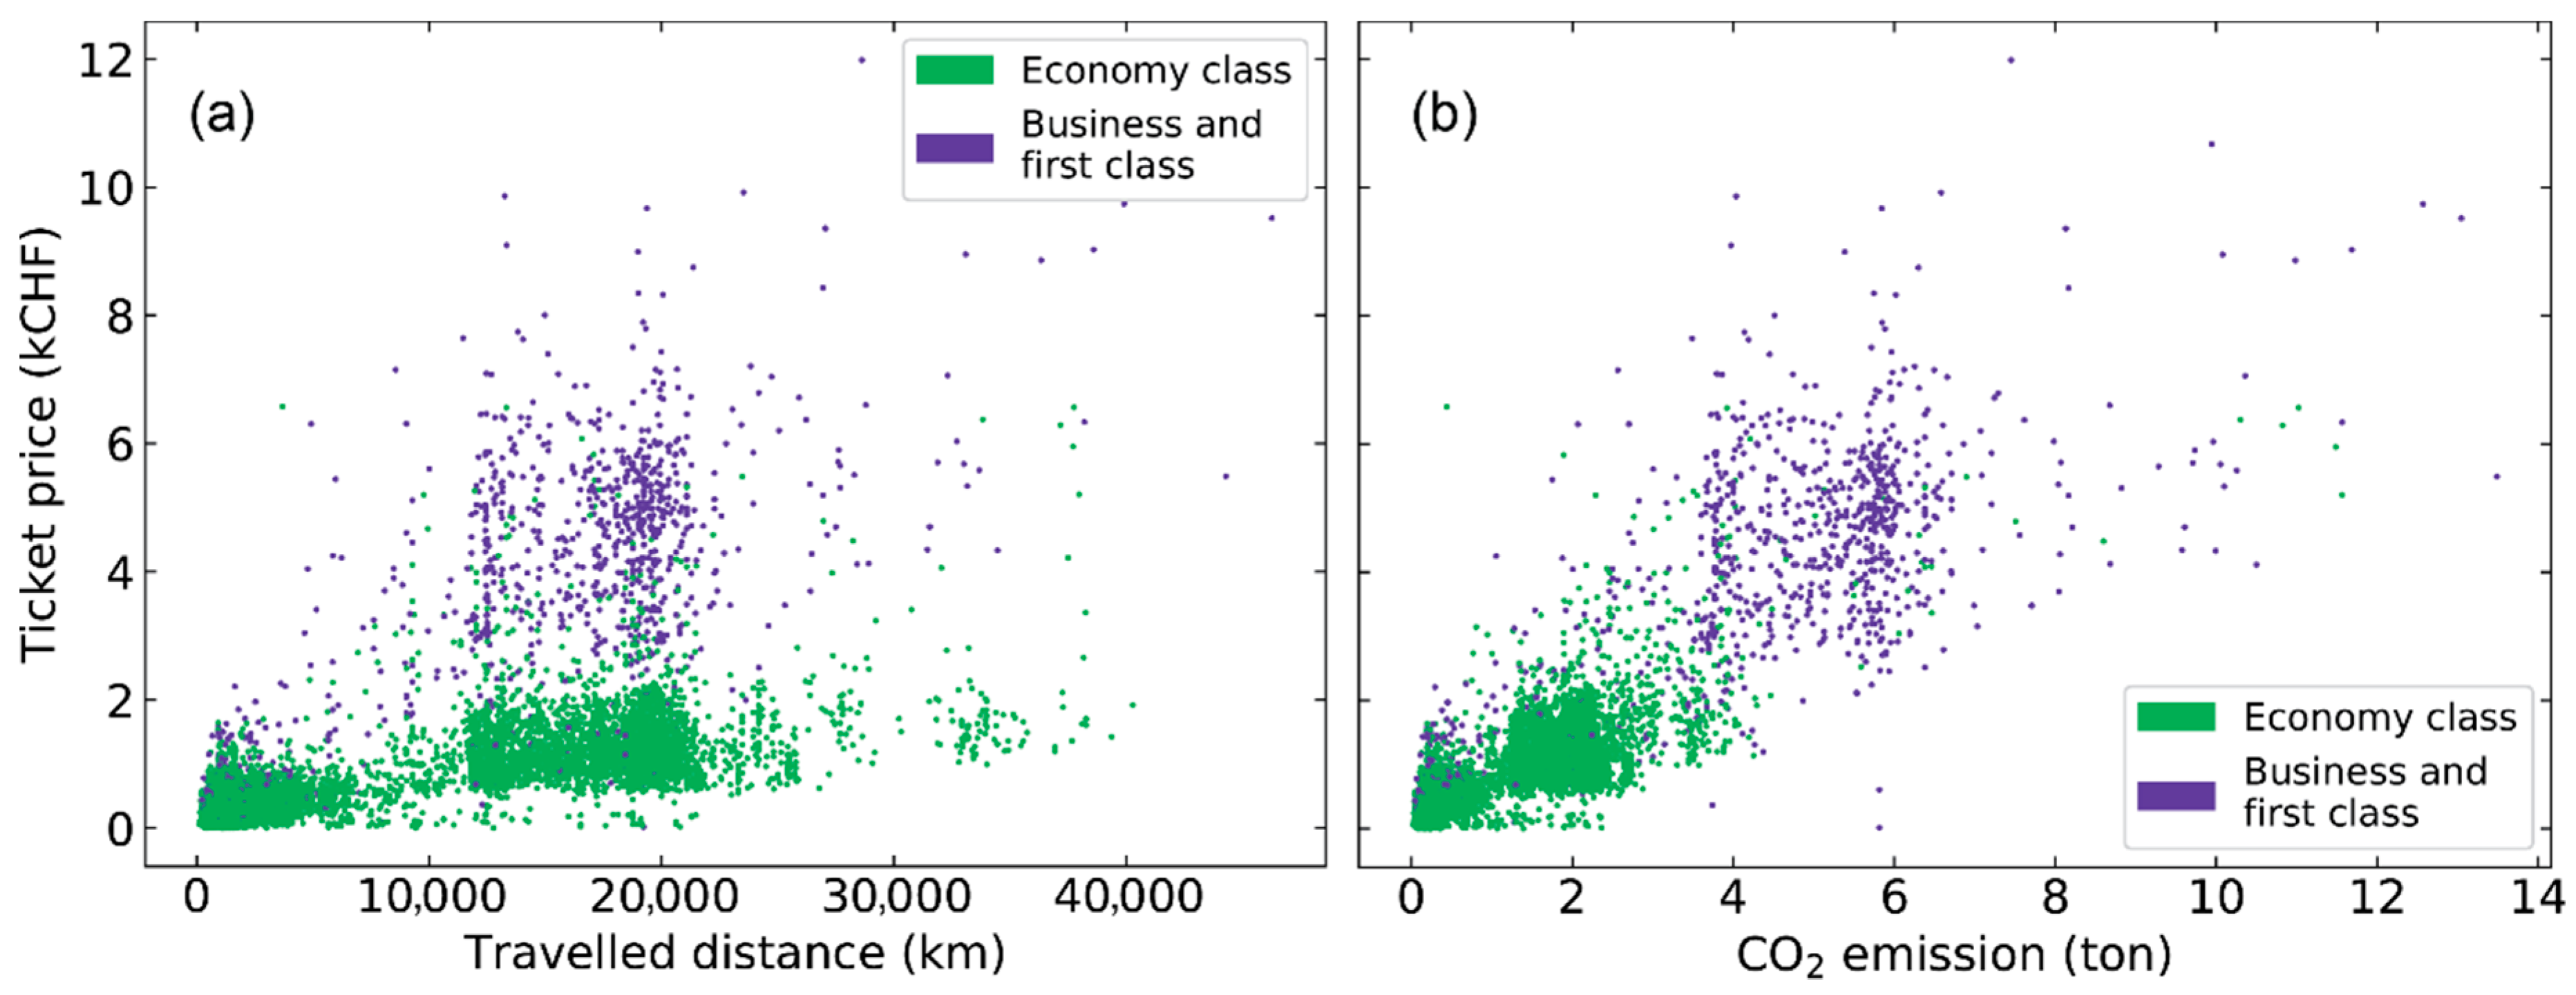
Figure 1 shows the relationship between CO2e emission and distance travelled. We can clearly see the increased emission from higher service classes. In Figure 2, we observe a higher correlation between the amount of money spent and CO2e emitted (correlation coefficient of 0.89) than between distance travelled and CO2e emitted (correlation coefficient of 0.64).
3.2. Travel Behavior of EPFL Researchers
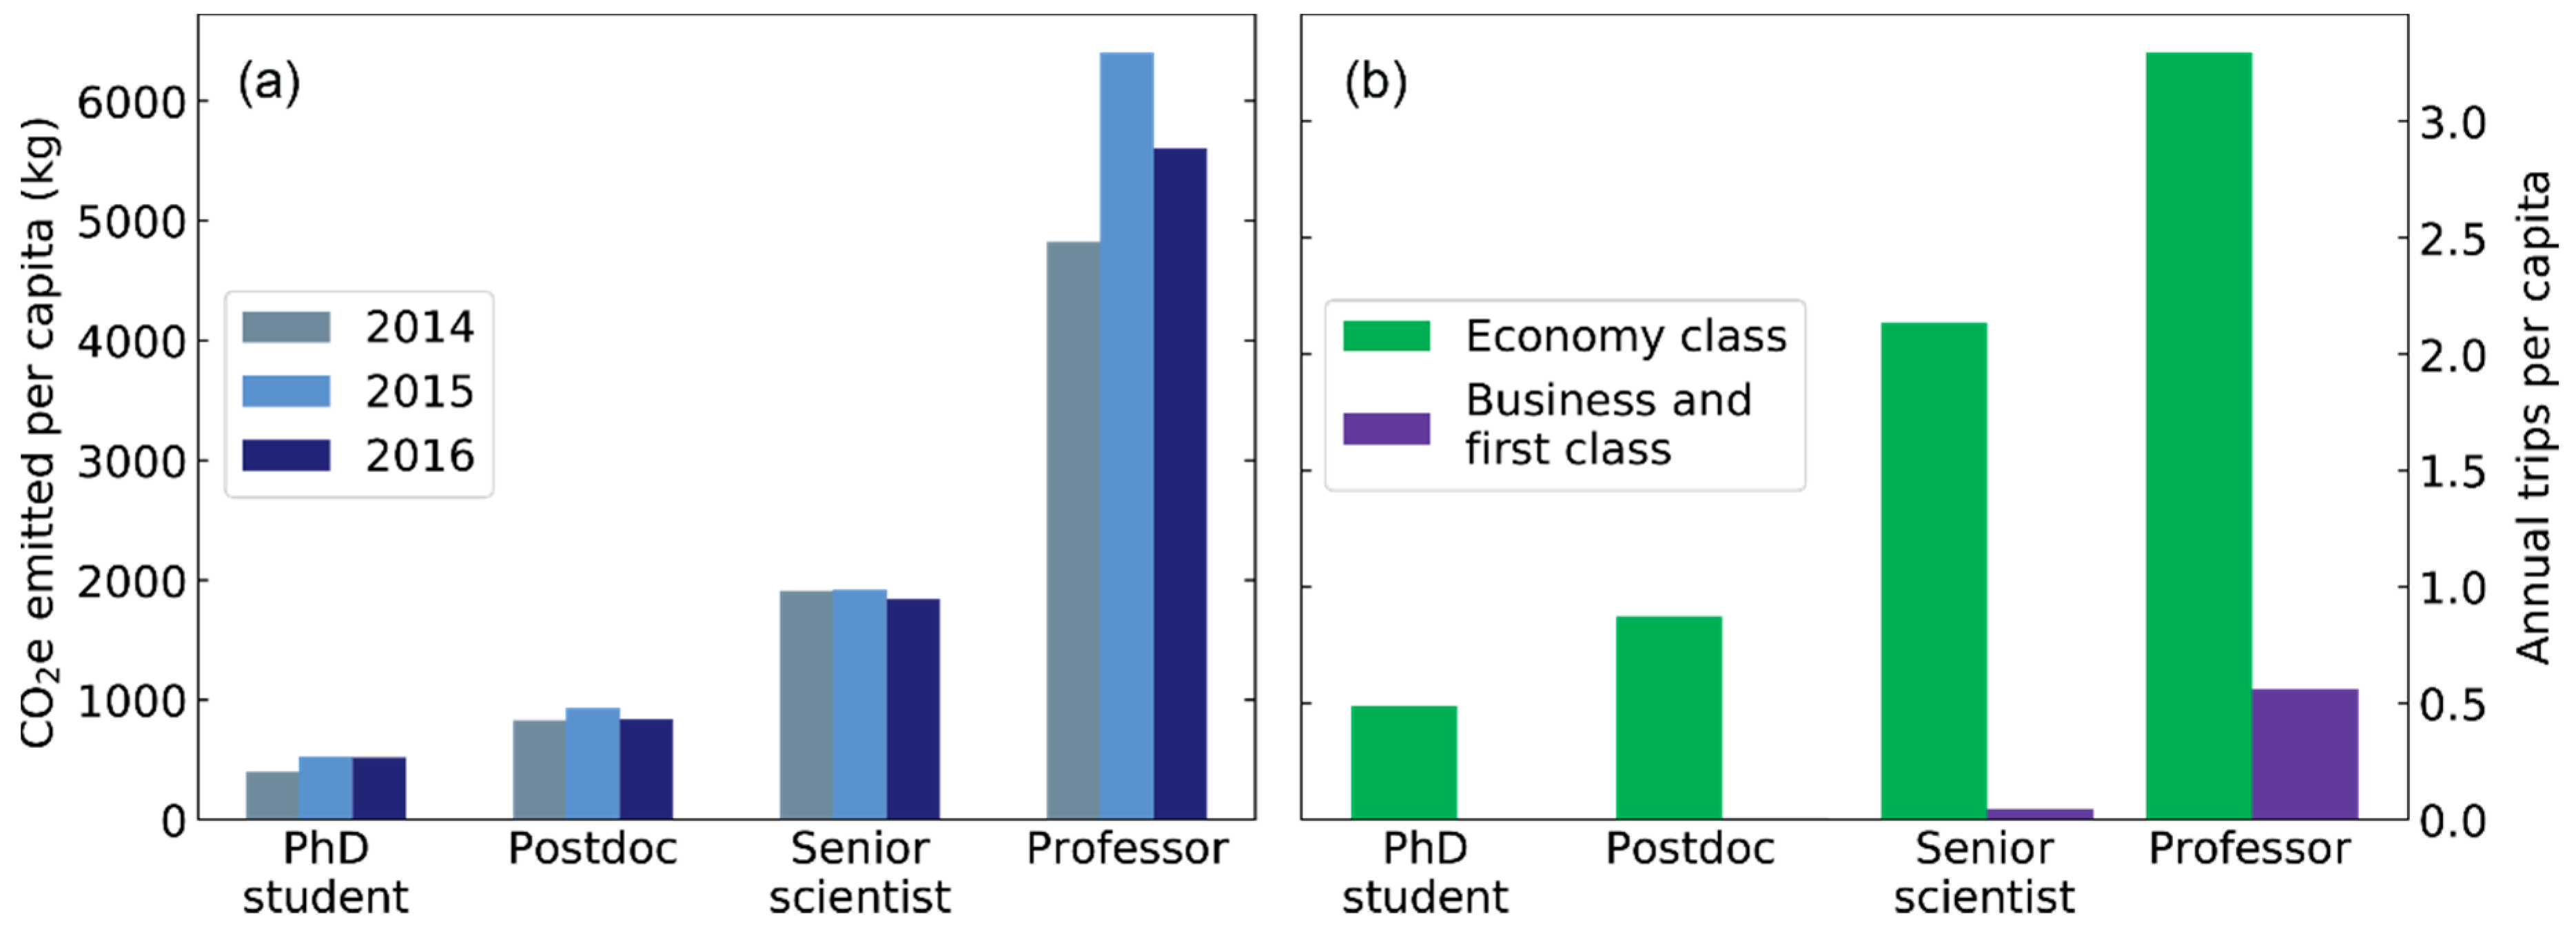
Upon investigation of the travel habits of the different groups of researchers, which are shown in Figure 3, we observe that carbon footprint increases dramatically with seniority (Figure 3a). Professors emit on average 10 and 5 times more GHGs compared to PhD students and postdocs, respectively. Moreover, professors—and to a smaller extent senior scientists—are the main users of business and first class travel, which is negligible for PhD students and postdocs. A similar increase with seniority can be observed for the distance travelled and money spent, as is shown in Supplementary Figure S2.
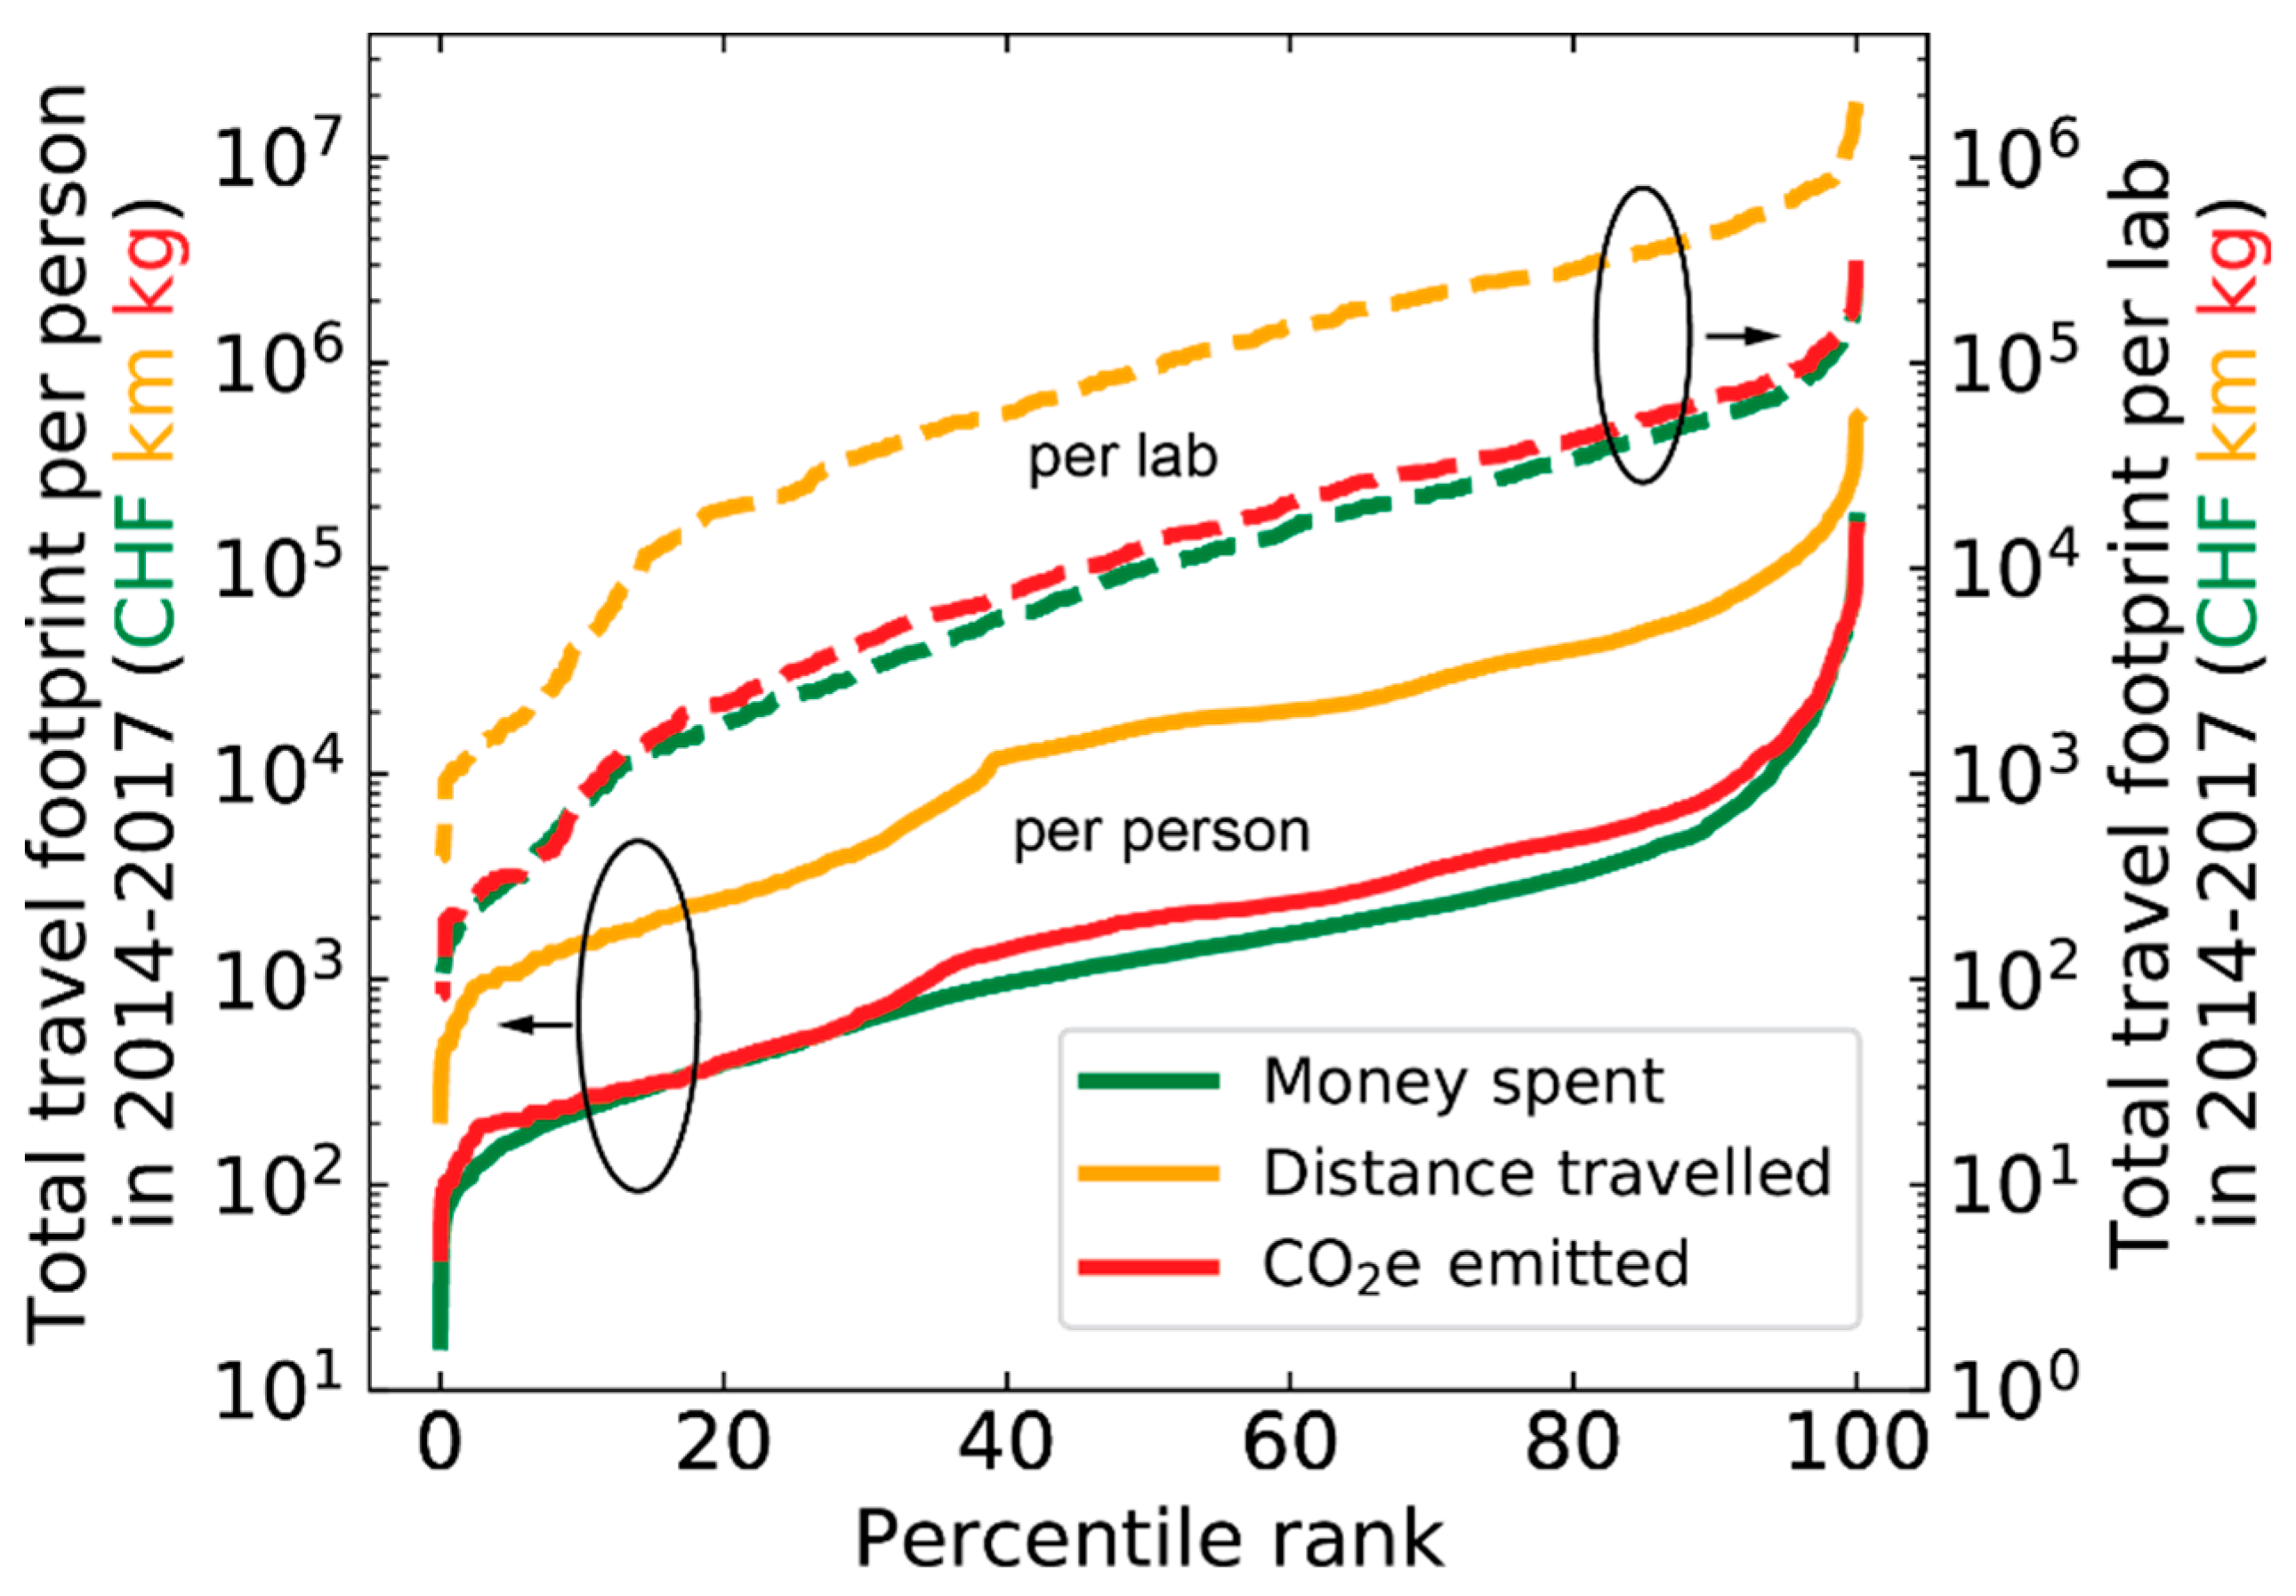
Figure 4 shows the inequality in footprint between individual travelers and research units or labs. We observe very high levels of inequality in terms of GHG emissions, money spent, and distance travelled, with a small number of individuals traveling over an order of magnitude more than the median, and a small number of labs traveling almost an order of magnitude more than the median. Table 2 shows two quantities that represent inequality for the three types of footprints discussed here, namely the share of the top 10% biggest travelers, and the Gini coefficient, both for individual researchers and for laboratories. We observe that the 10% of most traveling individuals are responsible for 58.3% of EPFL’s GHG emissions from air travel, while the 10% of most traveling labs emit 40.2% of EPFL’s air travel GHGs. Looking at the Gini coefficient, a measure of statistical dispersion most commonly used measurement of inequality, we observe a larger inequality in individual carbon footprint (0.722) than for worldwide income (0.65, World bank [8,9]). The Gini coefficient for CO2e emission per lab (0.607) is slightly lower than that of the worldwide income. We observe a systematically lower inequality for the distance travelled, compared to CO2e emissions and money spent. This observation is due to increased business and first class travel among the largest consumers.
3.3. Reduction Opportunities
Based on the relationships that emerged from the data analyses, we were able to identify and quantify three pathways to reduce GHG emissions without compromising travel.
First, due to the difference in CO2 intensity between service classes, a reduction of 17% in EPFL’s air travel GHG emissions, amounting to 840 t CO2e per year could be obtained by replacing all business and first class trips by economy class.
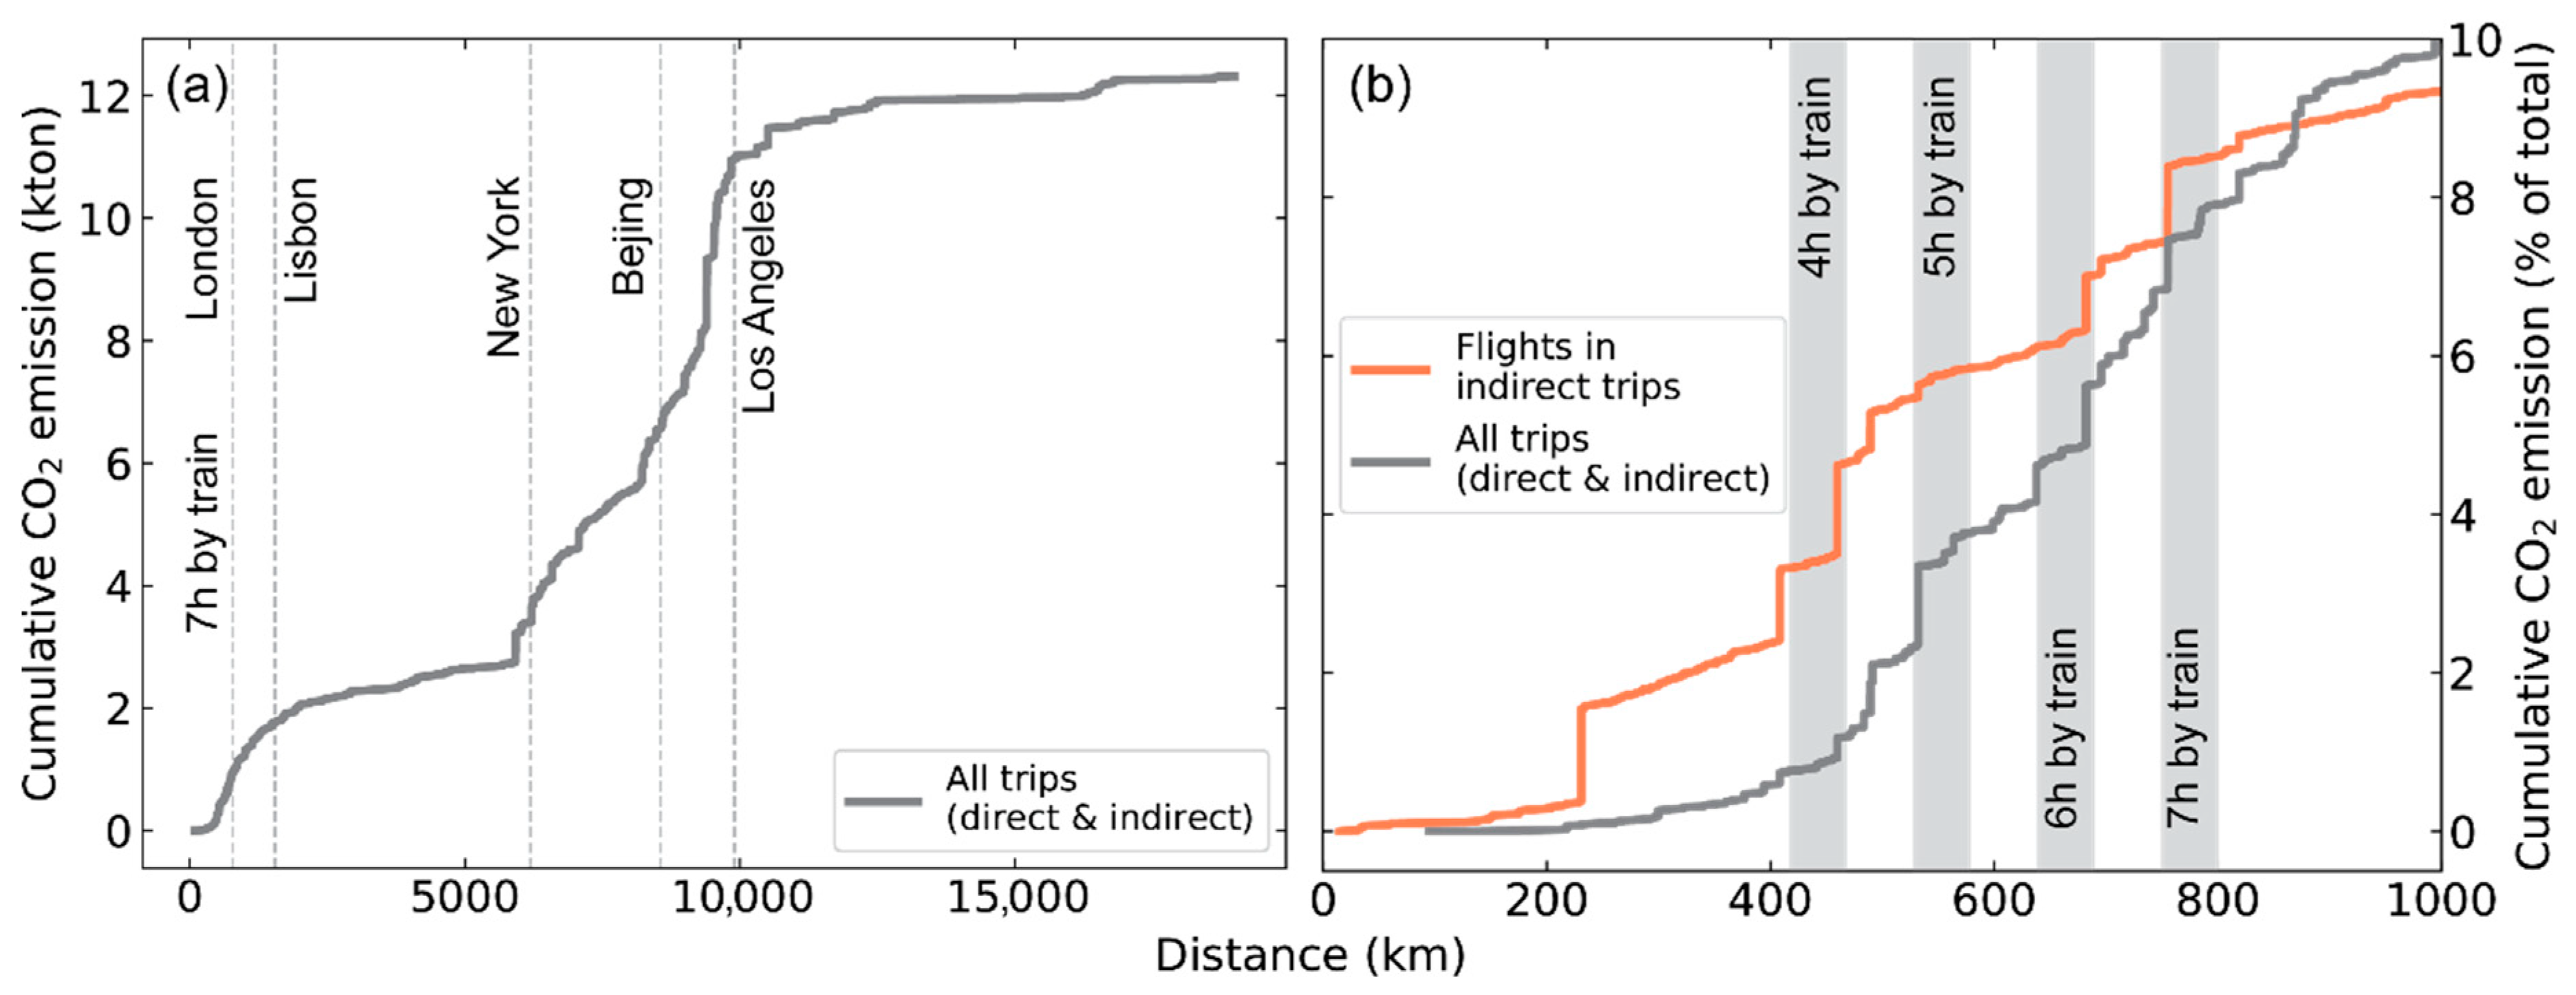
A second pathway would consist of replacing short flights by rail travel. In order to quantify this reduction, one should observe the cumulative CO2e emissions as a function of distance travelled in Figure 5a. We see that approximately 15% of EPFL’s air travel GHG emissions are coming from continental travel. Zooming in on the short trips below 1000 km, as well as short connection flights during indirect trips, allows us to determine the reduction potential of this replacement. The cumulative impacts of short direct trips and short flights during indirect trips are shown in Figure 5b. Replacing both of them over distances below 800 km could reduce EPFL’s air travel GHG emissions by up to 15% or 730 t CO2e per year. We assumed that the replacing train trip would emit 0.02 kg of CO2e per km.
Third, we considered replacing all indirect trips by direct ones. Two effects are influencing the GHG impact of this substitution. On one hand, indirect trips always cover more distance than a direct equivalent, causing increased emissions. On the other hand, typical flights are most efficient (in terms of fuel consumption per unit of distance) over distances of around 5000 km [10]. For shorter distances, taxiing and takeoff is proportionally more important, while for longer distances, the increased weight of the fuel leads to increased energy expenditure. This implies that, e.g., the emissions of a single 10,000 km flight could be reduced by splitting it up in two 5000 km flights, but only if the extra distance which is covered as a result of the intermediate touch-down is negligible. If we look at the flights in our database, we see that only 1.7% of the indirect trips have lower emissions than an equivalent direct trip would have. In these cases, the difference is in the order of a few percent. The vast majority of indirect trips in our database (98.3%) has much higher emissions than an equivalent direct trip, as can be seen in Supplementary Figure S3. Here, we supposed that all flights were flown in economy class to avoid the influence of service class, which we already discussed above. We can therefore conclude that the extra distance covered by indirect trips is much more important than the potential small gains in fuel efficiency in almost all cases. In total, we found a potential 9% reduction in EPFL’s air travel GHG emissions, corresponding to 440 t CO2e per year by replacing all indirect travels with direct flights. Note that it is likely not all of the direct flights required for this replacement are available on the commercial market.
4. Discussion
The observation that GHG emissions are more closely correlated to ticket price than to distance travelled, leads to the interesting phenomenon that a reduction in carbon footprint could lead to a cost reduction and vice versa. This means that a travel budget restriction could be used as a simple but effective measure to reduce carbon footprint of an institution. Additionally, reducing the carbon footprint of air travel could be a net negative cost measure, contrary to other sustainability measures.
The large inequality in travel footprint between individuals and laboratories raises the question whether all travel by the researchers with the largest footprint is useful and contributing positively to the institution and to their career. The time and energy spent traveling, in addition to fatigue from jetlags, could jeopardize the overall professional performance and quality of life. Future work should aim to answer the question whether increased traveling leads to improved academic performance.
Adding up the potential reductions in GHG emissions that could be achieved by replacing business and first class trips by economy class, short flights by train trips, and indirect journeys with direct flights, we find that the carbon footprint could be reduced by up to 36%. This significant amount shows that substantial reductions are possible by making the appropriate choices. This figure represents a theoretical upper boundary for the reduction in emissions that could be achieved for the present dataset without any reduction in travel. It does not take the reductions in GHG emissions into account that could result from avoided travel, e.g., by replacing it with videoconferencing. This is outside the scope of this work. In practice, there are several challenges in achieving the reduction figures presented here. Economy class travel can be less comfortable for long journeys, and train connections or direct flights are not always available and are in some cases more expensive. However, additional measures, such as the promotion of videoconferencing to replace physical travel, could lead to reductions not taken into account in this study. These results show which choices should be preferentially made when choosing a travel itinerary, and can be the basis for travel guidelines or policies within institutions, academic or otherwise.
Even though the present work focuses exclusively on researchers from EPFL, the results and conclusions are likely relevant for other academic institutions as well. Given the relatively large amounts of funds available for research and development in Switzerland (3.374% of GDP in 2015) [11], researchers might have less restrictions to travel compared to other countries. Nevertheless, qualitatively similar trends to the ones reported here could be expected elsewhere in academia. Moreover, most of the points raised in this work are also relevant for other communities. The high correlation between a flight’s GHG emissions and its ticket price can be used by anyone as a tool to limit air travel GHG emissions. The highly unequal distribution of air travel is a general trend throughout the human population [5]. Any individual or organization wishing to reduce their air travel GHG emission should, in cases where physical travel is absolutely required, favor economy class, train travel, and direct flights where comfort and/or availability allow to do so.
Supplementary Materials
The following are available online at https://www.mdpi.com/2071-1050/11/1/80/s1. Supplementary Figure S1: Number of direct (brown) and indirect trips (coral) as a function of distance between the departure and destination airport. Supplementary Figure S2: (a) Average per capita annual distance travelled by a PhD student, Postdoc, senior scientist and professor at EPFL. (b) Annual amount of money spent per capita on air travel for the same categories. Supplementary Figure S3: Carbon footprint of direct (brown) and indirect (coral) trips. Supplementary Table S1: Used DEFRA metrics to calculate CO2e emission over the studied time period.
Author Contributions
Conceptualization, G.O.V., A.M. and J.C.; Formal Analysis, J.C.; Investigation, J.C. and A.M.; Writing-Original Draft Preparation, J.C., A.M.; Writing-Review & Editing, L.D.T. and G.O.V.; Supervision, L.D.T. and G.O.V.; Project Administration, A.M.; Funding Acquisition, L.D.T. and G.O.V.
Funding
This research was funded by EPFL Sustainable Campus.
Acknowledgments
The authors thank D. Zhao and L. Bellocchi for valuable discussions.
Conflicts of Interest
The authors declare no conflict of interest. The funders had no role in the design of the study; in the collection, analyses, or interpretation of data; in the writing of the manuscript, or in the decision to publish the results.
References
- Aviation and Climate Change—The Continuing Challenge. Available online: https://onlinelibrary.wiley.com/doi/10.1002/9780470686652.eae1031 (accessed on 26 October 2018).
- International Energy Agency. Global Energy & CO2 Status Report. Available online: https://www.iea.org/publications/freepublications/publication/GECO2017.pdf (accessed on 26 October 2018).
- Carbon Offsetting & Air Travel Part 2: Non-CO2 Emissions Calculations. Available online: https://www.sei.org/publications/carbon-offsetting-air-travel-part-2-non-co2-emissions-calculations/ (accessed on 26 October 2018).
- Lee, D.S.; Fahey, D.W.; Forster, P.M.; Newton, P.J.; Wit, R.C.N.; Lim, L.L.; Owen, B.; Sausen, R. Aviation and global climate change in the 21st century. Atmos. Environ. 2009, 43, 3520–3537. [Google Scholar] [CrossRef] [Green Version]
- Peeters, P.; Gossling, S.; Becken, S. Innovation towards tourism sustainability: climate change and aviation. Int. J. Innov. Sustain. Dev. 2006, 1, 184. [Google Scholar] [CrossRef]
- Carlson Wagonlit Travel—Business Travel Management Company. Available online: https://www.carlsonwagonlit.com/ (accessed on 26 October 2018).
- Government Emission Conversion Factors for Greenhouse Gas Company Reporting. Available online: https://www.gov.uk/government/collections/government-conversion-factors-for-company-reporting (accessed on 26 October 2018).
- Income Inequality. Available online: http://www.worldbank.org/en/topic/poverty/lac-equity-lab1/income-inequality (accessed on 26 October 2018).
- Inequality—Income Inequality—OECD Data. Available online: http://data.oecd.org/inequality/income-inequality.htm (accessed on 26 October 2018).
- Green, J.E. Civil aviation and the environment—The next frontier for the aerodynamicist. Aeronaut. J. 2006, 110, 469–486. [Google Scholar] [CrossRef]
- Research and Development (R&D)—Gross Domestic Spending on R&D—OECD Data. Available online: http://data.oecd.org/rd/gross-domestic-spending-on-r-d.htm (accessed on 26 October 2018).
Figure 1.
CO2 emission as a function of the distance travelled for all trips in the dataset. Economy class trips are marked in green, while business and first class flights are marked in purple. This figure visually illustrates the increased greenhouse gas (GHG) emissions of higher service class.
Figure 1.
CO2 emission as a function of the distance travelled for all trips in the dataset. Economy class trips are marked in green, while business and first class flights are marked in purple. This figure visually illustrates the increased greenhouse gas (GHG) emissions of higher service class.

Figure 2.
(a) Ticket price as a function of distance travelled for the entire dataset; (b) ticket price as a function of CO2 emission, again for the entire dataset. We observe a much stronger correlation in (b); compared to (a). The correlation coefficients are 0.89 and 0.64, respectively.
Figure 2.
(a) Ticket price as a function of distance travelled for the entire dataset; (b) ticket price as a function of CO2 emission, again for the entire dataset. We observe a much stronger correlation in (b); compared to (a). The correlation coefficients are 0.89 and 0.64, respectively.

Figure 3.
(a) Average annual air travel carbon footprint of a PhD student, Postdoc, senior scientist and professor at École Polytechnique Fédérale de Lausanne (EPFL); (b) annual number of trips in economy and business class for the same categories. We clearly see the increase of travel footprint with seniority.

Figure 4.
Total travel footprint from 2014 to 2016 of individual researchers (solid line, corresponding to the left-hand vertical axis) and laboratories (dashed line, corresponding to the right-hand vertical axis). Individuals and laboratories are ranked from low to high on a scale from 0 to 100. The footprint is expressed in money spent (green), distance travelled (orange), and CO2 emitted (red) and the data are ranked in increasing order. All quantities show a large inequality with a spread over more than two orders of magnitude.

Figure 5.
(a) Cumulative CO2 emission as a function of distance between departure and arrival airports for the entire dataset; (b) zoom of the data shown in (a) for short distances (grey), together with the cumulative CO2 emission of short-distance flights in indirect trips (coral). The vertical grey bands show the distance that can be covered by train in the indicated amount of time.


Table 1.
Overview of the travel impact for intra- and inter-continental travel in economy, business and first class.
Table 1.
Overview of the travel impact for intra- and inter-continental travel in economy, business and first class.
| Travel Type | Number of Flights | CO2e Emitted (t) | Distance Travelled (Mm) | CHF/km | Avg. CO2e kg/CHF | Avg. CO2e kg/km | Total Cost (kCHF) | |
|---|---|---|---|---|---|---|---|---|
| Total | 14,949 | 14,603 | 98,975 | 0.120 | 1.235 | 0.148 | 11,809 | |
| Intra-continental | Economy | 9030 | 2300 | 14,004 | 0.184 | 0.893 | 0.164 | 2577 |
| Business and First | 324 | 100 | 600 | 0.296 | 0.562 | 0.167 | 178 | |
| Inter-continental | Economy | 4690 | 7958 | 69,356 | 0.075 | 1.524 | 0.115 | 5220 |
| Business and First | 905 | 4245 | 15,015 | 0.255 | 1.107 | 0.287 | 3834 | |
Table 2.
Inequality quantifiers for GHG emissions, distance traveled and money spent, both per person and per lab.
Table 2.
Inequality quantifiers for GHG emissions, distance traveled and money spent, both per person and per lab.
| Share of the Top 10% Biggest Travelers | Gini Coefficient | |||
|---|---|---|---|---|
| Per Person | Per Lab | Per Person | Per Lab | |
| CO2e emission | 58.3% | 40.2% | 0.722 | 0.607 |
| Distance travelled | 49.8% | 39.0% | 0.678 | 0.588 |
| Money spent | 64.0% | 42.3% | 0.749 | 0.622 |
© 2018 by the authors. Licensee MDPI, Basel, Switzerland. This article is an open access article distributed under the terms and conditions of the Creative Commons Attribution (CC BY) license (http://creativecommons.org/licenses/by/4.0/).
Share and Cite
MDPI and ACS Style
Ciers, J.; Mandic, A.; Toth, L.D.; Op ’t Veld, G. Carbon Footprint of Academic Air Travel: A Case Study in Switzerland. Sustainability 2019, 11, 80. https://doi.org/10.3390/su11010080
AMA Style
Ciers J, Mandic A, Toth LD, Op ’t Veld G. Carbon Footprint of Academic Air Travel: A Case Study in Switzerland. Sustainability. 2019; 11(1):80. https://doi.org/10.3390/su11010080
Chicago/Turabian StyleCiers, Joachim, Aleksandra Mandic, Laszlo Daniel Toth, and Giel Op ’t Veld. 2019. "Carbon Footprint of Academic Air Travel: A Case Study in Switzerland" Sustainability 11, no. 1: 80. https://doi.org/10.3390/su11010080
Note that from the first issue of 2016, this journal uses article numbers instead of page numbers. See further details here.