Optimal Line Design of New and Remanufactured Products: A Model for Maximum Profit and Market Share with Environmental Consideration


Department of Industrial and Information Systems Engineering, Soongsil University, Seoul 06978, Korea
Sustainability 2018, 10(11), 4283; https://doi.org/10.3390/su10114283
Submission received: 31 October 2018
/
Revised: 11 November 2018
/
Accepted: 15 November 2018
/
Published: 19 November 2018
Abstract
:For original equipment manufacturers (OEMs), producing a line of new and remanufactured products can be an effective strategy for improving the sustainability of their business. The potential cannibalization of new product sales and the technological obsolescence of used products, however, can create barriers for OEMs to embrace remanufacturing. In order to address these challenges in OEM remanufacturing, this paper proposes a mixed-integer programming model for the optimal line design of new and remanufactured products. Aiming at two objectives, i.e., maximizing the total profit and maximizing the total market share, the model simultaneously optimizes a line of new and remanufactured products in terms of their (1) design specifications (including an upgrade plan for the remanufactured product), (2) selling prices, and (3) production quantities and the detailed production plan. With the simultaneous optimization, the model suggests an optimal way of differentiating the new and remanufactured products in order to overcome the cannibalization and obsolescence effects and to maximize the total profit and/or market share. The model also accounts for environmental impact, stipulating that the total environmental impact of manufacturing remains under a certain limit. To demonstrate the applicability and effectiveness of the model, a case study is presented using the example of a desktop computer.
1. Introduction
As public awareness of environmental issues grows and environmental legislation and policies become more stringent, improving the sustainability of supply chains and achieving “green profit” (i.e., profit generated by an environmentally sustainable business) is emerging as a pressing issue in manufacturing industries [1,2,3]. For original equipment manufacturers (OEMs), remanufacturing can be an effective strategy to address this problem. Remanufacturing is a process of returning used products (i.e., end-of-life products) to like-new condition by rebuilding or replacing their component parts [4]. As parts from end-of-life products are reused, remanufactured products can offer the same level of performance and quality at only a small fraction of the original cost while consuming less material and energy [5]. With remanufactured products, firms can reduce the adverse environmental impact of manufacturing (e.g., greenhouse gas emissions, waste, and resource depletion), and also can comply with environmental legislation and policies, such as the Waste Electrical and Electronic Equipment (WEEE) Directive, End of Life Vehicles (ELV) Directive, and climate change-related laws and policies. Remanufacturing also enables firms to expand their product line. By embracing more affordable greener offerings, firms can target a wider range of the market as compared to firms producing brand-new products only [6,7]. Accordingly, remanufacturing has gained increasing interest in recent years as a means to achieve both economic profitability and environmental sustainability.
However, when facing a choice of whether or not to remanufacture their products, OEMs choose not to remanufacture in many cases [8,9]. They are concerned that offering remanufactured products will cannibalize their new product sales [6,7,8,9]. The technological obsolescence of end-of-life products is another barrier to remanufacturing. Given rapid advances in technology, it is less likely that the original design from past years will meet customer needs in the current market. For technology products with short life cycles, such as cell phones and computers, simple restoration of end-of-life products that maintain the original design specifications is especially hard to justify. In order to address these two challenges in OEM remanufacturing, decision-making tools are required that can help OEMs overcome the risks of cannibalization and obsolescence and assist them in achieving greater profit and market share from the line of new and remanufactured products. The environmental value from remanufacturing should be justifiable as well.
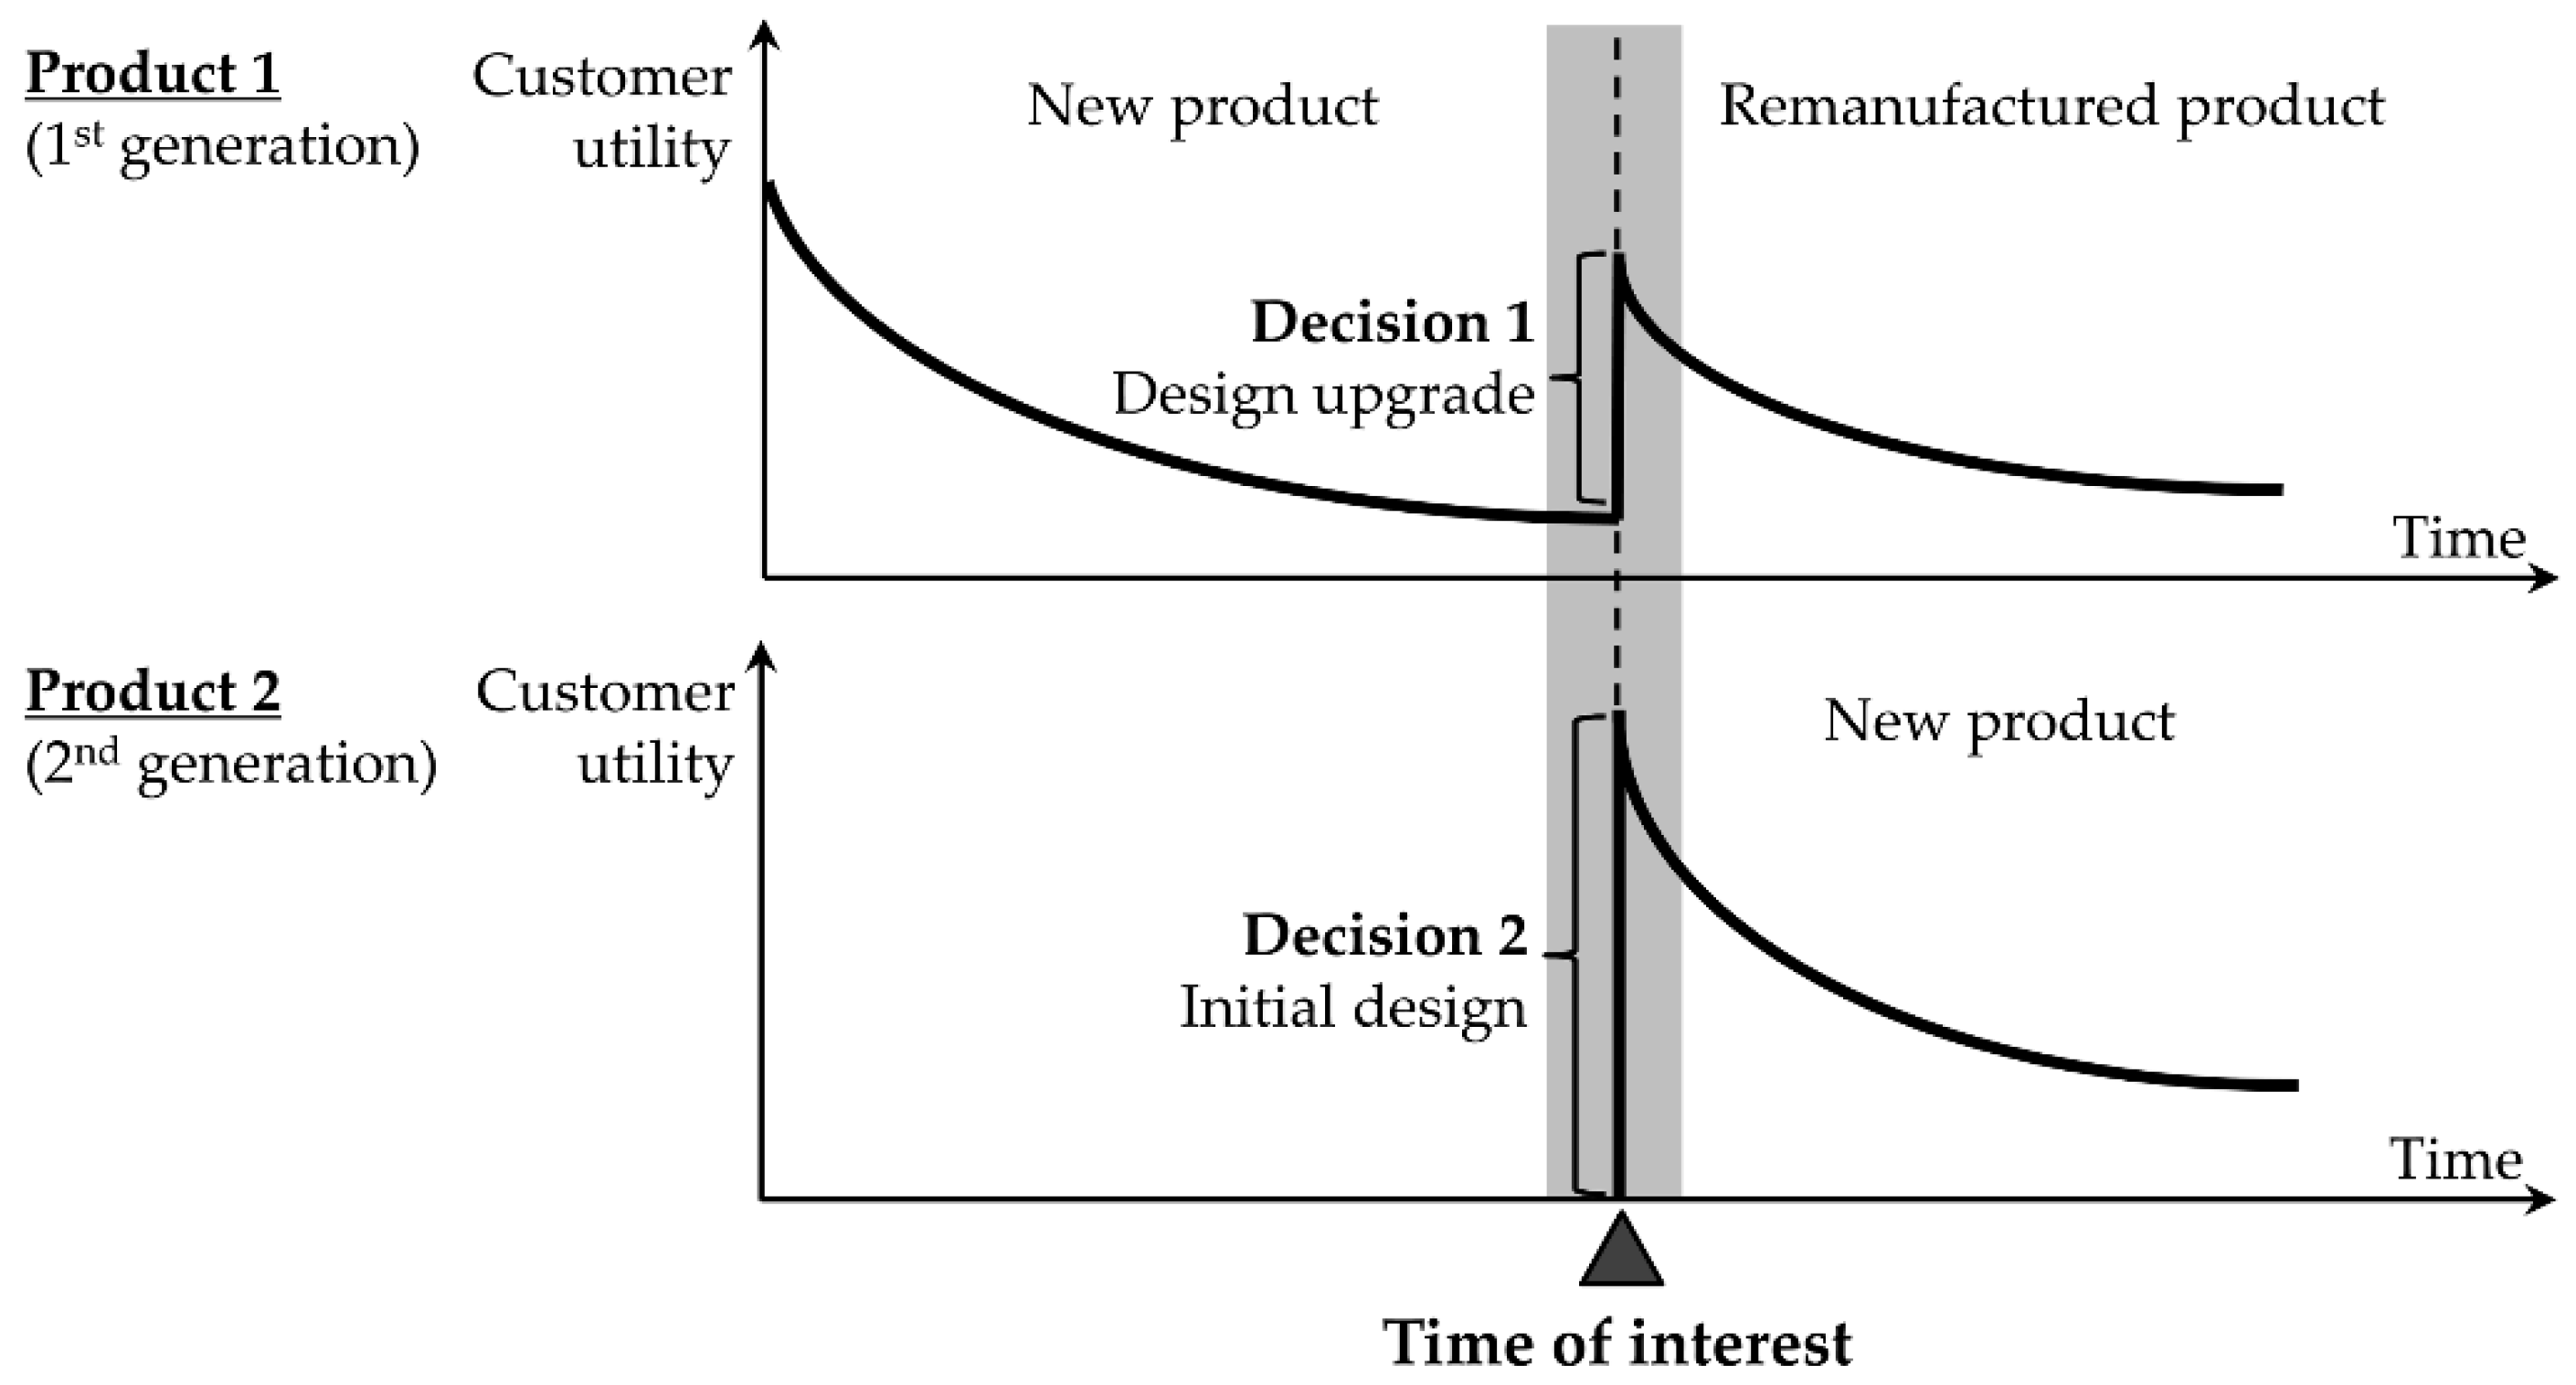
In order to support OEMs who produce both new and remanufactured products, this paper proposes a design tool for optimizing a line of new and remanufactured products in the form of a mixed-integer programming model. Figure 1 illustrates the research problem of interest. As shown in Figure 1, the proposed model differs from other studies [10,11,12] which optimized the closed-loop of new and remanufactured products (i.e., new products in the first life and their remanufactured versions in the second life). It assumes that both new and remanufactured products are launched into a competitive market at the same time. Aiming at two marketing objectives, i.e., maximizing the total profit and maximizing the total market share, the model simultaneously optimizes new and remanufactured products, in terms of their (1) design specifications, (2) selling prices, and (3) production quantities and the detailed production plan. In other words, the model conducts design optimization, pricing, and production planning of the new and the remanufactured products in an integrated manner (Figure 2). In order to overcome the technological obsolescence of end-of-life products, the model considers a design upgrade for the remanufactured product and optimizes it with the design of the new product. Environmental considerations are also taken as a key constraint in the optimization, indicating that the total environmental impact caused by manufacturing should remain under a certain limit.
Although there has been a great deal of research conducted on remanufacturing, research on the simultaneous optimization of new and remanufactured products remains in its early stage. Most existing studies have only focused on optimal pricing (i.e., how to optimize the selling prices and production quantities), and little attention has been given to product design optimization. Including those by Ferguson and Toktay (2006) [8], Vorasayan and Ryan (2006) [13], Atasu et al. (2008) [14], Ferrer and Swaminathan (2010) [15], Ovchinnikov (2011) [16], Zhou et al. (2017) [17] and Kwak and Kim (2017) [2], most studies thus far have assumed that product design is predefined and fixed for both new and remanufactured products; that is, the remanufactured product has the same design as the end-of-life product and no upgrade is considered.
The research of Aydin et al. (2015) [18] is an exception, in that it addressed both pricing and design optimization for a line of new and remanufactured products, including the possibility of an upgrade in remanufacturing. Their approach, however, has a limitation with respect to the cost model. They assumed the per-unit production cost of remanufacturing as a constant and overlooked the effects of their decisions on part reuse and procurement in remanufacturing. As Steeneck and Sarin (2013) [19] and Kwak and Kim (2017) [2] pointed out, the per-unit remanufacturing cost is interdependent with product design, pricing, and production planning decisions, and it should thus be considered as a function of decision variables. Another study worth mentioning is the work done by Kwak and Kim (2013) [20], where the authors proposed an integrated model for pricing, design optimization, and production planning of a remanufactured product. However, their model is applicable only to a single remanufactured product (not a product line) and it also does not consider the environmental impacts of its decisions.
The proposed model in this paper presents an advanced approach toward optimal line design, extending the approach by Kwan and Kim (2013) [20]. The model addresses the simultaneous optimization of design specifications, selling price, and production plans for the new and remanufactured products. With this simultaneous optimization, the model can more effectively and proactively differentiate the new and the remanufactured products to minimize the effect of cannibalization and maximize the profit and/or market share. The integration of design optimization, pricing, and production planning for the line of new and remanufactured products is the major contribution of the proposed model. Upgrade-related decision-making for the remanufactured product and environmental-impact consideration differentiate the model from others.
The rest of the paper is organized into sections. Section 2 describes the proposed mathematical model. Section 3 illustrates the application of the model using the example of a desktop to validate the applicability and effectiveness of the model. Section 4 concludes the paper with future research directions.
2. Mathematical Model
2.1. Problem Description
The proposed model considers the case in which a firm (i.e., the decision-maker) simultaneously launches a new product and a remanufactured product into a competitive market. The proposed model is based on the following assumptions. First, the firm relies on the waste stream for acquiring end-of-life products; no financial incentives are given for end-of-life products. Second, the decision-maker has good knowledge of the input for the remanufacturing. The quantity of the end-of-life product and its quality (i.e., reusability and generational differences of the parts) is given. Third, the products have modular structures, and any combination of parts is feasible and workable. Products are upgraded through part replacement. Fourth, unless part resale is restricted, the leftover reusable parts (that is, parts that are reusable but not used in remanufacturing) go to the second-hand part market. Only non-reusable parts proceed to material recycling. Finally, the model considers only a single period, and the effects of decisions on the next period (when the current new product reaches its end of life) are beyond the scope of this study. Table 1 shows the mathematical notations used in the model.
With the aim of maximizing the total profit and total market share, the model optimizes design specifications, selling prices, and production plans at the same time. For the design of the remanufactured product, the model decides whether or not to upgrade its design, as well as what the upgraded specifications should be if upgrading. The model uses the concept of generational difference [20] to represent design specifications. Generational difference is a relative measure that indicates, in terms of technology, how old a specific part is compared to the current cutting-edge part. Here, the newer part corresponds to the greater number of generations, and the current cutting-edge part corresponds to the maximum generation. The generational difference of a part is the gap between its generation and the current maximum generation of the cutting-edge part. A zero generational difference means that the part is cutting-edge in its design. If the generational difference is 1, the part is one generation old.
In the current model, δi, xNi, and xRi denote the generational difference of part i of an end-of-life, a new, and a remanufactured product, respectively. Here, xRi is defined as xRi = yi∙δi + ui, where yi is the binary decision variable indicating whether part i will maintain the original specification in remanufacturing (yi = 1) or upgrade its specification (yi = 0), and ui is the integer variable indicating the generational difference of part i when the part chooses to upgrade.
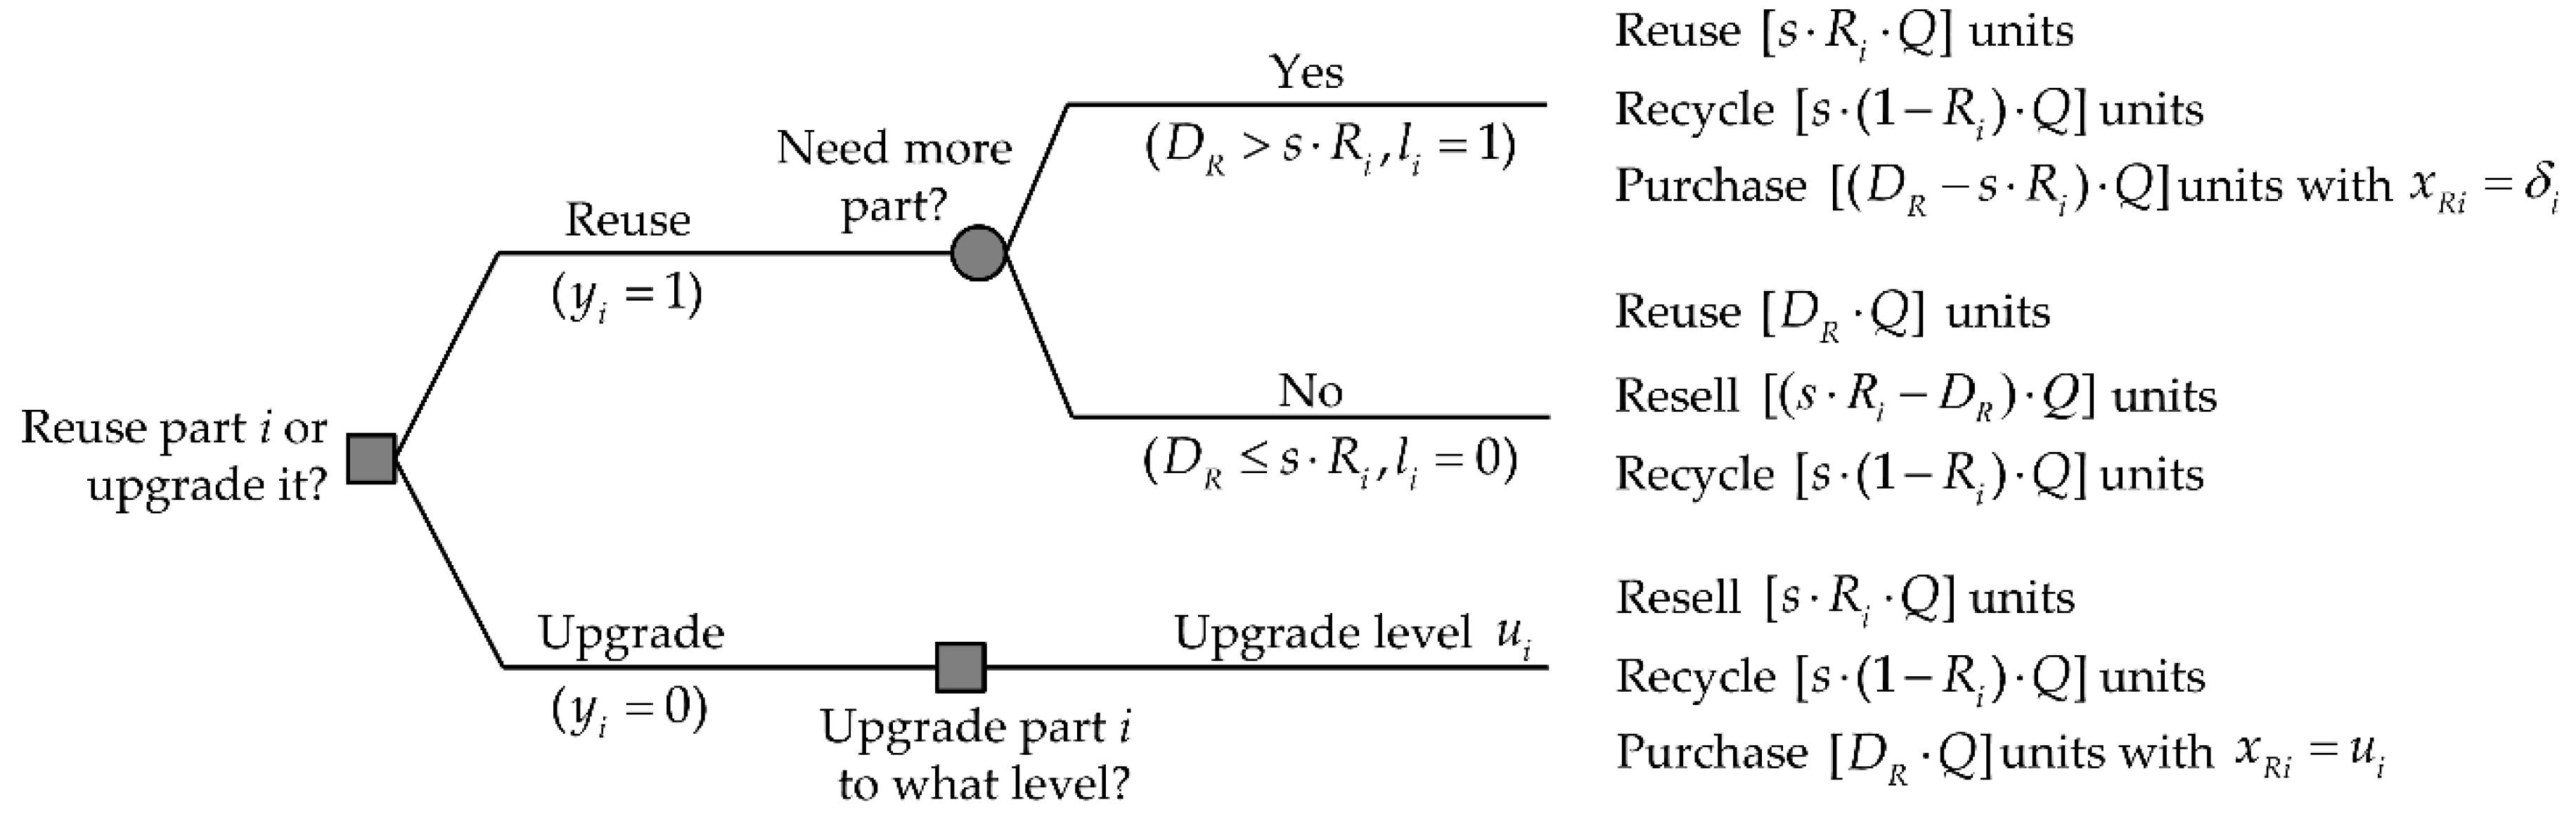
Part upgrade decisions affect material flows in remanufacturing. Figure 3 describes the implications of part upgrade decisions in remanufacturing. If an upgrade is indicated for part i, all s·Ri·Q units of reusable part i are sent for part resale and s·(1 − Ri)·Q units of non-reusable part i are sold for material recycling. At the same time, DR·Q units of the new part with an upgraded specification ui are purchased. If reuse is chosen for part i, the next question arises, i.e., whether the s·Ri·Q units of reusable part i are sufficient to meet the production quantity DR·Q. If there is an insufficient quantity of part i for remanufacturing (i.e., DR > s·Ri; li = 1), spare parts that are new but with the original specifications δi are purchased for as many as (DR − s·Ri)·Q; in the meantime, all non-reusable parts (i.e., s·(1 − Ri)·Q units) are sent to recyclers. In contrast, if there are enough reusable parts (i.e., DR ≤ s·Ri; li = 0), only DR·Q units are used in remanufacturing. Then, (s·Ri − DR)·Q units of reusable parts are resold to the part market, while s·(1 − Ri)·Q units of non-reusable part i are processed for material recycling.
2.2. Mathematical Model for Optimal Line Design
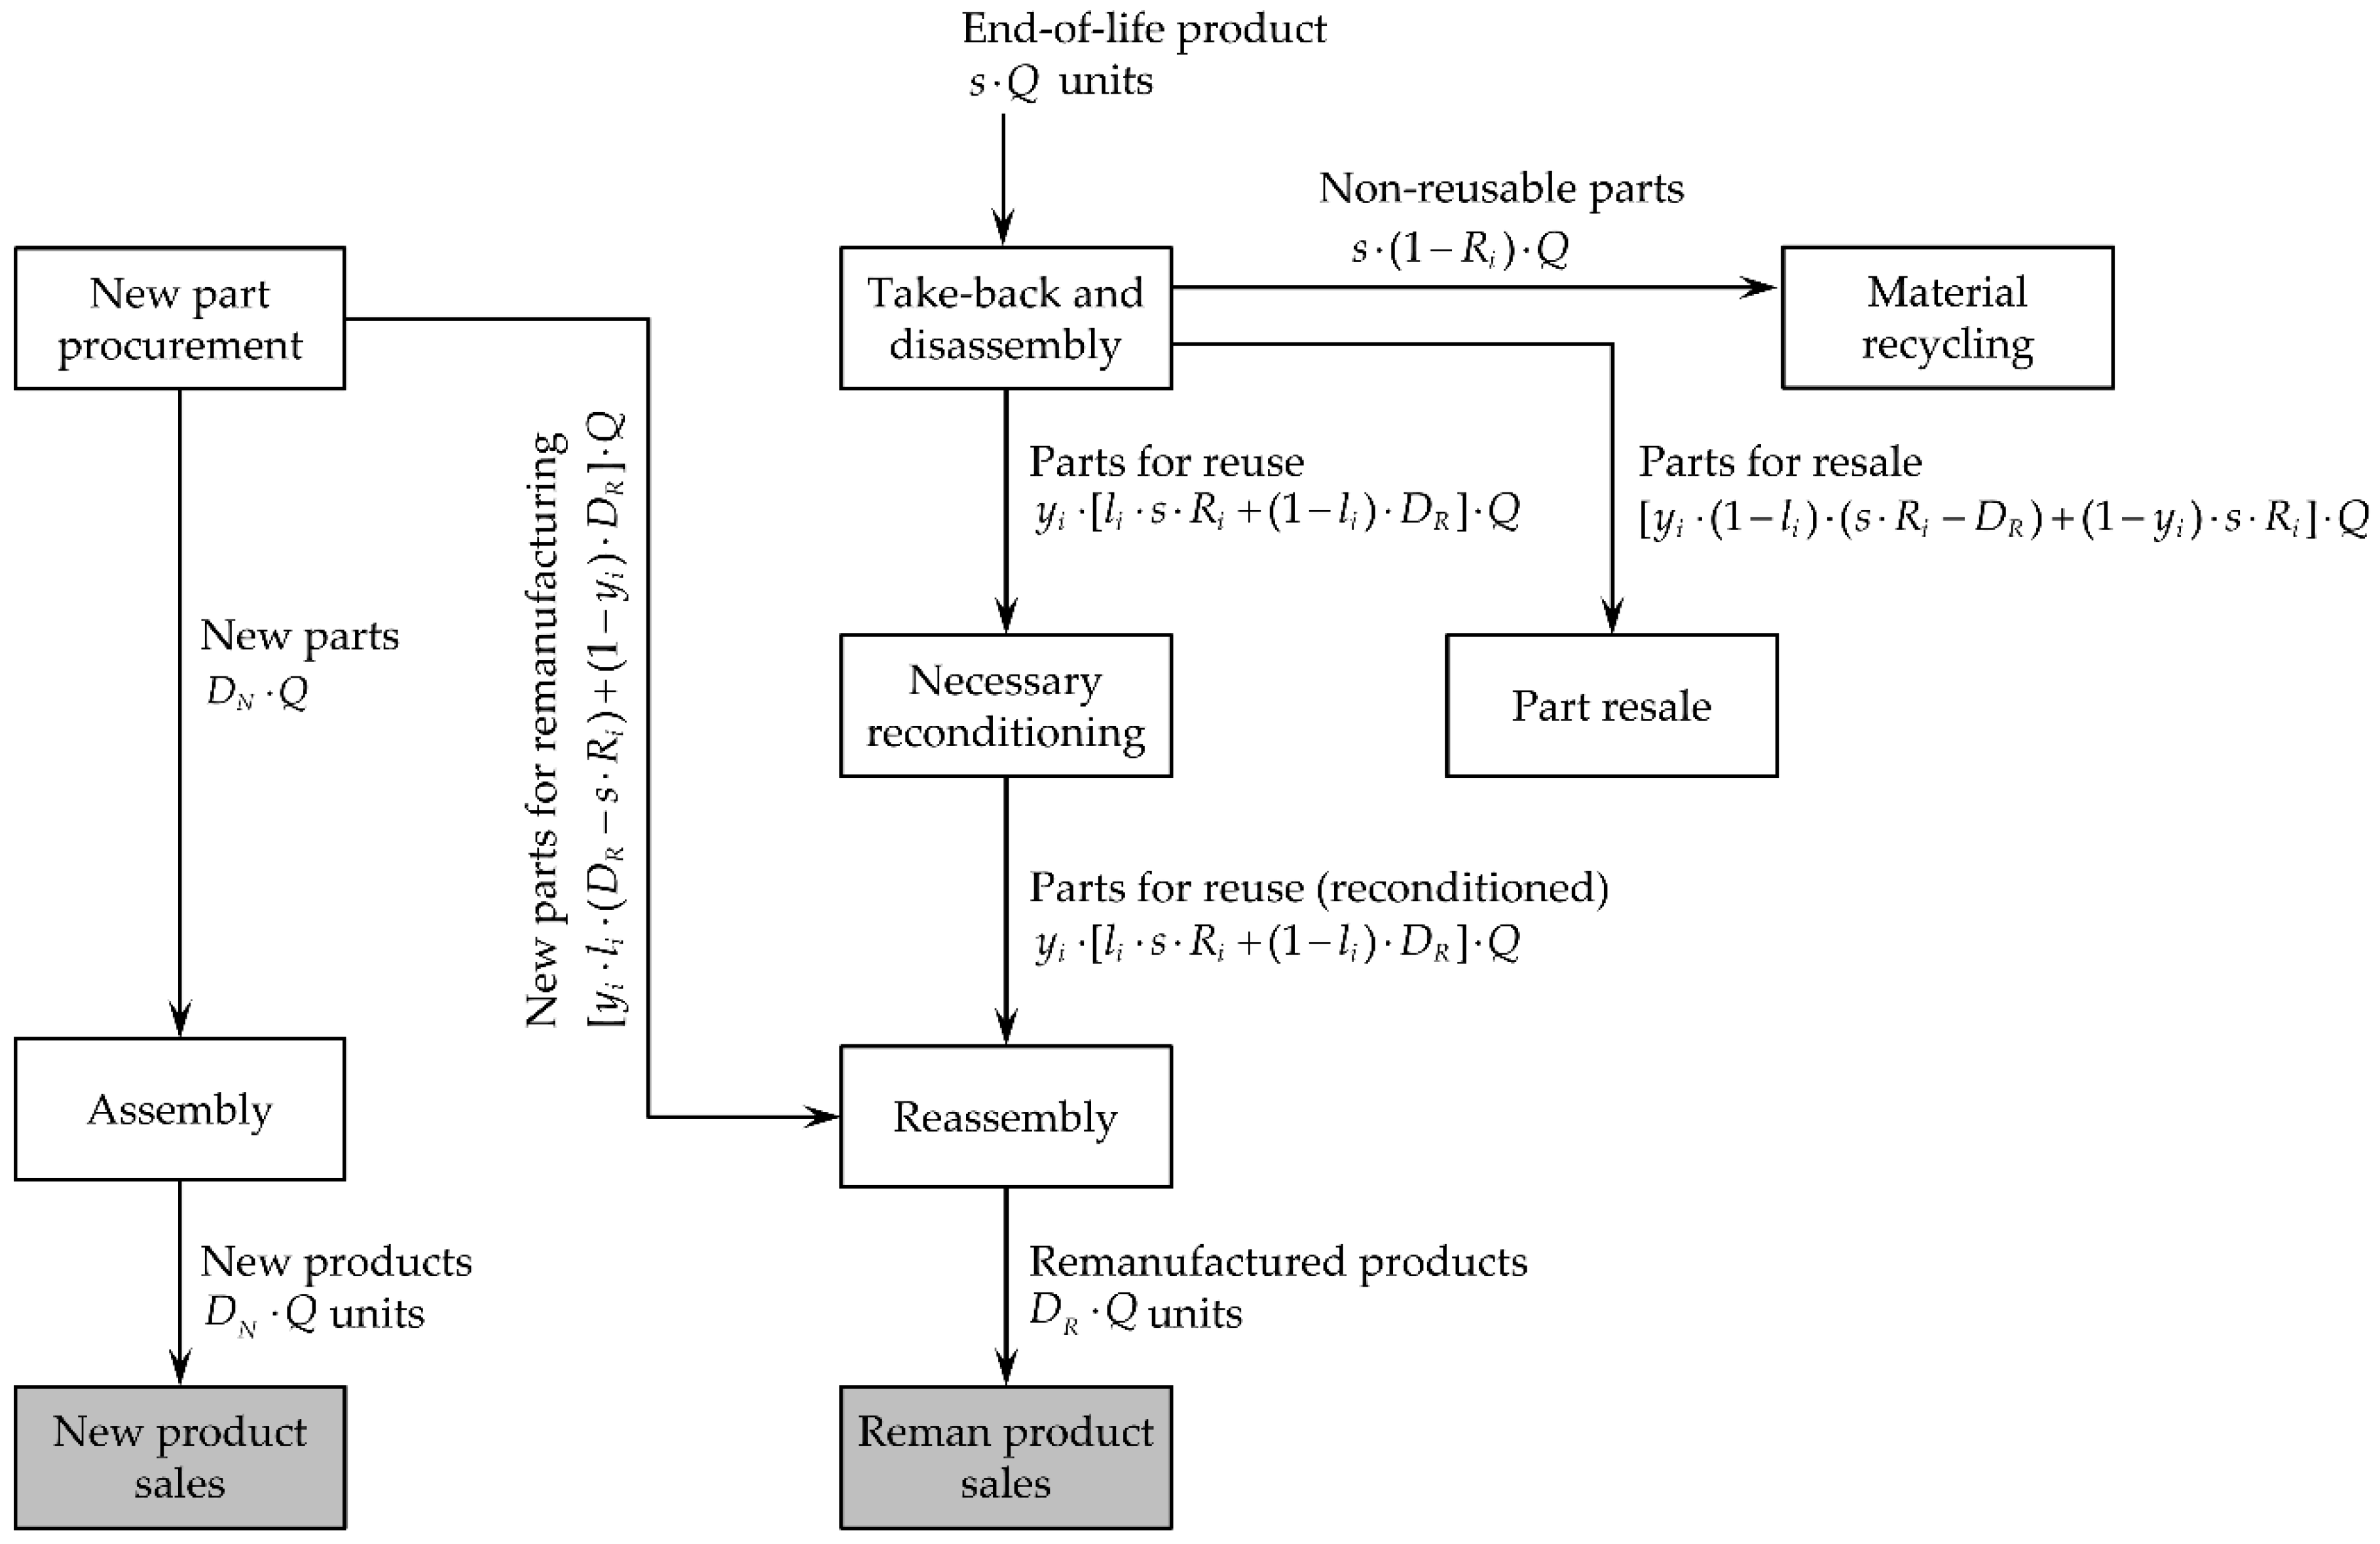
Figure 4 describes the entire process of manufacturing a line of new and remanufactured products. The material flows are represented as functions of decision variables. With that, the mathematical model can be modeled as Equations (1)–(6).
Equation (1) shows the objective functions of maximizing the total profit (i.e., f1) and maximizing the total market share (i.e., f2). The market share of the new (i.e., DN) and remanufactured products (i.e., DR) are affected by design specifications and selling prices. Well-known demand modeling techniques, such as discrete choice analysis and conjoint analysis, can help define the demand functions, fN and fR.
Equations (2)–(6) formulate the constraints of the model. Equation (2) formulates upgrade decisions and related constraints. The remanufactured product should reuse at least one part in order to maintain its identity as a remanufactured product. Equation (3) stipulates that the remanufacturing quantities should not exceed the supply of the end-of-life product. The sufficiency of the reusable parts is also checked for each part i, and the value of indicator variable li is determined accordingly. Equation (4) formulates the environmental impact of manufacturing and stipulates that the total impact not exceed the upper limit Ecritical determined by the decision-maker. By decreasing Ecritical, the decision-maker can increase the environmental sustainability of the business. Assuming that the decision-maker is a for-profit corporation, Equation (5) stipulates that the total profit is nonnegative. Equation (6) represents variable conditions.
2.3. The Model for Bi-Objective Optimization
In order to simultaneously deal with two objectives (i.e., maximizing the total profit and the total market share), this paper uses the ε-constraint approach [21,22]. The ε-constraint approach reformulates a bi-objective problem in Equation (7) as Equation (8), where the second objective f2(x) is incorporated into the constraint part of the model and is bounded from below by ε. The lower bound ε is set by a two-step approach. First, calculate the two extremes of the efficient frontier by solving Equation (7) with only one objective at a time (i.e., first, maximizing the profit, and next, maximizing the market share); this gives the range of f2, i.e., the lower bound f2(x1*) and the upper bound f2(x2*). Next, identify different points on the efficient frontier by progressively increasing the η value from 0 to 1. If η = 0, the resulting optimum of Equation (8) is the same as the independent maximum of f1. If η = 1, the resulting optimum is identical to the independent maximum of f2.
3. Case Illustration and Discussion
3.1. Case Description
To demonstrate the applicability and the effectiveness of the proposed model, this section presents an example using desktop computers, a representative modular product. The desktop computer consists of seven parts, and detailed product information is assumed based on the work of Kwak and Kim (2015) [11], as shown in Table 2 and Table 3.
Table 2 shows the parameter settings about the end-of-life product and the manufacturing costs. In the table, ϕi is the parameter representing the market value depreciation of part i due to the technological obsolescence, and αi is the parameter representing the market value discount of used part i. Equation (9) shows the value depreciation function [23] applied in this study; the function assumes that a part’s market value depreciates exponentially with its generational difference. The table also shows the recycling value of part i, i.e., Mimatl(xi) which is assumed to be the same regardless of the part specification. Other processing costs, cforward, creverse, and cirecond are assumed to be $35, $28.5, and $1, respectively.
In terms of the environmental impact parameters, carbon emissions to air in the unit of metric tons (tonnes) of carbon dioxide equivalent (i.e., CO2 equivalent) are considered. The initial upper limit for the environmental impact is set arbitrarily high in order to identify the profit maximum and market-share maximum first, and later takes progressively lower values for environmental considerations. Table 3 shows the environmental impact parameters used in this case study. In addition, eforward and ereverse are assumed to be 5.3 and 0.658 kg CO2 equivalent, respectively.
The total market size Q and the relative size of the supply of the end-of-life product s (in ratio to Q) are assumed to be 10,000 and 0.1, respectively. Table 4 summarizes the assumptions of the customers in the target market. The market consists of three market segments with different preference structures. Segment 1 represents a group of customers who strongly care about advanced technological performance. It accounts for 30% of the market. Segment 2 constituting 60% of the market is a group of customers who consider performance and price equally to be important. Segment 3 (30% of the market) represents a group of customers who care about low price above all. The numbers in each segment column show the part-worth utility assumed for the design specifications and selling price. The ‘Critical’ column provides the critical values for xNi, xRi, pN, and pR, i.e., the maximum generational differences and selling prices that customers are willing to accept for a product (i.e., δcritical,i, pcritical). For instance, no customer will buy a product if the CPU is more than three generations old or if the selling price is more than $1,200.
Equation (10) shows the demand models assumed for the target market. In this paper, the market share DN and DR are assumed based on a conditional multinomial logit model, where WNj, WRj, and Wkj denote segment j’s utility for the new, the remanufactured, and the competing product k, respectively; qj denotes the size of segment j in proportion to Q (i.e., 0.3, 0.6, and 0.1 for Segments 1, 2, and 3, respectively); and γj denotes a utility scaling parameter of segment j for the logit model (assumed to be 9.52, 17.62, and 7.47 for Segments 1, 2, and 3, respectively). In the equation, each utility is taken as a linear weighted sum of the normalized generational differences and selling prices, where the weight wij and wprice,j denote the part-worth utility assumed for segment j. For the remanufactured product, ρj is applied to discount the total utility. It is assumed to be 0.7 for all segments.
Table 5 shows detailed information about the competitors: Their design specifications (in terms of generational difference), selling prices, and the current market shares. Three competitors exist, each representing a high-spec desktop (Competitor 1), a medium-spec desktop (Competitor 2), and a low-spec desktop (Competitor 3), respectively.
The rest of the case study is organized as follows. Section 3.2 and Section 3.3 consider the two objectives of profit maximization and market-share maximization one by one. Section 3.4 considers both objectives simultaneously using a bi-objective optimization and analyzes whether the optimal product line can increase both profit and market share, given an environmental limit.
3.2. Result 1: Profit Maximization
Table 6 shows the optimization result with the objective of maximizing the total profit. In order to see the effect of incorporating remanufacturing and part resale, the table compares the results of five different recovery strategies, defined below. The proposed model can easily represent each case with small changes in the constraints.
- Scenario NRW (new and remanufactured products with part resale): The firm produces a product line of new and remanufactured products and sells leftover reusable parts to the second-hand part market. This scenario is the main scenario of interest in this paper.
- Scenario NO (new only): The firm produces only a new product. End-of-life products are collected but are all recycled. This scenario is the baseline case, i.e., the main comparison target showing the value of remanufacturing business.
- Scenario NRO (new and remanufactured products without part resale): The firm produces a product line of new and remanufactured products but conducts no part resale. This scenario allows one to see the effect of part resale on the optimal product line.
- Scenario NFW (new and refurbished products with part resale): The firm produces a product line of new and refurbished products and sells leftover reusable parts. For the refurbished products, no part upgrade is considered; the original design is maintained. This scenario reveals the value of upgrade in remanufacturing.
- Scenario NFO (new and refurbished products without part resale): The firm produces both new and refurbished products without part resale.
Table 6 shows that Scenario NRW, offering both new and remanufactured products with part resale, is the most profitable option for the firm. Compared to the baseline case (Scenario NO), the profit increases by 13.4%, and the market share also increases by 1% despite the cannibalization of new product sales. Decreased manufacturing cost is an additional benefit.
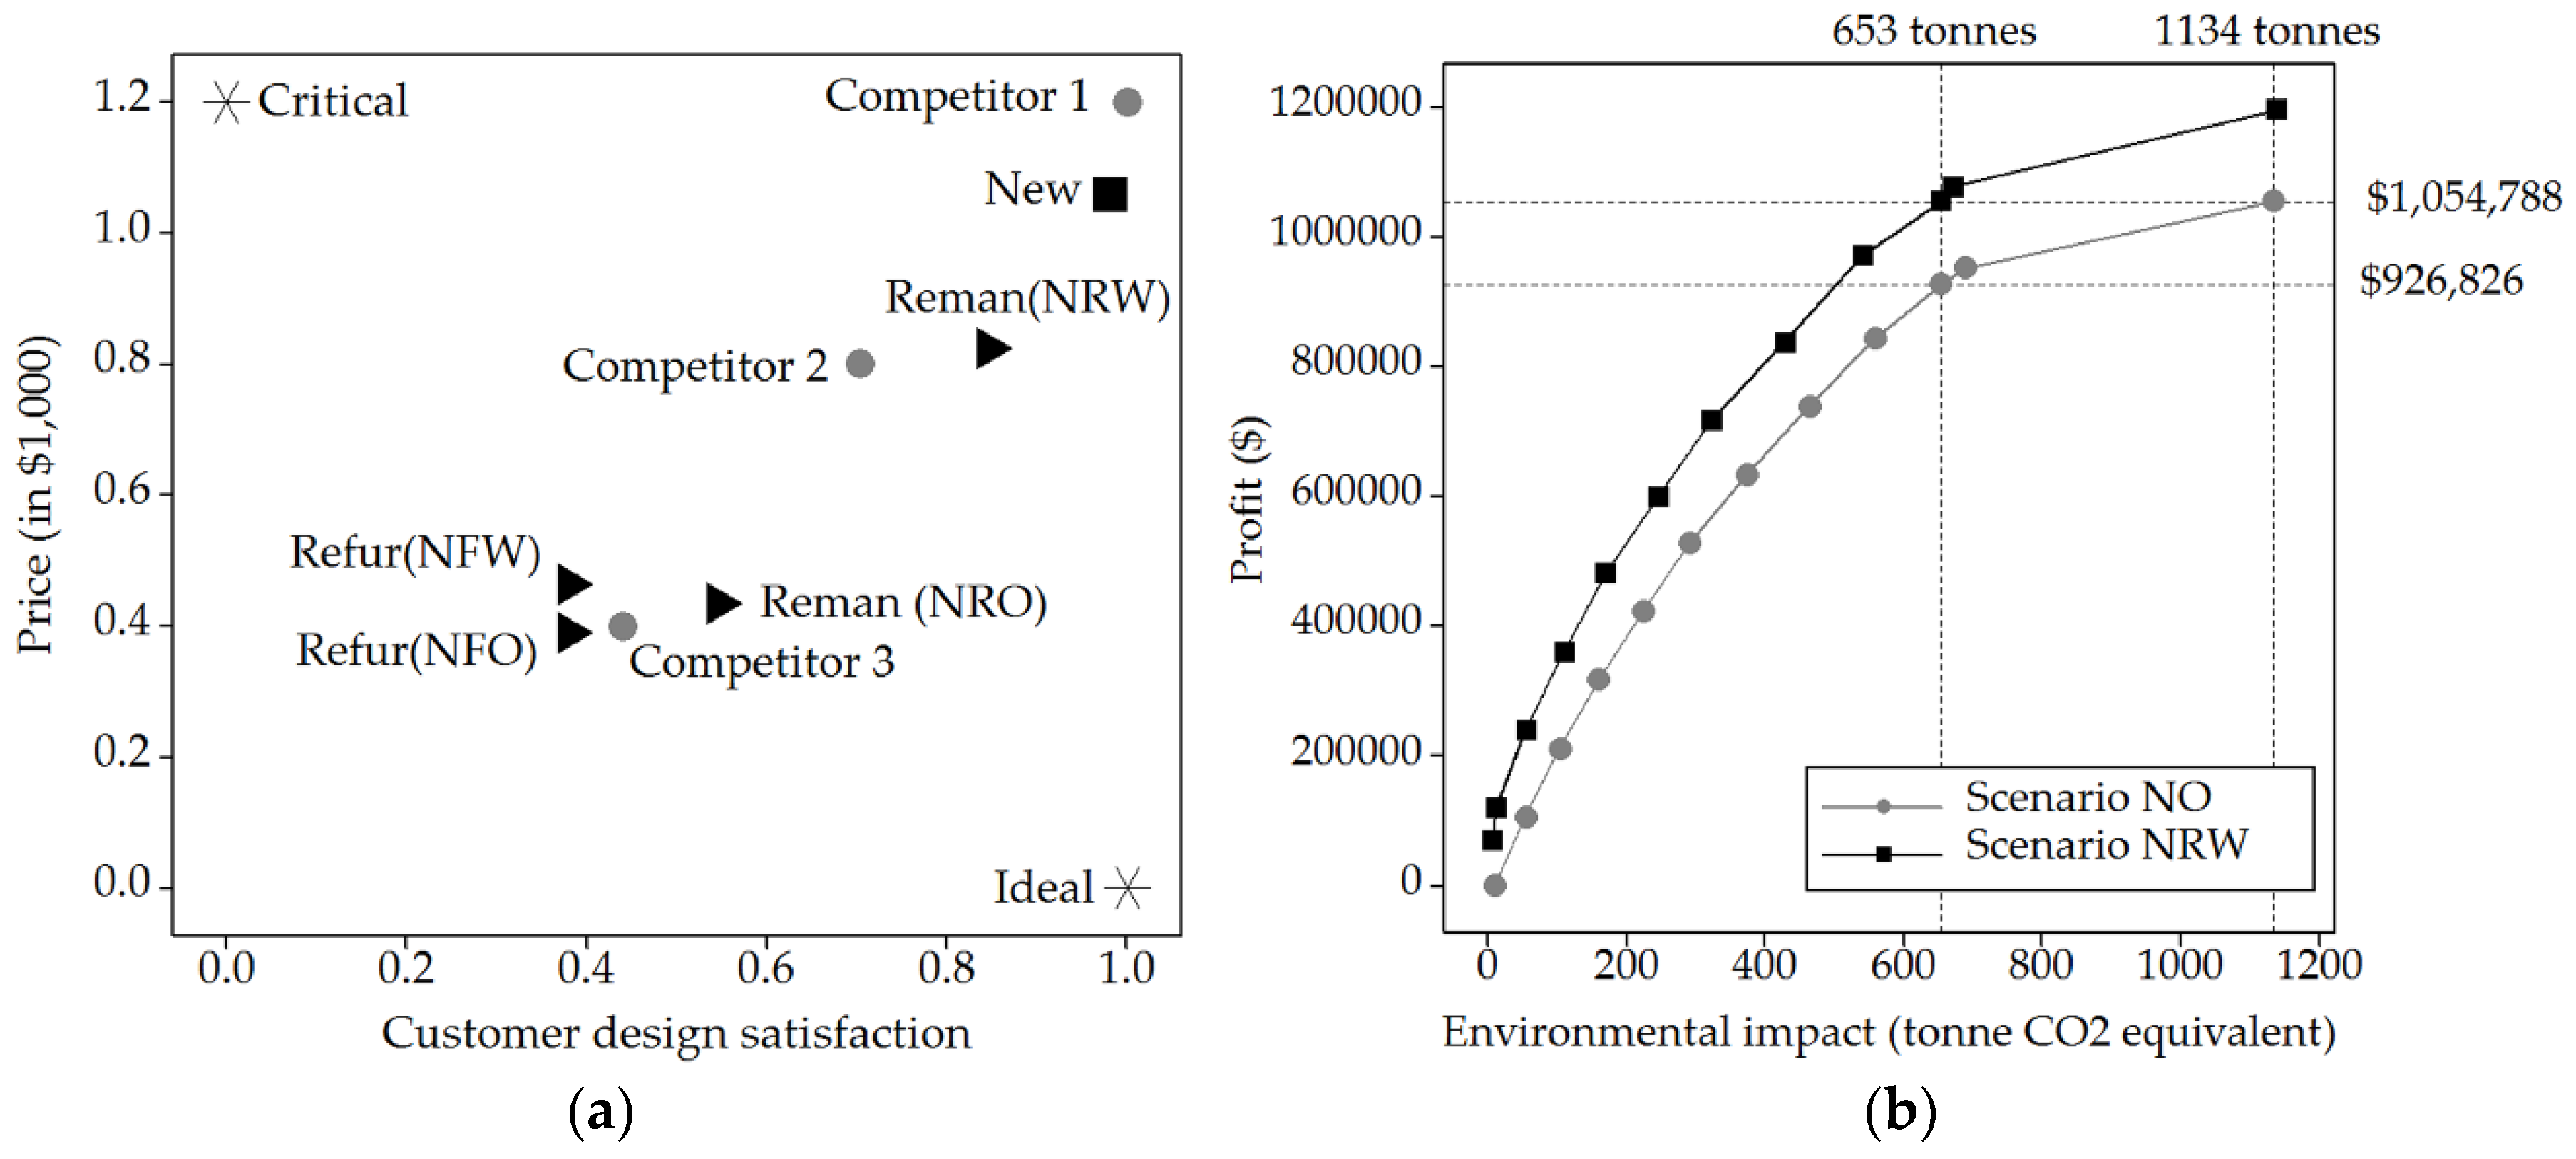
The results also imply that an upgrade in remanufacturing is a valuable choice. The optimal design for the remanufactured product is to upgrade the CPU, RAM, and motherboard to match current cutting-edge parts. Compared to Scenario NFW, in which an upgrade is not considered, the upgrade brings about a profit increase of approximately $28,000. Part resale seems to be one factor enabling and facilitating such upgrades in remanufacturing. When part resale is unavailable (Scenario NRO), part reuse attracts more interest than resale, and the design specifications of the remanufactured product tend to be set lower than those of Scenario NRW. In order to reuse more parts, the model is likely to prefer maintaining the original specifications. The selling price becomes cheaper and increases the demand for the remanufactured product, thus increasing the amount of reuse in turn. For a similar reason, the selling prices decrease between Scenarios NFO and NFW. Figure 5a helps to compare the optimal solutions of the five scenarios in terms of the design specifications and the selling price; it shows that Scenario NRW achieves greater profit with a better (medium-spec) design.
Considering the environmental impact reveals another advantage of Scenario NRW. The environmental impact of the profit maximum was 1139 tonnes. Starting from that, by progressively lowering the limit of the environmental impact, different (greener) optimums with reduced environmental impacts appear and create an efficient frontier, as shown in Figure 5b. Figure 5b compares the efficient frontiers of Scenarios NO and NRW from the profit and the environmental impact perspectives. The result shows that Scenario NRW can achieve “green profit”, i.e., higher profit with reduced environmental impact, as compared to Scenario NO. For example, Scenario NO can achieve the maximum profit of $1,054,788, and this accompanies an environmental impact of about 1130 tonnes of CO2 equivalent. However, scenario NRW can achieve the same amount of profit at a reduced impact of 653 tonnes of CO2 equivalent. For Scenario NO, the maximum profit achievable by taking the same amount of environmental impact is only $926,829.
3.3. Result 2: Market-Share Maximization
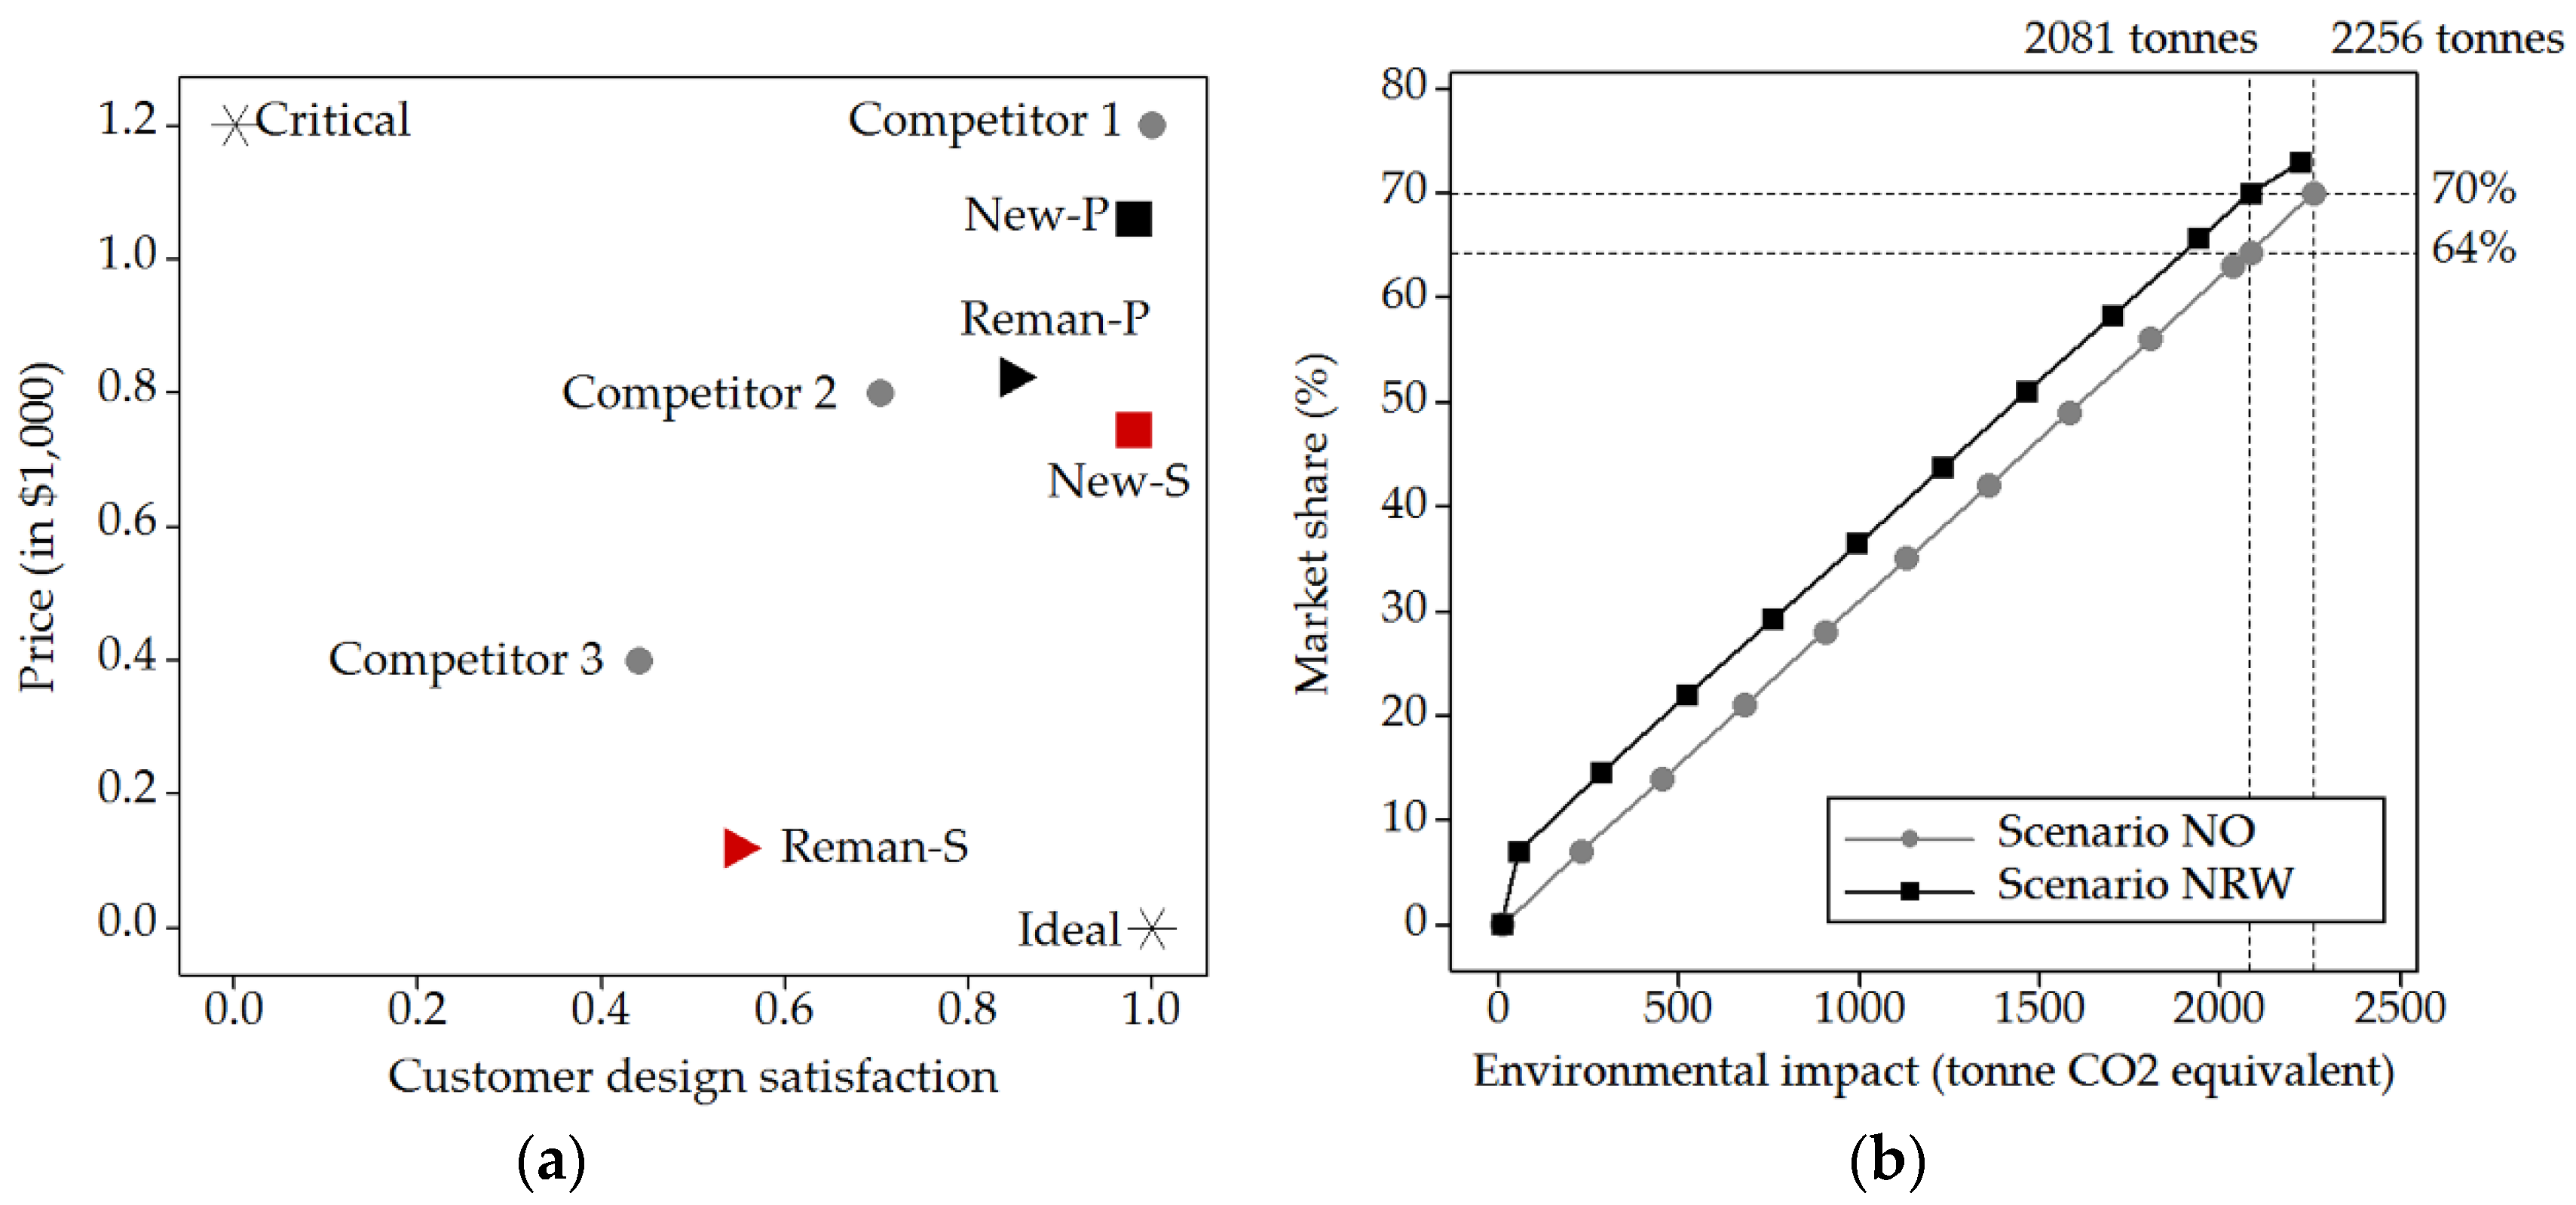
Table 7 shows the optimization results under the objective of maximizing the total market share. Figure 6a compares the optimal line design for market-share maximization (i.e., New-S, Reman-S) with the previous result from profit maximization (i.e., New-P, Reman-P). In an effort to increase the market share, selling prices are set lower than the profit maximization case. For the new product, the selling price changes from $1060 to $740, and for the remanufactured product, the selling price drops from $820 to $120. Although the design specifications of the new product remain the same, the solution for the remanufactured product shows differences between the two objectives. In market-share maximization, the model prefers more part reuse than upgrade. Upgrade is determined only for the RAM, the cheapest part with the highest part-worth utility in this desktop example. This result seems reasonable considering the cost burden of upgrade and the low selling price.
Market-share maximization can be restated as maximizing the production quantity. The firm needs to consume more materials and energy in manufacturing, which leads to an increased environmental impact. For instance, Scenario NRW accompanies 2221 tonnes of CO2 equivalent to achieve the maximum market share, 73%. The impact is still below the upper limit of 2500 tonnes, but it seems very high compared to the profit maximization case. Likewise, the increased environmental impact seems inevitable for the maximum market share. Figure 6b, however, shows that Scenario NRW has an advantage over Scenario NO in this regard.
In Figure 6b, Scenario NO should take 2256 tonnes of CO2 equivalent to achieve the maximum market share of 70%. Scenario NRW, however, can achieve the same market share with a reduced environmental impact of 2081 tonnes of CO2 equivalent. In other words, when allowing the maximum impact of 2081 tonnes of CO2 equivalent, Scenario NRW can increase the market share up to 70%, while Scenario NO can only reach up to 64%. The efficient frontiers of Scenarios NO and NRW in Figure 6b imply that Scenario NRW has unlimited opportunities for increasing market share with reduced environmental impact. (This does not mean that Scenario NRW always has such opportunities in all business cases. However, if any opportunities exist, the proposed model can reveal them effectively.)
3.4. Result 3: Profit and Market-Share Maximization
Profit maximization and market-share maximization are both well-known marketing objectives, and a firm may want to consider both profit and market share when deciding whether or not to remanufacture their products. The bi-objective optimization proposed in this paper can be an effective decision support tool in this regard. The firm can compare Scenarios NO and NRW to determine which one is better from the two perspectives. It is also possible to identify an optimal line design that corresponds to the best point on the efficient frontier (i.e., the best combination of profit and market share) for the firm.
Figure 7 depicts the results of the bi-objective optimization when the environmental impact target is 2000 tonnes of CO2 equivalent. The efficient frontiers of Scenarios NO and NRW imply that the firm has many opportunities to simultaneously improve both profit and market share by conducting remanufacturing. To be more specific, if the firm chooses Scenario NO, the maximum profit the firm can achieve is $1,054,788 and the expected market share is 35%; a maximum market share of 62% is also achievable if the firm prefers maximizing the market share rather than the total profit. However, if the firm chooses Scenario NRW, the firm can maximize the profit to $1,196,416, or maximize the market share to 67%. It is also possible to make the maximum profit of Scenario NO while achieving a greater market share of 50%. In this particular case, Scenario NRW exceeds Scenario NO, and the proposed model can help clarify such opportunities of higher profit and market share.
4. Conclusions
In order to support OEMs who produce both new and remanufactured products, this paper presented a mixed-integer programming model for designing an optimal line of new and remanufactured products. Considering the two marketing objectives of maximizing the total profit and maximizing the total market share, the proposed model simultaneously optimizes design specifications, selling prices, and production quantities, and the detailed production plan for the new and remanufactured products. The model contributes to the literature in three ways: (1) the model conducts design optimization, pricing, and production planning of the new and the remanufactured products in an integrated manner; (2) the model considers an upgrade possibility in remanufacturing; and (3) the model stipulates that the total environmental impact of manufacturing remains below a certain limit and helps improve the environmental sustainability of the decision. The proposed model can help firms overcome the two major challenges in OEM remanufacturing: Cannibalization of new product sales, and the technological obsolescence of used products.
To validate the applicability and effectiveness of the model, this paper presented a case study using the example of desktop computers. Three analyses were discussed in the case study: First, with the objective of profit maximization, the case of offering the line of new and remanufactured products (Scenario NRW) was compared with the case of producing brand-new products only (Scenario NO); second, the other objective of market-share maximization was considered to see which scenario has a greater potential for market share; finally, the two marketing objectives were considered at the same time using a bi-objective optimization in order to analyze whether the optimal product line can increase both profit and market share, given an environmental limit.
The case study demonstrated that remanufacturing can be an effective strategy for a firm to achieve both economic profitability and environmental sustainability. Despite the cannibalization of the new product sales, embracing remanufacturing achieved a higher profit and a greater market share with reduced environmental impact. Scenario NRW dominated Scenario NO in all three analyses and showed that there exist multiple opportunities for “green profit” and “green market share.” Upgrading in remanufacturing was revealed as one factor that maximizes the potential of remanufacturing. The results of the case study do not mean that such profit and market-share opportunities always are available, or that incorporating remanufacturing is always a good choice. It depends on the business case. However, if any opportunities exist, the proposed model can help reveal them and can assist in the OEM’s decision-making.
The current model considers only a single period and ignores the effects of current decisions on the next period. In the future, the model can be improved for multi-period planning by including future effects. Uncertainty consideration is another possibility for future research. Many parameters in the optimal line design are stochastic and uncontrollable in reality. A stochastic model can be developed in the future to deal with such uncertainties. Demand modeling was beyond the scope of this paper, but it is a critical element for the success of the proposed model. More research is needed in the future to clarify how the market responds to the pricing decisions. The current model also did not consider the case in which the competitors change their product line design in response to the OEM’s optimal decisions. Game theory can be utilized in the future to better reflect competition among firms.
Funding
This research at Soongsil University was supported by Basic Science Research Program through the National Research Foundation of Korea (NRF) funded by the Ministry of Science, ICT & Future Planning (NRF-2016R1C1B2014155).
Conflicts of Interest
The author declares no conflict of interest. The founding sponsors had no role in the design of the study; in the collection, analyses, or interpretation of data; in the writing of the manuscript, and in the decision to publish the results.
References
- Kwak, M. Green Profit Design for Lifecycle. Ph.D. Thesis, University of Illinois at Urbana-Champaign, Urbana, IL, USA, 2012. [Google Scholar]
- Kwak, M.; Kim, H. Green Profit Maximization through Integrated Pricing and Production Planning for a Line of New and Remanufactured Products. J. Clean. Prod. 2017, 142, 3454–3470. [Google Scholar] [CrossRef]
- Seuring, S.; Müller, M. From a Literature Review to a Conceptual Framework for Sustainable Supply Chain Management. J. Clean. Prod. 2008, 16, 1699–1710. [Google Scholar] [CrossRef]
- Ijomah, W.L. A Model-Based Definition of the Generic Remanufacturing Business Process. Ph.D. Thesis, University of Plymouth, Plymouth, UK, 2002. [Google Scholar]
- Hatcher, G.D.; Ijomah, W.L.; Windmill, J.F.C. Design for Remanufacture: A Literature Review and Future Research Needs. J. Clean. Prod. 2011, 19, 2004–2014. [Google Scholar] [CrossRef]
- Atasu, A.; Guide, D.R.; Wassenhove, L.N.V. So What If Remanufacturing Cannibalizes My New Product Sales? Calif. Manag. Rev. 2010, 52, 56–76. [Google Scholar] [CrossRef]
- Guide, V.D.R.; Li, J. The Potential for Cannibalization of New Products Sales by Remanufactured Products. Decis. Sci. 2010, 41, 547–572. [Google Scholar] [CrossRef]
- Ferguson, M.E.; Toktay, L.B. The Effect of Competition on Recovery Strategies. Prod. Oper. Manag. 2006, 15, 351–368. [Google Scholar] [CrossRef]
- Kurilova-Palisaitiene, J.; Sundin, E.; Poksinska, B. Remanufacturing Challenges and Possible Lean Improvements. J. Clean. Prod. 2018, 172, 3225–3236. [Google Scholar] [CrossRef]
- Ma, J.; Kwak, M.; Kim, H.M. Demand Trend Mining for Predictive Life Cycle Design. J. Clean. Prod. 2014, 68, 189–199. [Google Scholar] [CrossRef]
- Kwak, M.; Kim, H. Design for Life-Cycle Profit with Simultaneous Consideration of Initial Manufacturing and End-of-Life Remanufacturing. Eng. Optim. 2015, 47, 18–35. [Google Scholar] [CrossRef]
- Aydin, R.; Kwong, C.K.; Ji, P. Coordination of the Closed-Loop Supply Chain for Product Line Design with Consideration of Remanufactured Products. J. Clean. Prod. 2015, 114, 286–298. [Google Scholar] [CrossRef]
- Vorasayan, J.; Ryan, S.M. Optimal Price and Quantity of Refurbished Products. Prod. Oper. Manag. 2006, 15, 369–383. [Google Scholar] [CrossRef]
- Atasu, A.; Sarvary, M.; Wassenhove, L.N.V. Remanufacturing as a Marketing Strategy. Manag. Sci. 2008, 54, 1731–1746. [Google Scholar] [CrossRef]
- Ferrer, G.; Swaminathan, J.M. Managing New and Differentiated Remanufactured Products. Eur. J. Oper. Res. 2010, 203, 370–379. [Google Scholar] [CrossRef] [Green Version]
- Ovchinnikov, A. Revenue and Cost Management for Remanufactured Products. Prod. Oper. Manag. 2011, 20, 824–840. [Google Scholar] [CrossRef]
- Zhou, L.; Gupta, S.M.; Kinoshita, Y.; Yamada, T. Pricing Decision Models for Remanufactured Short-Life Cycle Technology Products with Generation Consideration. Procedia CIRP 2017, 61, 195–200. [Google Scholar] [CrossRef]
- Aydin, R.; Kwong, C.K.; Ji, P. A Novel Methodology for Simultaneous Consideration of Remanufactured and New Products in Product Line Design. Int. J. Prod. Econ. 2015, 169, 127–140. [Google Scholar] [CrossRef]
- Steeneck, D.W.; Sarin, S.C. Pricing and Production Planning for Reverse Supply Chain: A Review. Int. J. Prod. Res. 2013, 51, 6972–6989. [Google Scholar] [CrossRef]
- Kwak, M.; Kim, H. Market Positioning of Remanufactured Products with Optimal Planning for Part Upgrades. J. Mech. Des. 2013, 135, 011007. [Google Scholar] [CrossRef]
- Andersson, J. A Survey of Multiobjective Optimization in Engineering Design; Technical Report LiTH-IKP-R-1097; Linköping University: Linköping, Sweden, 2000. [Google Scholar]
- Mavrotas, G. Effective Implementation of the Ε-Constraint Method in Multi-Objective Mathematical Programming Problems. Appl. Math. Comput. 2009, 213, 455–465. [Google Scholar] [CrossRef]
- Kwak, M.; Kim, H.M. Modelling Time-Varying Value of an End-of-Life Product for Design for Recovery. In Proceedings of the 18th International Conference Engineering Design (ICED 11), Copenhagen, Denmark, 15–19 August 2011. [Google Scholar]
Figure 1.
Problem description of the model.

Figure 2.
Designing an optimal line of new and remanufactured products: Simultaneous optimization of design specifications, selling price, and production plan.
Figure 2.
Designing an optimal line of new and remanufactured products: Simultaneous optimization of design specifications, selling price, and production plan.

Figure 3.
Part upgrade decisions in remanufacturing and their implications on the remanufacturing process (adopted and revised from [20]).
Figure 3.
Part upgrade decisions in remanufacturing and their implications on the remanufacturing process (adopted and revised from [20]).

Figure 4.
Flows in the manufacturing process represented as functions of decision variables.

Figure 5.
Optimization results for profit maximization: (a) Optimal market position and differences between recovery strategies; (b) efficient frontiers of Scenarios NO and NRW and revealed opportunities for increasing profit with less environmental impact.
Figure 5.
Optimization results for profit maximization: (a) Optimal market position and differences between recovery strategies; (b) efficient frontiers of Scenarios NO and NRW and revealed opportunities for increasing profit with less environmental impact.

Figure 6.
Optimization results for market-share maximization: (a) Optimal market position (i.e., New-S, Reman-S) and comparison with the profit maximization case (i.e., New-P, Reman-P); (b) efficient frontiers of Scenarios NO and NRW and revealed opportunities for increasing market share with less environmental impact.

Figure 7.
The efficient frontiers of Scenarios NO and NRW and revealed opportunities for increasing profit and market share simultaneously.
Figure 7.
The efficient frontiers of Scenarios NO and NRW and revealed opportunities for increasing profit and market share simultaneously.


Table 1.
Mathematical notations.
| Notation | Description |
|---|---|
| Index for part | |
| Index for the new (=N) and the remanufactured (=R) products, respectively | |
| Profit from selling the new and the remanufactured products, respectively | |
| Revenue from selling the remanufactured product | |
| Revenue from selling the leftover parts not being used in remanufacturing | |
| Revenue from selling the non-reusable parts for material recycling | |
| Cost of purchasing new spare parts for remanufacturing | |
| Cost of entire remanufacturing operations | |
| Market value of a new part i with generational difference xRi | |
| Resale value of a used, reusable part i with generational difference δi | |
| Recycling value of a part i with generational difference δi | |
| Cost of assembling and marketing a unit of the new and the remanufactured product | |
| Cost of taking back and disassembling a unit of end-of-life product | |
| Cost of reconditioning a unit of part j | |
| Specification of part i of the new and the remanufactured products, respectively (in terms of generational difference) | |
| Selling price of the new and the remanufactured products, respectively | |
| Binary variable indicating whether part i of the remanufactured product maintains its original specification (=1) or upgrades its specification (=0) | |
| Binary variable indicating whether part i needs new part purchase (=1) or not (=0) | |
| Generational difference of part i being newly decided for a design upgrade | |
| Generational difference of part i of the end-of-life product at the time of interest | |
| Reusability of part i of the end-of-life product at the time of interest | |
| Target market size (in units of product) | |
| Market share of the new and the remanufactured products, respectively (in ratio to Q) | |
| Supply size of the end-of-life product, in ratio to the target market size Q | |
| Environmental impact of manufacturing the new and the remand product, respectively | |
| Upper limit for the total environmental impact | |
| Environmental impact of purchasing a new part i with generational difference xRi | |
| Environmental impact of reselling a used part i with generational difference δi | |
| Environmental impact of recycling part i with generational difference δi | |
| Environmental impact of assembling and marketing a unit of product | |
| Environmental impact of taking back and disassembling a unit of end-of-life product | |
| Environmental impact of reconditioning a unit of part j | |
| Critical (max.) generational difference of part i | |
| Critical (max.) selling price of the new and the remanufactured product |
Table 2.
Parameter settings about the end-of-life product and the manufacturing costs [11].
Table 2.
Parameter settings about the end-of-life product and the manufacturing costs [11].
| δi | Ri | Minew(0) | ϕi | αi | Mimatl(xi) | |
|---|---|---|---|---|---|---|
| CPU | 2 | 0.8642 | $175 | 0.6733 | 0.50 | $1 |
| RAM | 2 | 0.8642 | $50 | 0.8378 | 0.50 | $0.75 |
| Motherboard | 2 | 0.7468 | $150 | 0.6733 | 0.50 | $1 |
| Hard drive | 4 | 0.7468 | $120 | 0.1717 | 0.20 | $0.5 |
| Graphic card | 4 | 0.7468 | $56 | 0.2883 | 0.50 | $0.75 |
| Optical drive | 1 | 0.5577 | $80 | 0.8088 | 0.20 | $0.75 |
| Chassis | 0 | 0.7468 | $75 | 0.1500 | 0.00 | $0 |
Table 3.
Parameter settings about the environmental impact (kg CO2 equivalent) [11].
Table 3.
Parameter settings about the environmental impact (kg CO2 equivalent) [11].
| einew(xi) | eirecond(xi) | eiused(xi) | eimatl(xi) | |
|---|---|---|---|---|
| CPU | 5.9 | 1.18 | 0.0051 | 0.0051 |
| RAM | 7.6 | 1.52 | 0.0015 | 0.0015 |
| Motherboard | 169 | 33.80 | 0.0044 | 0.0044 |
| Hard drive | 12.3 | 2.46 | 0.0035 | 0.0035 |
| Graphic card | 50.2 | 10.04 | 0.0029 | 0.0029 |
| Optical drive | 17.1 | 3.42 | 0.0023 | 0.0023 |
| Chassis | 56.2 | 11.24 | 0.0022 | 0.0022 |
Table 4.
Customer information: Part-worth utility (wij, wi,price) and critical value (δi,critical, pcritical).
Table 4.
Customer information: Part-worth utility (wij, wi,price) and critical value (δi,critical, pcritical).
| Segment 1 (30%) | Segment 2 (60%) | Segment 3 (10%) | Critical Value | |
|---|---|---|---|---|
| CPU | 0.2 | 0.125 | 0.05 | 3 |
| RAM | 0.2 | 0.125 | 0.05 | 3 |
| Motherboard | 0.16 | 0.1 | 0.04 | 3 |
| Hard drive | 0.08 | 0.05 | 0.02 | 5 |
| Graphic card | 0.04 | 0.025 | 0.01 | 5 |
| Optical drive | 0.08 | 0.05 | 0.02 | 3 |
| Chassis | 0.04 | 0.025 | 0.01 | 2 |
| Selling price | 0.2 | 0.5 | 0.8 | $1200 |
Table 5.
Competitor information.
| Competitor 1 | Competitor 2 | Competitor 3 | |
|---|---|---|---|
| CPU | 0 | 1 | 2 |
| RAM | 0 | 1 | 2 |
| Motherboard | 0 | 1 | 2 |
| Hard drive | 0 | 1 | 2 |
| Graphic card | 0 | 1 | 2 |
| Optical drive | 0 | 1 | 1 |
| Chassis | 0 | 0 | 0 |
| Selling price | $1200 | $800 | $400 |
| Market share | 37% | 23% | 40% |
Table 6.
Optimal line design for profit maximization under different recovery strategies.
| Scenario NRW | Scenario NO | Scenario NRO | Scenario NFW | Scenario NFO | |||||
|---|---|---|---|---|---|---|---|---|---|
| New | Reman | New | New | Reman | New | Refurb | New | Refurb | |
| CPU | 0 | 0 (up 1) | 0 | 0 | 2 | 0 | 2 | 0 | 2 |
| RAM | 0 | 0 (up) | 0 | 0 | 0 (up) | 0 | 2 | 0 | 2 |
| Motherboard | 0 | 0 (up) | 0 | 0 | 2 | 0 | 2 | 0 | 2 |
| Hard drive | 0 | 4 | 0 | 0 | 4 | 0 | 4 | 0 | 4 |
| Graphic card | 2 | 4 | 2 | 2 | 4 | 2 | 4 | 2 | 4 |
| Optical drive | 0 | 1 | 0 | 0 | 1 | 0 | 1 | 0 | 1 |
| Chassis | 0 | 0 | 0 | 0 | 0 | 0 | 0 | 0 | 0 |
| Selling price | $1060 | $820 | $1050 | $1060 | $430 | $1050 | $460 | $1050 | $390 |
| Market share | 33% | 3% | 35% | 33% | 4% | 34% | 2% | 34% | 2% |
| Revenue 2 | 3807.51 | 3678.62 | 3666.48 | 3746.81 | 3685.55 | ||||
| Cost 2 | 2611.09 | 2623.83 | 2515.32 | 2578.32 | 2559.84 | ||||
| Profit 2 | 1196.42 | 1054.79 | 1151.16 | 1168.48 | 1125.71 | ||||
1 Upgrade is determined for the part; 2 numbers in $1000.
Table 7.
Optimal line design for market-share maximization.
| Scenario NRW | Scenario NO | ||
|---|---|---|---|
| New | Reman | New | |
| CPU | 0 | 2 | 0 |
| RAM | 0 | 0 (up) | 0 |
| Motherboard | 0 | 2 | 0 |
| Hard drive | 0 | 4 | 0 |
| Graphic card | 2 | 4 | 2 |
| Optical drive | 0 | 1 | 0 |
| Chassis | 0 | 0 | 0 |
| Selling price | $740 | $120 | $745 |
| Market share | 67% | 6% | 35% |
| Revenue (in $1000) | 5068.93 | 5194.88 | |
| Cost (in $1000) | 5068.93 | 5194.88 | |
| Profit (in $1000) | 0.00 | 0.00 | |
© 2018 by the author. Licensee MDPI, Basel, Switzerland. This article is an open access article distributed under the terms and conditions of the Creative Commons Attribution (CC BY) license (http://creativecommons.org/licenses/by/4.0/).
Share and Cite
MDPI and ACS Style
Kwak, M. Optimal Line Design of New and Remanufactured Products: A Model for Maximum Profit and Market Share with Environmental Consideration. Sustainability 2018, 10, 4283. https://doi.org/10.3390/su10114283
AMA Style
Kwak M. Optimal Line Design of New and Remanufactured Products: A Model for Maximum Profit and Market Share with Environmental Consideration. Sustainability. 2018; 10(11):4283. https://doi.org/10.3390/su10114283
Chicago/Turabian StyleKwak, Minjung. 2018. "Optimal Line Design of New and Remanufactured Products: A Model for Maximum Profit and Market Share with Environmental Consideration" Sustainability 10, no. 11: 4283. https://doi.org/10.3390/su10114283
Note that from the first issue of 2016, this journal uses article numbers instead of page numbers. See further details here.