The Problem of Sustainable Intermodal Transportation: A Case Study of an International Logistics Company, Turkey


Department of Industrial Engineering, Faculty of Engineering, Çukurova University, Balcalı, Sarıçam/Adana 01330, Turkey
*
Author to whom correspondence should be addressed.
Sustainability 2018, 10(11), 4268; https://doi.org/10.3390/su10114268
Submission received: 2 October 2018
/
Revised: 1 November 2018
/
Accepted: 13 November 2018
/
Published: 19 November 2018
(This article belongs to the Special Issue Intermodal Transportation and Sustainable Mobility)
Abstract
:Environmental and social concerns force logistics firms to evaluate various risk factors for intermodal transportation systems. In this context, this paper takes into account economic, social, and ecological risk factors that have attracted considerable attention toward sustainable transportation. In this paper, the allocation of export containers to transportation modes, by incorporating social and ecological risks with a main focus on the minimization of transportation costs, was examined. A mixed-integer-programming-based mathematical model was proposed to decide how the containers can be allocated to different transportation modes. In addition, a fuzzy-based approach was performed to determine the social and ecological risk weights of the transportation modes within the decision process. Each mode was evaluated with social risks (e.g., human accidents and deaths) and ecological risks (e.g., emission values and noise pollution) by decision makers via the assignment of numerical scores. The obtained results show that optimal transportation modes more economical and environmentally friendly were provided by the proposed methods.
1. Introduction
In recent years, intermodal transportation problems considering social and environmental impacts besides economic criteria have gained substantial attention. Intermodal transportation can be defined as a transport of containers by multiple transport modes without any change in the container [1]. Transport mode selection, load assignment, and transport operations are taken into account, which increases the complexity of the problem. Because of that, most researchers have focused on single-mode transport systems. Road transport is the dominant mode in Turkey. Road traffic crashes and deaths cause loses of 10,000 lives every year in Turkey [2]. Emission values also grew rapidly [3] and negative impacts of exposure to these values increase in Turkey. Sustainability has attracted a growing interest in the logistics sector. Researchers have focused on more sustainable transport systems due to concerns about the environmental results of transportation [4]. Intermodal transportation has been frequently considered as more efficient and sustainable [5]. However, the intermodal transport has not verified the expectations [6]. In addition, road transportation and intermodal transportation are in competition to ensure more environmentally friendly transport [7]. Road transportation with further improvements has been evaluated as a strong competitor to intermodal transport with disruption [8]. However, modal shifts are also stimulated from road transport to rail transport to ensure reductions in externalities, including energy, emissions, noise, accidents, and congestion [9]. In the literature, capacity constraints, distance constraints, etc. are generally considered for these problems. Despite the motivation to transport goods in a timely and optimal manner, transport considering social and ecological risks is also important for human living. Human accidents, deaths, and ecological factors must be evaluated for transport problems. Transportation modes with risk problems affect both the people and the environment. Road, rail, marine, and air transportation modes are used widely in the transportation sector. In this paper, air transportation is not used for the network. Air transport is preferred with its short travel time, although it is a carbon-intensive mode [10]. The contribution of air transportation to carbon emissions is expected to increase [11]. Road transportation is more carbon-intensive in the transport sector [12]. Road transport is used especially for door-to-door transport in Turkey. However, the fossil fuel use of this transport pollutes the environment, and the emissions are dangerous for human health and nature. In addition, every year about 1.25 million lives are lost due to road accidents in Turkey [13]. Road transport also causes higher noise levels in city centers. The number of truck transports increases with new road infrastructures and leads to congestion. Rail transport with minimal costs is mostly preferred for heavy goods. This transport is not affected by environmental conditions. However, trains meet all customer demands that are combined with other transport modes. Marine transport is also preferred for its transportation of heavy goods and liquids and its minimal cost advantages. For a better and sustainable world, the design of sustainable transport systems is critical. Transportation with a minimum amount of social and ecological risk problems is required in a sustainable system. We classify the risks into two groups: social and ecological. There are sub-classes of these risk groups. The social risk group covers vehicle collisions, driver faults, traffic intensity, and route construction. The ecological risk group includes the time spent in traffic, air toxics and particles, fuel efficiency, and ecosystem preservation. Decision makers evaluate the risk groups considering these sub-classes. These groups are described with linguistic variables instead of numeric values. The fuzzification process is applied to determine the weights of the transport modes. Measuring the environmental results of the transport modes is very complex under uncertainties. This problem needs a fuzzy logic approach [14].
In this study, a fuzzy-based approach was applied to the risks to determine the weights. The weights were used to find the most optimum allocation of modes. A fuzzy approach with new risk values was first applied to an intermodal transportation problem. In this approach, risks were scored by the decision makers. A risk weight for each input was then taken as output. The outputs for each transportation mode were then taken as inputs in the objective function.
Many papers about the intermodal network have been written. These authors used exact formulations or/and heuristic algorithms [15,16,17,18,19,20,21,22]. Some studies considered cost and time for the intermodal network. A fuzzy mixed integer model was provided for a multimodal transport problem [23]. One paper is about transporting hazardous materials via multimodal transportation [24]. Other papers that consider safety, risk, and security use decision-making methods. The fuzzy analytic hierarchy, artificial neural network, Topsis, Fuzzy Delphi, Fuzzy Electre methods were used for intermodal transportation, respectively [25,26,27,28,29]. Some articles focus on sustainable supply chain solutions. A mathematical model was formulated to design a first-mile-and-last-mile supply chain. They applied Industry 4.0 technologies for more sustainable, efficient, and available management [30]. Energy efficiency was also presented to build supply chain solutions. A model was provided to determine the scheduling and assignment of last-mile delivery. A heuristic approach was developed, and the heuristic ensured energy efficiency [31]. Carbon emissions in supply chain performance were studied. Market demand was stochastic and a cap-and-trade mechanism was used [32]. A green supply chain with uncertain demand was proposed. Goal programming was developed to reduce the carbon emissions on supply chain [33]. An optimization model was developed to design a sustainable network including carbon emissions and disruption risks by a goal programming approach [34]. However, mode weights using a fuzzy approach based on risk factors have not been considered. A risk model for the rail transport was formulated to weigh cost [35]. Dangerous materials were examined based on railroad transport, and a transport risk analysis was used to evaluate the risks [36]. Intermodal transport for dangerous goods was examined to minimize the total cost and risks. Risk was calculated by population and affected people [37]. Intermodal transportation was handled with dangerous goods that cause accidents. A methodology was developed to calculate local accident data [38]. Other papers that present road transport related to risk assessment include [39,40,41,42]; rail transport papers related to risk assessment include [43,44,45,46]; intermodal transport papers related to risk assessment include [47].
The above-presented papers mainly investigate the transshipment characteristics, such as the logistics service, the green supply chain, and the transport costs, from different perspectives. However, few papers focus on the effect of risk factors on the intermodal network. This paper tries to fill the gap by considering social, economic, and environmental risks. The main contributions of this study are four-fold:
- (i)
- A new mathematical programming model considers assigning the orders to different transportation modes; a multi-product and multi-period solution was proposed to help the freight forward in strategic decisions. In addition, a modal shift was achieved from road to rail and marine, referring to [48].
- (ii)
- Minimization of transportation costs and risk factors for each transportation mode was handled simultaneously. Researchers have suggested that performance scores can be used as input to the mathematical model [49]. This is the first paper to use the outputs of the fuzzy approach as input to the mathematical model.
- (iii)
- Intermodal transportation requires both mathematical model and artificial-intelligence-based methodologies [22]. A fuzzy approach was developed to evaluate the mode weights based on social and ecological risks. Findings are compared with [50], and the results are the same. Rail is ranked as the best alternative; marine transport is better than road transport.
- (iv)
- This study includes practical implications using real data of an international logistics firm.
2. Materials and Methods
2.1. Problem
The problem considered is the allocation of orders to both the routes and the transportation modes to minimize the total cost based on risk weights. The international logistics company provides its customers with modes of transportation such as direct road transport, road and marine transport, and marine–road–rail transport. By direct road transport, containers’ flow is from customers in Turkey to customers in Europe. There are also two different modes of transport that is the combination of sea and road transport. This situation prevents the tonnage restrictions on the road in Europe. Firstly, containers are transferred from ports in Turkey to ports in Europe. Then, containers are transported by road. Finally, intermodal transport with three modes of transport is used. This is the most efficient and environmentally friendly way of transporting. Once the container has been transported by Roro ships, the container is transferred to trains and then shipped to the customers by road. Each transportation mode has some human and ecological risks. Therefore, these risks must be evaluated to assign the orders to these modes.
A transport network we deal with in our problem is shown in Figure 1. First, it is necessary to talk about the characteristics of the system studied. Accordingly, the system considered the following:
- (i)
- containers,
- (ii)
- customers,
- (iii)
- the freight forwarder,
- (iv)
- the terminal,
- (v)
- the railway station,
- (vi)
- transport modes, and
- (vii)
- risk weights of modes.
The containers are divided into exported and imported containers according to type. Such containers are called imported containers, if the containers in the terminal are expected to be transported to the demand points in the hinterland area. Conversely, if the containers in the hinterland are being transported to the terminal, they are also referred to as export containers [51]. Containers are either transferred by trucks between the customers and the port, or they are transferred via the train line connected to the station within the port. Accordingly, imported containers are transported from the terminal to the customers. Containers are also grouped as FTLF, FTLB, and LTL.
Customers in the network of the problem are also divided into two classes: import companies that import the containers from the terminal and export companies that export containers to the terminal for shipping by vessel.
While the terminal is the starting point for imported containers, it is considered the destination for export containers. It is the intermediate region for the containers to be unloaded or loaded from the ship.
The purpose of the logistics forwarder is to distribute all the containers by providing the capacity constraints specified for the containers based on the risk weights and to minimize the total transport costs of the modes.
The general characteristics of the problem are summarized below:
- (i)
- import–export containers,
- (ii)
- multiple ports,
- (iii)
- multiple customers,
- (iv)
- multiple stations, and
- (v)
- a known demand for the containers in each period.
An optimization-based decision support system will be developed for transporting orders in Eastern Europe, using the Roro, Truck, or Truck–Train transport combinations.
Transportation modes to be examined within this model are as follows:
- Roro + Train: For export operations, transportation is from Turkey ports to the Trieste port with Roro and then to Ostrava by train.
- Roro + Truck: For export operations, transportation is from Turkey ports to the Trieste port with Roro and then to Ostrava, Bratislava, and Poland with trucks.
- Truck: Transport is from Turkey to Ostrava, Bratislava, and Poland with trucks.
The objective function of the problem is as follows:
- Minimization of the total transportation costs based on risk weights.
Decision variables of the problem:
- (i)
- Container transport mode that gives the minimum total cost and minimum risk.
The assumptions in the problem are as follows:
- (ii)
- for export operations, the activities of the logistics company in Turkey are not considered in the proposed model;
- (iii)
- demands are deterministic and known;
- (iv)
- the time and costs of loading/unloading and packing/unpacking are neglected.
2.2. The Mathematical Model Approach
This stage includes the assignment of the orders to the transportation modes and routes. The notation used for mathematical modeling of the problem is as follows:
Indices
i: facility points in Turkey (i ∈ I)
j: transfer points (j ∈ J)
m: demand points (m ∈ M)
p: containers (p ∈ P)
a: transportation modes (a ∈ A)
t: periods (t ∈ T)
Parameters
Dpmt: demands for container p of point m at period t(unit)
TC1ima: transportation cost from point i to point m by mode a (money/unit)
TC2ija: transportation cost from point i to point j by mode a (money/unit)
TC3jma: transportation cost from point j to point m by mode a (money/unit)
Capima: transportation capacity from point i to point m by mode a (money/unit)
Capija: transportation capacity from point i to point j by mode a (money/unit)
Capjma: transportation capacity from point j to point m by mode a (money/unit)
trnsjma: transfer cost from point j to point m by mode a (money)
risk_weighta: risk values based on human and ecological risk factors of the transportation mode a (unit)
Decision Variables
Xpimat: number of container p from point i to point m by mode a at period t (export)
Xpijat: number of container p from point i to point j by mode a at period t (export)
Xpjmat: number of container p from point j to point m by mode a at period t (export)
Nuimat: vehicle numbers from point i to point m by mode a at period t (export)
Nuijat: vehicle numbers from point i to point j by mode a at period t (export)
Nujmat: vehicle numbers from point j to point m by mode a at period t (export)
Objective Function:
The objective function minimizes the sum of the total transportation costs. First part of the equation is related to road transportation. The risk weight of the road transport is evaluated as human and ecological aspects by decision makers. The risk weight of the road transport is expected to be riskier than the other transport modes. The second part of the equation is related to marine transportation. The risk weight of the marine transport is evaluated by decision makers as a human and ecological aspect. The third part of the equation is related to rail or road transportation. Either train or truck transport is chosen according to the economic and environmental factors. The final part of the equation is related to mode change. There is a cost factor from marine transport to rail or road transport.
Constraints (1) ensure the meeting of the demands. Export customers are serviced by direct road transport or intermodal transport. The sum of the number of products by road and number of products by intermodal line is equal to the demands of the export customers.
Constraints (2) ensure that the number of products from the i point to j point is equal to the number of products from the j point to the m point. This constraint is a balance constraint that ensures the number of products between the starting and final points.
Constraints (3) are related to vehicle capacity. The number of products transported between two points cannot exceed truck capacity.
Constraints (4) ensure that the number of products transported between two points cannot exceed the Roro capacity.
Constraints (5) ensure that the number of products cannot exceed the train or truck capacity.
Constraints (6) show the ranges of the decision variables.
2.3. Method
In order to obtain the best solutions, a mixed integer programming approach and a fuzzy-based approach were applied to the intermodal transportation model. The results of the methodologies may be useful for firm experts. We employed a mixed integer programming solver via General Algebraic Modeling System (GAMS) software. This method does not include any subjectivity, and the problems are solved under certain environments. The model was solved in a reasonable time limit by high-performance solvers in GAMS. The fuzzy-based approach was applied via the Matlab fuzzy logic designer. The fuzzy logic designer also lets us design our fuzzy inference system. The fuzzy logic method was applied to determine the risk weights that are inputs of the mathematical model. The fuzzy approach requires subjective decisions since the assessments are conducted under uncertain environments.
The Fuzzy Approach
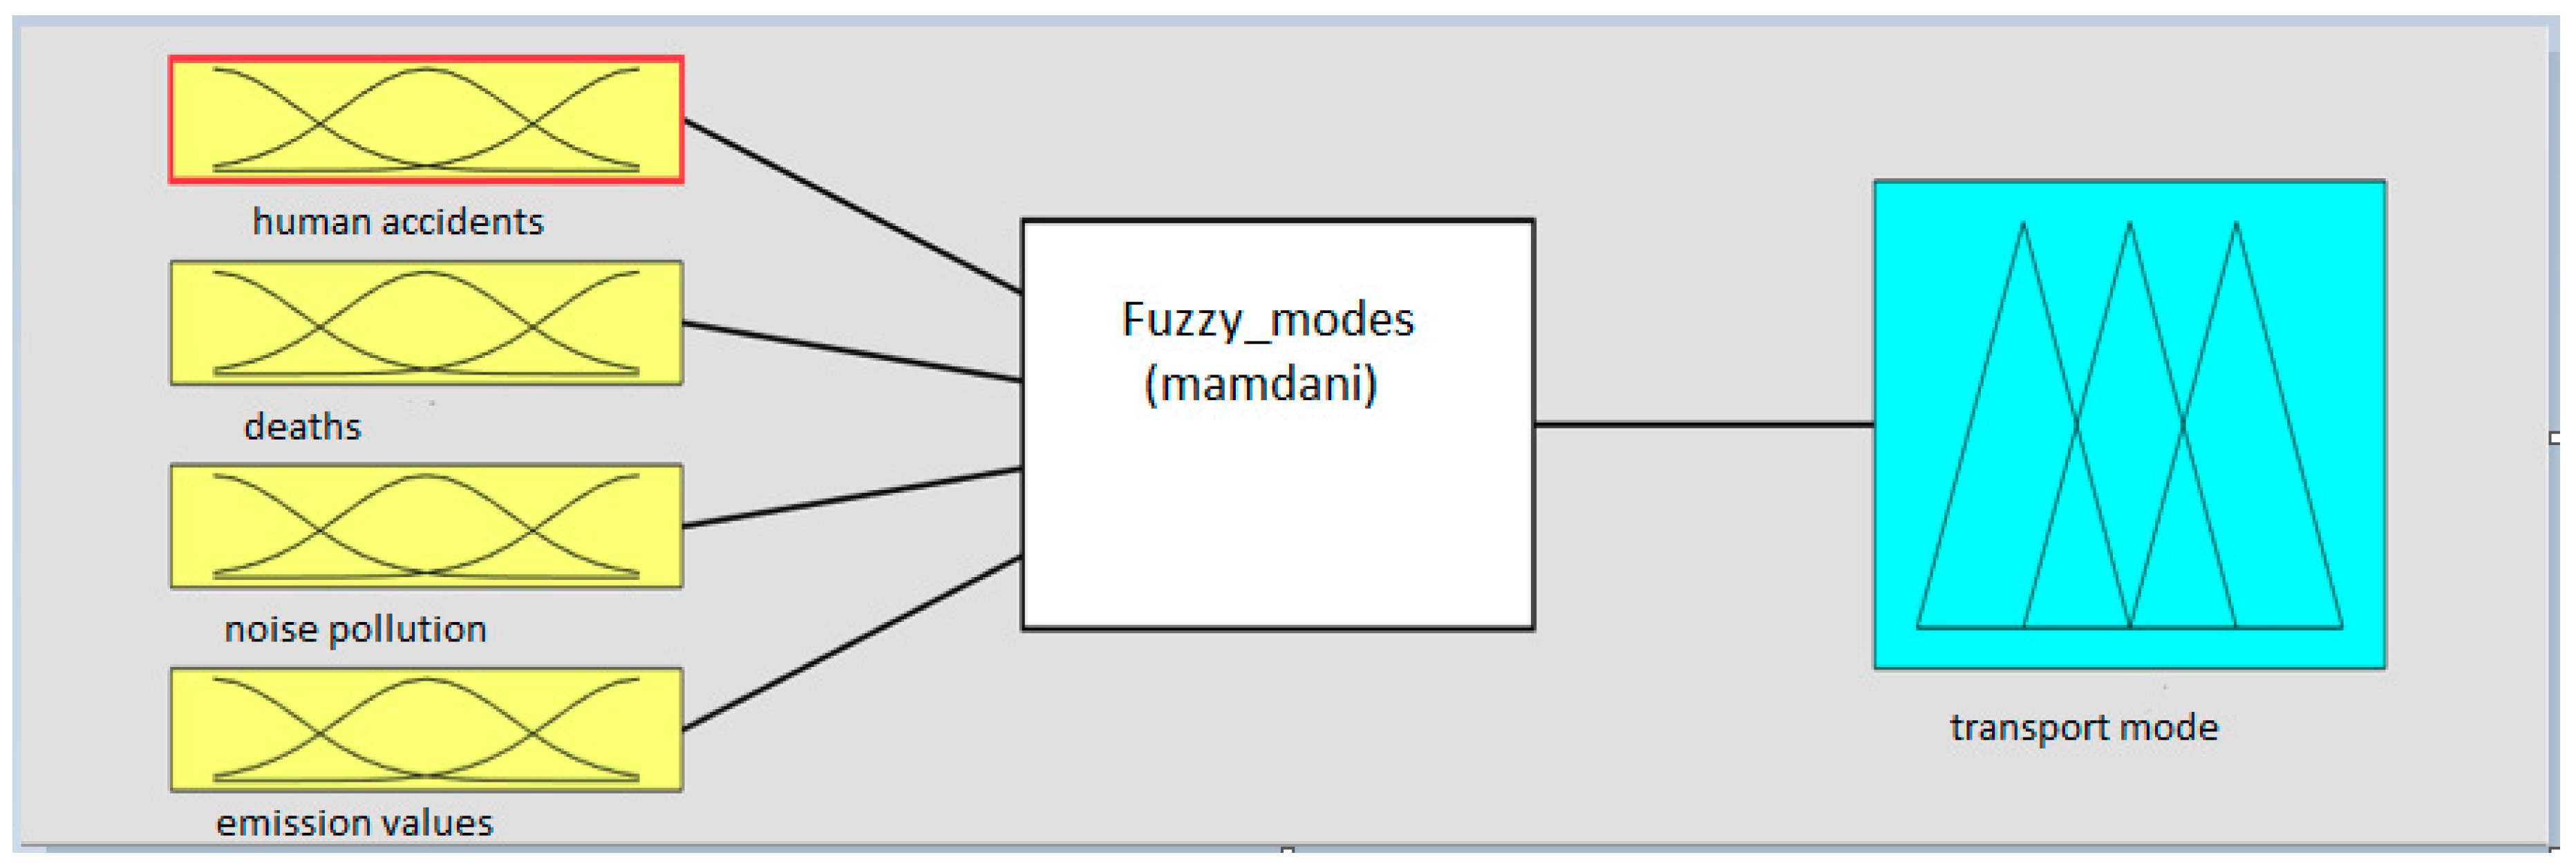
Transportation modes have human and ecological risks. Human risks (e.g., human accidents and deaths) and ecological risks (e.g., emission values and noise pollution) are fuzzified. A fuzzy approach is conducted using the fuzzy logic designer in Matlab. Membership functions based on decision rules are used for this process. The risk weight of the transportation mode is considered as output. The fuzzy design handled is given in Figure 2. The fuzzy logic designer displays an inference system with inputs and an output. Fuzzy inference functions are adjusted such as implication, aggregation, and defuzzification. Implication is applied to each rule by assigning a weight. Aggregation is a process whereby fuzzy sets of the outputs are aggregated as a single set. Defuzzification is a process whereby the aggregate fuzzy set is combined into a single number. Centroid calculation was used for the defuzzification method for this paper since this method is related to the center of the curve area. Mamdani inference was used for the design. Mamdani inference ensures that the outputs are fuzzy sets. Inputs are evaluated with linguistics assignments using low, medium, and high definitions. Decision makers in the company decided these definitions using transportation reports. For example, the number of human accidents and deaths was examined by transporting the containers to customers, and a decision for the transport mode was made. When the risk weight and cost of the transport mode was low, this mode was chosen for the network. The first step is to assign the inputs to the fuzzy sets. The inputs shown in Figure 2 with linguistic definitions must be fuzzified via membership functions.
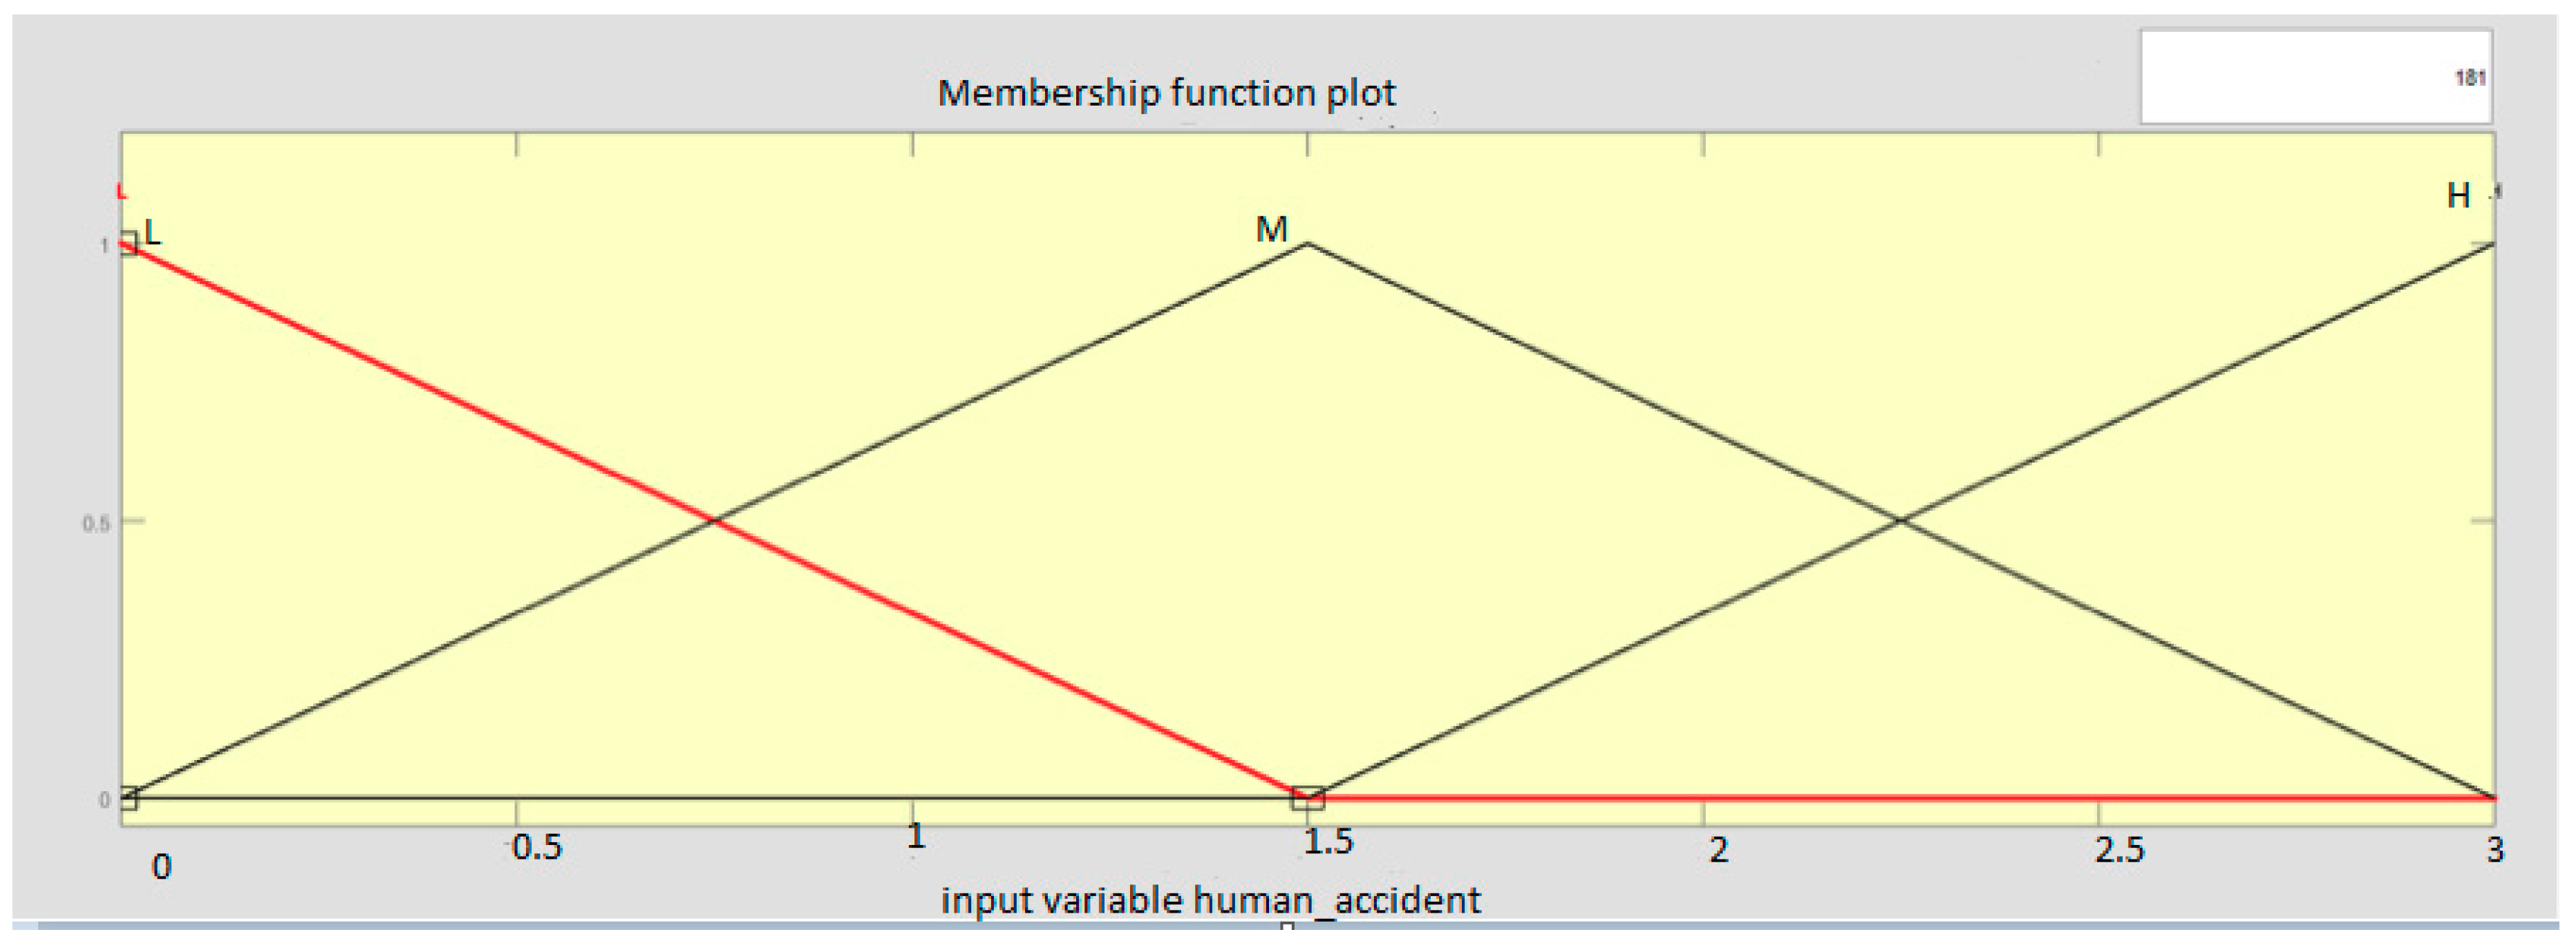
The triangular membership function is shown in Figure 3. This function includes low, medium, and high variables. This figure shows the membership functions of the selected input and output variables. Ranges of the variables and the type of membership function are set. Fuzzy numbers are presented as low (0, 0, 1.5), medium (0, 1.5, 3), and high (1.5, 3, 3). Decision makers score the inputs with linguistic variables, and fuzzy numbers representing the linguistic variables are assigned to the inputs.
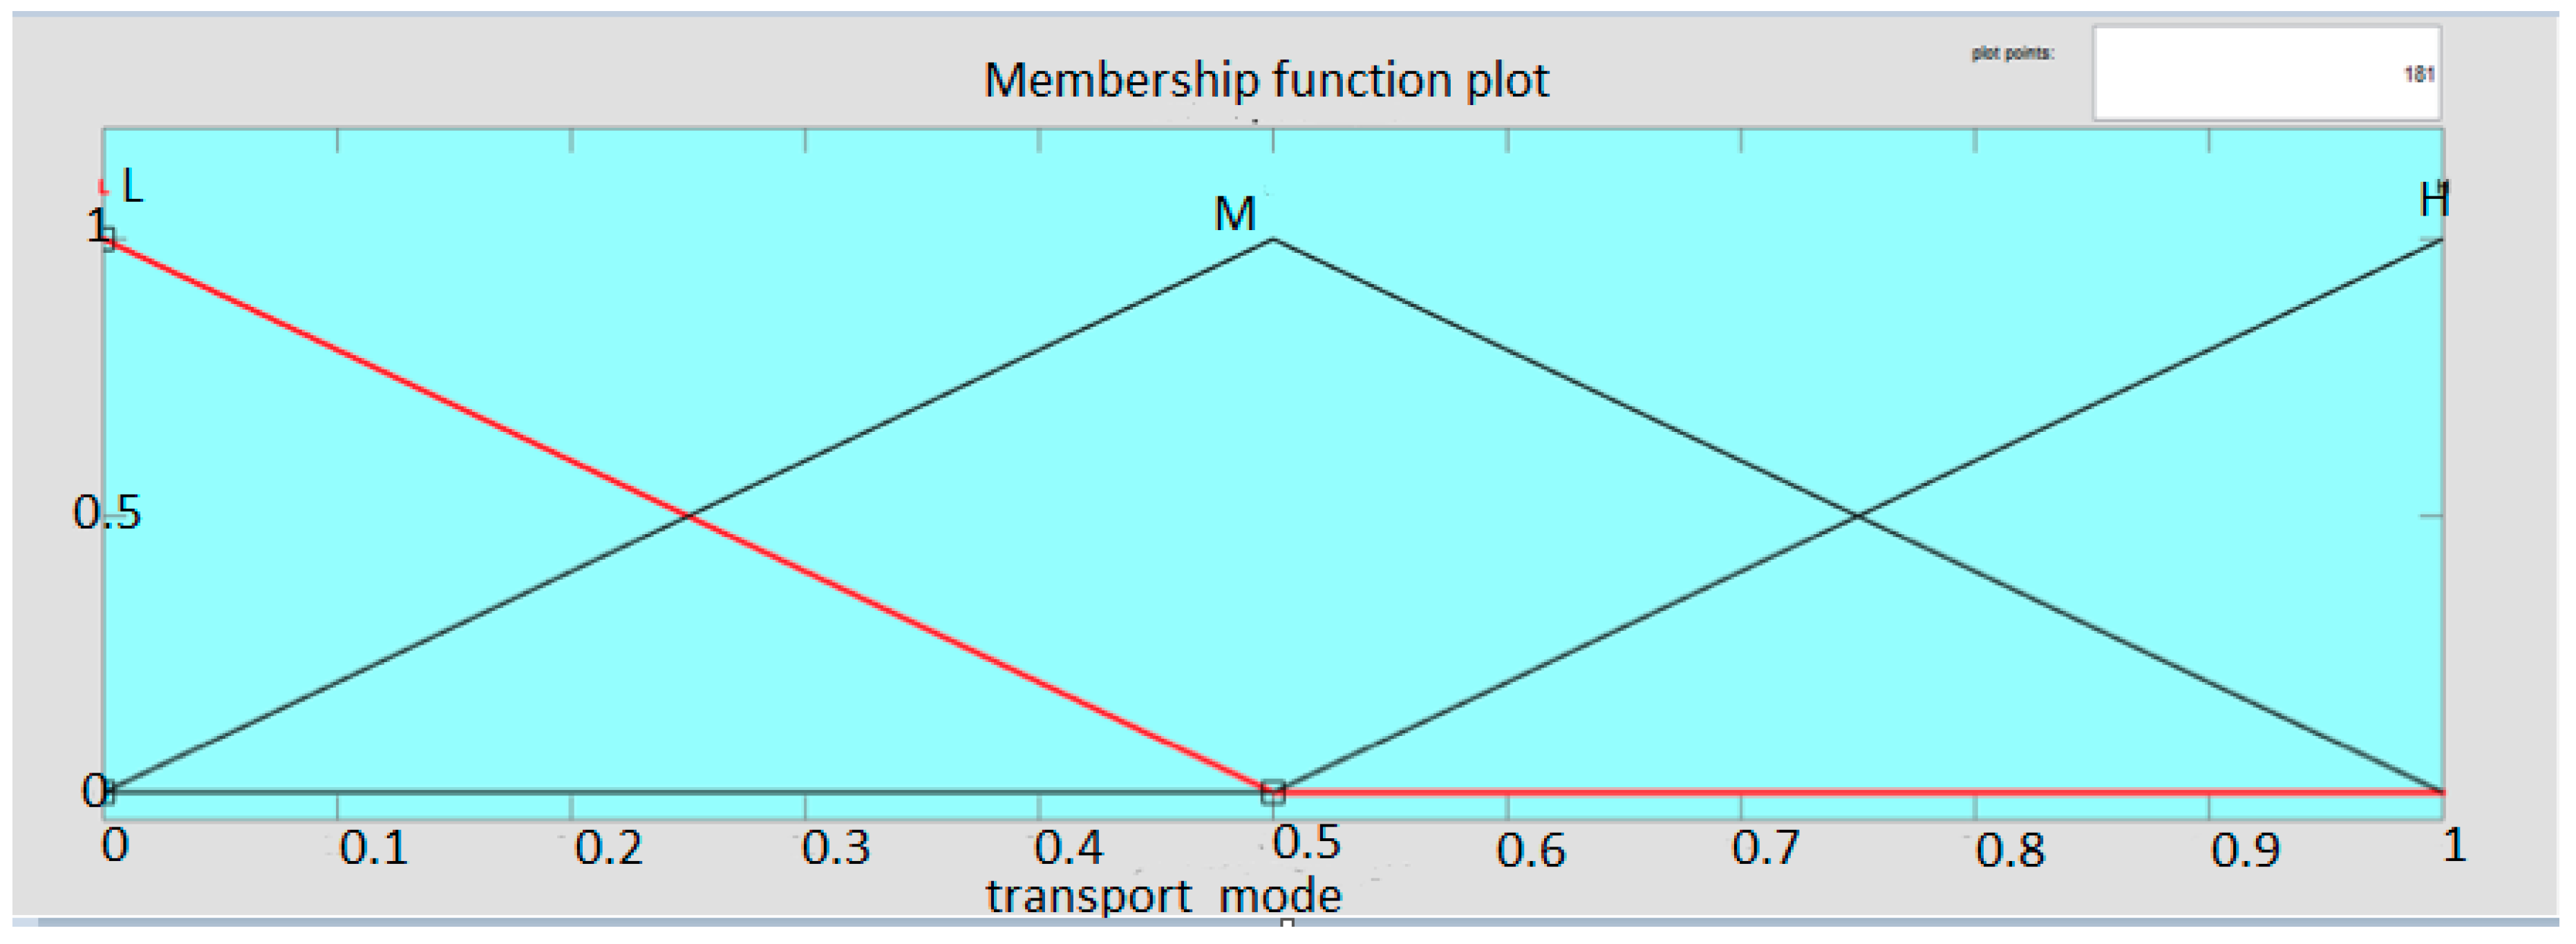
Fuzzy numbers are presented for the output as low (0, 0, 0.5), medium (0, 0.5, 1), and high (0.5, 1, 1). Figure 4 shows that the risk weight of output is decided by fuzzy numbers. By the results of the decision rules, a risk weight is obtained for each transport mode.
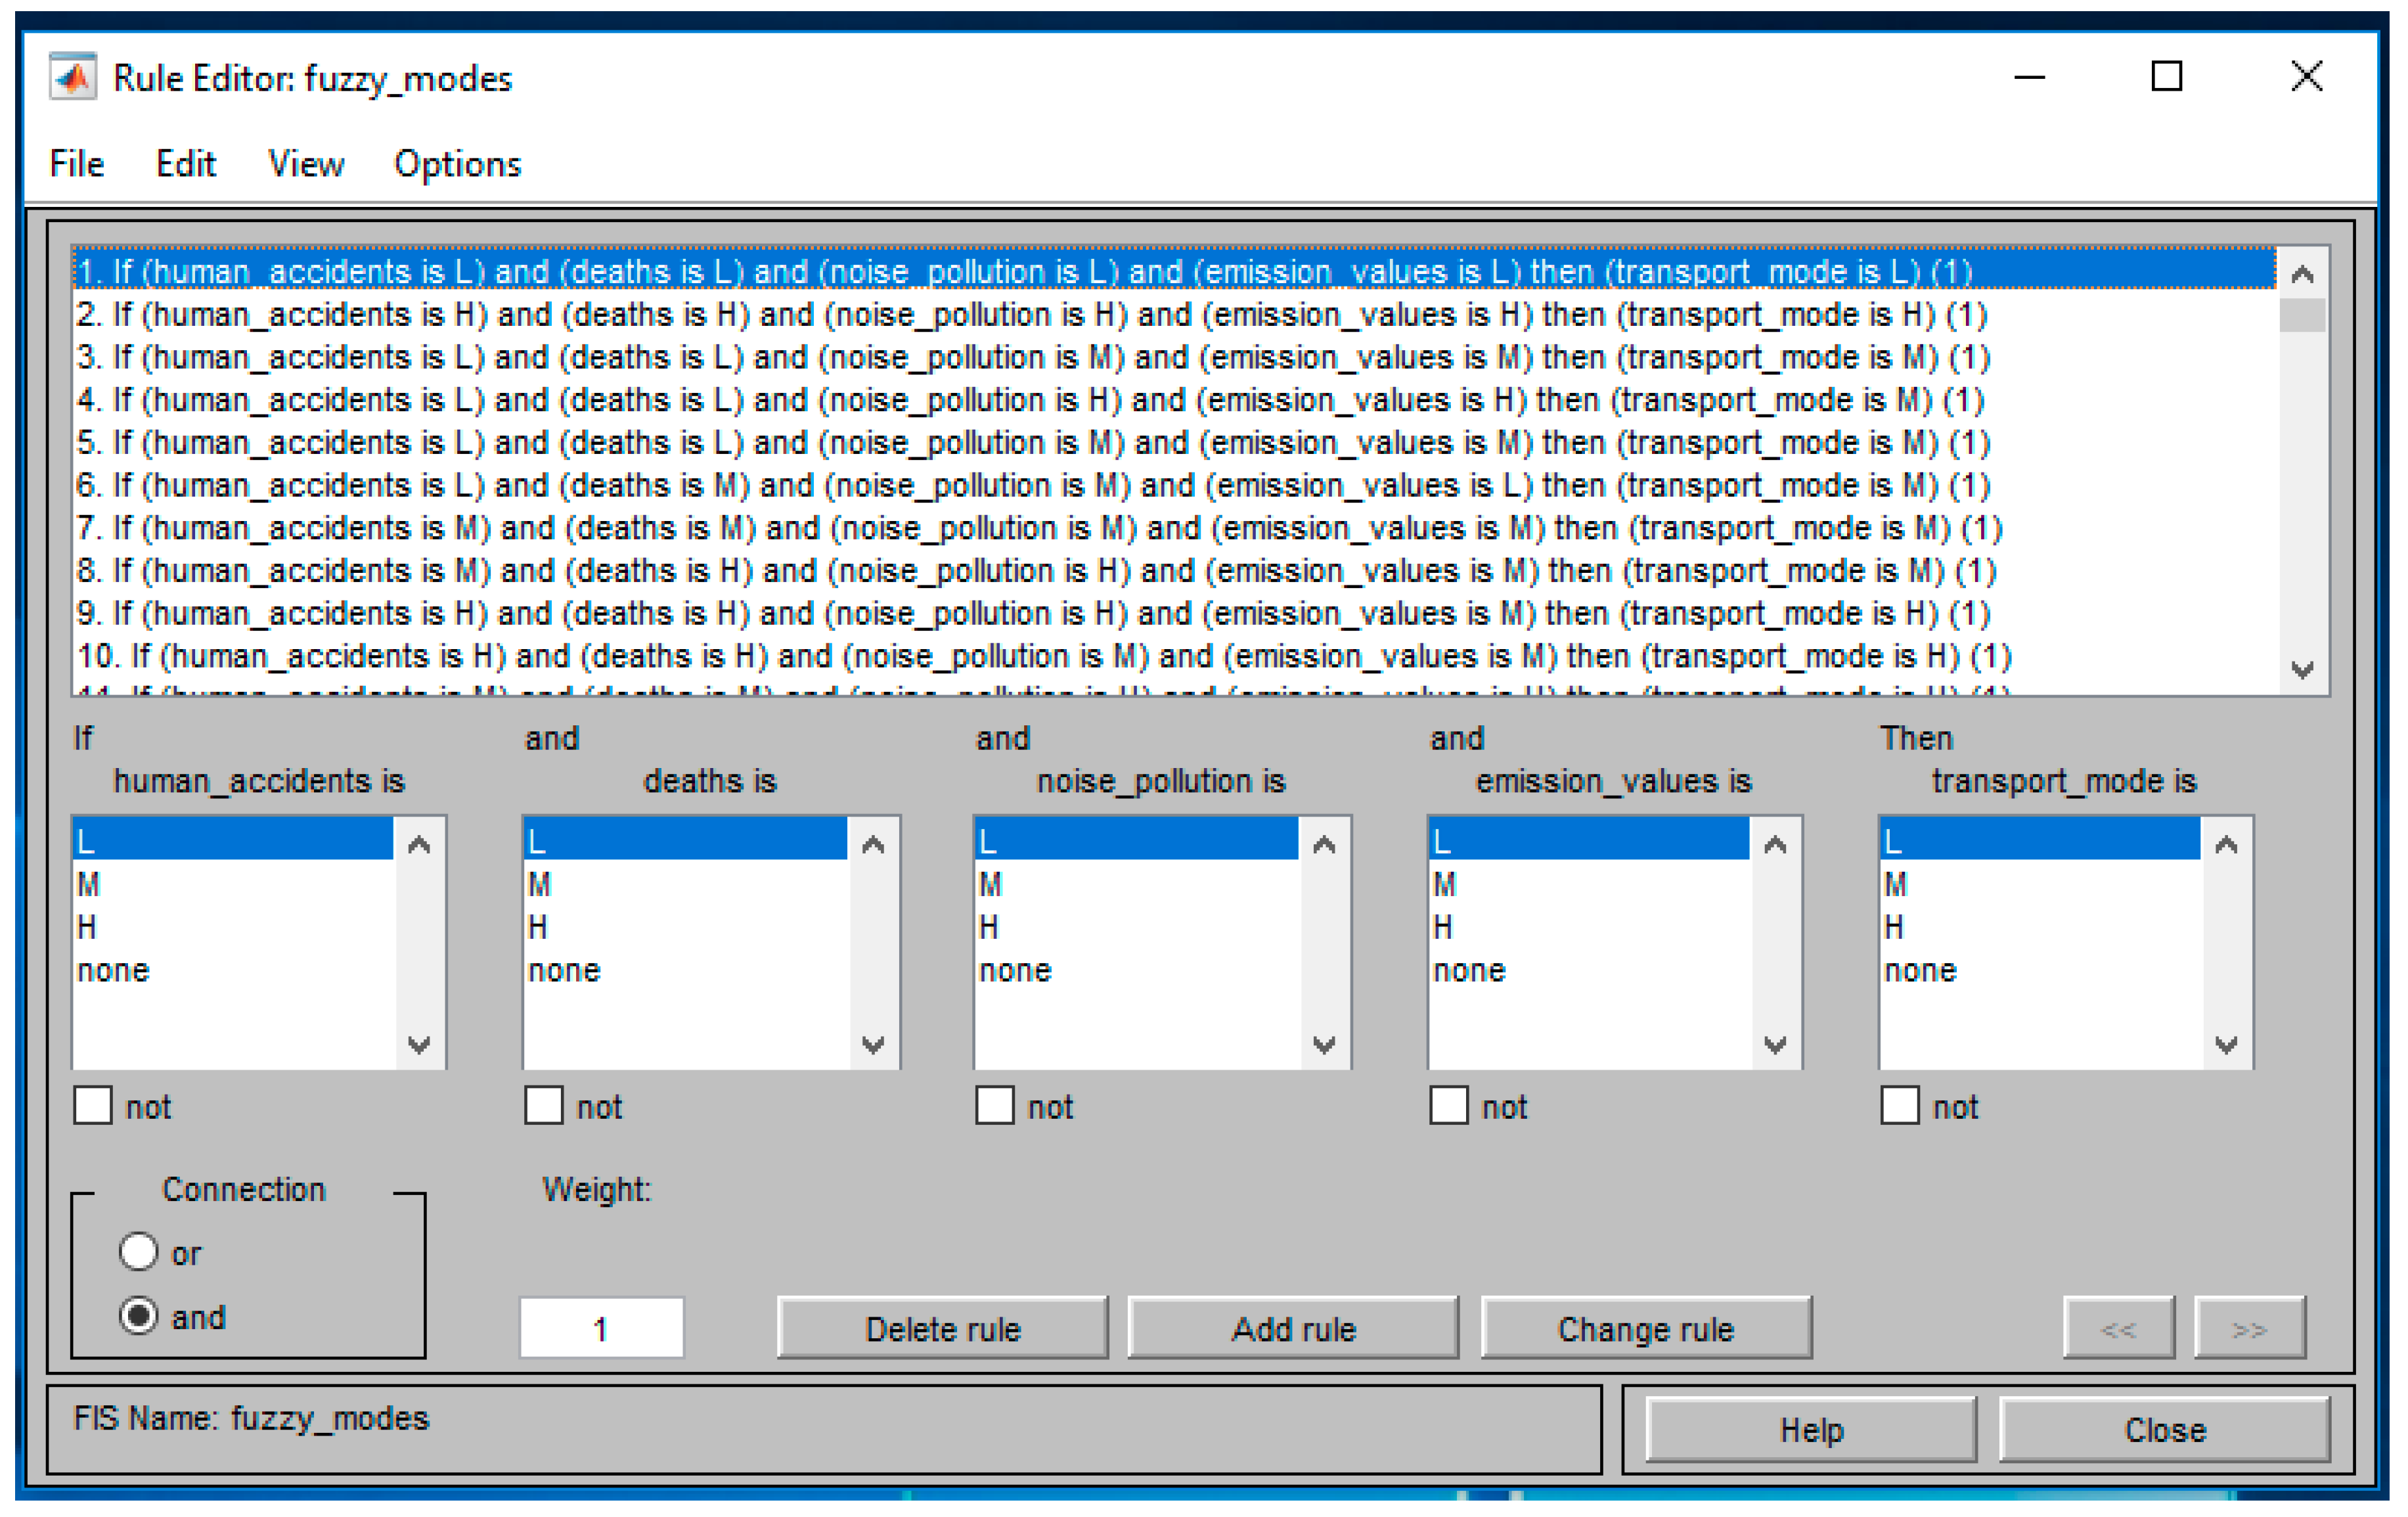
We developed 100 decision rules for the international logistic firm. All combinations of the linguistic variables are tried to find the risk weight. If–then rules are applied in this step. Some rules are shown in Figure 5.
A fuzzy if–then rule is formed as “if x is L then y is M.” L and M are linguistic definitions. Low is represented as a number between 0 and 0.5. M is represented as a fuzzy set. After the fuzzification of the inputs, the “and” operator is applied shown in Figure 5. The “and” operator uses the minimum fuzzy number.
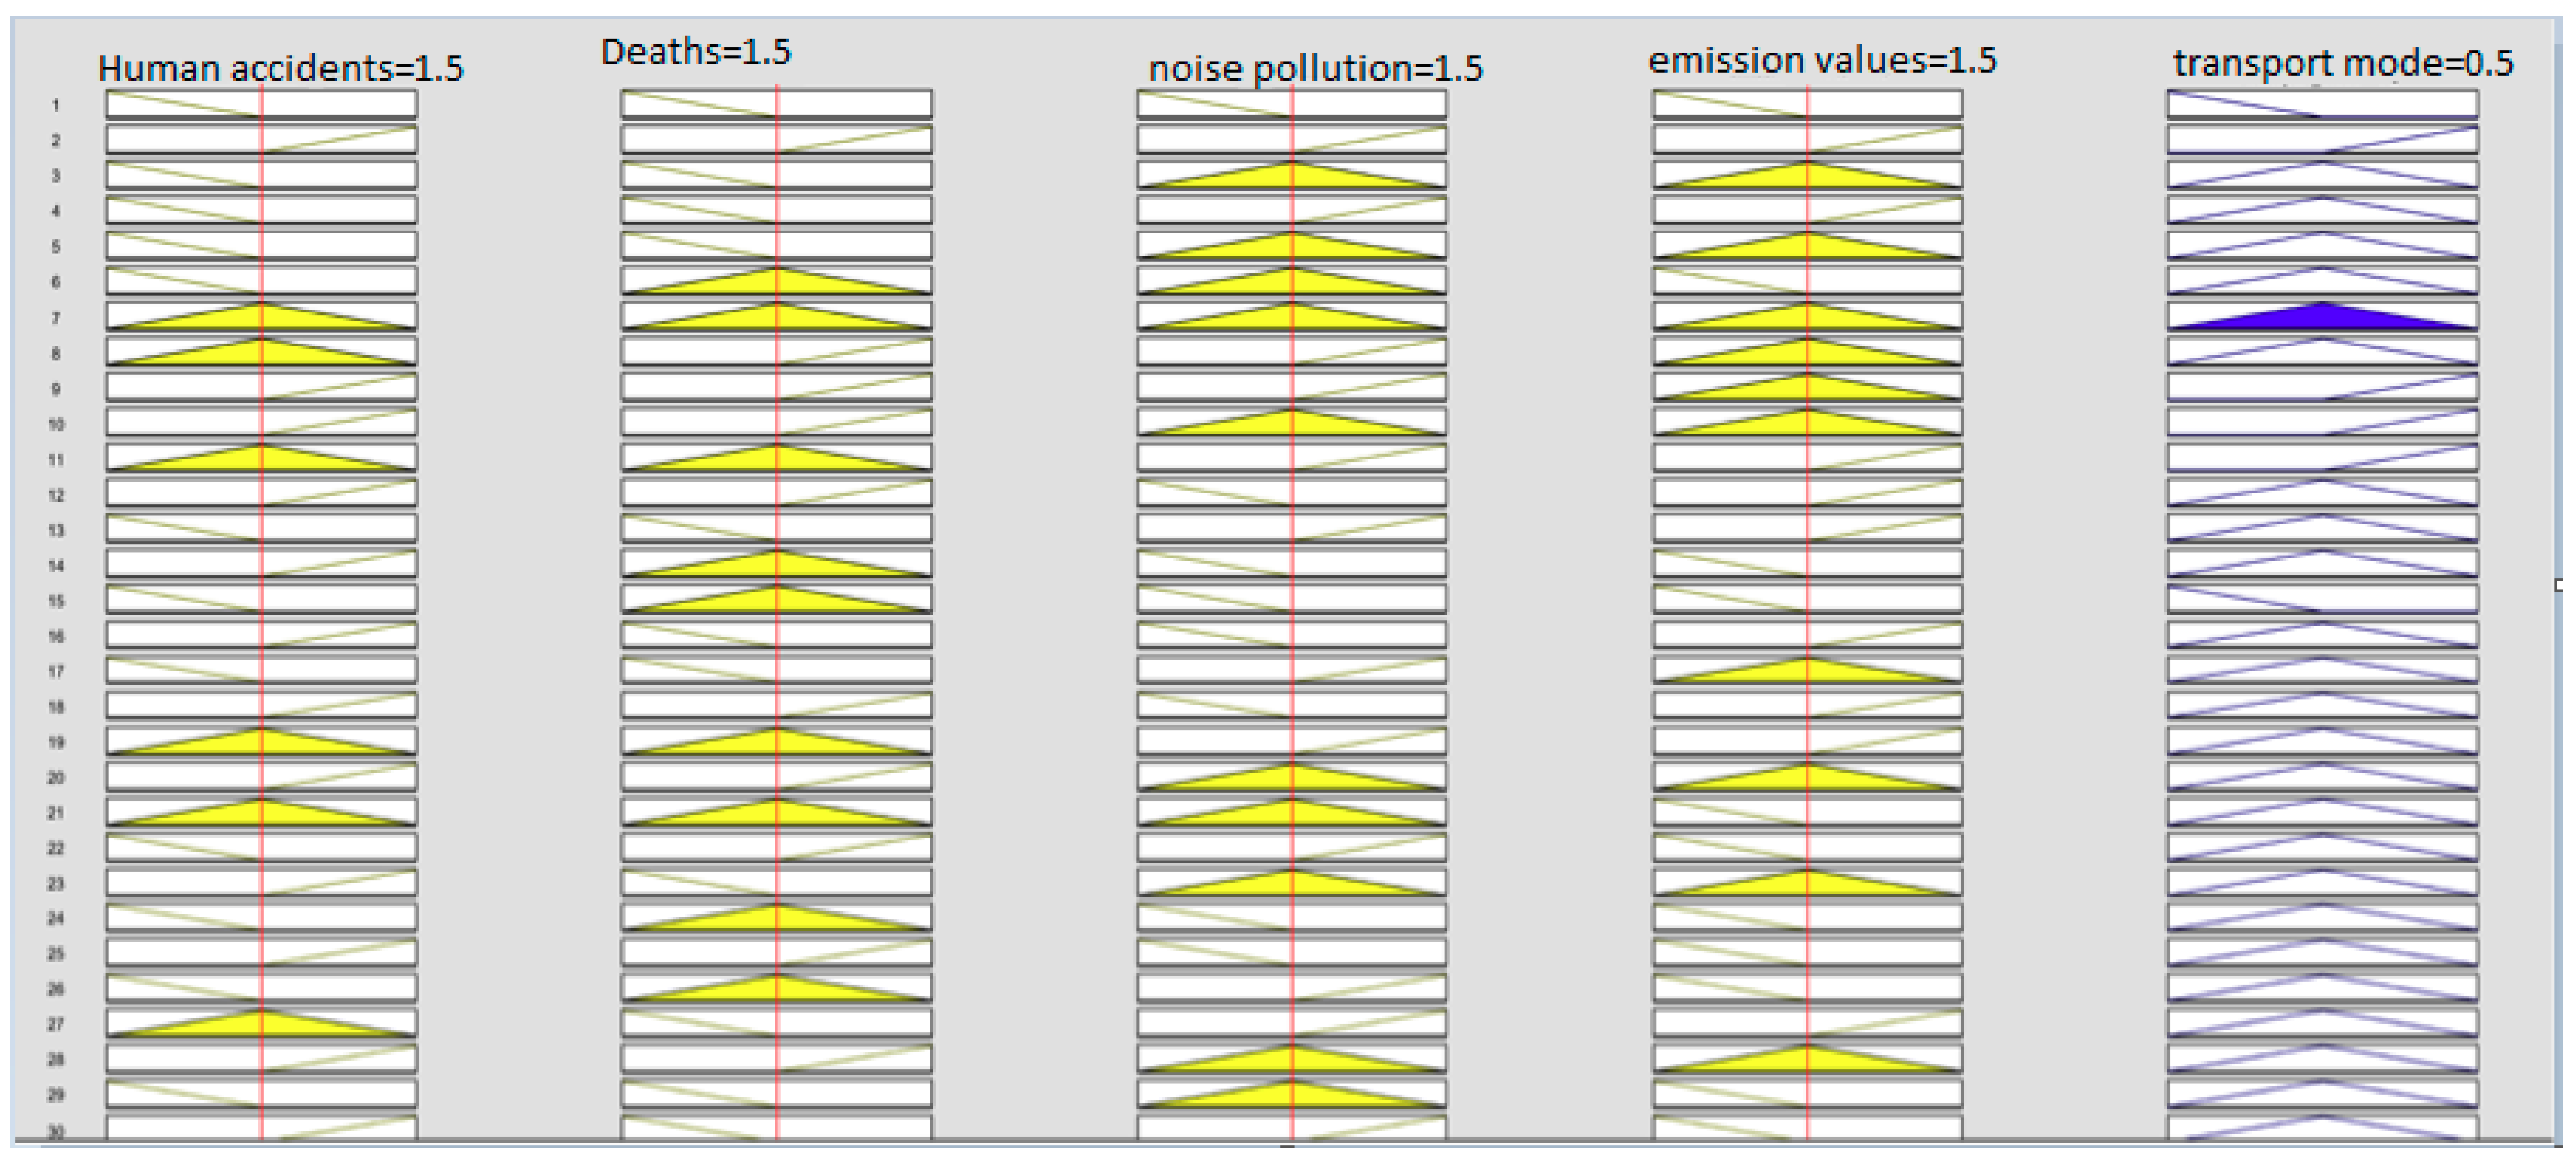
Figure 6 displays the rule viewer that represents the fuzzy inference system. The rules are on the left of the rows. Yellow plots in the figure show the if section of the rules. Blue plots are presented as then section of the rules. Decision rules are tried by decision makers, and effects to the output are evaluated. When all inputs are increased, transport mode value also increases. When all inputs are defined as medium, the output weight takes a 0.5 value in Figure 6.
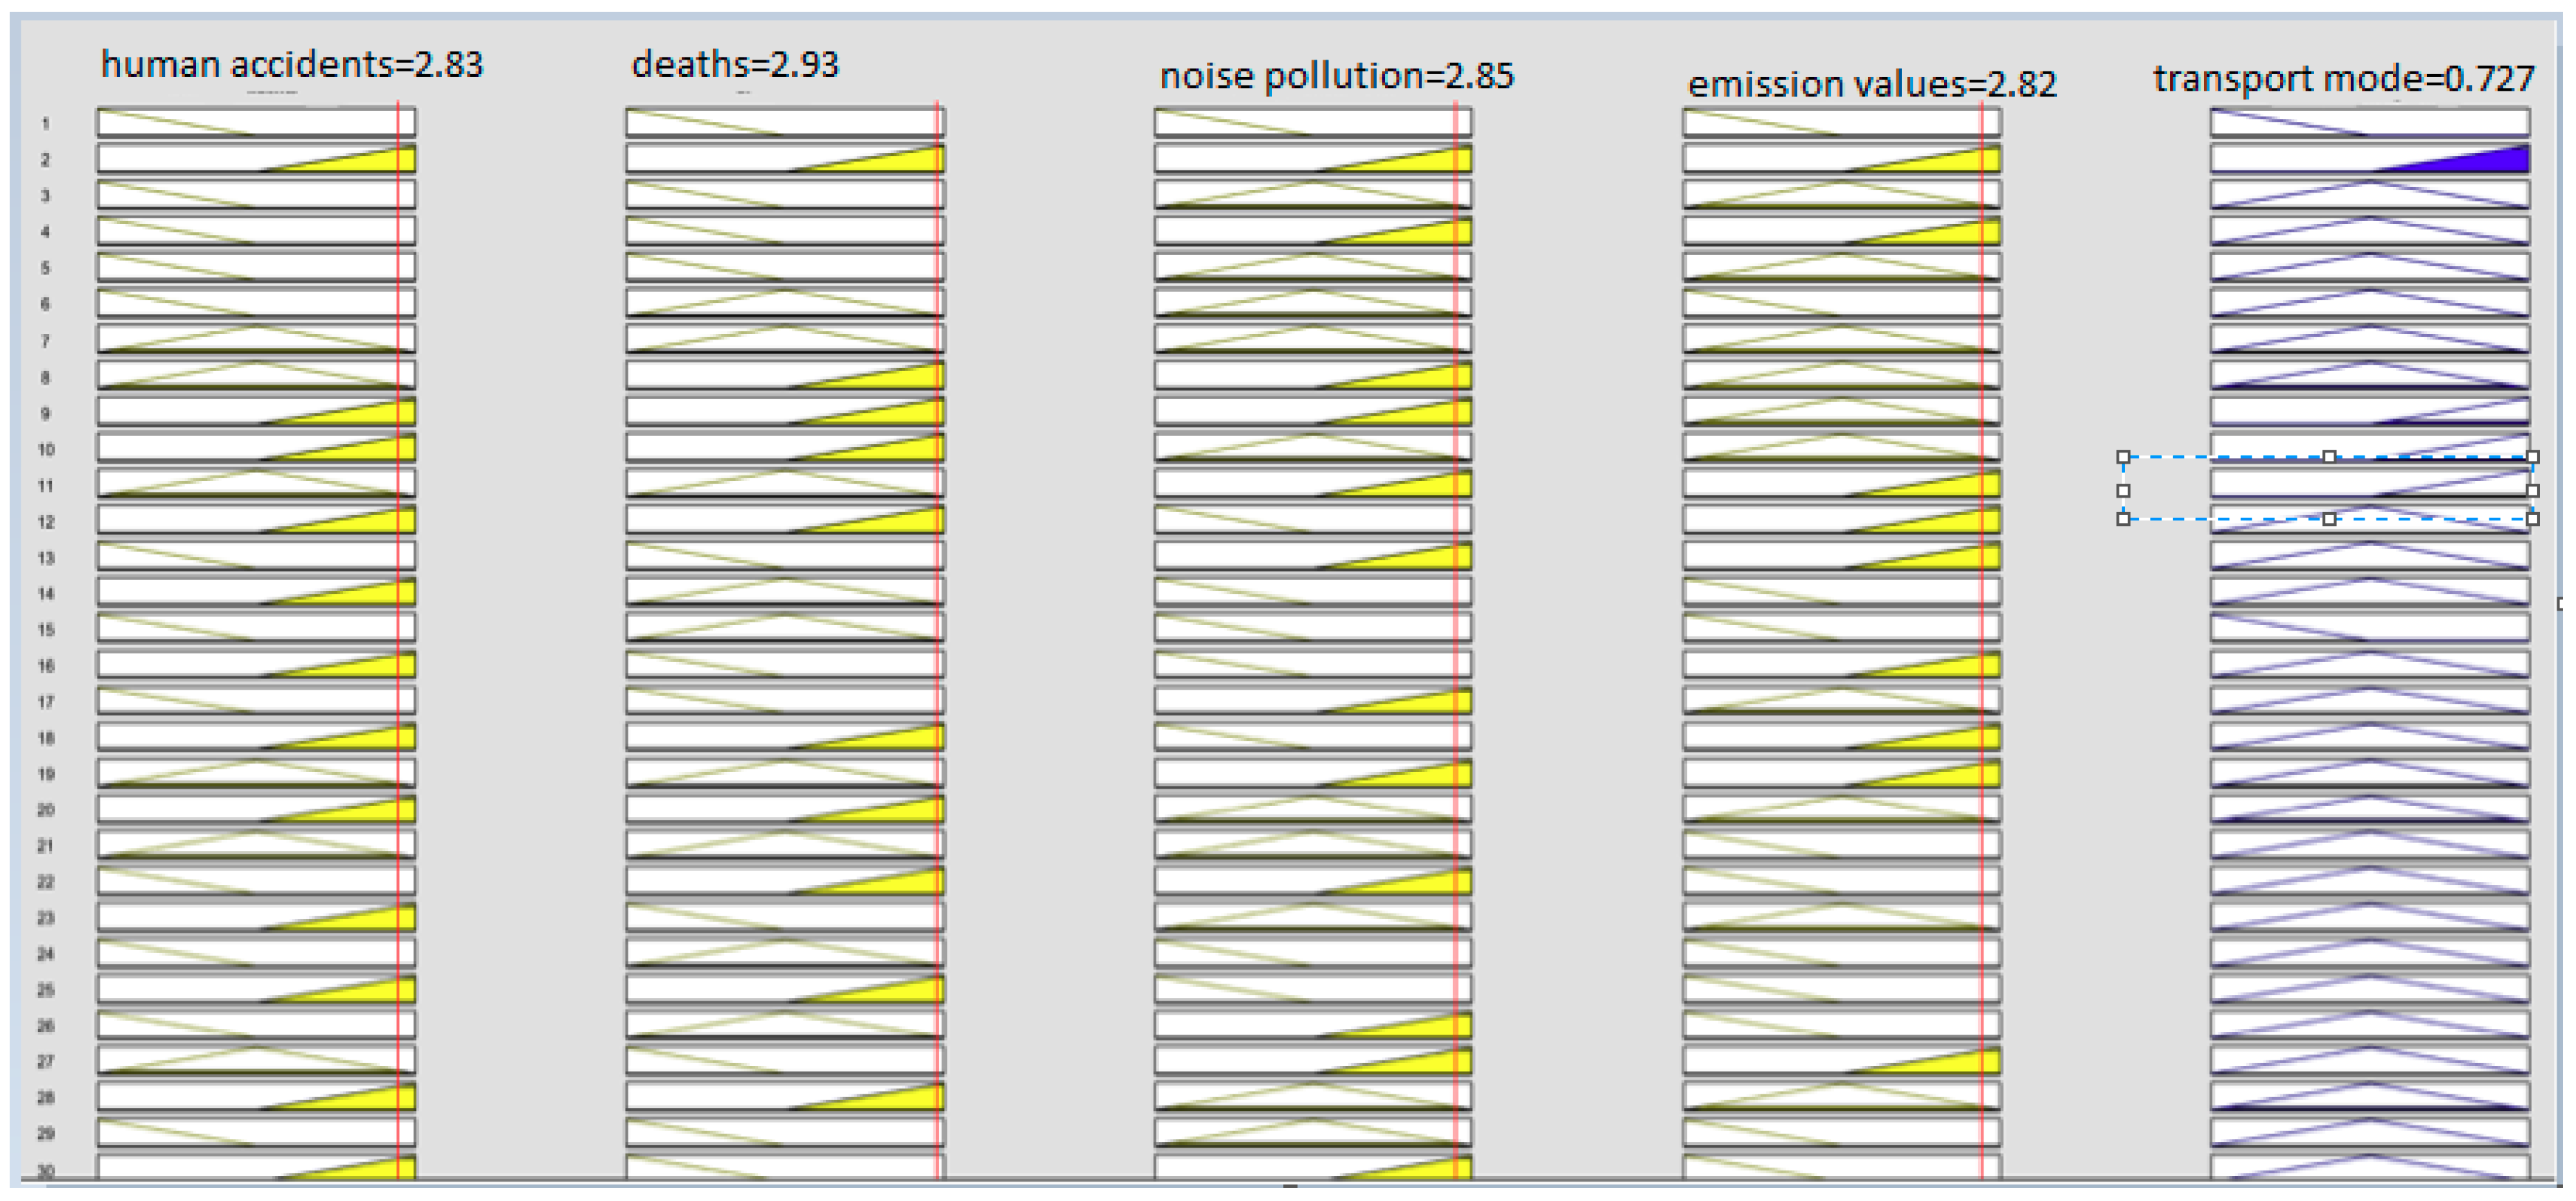
All inputs are given for road transport in Figure 7. Road transport is evaluated as the most risky mode by decision makers. Therefore, the inputs take a value of nearly 3 (high) and the output is nearly 1 (high risk weight). Human accidents, deaths, noise pollution, and emission are scored as 2.83, 2.93, 2.85, and 2.82 by decision makers. The risk weight is resulted as 0.727 for road transport. The risk weights of the rail and marine transports are 0.346 and 0.539.
3. A Real-Life Application for an International Logistics Company
A real-life application of an international logistics company operating in Turkey is discussed here. The company is leading in both Turkey and Europe. The company offers the best logistics solutions for transporting containers, finished products, industrial products, maritime, and railway services.
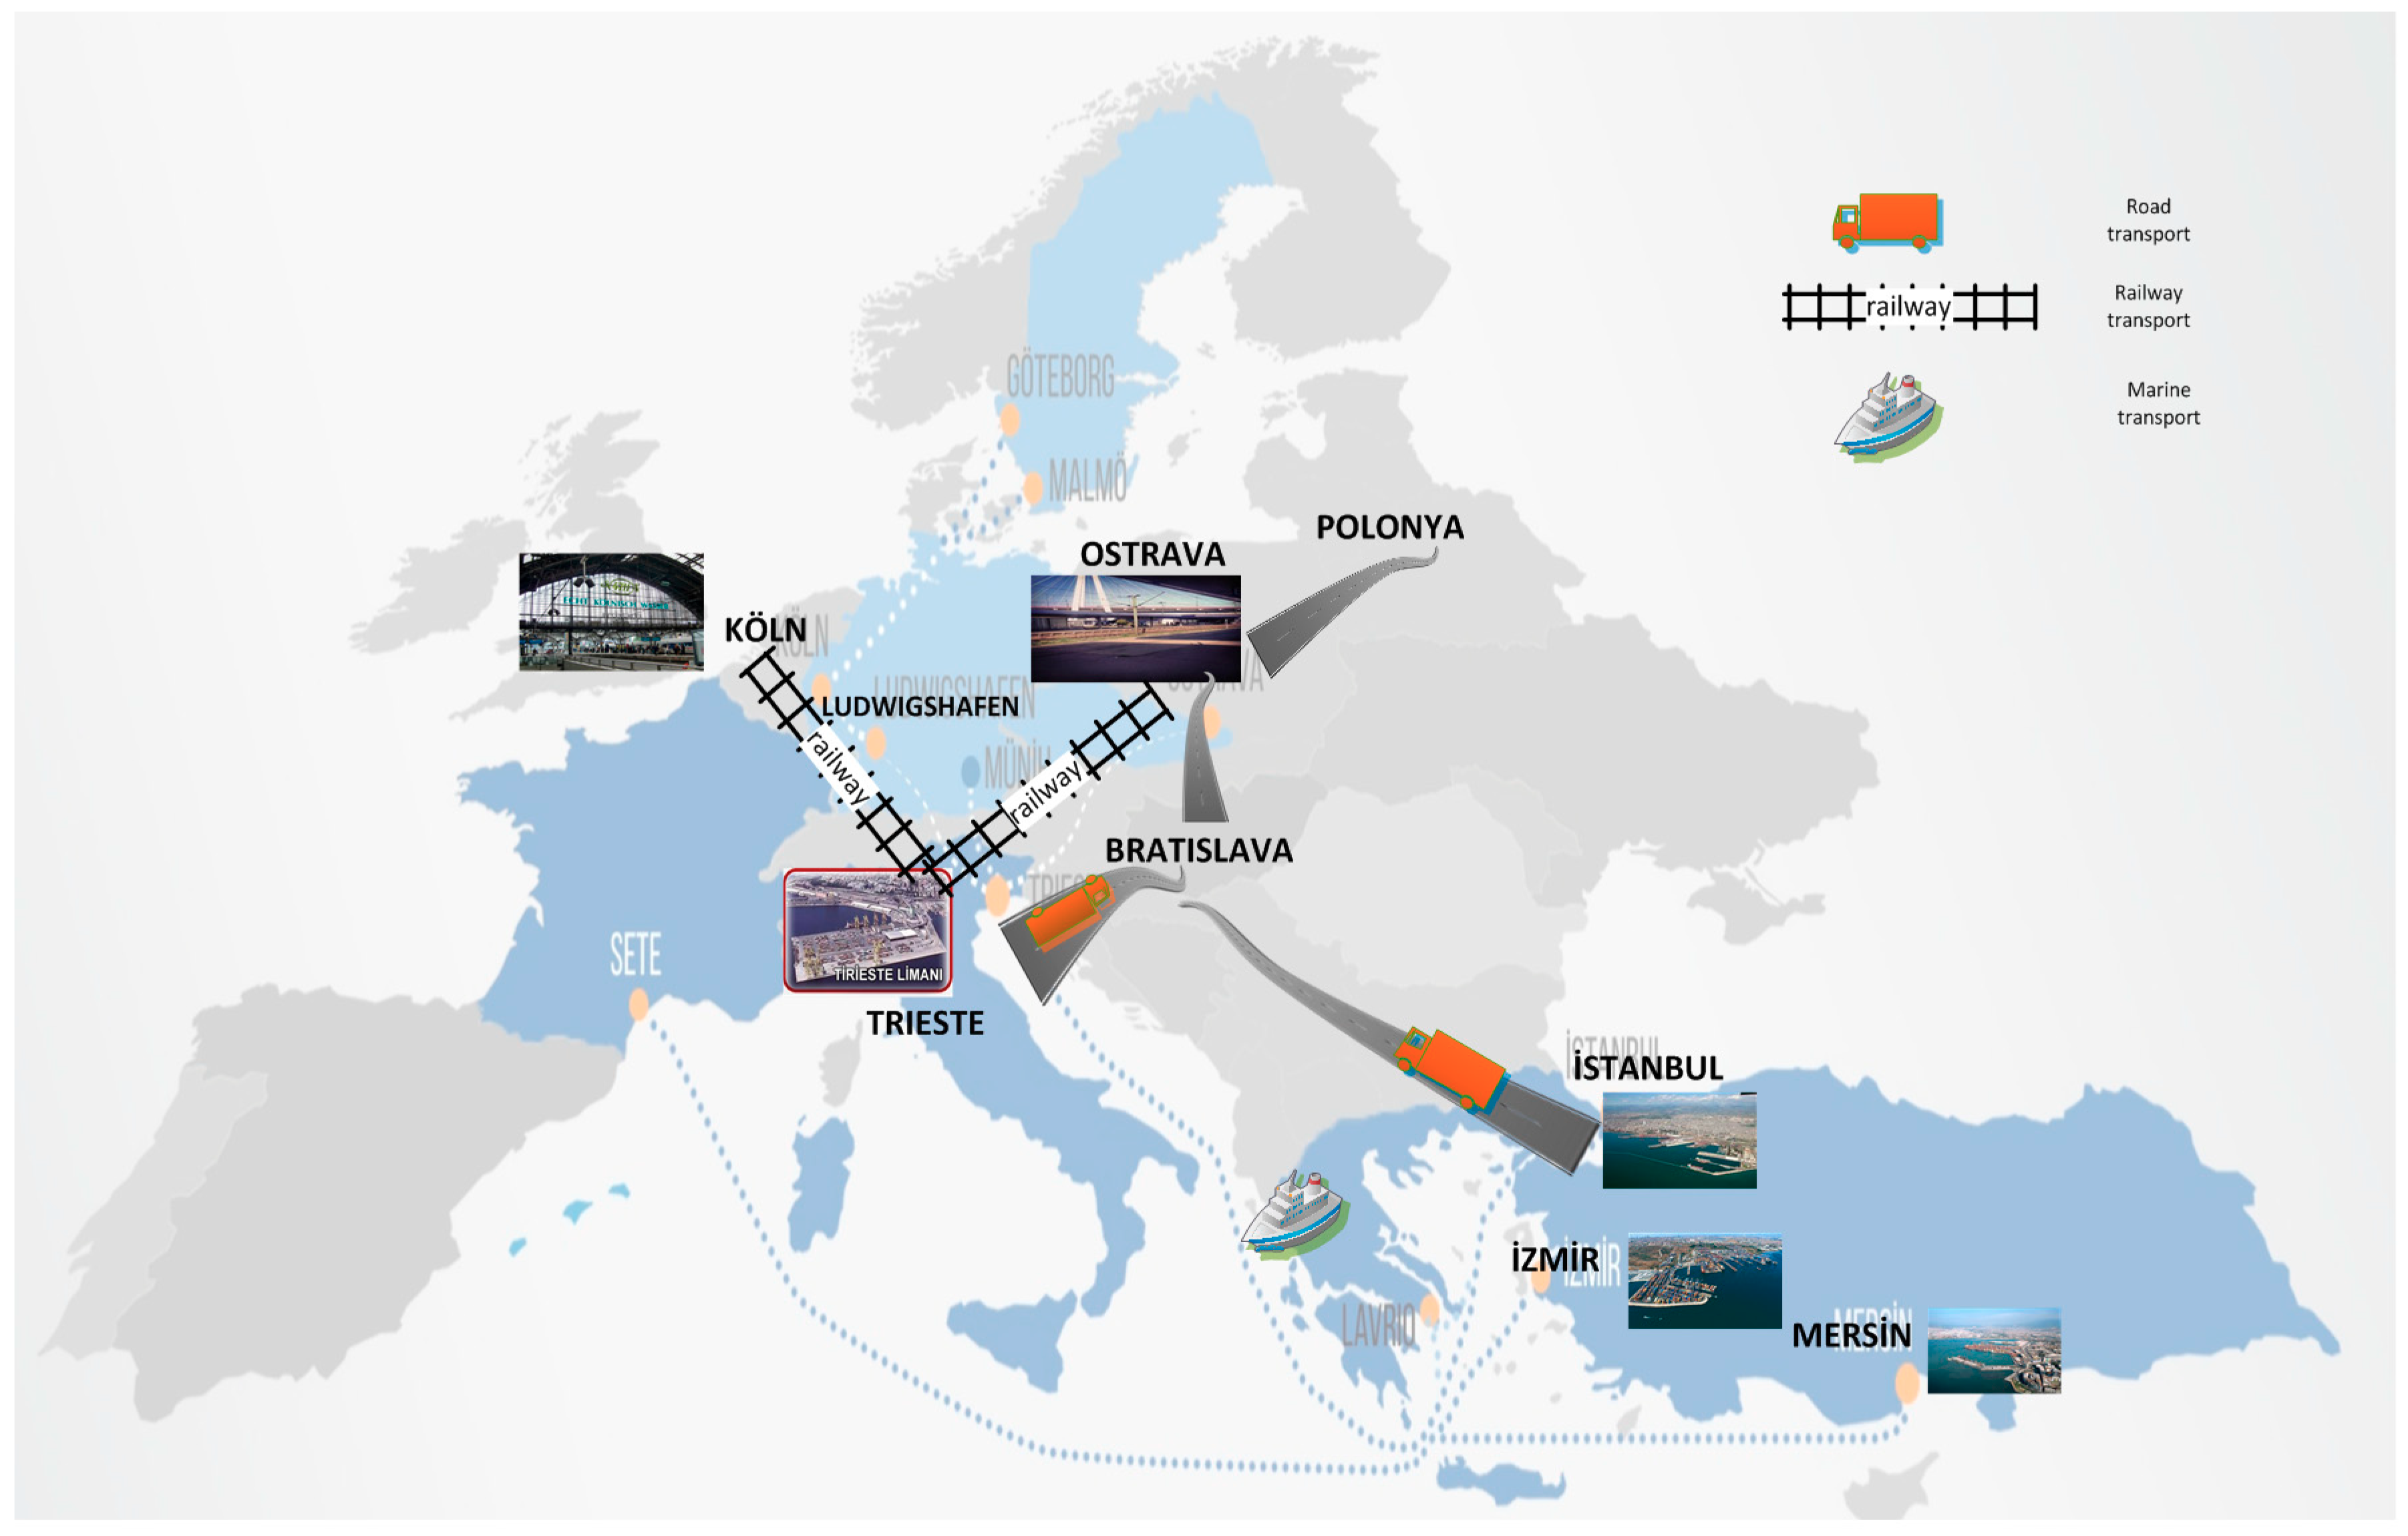
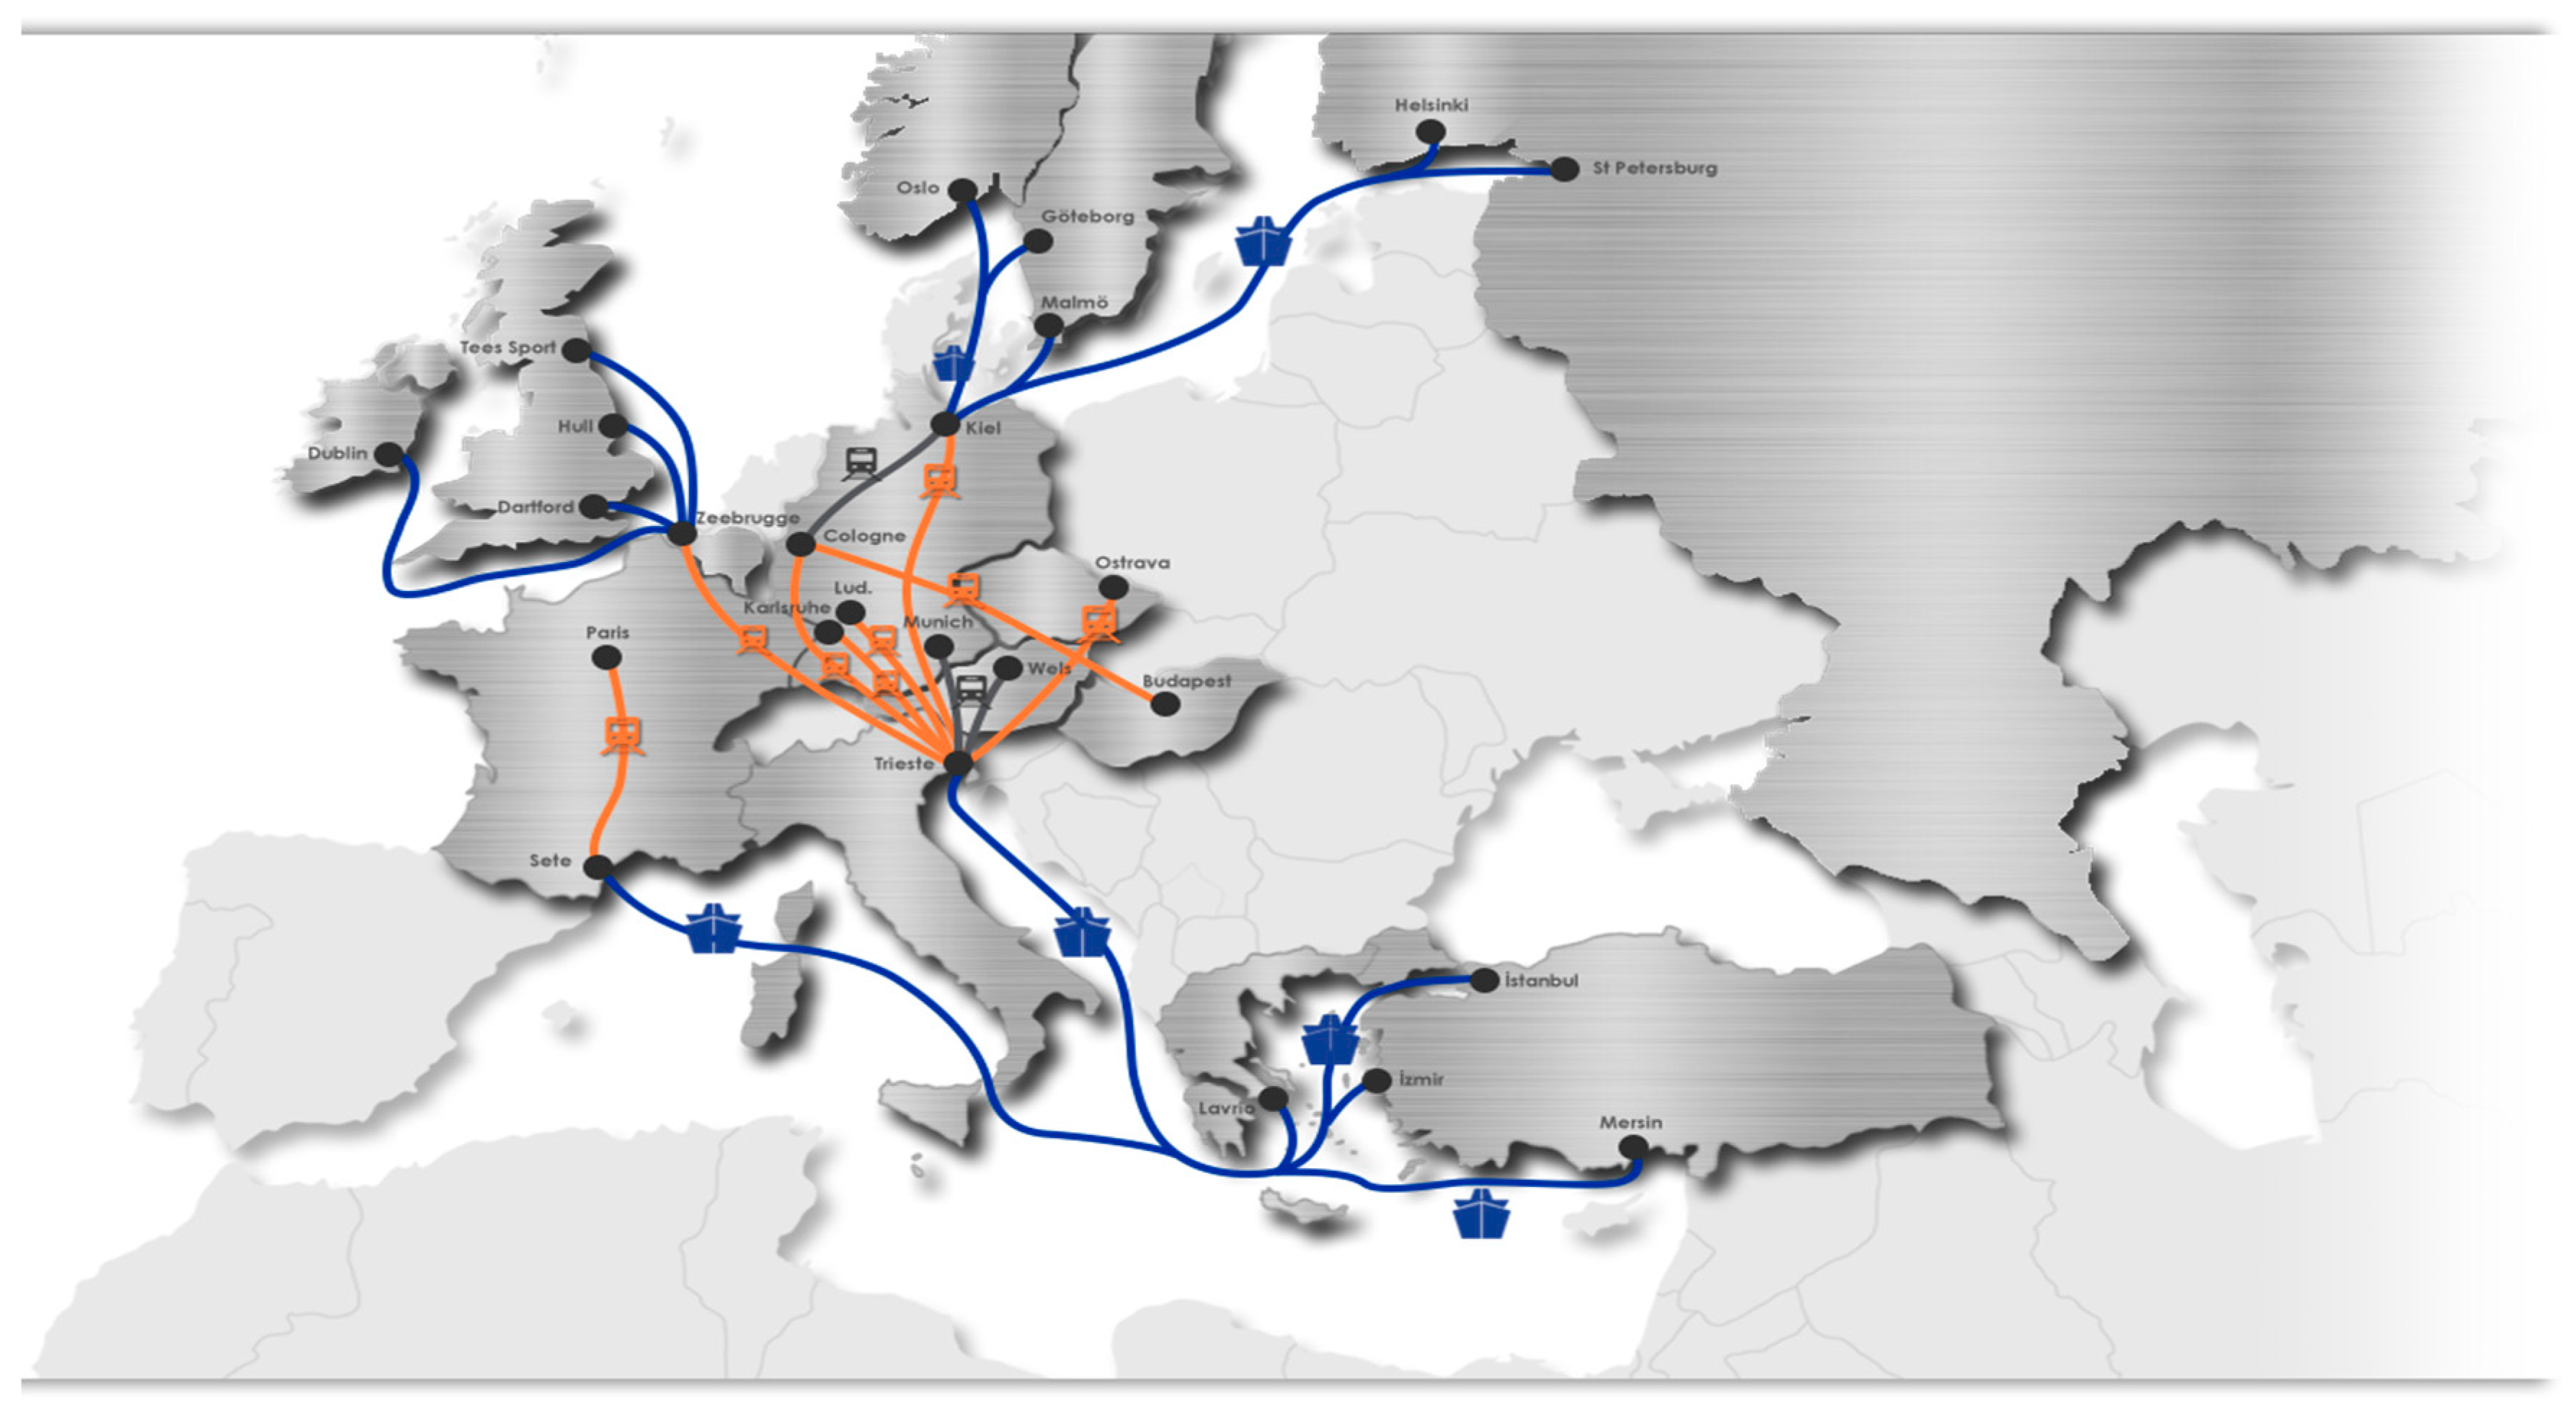
The company’s international transport system is the transport of carrying units from Turkey ports to Trieste and Sete ports by marine transport. Carrying units are taken by block trains from the ships with special equipment after arriving with Roros. Containers from block trains are transported by road from the centers of Ostrava, Cologne, and Ludwigshafen. The multimodal transport network of the company is given in Figure 8.
In the study, the intermodal transport network consists of one marine port in Europe, three ports in Turkey, and three train stations with block trains. There are three round trips per week from Istanbul port to the Trieste port and one round trip between İzmir and Sete ports. Each turn takes 60 h, and the tour is provided by the company’s own Roros. Each ship is equipped with proprietary technology and has 249 gigantic trailers or 45 ft. of contingent capacity. Every week, the company operates 6-day transit block trains between Istanbul and Europe. Thus, it consumes fewer liters of fuel and carbon dioxide than road transport. The block train capacity is 32 trailer-containers with a minimum of 8 trains per month.
4. Results
Intermodal transport has been increasingly applied in the supply chain in recent years. This study deals with mode selection and load assignment based on risk factors. The proposed model also considers the export of containers. For model validity, the proposed model was applied to the real data of a large-scale international logistics company. The mathematical model was solved by GAMS optimization software, and a fuzzy approach was applied by the Matlab fuzzy logic designer executed on an Intel CPU 3.6 GHz with 16 GB RAM. The model was solved in a reasonable time limit in GAMS. The fuzzy logic designer also lets us design our fuzzy inference system. The fuzzy logic software is useful for a large number of inputs and the software has a designer, a membership function editor, a rule editor, a rule viewer, and a surface viewer.
The results show that the logistics firm can minimize total costs and provide opportunities to manage the transportation network under risk factors. The results in terms of total cost presented better results. The results showed that all demands should not be transported using the same transport modes. Considering cost and social and environmental conditions, demands should be met by optimum transport vehicles. Export flow for FTLF, FTLB, and LTL from Turkey to Ostrava, Bratislava, and Poland at each period is shown in Table 1. All demands of Bratislava and Poland from Turkey were met by road transport. The demands of FTLF containers with road transport by Ostrava were not met at Periods 3, 4, 5, or 6, as shown in Table 1. The demand of FTLB containers by Ostrava with road transport was not met at Periods 1 and 2 shown in Table 1. The demand of LTL containers with road transport by Ostrava was not met at Periods 1 and 5, shown in Table 1. Therefore, there is a flow from Turkey ports to the Trieste port with Roros. Firstly, marine transport is used from the Turkey ports to the Trieste port by Roros shown in Table 2; then, a rail transport to Ostrava is ensured, shown in Table 3. Thus, both the road transport and the marine–rail transport are used for the intermodal network.
Some FTLF types of demands of Ostrava, Bratislava, and Poland were transported by road mode at all six periods, shown in Table 1. All demands of Bratislava and Poland were provided at each period. Considering all factors, the truck vehicle was chosen as the only mode for Bratislava and Poland.
Some FTLB types of demands of Ostrava, Bratislava, and Poland were transported by road mode at all six periods. No demands of Ostrava were met by truck. Some demands of Ostrava were transported by marine–rail mode at Periods 1 and 2.
Some LTL types of demands of Ostrava, Bratislava, and Poland were transported by road mode at all six periods. However, some demands of Ostrava were transported by marine–rail mode at Periods 1 and 5. There is a blank at Periods 1 and 5.
Some FTLF types of demands were transported by marine mode at Periods 3, 4, 5, and 6 shown in Table 2. From Turkey ports to the Trieste port, there was a flow by Roros for Ostrava.
Some FTLB types of demands were transported by marine mode at Periods 1 and 2. Roro transportation was used for these periods.
Some LTL types of demands were transported by marine mode at Periods 1 and 5.
Some FTLF types of demands were transported by rail mode at Periods 3, 4, 5, and 6 shown in Table 3. From Trieste to Ostrava, there was a railway, and a block train was used at these periods for Ostrava.
Some FTLB types of demands were transported by rail mode at Periods 1 and 2. The train line was used at these periods for Ostrava.
Some LTL types of demands were transported by rail mode at Periods 1 and 5.
Based on the risk weights, the number of transport modes used for the network is shown in Table 4. Weights are effective for the results and ensure the use of intermodal transportation modes. Without considering risk weights, all demands could be provided by road transport. For Ostrava, an intermodal network including marine and rail modes was used because of the risk weights.
The number of vehicles used for road, marine, and rail transportation is shown in Table 4. At each period, trucks were used to transport the demands for Ostrava, Bratislava, and Poland. Roros were used for Trieste at each period. Results show that Roros were not used for each day. At least two trains were used for Ostrava on each day.
5. Discussion
Intermodal transport has been increasingly used in recent years due to concerns of social, economic, and environmental problems. This paper deals with the allocation of demands for transportation modes, i.e., transport mode selection based on economic, social, and ecological aspects as basic parameters of sustainability. These social and ecological risks are assigned using linguistic definitions by decision makers to determine transport mode risk weights. The sub-classes of the social risk group, i.e., vehicle collisions, driver faults, traffic intensity, and route construction, and the ecological risk group, i.e., the time spent in traffic, air toxics and particles, fuel efficiency, and ecosystem preservation, were evaluated to determine the linguistic definitions of risk groups. The most risky transportation mode was determined as road transport. Road transport causes human deaths, accidents, and noise pollution and high emission values. Therefore, road transport has a high risk weight. Rail transport has a low risk weight, and marine transport has a medium risk weight. According to these risk weights and transport costs, the best mode assignments were obtained. For model validity, the proposed model was applied to the real data of a large-scale international logistics company. Since the risk weights were effective for their respective modes, export flow did not meet all demands by road transport. Some demands were met by intermodal transport. Research findings can reflect the existing literature by considering not only economic parameters but also social and environmental factors for the transportation sector in further research. The scientific contributions here consist of designing an intermodal field, a systematic comparison of transportation modes, which is important in determining the most optimum routes and modes, and the modeling of intermodal transportation based on economic, social, and environmental performance.
6. Conclusions
We examine the designing container transportation regarding effects of the risk factors on the transport modes. A novel mathematical model with multi-mode, multi-period, and multi-container planning contributes to high-level social and economic expectations and cost reductions. This mathematical model is the first to handle social, economic, and environmental risk factors to decide transportation modes. The application of a fuzzy approach for the transport sector is not new. However, this paper is the first to use fuzzy risk scores to decide transportation modes. The risks of transport modes are scored by decision makers with linguistic variables and then fuzzified. The results show that transport mode decisions are affected not only by risk coefficients but also transportation costs. The results introduce new findings that risk weights can change the decisions of transport modes and routes. For example, without considering risk weights, all demands could be provided to Ostrava by road transport. The results show that an intermodal network including marine and rail modes is used because of the risk weights. Thus, the freight forward can use this risk approach as the main basis to design an improved transportation network.
This paper has both academic and practical implications. The paper provides a new mathematical model for transport mode selection, integrating a mathematical modeling approach and a fuzzy approach. The paper also presents factors that are important when deciding road, rail, and marine modes. The findings show that risk factors should be given priority. Regarding the managerial view, freight forwarders and decision makers, who have responsibilities to decide transport modes, can determine sustainable supply chain solutions. Rail transport should be chosen by all policymakers for a cleaner world. Sustainability factors can be considered in the supply chain sector instead of only cost and time factors.
Though this paper only considers transport modes for Turkey and European customers, there are contributions regarding practical and theoretical aspects. Few studies have focused on time, cost, and smart solutions to design a supply chain network. The present study provides both economic and social factors for deciding transport modes from Turkey to European customers. A real case study was constructed to help decision makers who are to select the optimum modes. Both a mathematical modeling approach and a fuzzy designer are developed to achieve these aims. To generalize the results, other regions can be added to the network to compare all alternatives to decide the most appropriate route and modes. In future work, more social and ecological risk parameters, such as congestion, speed, reliability, and energy intensity, can be added to the system. Additionally, air transport can be evaluated based on these risk parameters. Risk weights can be determined with other risk tools such as Failure Mode and Effect Analysis, Fault Tree Analysis, and Fine–Kinney. This study can be replicated by including the import process or both the import and export processes simultaneously.
Author Contributions
The paper was managed by E.G. and R.E. Both authors contributed to the paper.
Funding
This research received no external funding.
Acknowledgments
We are grateful to Ebru Al and Özgür Ülker at the Ekol Lojistik R&D Department for their contributions.
Conflicts of Interest
The authors declare no conflict of interest.
References
- Oudani, M.; Alaoui, A.E.H.; Boukachour, J. An efficient genetic algorithm to solve the intermodal terminal location problem. Int. J. Sup. Oper. Man. 2014, 1, 279–296. [Google Scholar]
- World Health Organization (WHO). Global Status Report on Road Safety. Available online: http://www.who.int/violence_injury_prevention/road_safety_status/report/en/ (accessed on 10 September 2018).
- Past Energy Related Emissions from the Climate Change Performance Index (CCPI). Past Non-Energy and Future Emissions Projections from the Climate Action Tracker (CAT). Available online: https://germanwatch.org/sites/germanwatch.org/files/publication/15999.pdf (accessed on 9 September 2018).
- Lopez-Navarro, M.A. Environmental factors and intermodal freight transportation: Analysis of the decision bases in the case of Spanish motorways of the sea. Sustainability 2014, 6, 1544–1566. [Google Scholar] [CrossRef] [Green Version]
- Jugovic, A.; Debelic, B.; Brdar, M. Short sea shipping in Europe factor of the sustainable development transport system of Croatia. Sci. J. Marit. Res. 2011, 25, 109–124. [Google Scholar]
- Janic, M. Modelling the full costs of an intermodal and road freight transport network. Trans. Res. D 2007, 12, 33–44. [Google Scholar] [CrossRef]
- Mostert, M.; Limbourg, S. External costs as competitiveness factors for freight transport—A state of the art. Trans. Rev. 2016, 36, 692–712. [Google Scholar] [CrossRef]
- Janic, M. An assessment of the performance of the European long intermodal freight trains (LIFTS). Trans. Res. A 2008, 42, 1326–1339. [Google Scholar] [CrossRef]
- Janic, M.; Vleugel, J. Estimating potential reductions in externalities from rail-road substitution in Trans-European freight transport corridors. Trans. Res. D 2012, 17, 154–160. [Google Scholar] [CrossRef]
- Gennaro, M.C.; Paffumi, E.; Martini, G. Big data for supporting low-carbon road transport policies in Europe: Applications, challenges and opportunities. Big Data Res. 2016, 6, 11–25. [Google Scholar] [CrossRef]
- Sgouris, S.; Bonnefoy, P.A.; Hansman, R.J. Air transportation in a carbon constrained world: Long term dynamics of policies and strategies for mitigating the carbon footprint of commercial aviation. Trans. Res. A 2011, 45, 1077–1091. [Google Scholar]
- Li, Y.; Bao, L.; Li, W.; Deng, H. Inventory and policy reduction potential of greenhouse gas and pollutant emissions of road transportation industry in china. Sustainability 2016, 8, 1218. [Google Scholar] [CrossRef]
- World Health Organization (WHO). Global Status Report on Road Safety 2013: Supporting a Decade of Action (Official Report); WHO: Geneva, Switzerland, 2013. [Google Scholar]
- Tuzkaya, U.R. Evaluating the environmental effects of transportation modes using an integrated methodology and an application. Int. J. Environ. Sci. Technol. 2009, 6, 277–290. [Google Scholar] [CrossRef] [Green Version]
- Min, H. International intermodal choices via chance constrained goal programming. Trans. Res. A 1991, 25, 351–362. [Google Scholar] [CrossRef]
- Choong, S.T.; Cole, M.H.; Kutanoglu, E. Empty container management for intermodal transportation networks. Trans. Res. Part E Logist. Transp. Rev. 2002, 38, 423–438. [Google Scholar] [CrossRef] [Green Version]
- Chang, T.S. Best routes selection in international intermodal networks. Comput. Oper. Res. 2008, 35, 2877–2891. [Google Scholar] [CrossRef]
- Bauer, J.; Bektaş, Y.; Crainic, T.G. Minimizing greenhouse gas emissions in intermodal freight transport: An application to rail service design. J. Oper. Res. Soc. 2010, 61, 530–542. [Google Scholar] [CrossRef]
- Verma, M.; Verter, V.; Zufferey, N. A bi-objective model for planning and managing rail-truck intermodal transportation of hazardous materials. Trans. Res. Part E 2012, 48, 132–149. [Google Scholar] [CrossRef]
- Tierney, K.; Voß, S.; Stahlbock, R. A mathematical model of inter-terminal transportation. Eur. J. Oper. Res. 2014, 235, 448–460. [Google Scholar] [CrossRef]
- Serper, E.Z.; Alumur, S.A. The design of capacitated intermodal hub networks with different vehicle types. Trans. Res. Part B 2016, 86, 51–65. [Google Scholar] [CrossRef]
- Baykasoğlu, A.; Subulan, K. A multi-objective sustainable load planning model for intermodal transportation networks with a real-life application. Trans. Res. Part E 2016, 95, 207–247. [Google Scholar] [CrossRef]
- Tian, W.L.; Cao, C.X. A generalized interval fuzzy mixed integer programming model for a multimodal transportation problem under uncertainty. Eng. Optim. 2017, 49, 481–498. [Google Scholar] [CrossRef]
- Xie, Y.C.; Lu, W.; Wang, W.; Quadrifoglio, L. A multimodal location and routing model for hazardous materials transportation. J. Hazard. Mater. 2012, 227–228, 135–141. [Google Scholar] [CrossRef] [PubMed]
- Kunadhamraks, P.; Hanaoka, S. Evaluating the logistics performance of intermodal transportation in Thailand. Asia Pac. J. Mark. Logist. 2008, 20, 323–342. [Google Scholar] [CrossRef]
- Qu, L.; Chen, Y. A hybrid MCDM Method for Route Selection of Multimodal Transportation Network. Adv. Neural Netw. 2008, 5263, 374–383. [Google Scholar]
- Moon, D.S.; Kim, D.J.; Lee, E.K. A study on Competitiveness of Sea Transport by Comparing International Transport Routes between Korea and EU. Asian J. Shipp. Logist. 2015, 31, 1–20. [Google Scholar] [CrossRef]
- Wang, Y.; Yeo, G.T. A Study on International Multimodal Transport Networks from Korea to Central Asia: Focus on Secondhand Vehicles. Asian J. Shipp. Logist. 2016, 32, 41–47. [Google Scholar] [CrossRef]
- Wang, Y.; Yeo, G.T. Intermodal route selection for cargo transportation from Korea to Central Asia by adopting Fuzzy Delphi and Fuzzy ELECTRE I methods. Marit. Policy Manag. 2018, 45, 3–18. [Google Scholar] [CrossRef]
- Banyai, T.; Illes, B.; Banyai, A. Smart scheduling: An integrated first mile and last mile supply approach. Complexity 2018, 2018, 5180156. [Google Scholar] [CrossRef]
- Banyai, T. Real-time decision making in first mile and last mile logistics: How smart scheduling affects energy efficiency of hyperconnected supply chain solutions. Energies 2018, 11, 1833. [Google Scholar] [CrossRef]
- Yuan, B.; Gu, B.; Guo, J.; Xia, L.; Xu, C. The optimal decisions for a sustainable supply chain with carbon information asymmetry under cap-and-trade. Sustainability 2018, 10, 1002. [Google Scholar] [CrossRef]
- Brandenburg, M. Low carbon supply chain configuration for a new product—A goal programming approach. Int. J. Prod. Res. 2015, 53, 6588–6610. [Google Scholar] [CrossRef]
- Mari, S.I.; Lee, Y.H.; Memon, M.S. Sustainable and resilient supply chain network design under disruption risks. Sustainability 2014, 6, 6666–6686. [Google Scholar] [CrossRef]
- Glickman, T.S.; Erkut, E.; Zschocke, M.S. The cost and risk impacts of rerouting railroad shipments of hazardous materials. Accid. Anal. Prev. 2007, 39, 1015–1025. [Google Scholar] [CrossRef] [PubMed] [Green Version]
- Bubbico, R.; Maschio, G.; Mazzarotta, B.; Milazzo, M.F.; Parisi, E. Risk management of road and rail transport of hazardous materials in Sicily. J. Loss Prev. Proc. Ind. 2006, 19, 32–38. [Google Scholar] [CrossRef]
- Verma, M.; Verter, V. A lead-time based approach for planning rail–truck intermodal transportation of dangerous goods. Eur. J. Oper. Res. 2010, 202, 696–706. [Google Scholar] [CrossRef]
- Raemdonck, K.V.; Macharis, C.; Mairesse, O. Risk analysis system for the transport of hazardous materials. J. Saf. Res. 2013, 45, 55–63. [Google Scholar] [CrossRef] [PubMed]
- Fabiano, B.; Currò, F.; Palazzi, E.; Pastorino, R. A framework for risk assessment and decision-making strategies in dangerous good transportation. J. Hazard. Mater. 2002, 93, 1–15. [Google Scholar] [CrossRef]
- Huang, B.; Cheu, R.L.; Liew, Y.S. GIS and genetic algorithms for HAZMAT route planning with security considerations. Int. J. Geogr. Inf. Sci. 2004, 18, 769–787. [Google Scholar] [CrossRef]
- Guo, X.; Verma, M. Choosing vehicle capacity to minimize risk for transporting flammable materials. J. Loss Prev. Proc. Ind. 2010, 23, 220–225. [Google Scholar] [CrossRef]
- Yang, J.; Li, F.; Zhou, J.; Zhang, L.; Huang, L.; Bi, J. A survey on hazardous materials accidents during road transport in China from 2000 to 2008. J. Hazard. Mater. 2010, 184, 647–653. [Google Scholar] [CrossRef] [PubMed]
- Winslott Hiselius, L. Using choice experiments to assess people’s preferences for railway transports of hazardous materials. Risk Anal. 2005, 25, 1199–1214. [Google Scholar] [CrossRef] [PubMed]
- Verma, M. A cost and expected consequence approach to planning and managing railroad transportation of hazardous materials. Trans. Res. Part D 2009, 14, 300–308. [Google Scholar] [CrossRef]
- Reilly, A.; Nozick, L.; Xu, N.; Jones, D. Game theory-based identification of facility use restrictions for the movement of hazardous materials under terrorist threat. Trans. Res. Part E 2012, 48, 115–131. [Google Scholar] [CrossRef]
- Liu, X.; Saat, M.R.; Barkan, C.P.L. Probability analysis of multiple tank-car release incidents in railway hazardous materials transportation. J. Hazard. Mater. 2014, 276, 442–451. [Google Scholar] [CrossRef] [PubMed]
- Reniers, G.L.L.; Dullaert, W. A method to assess multi-modal Hazmat transport security vulnerabilities: Hazmat transport SVA. Trans. Policy 2013, 28, 103–113. [Google Scholar] [CrossRef]
- Islam, D.M.Z.; Ricci, S.; Nelldal, B.L. How to make modal shift from road to rail possible in the European transport market, as aspired to in the EU Transport White Paper 2011. Eur. Trans. Res. Rev. 2016, 8, 18. [Google Scholar] [CrossRef]
- Hanaoka, S.; Kunadhamraks, P. Multiple criteria and fuzzy based evaluation of logistics performance for intermodal transportation. J. Adv. Trans. 2009, 43, 123–153. [Google Scholar] [CrossRef]
- Tuzkaya, U.R.; Onut, S. A fuzzy analytic network process based approach to transportation-mode selection between Turkey and Germany: A case study. Inf. Sci. 2008, 178, 3133–3146. [Google Scholar] [CrossRef]
- Sterzik, S.; Kopfer, H. A tabu search heuristic for the inland container transportation problem. Comput. Oper. Res. 2013, 40, 953–962. [Google Scholar] [CrossRef]
- Ekol Logistics. Available online: https://www.ekol.com/en/services/freight/intermodal/routes/ (accessed on 1 September 2018).
Figure 1.
The proposed intermodal transportation network.

Figure 2.
Design of proposed fuzzy-based approach

Figure 3.
An example of membership function plot for input variables.

Figure 4.
Membership function plot of the output variable.

Figure 5.
Decision rules formed for transport modes.

Figure 6.
İnput and output values according to decision rules (with medium fuzzy numbers).

Figure 7.
Input and output values according to the decision rules (for road transportation).

Figure 8.
Company’s multimodal logistics network configuration [52].
Figure 8.
Company’s multimodal logistics network configuration [52].


Table 1.
(Export) From Turkey FTLF, FTLB, and LTL flow (×102).
| FTLF | FTLB | LTL | ||||||||||||||||
|---|---|---|---|---|---|---|---|---|---|---|---|---|---|---|---|---|---|---|
| Period | 1 | 2 | 3 | 4 | 5 | 6 | 1 | 2 | 3 | 4 | 5 | 6 | 1 | 2 | 3 | 4 | 5 | 6 |
| Ostrava | 230 | 210 | 128 | 140 | 140 | 110 | 150 | 110 | 200 | 188 | 160 | 218 | - | 100 | 50 | 120 | - | 95 |
| Bratislava | 218 | 226 | 210 | 230 | 206 | 145 | 200 | 220 | 220 | 210 | 130 | 228 | 380 | 210 | 500 | 700 | 10 | 21 |
| Poland | 138 | 108 | 220 | 238 | 232 | 110 | 260 | 128 | 226 | 218 | 158 | 220 | 10 | 30 | 89 | 48 | 12 | 70 |
Table 2.
(Export) From Turkey ports FTLF, FTLB, and LTL flow.
| FTLF | FTLB | LTL | ||||||
|---|---|---|---|---|---|---|---|---|
| Period | 3 | 4 | 5 | 6 | 1 | 2 | 1 | 5 |
| Trieste port | 10,000 | 10,000 | 9000 | 10,000 | 7000 | 10,000 | 3000 | 1000 |
Table 3.
(Export) From Trieste ports FTLF, FTLB, LTL flow.
| FTLF | FTLB | LTL | ||||||
|---|---|---|---|---|---|---|---|---|
| Period | 3 | 4 | 5 | 6 | 1 | 2 | 1 | 5 |
| Ostrava | 10,000 | 10,000 | 9000 | 10,000 | 7000 | 10,000 | 3000 | 1000 |
Table 4.
Number of trucks, Roros, and trains for all transportation modes.
| Period | Road | Marine | Rail | |||||||||||||||
|---|---|---|---|---|---|---|---|---|---|---|---|---|---|---|---|---|---|---|
| 1 | 2 | 3 | 4 | 5 | 6 | 1 | 2 | 3 | 4 | 5 | 6 | 1 | 2 | 3 | 4 | 5 | 6 | |
| Ostrava | 115 | 105 | 100 | 94 | 80 | 109 | - | - | - | - | - | - | - | - | - | - | - | - |
| Bratislava | 109 | 113 | 110 | 115 | 103 | 114 | - | - | - | - | - | - | - | - | - | - | - | - |
| Poland | 130 | 64 | 113 | 119 | 116 | 114 | - | - | - | - | - | - | - | - | - | - | - | - |
| Trieste | - | - | - | - | - | - | 14 | 20 | 20 | 20 | 18 | 20 | - | - | - | - | - | - |
| Ostrava | - | - | - | - | - | - | - | - | - | - | - | - | 70 | 100 | 100 | 100 | 90 | 100 |
© 2018 by the authors. Licensee MDPI, Basel, Switzerland. This article is an open access article distributed under the terms and conditions of the Creative Commons Attribution (CC BY) license (http://creativecommons.org/licenses/by/4.0/).
Share and Cite
MDPI and ACS Style
Göçmen, E.; Erol, R. The Problem of Sustainable Intermodal Transportation: A Case Study of an International Logistics Company, Turkey. Sustainability 2018, 10, 4268. https://doi.org/10.3390/su10114268
AMA Style
Göçmen E, Erol R. The Problem of Sustainable Intermodal Transportation: A Case Study of an International Logistics Company, Turkey. Sustainability. 2018; 10(11):4268. https://doi.org/10.3390/su10114268
Chicago/Turabian StyleGöçmen, Elifcan, and Rızvan Erol. 2018. "The Problem of Sustainable Intermodal Transportation: A Case Study of an International Logistics Company, Turkey" Sustainability 10, no. 11: 4268. https://doi.org/10.3390/su10114268
Note that from the first issue of 2016, this journal uses article numbers instead of page numbers. See further details here.