Article

Spatio-Temporal Reorganization of Cropland Development in Central Asia during the Post-Soviet Era: A Sustainable Implication in Kazakhstan

1
School of Soil and Water Conservation, Beijing Forestry University, Beijing 100083, China
2
Institute of Desertification Studies, Chinese Academy of Forestry, Beijing 100091, China
*
Authors to whom correspondence should be addressed.
Sustainability 2018, 10(11), 4042; https://doi.org/10.3390/su10114042
Submission received: 20 September 2018 / Revised: 22 October 2018 / Accepted: 30 October 2018 / Published: 5 November 2018
(This article belongs to the Section Sustainable Agriculture)

Abstract

:
The abandonment and cultivation of croplands in the Eurasian Steppe has become the focus of global and regional food security and agricultural policy-making. A large area of cropland in some post-Soviet countries has proven to be abandoned with the disintegration of the Soviet Union; however, it is unclear as to whether Kazakhstan also experienced a similar change as one of the main food providers for the former Soviet Union. In this study, we used the annual land cover dataset (1992–2015) from the European Space Agency, Climate Change Initiative (ESA-CCI) to detect spatio-temporal characteristics of rainfed and irrigated cropland changes in Kazakhstan. The Mann–Kendall test and regime shift analysis showed that rainfed and irrigated cropland at national level had a significant increasing trend with a significant rising up to 1999 and stagnation during 2000–2015, which was further confirmed with analysis at 14 regions. The greatest contributor to rainfed and irrigated croplands was steppes, followed by shrinkage of water bodies since 2005 to a great extent, rapid urbanization process resulted in losses of a part of irrigated oases. The trend surface analysis indicated that reorganized stable pattern characterized by rainfed cropland in north and irrigated cropland in south was driven by the strategy of the gradual agricultural development of oases. The nonexistence of cycle between the abandonment and recultivation proved that newly-gained cropland from steppe may be less degraded and more productive for sustainable land use in Kazakhstan. In conclusion, this study can provide strong evidence for sustainable land use and a basis for food security policy-making in Kazakhstan, and even all of the Central Asian countries in the future.

Graphical Abstract

1. Introduction

The Eurasian Steppe has historically served as the home for pastoral nomads [1,2,3]. Since the last Ice Age, this large inland area had been disturbed by the encroachment of sedentary civilization, which was accompanied by intensified grazing and cropland cultivation [4,5]; however, this change was gradual and fluctuated. Drastic changes started at the beginning of the 20th century when increasingly larger areas of the Eurasian Steppe became parts of communist states, especially the former Soviet Union [6,7,8], and peaked between the 1950s and 1960s with the Virgin Land Program in the former Soviet Union [9] and the Great Leap Campaign in China [10]. These newly rising governments centralized landownership, land management, and production plans, which implied or explicitly aimed at ending nomadism in the steppe [6]. A very large steppe area was exploited for agricultural production, and the steppe region as a whole had become the food base of Russia, Europe and China [11,12,13]. Another radical change occurred following the collapse of the former Soviet Union in 1991, when large tracts of government-controlled cultivated land were returned to herders or farmers. This soon led to fallow and the abandonment of a large area of plowed steppe because there was a lack of mechanical means and laborers; therefore, traditional culture and the secondary steppes regenerated [14,15]. Shortly thereafter, frantic production reemerged, and the re-plowing of the secondary steppes began, which was particularly intense in some post-Soviet countries [16,17].
As the world’s largest inland countries, Kazakhstan had been an Autonomous Socialist Republic within the USSR for almost 70 years [18]. Kazakhstan was proud of her agricultural production and was well-known as the breadbasket of Eastern Europe and Central Asia [19,20], and especially Russia’s agricultural crutch [21]. After achieving its independence in December 1991, Kazakhstan’s agricultural policy underwent some changes [22,23]; however, whether Kazakhstan had also experienced changes similar to other post-Soviet countries in the Eurasian Steppe [24] is unknown [25,26]. As an arid landlocked country, Kazakhstan’s agricultural system, which mainly included irrigated cropland and rainfed cropland, was very vulnerable to water resources influenced by climate change [27,28,29]. Therefore, understanding cropland change trajectories is helpful in the formulation of positive and effective agricultural policy to ensure the dual goals of sustainable management for food security and responsible water resource use in Kazakhstan [30,31,32].
In our study, on the basis of reclassified Kazakhstan land cover data from the ESA-CCI land cover dataset, we analyzed the spatio-temporal pattern change of rainfed and irrigated cropland from national and regional levels and from the whole study period and five subperiods (SPs). We attempted to address the following three research questions: (1) Have rainfed and irrigated cropland areas been significantly expanding or shrinking in the post-Soviet era? (2) From what type of land cover was cropland gained, and what is the spatial distribution pattern of these croplands? (3) Does a large area of abandonment and recultivation cycle exist? The results of this study will answer if land cover change in the post-Soviet era forms a stable and sustainable pattern, which is useful to develop scientific land use and food security policies in Kazakhstan and all of Central Asia.

2. Materials and Methods
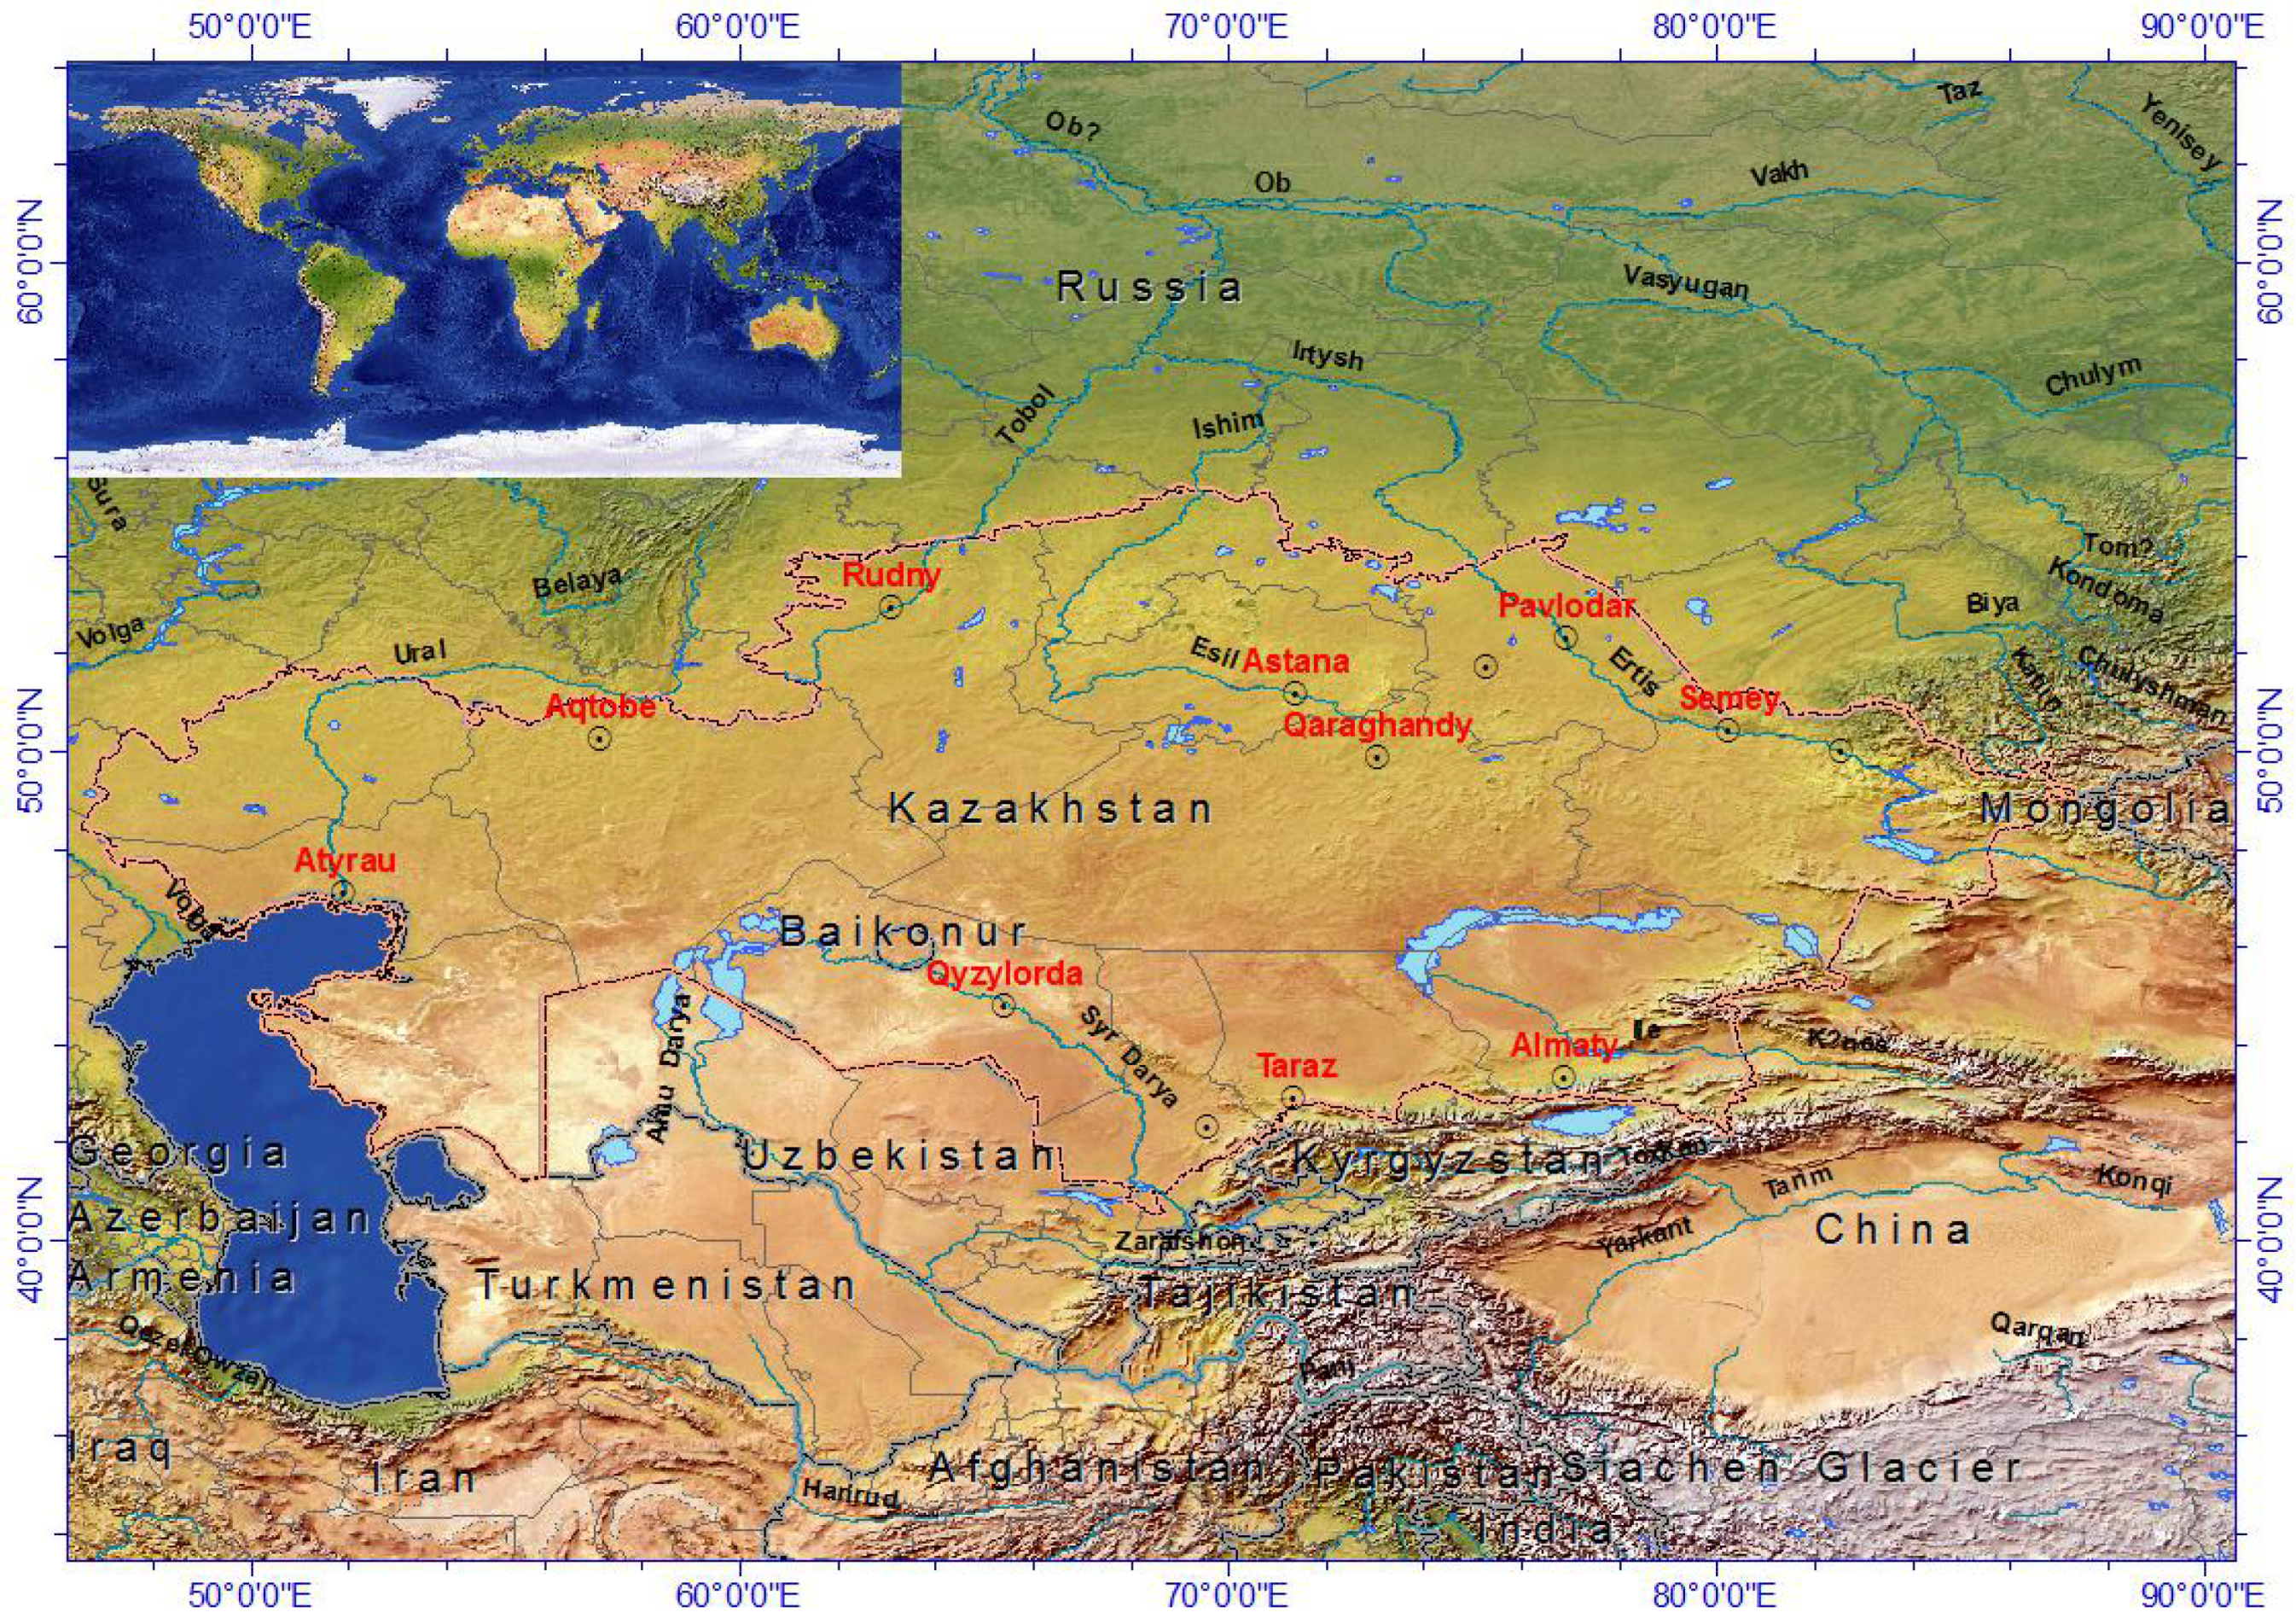
2.1. Study Area

Kazakhstan is located in the interior of the Eurasian landmass, about 2500 km from the closest ocean. The total area of the territory is 2.6 million km2 covering latitudes from approximately 40° N to 55° N and longitudes from 50° E to 85° E, bordering Turkmenistan, Uzbekistan, Kyrgyzstan in the south, Russia in the north, China in the east, and the Caspian Sea in the west (Figure 1) [18,33].
The dominant land features are the Caspian Sea in western Kazakhstan, an arid to semiarid low-lying plain in most of west-central Kazakhstan, and deserts interrupted by occasional green oases in the south-central border area. High, rugged, and heavily glaciated mountains exist in Southeastern Kazakhstan, including the Kirgiz, Tien Shan, and Altai ranges. An area of hills, plateaus, and low mountains occupy the northeastern one-third of Kazakhstan [34]. Three major rivers, the Irtysh, Ishim, and Tobol, flow northward to join the larger Russian rivers that ultimately drain into the Arctic Ocean.
The climate in Kazakhstan is a warm temperate continental climate and has three climatic zones as arid, dry continental, and highland. Arid parched desert landscapes account for 40–50% of the country and have less than 250 mm of annual precipitation. Approximately 40% of the country occupies a broad belt of the dry continental climate with 250–500 mm of annual precipitation. In addition, in the highland, some areas have 800 mm of annual precipitation (with most occurring as snow) [18]. Kazakhstan’s summers are hot, with temperatures over 32 °C throughout much of the country, with temperatures as high as 43 °C in the southwestern deserts, while the winter temperatures often fall to −18 °C and can be as cold as −46 °C. The average annual number of days of sunshine for most of Kazakhstan is 200 days [35,36].
There are few scattered xerophytic (drought-resistant) plants that exist in the arid desert area. Steppe is the main ecosystem type in semiarid plain regions, and woodlands occur mainly in the cooler and wetter mountainous areas. More than 500 native plant species and dozens of wild animals grow only in Kazakhstan. An estimated 150 species of fish inhabit Kazakhstan’s several thousand lakes. At present, Kazakhstan also has nine nature reserves [18].
Approximately 12% of Kazakhstan has soils that are suitable for agriculture. In much of the western, southern, and central portions of the country, soils are alkaline, sandy, and often saline—very poorly suited for agriculture. In the eastern and southeastern upland areas, the soil dominated by loams is of good quality, which presents an opportunity for high-yield farming. Spring wheat and barley are the principal crops grown using a dryland cultivation system of rotation with fallow every 3–4 years [22,37].
Kazakhstan is one of the least densely populated countries with a 16.7 million population, land is the largest natural resource but receives little investment from the Republic and local government; for example, among an overall budget for seven years (2004–2010) amounted to KZT 976 million (USD 7 million) for rural territory, only KZT 2 million (USD 14 thousand) was allocated to land issues [22].Obviously, agriculture is a huge and neglected industry in Kazakhstan.

2.2. Dataset Preprocessing

In this study, 24 consistent global annual land cover maps (1992–2015), with a 300 m spatial resolution, were chosen to analyze cropland dynamics. The coordinate reference system (CRS) used for the global land cover databases is a geographic coordinate system (GCS) based on the World Geodetic System 84 (WGS84) reference ellipsoid. This dataset was provided by the CCI-LC (Climate Change Initiative, Land Cover) project, ESA (European Space Agency) (http://maps.elie.ucl.ac.be/CCI/viewer/download.php), and has been applied in cropland, forest, and plant functional type research at the regional and global scales [38,39,40]. We masked this global land cover dataset with the administrative boundary of Kazakhstan and its 14 regions, which was acquired from the Global Administrative Areas (GADM) dataset (V3.6, released on 6 May 2018, https://gadm.org/index.html) with longitude/latitude the coordinate reference system and the WGS84 as the datum. Then, we aggregated the 37 subdatasets of the ESA land cover classes for Kazakhstan into 8 classes according to the UNCCD (United Nations Convention to Combat Desertification and Drought) land cover category with the following two important differences:
(1)
Since the majority of the Kazakhstan territory is desertification-prone with high-frequent drought [41,42], water was the most significant limiting factor for dryland agriculture [43,44]; hence, croplands were subdivided into rainfed cropland and irrigated cropland in this study.
(2)
The word steppe was used instead of grasslands in this study. As one Russian word for “grassy plain”, steppe is mostly dominated by short grasses without trees [2].
The new classification for the ESA-CCI land cover dataset is listed in Table 1.

2.3. Analysis Methods

First, we divided the whole of Kazakhstan into 14 administrative regions at spatial scale and the whole study period (24 years) into five subperiods (SPs) with a five year interval except the first subperiod with four years (1992–1995) at temporal scale; i.e., SP-I(1992–1995), SP-II(1995–2000), SP-III(2000–2005), SP-IV(2005–2010) and SP-V (2010–2015), which is a suitable temporal scale for time series related analysis [45,46]. Then we conducted a time series analysis to detect significant changes in cropland (rainfed and irrigated) at the national and regional levels during the whole study period. In addition, FAO (Food and Agriculture Organization of the United Nations) arable land statistics for Kazakhstan (available from http://www.fao.org/faostat/en/#country/108) were also analyzed for comparison. Here, the Mann–Kendall test method was employed for time series analysis, which is an often-used nonparametric test method to analyze trends in meteorological data [47,48] because it is less sensitive to outliers [49,50,51], and has been broadly applied in hydrology and water resource research [52,53]. The test is based on the Kendall’s S statistic as follows:
S = i = 1 n 1 k = i + 1 n sgn ( x k x i )
And
var ( S ) = n ( n 1 ) ( 2 n + 5 ) i = 1 n e i i ( i 1 ) ( 2 i + 5 ) 18
where S is Kendall’s statistic, which is expected to have N(0,var(S)) distribution with the null hypothesis H0 that there is no trend displayed by the time series. x k and x i are sequential data values representing the annual values in years k and i, respectively; n is the length of the dataset; sgn ( θ ) = 1 if θ < 0 , sgn ( θ ) = 0 if θ = 0 , sgn ( θ ) = 1 if   θ > 0 ; e i is the number of ties of extent i.
The Mann–Kendall test statistic Z c is computed by:
Z c = S 1 var ( S )   ,   if   S > 0
Z c = 0 ,   if   S = 0
Z c = S + 1 var ( S ) ,   if   S < 0
where, Z c is a standard normal variable, The null hypotheses that Z c is not statistically significant or has no significant trend will be accepted if Z 1 α / 2 Z c Z 1 α / 2 Z 1 α 2 Z c Z 1 α 2 , where ± Z 1 α / 2 ± Z 1 α 2 are the standard normal deviates and α α is the significance level for the test [54]. A positive Z c indicates an upward trend while a negative Z c indicates a downward trend [55]. The calculations were performed using the ‘rkt’ package [56] in the R software [57].
Sequential t tests for an analysis of regime shifts (STARS) [58] were employed simultaneously to test mean and variance values for statistically significant shifts between alternate states at national and regional levels during the whole study period. Attribute to its easy-to-use and statistically powerful analysis for shifts near the ends of the time series [59], this method has been applied mainly in oceanography [60,61,62] and expanded to terrestrial ecosystem applications recently [63,64,65]. In this method, when a new observation is added into a time series data, it is tested if there is a statistically significant deviation from the mean value of the current regime, if it is true, that time for this observation is marked as a potential change point c, and subsequent observations are used to accept or reject this hypothesis, which is tested by the regime shift index (RSI) as follows:
RSI = i = c c + m x i l σ l
where m = 0 , 1 , , l 1 (i.e., number of years since the start of a new regime), l is the cut-off length of the regimes tested, and σ l is the average standard deviation for allone-year intervals in the time-series. RSI is a cumulative sum of normalized deviations x i from thehypothetical mean level for the new regime ( x ¯ new ), for which the D, difference from the mean level for the current regime ( x ¯ cur ), is statistically significant according to a Student’s t-test:
D = x ¯ new x ¯ cur = t 2 σ l 2 / l
where t is the value of the t-distribution with 2 l 2 degrees of freedom at the given probability level p . If, at any time from the start of the new regime, RSI becomes negative, the test fails and a zero value is assigned. If RSI remains positive throughout l 1 , then c is declared to be the time of a regime shift at the level p . The search for the next regime shift starts with c + 1 to ensure that its timing is detected correctly even if the actual duration of the new regime is less than 1 year. In this analysis, STARS software was used to detect a regime shift of rainfed and irrigated cropland development periods from 1992 to 2015, and the software was parameterized as a probability equal to 0.05 to coincide with the Mann–Kendall test, cutoff length equal to five to coincide with the time steps of subperiods, and a Huber parameter equal to one for the default value [58,59].
Second, the Land Change Modeler (LCM) provided by the IDRISI TerrSet software, which had been applied to study LULCC in many studies [66,67], was used to evaluate gains and losses in land cover classes, land cover persistence, and specific transitions between selected categories based on cross-tabulation principles [68]. Using the aggregated land cover maps from 1992 to 2015 as input parameters, we identified the locations and magnitude of the rainfed and irrigated cropland changes and persistence. Then, the other land cover contributions to the net areal change in rainfed and irrigated cropland were analyzed and mapped with a cross-tabulation method for the whole study period and five subperiods.
Finally, we defined the transition from cropland to steppe as abandonment, the transition from steppe to cropland as cultivation, and the transition from new-gained steppe from abandoned cropland back to cropland as recultivation. We performed the grid-based calculation for each of the five subperiods to detect if a cycle of abandonment and recultivation exists using IDRIS TerrSet software analysis tools. In order to illuminate the possible transition between steppe and cropland directly, we used trend surface analysis (TSA) in LCM of the IDRISI TerrSet software to estimate the spatial trends of the transitions from steppe to rainfed or irrigated cropland. TSA, as an interpolation technique disaggregating the broad regional patterns from the nonsystematic, fine-scale variation within the data [68,69], assumes the inherent spatial trend of the observed data can be reasonably represented by a polynomial surface of closest fit to the observed ones by minimizing the difference between the interpolated value at a data location and its original value [70]. This is calculated mathematically as:
Z ( U , V ) = α 00 + α 10 U + α 01 V + α 20 U 2 + α 11 UV + + α pq U p V q
where Z stands for the transition from steppe to cropland (rainfed or irrigated). α represents the polynomial coefficients, and U and V represent the location coordinates. The TSA surfaces are calculated by assigning the pixels of a specific transition a value of 1 and pixels of no change a value of 0; they are then treated as if they were continuous values [68,69]. We performed the third-order polynomial TSA for transitions from steppe to cropland (rainfed or irrigated) to visualize the general locations of transitions in the whole study period and five subperiods. LCM in the IDRISI TerrSet software was used again to complete this calculation.

3. Results

3.1. Spatio-Temporal Change of Cropland Area at National and Regional Scales

3.1.1. National Level

Between 1992 and 2015, areas of rainfed cropland increased 18.59% from 333,169 km2 to 395,093 km2, or an increasing rate of 18.59%. The Mann–Kendall test showed that the increasing trend was significant ( p < 0.05 ) (Table 2), and significant change occurred in 1999 ( RSI 1999 = 2.456 ) (Figure 2a), whereas areas of irrigated cropland increased from 69,750 km2 to 76,223 km2, or an increasing rate of 9.28%, with significant increasing trend ( p < 0.05 ) (Table 2) and two significant change points in 1999 and 2003 respectively ( RSI 1999 = 2.319 , RSI 2003 = 0.408 ) (Figure 2b). However, data from FAO statistics showed that the area of arable land (defined as land under temporary crops, temporary meadows for mowing or pasture, land under market and kitchen gardens and land temporarily fallow for less than five years) in Kazakhstan decreased from 350,550 km2 to 293,950 km2, a decreasing rate of 16.15% at the same period, with a significant decreasing trend ( p < 0.05 ) (Table 2) and two significant change points in 1996 and 2000 respectively ( RSI 1996 = 1.283 , RSI 2000 = 2.001 ) (Figure 2c). The reason for this contrast trend may be the effects from the coarse resolution and inaccurate classification for the former (300 m spatial resolution) and from data sources of FAO estimates with official publication for the latter. Here, we considered that the former trend seems to be more reliable and could yield a more objective and reasonable trend of cropland change in Kazakhstan.

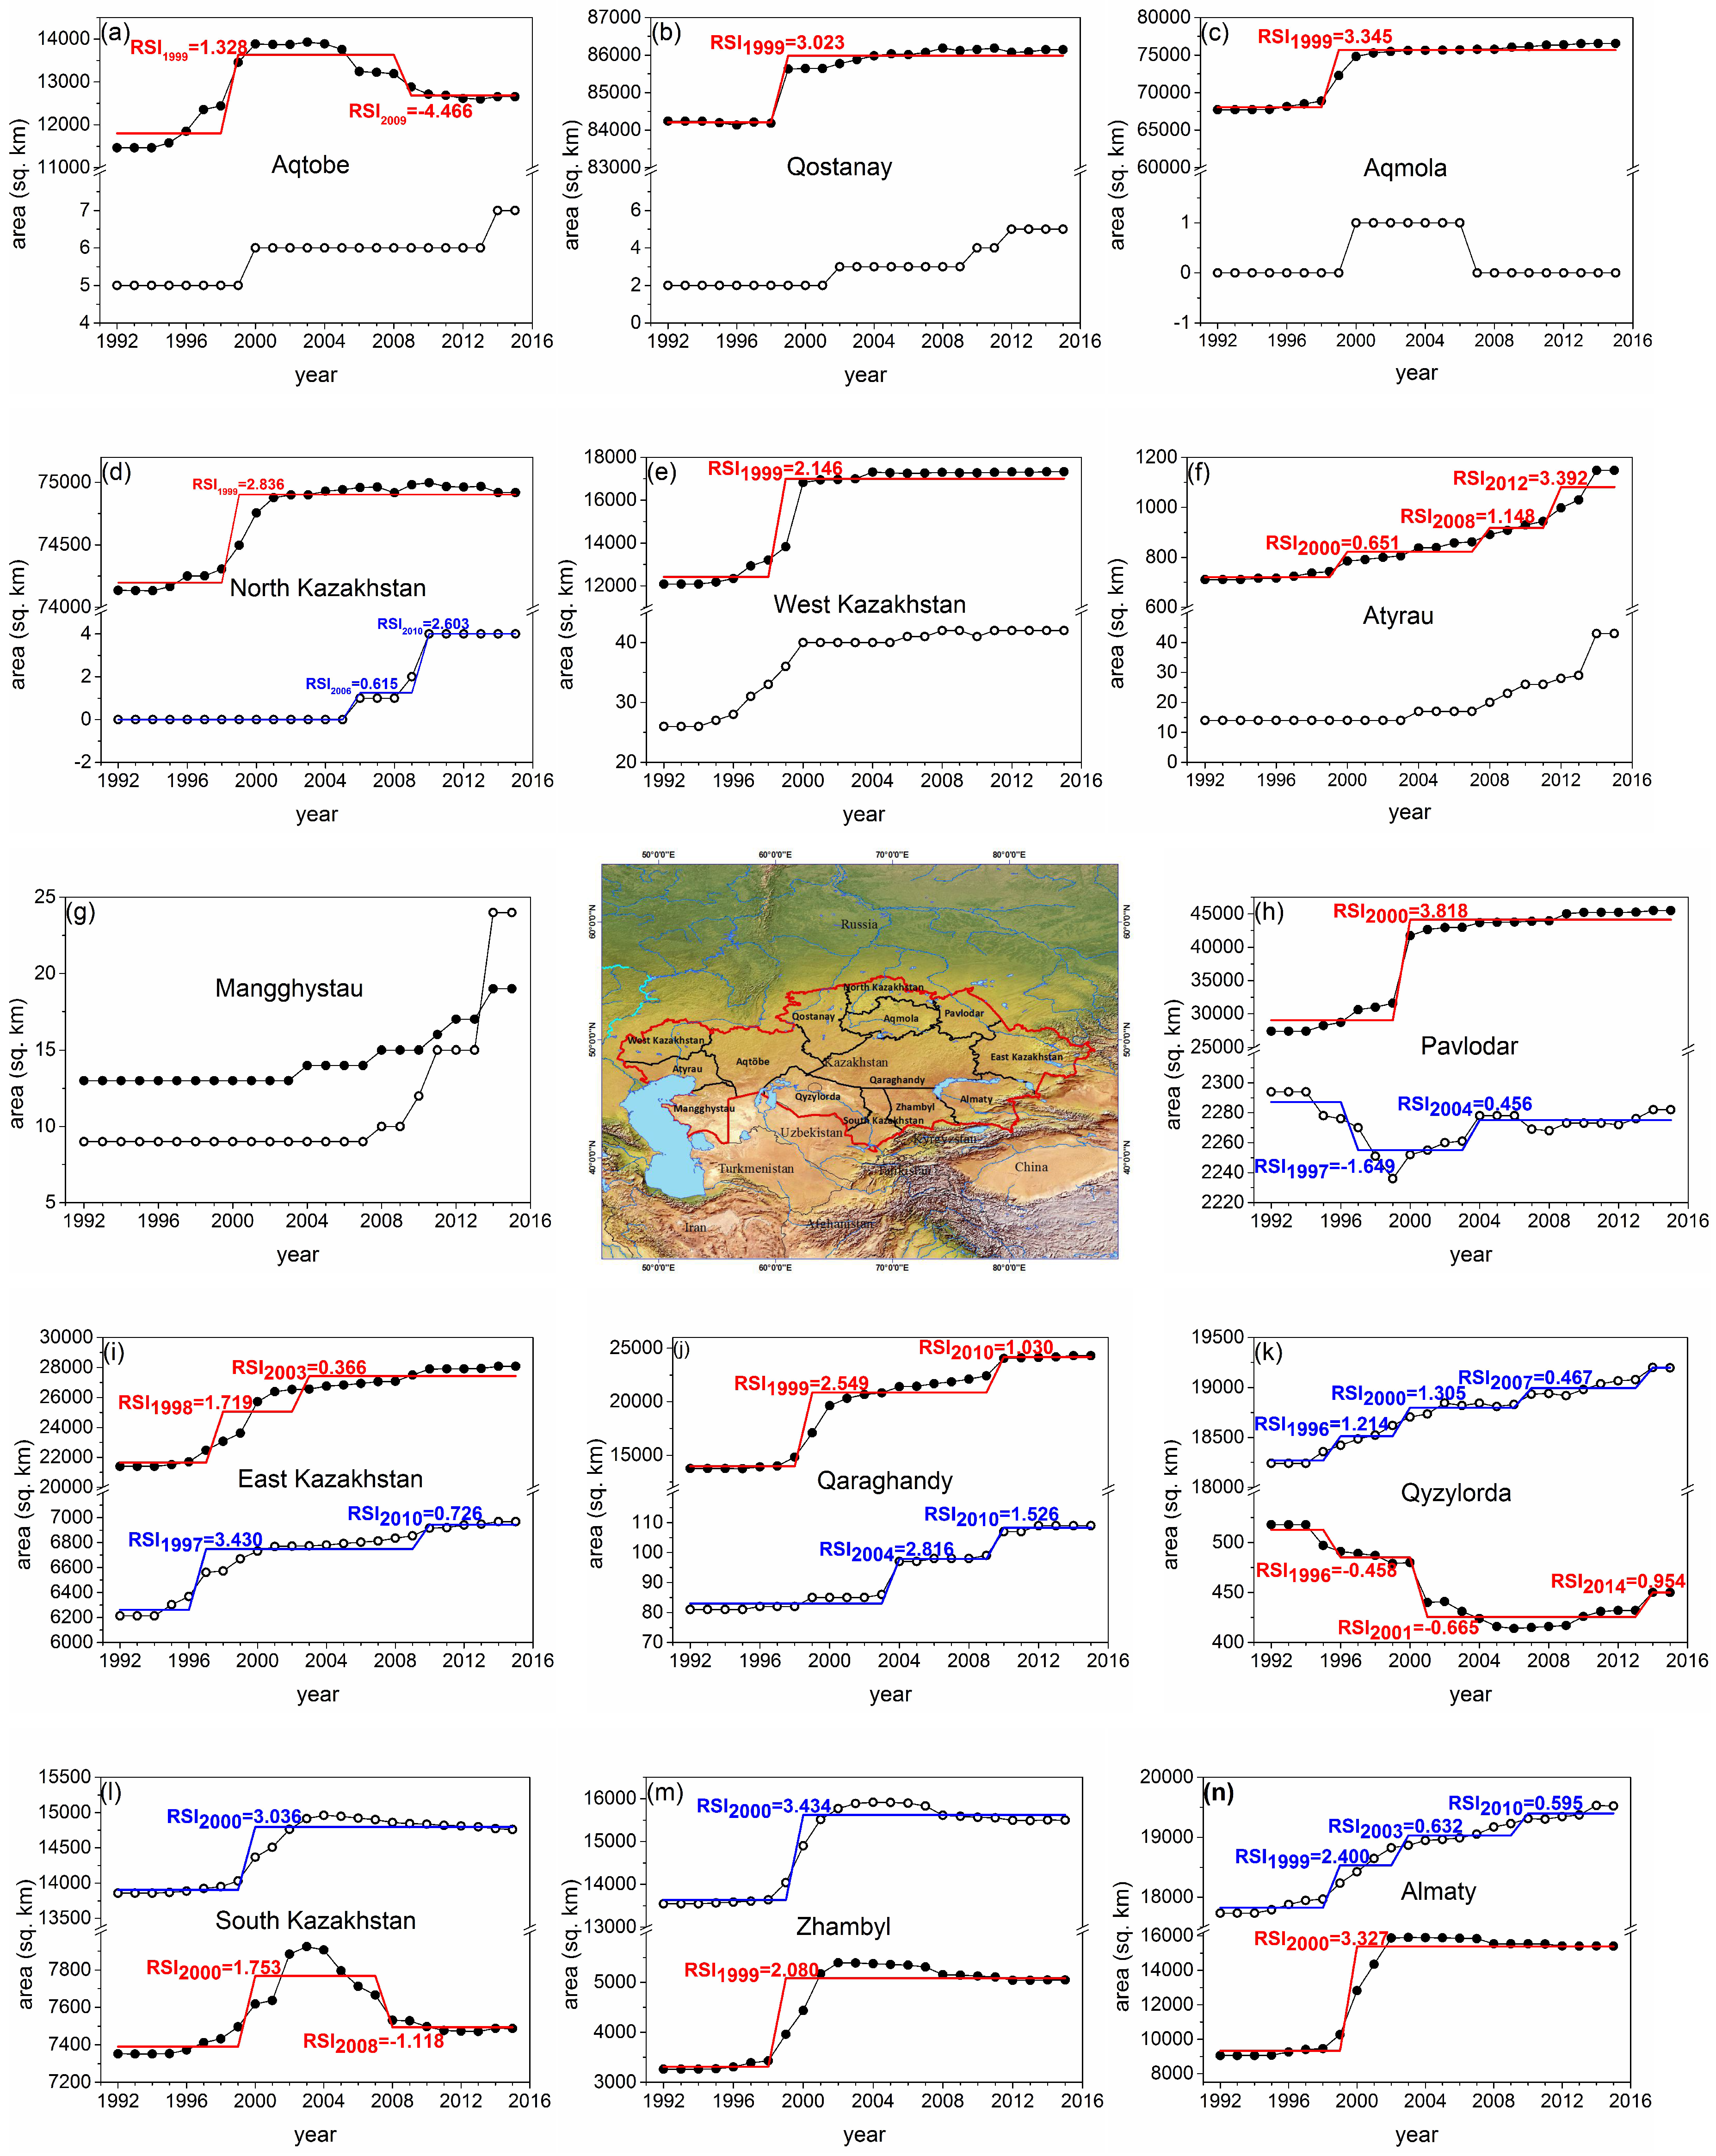
3.1.2. Regional Level

In the western, northern, eastern and central parts of the country, all of the rainfed cropland areas showed a significant increase ( p < 0.05 ) (Table 2) (Figure 3b–f,h–j) with one or several significant change points (most in 1999–2000), except in Aqtobe with insignificant increasing trend ( p < 0.05 ) (Table 2) as well as a significant increasing time point in 1999 and a significant decreasing point in 2009 (Figure 3a). Irrigated cropland in western and northern parts had smaller areas with less than 100 km2, even several km2, their significant changes were not tested in this study, while those in eastern and central parts showed a relatively complex condition, there was a relatively large area of irrigated cropland in East Kazakhstan with a significant increasing trend ( p < 0.05 ) (Table 2) and two significant increasing points in 1997 and 2010 respectively ( RSI 1997 = 3.430 , RSI 2010 = 0.726 ) (Figure 3i). Irrigated cropland in Qaraghandy in the Central part had a similar trend to East Kazakhstan, with a significant increasing trend ( p < 0.05 ) and two significant increasing points in 2004 and 2010 respectively ( RSI 2004 = 3.430 , RSI 2010 = 0.726 ), while an area of irrigated cropland in Pavlodar had no trend ( p < 0.05 ) with a decreasing point in 1997 and a slightly increasing point in 2004 respectively ( RSI 1997 = 1.649 , RSI 2004 = 0.456 ) (Figure 3h). An exception to Mangghystau near to the Caspian Sea in the western part is that almost no rainfed or irrigated cropland existed (Figure 3g), which could be attribute to arid climate, complex geomorphology, higher desertification risk, and the lowest population density [71,72,73].
In the southern part, due to rich water provision from glaciers and snowmelt on the north side of the Tien Shan Range [74], large irrigated oases developed. Here, the areas of irrigated cropland was more than that of rainfed cropland and showed significant increasing trends ( p < 0.05 ) in Qyzylorda, South Kazakhstan, Zhambyl and Almaty (Table 2, Figure 3k–n), only one significant shift point in 2000 can be detected for South Kazakhstan ( RSI 2000 = 3.036 , Figure 3l) and Zhambyl ( RSI 2000 = 3.434 , Figure 3m) respectively, while three significant shift points occurred in Qyzylorda ( RSI 1996 = 1.214 ,   RSI 2000 = 1.305 ,   RSI 2007 = 0.467 , Figure 3k) and Almaty ( RSI 1999 = 2.400 ,   RSI 2003 = 0.632 , RSI 2010 = 0.595 , Figure 3n) respectively, showing a continuous increasing trend, which benefited with water from the Syr Darya River and Ili River [75,76,77,78,79]. For rainfed cropland in the southern part, there were significant increasing trends ( p < 0.05 ) in Zhambyl and Alamty with one significant shift point in 1999 ( RSI 1999 = 2.080 , Figure 3m) and in 2000 ( RSI 2000 = 3.327 , Figure 3n) respectively, an insignificant increasing trend ( p < 0.05 ) in South Kazakhstan with one significant increasing point in 2000 ( RSI 2000 = 1.753 , Figure 3l) and a significant decreasing point in 2008 ( RSI 2008 = 1.118 ), and a significant decreasing trend ( p < 0.05 , Table 2) in Qyzylorda with two significant decreasing points in 1996 ( RSI 1996 = 0.458 ) and 2001 ( RSI 2001 = 0.665 ) as well as one significant increasing point in 2014 ( RSI 2014 = 0.954 ), which can be explained with a similar reason to Aqtobe (Figure 3k) [80,81].

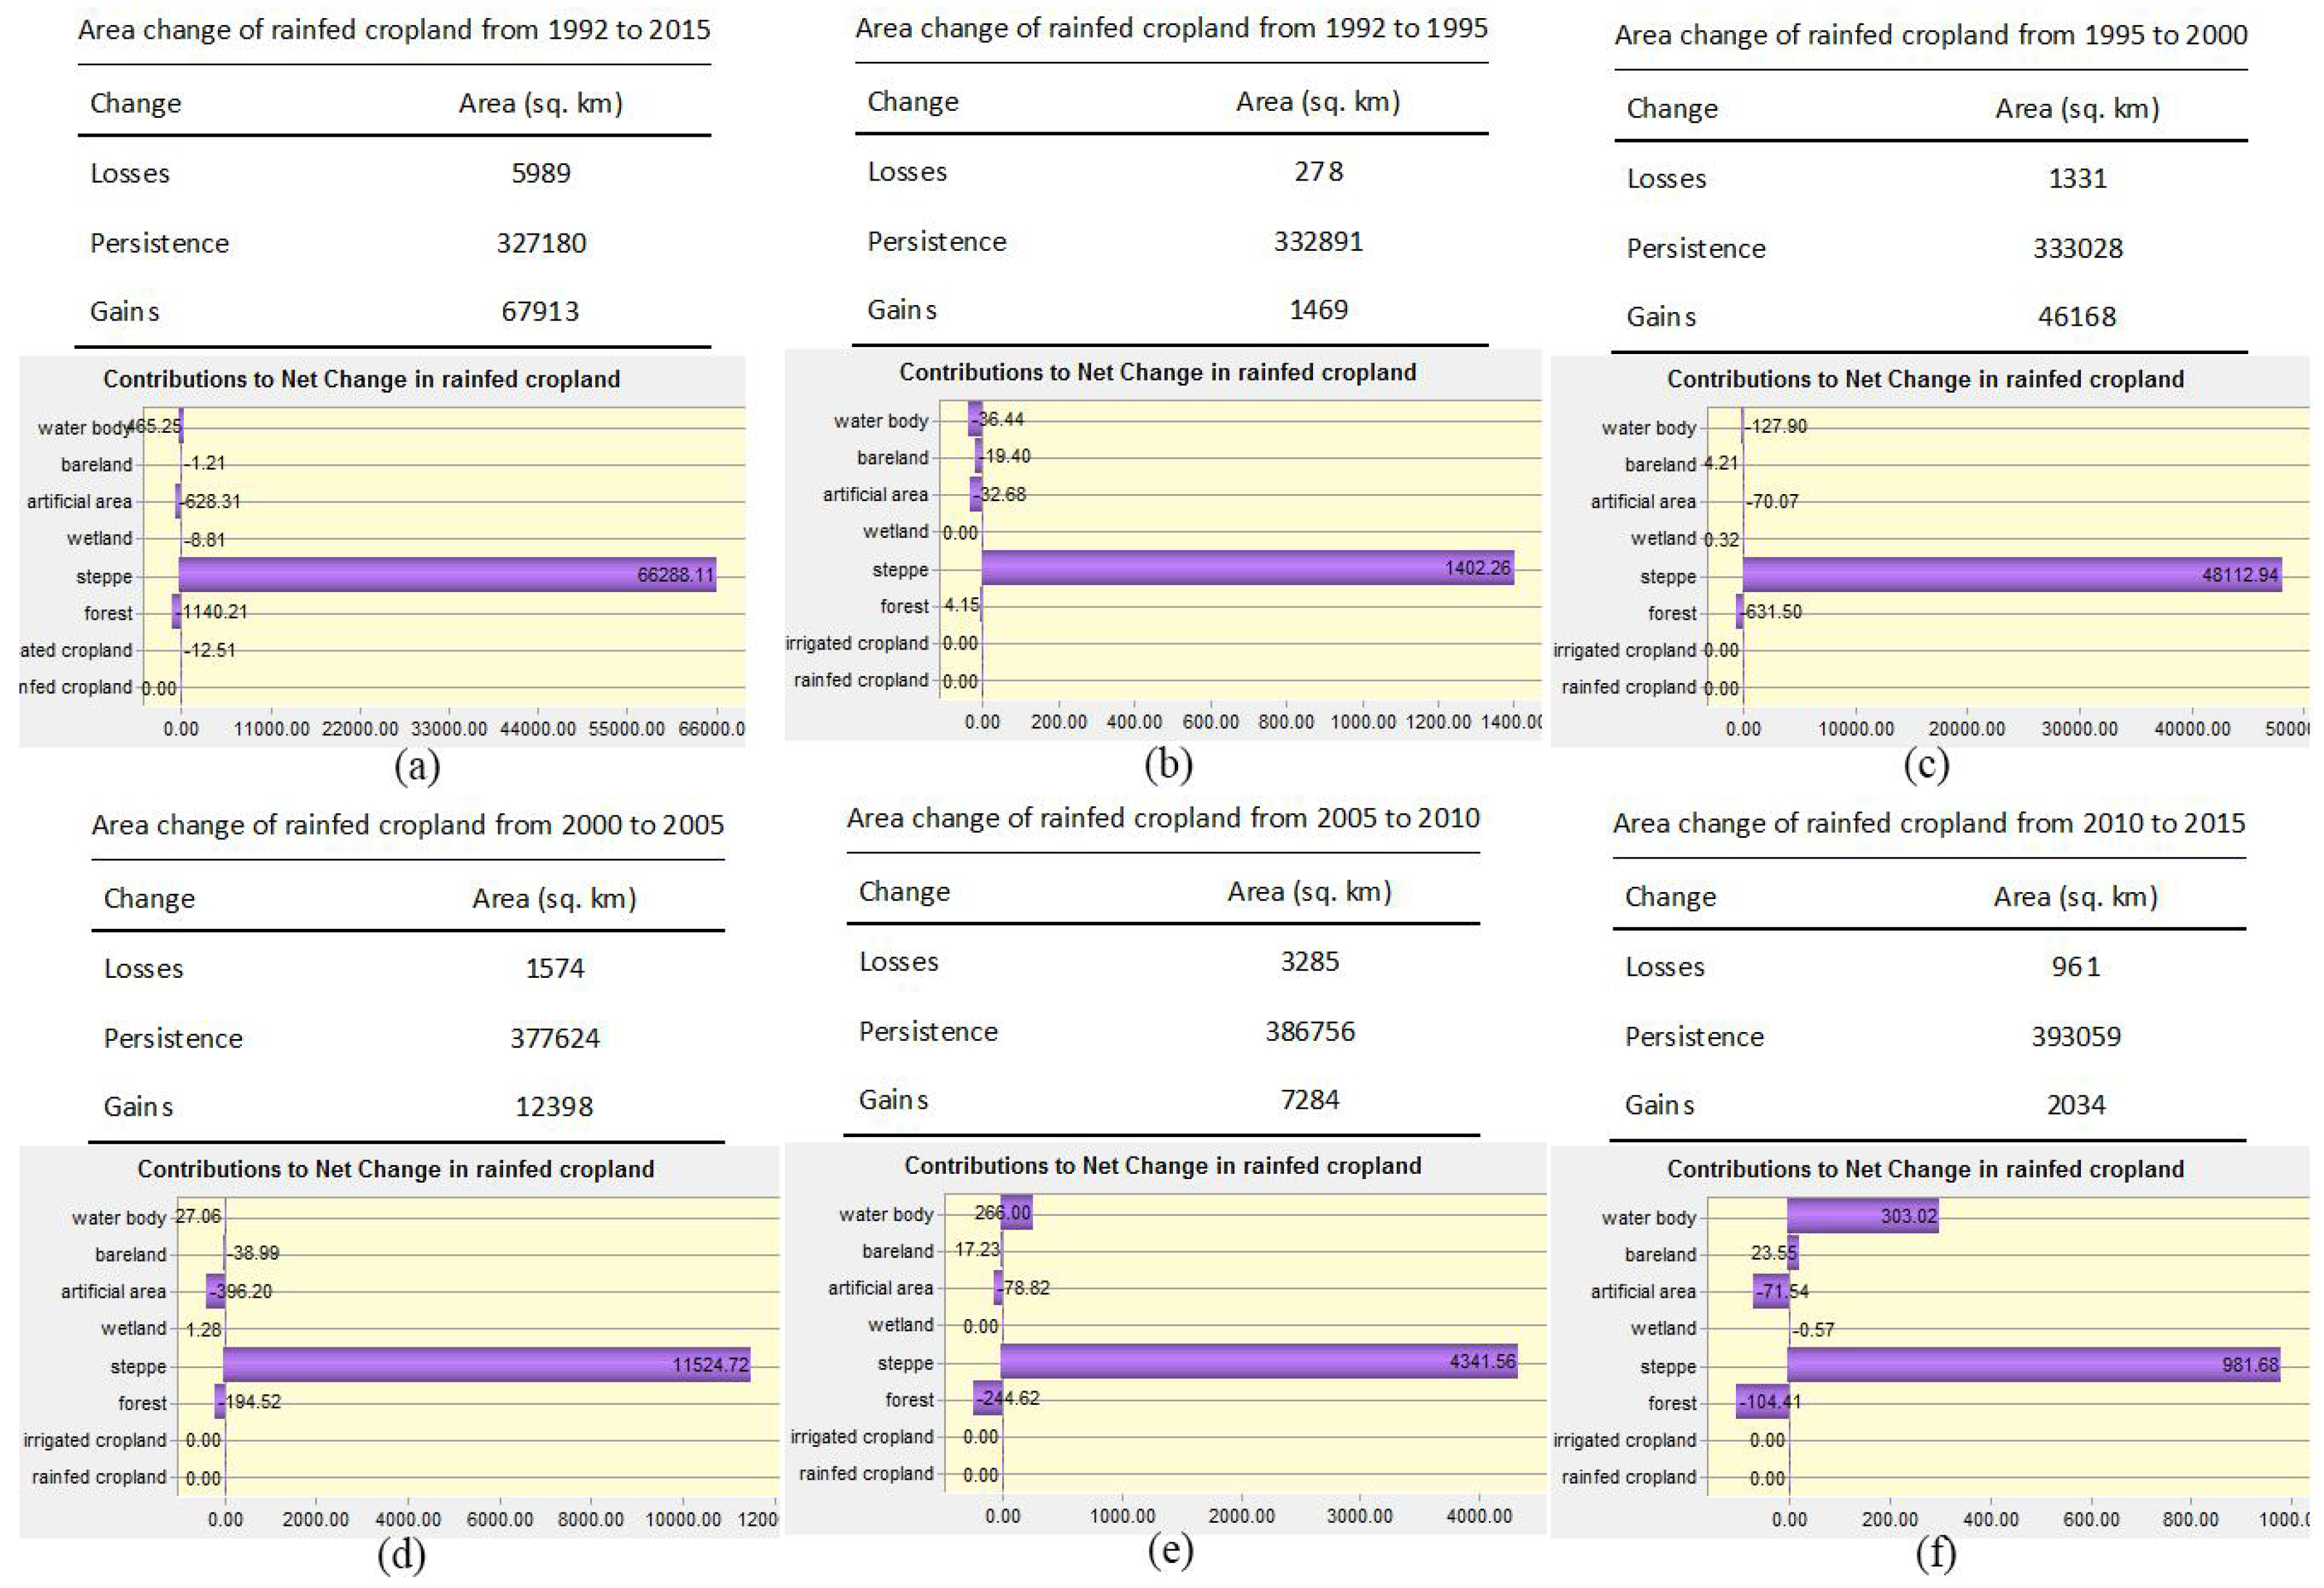
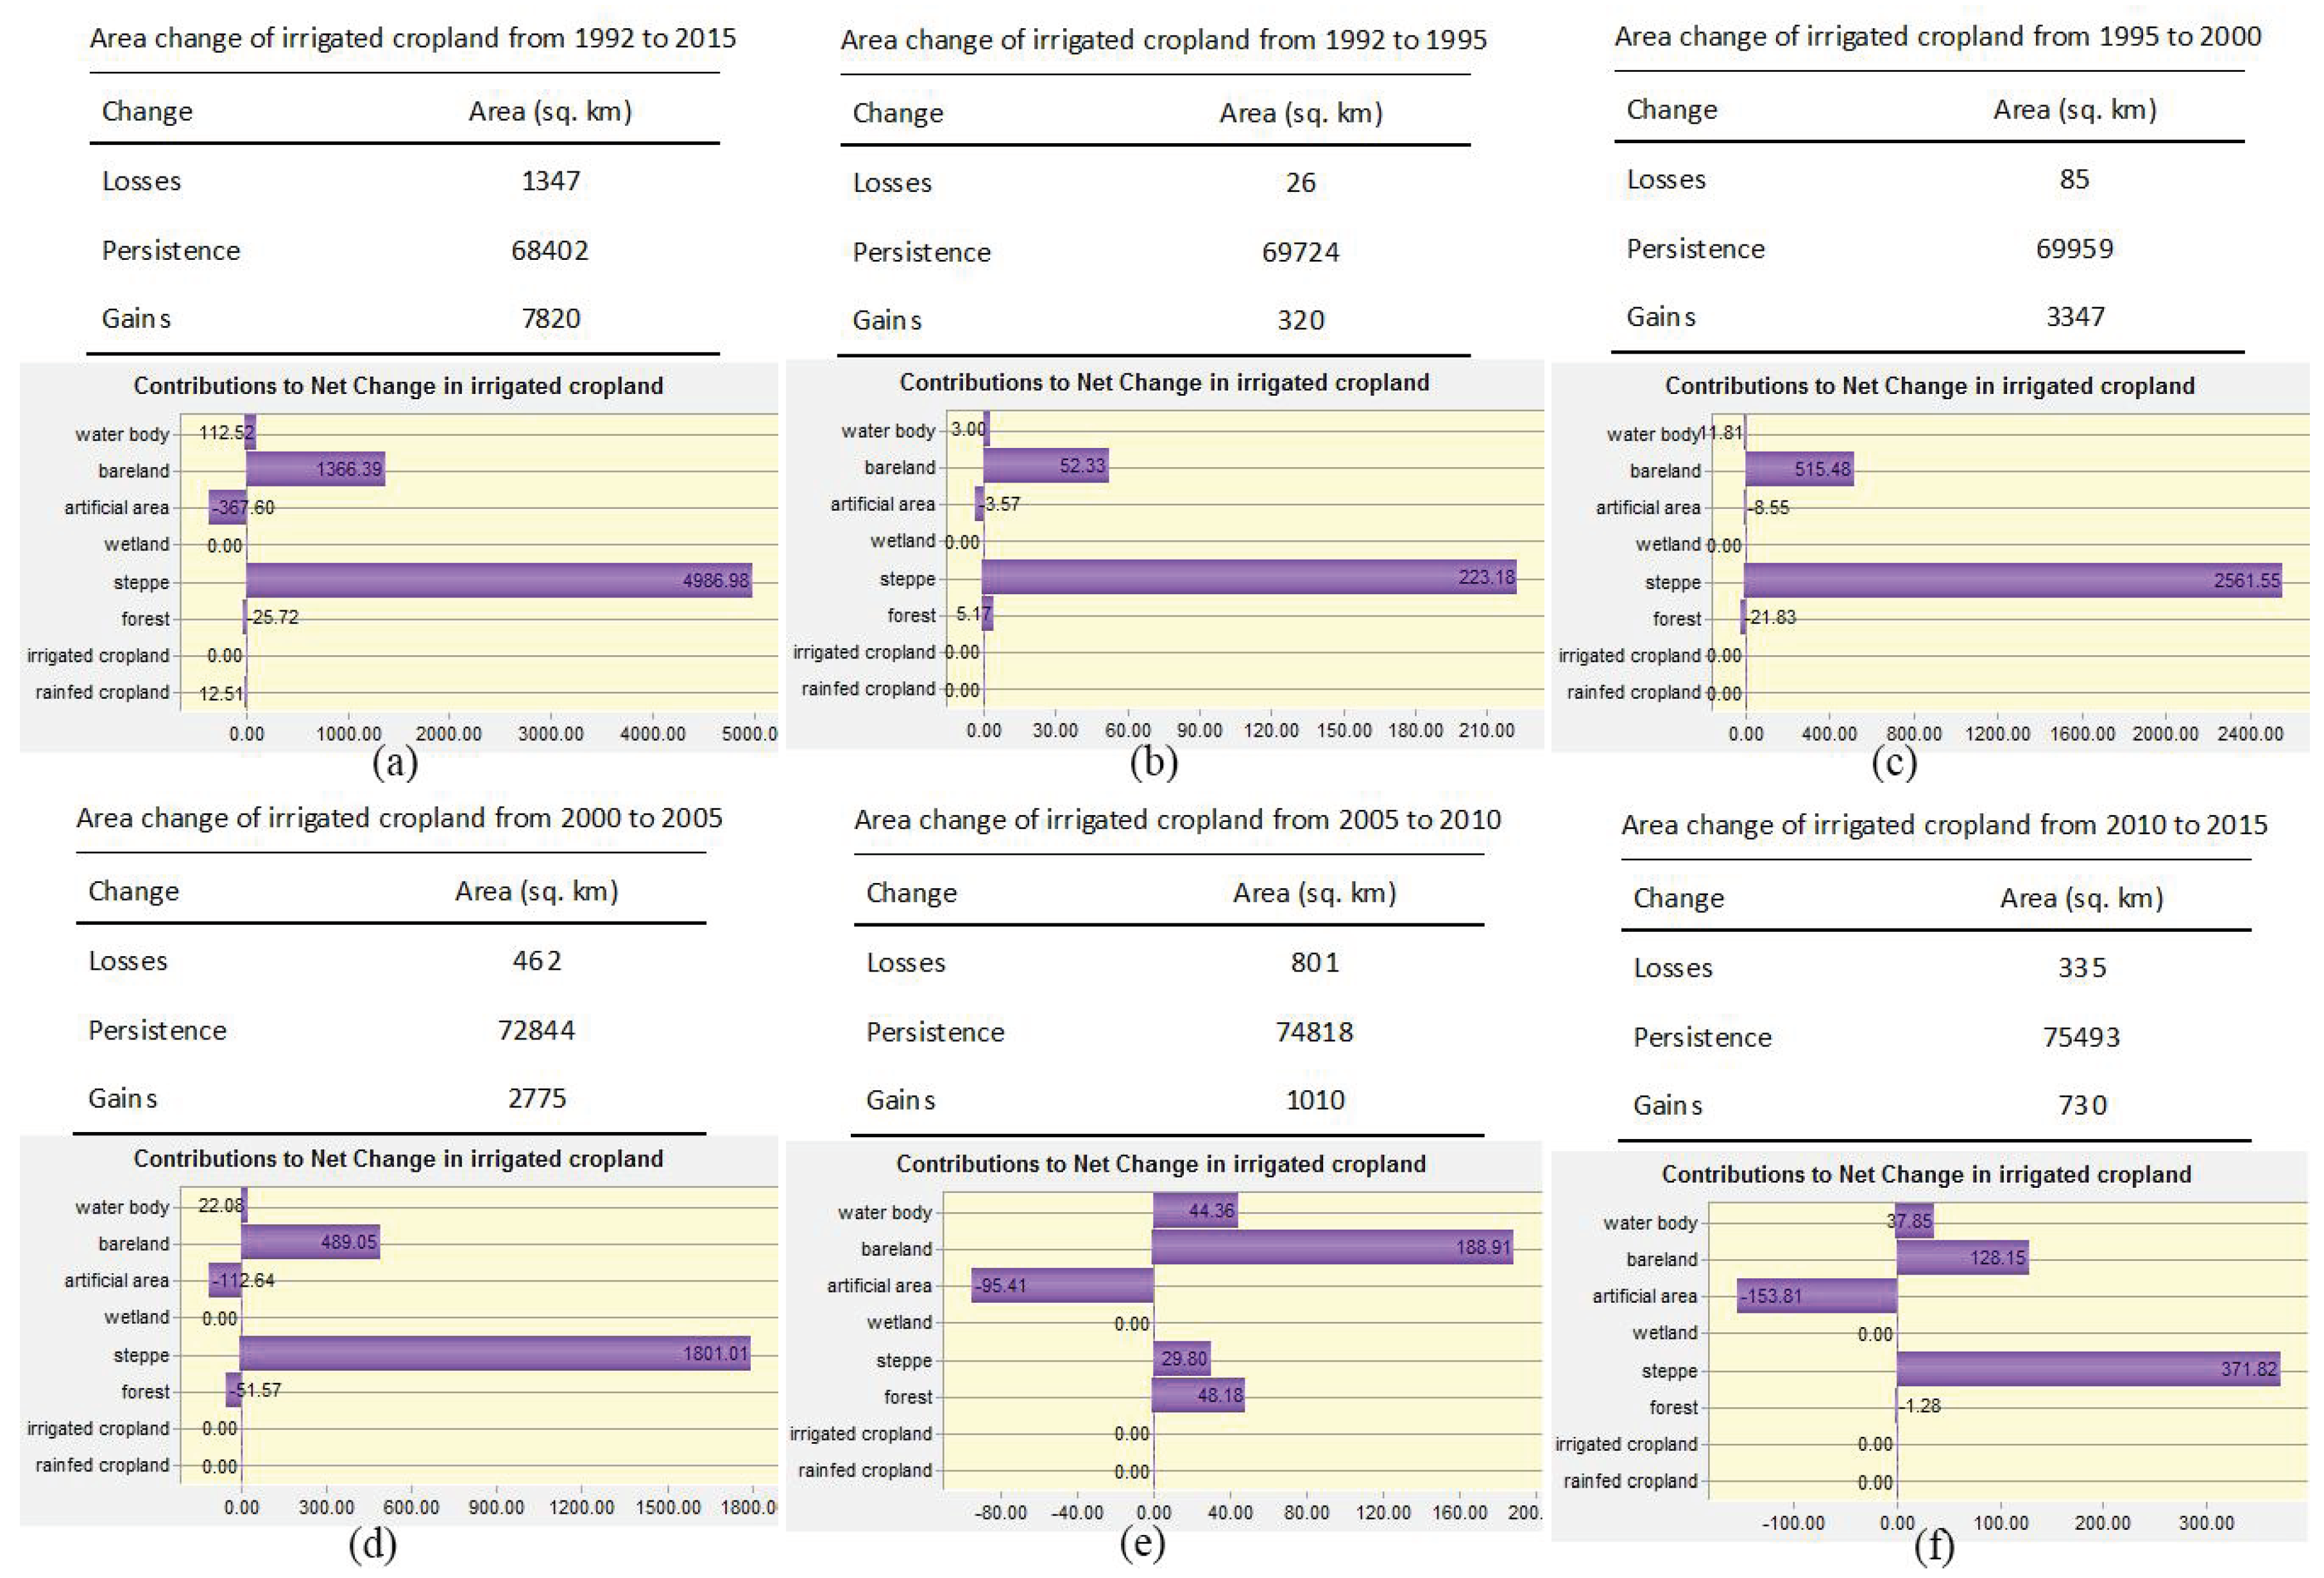
3.2. Net Areal Changes of Cropland and Their Contributors

Rainfed cropland was mapped, and its distribution was mainly in the northern part of Kazakhstan (with the majority in Qostanay, North Kazakhstan, Aqmola and Pavlodar), along the boundary regions with Russia (except Aqmola) and a small area in southeastern Kazakhstan, which was mosaiced with irrigated cropland (Almaty, Zhambyl and South Kazakhstan) (Figure 4). Over the whole study period (1992–2015), the persistent areas of rainfed and irrigated cropland were maintained as 327,180 and 68,402 km2, respectively, which accounted for 12.58% and 2.63% of the total territory (2.6 million km2), respectively, in which the gain areas were 67,913 and 7820 km2, which accounted for 20.76% and 11.43% of the persistence areas of rainfed and irrigated cropland, respectively. Loss areas amount to 5989 and 1347 km2, which accounted for 1.83% and 1.97% of the persistence areas of rainfed and irrigated cropland, respectively (Figure 4a). This result reflects the continuous increasing trend and reduced abandonment of rainfed and irrigated cropland during this period. For the five subperiods, there was little change in the first subperiod (1992–1995, SP-I) and last subperiod (2010–2015, SP-V), with persistence areas of 332,891 and 393,059 km2 for rainfed cropland and 69,724 and 75,493 km2 for irrigated cropland, respectively (Figure 4b,f and Figure 5b,f). For rainfed cropland, gain areas were 1469 (SP-I) and 2034 (SP-V) km2 and loss areas were 278 (SP-I) and 961 (SP-V) km2 (Figure 4b,f). For irrigated cropland,gains areas were 320 (SP-I) and 730 (SP-V) km2, and loss areas were 26 (SP-I) and 335 (SP-V) km2 (Figure 5b,f). This result highlights two relatively stable conditions with the former as a political transitional period and the latter as a period of policy stability [23]. The greatest gains occurred in SP-II (1995–2000) of 46,168 and 3347 km2, and decreases of 12,398 and 2775 km2 in SP-III (2000–2005) and 7284 and 1010 km2 in SP-IV (2005–2010) for rainfed and irrigated cropland, respectively (Figure 4c–e and Figure 5c–e). This result indicates that the economic development following political stability initiated in the traditional agriculture industry [82,83,84].
In general, the area of rainfed cropland between 1992–2015 was increasing in the whole study period and increasing in the five subperiods, with most of the contribution from steppe (Figure 4). In addition, water bodies had a great contribution to the increase of rainfed cropland in 2005–2010 and 2010–2015 (Figure 4e,F). The situation is obviously different for irrigated cropland. During the whole study period and five subperiods, steppe was still the greatest contributor to irrigated cropland, and bareland was the second largest. Similarly to rainfed cropland, water bodies had a nonnegligible contribution to irrigated cropland in 2005–2010 and 2010–2015 (Figure 5e,f). In addition, irrigated cropland became an important provider for artificial areas since 2000 (Figure 5c–f).

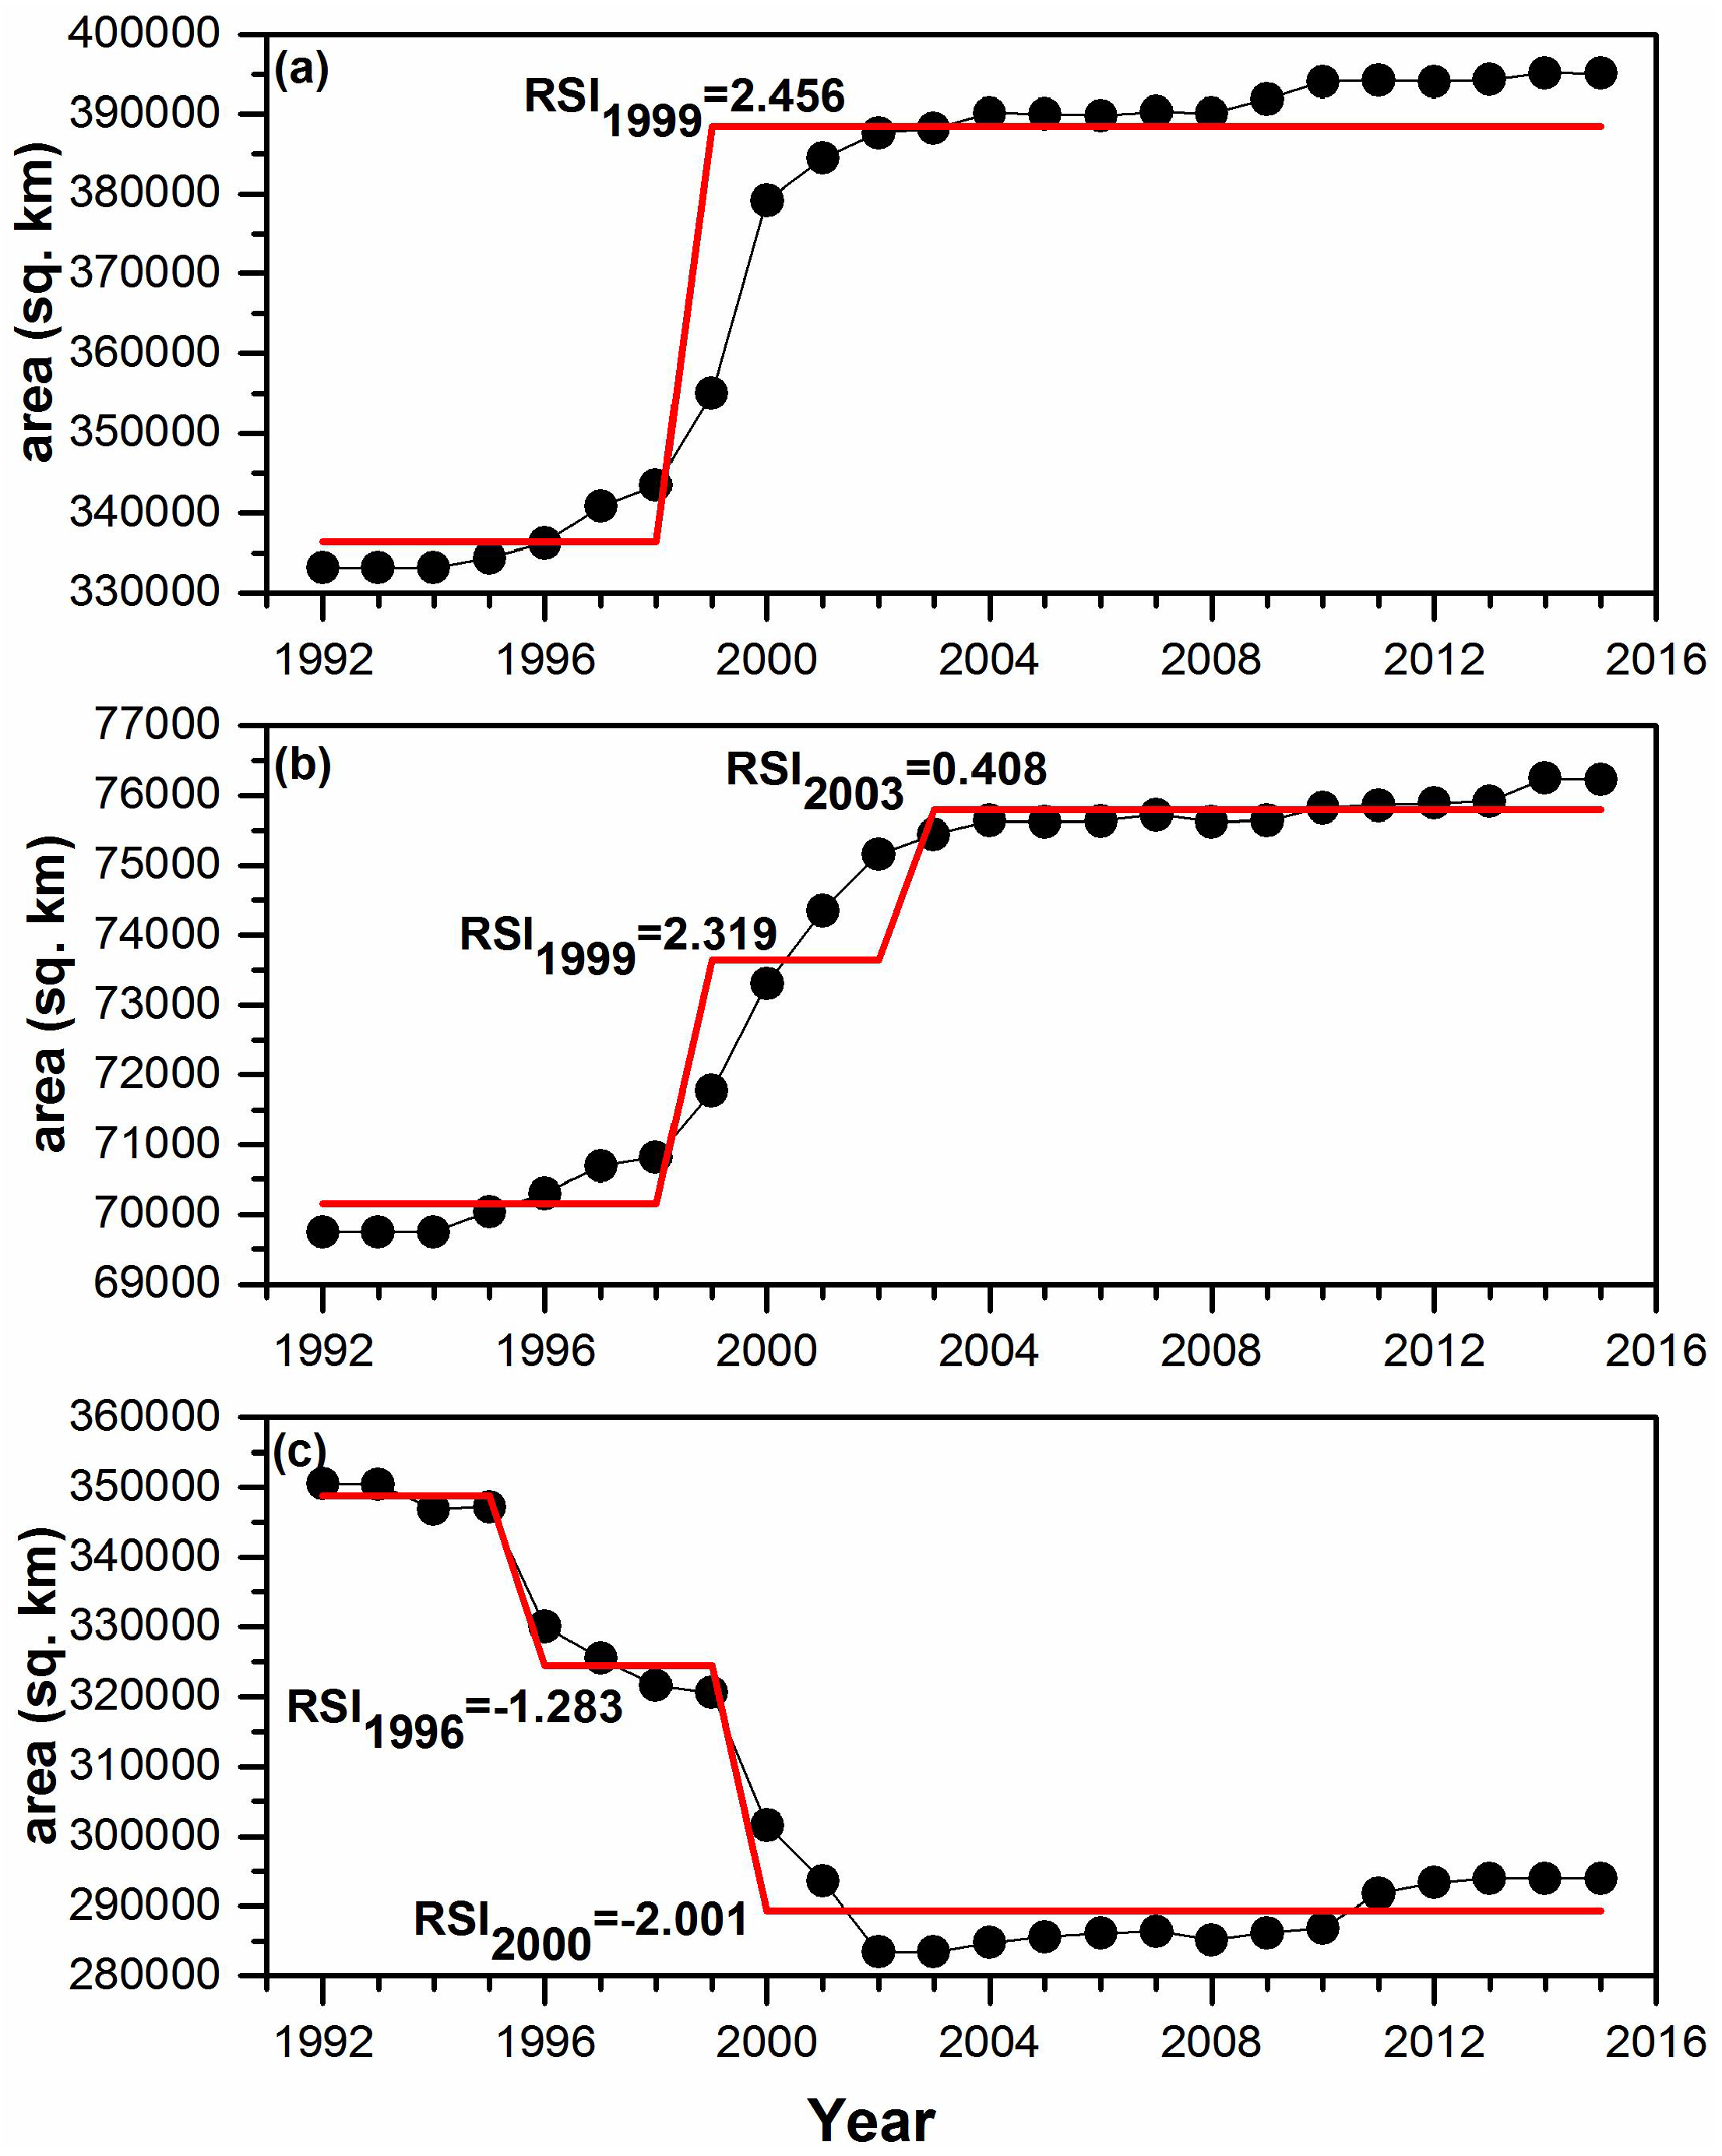
3.3. Abandonment and Recultivation Cycle Analysis

For rainfed cropland, it was found that the abandoned areas were 120, 435 and 838 km2 during the first three subperiods (SP-I, SP-II and SP-III) respectively, among which 4, 15 and 8 km2 in SP-IV were recultivated into rainfed cropland, which accounted for 3.11, 3.45 and 0.93% of the abandoned area in the first three subperiods. 1, 12 and 4 km2 in SP-V were recultivated into rainfed cropland, which accounted for 0.96, 2.86 and 0.43% of abandoned area in the first three subperiods. The total recultivated area in the whole study period was 27 and 17 km2, which accounted for 0.385% and 1.063% of the cultivated areas in next two subperiods (SP-IV and SP-V), respectively (Table 3). Obviously, the transition ratios of recultivated area to abandoned area in the first three subperiods and the cultivated areas in the next two subperiods were insignificant. We also inspected the abandonment and recultivation cycle between irrigated cropland and steppe. We determined that the abandoned areas were 11, 36, 235, 665, and 148 km2, and the cultivated areas were 1392, 2773, 2183, 682 and 538 km2 in the five subsequent subperiods; however, no recultivated area was detected.

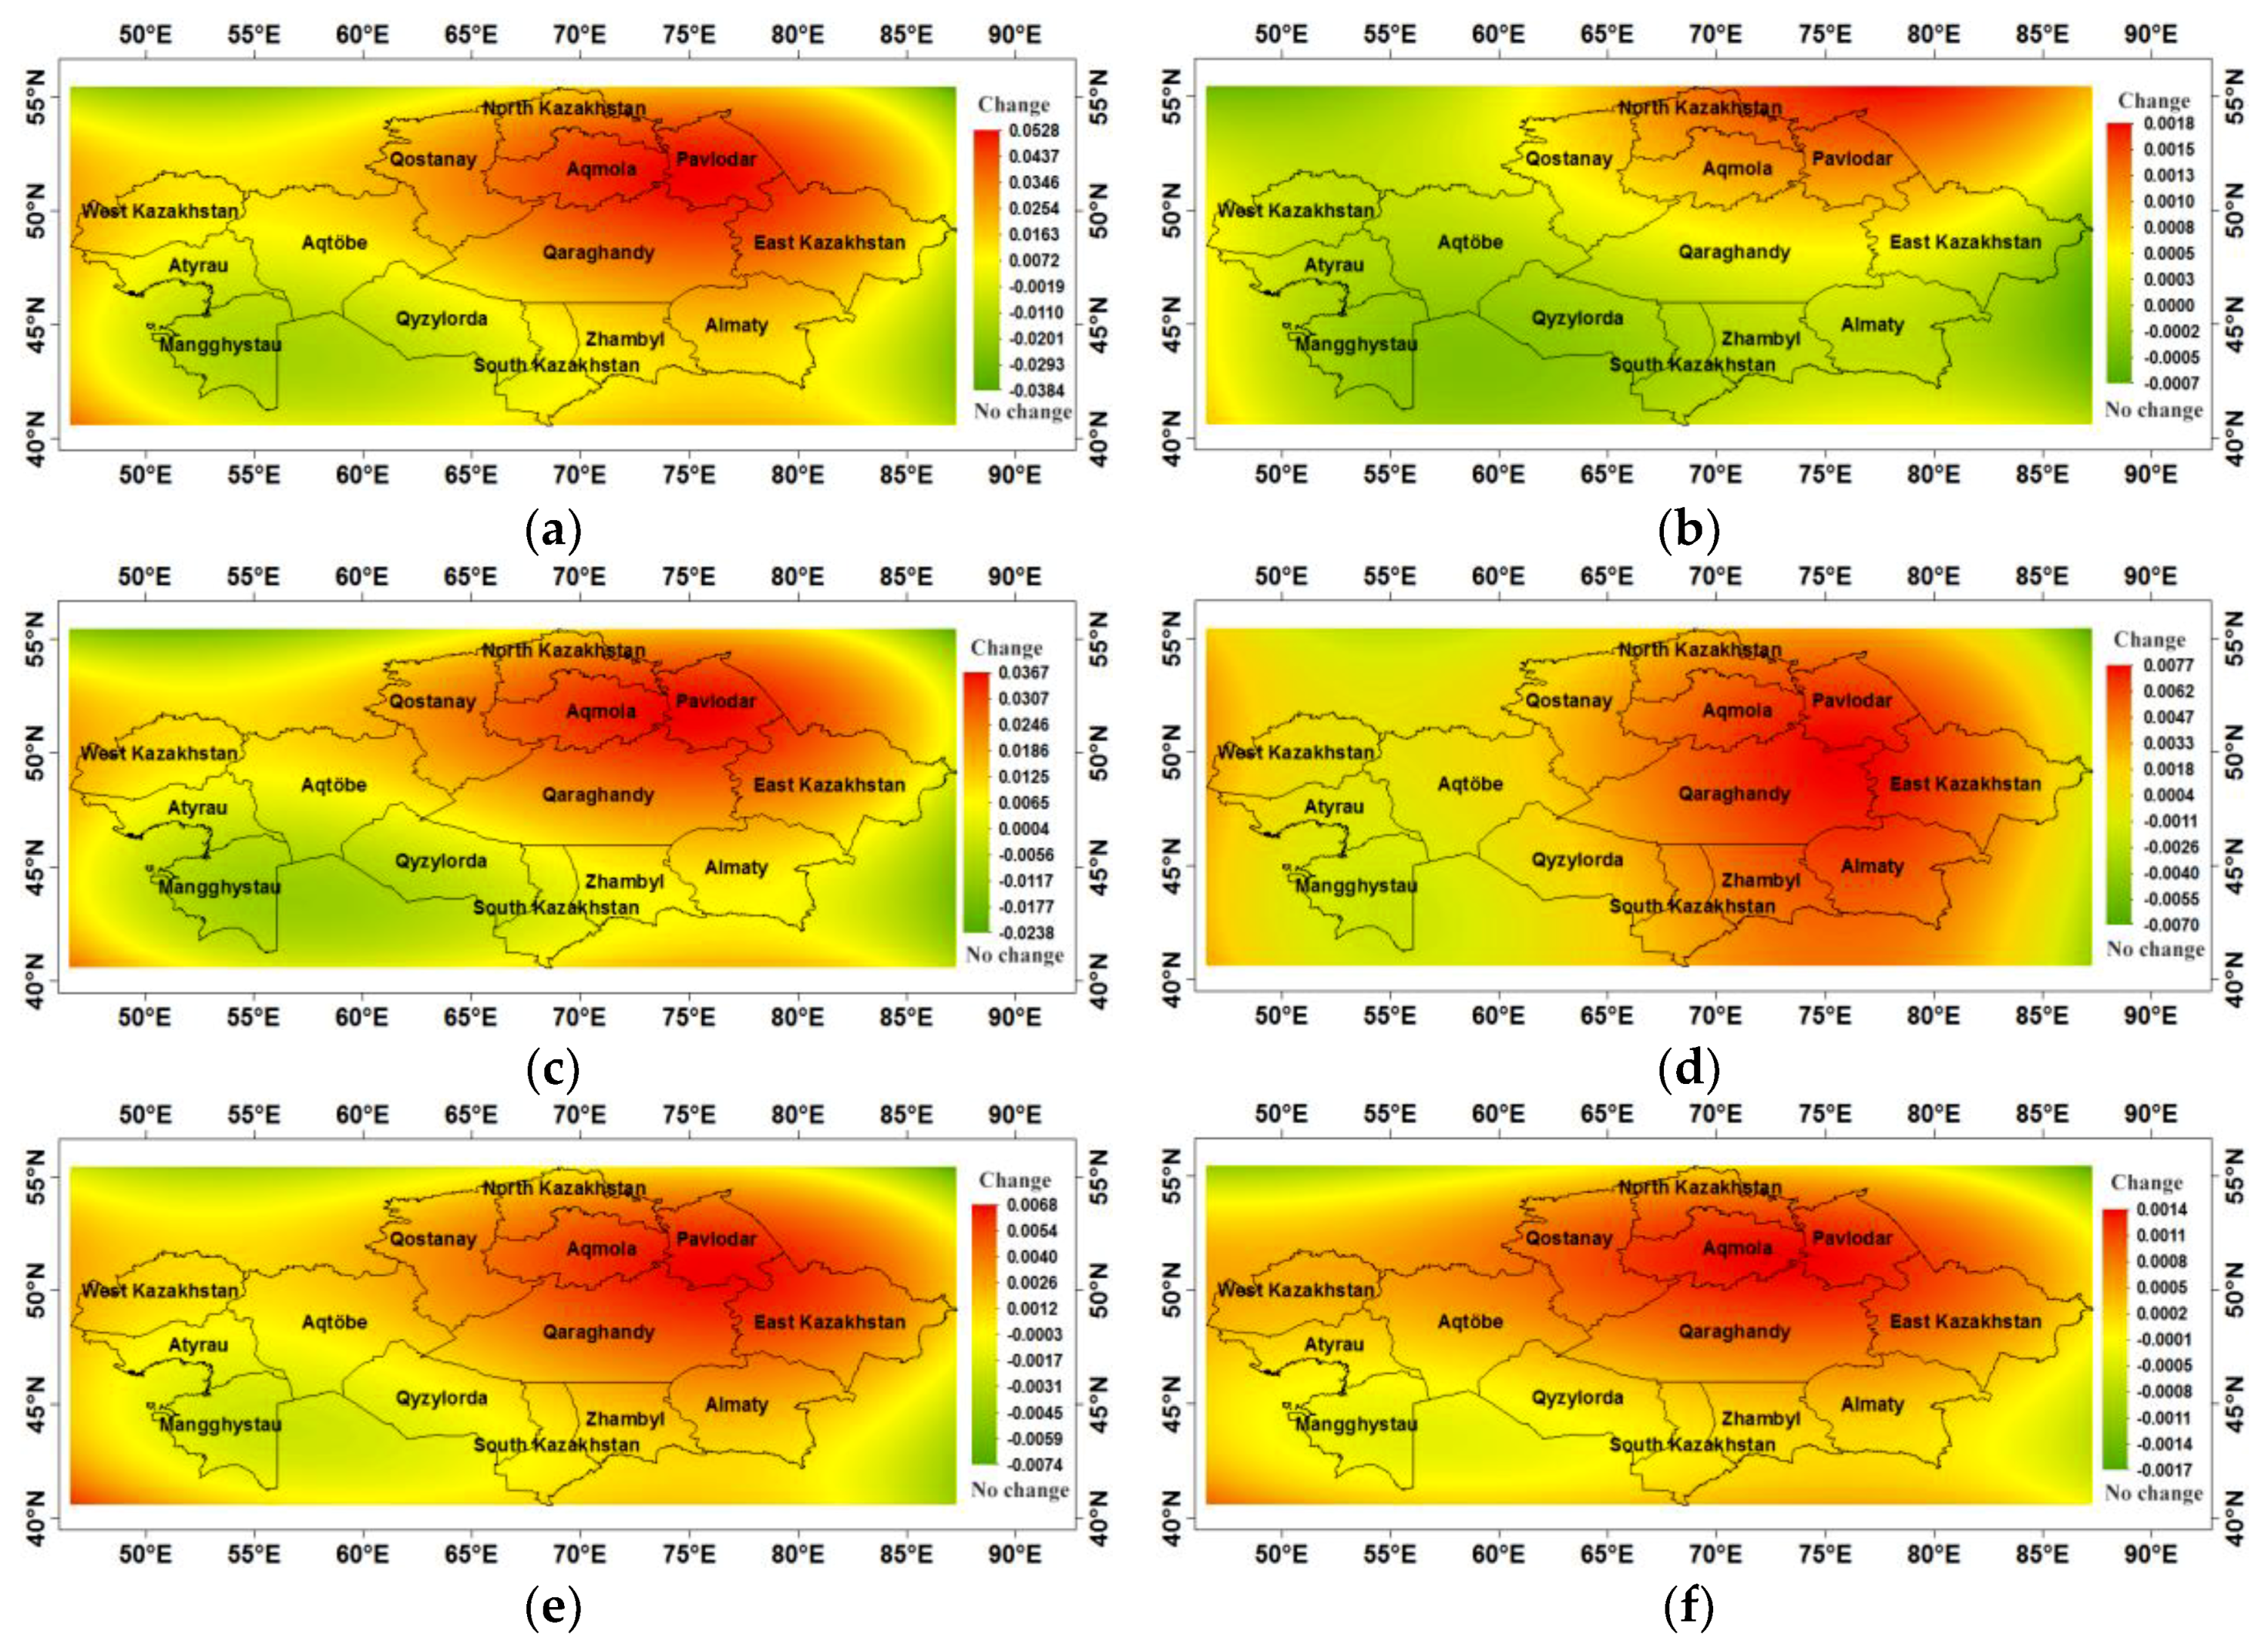
3.4. Spatial Pattern of Rainfed and Irrigated Cropland

Viewed from Figure 6, the general trend of transition from steppe to rainfed cropland in the whole study period was located in the northern and eastern parts of the study area, including North Kazakhstan, Aqumolar, Pavlodar, Qostanay, Qaraghandy and East Kazakhstan (Figure 6a). The major transitions from steppe to rainfed cropland were detected only in the northern part (North Kazakhstan, Aqumolar, Pavlodar) in SP-I (Figure 6b) and expanded to the northern and central parts (Qostanay, Qaraghandy and East Kazakhstan included) in SP-II (similar to those for the whole period) (Figure 6c). The transition expanded further to the entire eastern and central parts (Almaty, Zhambyl and South Kazakhstan also included) in SP-III (Figure 6d) and decreased to the southern part (Almaty, Zhambyl and South Kazakhstan, excluding where irrigated cropland was well developed) in SP-IV and SP-V (Figure 6e,f). The general transitions from steppe to irrigated cropland during the whole period and five subperiods had similar trends and were located in the following six regions: Qyzylorda Qaraghandy, South Kazakhstan, Almaty, Zhambyl and East Kazakhstan (Figure 7a–d). A slight difference appeared in SP-IV and SP-V with weaker transitions in Qyzylorda and Qaraghandy (Figure 7e,f). Following the significant increase of rainfed and irrigated cropland areas(Figure 2), a relatively stable cropland pattern characterized by rainfed cropland in north along boundary with China, Mongolia and Russia and irrigated cropland in south along the north slope of Tien Shan Range was formed.

4. Discussion

4.1. Cropland Area Change in the Post-Soviet Era

The breakdown of the Soviet Union resulted in the abandonment of a large area of cropland in some post-Soviet and ex-Soviet countries in the Eurasian steppe [14,16,24,85,86]. However, as one of the primary food providers for the former Soviet Union [87,88], it was unclear whether Kazakhstan had also experienced a similar change. According to the incomplete statistics from FAO, there has been a significant decreasing trend in arable land in Kazakhstan since 1995 (Figure 2); however, our results showed rainfed and irrigated cropland at the national level had a significant increasing trend with a significant increasing stage before 1999–2000 and a relatively stable stage during 2000–2015 (Figure 2), and the Mann–Kendall test and regime shift analysis at 14 regions also confirmed this result (Table 2, Figure 3). As an important traditional industry in Kazakhstan, agriculture had formed a relatively stable structure during the Soviet Union Era [89], which was affected very little by political surge. Due to its huge virgin land resources, especially the large area of the steppe [87,88,90], traditionally agricultural development is far easier than the development of other industries such as oil and gas [14,91]. Hence, a significant increase of cropland area in an earlier stage of newly sovereign Kazakhstan is a necessary consequence, with the coming of gradual foreign investment for resource exploitation, the agriculture in Kazakhstan lost its primary importance and cropland development showed a relatively stable trend [22,92,93].

4.2. Cropland Gains and Spatial Reorganization

While the cropland area exhibited a significant increase in Kazakhstan, it was unknown what the country-scale transition types and locations of change were. It was revealed that almost all cropland was gained from steppe in the whole study period and five subperiods; this can be viewed as a virgin land development strategy that will be continued [9,19]. The results from the trend surface analysis showed the cropland distribution was changing from a disordered expansion to ordered stability, while a small area of rainfed cropland was disappearing from the mosaic of irrigated cropland in the southern region. This may mainly result from the historical legacy of the former Soviet Union’s agricultural policies [90,94], and a reorganized pattern was gradually formed as rainfed cropland in the North and irrigated cropland in the South, which reflected the implementation of an oasis agricultural development strategy in the whole country [95,96,97]. In addition, a greater contribution from water bodies to rainfed and irrigated cropland since 2005 (SP-IV and SP-V) reflected lake shrinkage to a great extent with climate change and less water from the upper reaches of many transboundary rivers in recent years [96,98,99]. Meanwhile, irrigated cropland has been an important provider for artificial areas since 2000, which reflects the rapid urbanization process at the expense of irrigated oases with good agricultural infrastructure [100,101,102,103].

4.3. Cycle of Abandonment and Recultivation between Cropland and Steppe

We inspected the transition cycle between cropland and steppe for the greatest contributor to cropland, and the results showed that there is a negligible transition from rainfed cropland to steppe then back to rainfed cropland during the five subperiods. Obviously, the soil fertility of the original steppe was higher than that of the abandoned rainfed cropland [104,105], and local farmers should prefer to explore the original steppe as rainfed cropland as opposed to recultivating abandoned or fallow cropland.
For irrigated cropland, no transition from irrigated cropland to steppe and then back to irrigated cropland was observed during the five subperiods. The main reason for this result was that the abandonment of irrigated cropland in Kazakhstan may result from the severe secondary salinization [106,107]. Hence, this abandoned land was not able to be recultivated without cost-effective desalinization measures. Obviously, the nonexistence of cycle between the abandonment and recultivation proved that newly-gained cropland from steppe may be less degraded and more productive for sustainable land use in Kazakhstan [11].

5. Conclusions and Implications for Sustainability

Kazakhstan’s cropland development experienced a period of rapid increase and then a long-term stable period, forming a reorganization pattern with rainfed cropland in western, northern, eastern, and central parts and irrigated cropland in the southern part. The majority of new-developed cropland, rainfed or irrigated, comes from the original steppe rather than the recultivation of abandoned cropland. Rainfed cropland showed a significant increasing trend and maintained a recent long-term stable stage, dryland vulnerability to climate change can be reduced by diversified cropping systems, conservation tillage, water saving technologies, and less water-demanding crop species [108,109]. A great amount of rainfed cropland abandonment did not occur, hence we can deduce that the rainfed cropland system under the current situation has high sustainability. For irrigated cropland, the main impact on its areas and productivity came from water provision capacity of inland rivers; the amount of water was determined by precipitation, glacier- and snow-melt and the upstream water utilization amount. The former two were affected by climate change, the latter one affected by transboundary cooperation [96]. Similar to rainfed cropland, irrigated cropland also showed a significant increasing trend and maintained a recent long-term stable stage, a great amount of irrigated cropland abandonment did not occur, hence we can deduce that the cropland system under the current situation has medium sustainability limited mainly by transboundary water allocation. Undoubtedly, the results of the analysis can provide strong evidence for sustainable land use and a basis for food security policy-making in Kazakhstan and even all of Central Asia in the future [110]. In addition. It is undeniable that some significant changes at the regional scale may be neglected or omitted using ESA-CCI land cover dataset with an annual temporal resolution and 300 m spatial resolution; hence, some satellite images with high temporal resolution, such as MODIS (Moderate Resolution Imaging Spectroradiometer), and high spatial resolution, such as Landsate TM (Thematic Mapper), can be used to discover the regional changes in croplands in Kazakhstan when combined with several popular software packages, such as Landtrendr [26,111] and BFAST [112,113], which can characterize land use changes and their causes more directly and concretely.

Author Contributions

W.W., Y.Z. and H.L. developed the methodology, and prepared the original draft. K.Z. and B.W. conceptualized the framework of the article, reviewed the paper, and set directions for the revision. X.Y. and Z.S. conceptualized the framework of the article, reviewed the paper, and supervised the research. All of the authors read, revised, and approved the manuscript.

Funding

This research is supported by the Fundamental Research Funds of CAF (CAFYBB2017ZA006), the International Science & Technology Cooperation Programme of China (2015DFR31130), and the National Key Research and Development Programme of China (2016YFC0500801, 2016YFC0500804 and 2016YFC0500908).

Acknowledgments

Special thanks should be given to ESA CCI Land Cover project, without their free available series land cover maps, it will be impossible to implement this study. We also thank these anonymous reviewers for their suggestive comments to improve the quality of this artilcle substantially.

Conflicts of Interest

The authors declare no conflict of interest.

References

  1. Amitai, R.; Biran, M. Nomads as Agents of Cultural Change: The Mongols and Their Eurasian Predecessors; University of Hawaii Press: Honolulu, HI, USA, 2015. [Google Scholar]
  2. McColl, R.W. Encyclopedia of World Geography; Facts on File, Inc.: New York, NY, USA, 2005. [Google Scholar]
  3. Harmatta, J.; Puri, B.N.; Eternadi, G.F. History of Civilizations of Central Asia—Volume 2: The Development of Sedentary and Nomadic Civilizations: 700 B.C. to A.D. 250; UNESCO Publishing: Paris, France, 1994. [Google Scholar]
  4. Amitai, R.; Biran, M. Mongols, Turks, and Others: Eurasian Nomads and the Sedentary World; Brill: Leidon, The Netherlands, 2005. [Google Scholar]
  5. Bell-Fialkoff, A. The Role of Migration in the History of the Eurasian Steppe: Sedentary Civilization vs. “Barbarian” and Nomad; Macmillan Press Ltd.: Houndmills, UK, 2000. [Google Scholar]
  6. Cui, X.; Guo, K.; Hao, Y.; Chen, Z. Degradation and management of steppes in China. In Eurasian Steppes: Ecological Problems and Livelihoods in a Changing World; Werger, M.J.A., van Staalduinen, M.A., Eds.; Springer Science + Business Media B.V.: Dordrecht, The Netherlands, 2012; pp. 475–490. [Google Scholar]
  7. Josephson, P.; Dronin, N.; Cherp, A.; Mnatsakanian, R.; Efremenko, D.; Larin, V. An Environmental History of Russia; Cambridge University Press: Cambridge, UK, 2013. [Google Scholar]
  8. Smelansky, I.E.; Tishkov, A.A. The steppe biome in Russia: Ecosystem services, conservation status, and actual challenges. In Eurasian Steppes: Ecological Problems and Livelihoods in a Changing World; Werger, M.J.A., van Staalduinen, M.A., Eds.; Springer Science + Business Media B.V.: Dordrecht, The Netherlands, 2012; pp. 45–102. [Google Scholar]
  9. McCauley, M. Khrushchev and the Development of Soviet Agriculture: Virgin Land Program, 1953–64; The Macmillan Press Ltd.: London, UK, 1976. [Google Scholar]
  10. Chan, A.L. Mao’s Crusade: Politics and Policy Implementation in China’s Great Leap Forward; Oxford University Press: Oxford, UK, 2001. [Google Scholar]
  11. Werger, M.J.A.; van Staalduinen, M.A. Eurasian Steppes: Ecological Problems and Livelihoods in a Changing World; Springer Science + Business Media B.V.: Dordrecht, The Netherlands, 2012. [Google Scholar]
  12. Moon, D. The Plough that Broke the Steppes: Agriculture and Environment on Russia’s Grasslands, 1700–1914; Oxford University Press: Oxford, UK, 2013. [Google Scholar]
  13. Li, Z. Reform and Development of Agriculture in China; Springer: Singapore, 2017. [Google Scholar]
  14. Lerman, Z.; Csaki, C.; Feder, G. Agriculture in Transition: Land Policies and Evolving Farm Structures in Post-Soviet Countries; Lexington Books: Lanham, MD, USA, 2004. [Google Scholar]
  15. Gutman, G.; Radeloff, V. Land-Cover and Land-Use Changes in Eastern Europe after the Collapse of the Soviet Union in 1991; Springer International Publishing: Cham, Switzerland, 2017. [Google Scholar]
  16. Meyfroidt, P.; Schierhorn, F.; Prishchepov, A.V.; Müller, D.; Kuemmerle, T. Drivers, constraints and trade-offs associated with recultivating abandoned cropland in Russia, Ukraine and Kazakhstan. Glob. Environ. Chang. 2016, 37, 1–15. [Google Scholar] [CrossRef] [Green Version]
  17. Petrick, M.; Wandel, J.; Karsten, K. Rediscovering the Virgin Lands: Agricultural investment and rural livelihoods in a Eurasian frontier area. World Dev. 2013, 43, 164–179. [Google Scholar] [CrossRef]
  18. Pavlović, Z. Kazakhstan; Chelsea House Publishers: New York, NY, USA, 2013. [Google Scholar]
  19. Kraemer, R.; Prishchepov, A.V.; Müller, D.; Kuemmerle, T.; Radeloff, V.C.; Dara, A.; Terekhov, A.; Frühauf, M. Long-term agricultural land-cover change and potential for cropland expansion in the former Virgin Lands area of Kazakhstan. Environ. Res. Lett. 2015, 10, 054012. [Google Scholar] [CrossRef] [Green Version]
  20. Swinnen, J.; Burkitbayeva, S.; Schierhorn, F.; Prishchepov, A.V.; Müller, D. Production potential in the “bread baskets” of Eastern Europe and Central Asia. Glob. Food Secur. 2017, 14, 38–53. [Google Scholar] [CrossRef]
  21. Laird, R.D.; Chappell, J.E. Kazakhstan: Russia’s agricultural crutch. Russ. Rev. 1961, 20, 326–343. [Google Scholar] [CrossRef]
  22. OECD. OECD Review of Agricultural Policies: Kazakhstan 2013; OECD Publishing: Paris, France, 2013. [Google Scholar]
  23. Yerkinbayeva, L.K.; Bekturganov, A.E. Legal Problems of the Modern Agricultural Policy of the Republic of Kazakhstan. Procedia-Soc. Behav. Sci. 2013, 81, 514–519. [Google Scholar] [CrossRef]
  24. Prishchepov, A.V.; Müller, D.; Dubinin, M.; Baumann, M.; Radeloff, V.C. Determinants of agricultural land abandonment in post-Soviet European Russia. Land Use Policy 2013, 30, 873–884. [Google Scholar] [CrossRef] [Green Version]
  25. Wright, C.K.; de Beurs, K.M.; Henebry, G.M. Combined analysis of land cover change and NDVI trends in the Northern Eurasian grain belt. Front. Earth Sci. 2012, 6, 177–187. [Google Scholar] [CrossRef]
  26. Dara, A.; Baumann, M.; Kuemmerle, T.; Pflugmacher, D.; Rabe, A.; Griffiths, P.; Hölzel, N.; Kamp, J.; Freitag, M.; Hostert, P. Mapping the timing of cropland abandonment and recultivation in northern Kazakhstan using annual Landsat time series. Remote Sens. Environ. 2018, 213, 49–60. [Google Scholar] [CrossRef]
  27. Barrett, T.; Feola, G.; Krylova, V.; Khusnitdinova, M. The application of Rapid Appraisal of Agricultural Innovation Systems (RAAIS) to agricultural adaptation to climate change in Kazakhstan: A critical evaluation. Agric. Syst. 2017, 151, 106–113. [Google Scholar] [CrossRef]
  28. Bolch, T. Climate change and glacier retreat in northern Tien Shan (Kazakhstan/Kyrgyzstan) using remote sensing data. Glob. Planet. Chang. 2007, 56, 1–12. [Google Scholar] [CrossRef]
  29. Kerimray, A.; Baigarin, K.; De Miglio, R.; Tosato, G. Climate change mitigation scenarios and policies and measures: The case of Kazakhstan. Clim. Policy 2016, 16, 332–352. [Google Scholar] [CrossRef]
  30. Aigarinova, G.T.; Akshatayeva, Z.; Alimzhanova, M.G. Ensuring food security of the Republic of Kazakhstan as a fundamental of modern agricultural policy. Procedia-Soc. Behav. Sci. 2014, 143, 884–891. [Google Scholar] [CrossRef]
  31. OECD. OECD Studies on Water Reforming Economic Instruments for Water Resources Management in Kyrgyzstan; OECD Publishing: Paris, France, 2016. [Google Scholar]
  32. Karatayev, M.; Kapsalyamova, Z.; Spankulova, L.; Skakova, A.; Movkebayeva, G.; Kongyrbay, A. Priorities and challenges for a sustainable management of water resources in Kazakhstan. Sustain. Water Qual. Ecol. 2017, 9, 115–135. [Google Scholar]
  33. Bradley, C. Kazakhstan; Millbrook Press: Brookfield, CT, USA, 1993. [Google Scholar]
  34. Lydolph, P. Geography of the USSR; Wiley: New York, NY, USA, 1965. [Google Scholar]
  35. Thomas, P. The Central Asian States: Tajikstan, Uzbekistan, Kyrgyzstan, Turkmenistan; Millbrook Press: Brookfield, CT, USA, 1992. [Google Scholar]
  36. Pang, G.C. Kazakhstan; Marshall Cavendish: New York, NY, USA, 2001. [Google Scholar]
  37. Meng, E.; Longmire, J.; Moldashev, A. Kazakhstan’s wheat system: Priorities, constraints, and future prospects. Food Policy 2000, 25, 701–717. [Google Scholar] [CrossRef]
  38. Li, W.; Ciais, P.; MacBean, N.; Peng, S.; Defourny, P.; Bontemps, S. Major forest changes and land cover transitions based on plant functional types derived from the ESA CCI Land Cover product. Int. J. Appl. Earth Obs. 2016, 47, 30–39. [Google Scholar] [CrossRef]
  39. Li, W.; MacBean, N.; Ciais, P.; Defourny, P.; Lamarche, C.; Bontemps, S.; Houghton, R.A.; Peng, S. Gross and net land cover changes in the main plant functional types derived from the annual ESA CCI land cover maps (1992–2015). Earth Syst. Sci. Data 2018, 10, 219–234. [Google Scholar] [CrossRef] [Green Version]
  40. Matton, N.; Canto, G.S.; Waldner, F.; Valero, S.; Morin, D.; Inglada, J.; Arias, M.; Bontemps, S.; Koetz, B.; Defourny, P. An automated method for annual cropland mapping along the season for various globally-distributed agrosystems using high spatial and temporal resolution time series. Remote Sens. 2015, 7, 13208–13232. [Google Scholar] [CrossRef]
  41. Behnke, R.H. The Socio-economic Causes and Consequences of Desertification in Central Asia; Springer: New York, NY, USA, 2008. [Google Scholar]
  42. Spivak, L.; Arkhipkin, O.; Vitkovskaya, I.; Batyrbaeva, M.; Sagatdinova, G. Space monitoring of desertification processes in Kazakhstan with use of long-term raws of remote sensing data. In Proceedings of the IEEE International Conference on Geoscience and Remote Sensing Symposium, Denver, CO, USA, 31 July–4 August 2006; pp. 1157–1159. [Google Scholar]
  43. Ahmad, M.; Rodríguez, A.; Braslavskaya, A. Food and water insecurity: Re-assessing the value of rainfed agriculture. Water Sci. Technol. Water Sup. 2005, 5, 109–116. [Google Scholar] [CrossRef]
  44. Zhupankhan, A.; Tussupova, K.; Berndtsson, R. Water in Kazakhstan, a key in Central Asian water management. Hydrol. Sci. J. 2018, 63, 752–762. [Google Scholar] [CrossRef]
  45. Mehan, S.; Guo, T.; Gitau, M.W.; Flanagan, D.C. Comparative study of different stochastic weather generators for long-term climate data simulation. Climate 2017, 5, 26. [Google Scholar] [CrossRef]
  46. Guo, T.; Mehan, S.; Gitau, M.W.; Wang, Q.; Kuczek, T.; Flanagan, D.C. Impact of number of realizations on the suitability of simulated weather data for hydrologic and environmental applications. Stoch. Environ. Res. Risk Assess. 2018, 32, 2405–2421. [Google Scholar] [CrossRef]
  47. Jiang, F.Q.; Hu, R.J.; Wang, S.P.; Zhang, Y.W.; Tong, L. Trends of precipitation extremes during 1960–2008 in Xinjiang, the Northwest China. Theor. Appl. Climatol. 2013, 111, 133–148. [Google Scholar] [CrossRef]
  48. Wei, W.; Shi, Z.; Yang, X.; Wei, Z.; Liu, Y.; Zhang, Z.; Ge, G.; Zhang, X.; Guo, H.; Zhang, K.; et al. Recent trends of extreme precipitation and their teleconnection with atmospheric circulation in the Beijing-Tianjin Sand Source Region, China, 1960–2014. Atmosphere 2017, 8, 83. [Google Scholar] [CrossRef]
  49. Caesar, J.; Alexander, L.V.; Trewin, B.; Tse-Ring, K.; Sorany, L.; Vuniyayawa, V.; Keosavang, N.; Shimana, A.; Htay, M.M.; Karmacharya, J.; et al. Changes in temperature and precipitation extremes over the Indo-Pacific region from 1971 to 2005. Int. J. Climatol. 2011, 31, 791–801. [Google Scholar] [CrossRef] [Green Version]
  50. Shan, N.; Shi, Z.; Yang, X.; Gao, J.; Cai, D. Spatiotemporal trends of reference evapotranspiration and its driving factors in the Beijing–Tianjin Sand Source Control Project Region, China. Agric. For. Meteorol. 2015, 200, 322–333. [Google Scholar] [CrossRef]
  51. Von Storch, H. Misuses of statistical analysis in climate research. In Analysis of Climate Variability: Applications of Statistical Techniques; Storch, H.V., Navarra, A., Eds.; Springer: Berlin, Germany, 1999; pp. 11–26. [Google Scholar]
  52. Yue, S.; Pilon, P.; Cavadias, G. Power of the Mann–Kendall and Spearman’s rho tests for detecting monotonic trends in hydrological series. J. Hydrol. 2002, 259, 254–271. [Google Scholar] [CrossRef]
  53. Sun, S.; Fang, C. Water use trend analysis: A non-parametric method for the environmental Kuznets curve detection. J. Clean. Prod. 2018, 172, 497–507. [Google Scholar] [CrossRef]
  54. Xu, Z.X.; Takeuchi, K.; Ishidaira, H.; Li, J.Y. Long-term trend analysis for precipitation in Asian Pacific FRIEND river basins. Hydrol. Process. 2005, 19, 3517–3532. [Google Scholar] [CrossRef]
  55. Modarres, R.; da Silva, V.D.P.R. Rainfall trends in arid and semi-arid regions of Iran. J. Arid Environ. 2007, 70, 344–355. [Google Scholar] [CrossRef]
  56. Marchetto, A. Package rkt. Available online: http://cran.r-project.org/web/packages/rkt/rkt.pdf (accessed on 7 March 2017).
  57. R Core Team. R: A Language and Environment for Statistical Computing; R Foundation for Statistical Computing: Vienna, Austria, 2018; Available online: https://www.R-project.org/ (accessed on 2 July 2018).
  58. Rodionov, S.; Overland, J.E. Application of a sequential regime shift detection method to the Bering Sea ecosystem. ICES J. Mar. Sci. 2005, 62, 328–332. [Google Scholar] [CrossRef] [Green Version]
  59. Rodionov, S. A sequential algorithm for testing climateregime shifts. Geophys. Res. Lett. 2004, 31, L09204. [Google Scholar] [CrossRef]
  60. Doyle, M.J.; Picquelle, S.J.; Mier, K.L.; Spillane, M.C.; Bond, N.A. Larval fish abundance and physical forcing in the Gulf of Alaska, 1981–2003. Prog.Oceanogr. 2009, 80, 163–187. [Google Scholar] [CrossRef]
  61. Moellmann, C.; Diekmann, R.; Muller-Karulis, B.Ä.R.B.E.L.; Kornilovs, G.; Plikshs, M.; Axe, P. Reorganization of a large marine ecosystem due to atmospheric and anthropogenic pressure: A discontinuous regime shift in the Central Baltic Sea. Glob. Chang. Biol. 2009, 15, 1377–1393. [Google Scholar] [CrossRef]
  62. Vert-pre, K.A.; Amoroso, R.O.; Jensen, O.P.; Hilborn, R. Frequency and intensity of productivity regime shifts in marine fish stocks. PNAS 2013, 110, 1779–1784. [Google Scholar] [CrossRef] [PubMed] [Green Version]
  63. Litzow, M.A.; Urban, J.D.; Laurel, B.J. Increased spatial variance accompanies reorganization of two continental shelf ecosystems. Ecol. Appl. 2008, 18, 1331–1337. [Google Scholar] [CrossRef] [PubMed]
  64. Elliott, G.P. Influences of 20th century warming at the upper tree line contingent on local-scale interactions: Evidence from a latitudinal gradient in the Rocky Mountains, USA. Glob. Ecol. Biogeogr. 2011, 20, 46–57. [Google Scholar] [CrossRef]
  65. Peng, X.; Xiao, S.; Cheng, G.; Xiao, H.; Tian, Q.; Zhang, Q. Human activity impacts on the stem radial growth of Populuseuphratica riparian forests in China’s Ejina Oasis, using tree-ring analysis. Trees 2017, 31, 379–392. [Google Scholar] [CrossRef]
  66. Ceccarelli, T.; Bajocco, S.; Salvati, L.; Perini, L. Investigating syndromes of agricultural land degradation through past trajectories and future scenarios. Soil Sci. Plant Nutr. 2014, 60, 60–70. [Google Scholar] [CrossRef] [Green Version]
  67. Václavík, T.; Rogan, J. Identifying trends in land use/land cover changes in the context of post-socialist transformation in central Europe: A case study of the greater Olomouc region, Czech Republic. GISci. Remote Sens. 2009, 46, 54–76. [Google Scholar] [CrossRef]
  68. Eastman, J.R. TerrSet: Geospatial Monitoring and Modeling System Manual; Clark Labs, Clark University: Worcester, MA, USA, 2016. [Google Scholar]
  69. Chorley, R.J.; Haggett, P. Trend-surface mapping in geographical research. Trans. Inst. Br. Geogr. 1965, 37, 47–67. [Google Scholar] [CrossRef]
  70. Gustafson, E.J. Quantifying landscape spatial pattern: What is the state of the art? Ecosystems 1998, 1, 143–156. [Google Scholar] [CrossRef]
  71. Bayekenova, M.K.; Bazarbayev, A.T. Ecology and modern socio-economic conditions in Kazakhstan. In Environmental Problems of Central Asia and their Economic, Social and Security Impacts; Qi, J., Evered, K.T., Eds.; Springer: Dordrecht, The Netherlands, 2008; pp. 209–214. [Google Scholar]
  72. Akiyanova, F.Z.; Abitbayeva, A.D.; Baratovna Yegemberdiyeva, K.; Temirbayeva, R.K. Problems of desertification of the territory of Kazakhstan: Status and forecast. Life Sci. J. 2014, 11, 341–345. [Google Scholar]
  73. Akiyanova, F.Z.; Temirbayeva, R.K.; Bekkuliyeva, A.A. Functional zoning of the Kazakhstan’s part of the Caspian Sea shore for optimization of nature management. Life Sci. J. 2014, 11, 465–470. [Google Scholar]
  74. Kononova, N.K.; Pimankina, N.V.; Yeriskovskaya, L.A.; Li, J.; Bao, W.; Liu, S. Effects of atmospheric circulation on summertime precipitation variability and glacier mass balance over the Tuyuksu Glacier in Tianshan Mountains, Kazakhstan. J. Arid Land 2015, 7, 687–695. [Google Scholar] [CrossRef]
  75. Ismaiylov, G.K.; Fedorov, V.M.; Nezhad, S.S. Assessment of possible anthropogenic changes in the runoff of the Syr Darya River on the basis of a mathematical model. Water Resour. 2007, 34, 359–371. [Google Scholar] [CrossRef]
  76. Sorg, A.; Mosello, B.; Shalpykova, G.; Allan, A.; Clarvis, M.H.; Stoffel, M. Coping with changing water resources: The case of the Syr Darya river basin in Central Asia. Environ. Sci. Policy 2014, 43, 68–77. [Google Scholar] [CrossRef]
  77. Anzai, T.; Kitamura, Y.; Shimizu, K. The influence of seepage from canals and paddy fields on the groundwater level of neighboring rotation cropping fields: A case study from the lower Ili River Basin, Kazakhstan. Paddy Water Environ. 2014, 12, 387–392. [Google Scholar] [CrossRef]
  78. Guo, L.; Xia, Z.; Zhou, H.; Huang, F.; Yan, B. Hydrological Changes of the Ili River in Kazakhstan and the Possible Causes. J. Hydrol. Eng. 2015, 20, 5015006. [Google Scholar] [CrossRef]
  79. Thevs, N.; Nurtazin, S.; Beckmann, V.; Salmyrzauli, R.; Khalil, A. Water consumption of agriculture and natural ecosystems along the Ili River in China and Kazakhstan. Water 2017, 9, 207. [Google Scholar] [CrossRef]
  80. Glantz, M.H. Aral Sea basin: A sea dies, a sea also rises. AMBIO 2007, 36, 323–327. [Google Scholar]
  81. Medeu, A.R. The methodology of natural hazards management in Kazakhstan. Geogr. Environ. Sustain. 2015, 8, 69–91. [Google Scholar] [CrossRef]
  82. Knox, C. Kazakhstan: Modernizing government in the context of political inertia. Int. Rev. Adm. Sci. 2008, 74, 477–496. [Google Scholar] [CrossRef]
  83. Rywkin, M. Stability in Central Asia: Engaging Kazakhstan. Am. Foreign Policy Interests 2005, 27, 439–449. [Google Scholar] [CrossRef]
  84. Ziegler, C.E. Civil society, political stability, and state power in Central Asia: Cooperation and contestation. Democratization 2010, 17, 795–825. [Google Scholar] [CrossRef]
  85. Griffiths, P.; Müller, D.; Kuemmerle, T.; Hostert, P. Agricultural land change in the Carpathian ecoregion after the breakdown of socialism and expansion of the European Union. Environ. Res. Lett. 2013, 8, 045024. [Google Scholar] [CrossRef] [Green Version]
  86. Prishchepov, A.V.; Radeloff, V.C.; Dubinin, M.; Alcantara, C. The effect of Landsat ETM/ETM+ image acquisition dates on the detection of agricultural land abandonment in Eastern Europe. Remote Sens. Environ. 2012, 126, 195–209. [Google Scholar] [CrossRef]
  87. Zimina, R.P.; Polevaya, Z.A.; Yelkin, K.F. The plowing up of the virgin lands and the bobacmarmot resources of central Kazakhstan. Sov. Geogr. 1972, 13, 246–256. [Google Scholar] [CrossRef]
  88. Brezhnev, L.I. Virgin Lands: Two Years in Kazakhstan, 1954–5; Pergamon Press: Oxford, UK, 2014. [Google Scholar]
  89. Volin, L. A Century of Russian Agriculture. From Alexander II to Khrushchev; Harvard University Press: Cambridge, MA, USA, 1970. [Google Scholar]
  90. Ercilasun, K. Soviet agricultural policy and cultivating “Virgin Lands” in Kazakhstan. In Kazakhstan, Kyrgyzstan, and Uzbekistan: Politics and History in Central Asia; Dadabaev, T., Komatsu, H., Eds.; Palgrave Macmillan: New York, NY, USA, 2017; pp. 53–65. [Google Scholar]
  91. Kaiser, M.J.; Pulsipher, A.G. A review of the oil and gas sector in Kazakhstan. Energy Policy 2007, 35, 1300–1314. [Google Scholar] [CrossRef]
  92. OECD Development Pathways Multi-Dimensional Review of Kazakhstan: Volume 2. In-Depth Analysis and Recommendations; OECD Publishing: Paris, France, 2017.
  93. Schmitz, A.; Meyers, W.H. Transition to Agricultural Market Economies: The Future of Kazakhstan, Russia and Ukraine; CAB International: London, UK, 2015. [Google Scholar]
  94. Wädekin, K.E. Communist Agriculture: Farming in the Soviet Union and Eastern Europe; Routledge: London, UK, 1990. [Google Scholar]
  95. Wegerich, K. Blueprints for water user associations’ accountability versus local reality: Evidence from South Kazakhstan. Water Int. 2008, 33, 43–54. [Google Scholar] [CrossRef]
  96. Stone, R. For China and Kazakhstan, no meeting of the minds on water. Science 2012, 337, 405–407. [Google Scholar] [CrossRef] [PubMed]
  97. Sagin, J.; Adenova, D.; Tolepbayeva, A.; Poryadin, V. Underground water resources in Kazakhstan. Int. J. Environ. Stud. 2017, 74, 386–398. [Google Scholar] [CrossRef]
  98. Stewart raf, D.I. Water conflict in Central Asia–Is there potential for the desiccation of the Aral Sea or competition for the waters of Kazakhstan’s cross-border Ili and Irtysh Rivers to bring about conflict; and should the UK be concerned? Defence Stud. 2014, 14, 76–109. [Google Scholar] [CrossRef]
  99. Salnikov, V.; Turulina, G.; Polyakova, S.; Petrova, Y.; Skakova, A. Climate change in Kazakhstan during the past 70 years. Quat. Int. 2015, 358, 77–82. [Google Scholar] [CrossRef]
  100. Kosdauletova, R. Methodology and business background of the urban agglomerations development in the real life of Kazakhstan. Public Policy Adm. 2014, 13, 232–242. [Google Scholar] [CrossRef]
  101. Wuzhati, Y.; Hui, L.; Liu, W. Evaluation of Kazakhstan’s urbanization during 1992–2011 and its influencing factors. Prog. Geogr. 2014, 33, 181–193. (In Chinese) [Google Scholar]
  102. Rykov, P.V.; Li, Z. Development of urban agglomerations of the Republic of Kazakhstan in conditions of the formation of the New Silk Road. J. Resour. Ecol. 2015, 6, 101–105. [Google Scholar] [CrossRef]
  103. Seitz, W.H. Urbanization in Kazakhstan: Desirable Cities, Unaffordable Housing, and the Missing Rental Market (No. 8530); The World Bank: New York, NY, USA, 2018. [Google Scholar]
  104. Lal, R.; Suleimenov, M.; Stewart, B.A.; Hansen, D.O.; Doraiswamy, P. Climate Change and Terrestrial Carbon Sequestration in Central Asia; Taylor & Francis Group: London, UK, 2007. [Google Scholar]
  105. Wertebach, T.M.; Hölzel, N.; Kämpf, I.; Yurtaev, A.; Tupitsin, S.; Kiehl, K.; Kamp, J.; Kleinebecker, T. Soil carbon sequestration due to post-Soviet cropland abandonment: Estimates from a large-scale soil organic carbon field inventory. Glob. Chang. Biol. 2017, 23, 3729–3741. [Google Scholar] [CrossRef] [PubMed]
  106. Ogino, Y.; Hatcho, N.; Tsutsui, H. World irrigation (VIII): Salinization and water management in arid regions with emphasis on Kazakhstan. Rural Environ. Eng. 1998, 34, 5–24. [Google Scholar]
  107. Kitamura, Y.; Yano, T.; Honna, T.; Yamamoto, S.; Inosako, K. Causes of farmland salinization and remedial measures in the Aral Sea basin: Research on water management to prevent secondary salinization in rice-based cropping system in arid land. Agric. Water Manag. 2006, 85, 1–14. [Google Scholar] [CrossRef]
  108. Thomas, R.J. Opportunities to reduce the vulnerability of dryland farmers in Central and West Asia and North Africa to climate change. Agric.Ecosyst. Environ. 2008, 126, 36–45. [Google Scholar] [CrossRef]
  109. Kienzler, K.M.; Lamers, J.P.A.; McDonald, A.; Mirzabaev, A.; Ibragimov, N.; Egamberdiev, O.; Ruzibaev, E.; Akramkhanov, A. Conservation agriculture in Central Asia—What do we know and where do we go from here? Field Crop. Res. 2012, 132, 95–105. [Google Scholar] [CrossRef]
  110. Squires, V.R.; Lu, Q. Sustainable Land Management in Greater Central Asia: An Integrated and Regional Perspective; Rougtledge: New York, NY, USA, 2018. [Google Scholar]
  111. Kennedy, R.E.; Yang, Z.; Cohen, W.B. Detecting trends in forest disturbance and recovery using yearly Landsat time series: 1. LandTrendr—Temporal segmentation algorithms. Remote Sens. Environ. 2010, 114, 2897–2910. [Google Scholar] [CrossRef]
  112. Verbesselt, J.; Hyndman, R.; Newnham, G.; Culvenor, D. Detecting trend and seasonal changes in satellite image time series. Remote Sens. Environ. 2010, 114, 106–115. [Google Scholar] [CrossRef]
  113. Fang, X.; Zhu, Q.; Ren, L.; Chen, H.; Wang, K.; Peng, C. Large-scale detection of vegetation dynamics and their potential drivers using MODIS images and BFAST: A case study in Quebec, Canada. Remote Sens. Environ. 2018, 206, 391–402. [Google Scholar] [CrossRef]
Figure 1. Map of Kazakhstan (study area is denoted with a pink line on the map and inset global map).
Sustainability 10 04042 g001
Figure 2. Regime shifts of rainfed cropland, irrigated cropland, and arable land areas in Kazakhstan in 1992–2015, (a) rainfed cropland; (b) irrigated cropland; and (c) arable land from FAO.
Sustainability 10 04042 g002
Figure 3. Areal change in rainfed and irrigated cropland in 14 regions of Kazakhstan from 1992 to 2015. The black filled dots represent rainfed cropland, and the black empty dots represent irrigated cropland, red lines for regime shift trends in rainfed cropland and blue lines for regime shift trends for irrigated cropland. (a) Aqtobe, (b) Qostanay, (c) Aqmola, (d) North Kazakhstan, (e) West Kazakhstan, (f) Atyrau, (g) Mangghystau, (h) Pavlodar, (i) East Kazakhstan, (j) Qaraghandy, (k) Qyzyloeda, (l) South Kazakhstan, (m) Zhambyl and (n) Almaty.
Sustainability 10 04042 g003
Figure 4. Areal changes and contributions of other land use types to the net change in rainfed cropland in different periods. (a) 1992–2015; (b) 1992–1995; (c) 1995–2000; (d) 2000–2005; (e) 2005–2010; and (f) 2010–2015.
Sustainability 10 04042 g004
Figure 5. Areal changes and contributions of other land use types to the net change in irrigated cropland in different periods. (a) 1992–2015; (b) 1992–1995; (c) 1995–2000; (d) 2000–2005; (e) 2005–2010; and (f) 2010–2015.
Sustainability 10 04042 g005
Figure 6. Trend surface analysis of the transitions from steppe to rainfed cropland. (a) 1992–2015; (b) 1992–1995; (c) 1995–2000; (d) 2000–2005; (e) 2005–2010; and (f) 2010–2015.
Sustainability 10 04042 g006
Figure 7. Trend surface analysis of the transitions from steppe to irrigated cropland. (a) 1992–2015; (b) 1992–1995; (c) 1995–2000; (d) 2000–2005; (e) 2005–2010; and (f) 2010–2015.
Sustainability 10 04042 g007
Table 1. Land cover reclassification based on the ESA-CCI land cover dataset.
Land Cover ClassESA Land Cover Class ComponentsCode
Rainfed croplandCropland, rainfed (10); Mosaic cropland (>50%)/natural vegetation (tree, shrub, herbaceous cover) (<50%)(30)10
Irrigated croplandCroplands, irrigated or post-flooding (20)20
ForestTree cover, broadleaved, evergreen, closed to open (>15%) (50); Tree cover, broadleaved, deciduous, closed to open (>15%) (60); Tree cover, needleleaved, evergreen, closed to open (>15%) (70); Tree cover, needleleaved, deciduous, closed to open (>15%) (80); Tree cover, mixed leaf type (broadleaved and needleleaved) (90); Mosaic tree and shrub (>50%)/herbaceous cover (<50%) (100)30
SteppeMosaic cropland (<50%)/natural vegetation (tree, shrub, herbaceous cover) (>50%)(40); Mosaic herbaceous cover (>50%)/tree and shrub (<50%) (110); Shrubland (120); Grassland (130); Lichens and mosses (140); Sparse vegetation (tree, shrub, herbaceous cover) (<15%) (150);40
WetlandTree cover, flooded, fresh or brackish water (160); Tree cover, flooded, saline water (170); Shrub or herbaceous cover, flooded, fresh/saline/brackish water (180)50
Artificial areaUrban areas (190)60
BarelandBare areas (200); Permanent snow and ice (220)70
Water bodyWater bodies (210)80
Table 2. Time series analysis using the Mann–Kendall test for annual cropland areas at national and regional levels during the period 1992 to 2015.
RegionRainfed CroplandIrrigated Cropland
Sen’s Slopep-ValueSen’s Slopep-Value
National level
ESA-CCI dataset2815.1360.00308.6670.00
FAO statistics *−2497.800.02
Regional level
Almaty302.42220.0186.36670.00
Aqmola338.1250.00--
Aqtobe21.291670.40--
Atyrau15.33330.00--
East Kazakhstan314.99110.0025.90.00
Mangystau----
North Kazakhstan37.29050.00--
Pavlodar822.86860.0000.78
Qaraghandy507.94120.00--
Qostanay69.53330.00--
Qyzylorda−4.15480.0041.03330.00
South Kazakhstan6.28290.1247.30.00
West Kazakhstan240.66180.00--
Zhambyl84.28570.0494.94520.01
Bold values indicate trends significant at the 0.05 level. * For FAO statistics, data in rainfed cropland column are actually for arable land.
Table 3. Analysis results of cycle between abandonment and recultivation during 5 subperiods (km2).
No.Area (A) *Area (C)SP-IVSP-V
Area (RC)% of RC/A% of RC/CArea (RC)% of RC/A% of RC/C
SP-I120 43.110.05410.960.071
SP-II435 153.450.218122.860.767
SP-III838 80.930.11340.430.224
SP-IV 689827 ** 0.385
SP-V 1623 17 1.063
* Upper cases inparentheses indicate the transition between specific categories of land cover: A represents abandonment, C represents cultivation and RC represents recultivation. ** Bold figures indicate the sum of area in the first three subperiods.

