A Conceptual Framework for Assessing an Organization’s Readiness to Adopt Big Data


Department of Business Informatics, University of Economics in Katowice, 1 Maja 50, 40-287 Katowice, Poland
*
Author to whom correspondence should be addressed.
Sustainability 2018, 10(10), 3734; https://doi.org/10.3390/su10103734
Submission received: 11 September 2018
/
Revised: 8 October 2018
/
Accepted: 15 October 2018
/
Published: 17 October 2018
(This article belongs to the Special Issue Big Data Research for Social Sciences and Social Impact)
Abstract
:The main aim of this paper is to provide a theoretically and empirically grounded discussion on big data and to propose a conceptual framework for big data based on a temporal dimension. This study adopts two research methods. The first research method is a critical assessment of the literature that aims to identify the concept of big data in organizations. This method is composed of a search for source materials, the selection of the source materials, and their analysis and synthesis. It has been used to develop a conceptual framework for assessing an organization’s readiness to adopt big data. The purpose of the second research method is to provide an initial verification of the developed framework. This verification consisted of conducting qualitative research with the use of an in-depth interview in 15 selected organizations. The main contribution of this study is the Temporal Big Data Maturity Model (TBDMM) framework, which can help to measure the current state of an organization’s big data assets, and to plan their future development with respect to sustainability issues. The proposed framework has been built over a time dimension as a fundamental internal structure with the goal of providing a complete means for assessing an organization’s readiness to process the temporal data and knowledge that can be found in modern information sources. The proposed framework distinguishes five maturity levels: atemporal, pre-temporal, partly temporal, predominantly temporal, and temporal, which are used to evaluate data/knowledge, information technology (IT) solutions, functionalities offered by IT solutions, and the sustainable development context.
1. Introduction
In recent years, the source of power has shifted from land, finance, and capital to information and knowledge [1]. Organizations can use information: (1) to collect information about competitors, customers, suppliers, industries, and governments; (2) to collect and analyze background information, such as information about technology, politics, and society; (3) to observe the changing business environment and keep track of trends; and (4) to monitor the trends of suppliers of materials, exporting nations, and competitors. Historically, organizations have stored and explored internal information in order to better understand their business processes and to improve their decision-making on an operational and tactical level [2]. Recently, organizations have started to analyze the external information that comes from different dispersed information sources; e.g., from competitors, industries, government, administration, and healthcare [3,4]. In this respect, the study of big data is highly important. On the other hand, practice has shown questionable success from the application of big data. Organizations do not achieve an appropriate degree of benefit from big data usage. The reasons for this failure are not clear and have not been well-investigated. So, there is a need for a more systematic and deliberate study of tools for assessing organizations’ readiness to adopt big data.
The first commonly accepted definitions of big data took into account three Vs: Volume, Velocity, and Variety [5,6,7,8,9]. Then, two other Vs (Veracity and Value) were added to form five Vs [10]. Recently, big data has been characterized by seven Vs: Volume, Velocity, Variety, Veracity, Variability, Visualization, and Value [11]. In the contemporary global economy, the velocity dimension of big data is particularly important, as the speed at which an organization takes action is critical to its gaining a sustainable competitive advantage. Organizations have to respond in almost real time to emergent challenges and opportunities [12]. For this reason, real-time big data analytics has gained importance. Two of the hottest trends for 2018 in big data analytics are real-time data analytics and data visualization [13]. All of the definitions of big data, such as those listed in [11], emphasize big data’s volume, variety, and rate of change (velocity), and reveal at the same time the strong link between big data analytics and new business insights [14]. These analytical procedures may be even called temporal big data analytics; that is, analytics focused on data change and on a time dimension in the domain being analyzed. At the same time, the greatest benefits (as perceived by top management) for a competitive organization come from the use of all data available from inside and outside the organization at the same time; i.e., its integration and then real-time analysis from a holistic viewpoint [13]. A sustainable competitive advantage and sustainable development are becoming more and more dependent on an organization’s ability to manage big data, information, and knowledge [15,16,17]. In this way, advanced data analytics and a sustainable competitive advantage are linked together. Research shows that any organization that is willing to be competitive and innovative must also be self-adjusting, sensitive, and responsive to have continued market relevance and viability/sustainability [18]. Real-time big data analytics is one of the ways to achieve this state.
It is widely recognized that new sources of insight need to be used, as big data analytics is a new enabler of a sustainable competitive advantage. It enables organizations to have improved business efficiency because of its high operational and strategic potential [19]. “Big data analytics (…) has emerged as the new frontier of innovation and competition” [20] (p. 190).
Although there have been numerous studies on big data over the last few years, they have not addressed the essence of temporal big data’s maturity and the design of temporal big data maturity models for assessing an organization’s readiness to adopt big data. They have been mainly focused on static and well-structured information. The issue of the design of a framework for assessing an organization’s readiness to adopt big data based on the temporal dimension has been insufficiently investigated. The research studies are fragmentary and scattered. There is a lack of a comprehensive framework in this respect as well as a lack of examples on how to build and use such a framework in organizations. Moreover, as stated in [21], the existing frameworks are mainly technically focused. There is no maturity framework that addresses both big data adoption based on the temporal dimension and its implications for an organization’s sustainable development issues. On the other hand, the existing maturity models, such as sustainability maturity models and stakeholders’ relationships maturity models, do not address advanced analytics issues in a satisfactory manner. Hence, a comprehensive maturity framework aimed at combining these two perspectives is required.
The main aim of this study is to investigate the issue of big data and to propose a conceptual framework for big data based on the temporal dimension. Temporality in the proposed framework extends and enhances the existing maturity models for big data that have been developed, e.g., by [22,23,24,25,26]. The existing frameworks in fact only take into account the three classical Vs (Volume, Variety, and Veracity) or sometimes five Vs (Volume, Variety, Veracity, Visualization, and Value). The proposed framework also incorporates the sixth and the seventh Vs (Velocity and Variability); thus, it provides a complete toolkit for assessing not only the current state of an organization’s big data assets and its current set of analytical tools, but also the organization’s preparedness for processing this influx of temporal data and/or knowledge that can be found in modern sources of information.
This study adopts two research methods. The first research method is a critical assessment of the literature that aims to identify the concept of big data in organizations. This method is used to develop a conceptual framework for assessing an organization’s readiness to adopt big data. The purpose of the second research method is to provide an initial verification of the developed framework. This verification consists of conducting qualitative research with the use of an in-depth interview in 15 selected organizations.
Our study makes several theoretical contributions to the relevant literature. First, big data (BD) is generally an unexplored field of research. Therefore, the current study contributes to the emerging literature on BD by investigating the issue of BD from a temporal perspective. Second, the current study is one of the rare studies that proposes a framework that would be helpful to measure the current state of an organization’s big data assets and to plan for their future development. Third, this study demonstrates that the proposed framework distinguishes five maturity levels—atemporal, pre-temporal, partly temporal, predominantly temporal, and temporal—that are used to evaluate data/knowledge, information technology (IT) solutions, functionalities offered by IT solutions for organizations, and the sustainable development context. Finally, the current findings provide empirical evidence that the proposed framework may play an important role in the management of organizations.
The structure of the paper is as follows. In Section 2, related work on big data, sustainability, and maturity models is presented and discussed. Section 3 is devoted to the Temporal Big Data Maturity Model (TBDMM) framework. In Section 4, the reception of the TBDMM among managers is presented in detail. Section 5 contains a discussion of the research findings, and Section 6 contains our concluding remarks.
2. Related Work
2.1. Big Data and Sustainability Issues
The interest in analytics in the information systems domain has continued for many years. This is reflected in research that was conducted in the 1980s and 1990s and that referred mainly to Management Information Systems (MIS), Decision Support Systems (DSS), and Enterprise Information Systems (EIS) [2,27,28,29]. The 21st century has been characterized by the development of data warehousing, Online Analytical Processing (OLAP), Business Intelligence (BI), Competitive Intelligence (CI), and big data. The common assumption that underlies these analytical systems is that information that is appropriately acquired, collected, analyzed, integrated, and used may be a critical component in the success of an organization. Analytical systems may help organizations to reach strategic goals, make better decisions, improve business processes, increase profitability, and improve customer satisfaction [29,30,31,32,33]. At the same time, it is emphasized that this challenge becomes more difficult with the constantly increasing volume of information, both internal and external, that is available to an organization.
To better understand the concept of big data, it is worth recalling the basic assumptions that underlie the idea of BI and CI, which represent the most recent stages in the evolution of analytical systems. It is said that BI is focused mainly on acquiring and analyzing internal information; thus, it helps to improve internal business processes and decision-making on an operational and tactical level [2]. CI refers to the collection and exploration of external information that comes from an organization’s environment [3,4]. Organizations believe that external information is as valuable to them (and sometimes even more) as information that comes from their own internal sources. According to many authors, organizations that are able to understand their environment and their competitors and establish competitive management strategies will win in this rapidly globalizing information society [1,28,34]. It has been highlighted [35] that BI cannot replace CI and vice versa. The main aim of BI is to manage an organization’s well-structured internal data and processes. Typical BI tools include reporting, OLAP, data warehouse, and data mining and visualization toolkits. In contrast, data that originates from external sources, which is distinctive of CI, is usually semi-structured and unstructured. Therefore, a strong position in CI requires tools such as advanced data mining, predictive modeling, web mining, text mining, and opinion mining tools. Big data, compared to BI and CI, concerns an even broader spectrum of data and more complex and sophisticated data processing. In general, it is not possible to store and process this kind of data by conventional databases and data analysis techniques [36]. It requires tools and methods that are capable of analyzing and extracting patterns from large-scale data. The rise of big data has been caused by increased data storage capabilities, increased computational processing power, and the availability of huge volumes of data [37]. Big data mainly concerns unstructured information about competitors, customers, and other stakeholders of the organization (Table 1).
A critical analysis of the literature on the subject shows that there is no consensus on the correct interpretation of the term “big data” (Table A1 [38,39,40,41,42,43,44,45,46,47,48,49,50,51,52,53,54,55,56,57,58,59,60,61] in Appendix A).
Ferguson [56] states that the term “big data” is “associated with the new types of workloads and underlying technologies needed to solve business problems that could not be previously supported due to technology limitations, prohibitive cost, or both”. It has been highlighted that big data is therefore not just about data volumes but about analytical workloads that are associated with some combination of data volume, data velocity, and data variety that may include complex analytics and complex data types. It is believed that big data, when analyzed in combination with traditional organizational data, enables organizations not only to better understand their business, but first of all to change it and to have new sources of revenue, a more competitive position, and greater innovation. The most widely accepted definition of big data is the one by Gartner [5] (cf. Table A1). Gartner stresses the role of big data as a new type of asset, which—if properly addressed—may provide organizations with enhanced insights and better decision-making. In turn, the most extensive definition of big data has been given by [61], which focuses on data heterogeneity, the lack of structure, and the Internet as big data source. When analyzing such data, organizations gain a deeper understanding of the economic environment, which may lead to the creation of a sustainable business and a sustainable competitive advantage.
When analyzing the literature, it should be noticed that the concept of big data may be explained from a technical or an organizational perspective. From a technical point of view, big data means new technologies and tools that make it possible to process huge amounts of data that come from such new sources as sensors, social media, and real-time systems [9,38,39,40,41,42,43,44,45,46,47,48,49,50]. From an organizational point of view, big data means new ways of running a business, of decision making, and of understanding the customers, suppliers, and other stakeholders of organizations [7,8,24,51,52,53,54]. There are also some explanations that take both perspectives into account [5,6,55,56,57,58,59,60]. Some research shows that big data can completely change the functioning of an organization [62]. Recently, the notion of smart data— big data that has been initially preprocessed—has been gaining popularity [63,64]. “Smart data arises by expediently structuring information from big data which then can be used for knowledge advances and decision making” [65].
According to [24,53], big data is a new asset that creates valuable opportunities for organizations. The most outstanding one is creating multidimensional business insights that encompass, inter alia, insights into customers’ interests, passions, affiliations, and associations, product performance recommendations, and location-based insights. In this way, an organization is able to quickly respond to external challenges/trends, to make faster decisions, and to obtain more precise answers from data [43].
It has been highlighted that big data, when explored and analyzed together with traditional organizational data, enables organizations not only to better understand their business, but first of all to change it and to have new sources of revenue, a more competitive position, and greater innovation. Nelson [51] says that the use of big data in organizations will contribute mainly to improving decision-making through crowdsourcing, a better visualization of data and complex relationships, making the reporting and monitoring of business decisions easier, making the detection of complex patterns in data faster, and making the search for information and results easier.
It has been stated that big data enables the creation of innovative business models, products, and services. It gives organizations a way to outperform their competition. This kind of data may be used to achieve a better understanding of an organization’s customers, employees, partners, and operations [39]. Big data may complement BI systems, and provide in-depth insights and predictive analytics on unstructured massive data. Big data provides organizations with a completely new kind of insight with its analyses of social media, images, natural language, and so on. With big data, unstructured web content may be understood and used for predictive analysis. With such possibilities, big data sources may be used for analysis in such areas as decision-making, customer insights, competitive intelligence systems, marketing, and human resources. Customers and competitors are now understood better, and decisions are better, as they are fact-based [66]. Schmarzo [24] gives some examples of new insights that are possible with big data. These are, among others:
- resource scheduling based on purchase history, buying behaviors, and local weather and events;
- distribution and inventory optimization given current and predicted buying patterns and local demographic, weather, and events data;
- integrating analytics directly into products to create “intelligent” products; and
- insights about customers’ usage patterns, product performance behaviors, and overall market trends.
These insights may be also accompanied by social media analysis when an organization obtains feedback on customers’ needs and expectations concerning current and future products/services. As pointed out in [67], modern organizations face several new megatrends, one of which is globalization. It is, therefore, not sufficient to analyze only the immediate economic environment in order to be competitive; organizations have to also consider globalization processes. One of the current globalization challenges is to ensure the sustainable evolution of human existence in its social, environmental, and economic dimensions. Hence, business value creation must be geared towards sustainability [65]. According to [68], “sustainability is a paradigm for thinking about the future in which environmental, societal, and economic considerations are equitable in the pursuit of an improved lifestyle”, and innovative solutions (such as business models, goods, and services) have to be developed according to this new paradigm. Big data has the potential to transform business processes [69], providing organizations with the opportunity to create new, sustainable business models, and to realize sustainable business value creation in the three sustainability dimensions: economic, social, and environmental [65]. As claimed in [70], these new business models can contribute to solving an environmental or a social problem. It has even been postulated that we treat the big data that is captured and analyzed by organizations as a knowledge commons that will help us to create innovative solutions to various socioeconomic problems [71]. It has also been argued that real-time big data analytics may provide the basis for a more efficient, sustainable, competitive, and productive organization [16]. In this way, temporal big data analytics may link together a successful organization and sustainability. However, there is a lack of a comprehensive framework that links the maturity of an organization’s temporal big data analytics adoption with the sustainable development of an organization. There are some frameworks that address in a detailed manner such questions as sustainability maturity [72,73], stakeholders’ relationships management maturity [74,75], or related concepts, such as learning maturity [76,77] and change management maturity [78]; however, they do not cover big data analytics issues in relation to management questions.
Along with the increasing number of data sources and types, one important challenge that emerges is how to ensure that the analytical results from big data are trustworthy. Research from IBM has shown that one in three managers do not trust the information used in their decision-making processes, and 27% of managers are unsure about the accuracy of the information [79]. The value of insights from big data depends not only on meeting the challenges from the seven Vs. The analytical process also has to ensure that there are solutions to such problems as data quality, data cleansing, real-time analysis and decision-making, parallel and distributed computing, exploratory analysis, and new models for big data computation (to name only a few) [37].
Despite the many potential benefits of big data analytics that were pointed out above, the current level of its take-up is not satisfactory [13]. This is most probably due to the fact that many organizations lack the knowledge that is required to organize and create big data insights and profit from them. The theory of maturity models may provide organizations with methods and guidelines to develop the big data idea.
2.2. Maturity Models
“Maturity” may be defined as “a state of being complete, perfect, or ready” [80]. Cooke-Davies [81] treats the notion of maturity more widely by pointing out that maturity may be graded from extreme immaturity to extreme maturity. Maturity is obtained in the process of improving certain needed tasks and activities. To assess the level of maturity in various domains, so-called maturity models have been proposed by several authors.
According to [80,82], a maturity model allows us to identify the strong and weak points of a domain. Hence, with such a model, it is possible to assess an organization (or part of it) and to describe its current state of development. Many maturity models originate from the popular Capability Maturity Model (CMM). It was proposed in 1991 for a software development process. This was then superseded by Capability Maturity Model Integration (CMMI), which integrates several sub-models concerning various areas of an organization. In CMMI—and also in many of the models that have followed it—the maturity of an area may be placed on one of several maturity levels. A typical set of maturity levels is presented in Figure 1. The main goal of integrating maturity models into an analysis is to codify knowledge on good processes/activities, codify knowledge on which assessment criteria can be brought to bear on the issue, and to elaborate upon a systematized way of assessing a domain [83].
Generally speaking, any maturity model falls into one of the following categories [85]:
- descriptive: used to determine an organization’s level of maturity;
- prescriptive: describing a desired state and assessing an organization’s distance to it;
- transitive: determining the steps that an organization must follow to reach the desired state.
As has already been highlighted, the current set of maturity models were first set up for process management and software development, but the ability of these models to be adapted for other domains has caused their popularity to spread. Hence, maturity models can also be used for the assessment of an organization’s ability and capability to make use of big data.
2.3. Maturity Models for Big Data
Researchers have most commonly proposed to use the classical CMM and/or CMMI models to assess an organization’s capability to adopt big data. Such an approach is presented in [86]. Spaletto [87] proposes to use the CMM to assess an organization’s big data strategy and standards of data growth management. Such an approach would enable us to identify effective strategies for managing exponential data growth.
The authors in [88] propose the use of CMMI and/or Software Process Improvement and Capability Determination (SPICE) models to assess web engineering systems, because, when using them, one may consider also the latest trends, such as cloud computing, that are closely linked to big data. Hence, it would be possible to adapt this approach in order to investigate an organization’s maturity in big data adoption.
The SaaS maturity model proposed in [89] may be used to measure the big data maturity of an organization. This is because any organization capable of using SaaS is also capable of using big data. These authors assess maturity in the context of service components and link them to the levels of maturity.
The first model designed to measure the maturity level of an organization in the context of big data analytics has been proposed by The Data Warehouse Institute (TDWI). TDWI’s Big Data Maturity Model describes the steps that every organization has to follow while undertaking big data initiatives. The model shows how an organization can transform itself to fully profit from big data, and is composed of five levels [22]: nascent, pre-adoption, early adoption, corporate adoption, and mature/visionary.
Radcliffe Advisory Services [23] proposes a Big Data Maturity Model that aims to arrange the notions that are connected to big data, assess the current state of an organization, and build a vision for the use of big data in the future. The model is similar to other maturity models, and is composed of six levels: five main ones and an additional one, which is described as “level 0” (“In the Dark”), where organizations do not even realize that big data exists. The main levels are called Catching up, First Pilot(s), Tactical Value, Strategic Leverage, and Optimize and Extend. The Radcliffe model is rather general, and the company offers only a set of big data hints to help organizations pass through all of the maturity levels [90].
Schmarzo [24] proposed the Big Data Business Model Maturity Index as a tool for assessing the maturity of a business model in the context of big data usage. As Schmarzo claims, organizations may use this index to:
- obtain information on their stage of use of advanced big data analytics, on their value creation process, and on their business models; that is, obtain information on their current state;
- identify the desired target state.
Schmarzo’s model is composed of five levels (stages): Business Monitoring, Business Insights, Business Optimization, Data Monetization, and Business Metamorphosis. The first three levels are focused on optimizing an organization’s internal business processes. The last two levels are focused on the organization’s environment: its clients and markets.
It has to be noted, however, that none of the abovementioned big data maturity models accommodate the important factor of time, even though the temporal dimension is essential due to big data’s velocity. For this reason, in this paper, a new conceptual framework for assessing an organization’s readiness to adopt big data is proposed. The framework, named the Temporal Big Data Maturity Model (TBDMM), explicitly incorporates the temporal dimension. Temporality in the proposed maturity framework is an element that complements the other models, and enables a full adoption of big data’s seven Vs. The existing models in fact take into account only five Vs (Volume, Variety, Veracity, Visualization, and Value), while the framework proposed in this paper also incorporates the sixth and seventh Vs (Velocity and Variability). In this respect, the new maturity framework is more complete than the existing ones.
3. Framework of the Temporal Big Data Maturity Model (TBDMM)
3.1. Levels of Temporality
The main idea of the proposed framework—to incorporate the time dimension in it—results from several observations. First and foremost, all types of knowledge processed by organizations, such as internal knowledge and knowledge from big data, may be considered temporal. The “temporality” of knowledge is seen in knowledge changes; knowledge is mostly dynamic in nature and evolves in time. Hence, knowledge possesses an explicit time dimension that must not be omitted in order to not lose the temporal characteristics of a domain. In this way, time turns out to be one of the most important aspects of knowledge analytics in organizations.
Second, the time dimension is indispensable for making inferences about areas of interest that are dynamic, such as the economic and competition domains. Such inferences can be performed by intelligent computer systems that mimic human reasoning. Hence, data, knowledge, and reasoning may be considered at different levels of temporality.
Regarding the time dimension, there can be the following types of data:
- static data: this data does not contain any temporal context, nor can this context be inferred from it;
- sequences: ordered sequences of static data with no direct time stamps (relative ordering, such as “earlier” or “later”);
- time-stamped sequences: sequences of static data stamped with time, which are collected in regular or irregular intervals; and
- fully temporal data: data that contains at least one time dimension; e.g., valid time or transaction time.
Knowledge temporality levels are similar, and may be characterized as follows:
- static knowledge: this knowledge does not contain any temporal context, nor can this context be inferred from it. An example of such knowledge is the sentence: “Every organization has to conform to legal rules”;
- sequences: ordered sequences of events with no direct time stamps. These may be, e.g., events ordered by Allen’s temporal relations [91]. An example of sequential knowledge may concern the legal domain; namely, the sequential knowledge about a law-creating process: passing a law → signing of the law by the President → publishing the law;
- time-stamped knowledge: static knowledge that has been extended with time stamps (an example of which is a description of a license issuing process: Application for a license → decision → valid period of the license); and
- fully temporal knowledge: knowledge that possesses at least one time dimension, e.g., knowledge on the varying prices of shares.
Depending on the type of data and knowledge, different reasoning rules may be applied:
- static rules: rules with no time context;
- temporally extended static rules; e.g., temporal descriptive rules; and
- rules that are proper to fully temporal knowledge; e.g., causal detection rules and temporal data mining rules.
As for the levels of temporality, all types of big data fall into the category of fully temporal data. However, as regards the various types of big data, it is also possible to discuss them in a temporal logic structure context. Big data differs depending on the source. These can be click streams, data from mobile and business transactions, user-generated content (UGC), social media data, sensor data, healthcare records, and management and finance data. The most intuitive temporal classification of big data is, therefore, the one that considers the time structure that is used to represent and process the data. Data that is generated periodically, such as financial or management data, may be formalized using point structures, while almost-continuous data flows, such as social media data, may need interval structures or point-interval ones. There is, of course, also the question of time granularity, which will not be discussed in this paper.
The above definitions of various atemporal and temporal types of data, knowledge, and reasoning have been used to develop the levels of the Temporal Big Data Maturity Model. The main assumption regarding the analytical maturity of an organization in the context of temporal big data states that the more mature the organization is, the more temporal solutions it uses in its analytics.
3.2. The Temporal Big Data Maturity Model (TBDMM)
In this paper, the Temporal Big Data Maturity Model (TBDMM) is advocated as a way to establish an organization’s level of maturity in temporal big data analytics. It enables an organization to measure its big data assets and the effectiveness of its current analytical tools and to plan for their evolution. Furthermore, the model intentionally makes use of the time dimension. Therefore, it provides a complete toolkit for gauging an organization’s fitness to process temporal data and/or knowledge. Hence, we propose the new framework as a guide for organizations that are willing to implement temporal big data analytics. With the TBDMM, organizations may be able to plan and execute the steps that are necessary to move from one level (their current state) to another (the desired one). However, to be fully functional, the framework needs to be accompanied by a self-assessment form. Such a form, originating from the characteristics of the subsequent maturity levels, will allow organizations to assess the state of temporal BD analytics in order to plan their subsequent activities.
The framework of the TBDMM comprises five maturity levels that are coordinated by the temporality levels that were discussed in the previous section. The names of the levels are: Atemporal, Pre-Temporal, Partly Temporal, Predominantly Temporal, and Temporal. At each level, the framework evaluates an organization’s maturity against four areas: the data/knowledge from which insights are gained, the IT solutions used for analytics, the functionalities offered by these solutions, and the sustainable development context. Such a four-tier structure reflects the most significant points where an organization’s preparedness to profit from temporal big data analytics is manifested. The numbering of the maturity levels starts with 0 to point out that, at the beginning, an organization does not gain insights from big data nor from temporal data/knowledge. The details of the maturity levels are provided below. The TBDMM model is composed of five levels in order to show the process of change in an organization in an adequately precise manner. Too few levels—e.g., three or four—would fail to capture all of the necessary features and characteristics of the various phases in the process of adopting temporal big data analytics. On the other hand, too many levels—e.g., more than five—would result in the dispersion of detail. The rationale that underlies using exactly five levels is to show the key trends in the path to an organization’s full adoption of temporal big data.
Level 0 (Atemporal): as highlighted above, at Level 0 the data and knowledge that are used for analytics are atemporal in nature. These comprise multidimensional data and static knowledge (as defined in the previous section). Of course, in the OLAP model, a temporal dimension is included; however, at this maturity level, an organization does not make any temporal inferences with such data. What is more, at this level, an organization has no ability to make use of big data. The IT solutions that are enacted at Level 0 cover mainly a data warehouse, a BI system, and a knowledge base system. These allow various functions to be incorporated into an organization’s functions, including performance monitoring, trend analysis, reporting, comparative analysis, benchmarking, and decision support with the use of static rules. Data warehouses and BI systems might not be classified as temporal, because, to date, questions on processes representation, persistence representation, temporal operators in queries, and temporal relations analysis have not been successfully solved. Trend analysis involves a similar picture. Although time series are time-stamped, they do not allow for temporal reasoning. They only record data in predefined time intervals. At Level 0, the organization is able to perform daily reporting from structured data and historical analyses on structured data, and may use some intelligent decision support for daily operations. However, these are only day-to-day insights, and do not provide the organization with the possibility to mine client data, to perform sentiment analysis, or to predict the decisions of an organization’s market competitors. Such basic business analytics on structured data have very little potential to support a sustainable competitive advantage. At this level, any activities that aim to gain such an advantage are not supported properly, and managers mainly rely on their own beliefs to make decisions. At Level 0, sustainability issues are addressed in the organization in an ad-hoc manner. Processes for sustainability support are missing. The same concerns change management. A stakeholder network does not exist; stakeholders (e.g., suppliers and retailers) are selected ad-hoc on a financial basis only, with price as the main factor. Learning and communication issues are not perceived by senior staff to be important, and are not managed. Stakeholder management—if it exists—is performed with simple tools only.
Level 1 (Pre-Temporal): with respect to data/knowledge, an organization that is classified as being at this level makes use of similar structures to those that are listed in Level 0, but has begun making limited use of unstructured data sources (e.g., texts). The knowledge that is gained can now be said to be static or sequential. Additional solutions that are used by the organization to process the data/knowledge sources—apart from the solutions that are used at Level 0—also now include intelligent dashboards and sequential knowledge base systems. These increased abilities lead to the following functionalities becoming available: predictive analytics, advanced statistics, data mining on structured data, and text mining. The possibility to structure knowledge fragments qualitatively with temporal relations, such as “earlier” or “later”, is now available. With the data/knowledge, IT solutions, and IT functionalities that are implemented at Level 1, an organization may gain some deeper insights into its customers by analyzing, e.g., customer relationships management (CRM) data. This provides an organization with, for example, profiles of clients, but they are based only on structured data. An organization is not able to utilize knowledge on clients’ opinions or expectations. At this level, it is also possible to predict changes in the market environment, and consumers’ and competitors’ behavior. Decision support can be based on information about how the knowledge base changes with time. However, this support only reveals the directions of changes and the possible causes and effects of them. Such a level of analytics may give an organization a temporal competitive advantage; however, in the long run, it is not sufficient to maintain a sustainable advantage over competitors. At Level 1, sustainability management is supported by the planning of processes and activities as well as by predictions. Change management uses structured processes, predictions, event processing, and time-series analytics; however, it is still mostly reactive. The organization begins to establish a stakeholder network based on collaboration and BI and DM (Data Mining) insights. Learning occurs on an individual level. The organization may begin efforts to reduce environmental impacts.
Level 2 (Partly Temporal): at this maturity level, data/knowledge may partially be obtained from big data sources. Hence, data sequences, time-stamped data sequences, and time-stamped knowledge are in use. An organization gains insights from these kinds of data/knowledge by implementing business optimization software, time-stamped knowledge systems, and data mining systems. These IT solutions offer the following functionalities: embedded analytics, optimization, scheduling, pattern analysis, advanced data mining, and temporal descriptive reasoning rules. This kind of temporal rule is indispensable for describing the evolution of knowledge and knowledge sources in a reasoning system. At this level, through time-series analytics and business optimization software, it is possible to optimize business processes and market operations. Also possible is a temporal analysis of knowledge on the business environment, which provides an organization with the potential to predict changes in market conditions. Client data can be analyzed in an advanced manner (e.g., market basket analysis and natural groups based on demographic features and former buying decisions); however, these analyses do not contain the time component and are predominantly static. On the other hand, at this partly temporal level of maturity, organizations may implement some elements of temporal reasoning for decision support, and thus obtain insights into changes in clients’ and competitors’ behavior. Also, at this level, basic big data analytics may be implemented; hence, unstructured or semi-structured information on market trends may be added to the analytical landscape. With this form of business analytics, organizations are able to gain a stronger and more durable competitive advantage than on the previous level; however, as they cannot detect real-time changes in big data, it is difficult to obtain a sustainable advantage or sustainable business models. However, sustainability issues are integrated into business operations with the use of advanced IT solutions. Using big data analytics on customer data, the organization will begin to work on enhancing its image concerning the environmental context. Change management is built into other processes, and stakeholders are selected on the basis of quality. The main stakeholder network is based on advanced and structured collaboration processes, while stakeholder management is focused on the sharing of benefits. Customers’ needs are analyzed using advanced DM and some big data analytics. Learning processes in an organization occur at both the individual and the team level. Processes are established to reduce environmental impacts.
Level 3 (Predominantly Temporal): at this level, the temporal dimension starts to dominate in the data/knowledge sources that an organization uses and in the processing of this data/knowledge. Apart from the data sources that are apparent at Level 2, an organization uses temporal big data from sensors and clickstreams. In addition, unstructured knowledge and data, such as legal texts, are brought together and used for analytics. This is possible with Hadoop (and presumably alternative big data tools, such as Spark) and partly temporal knowledge base (KB) systems; that is, KB systems within which only the structured knowledge is temporal, while the unstructured data is not. Text mining and web mining tools are also being taken advantage of. Such IT solutions offer functionalities concerning customer behavior analysis, personalized recommendations, market trends discovery, strategic analysis, temporal query processing, and temporal reasoning on the structured part of the knowledge. In the context of a sustainable competitive advantage or sustainable business models, the predominantly temporal level provides organizations with more knowledge on market conditions and on the competitive environment. Organizations will start to obtain insights from real-time data flow; e.g., clickstreams are analyzed. Also, unstructured knowledge from opinion portals is used; however, organizations cannot track its evolution. Additionally, the knowledge base that is implemented in an organization is temporal. Temporal knowledge representation has many advantages with respect to environmental analysis. Some of these advantages are as follows: the representation of changes, their scope, and the resulting interactions among, e.g., market features; the representation of both discrete and continuous changes; and the representation of changes as processes with causal relationships that are explicitly defined. Temporal knowledge base systems collect experiences concerning the domain being depicted, and thus trace a domain’s evolution and are able to draw new conclusions. Temporal reasoning on temporal knowledge may be qualitative; hence, it may concern complex relationships, descriptive information, or information that is only partially specified. Together with the possibility to model the persistence of notions, it is possible to encode in a temporal system the so-called erudite knowledge of experts. Such rich representation and reasoning possibilities provide organizations with valuable dynamic insights into the market and competitive environment situations. An organization may react to new challenges more quickly and accurately. At this level of maturity, big data analytics may also be implemented, providing broader predictive possibilities because of the intensive use of unstructured data. Decision support systems have a clear time component; e.g., when to bring a new product or service to the market. The competitive advantage of the organization is, therefore, becoming sustainable. Sustainability issues drive the business. The organization turns its attention to advanced and timely analyses of its customers. Sustainability and customer management are supported by temporal knowledge analytics and reasoning. Stakeholders are selected with respect to environmental concerns. The stakeholder network is built upon strong collaboration, consultation, and crowdsourcing. At the same time, stakeholder management is focused on stakeholder engagement. Innovations and creativity are fostered and supported by dynamic management. Communication and knowledge sharing are strongly promoted inside and outside the organization.
Level 4 (Temporal): as the level name suggests, an organization uses temporal big data and temporal knowledge in a mature way. Temporal big data maturity means making use of, e.g., social data; additionally, structured and unstructured temporal knowledge is now taken into account. An organization puts into practice such IT solutions as big data analytics toolkits, temporal knowledge bases, and multiagent systems that obtain social data. The functionalities offered by these IT solutions might include, inter alia, text and opinion mining, sentiment analysis, the discovery of customer usage patterns, a holistic analysis of clients, qualitative and quantitative temporal reasoning, and the representation and analysis of beliefs. At the temporal level, an organization fully incorporates big data in its business analytics, and pays special attention to social media data and real-time information on customers’ opinions. This can be easily added to the temporal knowledge base system even though the real-time big data lack structure. The reach of the representation of data, information, and knowledge from the competitive environment enables advanced temporal analytics, and temporal reasoning, in every area of management. Through real-time insights into the competitive environment, through the early detection of customers’ attitudes and expectations, and through temporal reasoning about the market’s evolution and competitors’ intentions, an organization is able to obtain the advantage of being the first to act on an issue, which may be easily transformed into a sustainable competitive advantage based on a sustainable business model. At the highest maturity level, sustainability is treated and understood as a strategic key concept. The organization advocates for continuous change and improvements. Innovative ideas are fostered and supported by unstructured big data analytics and by the use of the temporal reasoning system. An organization-wide learning environment is established. The stakeholder network is based on creative collaboration, trust, and on knowledge sharing. Hence, stakeholders actively participate in the organization’s life and decision-making processes. Temporal big data analytics is used to explore the competitive environment and to support innovations and creativity. Learning and change management are continuously improved. Sustainability and environmental issues are built into the organization’s strategy.
An illustration of the TBDMM model is presented in Figure 2.
The proposed framework extends the previous maturity models for big data adoption by suggesting that the time factor is to be taken as the primary factor in developing advanced business analytics that are focused on a sustainable competitive advantage. The TBDMM responds precisely to the modern challenges faced by organizations: the need to analyze an unstructured real-time data flow, the need to respond to consumers’ expectations that are expressed in social media discussions, the need to understand changes in competitors’ activities, and finally the need to incorporate the new insights into decision support systems.
4. Reception of the TBDMM
This section presents the results that were obtained from the survey conducted from April 2016 to October 2016. The survey has been aimed at identifying how organizations perform big data analytics (BDA), and hence how the proposed framework fits into their analytics needs. Specifically, the research questions were: what BDA activities are undertaken in the organizations under study, and do the solutions concerning data/knowledge, IT systems, and their functionalities that are incorporated in the new framework respond to these organizations’ analytical needs?
4.1. Research Methodology and Research Sample
The proposed temporal framework for big data has been presented to managers during personal, semi-structured, Computer-Assisted Personal Interviewing (CAPI) interviews. In total, 25 organizations were invited to participate in the research, and 15 of them agreed. Hence, interviews with employees from 15 organizations were done. Formally, the research consisted of a case-study approach with multiple cases. Specifically, the interviews were performed in a two-stage process. At the first stage, all the respondents who agreed to participate in the research were sent the interview questionnaire and given as much time as they needed to fill it in. Then, they returned the questionnaires. During the second stage, personal meetings with each respondent were arranged. During these meetings, the interviews were performed on the basis of the completed questionnaires. The respondents were free to add comments to each question; also, some of the questions were extended and made more precise during the interview. The interviews were recorded using a recording application on a computer, and, after completing all the interviews, they were listened to and transcribed. In this way, the collected data and information set consisted of three subsets: the original completed questionnaires, the recordings, and the transcripts.
In the interview questionnaire, 15 closed and open-ended questions were present. Each respondent’s particulars were covered by seven questions. The research questions referred to:
- the presence of temporal aspects in analysis and managerial decisions, and their significance;
- the maturity of the organization;
- the respondent’s understanding of the term “big data”;
- the importance of various business analytics types;
- the data/knowledge, IT solutions, and IT functionalities appropriate for BDA;
- the respondent’s assessment of their employees’ level of training in the context of BDA;
- the IT infrastructure and data quality in the organization; and
- the advantages of, and barriers to, BDA implementation.
The method of purposive sampling was used to select the research sample. Then, the sample was verified with the business activity of the organization, the number of staff members, the average annual turnover during the last three years, and the capital structure as independent variables. Also, such variables as the respondent’s position in the organization, the organization’s sector, and the period of market operation of the organization were used.
The group of organizations was composed of the following sub-groups: eight service organizations, one research and development (R&D) organization, four manufacturing organizations, one banking organization, and one commerce organization.
The research sample can also be divided into the sub-group of medium or large organizations (eight indications), and the sub-group of small organizations (seven indications). No organizations fell into the micro-organization sub-group. The next descriptive feature concerns the financial capital of the organizations under study. Ten organizations were financed with national capital, three with foreign capital, and two with mixed capital.
Taking into consideration the sector of operation, the research sample can be divided into the sub-group of ICT (Information and Communication Technology) production and ICT service/support (three indications), the sub-group of the professional, scientific, and technical sector (four indications), the sub-group of the financial sector (one indication) and the sub-group of other sectors (seven distinct indications).
The interviewed respondents were owners or management board members (eight persons), ICT managers/specialists (two persons), or persons that performed other functions in their organizations, such as technology department managers, advanced analytics managers, SEO (Search Engine Optimization) specialists, and risk assessment managers. The details of the backgrounds of the companies are given in Table A2 in Appendix B.
The research focused on the analytics needs of organizations concerning data/knowledge, IT solutions, and their functionalities. Due to the qualitative nature of the research, it was difficult to precisely define the model’s reception indicators. Hence, attention has been paid to the question of whether respondents recognize the need to use solutions that are incorporated into the new temporal maturity framework (TBDMM).
4.2. Selected Survey Findings
4.2.1. Managers’ Understanding of Temporal Big Data
The first two important questions of the survey concerned managers’ understanding of big data, and the basic assumption of the TBDMM; namely, its explicit time dimension. First, respondents were asked to define the meaning of the “big data” notion. For almost all of the managers (14 persons), big data meant the flow and processing of huge amounts of data that is constantly changing, dispersed, and only loosely coupled. Five persons pointed out difficulties in the processing of such data, in using standard analytical methods, and in searching for dependencies among the data. These people understand big data to be vast datasets on which classical processing and storing methods are ineffective. Also, five persons linked the big data term with such notions as dynamics and variability. Similarly, five persons linked big data with its sources of origin: the internet, social media, cookies, web usage mining, the Internet of Things (IoT), and Google. Two managers pointed out big data’s lack of structure and its irregular flows. Other remarks concerning the big data term were as follows:
- “people from organizations having no advanced information technology solutions do not know what they mean while using the big data notion”;
- “big data does not exist, we focus on the analysis of a dataset’s portion”;
- “big data means creating and validating models based on machine learning tools, and using these models on complete datasets”;
- “linked heterogeneous datasets owned by various organizations”; and
- Hadoop, Spark, Cassandra, HBase, and NoSQL.
To verify the time assumption of the TBDMM, respondents were asked to determine how important the time factor is in managerial analysis and decision-making. For 11 of them, time is important, and for 4 of them it is very important. Hence, all of the interviewed managers recognize the temporality of business analytics and decisions. This means that the assumption that the time factor is the key indicator of subsequent maturity levels in the presented framework has been fully justified.
4.2.2. The Data/Knowledge Aspect in the TBDMM
The next area of the survey concerned the data/knowledge that is used by organizations, and the data/knowledge that should be used for advanced business analytics. The majority of the studied organizations (10 indications) does not use big data to gain valuable insights. Five managers indicated the use of customer data, three of them indicated competitors’ data, two managers pointed out social media data, one person indicated suppliers’ data, and one person indicated other stakeholders’ data. As for the quality of data used in the organizations for advanced analytics, three managers assessed it as high quality data, nine persons assessed it as average quality data, two persons assessed it as rather poor quality data, and one person declared that big data is not used for analytics, as there is no need to do it (Figure 3).
It should be noted here that, while only one person who assessed the data quality declared big data to have no use, there were as many as 10 indications in the area of the data being used concern big data (as not being used at all). At first sight this may seem contradictory; however, most probably, this contradiction is due to a poor understanding of the big data notion and its features as discussed in Section 4.2.1.
In the area of the survey concerning the data/knowledge that should be used for BDA, the respondents were presented with a closed set of examples, and asked to express their opinion on each with respect to the solution’s usability. They were also able to add their own remarks on this topic. Figure 4 illustrates how the interviewed managers responded.
As expressed by the respondents, they understood static knowledge to be, e.g., managerial knowledge, models, and expert rules. Almost all of the interviewed persons (14) recognized time-stamped knowledge (such as time-series knowledge) to be indispensable to BDA. However, they indicated that this factor is strictly linked with the industry, and is highly project-dependent. For the majority of managers (12), dynamic (changing) knowledge is essential for BDA. Attention should be also paid to the high position of unstructured data, including social network data. Hence, managers recognize the need to make use of temporal data, including big data. The big data notion was not present in the managers’ comments explicitly; however, as the respondents see the analytics potential of the web, social networks, sensors, click streams, etc., this indicates their interest in big data. Additionally, the respondents were asked to give their opinion on whether advanced BI and big data analytics should be unlimited across the organization, or conducted only in isolated fragments (departments) of the organization. For the majority of the managers (10 indications), such analytics should be limited to isolated fragments of the organization, and, according to five managers, it should be unlimited across the organization.
4.2.3. The IT Solutions Aspect in the TBDMM
The next part of the interview was devoted to the advanced analytic solutions in each organization, its IT infrastructure, and to the BDA solutions that, according to the respondents, should be implemented. The managers were asked about the types of business analytics solutions that are particularly important for their organization. The solutions that were most often indicated were dynamic analysis systems (12 indications) and reporting systems (11 indications). Also, real-time analytics systems were often chosen (nine indications). On the other end of the solutions spectrum, respondents pointed out scoring systems (one indication), risk analysis and decision support systems (three indications), and static analysis systems (understood as simple analytical systems with no time or dynamic aspects, four indications). Information on the respondents’ opinions is given in Figure 5.
Each manager was also asked to evaluate the suitability of their organization’s IT infrastructure for executing advanced business analytics. None of the managers assessed it as “very good” or “very bad”. Seven managers assessed the IT infrastructure’s suitability as “good”; four of them assessed it as “neither good nor bad”; and four of them assessed it as “bad”.
Subsequently, the respondents were asked about what IT solutions their organization should use while preparing BDA. Again, they were presented with a closed set of examples, and asked to express their opinion on each with respect to the solution’s usability for advanced business analytics, including big data analytics. As before, the respondents were able to add their own remarks during the interview. The results are presented in Figure 6.
Almost all of the respondents (13) recognized BI systems as an indispensable tool for BDA. Similarly, almost all of them (14) admitted that using Web mining tools for BDA is very important for organizations. Ten managers recognized that Hadoop and other big data tools (such as Spark) support organizations in performing BDA.
As in the case of analytics sources, among the IT solutions the respondents brought to the forefront were those linked with time and big data. The respondents recognize—in the context of advanced business analytics—the need for and utility of Web/text mining tools, big data analytics tools (Hadoop, Spark), and temporal tools, such as temporal knowledge base systems. This is consistent with previous remarks showing that time and big data need to be taken into consideration in managerial analysis and decisions.
4.2.4. The IT Functionalities Aspect in the TBDMM
The subsequent interview topics concerned the IT functionalities used for advanced business analytics in the studied organizations, and those that should be offered by IT systems if they are to be useful in BDA. The functionalities that were used in the surveyed organizations correspond to the data/knowledge pointed out in the earlier part of the interviews (Section 4.2.2.) and are as follows: customer data analytics (five indications), competitors’ data analytics (three indications), social media analytics (two indications), and suppliers’ data and other stakeholders’ data analytics (one indication each). As for the desired IT functionalities for BDA, the managers were presented again with a closed set of examples, and asked to express their opinion on each with respect to each solution’s usability. The functionalities that were found to be necessary are as follows:
- multidimensional analytics/BI reporting;
- data mining and advanced data mining;
- big data analytics; and
- temporal inferences (with time as a distinctive feature).
“Advanced data mining” for the interviewed managers meant data mining procedures that go beyond typical data mining (DM) activities (such as clustering, classification, and associations); e.g., temporal data mining. Figure 7 presents the summarized results.
Almost all of the respondents (14 indications) admitted that multidimensional analytics/BI reporting is of extreme importance as an IT functionality supporting advanced business analytics and BDA. The same number of respondents gave such an opinion on data mining. Twelve respondents stated that IT systems should also offer such functionality as event ordering in time (e.g., for events from the economic environment). The description of knowledge changes is an important IT functionality for 10 respondents. Fourteen respondents claimed that IT systems supporting advanced analytics and BDA should offer the functionality of temporal reasoning.
As in the previous areas of the interview, in the area of IT functionalities supporting advanced business analytics and BDA, the most acknowledged functionalities were solutions concerning data mining (including advanced data mining; e.g., temporal data mining) and functionalities concerning the temporal aspect of analytics (the description of changes in knowledge/data, causal analytics of event sequences, automatic temporal reasoning).
5. Discussion. The Sustainable Development Context
All of the respondents perceive an organization’s maturity, in the context of advanced business analytics, to be characterized by identifying business processes, elaborating organizational strategy, and identifying analytics needs. Almost all of them (13 indications) claimed that organizational maturity depends strongly on the completeness and coherence of the data used for analytics. More than a half of the interviewed respondents (eight indications) are convinced that organizations need an appropriate IT infrastructure to perform advanced business analytics and to cooperate with their customers, suppliers, and all other stakeholders. According to four respondents, the analytics maturity of an organization is manifested in employing people with high analytics competency and skills. As these results show, the understanding of an organization’s analytics maturity that the respondents have corresponds partially to the framework of the TBDMM that is proposed in this paper. This correspondence concerns the IT infrastructure, which is perceived as one of the maturity determinants, and at the same time is one of the three fundamental aspects (named IT solutions) in the TBDMM. On the other hand, however, the respondents did not consider big data processing and usage in organizations to be an important step towards analytics maturity (or they did not express this explicitly). This is probably due to the rather poor awareness among managers of big data’s core characteristics as discussed in Section 4.2.1.
The majority of respondents (nine indications) assessed the level of training for employees (their competencies and skills) in their organizations to draw up BDA as good or very good. The rest of the respondents assessed these competencies and skills as unsatisfactory, or even very bad (two indications). In the area of interpretation of the prepared advanced analytical outputs, 10 respondents assessed their employees’ level of training as good (9 indications) or very good (1 indication). However, for five respondents, this level was neither good nor bad (three indications) or “bad” (two indications), which means that this area is in need of special attention.
As for the benefits of big data analytics for organizations, the respondents most frequently pointed to the reliability of insights, allowing for: better decisions, a faster reaction to changes, better quality conclusions, an effective impact on the market, and a faster detection of trends or fluctuations in consumers’ expectations (eight indications). Five respondents named such benefits as gaining detailed insights into market and consumer needs, and understanding clients’ motivations and behaviors, which leads to a sustainable competitive advantage. The optimization of business processes resulting in a profitability increase was recognized as a benefit of BDA by three respondents. Two respondents were convinced that BDA allows for the targeting and accessing of selected consumer groups with a tailored offer. Similarly, two respondents linked BDA with the potential of e-commerce in social media. Other BDA benefits that were pointed out are as follows:
- the possibility of creating new products and entering new markets;
- technology cost optimization;
- the possibility of using new technologies;
- the prediction of client insolvency risk, and a better understanding of global risks; and
- easier credit scoring.
The respondents—even if they may not be sure what the term “big data” in fact means (Section 4.2.1.)—are able to sense the most outstanding benefits of BDA. They properly linked BDA with a sustainable competitive advantage, gained through enhanced insights into consumers’ needs, opinions, and desires, that comes from (inter alia) social media and web analysis. This is in line with the IT functionalities aspect in the TBDMM, which encompasses, among other things, functionalities aimed at, e.g., text or web mining.
The respondents also spoke about barriers to the performance of big data analytics. The most often recognized barrier (10 indications) was a lack of qualified data scientists able to analyze and interpret big data. Five respondents pointed out financial barriers, high BDA implementation costs, and a lack of a big data strategy. Similarly, five respondents noticed no understanding or awareness of BDA among businesses. Four managers turned their attention to the low reliability, low quality, and randomness of big data. Three respondents recognized technological barriers. Other barriers to the successful performance of big data analytics that were pointed out by the respondents are as follows:
- the ROI (Return on Investment) is hard to estimate (two indications);
- data cleaning and storage issues (two indications);
- the economy is not mature enough to make use of big data insights;
- a lack of internal data access procedures;
- a lack of appropriate hardware; and
- communication and legal barriers.
The barriers to BDA implementation in organizations, as perceived by the respondents, most generally concern financial and educational questions. It may thus be assumed that organizations in which managers are aware of BDA’s potential benefits would more easily overcome such obstacles as a lack of a big data strategy or a lack of financial support. Once BDA is well-understood and perceived as indispensable in an organization, the proposed TBDMM may be a helpful tool for the successful implementation of BDA.
During the interviews, special attention was paid to the areas (data/knowledge, IT tools, and IT functionalities) that are included in the proposed TBDMM. Special attention was paid to the temporal dimension, but it was also interesting to check whether the elements on the lower levels of the proposed model were perceived as useful and needed.
Comparing the model presented in Figure 2 to the respondents’ answers, it can easily be seen that the managers used almost all of the notions and solutions that are included in all of the maturity levels of the proposed framework. Hence, this justifies the accommodation in the model of the structured, static solutions; i.e., the ones not designed for big data analytics. At the same time, it should be noted that, in the context of advanced business analytics (including big data analytics), the majority of answers concerned temporal solutions and unstructured data. In other words, the more mature (in the context of the effective use of big data analytics) is an organization, the more it is driven by temporal, unstructured sources of data/knowledge, temporal IT tools, and their temporal functionalities.
Summing up the respondents’ statements on their knowledge and needs concerning big data analytics, and comparing them to the proposed temporal maturity model, it may be stated that the model’s reception has been positive and its composition responds to the analytical scope of modern organizations. However, some general differences between industries could be noticed. The respondents from the IT and R&D sectors were the most aware of big data analytics’ potential, its benefits, and its implementation barriers. Also, the respondent from the only light industry manufacturer was among those managers who understood the notion of big data, and the possible value that may be obtained for an organization from BDA. On the other end of the spectrum, the respondents representing the sector of services had the most numerous problems with defining the big data notion, and with assessing BDA’s possible benefits. Surprisingly, one manager from a very large manufacturing organization declared that his organization uses only MS Excel for advanced analytics, and has no need to capture or analyze big data.
As mentioned earlier, the interviews were performed in 2016. This probably explains why the big data notion, and some of the notions linked to it, that are present in the new framework (e.g., unstructured big data analytics) were not understood properly by some of the respondents, especially the non-IT professionals [92]. Also, there were some concerns that were associated with the quality and reliability of the new data. Additionally, the respondents did not always see the direct link between advanced business analytics (including big data analytics) and a sustainable competitive advantage. It has also to be noted that some terms, e.g., “temporal knowledge base”, “sequential knowledge”, “temporal data mining”, and other temporally associated ones are obviously not widely known, nor understood. The interviewed managers are not an exception. Often, during the interviews, they asked for explanations, and then acknowledged the temporal solutions to be very useful for advanced business analytics in a dynamic competitive environment. Hence, it would be desirable to popularize knowledge on temporal analytics, temporal IT solutions, and their functionalities among managerial staff. It may be assumed that with such knowledge managers would be more willing to implement temporal analytics solutions, including those for big data. This will give organizations better insight into, and understanding of, the dynamic environment of business operations.
6. Concluding Remarks
The usability of big data analytics for gaining a sustainable competitive advantage and for establishing successful sustainable business models has been drawing researchers’ attention for several years [14,15,18,52,66,70]. Time is also widely accepted as an important aspect of business operations [13,16]. However, research on big data analytics in general, and on big data maturity models in particular, has not brought the temporal dimension to the forefront. The research is focused either on big data’s operational and strategic potential [19] or on big data implementation and processing based on well-established IT solutions [22,24,25,26].
Our study attempts to formulate a new conceptual framework for assessing an organization’s readiness to adopt big data. It argues that a time dimension is a critical driver in maturity models for big data adoption. The proposed framework consists of five maturity levels: atemporal, pre-temporal, partly temporal, predominantly temporal, and temporal. The maturity levels are used to evaluate the data/knowledge, IT solutions, functionalities offered by IT solutions, and sustainable development of organizations.
The proposed model was initially tested among 15 organizations. The survey that was conducted among respondents advocates that our framework extends the previous maturity models for big data adoption by suggesting that the time factor should be taken as the primary factor in the development of advanced analytics that are focused on the sustainable development of organizations. The proposed framework responds precisely to the modern challenges faced by organizations.
Our study makes several theoretical contributions to the relevant literature. First, big data adoption in organizations is a largely unexplored field of research. Therefore, the current study contributes to the emerging literature on assessing an organization’s readiness to adopt big data by investigating temporal big data maturity models. Second, the current study is one of the rare studies that proposes a conceptual framework for assessing an organization’s readiness to adopt big data based on the temporal dimension. This framework proposes a new perspective on the issue of assessing an organization’s readiness to adopt big data. It responds to the current challenges that come from an organization’s environment, such as the need to incorporate real-time big data analytics into decision support systems. Third, this study demonstrates how the proposed framework may be used to assess modern information sources in organizations. The interviews with managers that were discussed in this paper have proven that organizations are aware of the big data phenomenon and its analytics potential. However, they do need a tool—a kind of signpost—that will enable them to assess their organizations’ preparedness to perform big data analytics and to implement in a coordinated manner solutions that are aimed at improving these analyses. This conclusion is drawn from the barriers to the successful performance of big data analytics that were listed by the managers. During the interviews, they described, e.g., a lack of qualified staff, a lack of a big data analytics implementation strategy, and the randomness, poor quality, and incredibility of such data. Using a big data maturity model may help organizations to overcome these barriers.
Finally, the current findings provide empirical evidence that the design of a conceptual framework for assessing organizations’ readiness to adopt big data based on the temporal dimension may play an important role in their sustainable development. This framework offers guidance to managers who want to successfully incorporate temporal big data analytics into their organization’s business, competition, and sustainability strategies. It highlights the role of real-time big data analytics and temporal decision support systems as critical tools for building a sustainable competitive advantage and sustainable business models. The proposed framework provides a comprehensive means to be used by managers in their efforts to respond to market challenges.
Although our results provide important contributions to theory and practice in the big data field, we discuss some limitations to keep in mind when interpreting the results of this study, while also suggesting some potential opportunities for future research.
The proposed model needs further validation and testing. This should lead to the development of best practice and contingency guidelines for managers, researchers, and software engineers concerned with big data usage. By understanding the idea of the proposed framework, organizations should be better able to profit from big data analytics. It seems that the next step in exploring the phenomenon of temporal big data maturity models should be quantitative tests that cover a much greater number of organizations and that compare the results obtained from different domains.
Author Contributions
C.M.O. conceived the idea, designed the study’s outline, and proposed the interview questions; M.M.-K. and C.M.O. performed the literature review; M.M.-K. designed the TBDMM and conducted the interviews with managers; M.M.-K. analyzed the data from the interviews; and C.M.O. supervised the entire project, and reviewed and edited the manuscript.
Funding
This research received no external funding.
Conflicts of Interest
The authors declare no conflict of interest.
Appendix A

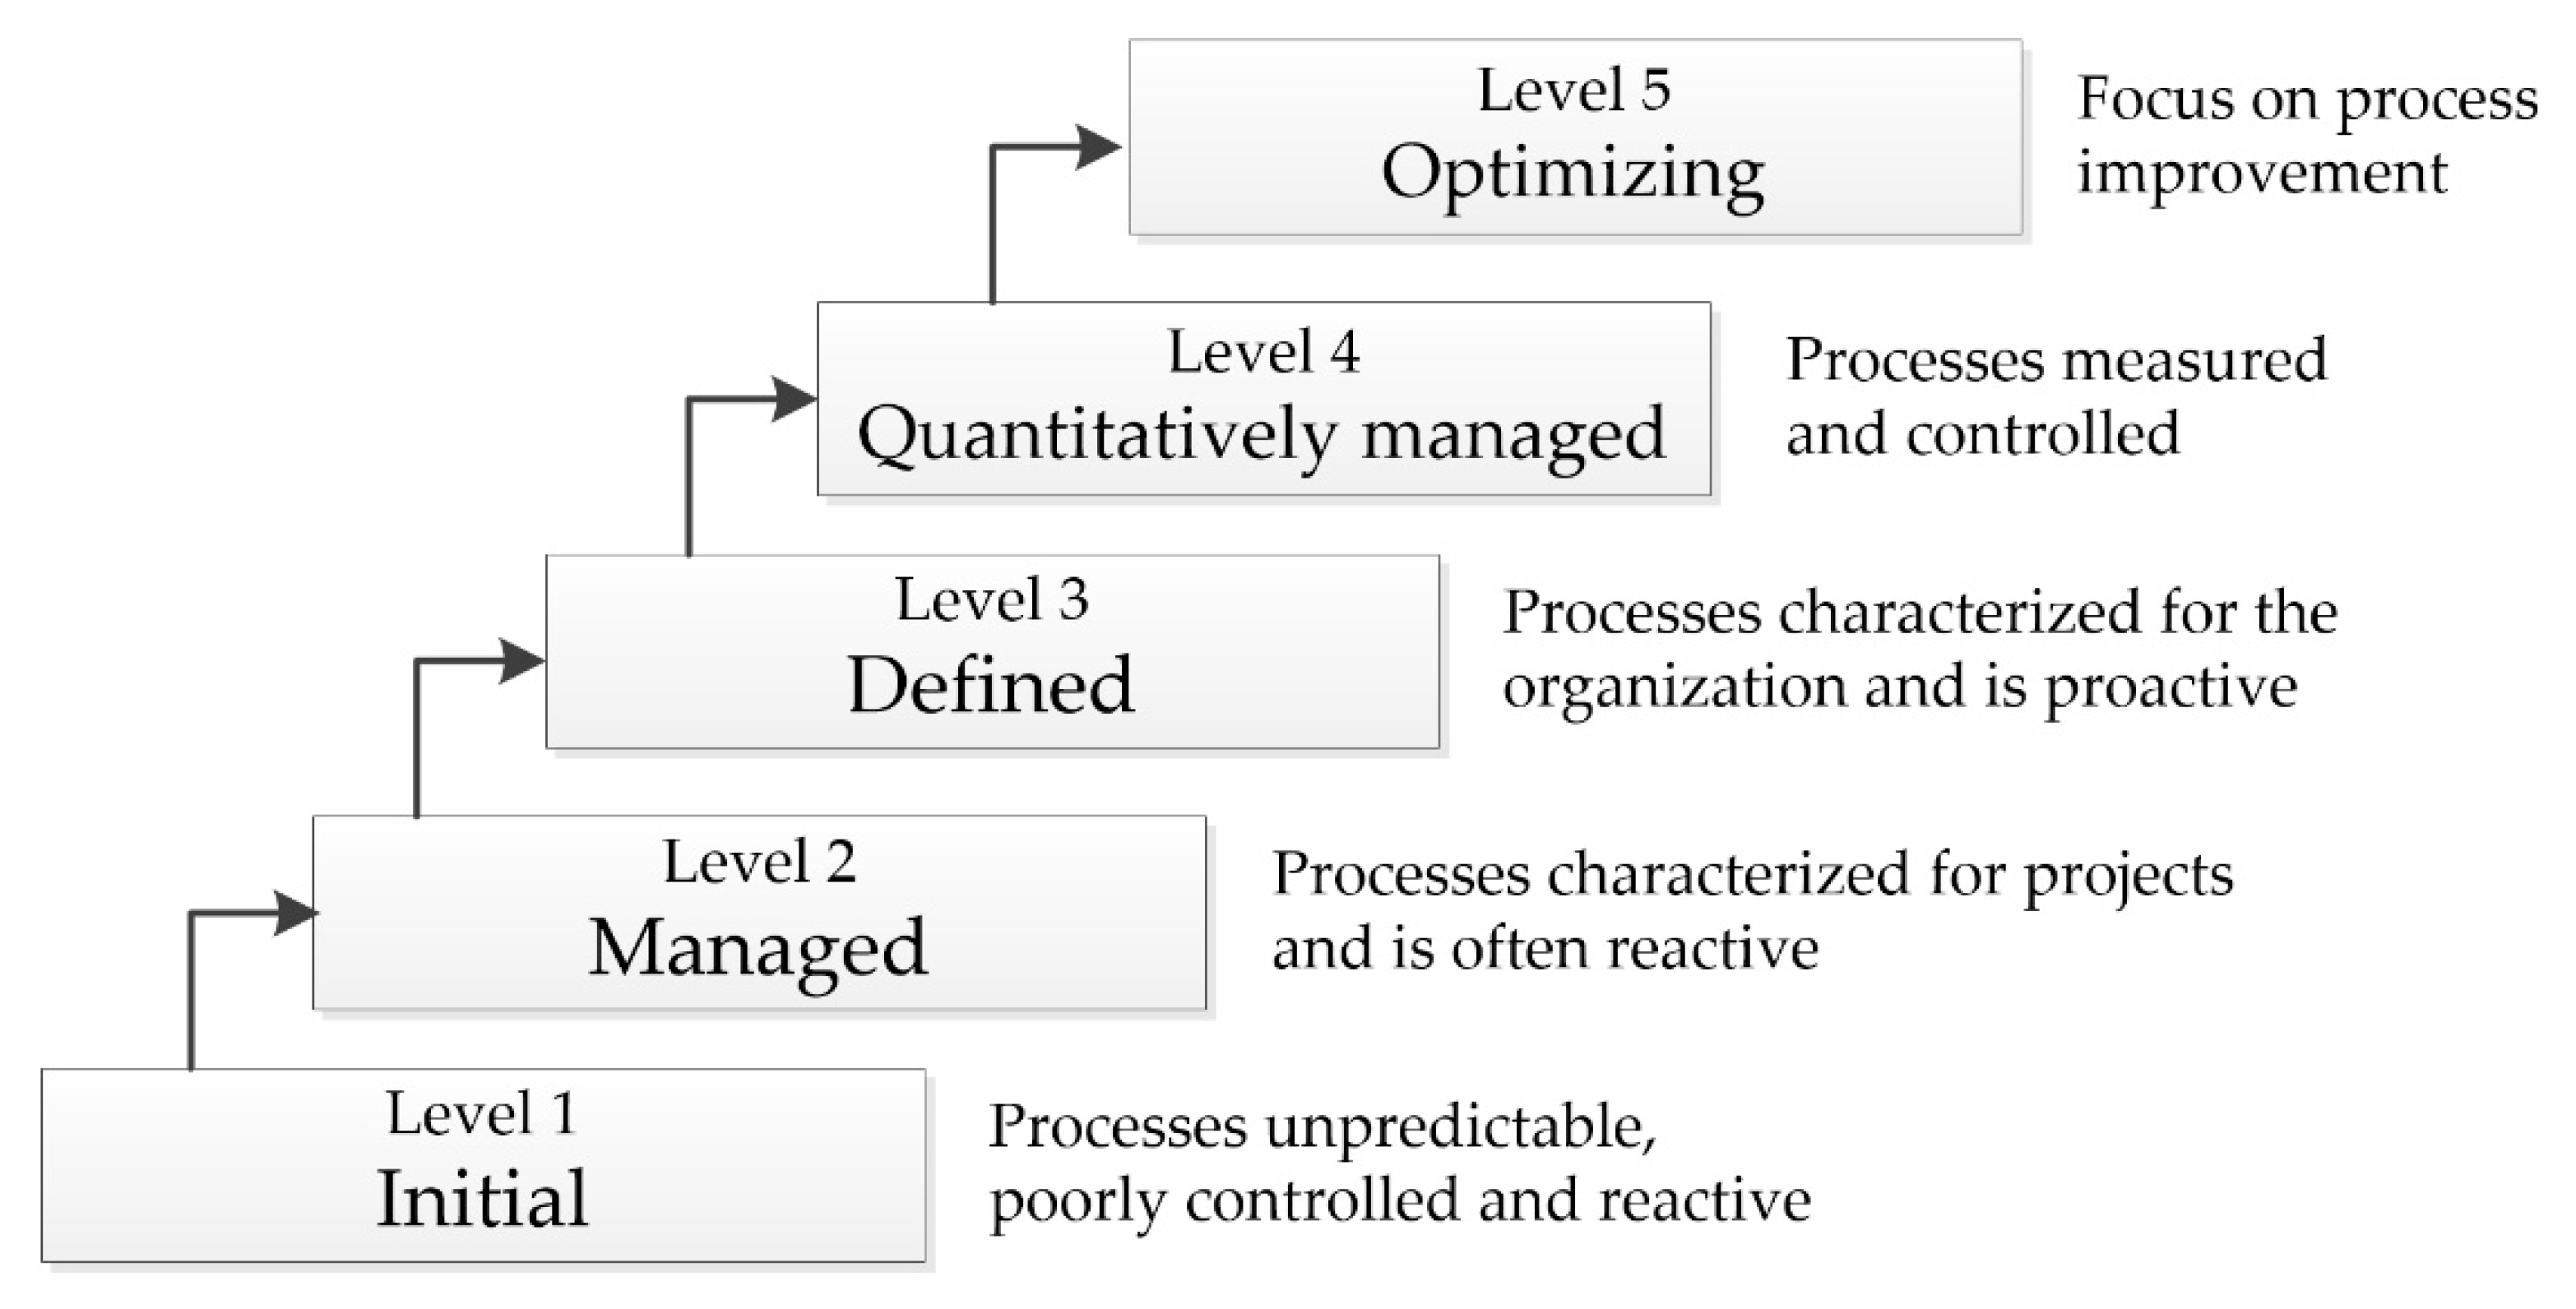
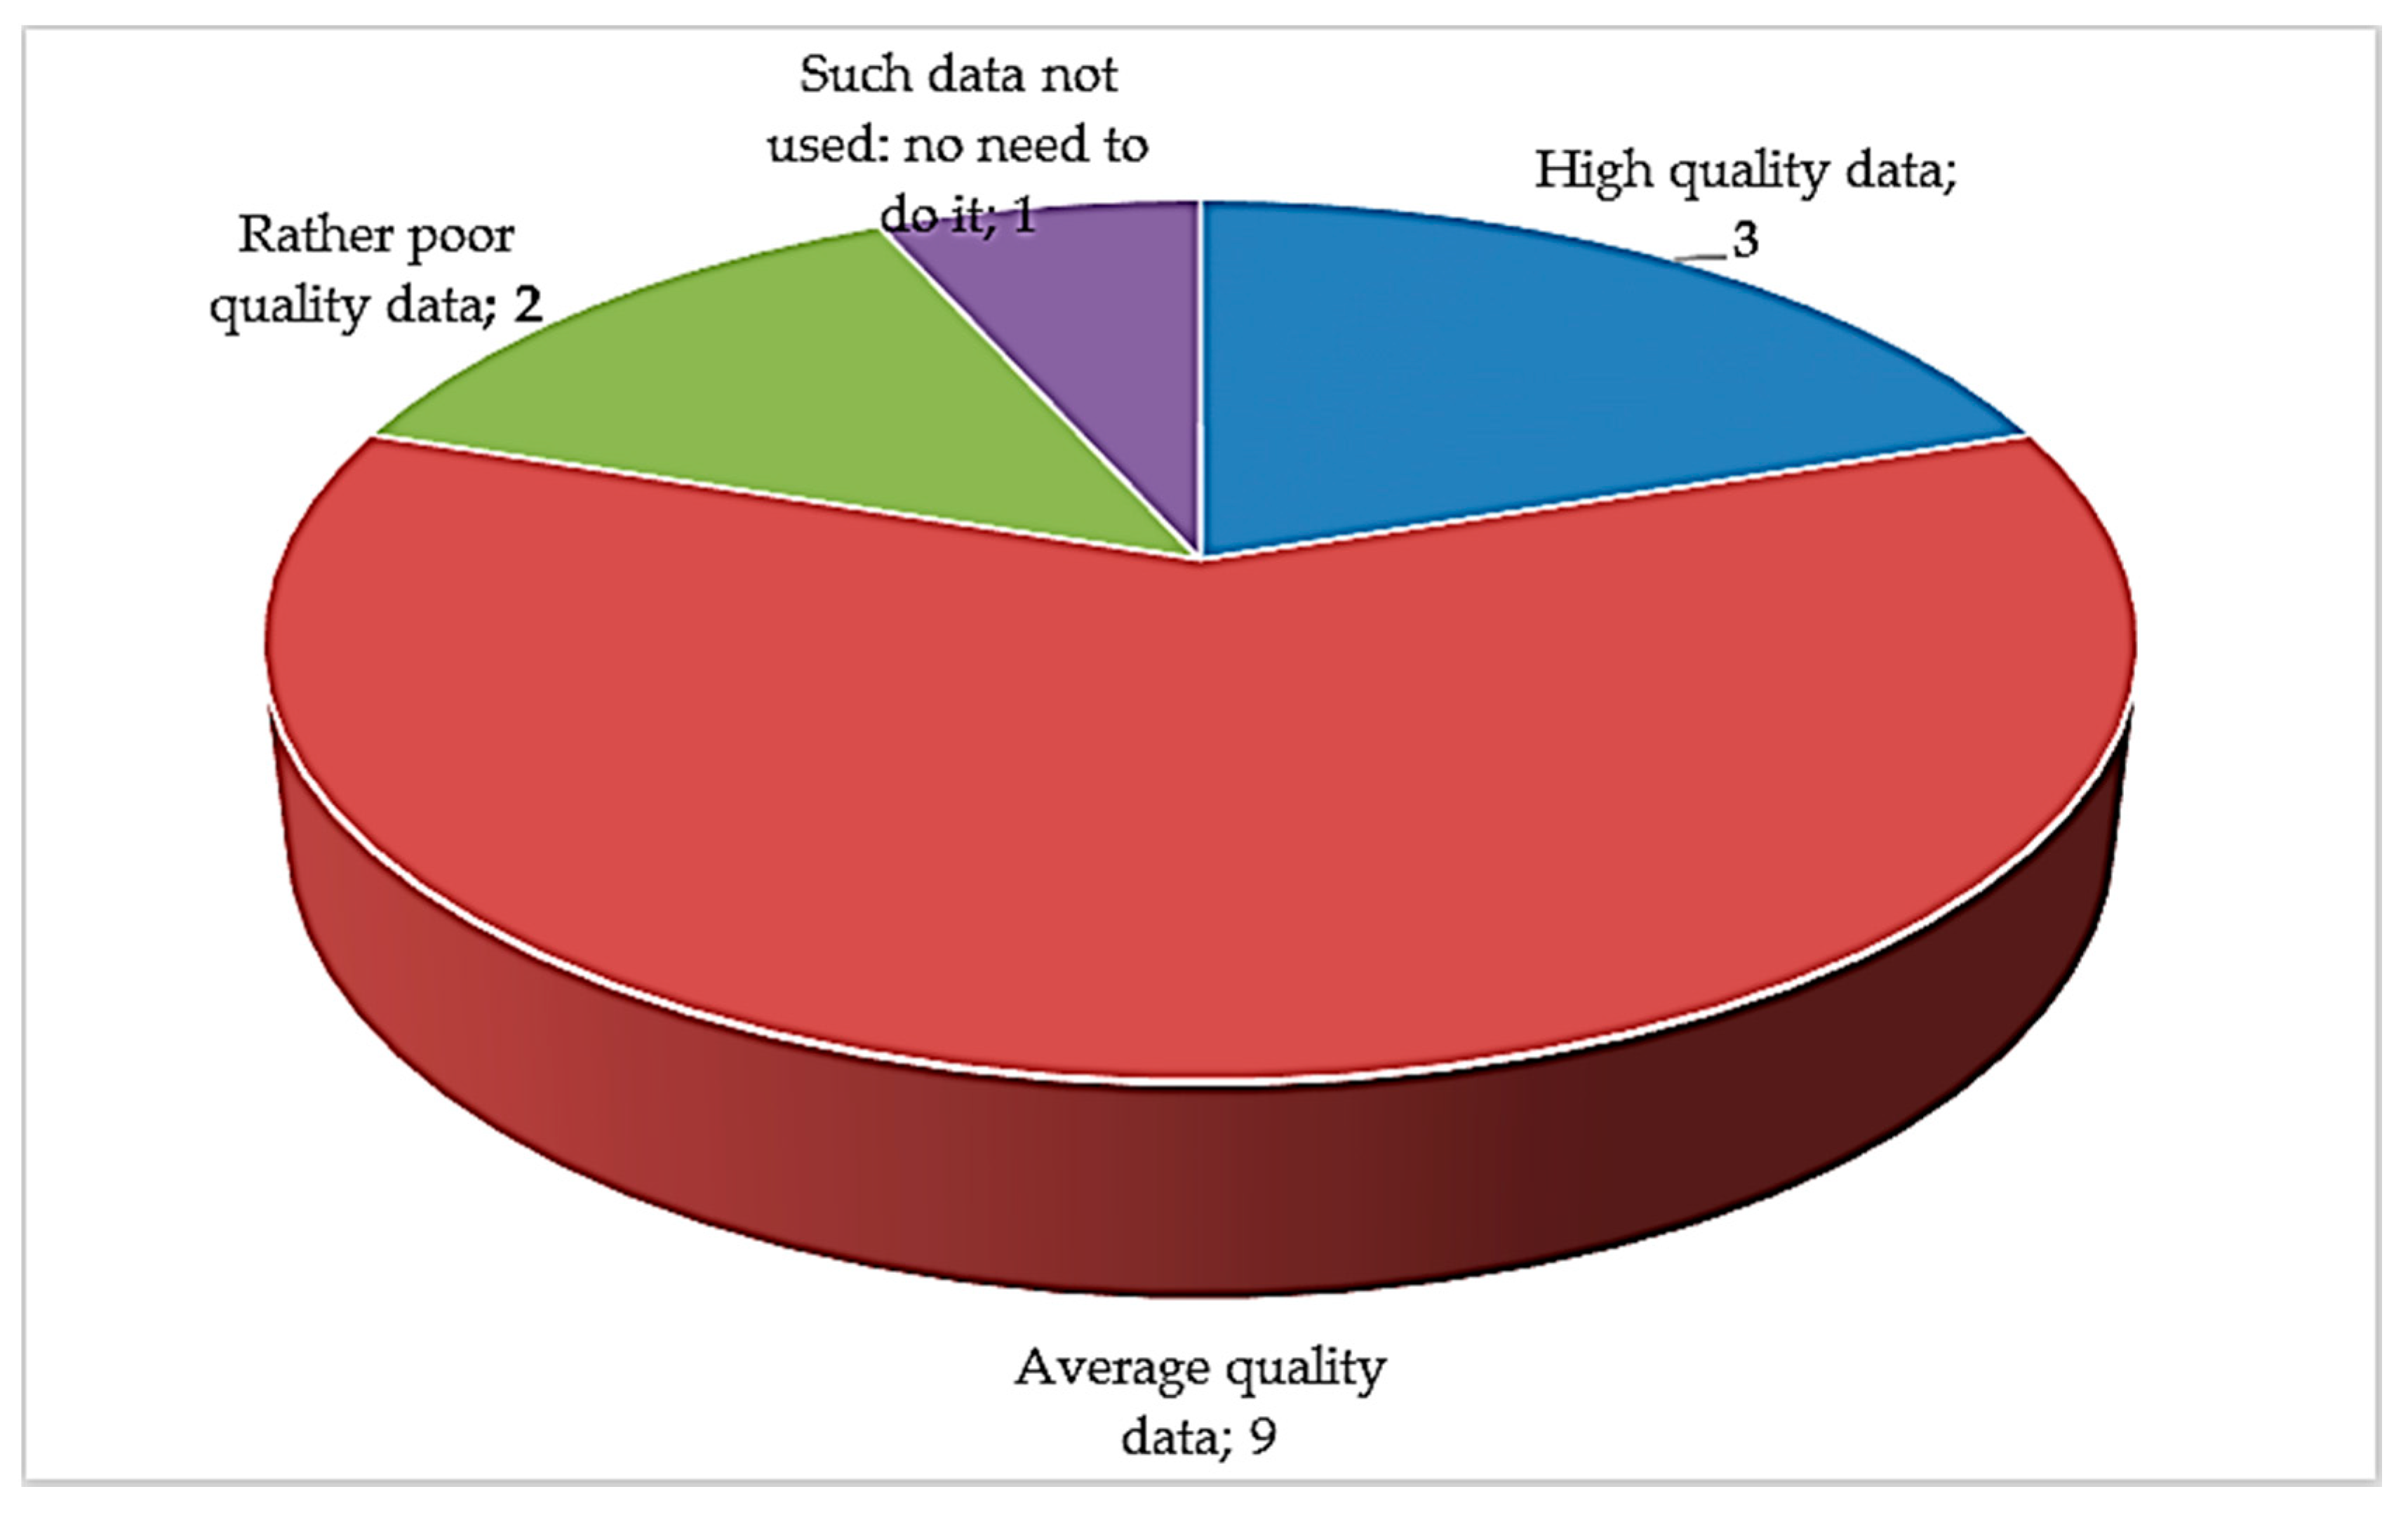
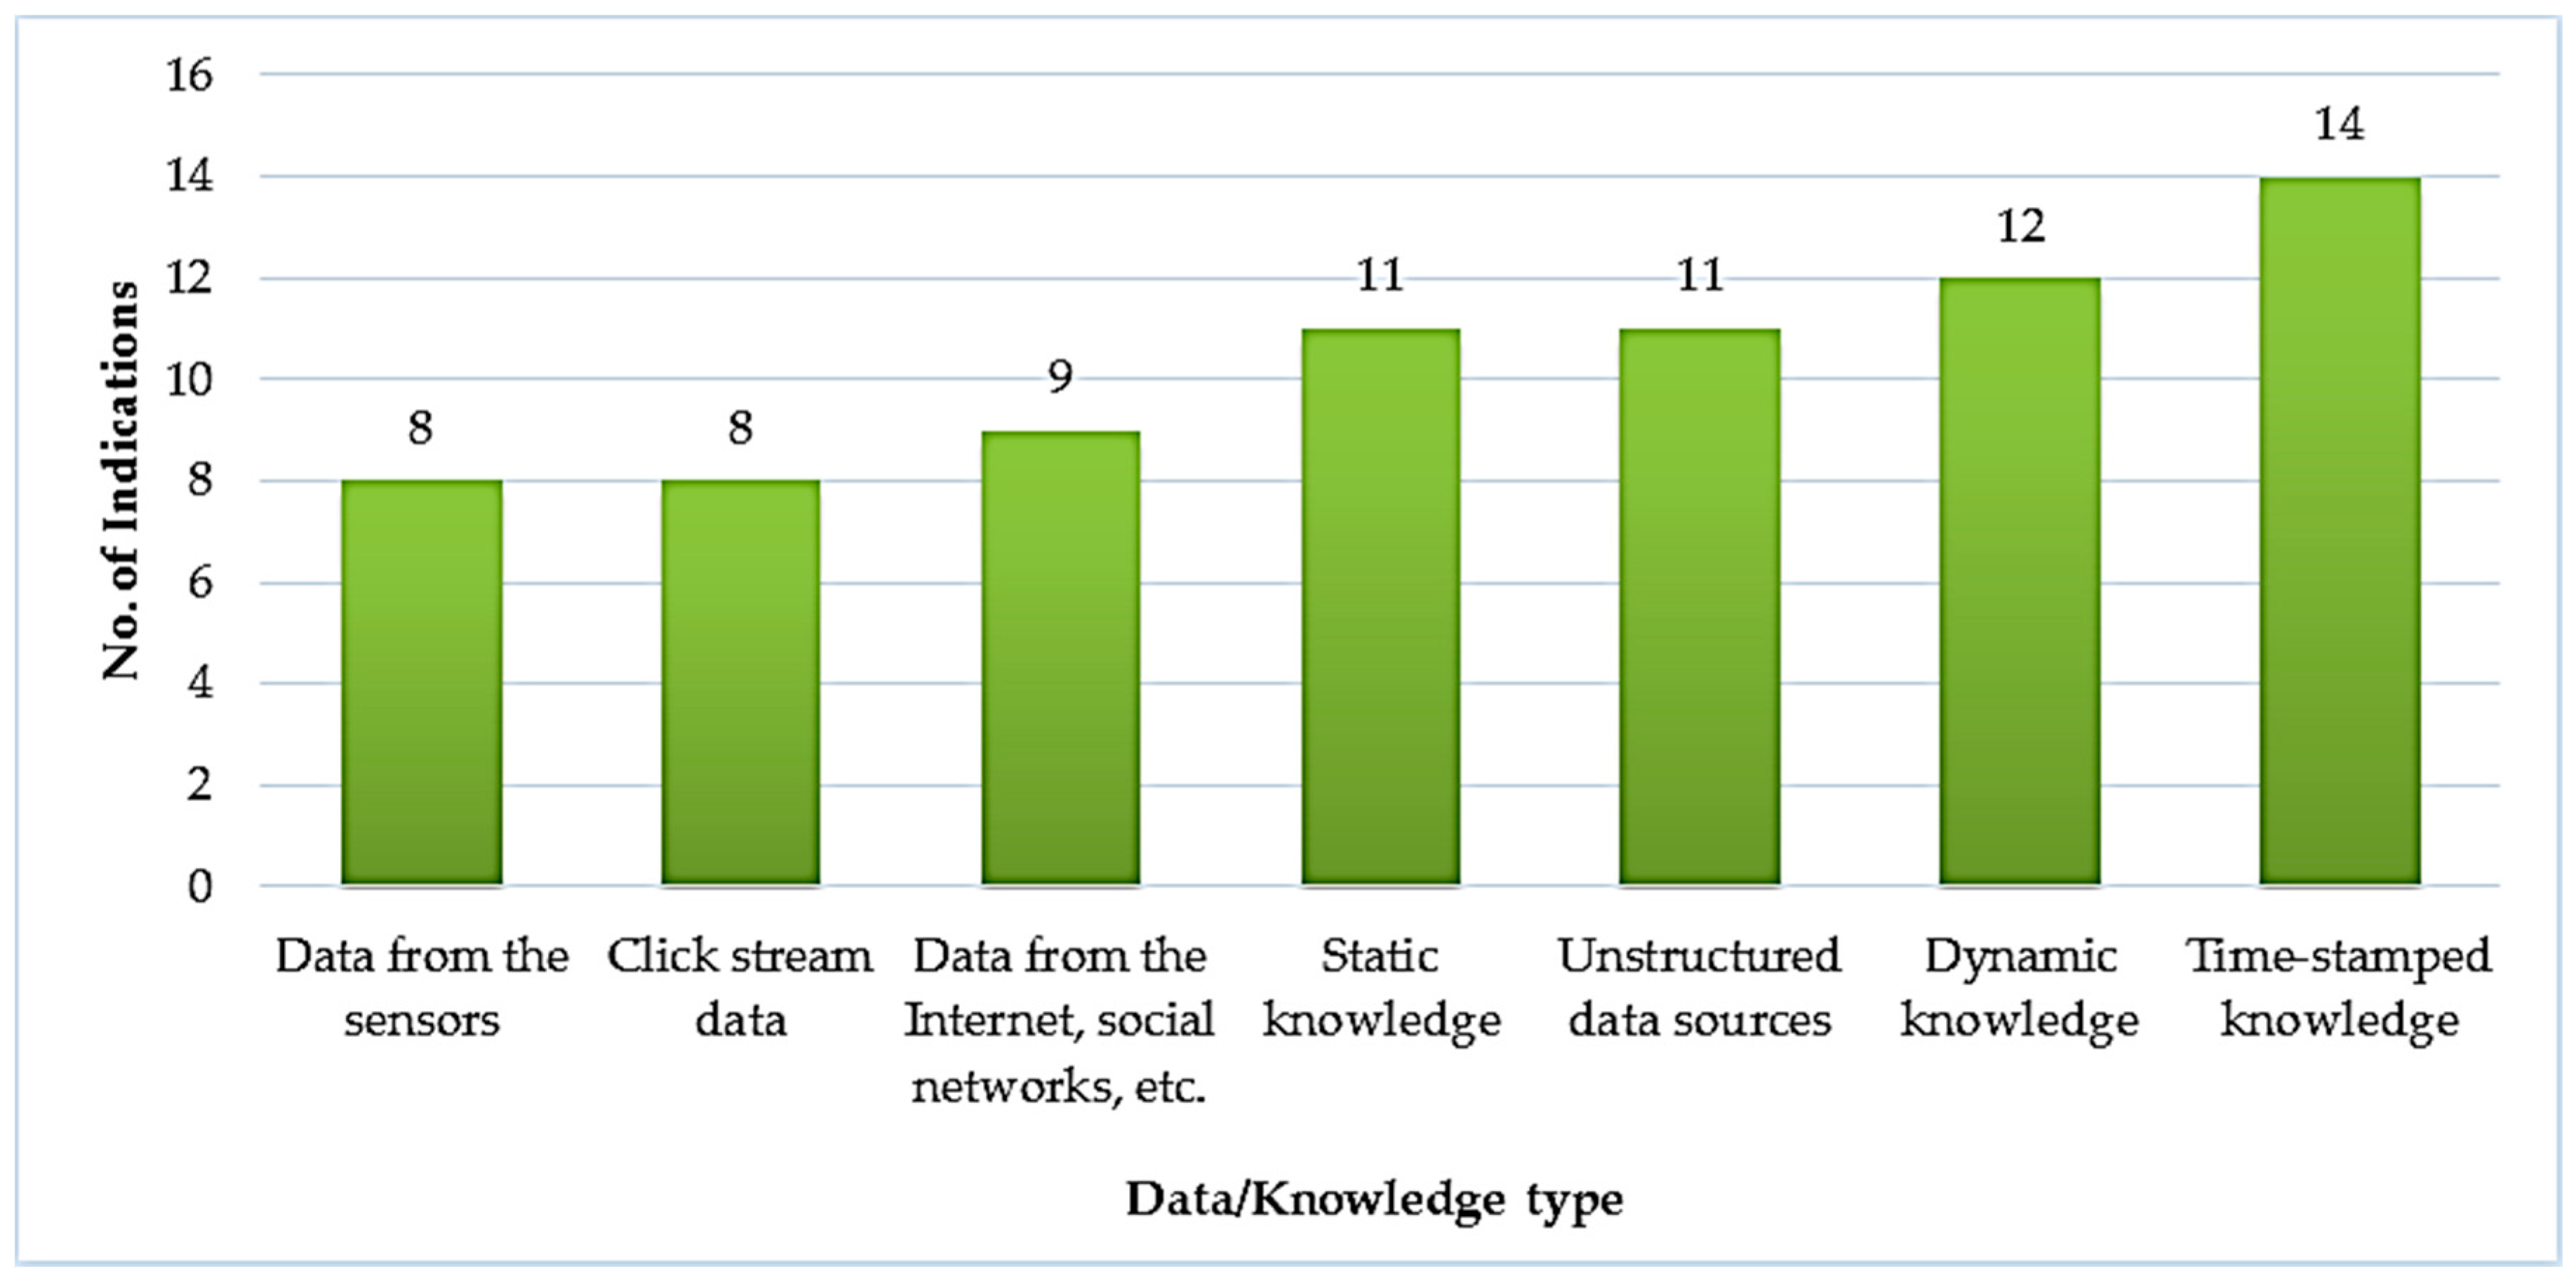
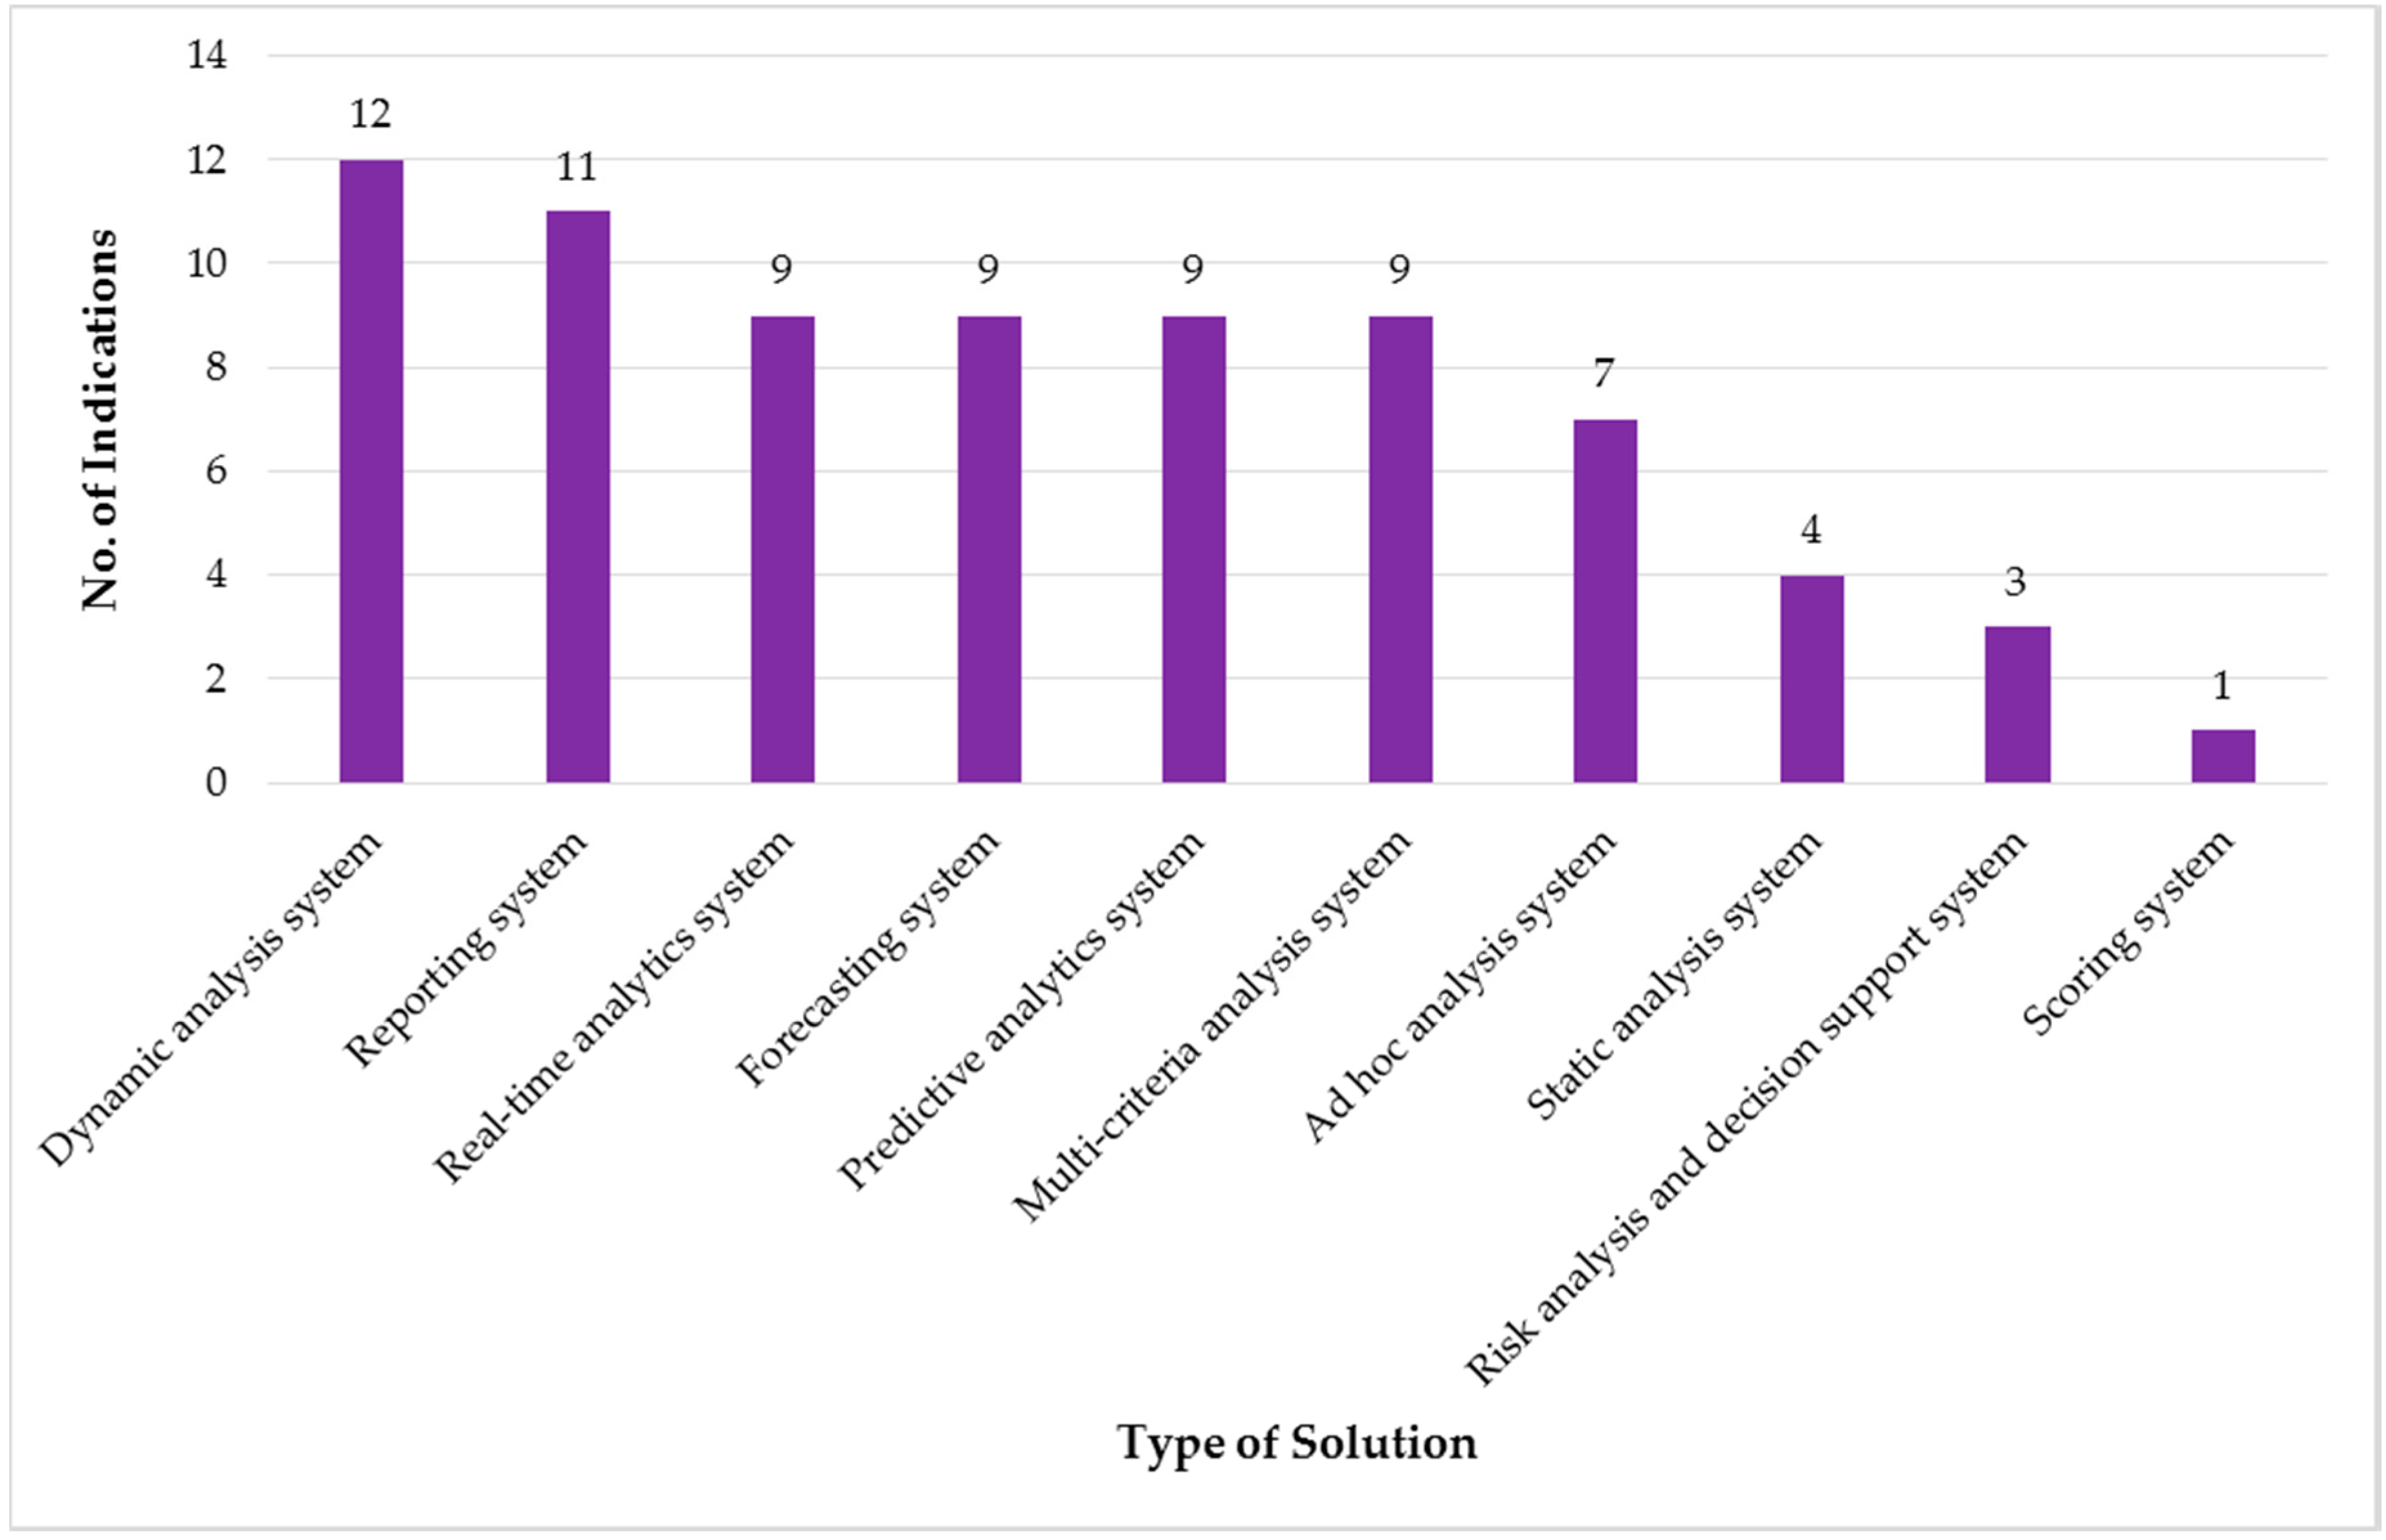
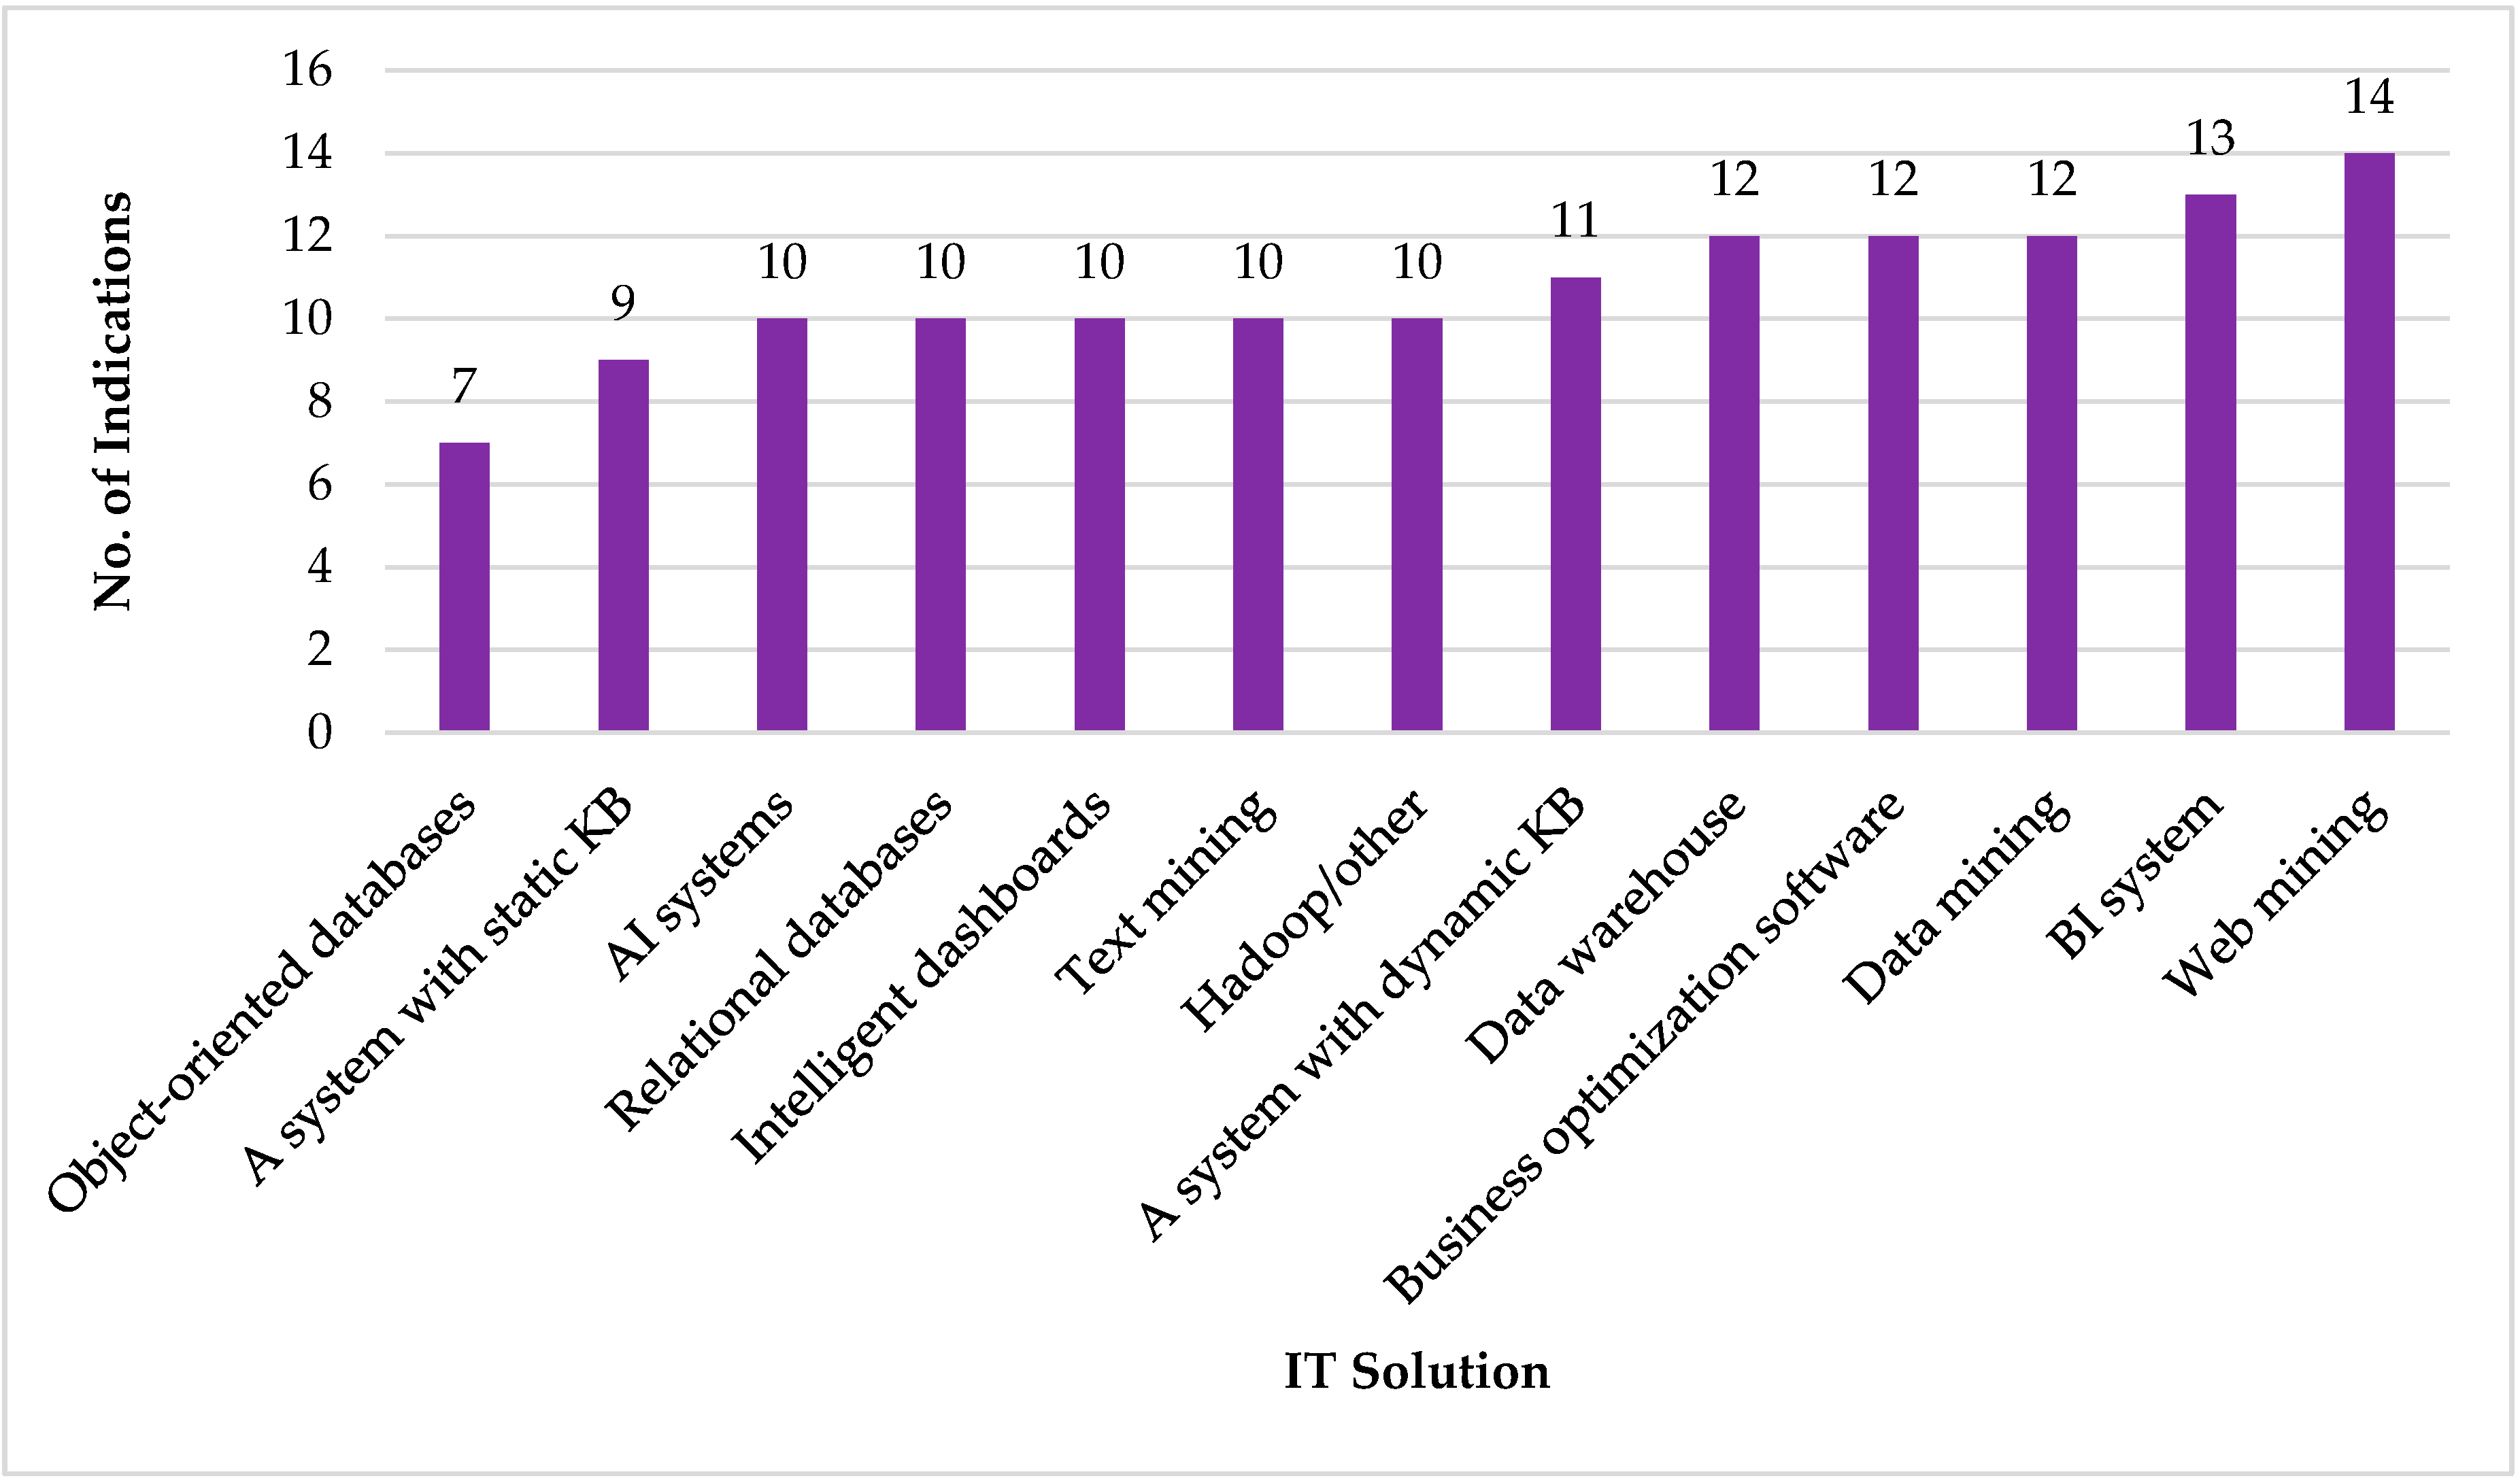
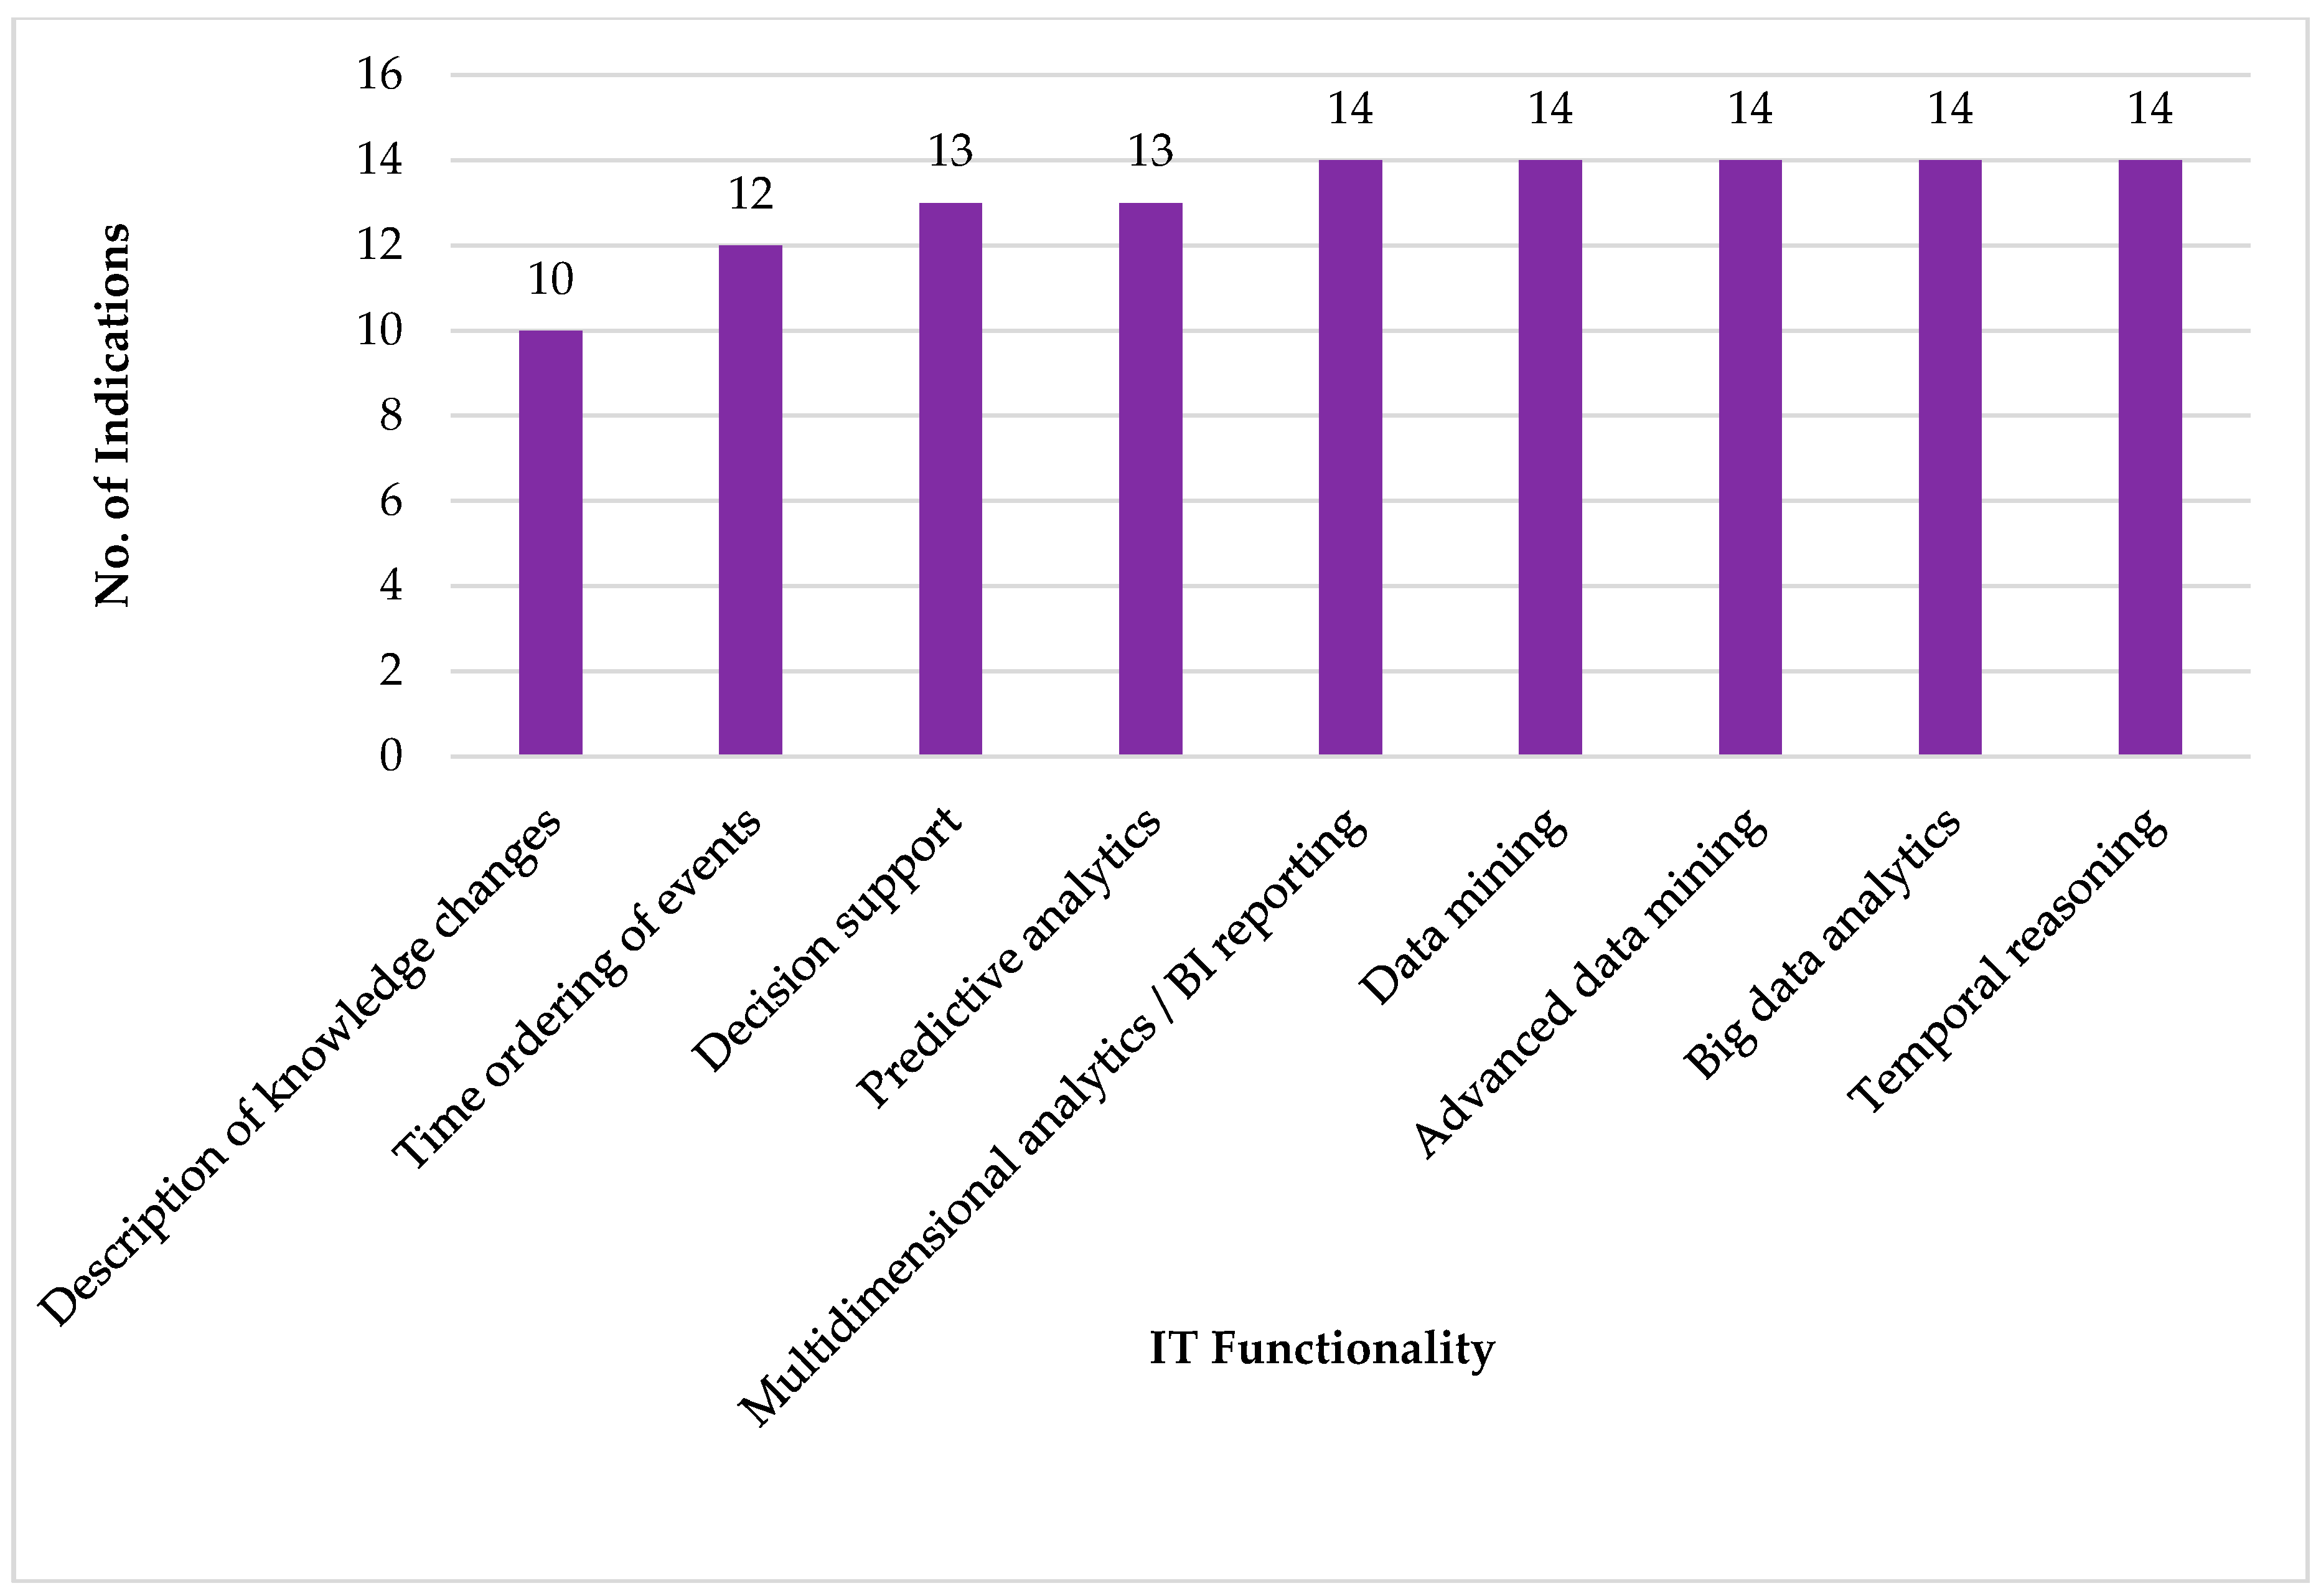
Table A1.
Various definitions of the term “big data”, listed in chronological order.
| Author(s) | Definition |
|---|---|
| Technological Approach | |
| [38] | “Data sets are generally quite large, taxing the capacities of main memory, local disk, and even remote disk. We call this the problem of big data. When data sets do not fit in the main memory (in core), or when they do not fit even on the local disk, the most common solution is to acquire more resources.” |
| [39] | The big data term “describes data sets that are growing exponentially and are too large, too raw or too unstructured for analysis using relational database techniques”. |
| [40] | “Big data involves the data storage, management, analysis, and visualization of very large and complex datasets.” |
| [36] | “Datasets whose size is beyond the ability of typical database software tools to capture, store, manage, and analyze.” |
| [41] | The big data term is “used to describe data sets so large, so complex or that require so rapid processing (…) that they become difficult or impossible to work with using standard database management or analytical tools.” |
| [42] | “Big data refers to datasets with sizes beyond the ability of common software tools to capture, curate, manage, and process the data within a specified elapsed time.” |
| [43] (p. 89) | “Big data (…) means that the organization’s need to handle, store, and analyze data (its volume, variety, velocity, variability, and complexity) exceeds its current capacity and has moved beyond the IT comfort zone.” |
| [44] | “Big data involves the data storage, management, analysis, and visualization of very large and complex datasets. It focuses on new data-management techniques that supersede traditional relational systems, and are better suited to the management of large volumes of social media data.” |
| [9] | “Big data consists of expansive collections of data (large volumes) that are updated quickly and frequently (high velocity) and that exhibit a huge range of different formats and content (wide variety).” |
| [45] | “The broad range of new and massive data types that have appeared over the last decade or so.” |
| [46] | “Data of a very large size, typically to the extent that its manipulation and management present significant logistical challenges.” |
| [47] | “Big data: the data-sets from heterogeneous and autonomous resources, with diversity in dimensions, complex and dynamic relationships, by size that is beyond the capacity of conventional processes or tools to effectively capture, store, manage, analyze, and exploit them.” |
| [48] | “Big data typically refers to the following types of data: (1) traditional enterprise data; (2) machine-generated/sensor data (e.g., weblogs, smart meters, manufacturing sensors, equipment logs); and (3) social data.” |
| [49] | “Big data is an emerging paradigm applied to datasets whose size is beyond the ability of commonly used software tools to capture, manage, and process the data within a tolerable elapsed time.” |
| [50] | “«Big data» means enormous volumes of data. The data can be divided as structured data and unstructured data. Various methods are applied to collect these data.” |
| Organizational approach | |
| [51] (p. 1) | “Consumers have unprecedented access to information and tools with which to consume information. Social media, mobile access, augmented reality and three-dimensional (3D) views of pictures and video have blurred the lines between our private and work personas and have fundamentally changed the way the consumer utilizes information.” |
| [7] | “Big data, like analytics before it, seeks to glean intelligence from data and translate that into business advantage. However, there are three key differences: Velocity, variety, volume.” |
| [52] | “Big data focuses on three main characteristics: the data itself, the analytics of the data, and presentation of the results of the analytics that allow the creation of business value in terms of new products or services.” |
| [8] | “Big data is a combination of volume, variety, velocity and veracity that creates an opportunity for organizations to gain sustainable competitive advantage in today’s digitized marketplace.” |
| [53] (p. 21) | “Companies today are overgrown with information, including what many categorize as big data. The jungle includes information about customers, competition, media and channel performance, locations, products, and transactions, to name just a few (…)” |
| [24] (p. xxi) | “(…) big data is about leveraging the unique and actionable insights gleaned about your customers, products, and operations to rewire your value creation processes, optimize your key business initiatives, and uncover new monetization opportunities.” |
| [54] | “A new attitude by businesses, non-profits, government agencies, and individuals that combining data from multiple sources could lead to better decisions.” |
| Mixed (tech-organizational) approach | |
| [55] | “Big data involves more than simply the ability to handle large volumes of data; instead, it represents a wide range of new analytical technologies and business possibilities. These new systems handle a wide variety of data, from sensor data to Web and social media data, improved analytical capabilities, operational business intelligence that improves business agility by enabling automated real-time actions and intraday decision making, faster hardware and cloud computing including on-demand software-as-a service. Supporting big data involves combining these technologies to enable new solutions that can bring significant benefits to the business.” |
| [56] | Big data is “associated with the new types of workloads and underlying technologies needed to solve business problems that could not be previously supported due to technology limitations, prohibitive cost or both.” |
| [6] | “Big data: high-volume, high-velocity, and/or high-variety information assets that require new forms of processing to enable enhanced decision making, insight discovery, and process optimization.” |
| [57] | “Big data: a cultural, technological, and scholarly phenomenon that rests on the interplay of (1) Technology: maximizing computation power and algorithmic accuracy to gather, analyze, link, and compare large datasets; (2) Analysis: drawing on large datasets to identify patterns in order to make economic, social, technical, and legal claims; (3) Mythology: the widespread belief that large datasets offer a higher form of intelligence and knowledge that can generate insights that were previously impossible, with the aura of truth, objectivity, and accuracy.” |
| [58] | “Big data is massively generated by uncountable online interactions between people, by human–systems transactions, and by sensor devices.” |
| [59] | “Big data is no subject to sampling, it is linked with building databases from electronic sources, with no intention of statistical inference.” |
| [5] | “Big data is high-volume, high-velocity and high-variety information assets that demand cost-effective, innovative forms of information processing for enhanced insight and decision making.” |
| [60] | “Big data is large-scale data with various sources and structures that cannot be processed by conventional methods and that is intended for organizational or societal problem solving.” |
| [61] | “Big data often represents miscellaneous records of the whereabouts of large and shifting online crowds. It is frequently agnostic, in the sense of being produced for generic purposes or purposes different from those sought by big data crunching. It is based on varying formats and modes of communication (e.g., text, image, and sound), raising severe problems of semiotic translation and meaning compatibility. Big data is commonly deployed to refer to large data volumes generated and made available on the Internet and the current digital media ecosystems.” |
Appendix B
Table A2.
The backgrounds of the companies that were selected for interviews.
| Interview No | Business Activity | No of Employees | Annual Turnover for the Last 3 years | Capital Structure | Respondent’s Position | Sector | Period of Existence on the Market |
|---|---|---|---|---|---|---|---|
| 1 | R&D | 50–249 | <EUR 50 million | National capital | Owner/Management Board | Professional, scientific, and technical | 6–10 years |
| 2 | Manufacturing | >250 | <EUR 50 million | Mixed (national and foreign) | Technology manager | Light industry | >10 years |
| 3 | Services | ≤9 | <EUR 2 million | National capital | Owner/Management Board | Professional, scientific, and technical | >10 years |
| 4 | Manufacturing | >250 | >EUR 50 million | Foreign capital | Manager/specialist planning and production management | Automotive industry | >10 years |
| 5 | Services | >250 | >EUR 50 million | Foreign capital | Advanced analytics manager | Telecommunications | 1–5 years |
| 6 | Manufacturing | >250 | >EUR 50 million | Foreign capital | ICT Manager/specialist | Consumer electronic | >10 years |
| 7 | Services | 10–49 | <EUR 2 million | National capital | Owner/Management Board | Professional, scientific, and technical | 6–10 years |
| 8 | Services | ≤9 | <EUR 2 million | National capital | Owner/Management Board | Administration services and support | >10 years |
| 9 | Services | ≤9 | <EUR 2 million | National capital | Owner/Management Board | ICT service and support | >10 years |
| 10 | Services | 50–249 | <EUR 10 million | National capital | ICT Manager/specialist | Production of ICT | >10 years |
| 11 | Services | 50–249 | <EUR 2 million | National capital | Senior SEO specialist | Transportation and storage | 6–10 years |
| 12 | Services | ≤9 | <EUR 2 million | National capital | Owner/Management Board | Construction | 6–10 years |
| 13 | Manufacturing | 10–49 | <EUR 2 million | National capital | Owner/Management Board | Production of ICT | 6–10 years |
| 14 | Banking | >250 | >EUR 50 million | Mixed (national and foreign) | Other-risk assessment manager | Finance | >10 years |
| 15 | Commerce | 10–49 | <EUR 2 million | National capital | Owner/Management Board | Professional, scientific, and technical | >10 years |
References
- Ishikawa, A.; Nakagawa, J. An Introduction to Knowledge Information Strategy. From Business Intelligence to Knowledge Sciences; World Scientific: London, UK, 2013; ISBN 978-981-4324-42-7. [Google Scholar]
- Negash, S.; Gray, P. Business Intelligence. In Handbook on Decision Support Systems; Burstein, F., Holsapple, C.W., Eds.; Springer: Berlin/Heidelberg, Germany, 2008; Volume 2, pp. 175–193. ISBN 978-3-540-48715-9. [Google Scholar]
- Baaras, H.; Kemper, H.G. Management support with structured and unstructured data–an integrated Business Intelligence framework. Manag. Inf. Syst. 2008, 25, 132–148. [Google Scholar] [CrossRef]
- Olszak, C.M. An Overview of Information Tools and Technologies for Competitive Intelligence Building: Theoretical Approach. Issues Inform. Sci. Inf. Technol. 2014, 11, 139–153. [Google Scholar] [CrossRef] [Green Version]
- Gartner IT Glossary. Available online: http://www.gartner.com/it-glossary/big-data/ (accessed on 10 February 2015).
- The Importance of “Big Data”: A Definition. Available online: https://www.gartner.com/doc/2057415/importance-big-data-definition (accessed on 21 April 2018).
- McAfee, A.; Brynjolfsson, E. Big Data: The Management Revolution. Harvard Bus. Rev. 2012, 90, 60–668. [Google Scholar]
- Analytics: The Real-World Use of Big Data. Available online: https://www-01.ibm.com/common/ssi/cgi-bin/ssialias?htmlfid=GBE03519USEN (accessed on 10 February 2015).
- Davis, C.K. Beyond data and analysis. Commun. ACM 2014, 57, 39–41. [Google Scholar] [CrossRef]
- Erl, T.; Khattak, W.; Buhler, P. Big Data Fundamentals: Concepts, Drivers & Techniques; Prentice Hall: Upper Saddle River, NJ, USA, 2016; ISBN 978-0134291079. [Google Scholar]
- Mikalef, P.; Pappas, I.O.; Krogstie, J.; Giannakos, M. Big data analytics capabilities: A systematic literature review and research agenda. Inf. Syst. e-Bus. Manag. 2017, 1–32. [Google Scholar] [CrossRef]
- Yang, W.; Meyer, K.E. Competitive dynamics in an emerging economy: Competitive pressures, resources, and the speed of action. J. Bus. Res. 2015, 68, 1176–1185. [Google Scholar] [CrossRef]
- 2018 Big Data Trends: Liberate, Integrate & Trust. Available online: http://www.businessintelligenceinfo.com/business-intelligence/big-data/now-available-2018-big-data-trends-survey-report (accessed on 21 February 2018).
- Rajaraman, V. Big Data Analytics. Resonance 2016, 21, 695–716. [Google Scholar] [CrossRef]
- Ngai, E.W.; Gunasekaran, A.; Wamba, S.F.; Akter, S.; Dubey, R. Big data analytics in electronic markets. Electron. Mark. 2017, 27, 243–245. [Google Scholar] [CrossRef] [Green Version]
- Kitchin, R. The Real-Time City? Big Data and Smart Urbanism. GeoJournal 2014, 79, 1–14. [Google Scholar] [CrossRef]
- Townsend, A. Smart Cities: Big Data, Civic Hackers, and the Quest for a New Utopia; W.W. Norton & Co.: New York, NY, USA, 2013; ISBN 9780393082876. [Google Scholar]
- Lusch, R.F.; Nambisan, S. Service innovation: A service-dominant logic perspective. MIS Q. 2015, 39, 155–175. [Google Scholar] [CrossRef]
- Wamba, S.F.; Gunasekara, A.; Akter, S.; Ren, S.J.F.; Dubey, R.; Childe, S.J. Big data analytics and firm performance: Effects of dynamic capabilities. J. Bus. Res. 2017, 70, 356–365. [Google Scholar] [CrossRef] [Green Version]
- Akter, S.; Wamba, S.F. Big data analytics in E-commerce: A systematic review and agenda for future research. Electron. Mark. 2016, 26, 173–194. [Google Scholar] [CrossRef]
- Kayser, V.; Nehrke, B.; Zubovic, D. Data Science as an Innovation Challenge: From Big Data to Value Proposition. Technol. Innovat. Manag. Rev. 2018, 8, 16–25. [Google Scholar] [CrossRef] [Green Version]
- TDWI Launches Big Data Maturity Model Assessment Tool. Available online: http://tdwi.org/Articles/2013/11/20/TDWI-Launches-Big-Data-Maturity-Model-Assessment-Tool.aspx?Page=2 (accessed on 17 June 2014).
- Leverage a Big Data Maturity Model to Build Your Big Data Roadmap. Available online: http://www.radcliffeadvisory.com/research/download.php?file=RAS_BD_MatMod.pdf (accessed on 19 February 2014).
- Schmarzo, B. Big Data: Understanding How Data Powers Big Business; John Wiley & Sons: Indianapolis, IN, USA, 2013; ISBN 978-1-118-73957-0. [Google Scholar]
- Big Data & Analytics Maturity Model. Available online: http://www.ibmbigdatahub.com/blog/big-data-analytics-maturity-model (accessed on 18 December 2016).
- Hortonworks Big Data Maturity Model White Paper. Available online: http://hortonworks.com/wp-content/uploads/2016/04/Hortonworks-Big-Data-Maturity-Assessment.pdf (accessed on 18 December 2016).
- Liautaud, B.; Hammond, M. E-Business Intelligence. Turning Information into Knowledge into Profit; McGraw-Hill: New York, NY, USA, 2002; ISBN 978-0071364782. [Google Scholar]
- Davenport, T.H.; Harris, J.G. Competing on Analytics. The New Science on Winning; Harvard Business School Press: Boston, MA, USA, 2007; ISBN 9781422103326. [Google Scholar]
- Wixom, B.H.; Watson, H.J. The BI-based organization. Int. J. Bus. Int. Res. 2010, 1, 13–28. [Google Scholar] [CrossRef]
- Weiss, A. A brief guide to competitive intelligence. Bus. Inf. Rev. 2002, 19, 39–47. [Google Scholar] [CrossRef]
- Williams, S.; Williams, N. The Profit Impact of Business Intelligence; Morgan Kaufmann: San Francisco, CA, USA, 2007; ISBN 978-0-12-372499-1. [Google Scholar]
- Howson, C. Successful Business Intelligence: Secrets to Making BI a Killer Application; McGraw-Hill: New York, NY, USA, 2008; ISBN 9780071498517. [Google Scholar]
- Olszak, C.M. Toward better understanding and use of Business Intelligence in organizations. Inf. Syst. Manag. 2016, 33, 105–123. [Google Scholar] [CrossRef]
- Paraschiv, D.; Pugna, I.; Albescu, F. Business intelligence & knowledge management—Technological support for strategic management in the knowledge based economy. Inform. Econ. J. 2008, 12, 5–12. [Google Scholar]
- Steyl, J. Knowledge Management—BI vs. CI. Available online: http://it.toolbox.com/blogs/bi-ci/business-intelligence-vs-competitive-intelligence-32441 (accessed on 15 March 2017).
- Manyika, J.; Chui, M.; Brown, B.; Bughin, J.; Dobbs, R.; Roxburgh, C.; Byers, A.H. Big Data: The Next Frontier for Innovation, Competition, and Productivity. McKinsey Global Institute, 2011. Available online: https://www.mckinsey.com/~/media/McKinsey/Business%20Functions/McKinsey%20Digital/Our%20Insights/Big%20data%20The%20next%20frontier%20for%20innovation/MGI_big_data_exec_summary.ashx (accessed on 15 March 2017).
- Najafabadi, M.M.; Villanustre, F.; Khoshgoftaar, T.M.; Seliya, N.; Wald, R.; Muharemagic, E. Deep learning applications and challenges in big data analytics. J. Big Data 2015, 2, 1. [Google Scholar] [CrossRef]
- Cox, M.; Ellsworth, D. Application-controlled demand paging for out-of-core visualization. In Proceedings of the 8th Conference on Visualization ‘97 (VIS ‘97), Phoenix, AZ, USA, 18–24 October 1997; Yagel, R., Hagen, H., Eds.; IEEE Computer Society Press: Los Alamitos, CA, USA, 1997. [Google Scholar]
- Leadership Council for Information Advantage. Big Data: Big Opportunities to Create Business Value. Available online: http://www.emc.com/microsites/cio/articles/big-data-big-opportunities/LCIA-BigData-Opportunities-Value.pdf (accessed on 1 February 2015).
- Big Data Analytics. TDWI Best Practices Report, 2011, Fourth Quarter. Available online: https://tdwi.org/research/2011/09/best-practices-report-q4-big-data-analytics.aspx (accessed on 21 April 2018).
- NewVantage Partners. Big Data Executive Survey. Themes & Trends. Available online: http://newvantage.com/wp-content/uploads/2012/12/NVP-Big-Data-Survey-Themes-Trends.pdf (accessed on 1 February 2015).
- Bharadwaj, A.; El Sawy, O.A.; Pavlou, P.A.; Venkatraman, N.V. Digital business strategy: Toward a next generation of insights. MIS Q. 2013, 37, 471–482. [Google Scholar] [CrossRef]
- Kent, P.; Kulkarni, R.; Sglavo, U. Finding Big Value in Big Data: Unlocking the Power of High Performance Analytics. In Big Data and Business Analytics; Liebowitz, J., Ed.; CRC Press Taylor & Francis Group, LLC: Boca Raton, FL, USA, 2013; pp. 87–102. ISBN 9781466565784. [Google Scholar]
- Bekmamedova, N.; Shanks, G. Social media analytics and business value: A theoretical framework and case study. In Proceedings of the 47th Hawaii International Conference on System Sciences (HICSS), Waikoloa, HI, USA, 6–9 January 2014. [Google Scholar]
- Davenport, T. Big Data at Work. In Dispelling the Myths, Uncovering the Opportunities; Harvard Business Review Press: Boston, MA, USA, 2014; ISBN 9781422168165. [Google Scholar]
- OED—Oxford English Dictionary. Available online: http://www.oed.com/view/Entry/18833#eid301162177 (accessed on 10 February 2015).
- Sun, E.W.; Chen, Y.T.; Yu, M.T. Generalized optimal wavelet decomposition algorithm for big financial data. Int. J. Prod. Econ. 2015, 165, 194–214. [Google Scholar] [CrossRef]
- Opresnik, D.; Taisch, M. The value of big data in servitization. Int. J. Prod. Econ. 2015, 165, 174–184. [Google Scholar] [CrossRef]
- He, X.; Ai, Q.; Qiu, R.C.; Huang, W.; Piao, L.; Liu, H. A big data architecture design for smart grids based on random matrix theory. IEEE Trans Smart Grid 2017, 8, 674–686. [Google Scholar] [CrossRef]
- Kusuma, S.; Kasi Viswanath, D. IOT And Big Data Analytics In E-Learning: A Technological Perspective and Review. Int. J. Eng. Technol. 2018, 7, 164–167. [Google Scholar] [CrossRef] [Green Version]
- Nelson, G.S. Business Intelligence 2.0: Are We There Yet? SAS Global Forum. Business Intelligence/Analytics. Available online: http://support.sas.com/resources/papers/proceedings10/040-2010.pdf (accessed on 10 February 2015).
- The Digital Universe in 2020: Big Data, Bigger Digital Shadows, and Biggest Growth in the Far East. IDC iView. Available online: https://www.emc.com/collateral/analyst-reports/idc-the-digital-universe-in-2020.pdf (accessed on 10 February 2015).
- Suther, T.; Burkart, B.; Cheng, J. Jack and the Big Data Beanstalk: Capitalizing on a Growing Market Opportunity. In Big Data and Business Analytics; Liebowitz, J., Ed.; CRC Press Taylor & Francis Group, LLC: Boca Raton, FL, USA, 2013; pp. 21–42. ISBN 9781466565784. [Google Scholar]
- 12 Big Data Definitions: What’s Yours? Available online: http://www.forbes.com/sites/gilpress/2014/09/03/12-big-data-definitions-whats-yours/ (accessed on 10 February 2015).
- White, C. Using Big Data for Smarter Decision Making. Available online: ftp://public.dhe.ibm.com/software/pdf/ro/Using-Big-Data-Smarter-Decision-Making.pdf (accessed on 6 August 2017).
- Ferguson, M. Architecting a Big Data Platform for Analytics. IBM, White Paper, 2012. Available online: http://www.ibmbigdatahub.com/whitepaper/architecting-big-data-platform-analytics (accessed on 13 May 2018).
- Boyd, D.; Crawford, K. Critical questions for big data: Provocations for a cultural, technological, and scholarly phenomenon. Inf. Commun. Soc. 2012, 15, 662–679. [Google Scholar] [CrossRef]
- Big Data and Better Data. Available online: http://magazine.amstat.org/blog/2012/06/01/prescorner/ (accessed on 21 April 2018).
- Big Data: A Perspective from the BLS. Available online: http://www.andrew.cmu.edu/user/jsmurray/teaching/303/files/bls_bigdata.pdf (accessed on 6 August 2017).
- Kamioka, T.; Tapanainen, T. Organizational use of big data and competitive advantage—exploration of antecedents. In Proceedings of the 18th Pacific Asia Conference on Information Systems, PACIS 2014, Chengdu, China, 24–28 June 2014; p. 372. [Google Scholar]
- Akter, S.; Wamba, S.F.; Gunasekaran, A.; Dubey, R.; Childe, S.J. How to improve firm performance using big data analytics capability and business strategy alignment? Int. J. Prod. Econ. 2016, 182, 113–131. [Google Scholar] [CrossRef] [Green Version]
- Liebowitz, J. (Ed.) Big Data and Business Analytics; CRC Press Taylor & Francis Group, LLC: Boca Raton, FL, USA, 2013; ISBN 9781466565784. [Google Scholar]
- Kaisler, S.; Money, W.; Cohen, S. Smart Objects: An Active Big Data Approach. In Proceedings of the 51st Hawaii International Conference on System Sciences, Waikoloa Village, HI, USA, 3–6 January 2018; Curran Associates, Inc.: Red Hook, NY, USA, 2018; pp. 809–818. [Google Scholar]
- Edelenbos, J.; Hirzalla, F.; van Zoonen, L.; van Dalen, J.; Bouma, G.; Slob, A.; Woestenburg, A. Governing the Complexity of Smart Data Cities: Setting a Research Agenda. In Smart Technologies for Smart Governments. Public Administration and Information Technology; Rodríguez Bolívar, M., Ed.; Springer: Cham, Germany, 2018; Volume 24, pp. 35–54. ISBN 978-3-319-58576-5. [Google Scholar]
- Stock, T.; Seliger, G. Opportunities of sustainable manufacturing in industry 4.0. Procedia CIRP 2016, 40, 536–541. [Google Scholar] [CrossRef]
- Wielki, J. The Opportunities and Challenges Connected with Implementation of the Big Data Concept. In Advances in ICT for Business, Industry and Public Sector; Mach-Król, M., Olszak, C.M., Pełech-Pilichowski, T., Eds.; Springer: Cham, Germany, 2015; pp. 171–189. ISBN 978-3-319-11327-2. [Google Scholar]
- Valacich, J.S.; Schneider, C. Information Systems Today. Managing the Digital World; Global Edition; Pearson Education Limited: Harlow, UK, 2017; ISBN 9781292215976. [Google Scholar]
- Belaud, J.-P.; Negny, S.; Dupros, F.; Michéa, D.; Vautrin, B. Collaborative simulation and scientific big data analysis: Illustration for sustainability in natural hazards management and chemical process engineering. Comput. Ind. 2014, 65, 521–535. [Google Scholar] [CrossRef]
- Papadopoulos, T.; Gunasekaran, A.; Dubey, R.; Altay, N.; Childe, S.J.; Fosso-Wamba, S. The role of Big Data in explaining disaster resilience in supply chains for sustainability. J. Clean. Prod. 2017, 142, 1108–1118. [Google Scholar] [CrossRef] [Green Version]
- Schaltegger, S.; Wagner, M. Sustainable entrepreneurship and sustainability innovation: Categories and interactions. Bus. Strategy Environ. 2011, 20, 222–237. [Google Scholar] [CrossRef]
- Pitt, J.; Bourazeri, A.; Nowak, A.; Roszczyńska-Kurasińska, M.; Rychwalska, A.; Santiago, I.R.; Sanchez, M.L.; Florea, M.; Sanduleac, M. Transforming Big Data into Collective Awareness For Transformative Impact On Society. Computer 2013, 46, 40–45. [Google Scholar] [CrossRef]
- Cagnin, C.H.; Loveridge, D.; Butler, J. Business sustainability maturity model. In Proceedings of the Business Strategy and the Environment Conference, Devonshire Hall, Leeds, UK, 4–6 September 2005. [Google Scholar]
- The Sustainability Management Maturity Model: Version 2.0. Available online: https://www.triplepundit.com/2009/12/the-sustainability-management-maturity-model-version-2-0/ (accessed on 1 October 2018).
- Bourne, L. SRMM®: Stakeholder Relationship Management Maturity; Project Management Institute: Newtown Square, PA, USA, 2008. [Google Scholar]
- Jawahar, I.M.; McLaughlin, G.L. Toward a descriptive stakeholder theory: An organizational life cycle approach. Acad. Manag. Rev. 2001, 26, 397–414. [Google Scholar] [CrossRef]
- How Mature Is Your Learning Business? Available online: https://www.tagoras.com/learning-business-maturity-model/ (accessed on 1 October 2018).
- The Evolution of The High-Impact Learning Organization. Available online: https://www.panopto.com/blog/the-evolution-of-the-high-impact-learning-organization/ (accessed on 1 October 2018).
- Five Levels of Change Management Maturity. Available online: https://www.prosci.com/resources/articles/change-management-maturity-model (accessed on 1 October 2018).
- Big Data at the Speed of Business. Available online: http://www-01.ibm.com/software/data/bigdata/ (accessed on 2 October 2014).
- Lahrmann, G.; Marx, F.; Winter, R.; Wortmann, F. Business Intelligence Maturity Models: An Overview. In Information Technology and Innovation Trends in Organizations, Proceedings of the VII Conference of the Italian Chapter of AIS (itAIS 2010), Naples, Italy, 8–9 October 2010; D’Atri, A., Ferrara, M., George, J., Spagnoletti, P., Eds.; Italian Chapter of AIS: Naples, Italy, 2010. [Google Scholar]
- Cooke-Davies, T.J. Measurement of Organizational Maturity. In Innovations: Project Management Research; Slevin, D.P., Cleland, D.I., Pinto, J.K., Eds.; Project Management Institute: Newtown Square, PA, USA, 2004; pp. 211–228. ISBN 193069959X. [Google Scholar]
- Hribar Rajterič, I. Overview of Business Intelligence Maturity Models. Management: J. Contemp. Manag. Issues 2010, 15, 47–67. [Google Scholar]
- Mircea, M. (Ed.) Business Intelligence—Solution for Business Development; InTechOpen: London, UK, 2012; ISBN 978-953-51-0019-5. [Google Scholar]
- Wikimedia Commons. Available online: http://commons.wikimedia.org/wiki/File:Characteristics_of_Capability_Maturity_Model.svg (accessed on 20 May 2014).
- Röglinger, M.; Pöppelbuß, J.; Becker, J. Maturity models in business process management. Business Process Manag. J. 2012, 18, 328–346. [Google Scholar] [CrossRef] [Green Version]
- Woo, J. Information Retrieval Architecture for Heterogeneous Big Data on Situation Awareness. Int. J. Adv. Sci. Technol. 2013, 59, 113–122. [Google Scholar] [CrossRef]
- Spaletto, J. An Investigation of Strategies for Managing Exponential Data Growth in the Enterprise. J. Leadersh. Org. Eff. 2013, 1, 4–14. [Google Scholar]
- Lee, H.-Y.; Wang, N.-J. The Construction and Investigation of Web Engineering for Extending the Enterprise’s Core Competence Related Studies. Int. J. Softw. Hardw. Res. Eng. 2013, 1, 68–78. [Google Scholar]
- Kang, S.; Myung, J.; Yeon, J.; Ha, S.W.; Cho, T.; Chung, J.M.; Lee, S.G. A General Maturity Model and Reference Architecture for SaaS Service. In Database Systems for Advanced Applications, Part II; Kitagawa, H., Ishikawa, Y., Li, Q., Watanabe, C., Eds.; Springer: Berlin/Heidelberg, Germany, 2010; LNCS 5982; pp. 337–346. ISBN 978-3-642-12097-8. [Google Scholar]
- The Eight Building Blocks of Big Data: Management Summary. Available online: http://radcliffeadvisory.com/research/download.php?file=RAS_8BB_BD_MS.pdf (accessed on 17 May 2014).
- Allen, J. Maintaining Knowledge about Temporal Intervals. Commun. ACM 1983, 26, 832–843. [Google Scholar] [CrossRef]
- Mach-Król, M. Big Data analytics in Polish companies. Selected research results. In Proceedings of the International Conference on ICT Management for Global Competitiveness and Economic Growth in Emerging Economies, Wrocław, Poland, 23–24 October 2017; Kowal, J., Kuzio, A., Makio, J., Paliwoda-Pękosz, G., Soja, P., Sonntag, R., Eds.; University of Wrocław: Wrocław, Poland, 2017; pp. 64–77. [Google Scholar]
Figure 1.
A description of maturity levels in the process approach (the Capability Maturity Model (CMM) model) [84].
Figure 1.
A description of maturity levels in the process approach (the Capability Maturity Model (CMM) model) [84].

Figure 2.
The proposed Temporal Big Data Maturity Model (TBDMM).

Figure 3.
The quality of data for big data analytics (BDA) in the studied organizations.

Figure 4.
The most essential data/knowledge in BDA.

Figure 5.
The business analytics solutions that were particularly important to the surveyed organizations.
Figure 5.
The business analytics solutions that were particularly important to the surveyed organizations.

Figure 6.
The most suitable information technology (IT) solutions for BDA in surveyed organizations. KB, knowledge base.
Figure 6.
The most suitable information technology (IT) solutions for BDA in surveyed organizations. KB, knowledge base.

Figure 7.
The most desired IT functionalities for BDA. BI, business intelligence.

Table 1.
The basic differences between Business Intelligence (BI), Competitive Intelligence (CI), and big data.
Table 1.
The basic differences between Business Intelligence (BI), Competitive Intelligence (CI), and big data.
| Business Intelligence | Competitive Intelligence | Big Data | |
|---|---|---|---|
| Purpose | Analysis of internal business processes, improvement of operational and tactical decisions | Analysis of external environment (mainly competitors) | Analysis of the whole environment of the organization: internal resources, customers, suppliers, users of the Internet, and communities of practices |
| Scope | Organization | Environment of organization (mainly competitors) | Whole environment of the organization |
| Content/data | Well-structured information, internal data originating from databases, Enterprise Resource Planning, transaction systems | Semi-structured or unstructured information, external data originating from competitors, customers, and the Internet | Unstructured content, external data that comes from public, open resources, the Internet, mobile devices, and social media |
| Used tools, technologies | Online Analytical Processing (OLAP), data mining, data warehouses | Advanced data mining, predictive modeling, web mining, text mining, and opinion mining | Advanced data mining, predictive modeling, web mining, opinion mining, text mining, exponential random graph models, search-based applications, dashboards, SOA (Service-Oriented Architecture), Hadoop, Spark, MapReduce, parallel processing, real-time processing, and machine learning techniques |
© 2018 by the authors. Licensee MDPI, Basel, Switzerland. This article is an open access article distributed under the terms and conditions of the Creative Commons Attribution (CC BY) license (http://creativecommons.org/licenses/by/4.0/).
Share and Cite
MDPI and ACS Style
Olszak, C.M.; Mach-Król, M. A Conceptual Framework for Assessing an Organization’s Readiness to Adopt Big Data. Sustainability 2018, 10, 3734. https://doi.org/10.3390/su10103734
AMA Style
Olszak CM, Mach-Król M. A Conceptual Framework for Assessing an Organization’s Readiness to Adopt Big Data. Sustainability. 2018; 10(10):3734. https://doi.org/10.3390/su10103734
Chicago/Turabian StyleOlszak, Celina M., and Maria Mach-Król. 2018. "A Conceptual Framework for Assessing an Organization’s Readiness to Adopt Big Data" Sustainability 10, no. 10: 3734. https://doi.org/10.3390/su10103734
Note that from the first issue of 2016, this journal uses article numbers instead of page numbers. See further details here.