Sustainable Urban Transport Development with Stakeholder Participation, an AHP-Kendall Model: A Case Study for Mersin


Department of Transport Technology and Economics, Budapest University of Technology and Economics, Stoczek u. 2, H-1111 Budapest, Hungary
*
Author to whom correspondence should be addressed.
Sustainability 2018, 10(10), 3647; https://doi.org/10.3390/su10103647
Submission received: 13 August 2018
/
Revised: 2 October 2018
/
Accepted: 10 October 2018
/
Published: 11 October 2018
(This article belongs to the Section Sustainable Transportation)
Abstract
:Public transport development decisions are generally made by local government representatives or managers of the local transport company through a top-down procedure. However, if the implications do not meet the demand of the public, the improvement cannot be considered as sustainable and in a long range, correction is necessary. This paper aims to introduce a new model which is capable of supporting public transport development decision making by examining the preferences of different stakeholder groups (passengers, potential passengers, and local government) and creating an acceptable coordination for an ultimate, sustainable decision. In the model, Analytic Hierarchy Process is applied, combined with Kendall rank correlation and an extra level of stakeholder significance in the decision. A case study is also presented on the situation of a Turkish city: Mersin. The results show, that by the application of the new model, a more integrated and thus more sustainable solution can be created for the public transport problems of the city, and by this, probably more citizens can be attracted to use public transport modes which might result in decreased CO2 emissions.
1. Introduction
In recent years, it has become well-known that sustainable local development decisions may only be made by considering the interests of different stakeholder groups [1]. Evidently, this also refers to urban transport service development, in which three main stakeholder participants can easily be identified: Passengers, potential passengers (citizens using other type of transport yet), and local government. Merely such public transport system improvement can be successful in the long term, which integrates the needs of these different groups; in case one or more are violated, the impact (e.g., on the environment) will not be as expected by the decision makers [2]. Moreover, because of the different motivation of the evaluator groups, the information that they possess, the perception, expertise, and interest that they have, also their need for development of the system might differ severely among stakeholders in urban transport planning [3]. Government representatives and experts may consider cost and technical issues [4], while the users and potential users of public transport (in the paper the term: non-passenger will be applied for this group) as consumers of the public service may have more subjective opinions [5]—based on their perceptions of the journey. It is advisable for all public service development projects, to examine the conflict among the needs of the involved groups before launching the implications. Measuring the gaps among the requirements is a powerful tool in decision making and the first step for coordinating the conflicts in case of large discrepancy. Coordination should be fair [6] and target-oriented [7], and in case of urban transport, it should serve sustainably [8].
Consequently, a proper methodology is necessary in public transport planning, which is capable of surveying the needs of the stakeholders, measuring the deviation in needs, and creating an acceptable consensus among the groups.
Considering that for transport supply quality, both tangible and intangible factors have to be participated as factors in the decision [9,10] and also regarding the success of application in sustainable transport issues [11,12,13], a hybrid Analytic Hierarchy Process (AHP) model has been created. The combination of AHP with Kendall rank correlation provided the measurement of discrepancy among different stakeholder groups while the coordination of opinions could be reached by inserting an extra level (“Level 0”) into the AHP hierarchy referring the weights of participant groups in the final decision.
The objective of this paper is to present a decision support methodology that can be applied for public transport development decisions integrating the demand of all involved groups and thus resulting in a sustainable amelioration of the system. The created model has been tested in the city of Mersin in Turkey on surveying the local public bus transport supply quality and its desired modification by passenger, potential passenger, and local government representatives.
In the followings, the applied two techniques—AHP and Kendall rank correlation—are introduced in the Materials and Methods section. Afterwards, a case study is presented that demonstrates the difference of group opinions and the necessity of coordination among stakeholders. The final calculation and decision for improvement is also presented.
2. Materials and Methods
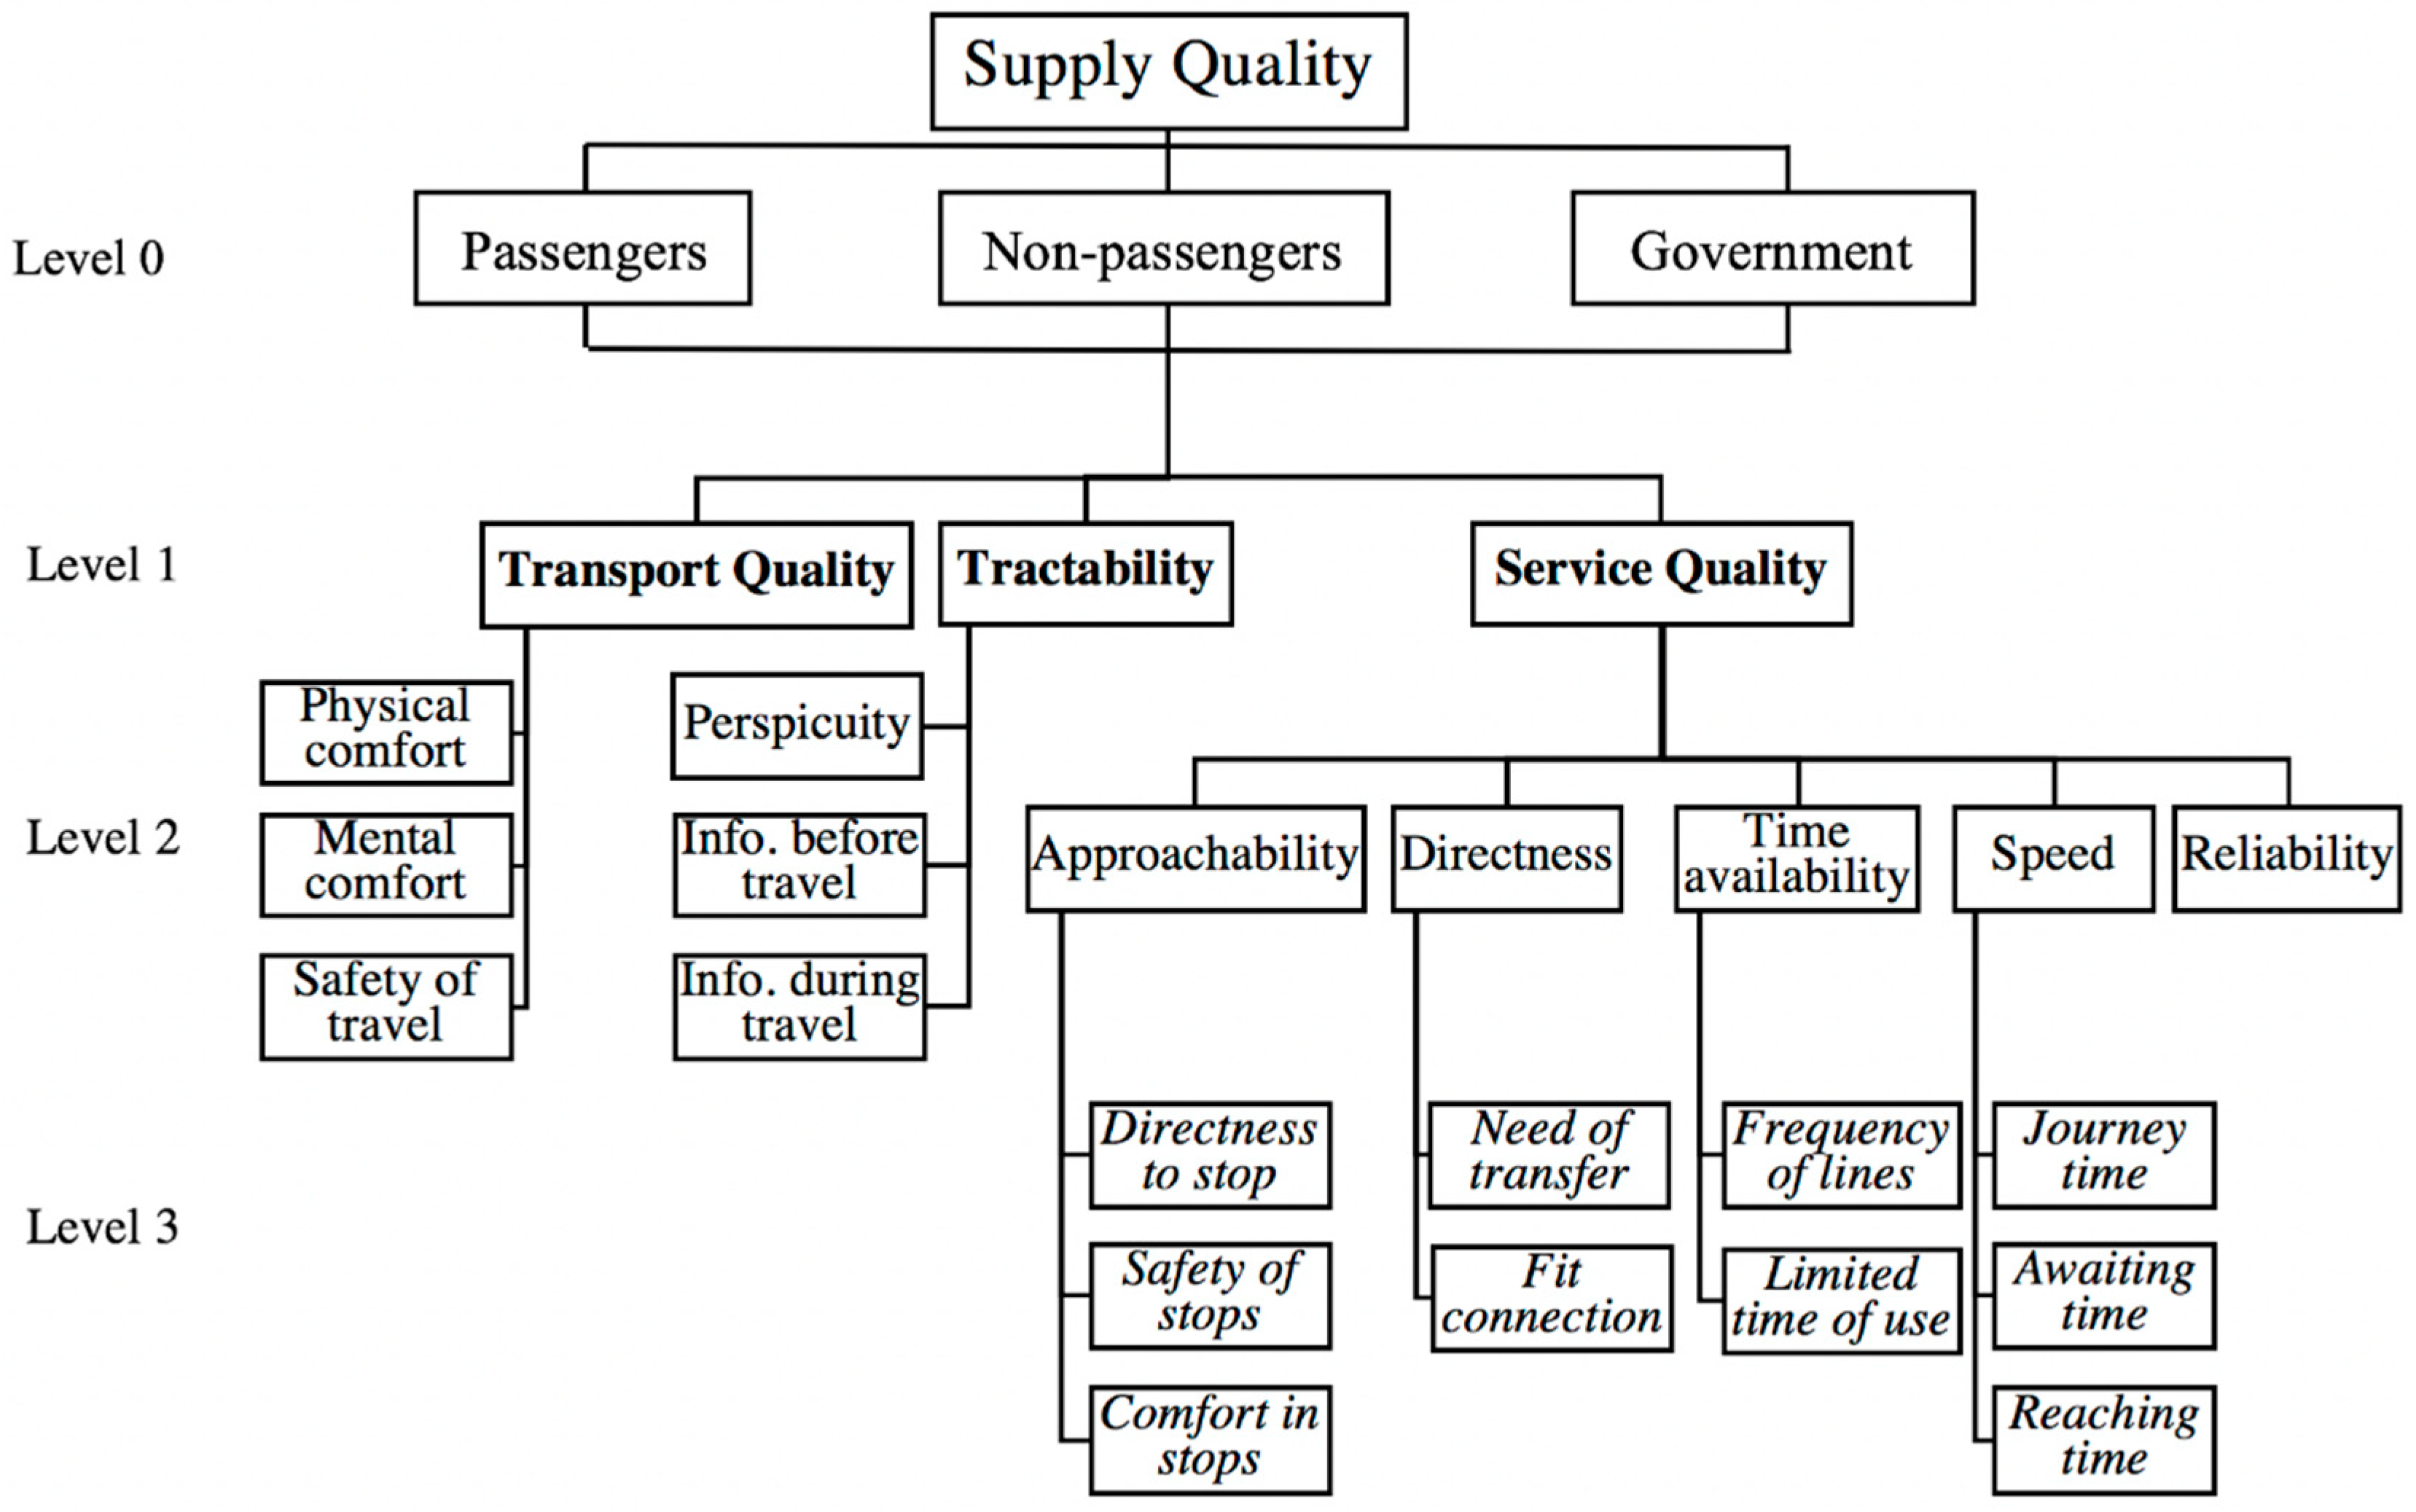
There are several well applicable techniques in multi-criteria decision making (MCDM) utilized by many analysts around the world [14,15,16]. To improve supply quality of public transport, MCDM methods have been used by authors, because of their widespread popularity in gathering stakeholder’s opinions over the last 30 years, especially in service quality improvements [7,17]. Most of the MCDM techniques are available, many of them are implemented by different specialized decision-making software. TOPSIS (Technique for Order of Preference by Similarity to Ideal Solution) is generally applied for multi-criteria decisions [18], however, in the examined case of Mersin no alternatives were given in the decision; the aim was just to analyze the weights of the criteria. The same refers to PROMETHEE (Preference Ranking Organization Method for Enrichment Evaluation) technique [19]. ANP (Analytic Network Process) [20] is capable of determining criteria weights in a decision and also of integrating the interdependencies of the criteria. Nevertheless, the evaluation procedure of this method is highly complex and requires knowledge and expertise from the decision makers, thus for layman—as the citizen stakeholder groups of the recent survey—it is not convenient. The selected Analytic Hierarchy Process (AHP) (see Figure 1) method has the advantage of providing a comprehensive decision structure to the evaluators and checking the consistency of the responses that are inevitable in the case of layman evaluators. However, there is a serious disadvantage of this technique; compared to ANP, it cannot deal with non-hierarchical connections of the decision system elements. Since the decision structure for evaluating the supply quality of public transport in Mersin is dominantly hierarchical (see Figure 2), this drawback could be omitted.
Thus, out of the wide range of possible techniques, AHP has been selected because of the nature of the decision problem to be solved. The evaluators have to be provided with a clear, hierarchical structure of public transport system elements (see Table 1), and moreover, a consistency check is also advisable due to the non-expert characteristics of two out of three evaluator groups. Based on this, the preconditions of the creator of AHP [21], for the application, have been fulfilled.
- The problem is hierarchically structured and dynamic analysis could be considered;
- Consistency check is required (passengers and non-passengers are evaluators);
- The elements of supply quality should be characterized both from ordinal and cardinal aspects;
- In the final decision not only the ranking itself is important but also the score attained to each factor, this will be the basis for deciding on development projects in the city.
The first phase of every AHP application is setting up a decision tree where the elements of the decision are designed in a hierarchical order. The top level is connected directly to the final decision, the lower levels (can be called sub-criteria) are linked to the elements of the upper levels. Based on the hierarchy, pairwise comparison matrices (PCM) have to be created. It is an assumption of the AHP that evaluators can better decide between two issues at a time than solving a more complex decision among more factors. The hierarchy constitutes groups within elements of the complex decision following the branches, thus pairwise comparisons can be created by comparing the factors that belong to the same branch, based on Saaty’s judgment scale.
AHP utilizes the special characteristics of pairwise comparison matrices. A theoretical PCM is quadratic, reciprocal, and consistent.
The matrix A is considered consistent if all of its elements are positive, transitive, and reciprocal as
The dominant eigenvector of such PCM is trivial to be determined by Saaty’s eigenvector method [21]: if A is a consistent matrix, then the eigenvector w can be calculated by finding its maximum eigenvalue (.
While in AHP, decision makers most likely do not evaluate PCM-s consistently (for the evaluation, the Saaty scale is recommended, see Table 1) the eigenvector method can be used provided consistency check has been conducted for the evaluations. Thus, for AHP applications the eigenvector method can be used for deriving the weight scores of the decision elements, however only in those cases, in which the pairwise evaluations meet the inconsistency tolerance, measured by the Consistency Ratio,
Consequently, during the AHP process the consistency of answers must be examined by Saaty’s Consistency Index (CI) and Consistency Ratio (CR) [21,22,23]:
where CI is the consistency index, is the maximum eigenvalue of the PCM and n is the number of rows in the matrix. CR can be determined by:
Saaty provides the calculated RI values for matrices of different sizes as shown in Table 2.
Where RI is the random consistency index. The threshold was also determined by Saaty, if CR is below 0.1 (, the PCM can be considered as acceptable from inconsistency point of view. Since most of the AHP applications involve several evaluators, the individual scores have to be aggregated, and avoiding rank reversal, the calculation of the geometric mean [24] of the respective evaluator scores is recommended for determining the aggregate results.
If “h” evaluators exist in the procedure
where denotes entries, in the same position (i, j), of pairwise comparison matrices, filled in by the k-th decision maker.
Having gained the aggregated matrices, calculating final weight vector scores considering hierarchical linkages within the decision is the next step in the procedure. As consistency has been acceptable, the final score determination can be applied as:
where j = 1,…, m and ; wj > 0 (j = 1,…, m) represents the related weight coordinate from the previous level; > 0 (i = 1,…, n) is the eigenvector computed from the matrix in the current level, (i = 1,…, n) is the calculated weight score of current level’s elements. Sensitivity analysis enables understanding of the effects of changes in the main criteria on the sub criteria ranking and help decision maker to check the robustness throughout the process.
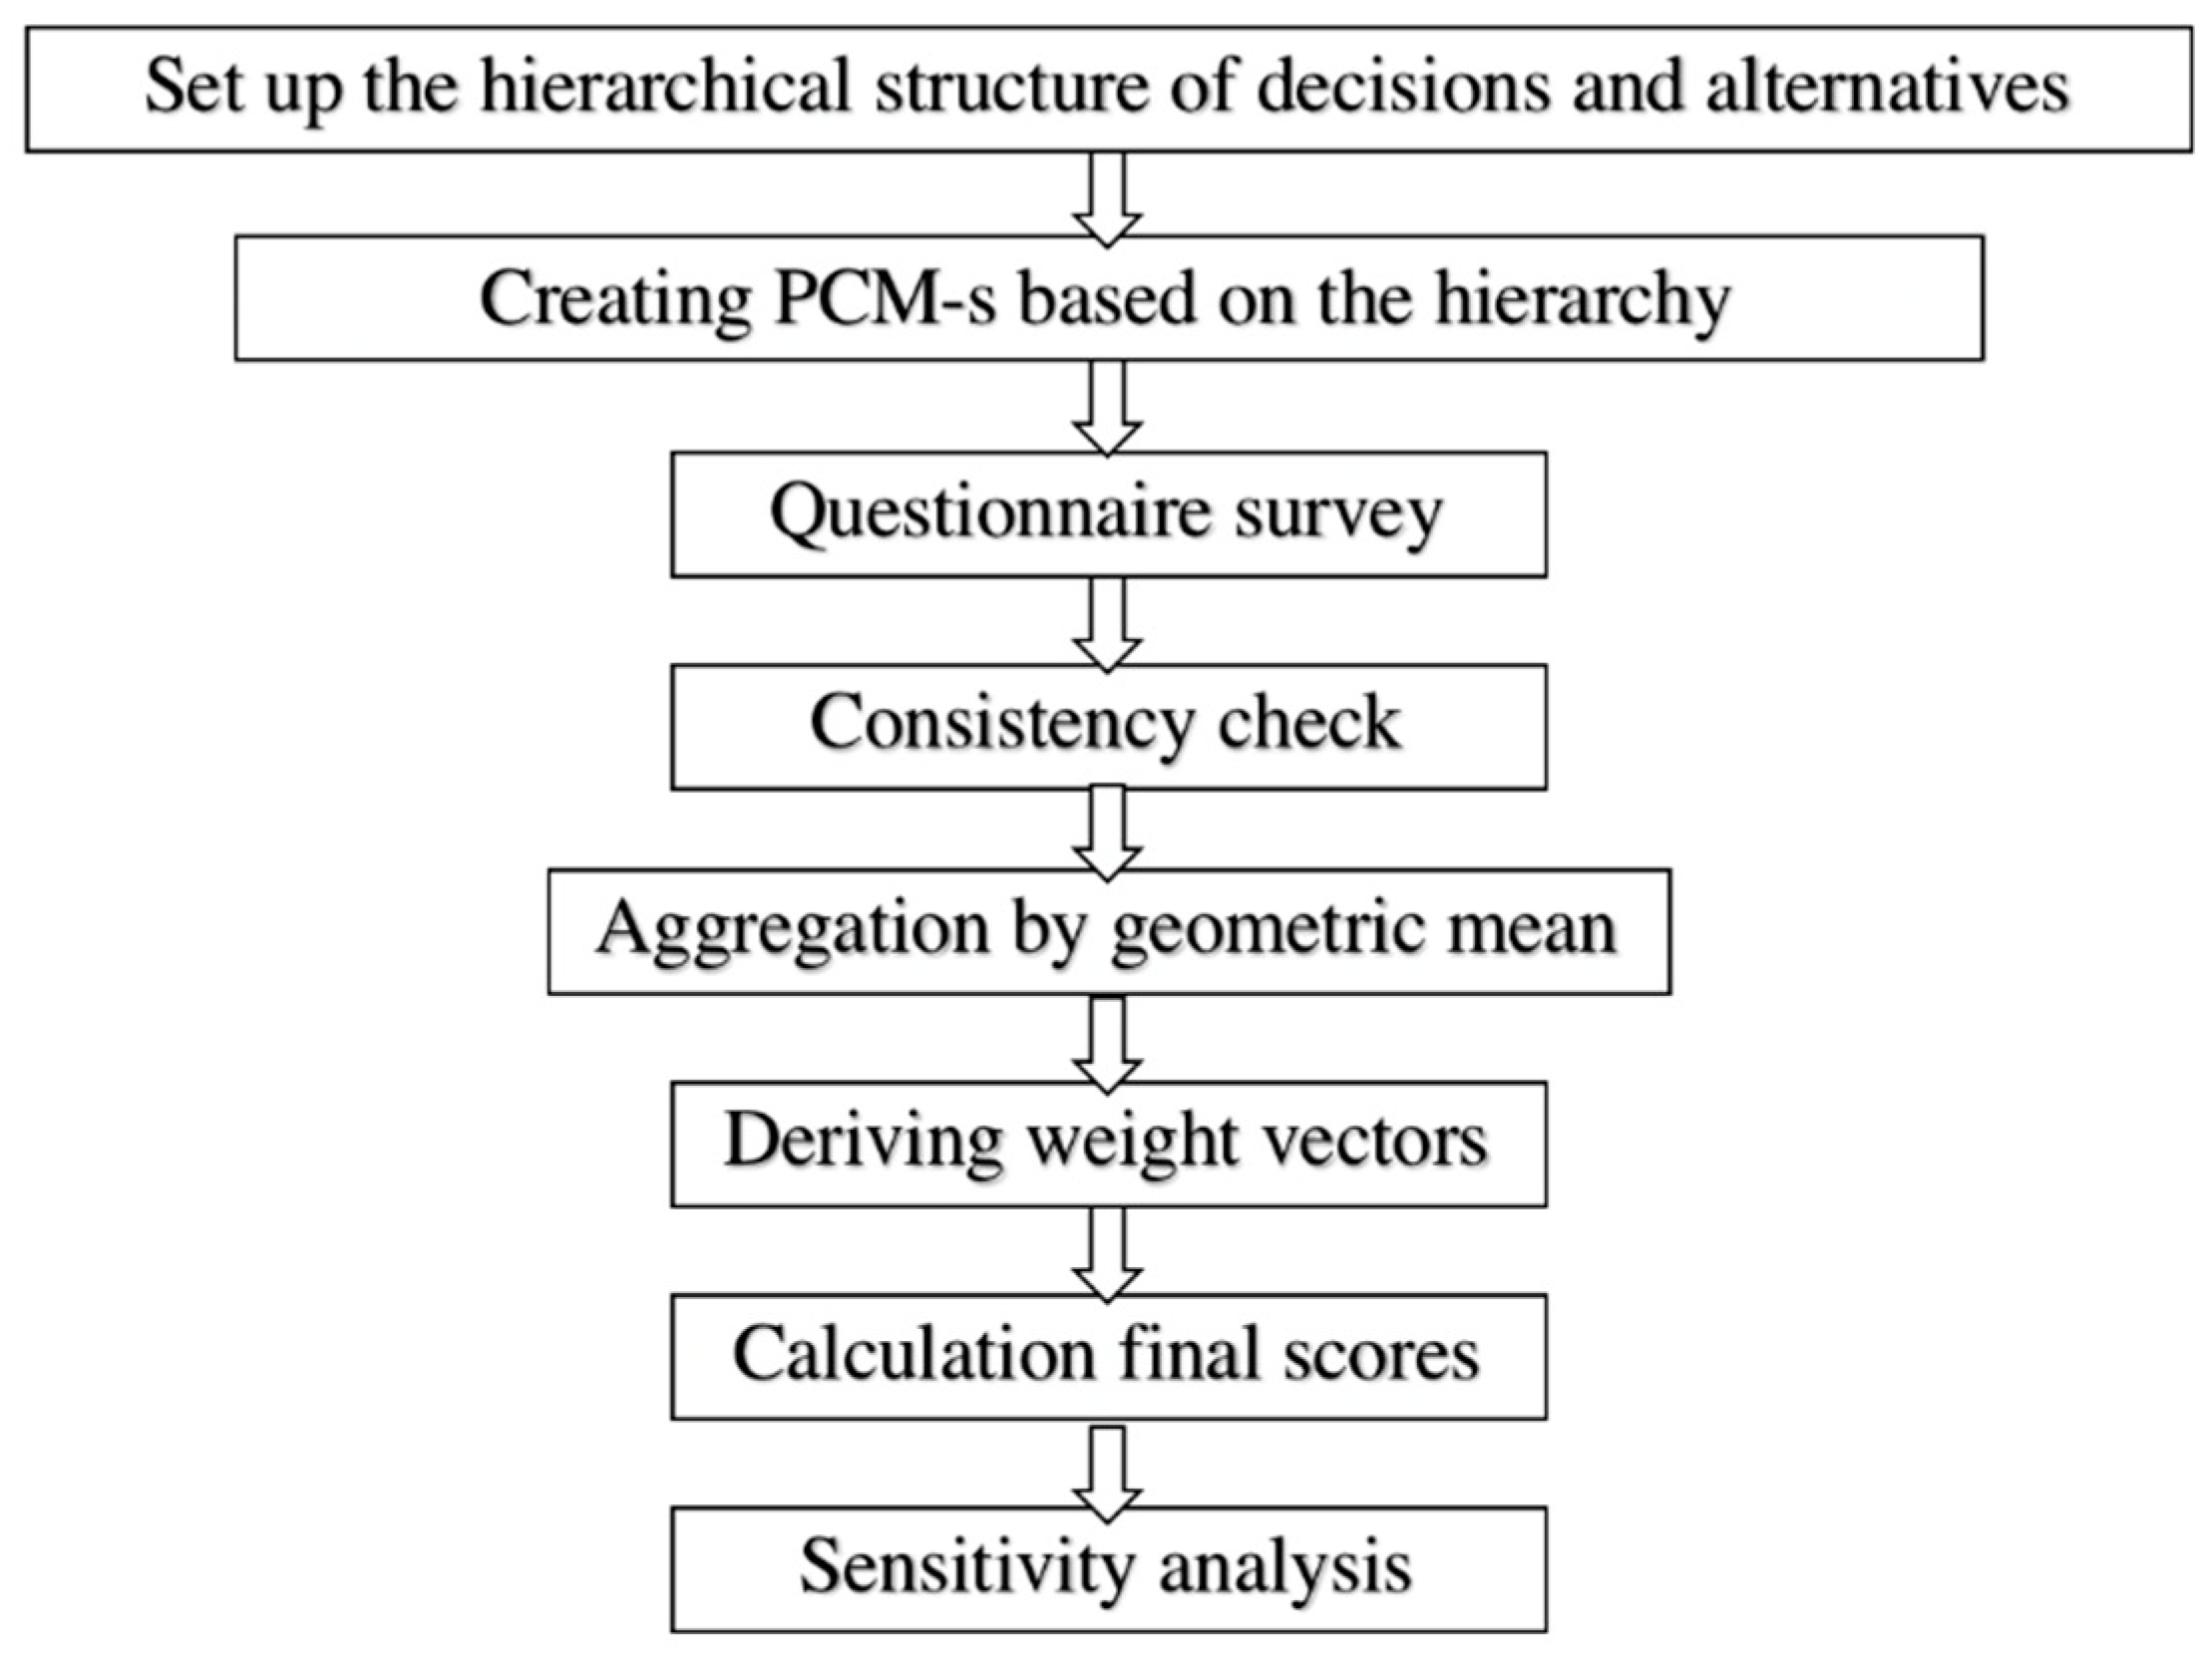
The steps of conducting AHP is clearly presented in Figure 1.
As previously stated, the objective of this research has not only been to gain preference scores related to public transport development, but also to analyze the difference among the opinions of the three clearly distinguished evaluator groups. These opinions are expressed by the previously introduced final scores (8) gained group wisely. It has to be emphasized that for such cases, where fairly homogeneous groups can be separated in the evaluation process with different interest, expertize, etc., the aggregation Formula (7) can only be applied within the homogeneous group, but not among groups. In the case of Mersin (introduced in the Results section) 3 quasi-homogeneous groups: Passengers, non-passengers, and government representatives could be separated. The Formula (7) was applied within each group so the aggregation was made group wisely considering the different characteristics (motivation, etc.) of groups as described in the Introduction section. By this, the application of AHP could clearly demonstrate the preferences of each group: Three different rankings of supply quality elements could be gained that reflected the importance scores of each stakeholder community related to the necessity of development of public transport system items. To estimate the agreement degree or concordant degree among passengers, non-passengers and government, Kendall’s coefficient of concordance (W) has been applied [25,26]. This is a non-parametric method for three or more different rankings and applicable for evaluating the agreement among multiple participant groups.
where is the aggregated ranking of the criterion i, is the rank given to criterion i by the evaluator group j, m is the number of rater groups rating n factors.
where S is a sum-of-squares statistic deviations over the row sums of ranking .
R is the mean of the values. Following that, Kendall’s “W” statistic is between one and zero and it can be obtained from either of the following formulas:
After applying the formula, the result will be a number that determines the agreement degree among the different groups as shown in Table 3.
For the last phase, coordinating the three different group scoring, a zero level has been inserted into the AHP hierarchy based on the logic of Saaty. While this level is out of the criteria and sub-criteria of the original decision tree, it plays an important role in determining the final scores of the decision. Level ‘0’ is for deciding on the significance of each evaluator group in the final decision. Such as any other levels, pairwise comparisons have to be made by filling a PCM that is constituted by the evaluator groups (note that the evaluators of this phase can be different persons than the ones in the original survey). The procedure of deriving weights is also identical with any other criteria see Formula (4), evidently after the consistency check (5) and (6). Due to the nature of the eigenvector method, the results of (4) are normalized to the value of one, and thus, the overall scores and ranking of the decision elements can be gained by simply multiplying the weight scores of significance attained to each decision maker group with the preference weight scores (related to criteria and sub-criteria of the decision) of that certain group. In the next section, the authors provide a detailed description of the procedure on real data for all the three phases: The AHP group wise step, the Kendall rank correlation test, and the final coordination phase.
3. Results
The following structural model (Figure 2) has been created and applied for elaborating the public transport situation in a Turkish city, Mersin. This hierarchical model was previously tested on a Japanese small town, Yurihonjo in 2012 and because of the positive feedbacks it has been selected for this case too. The results of the preliminary study were published in Reference [3]. In the Japanese survey, however, only the different images on the supply quality could be determined group wisely but a consensual overall result was not elaborated. The model for the case of Mersin, introduced in this paper—AHP amended by Kendall rank check and an extra level on the significance of the stakeholder groups—is a step forward to a sustainable development decision.
As can be seen in Figure 2, the first level of the hierarchy is a fairly general one, the second level is more specific and the third is even more specific so the data could be increased essential on a wide range of components in an entirely intelligent manner, keeping the hierarchy. The selection of the elements of supply quality aimed to take into account not only quantitative influencing factors (e.g., frequency of lines, awaiting time, and fit connection), but also qualitative ones such as perspicuity of the timetable or mental comfort during the journey. The perception of the quality of the journey has been divided into three main parts: transport quality refers to the time spent on the vehicle, tractability refers to providing the sufficient and comprehensive information before and during travel, while service quality describes the pre and post-service elements. A thorough preliminary literature survey was conducted based on References [27,28,29,30], before setting up the decision hierarchy. Cost considerations are omitted, only supply quality issues are investigated. Another point in AHP approach is isolating the different members of open transport: Government as a maintainer, organization as the administrator, and travelers as clients. The conflict of their distinctive picture on key-purposes of a specific framework can be the reason for settling on wrong choices on transport advancement [22]. Thus evaluator groups had to be created, because of the different point of view of passengers, non-passengers, and governmental evaluators. Pairwise comparisons had to be made by the evaluators for all the elements of the model, considering the hierarchy levels as the nature of AHP.
Figure 2 exhibits that for the recent AHP application, one 3 × 3 PCM has been created for the first level, one 5 × 5 and two 3 × 3 PCM-s for the second level and two 3 × 3 and two 2 × 2 matrices for the third level. This has been the basis of constructing a questionnaire considering the rules of the AHP methodology. For the first level the following questions have been asked: ‘Compare the importance of improvement for the service quality and transport quality elements. Compare the importance of improvement for the service quality and tractability elements. Compare the importance of improvement for the transport quality and tractability elements’. For the second and third level, the same procedure has been followed.
The characteristics of the conducted survey based on the hierarchical model were the following:
- 97 evaluators (2 managers ‘in the relevant field’ + 15 government officials ‘in the relevant field’ + 40 public passengers + 40 non-passenger) were asked out of the total population of 1,773,852. The number of participants evidently not statically representative however the MCDM provides a deeper insight based on pairwise comparisons than a simple statistical survey [21];
- The evaluators were randomly selected nearby bus stops in Mersin in the peak hours. Despite the random selection, the proportion of genders and age reflected the characteristics of the total population of the city and even more the current and potential users of public transport. In the sample, the proportion of males was 45%, female was 55% for both passenger and non-passenger groups (men more tend to use private cars in Turkey); from an occupational aspect, students 40%, retired 20% (university students give a great proportion of public transport usage); and 70% for age 18–30, 17.5% for age 31-51, and 12.5% for over 51 (Mersin such as many developing cities has many youngsters). The data of the selected evaluator groups of citizens were compared to the data of the Turkish Statistical Institute [30]. Based on the official database, the female proportion in the city is 51% (893,806) and male is 49% (881,046), while the number of students is 412,559, which makes 23% out of the total population. In the sample the representation of the students were higher due to their increased participation in the public transport. The number of retired persons, aged over 51 is 202,053 that makes 11.4% out of the total population of the city which was reflected in the sample.
- All of the government decision makers were selected from Mersin Municipality Transportation Department. The characteristics were obviously different from the citizen groups. 88.24% were male due to the gender feature of engineering profession; 70.6% of the respondents were between the age of 31–51, all with relevant experience in transport planning and development. 76.47% had bachelor degrees and 23.53% had master degrees.
- The questionnaire was evaluated between July and November 2017, and analyzed in December 2017.
The consistency ratio (CR) for all matrices in all groups was smaller than 0.1, thus it is acceptable to complete the AHP analysis as Saaty suggested [21]. Sensitivity analysis has been performed by changing the weight of each main criterion to test the stability of the rank and it was robust without change.
In case of some factors significant conflict could be detected among the passenger, non-passenger and the governmental evaluators. The scores of the proper eigenvectors provide the opportunity to set up a rank order of preferences among the participants of public transport on the issues of the system considering the weights of the previous levels as well (see Formula (6)). Priority order of different elements in public bus transportation systems in terms of their development is presented in Tables Table 4 Table 5 Table 6.
For the first two groups, passenger and non-passenger evaluators of the analyzed public transportation system indicated in the first level the development of “Transport Quality” as the most essential related issue as presented in Table 4, however, there were differences of preferences in the second and third rank, in which passenger side ranked “Service Quality” was the second most important issue, followed by “Tractability” and non-passenger side evaluated “Tractability” that was the second most important issue, followed by “Service Quality”. In the survey, transport quality referred to the time spent on the vehicle by passengers and consisted of elements such as physical and mental comfort on the vehicle during the journey or the feeling of safety on the bus. Consequently, public evaluators esteemed that the most crucial part of the system is the service during their journey on the vehicle and not the other circumstances (before or after) of the travel.
The situation is completely different for the government side, where “Tractability” is the most important issue followed by “Transport Quality” and “Service Quality”.
In level 2, for the passenger and non-passenger side “Safety of travel” was the most essential issue to be developed, however, it was not so important for government side as shown in Table 5. The second important issue for passenger side was “Physical comfort”, followed by “Directness”, “Time availability”, and “Approachability”, however, non-passengers’ point of view was the same as government’s point of view for improving “Information before travel”, “Information during travel”, and similar in the cases of “Mental comfort”, “Physical comfort”, and “Approachability”. Based on the priorities, it can be stated that local government representatives are not aware of the need of citizens for improving the safety of travel in local buses. In case project initiations, it would be started for increasing safety in transportation that might attract more people to use public transport that might have a positive impact on the environment and sustainability issues.
In the last level, “Frequency of lines” was the most essential issue for passenger side which is a rather general demand from citizens all over the world. It was followed by “Need for transfer”, “Directness to stops”, and “Fit connection”. For the non-passenger side, “Fit connection” is first, which can be recommended for the decision makers to overview, that not only means connection of transport modes (e.g., bus-train), but also linkage of local-regional buses or local bus lines. For the government side, “Limited time of use” was the most important issue, followed by “Need for transfer”, “Journey time”, and “Fit connection”. Interestingly, the time limitation of bus lines (the gap between the last bus in the evening and the first bus in the morning) did not get attention for citizens, thus this issue is a miss-perceived problem by the local transport operators.
“Fit connection” issue had the same importance for both passengers’ and government’ side, while “Awaiting time” and “Directness to stops” issues had the same importance for non-passengers’ and government’ side.
Sensitivity analysis showed stability of ranking factors.
As could be seen in Tables Table 4 Table 5 Table 6 there is significant difference among the different evaluator groups, and Kendall’s coefficient of concordance (W) is verified to apply to detect the degree of agreement among different evaluator groups (Passengers, non-passengers and government). Based on Table 3, there was “moderate agreement” among different evaluator groups in the first Level (Table 7).
In Level 2. (Table 8) Kendall’s coefficient of concordance (W) also indicates that the agreement is temperance among different evaluator groups following the intervals exhibited in Table 3. Further, the situation for Level 3 is also similar, the agreement degree is moderate among different evaluator groups (Table 9).
Rank analysis indicated diverse opinions on the necessary elements to be developed for the same public transportation system. It can be explained by the different interest and motivation of the groups (mainly between citizens with maximizing the comfort of the travel and local transport managers with decreasing costs) or not sufficient expertize or information for the users side.
However, a sustainable development plan can only be created if citizens’ (both passengers and potential passengers) aspects are also considered, as mentioned in the Introduction section. Consequently, coordination is necessary among group opinions by weighting each group score by the attained significance of each group in the decision. Evidently, it is a difficult task on deciding the significance of passenger, non-passenger, and local government representatives in a public transport development decision.
In the research four independent transportation experts have been asked in Mersin to evaluate (through pair wise comparisons, following the AHP logic) the relative importance of each evaluator group in the public transport decision. The results are shown in Table 10.
The final aggregated scores (considering stakeholder weights) for different levels have been calculated and proffered in Table 11.
Weighting the group importance caused the approximation of the final results to the government preferences. It is explainable regarding that local governmental budget is at stake in public transport development and cost and technical considerations also play an important role. It has to be strongly emphasized, however, that the final results are more sophisticated and are significantly closer to citizens’ preferences than the original government side scoring (see Tables Table 12 Table 13 Table 14 ). For instance, in Level 2; “Perspicuity” got ranked only at 4th place in the overall decision (see Table 13), while the original government incentive was to develop it in the first place (see Table 5). Consequently, the created model succeeded in contributing to a more sustainable public transport development planning by adding public preferences to the governmental aspects on the amelioration of the system.
4. Discussion
In this section, the relevance of the results is analyzed in detail. First, the question of representativity might emerge because of the low proportion of respondents in the passenger and non-passenger groups (merely 40 + 40 out of the population of approx.1.8 million in the city).
As stated in the Results section, the results of the AHP-Kendall model did not show sensitivity and it also refers to the sample size. Consequently, the extension of the sample size does not make a significant impact on the results.
A possible reason for that is most likely the phenomenon of “The wisdom of crowds” [31]. It states that, when it comes to a complex decision, the perception of a group is more powerful than the rationalized decision of an expert even in case of relatively small number of participants. The member size of the group—as a rule of thumb—should not be large, participant number from 20 can be considered as sufficient for “The wisdom of crowds” effect. The logic behind this phenomenon is that a sample consisting more than 20 randomly selected people is large enough to filter out the extreme perceptions of some individuals, and thus a very reasonable final decision can be gained already by this sample size. Due to the imprecise definition of the threshold, 40 participants were involved in recent research and stable results could be gained. It has to be emphasized that this effect merely refers to quasi-subjective or subjective decisions, such as perception on supply quality of an urban transport system.
Obviously, the deviations within each stakeholder group were also analyzed and the authors did not find significant difference in the perceptions of each group members in the sample of passengers and non-passengers, which might also be a reason for the stability of the final results.
Finally, although the evaluators were randomly selected, they properly represented the total society of the city from gender, age, and occupation aspects, and this might also explain the robustness of the preference ranking.
Another point that has to be discussed is the decision on the significance of each group; a possible technique would have been to ask the 97 participants to vote on their weights of opinion and not using four experienced experts to do that. It has to be emphasized that this is a very difficult comparison: Deciding which stakeholder group’s opinion is more important and how much more. The authors believe that it is no use of asking the original evaluators about their significance in the decision because all would evaluate the dominancy of their own stakeholder group (e.g., in national parliaments parties do not vote about their significance in the decision).
This is the reason why four non participant experts (all advisors of Mersin Transportation Department) were asked to make their judgments on the weight of the groups in the decision. It has to be stressed that in real public transport development projects, the group of the final decision makers does not consist of more than three or four top managers or top officials. Consequently, the sample size of four for this stage can be considered as sufficient. Moreover, the relatively large weight (63.51%) of the government group can be also justified by the general practice of 100%, which means not considering public opinion at all. This 63.51% means that the local government still vindicates the right to decide on transport system development but not with neglecting the public’s view any more. This is a serious step towards the creation of a more sustainable transport system.
5. Conclusions
Based on the results, it can be concluded that the assumption on the difference of opinions among the stakeholders of public transport has been verified by Kendall calculation. It has to be emphasized that merely the AHP application itself revealed very important preferences of mainly the users’ side, and the awareness of these needs can be the basis of initiating new transport system improvement projects. Moreover, the application of Kendall method has proven that only moderate connection can be detected among the three different groups’ ranking for all three levels, while the participants evaluated exactly the same questionnaires on their own perceptions and image on public bus transport supply quality. As a consequence, it can be stated that the decision makers in Mersin Municipality Transportation Department ought to share public views in their future Transportation Strategic Plan and they should pay more attention to “Service quality”, “Approachability”, and “Directness” improving factors in their future plans more than “Tractability”, “Information during travel”, and “Perspicuity” to attract non-passengers and increase the satisfaction of passengers.
The introduced model is primarily suitable for supporting strategic decisions of public transport system improvement with respect to sustainability issues. Consequently, the gained overall weights of criteria could be used for evaluating and ranking projects aiming to develop the transport system. By applying the introduced results, the Municipality of Mersin can directly evaluate and rank tender proposals for urban transport amelioration, and based on personal interviews, the representatives of the local government are considering taking this opportunity. In the European Union countries, this research can be a basis for creating a methodologically proven Sustainable Urban Mobility Plan (SUMP) integrating citizens’ needs for improvement.
In general, AHP amended by Kendall analysis and group coordination has been proven to be an appropriate method for evaluating transport participants’ demand for system improvement. Instead of an automatic overall aggregation, a clear distinction among passengers, non-passenger citizens, and transport operators is advised to be made in order to get more sophisticated results because of the different motivation and expertize on the system development. Under these conditions, it is strongly recommended to apply a Kendall method (Kendall technique has been proven to be appropriate) together with AHP to analyze the distance among the different aspects of the stakeholders.
As a remark for further research, optimization techniques might be selected in order to create consensus among the different groups on an objective basis, and thus, to gain a final preference ranking for development factors containing all aspects. While the criteria are dominantly hierarchically structured, for academic scholars, factor interactions might be possible to examine within the decision system. This will probably lead to a more complicated, most likely hybrid operations research model. For practitioners, the implementation of the model should be elaborated, e.g., software application might be developed for future evaluations of public transport. The authors find it also important to follow the impact of the decisions by the local government and surveying passenger and potential passenger satisfaction after the modification of the transport system. A successful implementation of the introduced model might result in a proper scoring system for tendering transportation projects in which technical and cost considerations are integrated as well as aspects of the current and future passengers.
Author Contributions
S.D. conceptualized the research and created the suitable methodology. S.M. conducted the survey and calculated the results. In paper writing both authors participated.
Funding
This research received no external funding.
Conflicts of Interest
The authors declare no conflicts of interest
References
- Ioppolo, G.; Cucurachi, S.; Salomone, R.; Saija, G.; Shi, L. Sustainable local development and environmental governance: A strategic planning experience. Sustainability 2016, 8, 180. [Google Scholar] [CrossRef]
- Bergman, N. Impacts on the fossil fuel divestment movement: Effects on finance, policy and public discourse. Sustainability 2018, 10, 2529. [Google Scholar] [CrossRef]
- Duleba, S.; Mishina, T.; Shimazaki, Y. A dynamic analysis on public bus transport’s supply quality by using AHP. Transport 2012, 27, 268–275. [Google Scholar] [CrossRef]
- Koryagin, M. Urban planning: A game theory application for the travel demand management. Per. Polyt. Transp. Eng. 2018, 46, 171–178. [Google Scholar] [CrossRef]
- Perlaviciute, G.; Steg, L.; Contzen, N.; Roeser, S.; Huijts, N. Emotional responses to energy projects: Insights for responsible decision making in a sustainable energy transition. Sustainability 2018, 10, 2526. [Google Scholar] [CrossRef]
- Scala, N.M.; Rajgopal, J.; Vargas, L.G.; Needy, K.L. Group decision making with dispersion in the Analytic Hierarchy Process. Group Decis. Negot. 2016, 25, 355–372. [Google Scholar] [CrossRef]
- Van den Honert, R.C. Decisional power in group decision making: A note on the allocation of group members’ weights in the multiplicative AHP and SMART. Group Decis. Negot. 2001, 10, 275–286. [Google Scholar] [CrossRef]
- Li, W.; Li, Y.; Deng, H.; Bao, L. Planning of electric public transport system under battery swap mode. Sustainability 2018, 10, 2528. [Google Scholar] [CrossRef]
- De Luca, S. Public engagement in strategic transportation planning: An Analytic Hierarchy based approach. Transp. Policy 2014, 33, 110–124. [Google Scholar] [CrossRef]
- Sidorchuk, R.; Efimova, D.; Lopatinskaya, I.; Kaderova, W. Parametric approach to the assessment of service quality attributes of municipal passenger transport in Moscow. Mod. Appl. Sci. 2015, 9, 303–311. [Google Scholar] [CrossRef]
- He, Y.; Wang, X.; Lin, Y.; Zhou, F. Optimal partner combination for joint distribution alliance using integrated fuzzy EW-AHP and TOPSIS for online shopping. Sustainability 2016, 8, 341. [Google Scholar] [CrossRef]
- Li, W.; Li, Y.; Fan, J.; Deng, H. Siting of carsharing station based on Spatial Multi Criteria evaluation: A case study of Sanghai EVCARD. Sustainability 2017, 9, 152. [Google Scholar] [CrossRef]
- Lyu, H.M.; Wu, Y.X.; Shen, J.S.; Zhou, A.N. Assessment of socio-economic risk of Chinese dual land use system using fuzzy AHP. Sustainability 2018, 10, 2451. [Google Scholar] [CrossRef]
- Hashim, H. Grassroots Participation in Local Planning Process. Master’s Thesis, Iowa State University, Ames, IA, USA, 1986. [Google Scholar]
- Pérez, J. Some comments on Saaty’s AHP. Manag. Sci. 1995, 41, 1091–1095. [Google Scholar] [CrossRef]
- Benítez, J.; Delgado-Galván, X.; Izquierdo, J.; Pérez-García, R. Consistent completion of incomplete judgments in decision making using AHP. J. Comput. Appl. Math. 2015, 290, 412–422. [Google Scholar] [CrossRef] [Green Version]
- Mardani, A.; Jusoh, A.; Zavadskas, E.K.; Khalifah, Z.; Nor, K.M. Application of multiple-criteria decision-making techniques and approaches to evaluating of service quality: A systematic review of the literature. J. Bus. Econ. Manag. 2015, 16, 1034–1068. [Google Scholar] [CrossRef]
- Kumar, K.; Garg, H. TOPSIS method based on the connection number of set pair analysis under interval-valued intuitionistic fuzzy set environment. Comput. Appl. Math. 2018, 37, 1319–1329. [Google Scholar] [CrossRef]
- Liao, H.; Wu, D.; Huang, Y.; Ren, P.; Xu, Z.; Verma, M. Green Logistic Provider Selection with a Hesitant Fuzzy Linguistic Thermodynamic Method Integrating Cumulative Prospect Theory and PROMETHEE. Sustainability 2018, 10, 1291. [Google Scholar] [CrossRef]
- Saaty, T.L. The Analytic Network Process; RWS Publication: Pittsburg, CA, USA, 1996. [Google Scholar]
- Saaty, T.L. A scaling method for priorities in hierarchical structures. J. Math. Psychol. 1977, 15, 234–281. [Google Scholar] [CrossRef]
- Saaty, T.L. How to make a decision: The analytic hierarchy process. Interfaces 1994, 24, 19–43. [Google Scholar] [CrossRef]
- Zahedi, F. The analytic hierarchy process—A survey of the method and its applications. Interfaces 1986, 16, 96–108. [Google Scholar] [CrossRef]
- Aczél, J.; Saaty, T.L. Procedures for synthesizing ratio judgements. J. Math. Psychol. 1983, 27, 93–102. [Google Scholar] [CrossRef]
- Siegel, S. Nonparametric Statistics for the Behavioral Sciences; McGraw-Hill: New York, NY, USA, 1956. [Google Scholar]
- Kendall, M.G.; Smith, B.B. The problem of m rankings. Ann. Math. Stat. 1939, 10, 275–287. [Google Scholar] [CrossRef]
- Hensher, D. Bus Transport: Economics, Policy and Planning; Research in Transportation Economics; Elsevier: Oxford, UK, 2007; Volume 18, Chapter 14; pp. 259–276. [Google Scholar]
- Guo, Z. Mind the map! The impact of transit maps on path choice in public transport. Transp. Res. Part A Policy Pract. 2011, 45, 625–639. [Google Scholar] [CrossRef]
- Molander, S.; Felleson, M.; Friman, M.; Skalen, P. Market orientation in public transport research—A review. Transp. Rev. 2012, 32, 155–180. [Google Scholar] [CrossRef]
- Turkish Statistical Institute (TURKSTAT). 2017. Available online: www.turkstat.gov.tr. (accessed on 22 May 2017).
- Solomon, M. Groupthink versus “The wisdom of crowds”: The social epistemology of deliberation and dissent. South. J. Philos. 2006, 44, 28–42. [Google Scholar] [CrossRef]
Figure 1.
The process of applying AHP (Source: own).

Figure 2.
The hierarchical structure of public bus transport.


Table 1.
Judgment scale of relative importance for pairwise comparisons (Saaty’s 1–9 scale).
| Numerical Values | Verbal Scale |
|---|---|
| 1 | Equal importance of both elements |
| 3 | Moderate importance of one element over another |
| 5 | Strong importance of one element over another |
| 7 | Very strong importance of one element over another |
| 9 | Extreme importance of one element over another |
| 2, 4, 6, 8 | Intermediate values |
Table 2.
Consistency indices for a randomly generated matrix.
| n | 2 | 3 | 4 | 5 | 6 | 7 | 8 | 9 |
|---|---|---|---|---|---|---|---|---|
| RI | 0 | 0.58 | 0.9 | 1.12 | 1.24 | 1.32 | 1.41 | 1.45 |
Table 3.
Kendall’s W agreement degree scale.
| W | Interpretation |
|---|---|
| 0 | No agreement |
| 0.10 | Weak agreement |
| 0.30 | Moderate agreement |
| 0.60 | Strong agreement |
| 1 | Perfect agreement |
Table 4.
Different priority ranking of elements by evaluator groups for Level 1.
| For Passenger Side | For Non-Passenger Side | For Government Side | ||||
|---|---|---|---|---|---|---|
| 1 | Transport Quality | 0.4658 | Transport Quality | 0.3927 | Tractability | 0.5849 |
| 2 | Service Quality | 0.3743 | Tractability | 0.3541 | Transport Quality | 0.2776 |
| 3 | Tractability | 0.1599 | Service Quality | 0.2532 | Service Quality | 0.1375 |
Table 5.
Different priority ranking of elements by evaluator groups for Level 2.
| For Passenger Side | For Non-Passengers Side | For Government Side | ||||
|---|---|---|---|---|---|---|
| 1 | Safety of travel | 0.2696 | Safety of travel | 0.1817 | Perspicuity | 0.2003 |
| 2 | Physical comfort | 0.1253 | Information before travel | 0.1418 | Information before travel | 0.1945 |
| 3 | Directness | 0.0966 | Information during travel | 0.1336 | Information during travel | 0.1902 |
| 4 | Time availability | 0.0925 | Mental comfort | 0.1086 | Physical comfort | 0.1369 |
| 5 | Approachability | 0.0871 | Physical comfort | 0.1024 | Mental comfort | 0.1158 |
| 6 | Information before travel | 0.0739 | Reliability | 0.0842 | Speed | 0.0384 |
| 7 | Mental comfort | 0.0709 | Perspicuity | 0.0786 | Directness | 0.0347 |
| 8 | Reliability | 0.0685 | Directness | 0.0552 | Time availability | 0.0336 |
| 9 | Information during travel | 0.0553 | Speed | 0.0515 | Safety of travel | 0.0248 |
| 10 | Perspicuity | 0.0307 | Time availability | 0.0325 | Approachability | 0.0187 |
| 11 | Speed | 0.0296 | Approachability | 0.0298 | Reliability | 0.0121 |
Table 6.
Different priority ranking of elements by evaluator groups for Level 3.
| For Passenger Side | For Non-Passengers Side | For Government Side | ||||
|---|---|---|---|---|---|---|
| 1 | Frequency of lines | 0.0649 | Fit connection | 0.0392 | Limited time of use | 0.0260 |
| 2 | Need for transfer | 0.0604 | Time to reach stops | 0.0238 | Need for transfer | 0.0202 |
| 3 | Directness to stops | 0.0404 | Frequency of lines | 0.0213 | Journey time | 0.0160 |
| 4 | Fit connection | 0.0362 | Need for transfer | 0.0160 | Fit connection | 0.0145 |
| 5 | Limited time of use | 0.0276 | Safety stops | 0.0157 | Time to reach stops | 0.0133 |
| 6 | Safety stops | 0.0255 | Awaiting time | 0.0151 | Comfort in stop | 0.0106 |
| 7 | Comfort in stop | 0.0212 | Journey time | 0.0125 | Awaiting time | 0.0091 |
| 8 | Time to reach stops | 0.0148 | Limited time of use | 0.0112 | Frequency of lines | 0.0076 |
| 9 | Journey time | 0.0078 | Comfort in stop | 0.0093 | Safety stops | 0.0049 |
| 10 | Awaiting time | 0.007 | Directness to stops | 0.0048 | Directness to stops | 0.0033 |
Table 7.
Kendall’s coefficient of concordance (W) for Level 1.
| Criteria | Rank of Passenger Side | Rank of Non-Passenger Side | Rank of Government Side | ||
|---|---|---|---|---|---|
| Service quality | 2 | 3 | 3 | 8 | 4 |
| Transport Quality | 1 | 1 | 2 | 4 | 4 |
| Tractability | 3 | 2 | 1 | 6 | 0 |
| n = 3 | m = 3 | S = 8 | = 6 | W = 0.444 | |
Table 8.
Kendall’s coefficient of concordance (W) for Level 2.
| Criteria | Rank of Passenger Side | Rank of Non-Passenger Side | Rank of Government Side | ||
|---|---|---|---|---|---|
| Approachability | 5 | 11 | 10 | 26 | 81 |
| Directness | 3 | 8 | 7 | 18 | 0 |
| Time availability | 4 | 10 | 8 | 22 | 16 |
| Speed | 11 | 9 | 6 | 26 | 64 |
| Reliability | 8 | 6 | 11 | 25 | 49 |
| Physical comfort | 2 | 5 | 4 | 11 | 49 |
| Mental comfort | 7 | 4 | 5 | 16 | 4 |
| Safety of travel | 1 | 1 | 9 | 11 | 49 |
| Perspicuity | 10 | 7 | 1 | 18 | 0 |
| information before travel | 6 | 2 | 2 | 10 | 64 |
| Information during travel | 9 | 3 | 3 | 15 | 9 |
| n = 11 | m =3 | S =385 | = 18 | W = 0.3889 | |
Table 9.
Kendall’s coefficient of concordance (W) for Level 3.
| Criteria | Rank of Passenger Side | Rank of Non-Passenger Side | Rank of Government Side | ||
|---|---|---|---|---|---|
| Directness to stops | 3 | 10 | 10 | 23 | 42.25 |
| Safety of stops | 6 | 5 | 9 | 20 | 12.25 |
| Comfort in stops | 7 | 9 | 6 | 22 | 30.25 |
| Need of transfer | 2 | 4 | 2 | 8 | 72.25 |
| Fit connection | 4 | 1 | 4 | 9 | 56.25 |
| Frequency of lines | 1 | 3 | 8 | 12 | 20.25 |
| Limited time of use | 5 | 8 | 1 | 14 | 6.25 |
| Journey time | 9 | 7 | 3 | 19 | 6.25 |
| Awaiting time | 10 | 6 | 7 | 23 | 42.25 |
| Time to reach stops | 8 | 2 | 5 | 15 | 2.25 |
| n = 10 | m = 3 | S = 290.5 | = 16.5 | W = 0.3912 | |
Table 10.
The relative importance of each group in the public transport decision.
| Evaluator | Weight | Rank |
|---|---|---|
| Passengers | 0.2530 | 2 |
| Non-passengers | 0.1119 | 3 |
| Government | 0.6351 | 1 |
Table 11.
Overall (consensual) scores according to expert opinion.
| Level 1 | Level 2 | Level 3 | |||
|---|---|---|---|---|---|
| Supply Quality | Service Quality | Approachability | |||
| Service Quality | 0.2104 | Approachability | 0.1586 | Directness to stop | 0.2466 |
| Transport Quality | 0.3381 | Directness | 0.2498 | Safety of stops | 0.2993 |
| Tractability | 0.4515 | Time availability | 0.2320 | Comfort in stops | 0.4541 |
| Speed | 0.2201 | Directness | |||
| Reliability | 0.1395 | Need of transfer | 0.5598 | ||
| Transport Quality | Fit connection | 0.4402 | |||
| Physical comfort | 0.4104 | Time availability | |||
| Mental comfort | 0.3345 | Frequency of lines | 0.3936 | ||
| Safety of travel | 0.2551 | Limited time of us | 0.6064 | ||
| Tractability | Speed | ||||
| Perspicuity | 0.2909 | Journey time | 0.3581 | ||
| Information before travel | 0.3729 | Awaiting time | 0.2438 | ||
| Information during travel | 0.3362 | Time to reach stops | 0.3981 | ||
Table 12.
Priority ranking of elements by all groups for Level 1.
| Rank | Criteria | Final Score |
|---|---|---|
| 1 | Tractability | 0.4515 |
| 2 | Transport Quality | 0.3381 |
| 3 | Service Quality | 0.2104 |
Table 13.
Different priority ranking of elements by all groups for Level 2.
| Rank | Criteria | Final Score |
|---|---|---|
| 1 | Information before travel | 0.1684 |
| 2 | Information during travel | 0.1518 |
| 3 | Physical comfort | 0.1388 |
| 4 | Perspicuity | 0.1314 |
| 5 | Mental comfort | 0.1131 |
| 6 | Safety of travel | 0.0862 |
| 7 | Directness | 0.0526 |
| 8 | Time availability | 0.0488 |
| 9 | Speed | 0.0463 |
| 10 | Approachability | 0.0334 |
| 11 | Reliability | 0.0293 |
Table 14.
Different priority ranking of elements by all groups for Level 3.
| Rank | Criteria | Final Score |
|---|---|---|
| 1 | Limited time of use | 0.0296 |
| 2 | Need for transfer | 0.0294 |
| 3 | Fit connection | 0.0231 |
| 4 | Frequency of lines | 0.0192 |
| 5 | Time to reach stops | 0.0184 |
| 6 | Journey time | 0.0166 |
| 7 | Comfort in stop | 0.0151 |
| 8 | Awaiting time | 0.0113 |
| 9 | Safety stops | 0.0100 |
| 10 | Directness to stops | 0.0082 |
© 2018 by the authors. Licensee MDPI, Basel, Switzerland. This article is an open access article distributed under the terms and conditions of the Creative Commons Attribution (CC BY) license (http://creativecommons.org/licenses/by/4.0/).
Share and Cite
MDPI and ACS Style
Duleba, S.; Moslem, S. Sustainable Urban Transport Development with Stakeholder Participation, an AHP-Kendall Model: A Case Study for Mersin. Sustainability 2018, 10, 3647. https://doi.org/10.3390/su10103647
AMA Style
Duleba S, Moslem S. Sustainable Urban Transport Development with Stakeholder Participation, an AHP-Kendall Model: A Case Study for Mersin. Sustainability. 2018; 10(10):3647. https://doi.org/10.3390/su10103647
Chicago/Turabian StyleDuleba, Szabolcs, and Sarbast Moslem. 2018. "Sustainable Urban Transport Development with Stakeholder Participation, an AHP-Kendall Model: A Case Study for Mersin" Sustainability 10, no. 10: 3647. https://doi.org/10.3390/su10103647
Note that from the first issue of 2016, this journal uses article numbers instead of page numbers. See further details here.