1. Introduction
Antibiotics belong to a group of pharmaceuticals that have recently been excessively used, consequently leading to their accumulation in various parts of the environment, including the soil. Studies have shown that the concentration of antibiotics in the soil can range from a few nanograms to even 50 mg/kg of soil [
1,
2,
3,
4]. Antibiotics, as organic compounds, can be subjected to various processes in the soil environment, the most important of which are sorption on soil components, as well as transformation and/or degradation [
5,
6,
7,
8,
9]. Factoring in both various abiotic and biotic factors, which influence the behavior of the antibiotic in the soil, its degradation time (DT50 or half-life) may vary from less than one (e.g., amoxicillin) [
10] up to 3466 (e.g., azithromycin) days [
11]. In addition to antibiotics, bacterial strains resistant to these compounds may also enter the environment [
12,
13,
14,
15]. The consequences of such actions may be the development of antibiotic-resistant microorganisms [
16,
17,
18,
19,
20]. It has been shown that even very low concentrations of antibiotics can cause changes in the genome of microorganisms and consequently lead to the transfer of resistance genes between individual members of an exposed population of microorganisms. In addition, microorganisms naturally present in the soil can be a source of resistance genes that can be transferred to other microorganisms such as human and animal pathogens [
21,
22,
23,
24]. In addition to this effect, antibiotics belonging to different classes may adversely affect the soil microflora, possibly manifesting themselves in the change of their structure [
15,
25,
26,
27] and functionality [
6,
9,
28,
29,
30]. The consequence of these changes may be the disturbance of the soil ecosystem balance. Data on the effect of antibiotics on soil microorganisms are varied and include results related to the impact on individual species and whole populations of microorganisms obtained on the basis of biochemical and genetic indices analyses [
9,
30,
31,
32,
33].
One of the most frequently used groups of antibiotics are the second-generation cephalosporins, particularly cefuroxime (XM) [
34]. The mode of action of this antibiotic involves blocking the synthesis of the bacterial wall and is directed against a wide group of microorganisms [
35,
36,
37]. For example, the consumption of cefuroxime in many European countries reaches as much as 50% of the total consumption of cephalosporins [
34,
38,
39]. The consequence of such a high consumption of XM is its detection in wastewater and surface waters, with the highest concentration reaching 210 μg/L for wastewater from the pharmaceutical industry and hospitals around the world [
40,
41]. Considering that currently used wastewater treatment systems do not guarantee 100% removal of antibiotics, these compounds may enter the soil with the sewage sludge. However, there are no reports on concentrations of this antibiotic in the soil environment, and studies on its degradation have shown that in aerobic conditions, its elimination reached 42.8–80% in 64 days [
42]. Additionally, data on the effect of XM on soil microorganisms are limited. In our previous studies [
43], including the determination of the effect of XM and multidrug resistant
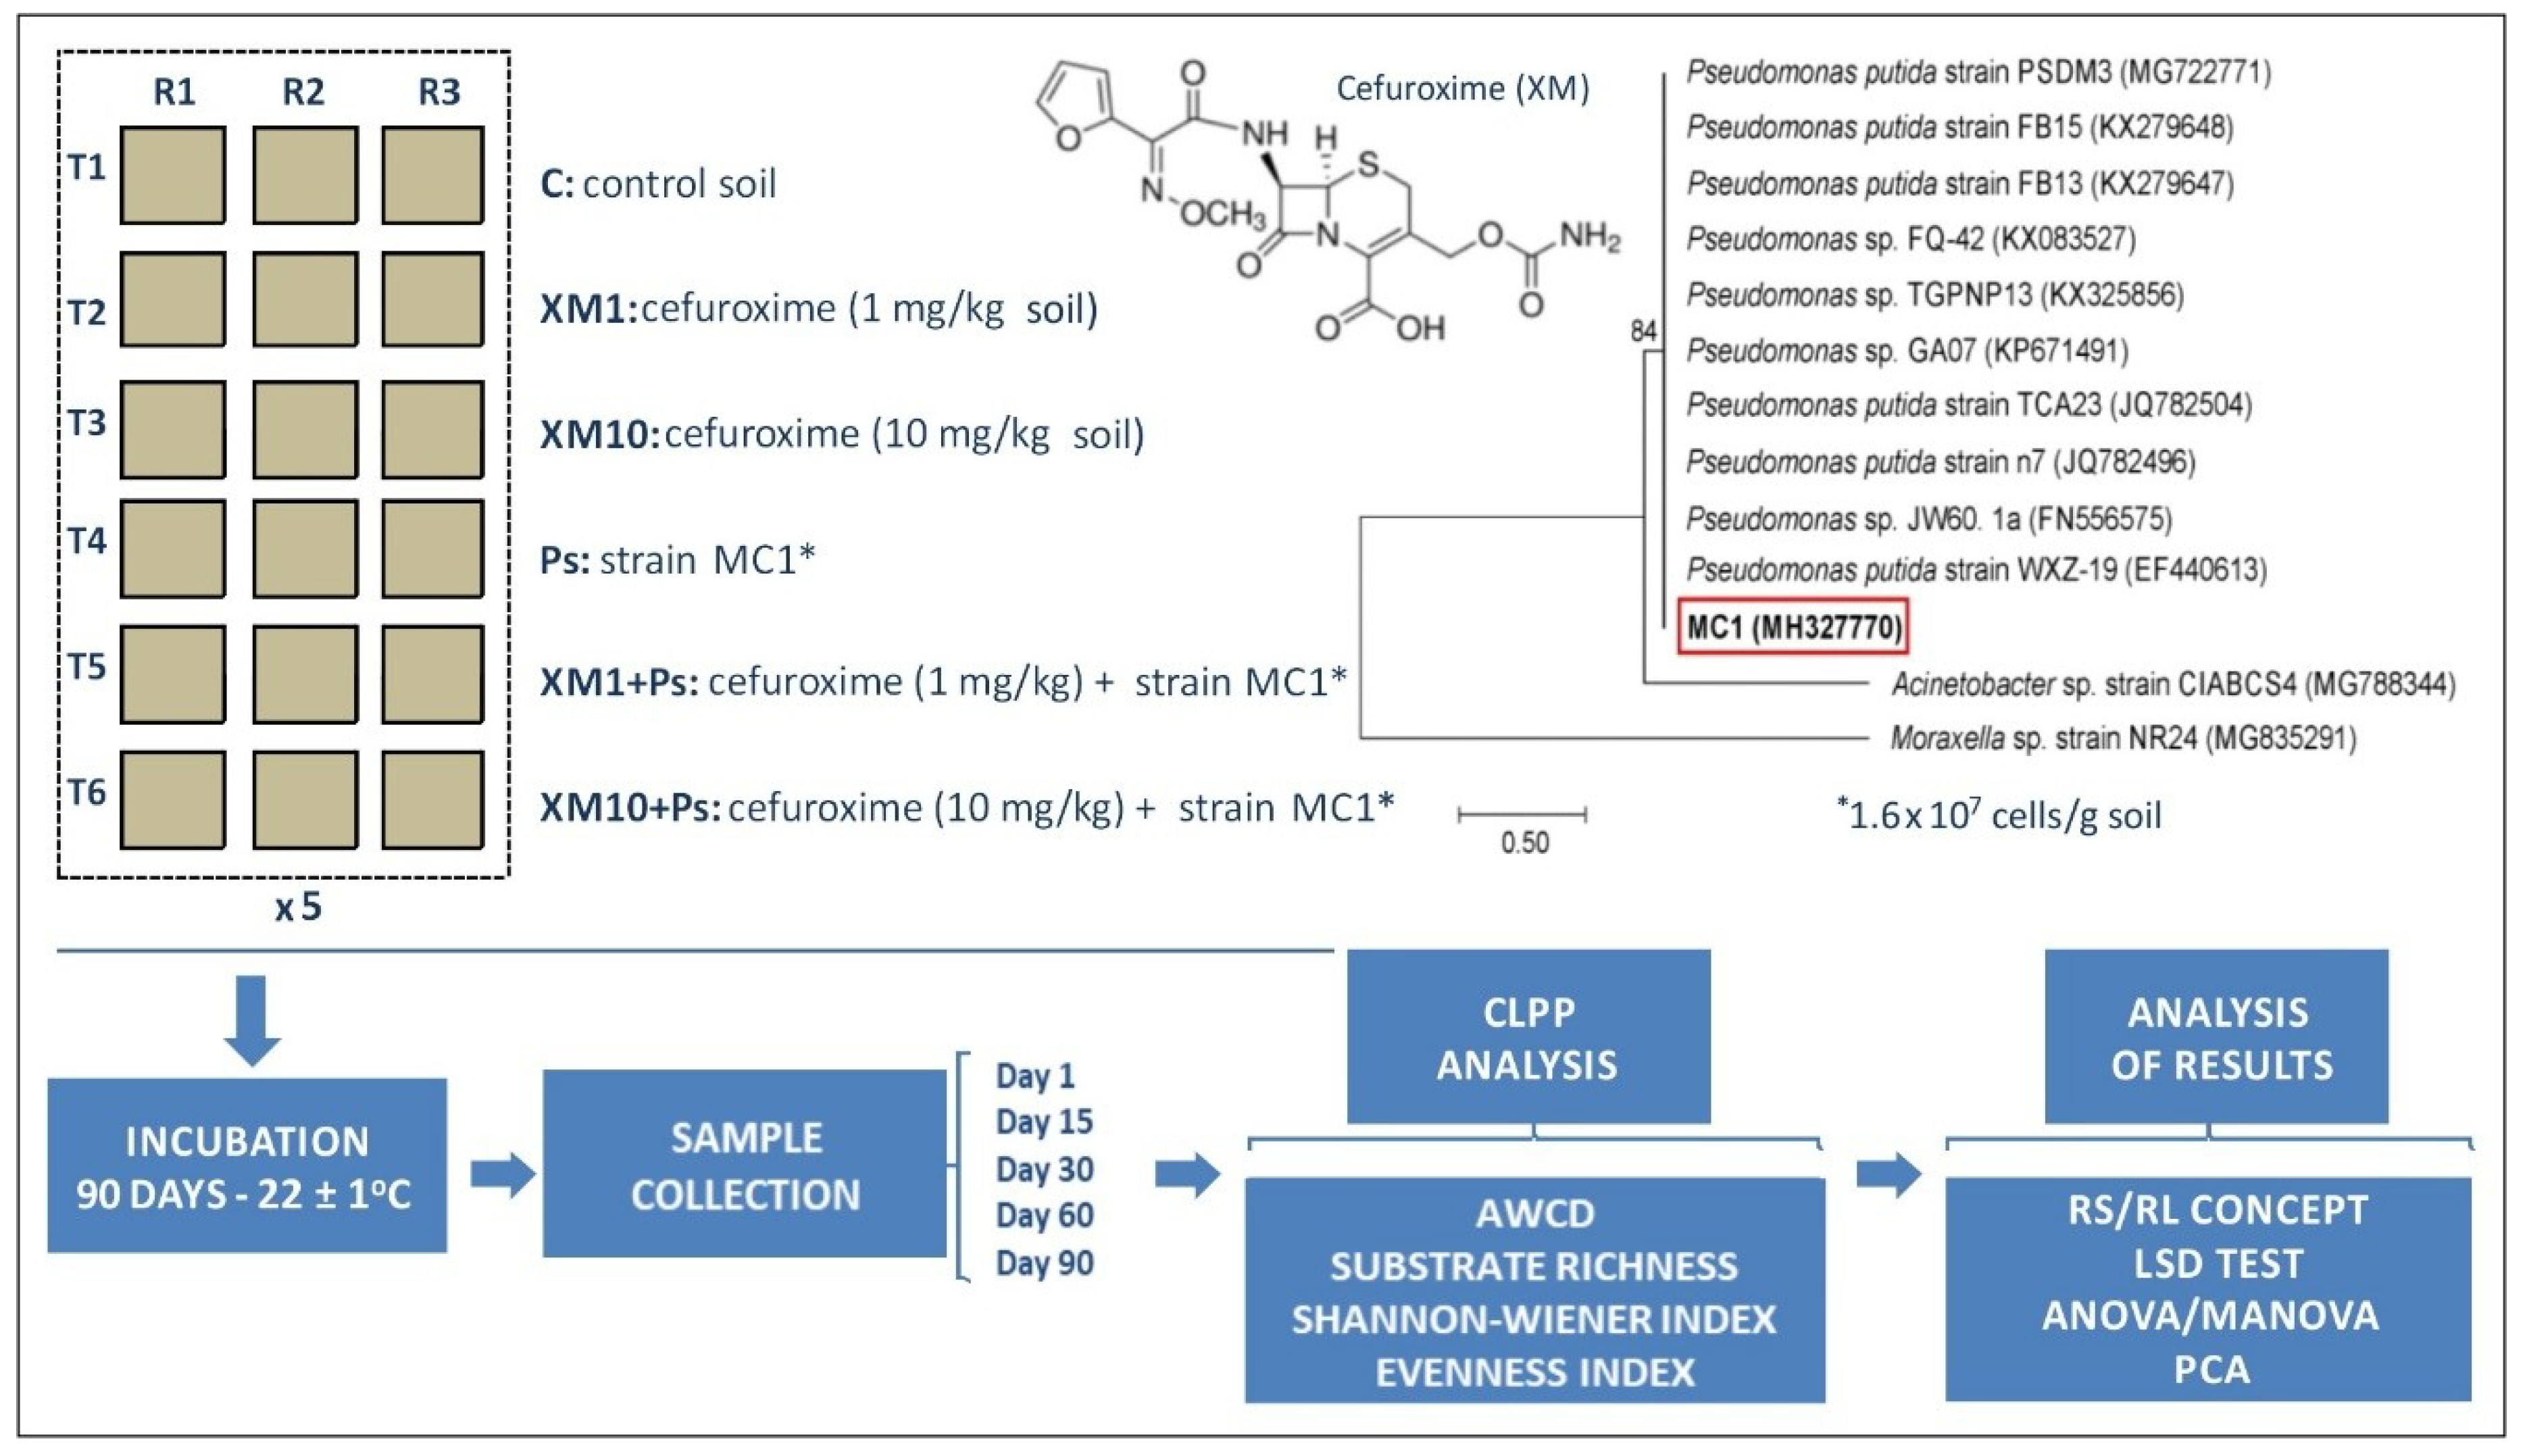
Pseudomonas putida MC1 on the soil bacterial genetic structure, the antibiotic showed a negative effect at 10 mg/kg in soil on the bacterial population analyzed, resulting in a decrease in its biodiversity after 30, 60 and 90 days from the application of antibiotics. In turn, the effect of strain MC1 on the measured biodiversity indices was not demonstrated. Use of the resistance (RS)/resilience (RL) concept during the 90-day experiment demonstrated the progressively detrimental effect of XM on the genetic structure of the soil bacteria [
43]. The changes observed in the diversity of microbial communities under the influence of XM may also be reflected in the altered functions of soil microorganisms, possibly translating into soil processes important for the ecosystem. Therefore, in this study, due to the lack of such studies, we assumed that the application of XM and/or strain MC1 to the soil may result in changes in the functional biodiversity of the soil microorganisms. To obtain this knowledge, the metabolic potential of the soil microbial community analyzed was assessed using the community-level physiological profile (CLPP) approach. In addition, the RS/RL concept and multivariate analysis were used to determine the ability of microorganisms to maintain their activity and functional diversity under the stress conditions caused by XM and/or strain MC1.
4. Discussion
Due to the significant share of microorganisms in maintaining the balance of the soil ecosystem, it is important to determine the impact of various factors on their catabolic potential. This potential may be measured by the Biolog method and EcoPlates
TM that allow for insight into the functional activity of the soil microbial community. However, some authors stated that the effects of contamination can be better evaluated by measuring the activity of some soil enzymes rather than use of Biolog EcoPlates
TM [
51]. This conclusion may be due to the fact that the Biolog technique does not take into account the activity of catabolically inactive microorganisms that exist in a dormant state or non-culturable microorganisms. Moreover, mainly fast growing microorganisms are involved in this analysis. Despite some limitations, as other studies have shown, this method can be useful to assess the functional biodiversity of soils contaminated with antibiotics [
32,
52,
53,
54]. There are no reports on the effects of XM and/or antibiotic-resistant
Pseudomonas putida on soil microbial activity. However, the results of other studies indicate that antibiotics may negatively affect the microbial activity of the soil [
9,
25,
52,
55].
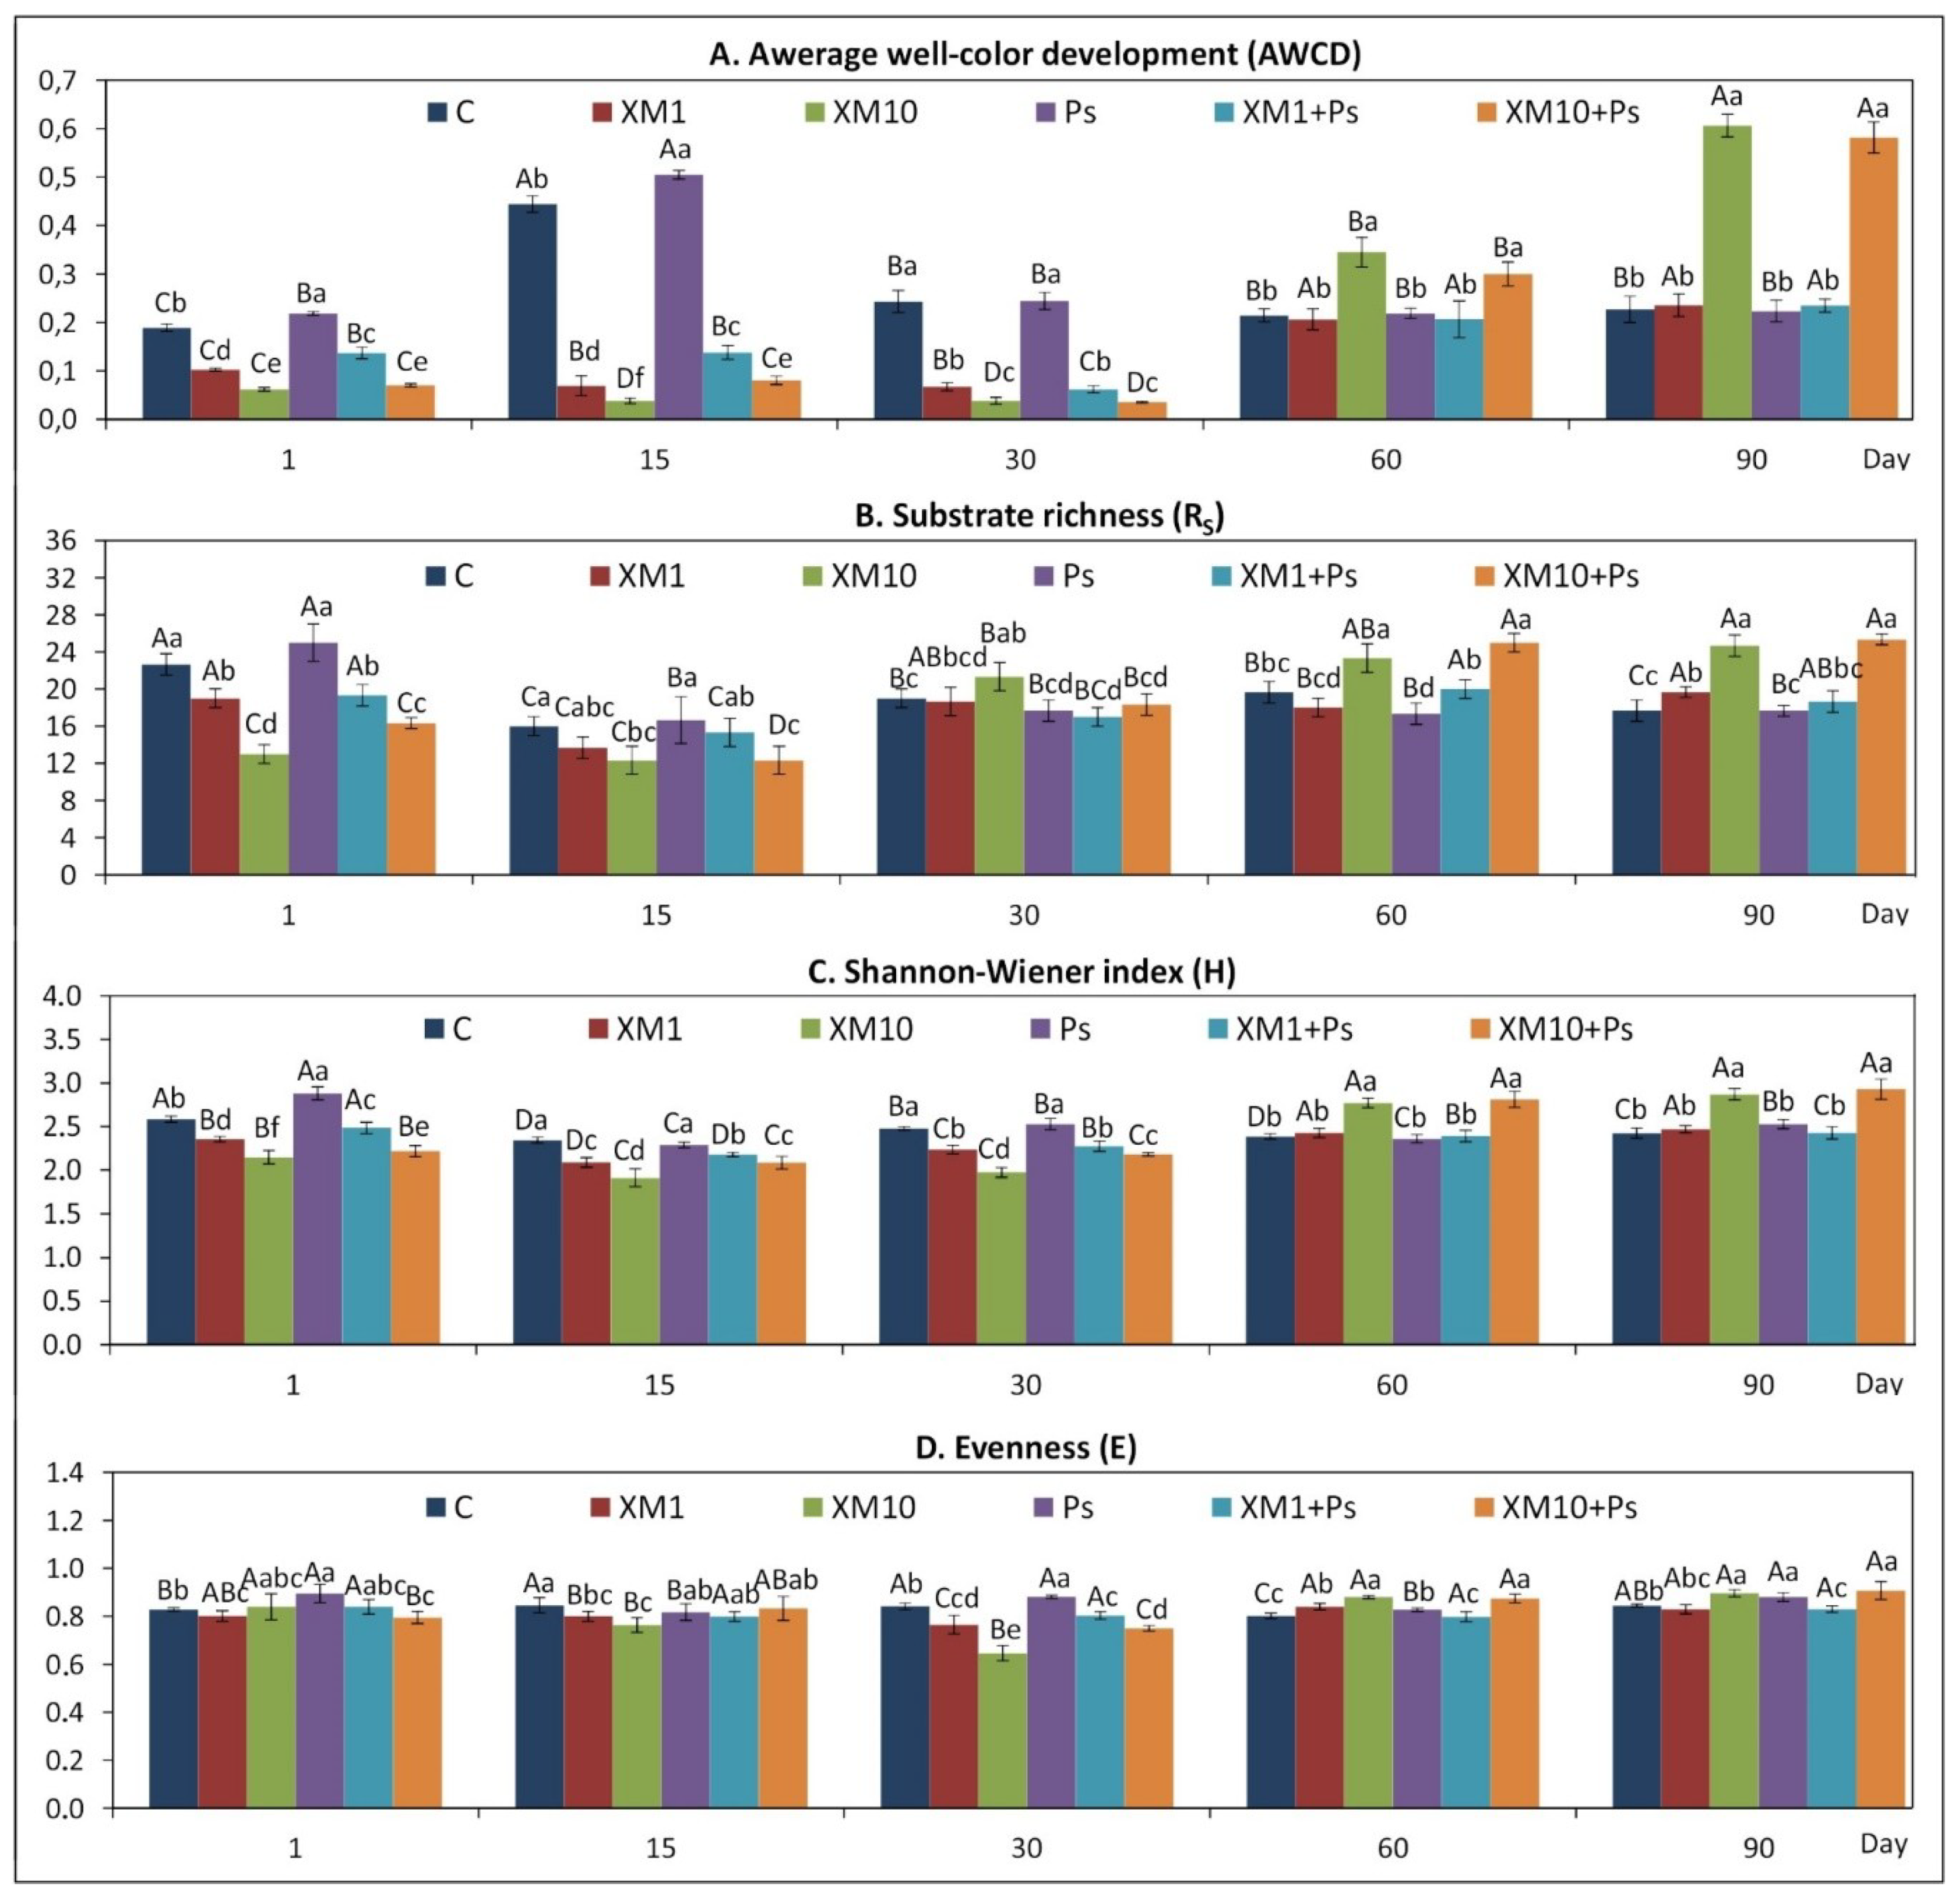
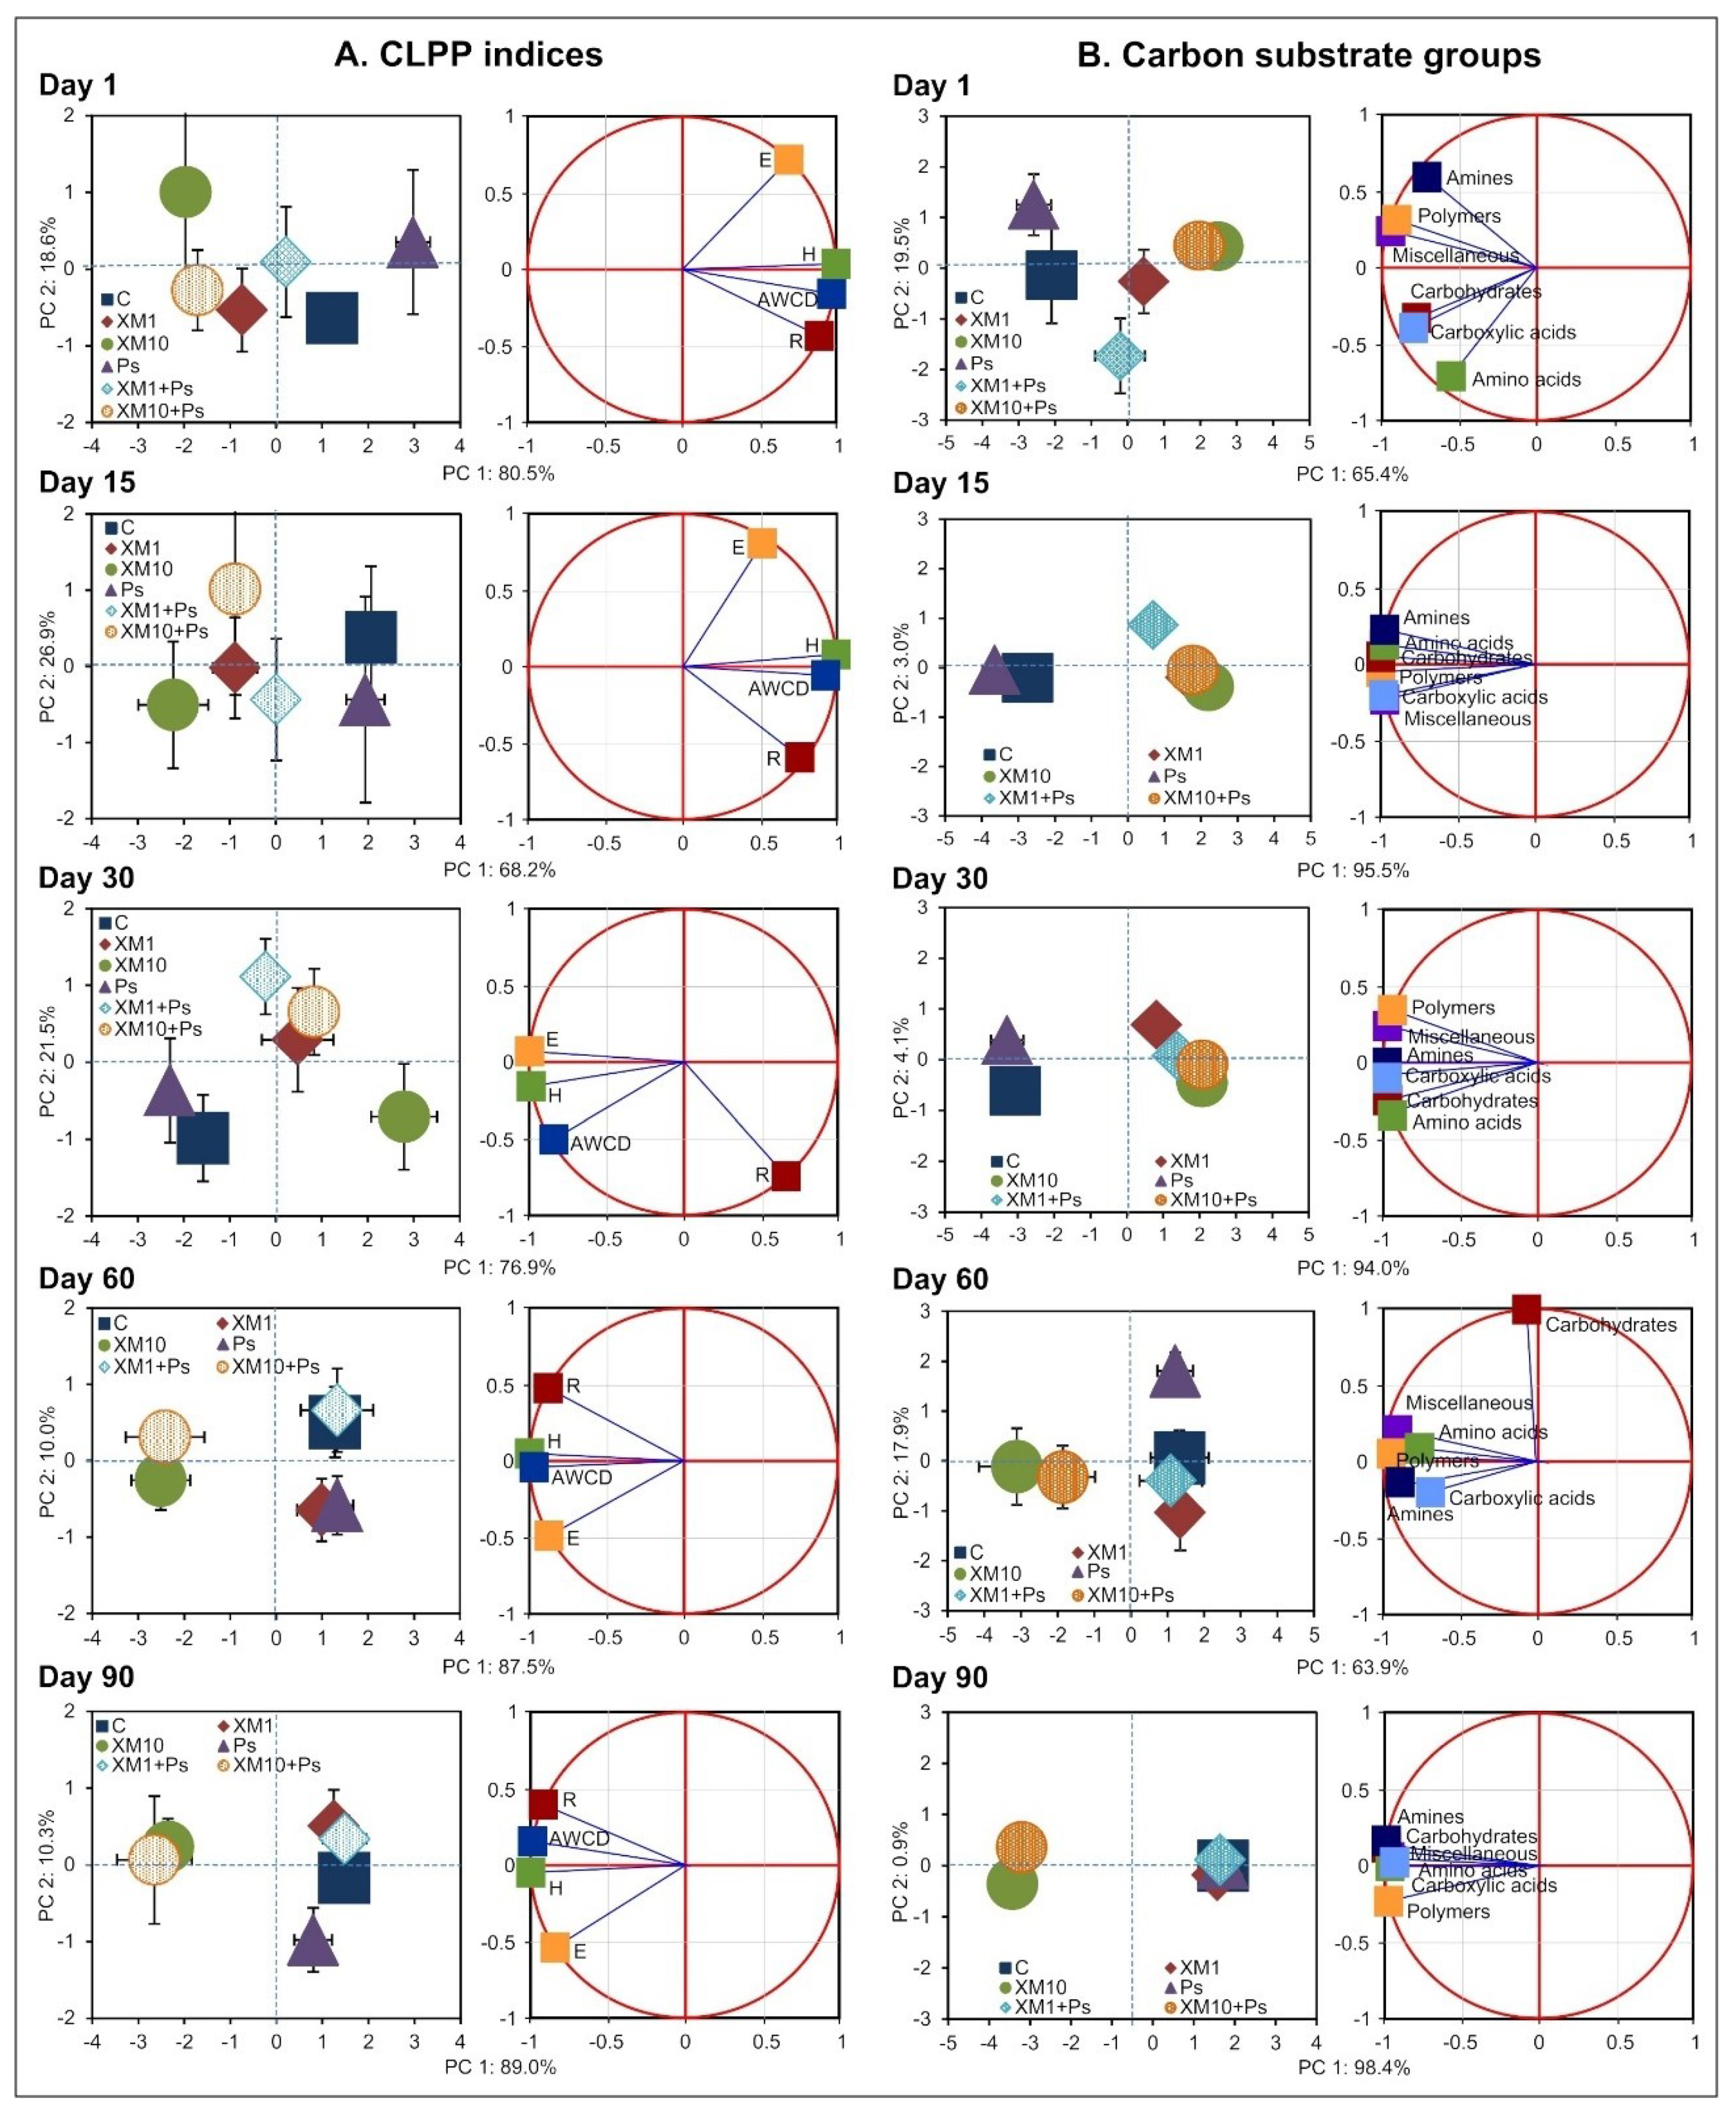
The presented study showed that the introduction of XM and/or strain MC1 to the soil caused changes in the catabolic activity of the microbial community analyzed. At both doses of the antibiotic, a decrease in the values of all the CLPP indices measured was generally observed up to 30 days. In turn, at the beginning of the experiment, the catabolic activity in the soil inoculated with the MC1 strain was higher compared to the control soil. In contrast to this effect, at the following measurement times (days 60 and 90), the values of the CLPP indices increased, particularly for the XM-treated soil (10 mg/kg) in combination with strain MC1. A short-term negative effect on the catabolic activity of soil microorganisms has also been noted for other antibiotics. For example, Fang et al. [
56] found that AWCD and functional diversity indices decreased significantly up to 35 days after chlortetracycline application. A slight reduction in the value of the H index was observed for soil treated with a gradient of oxytetracycline concentration (1–300 mg/kg in soil). In contrast, a marked decline in functional diversity and AWCD values with increasing concentrations of oxytetracycline was reported by Kong et al. [
52]. Antibiotics from the sulfonamide group, such as sulfamethoxazole and sulfamethazine, can also alter the activity of microbial populations; however, they only had short-term detrimental effects [
54,
57]. Furthermore, sulfadimethoxine or chlortetracycline did not affect the CLPP indices including AWCD, whereas other antibiotics such as monensin contributed to an increase in the value of the H index [
53].
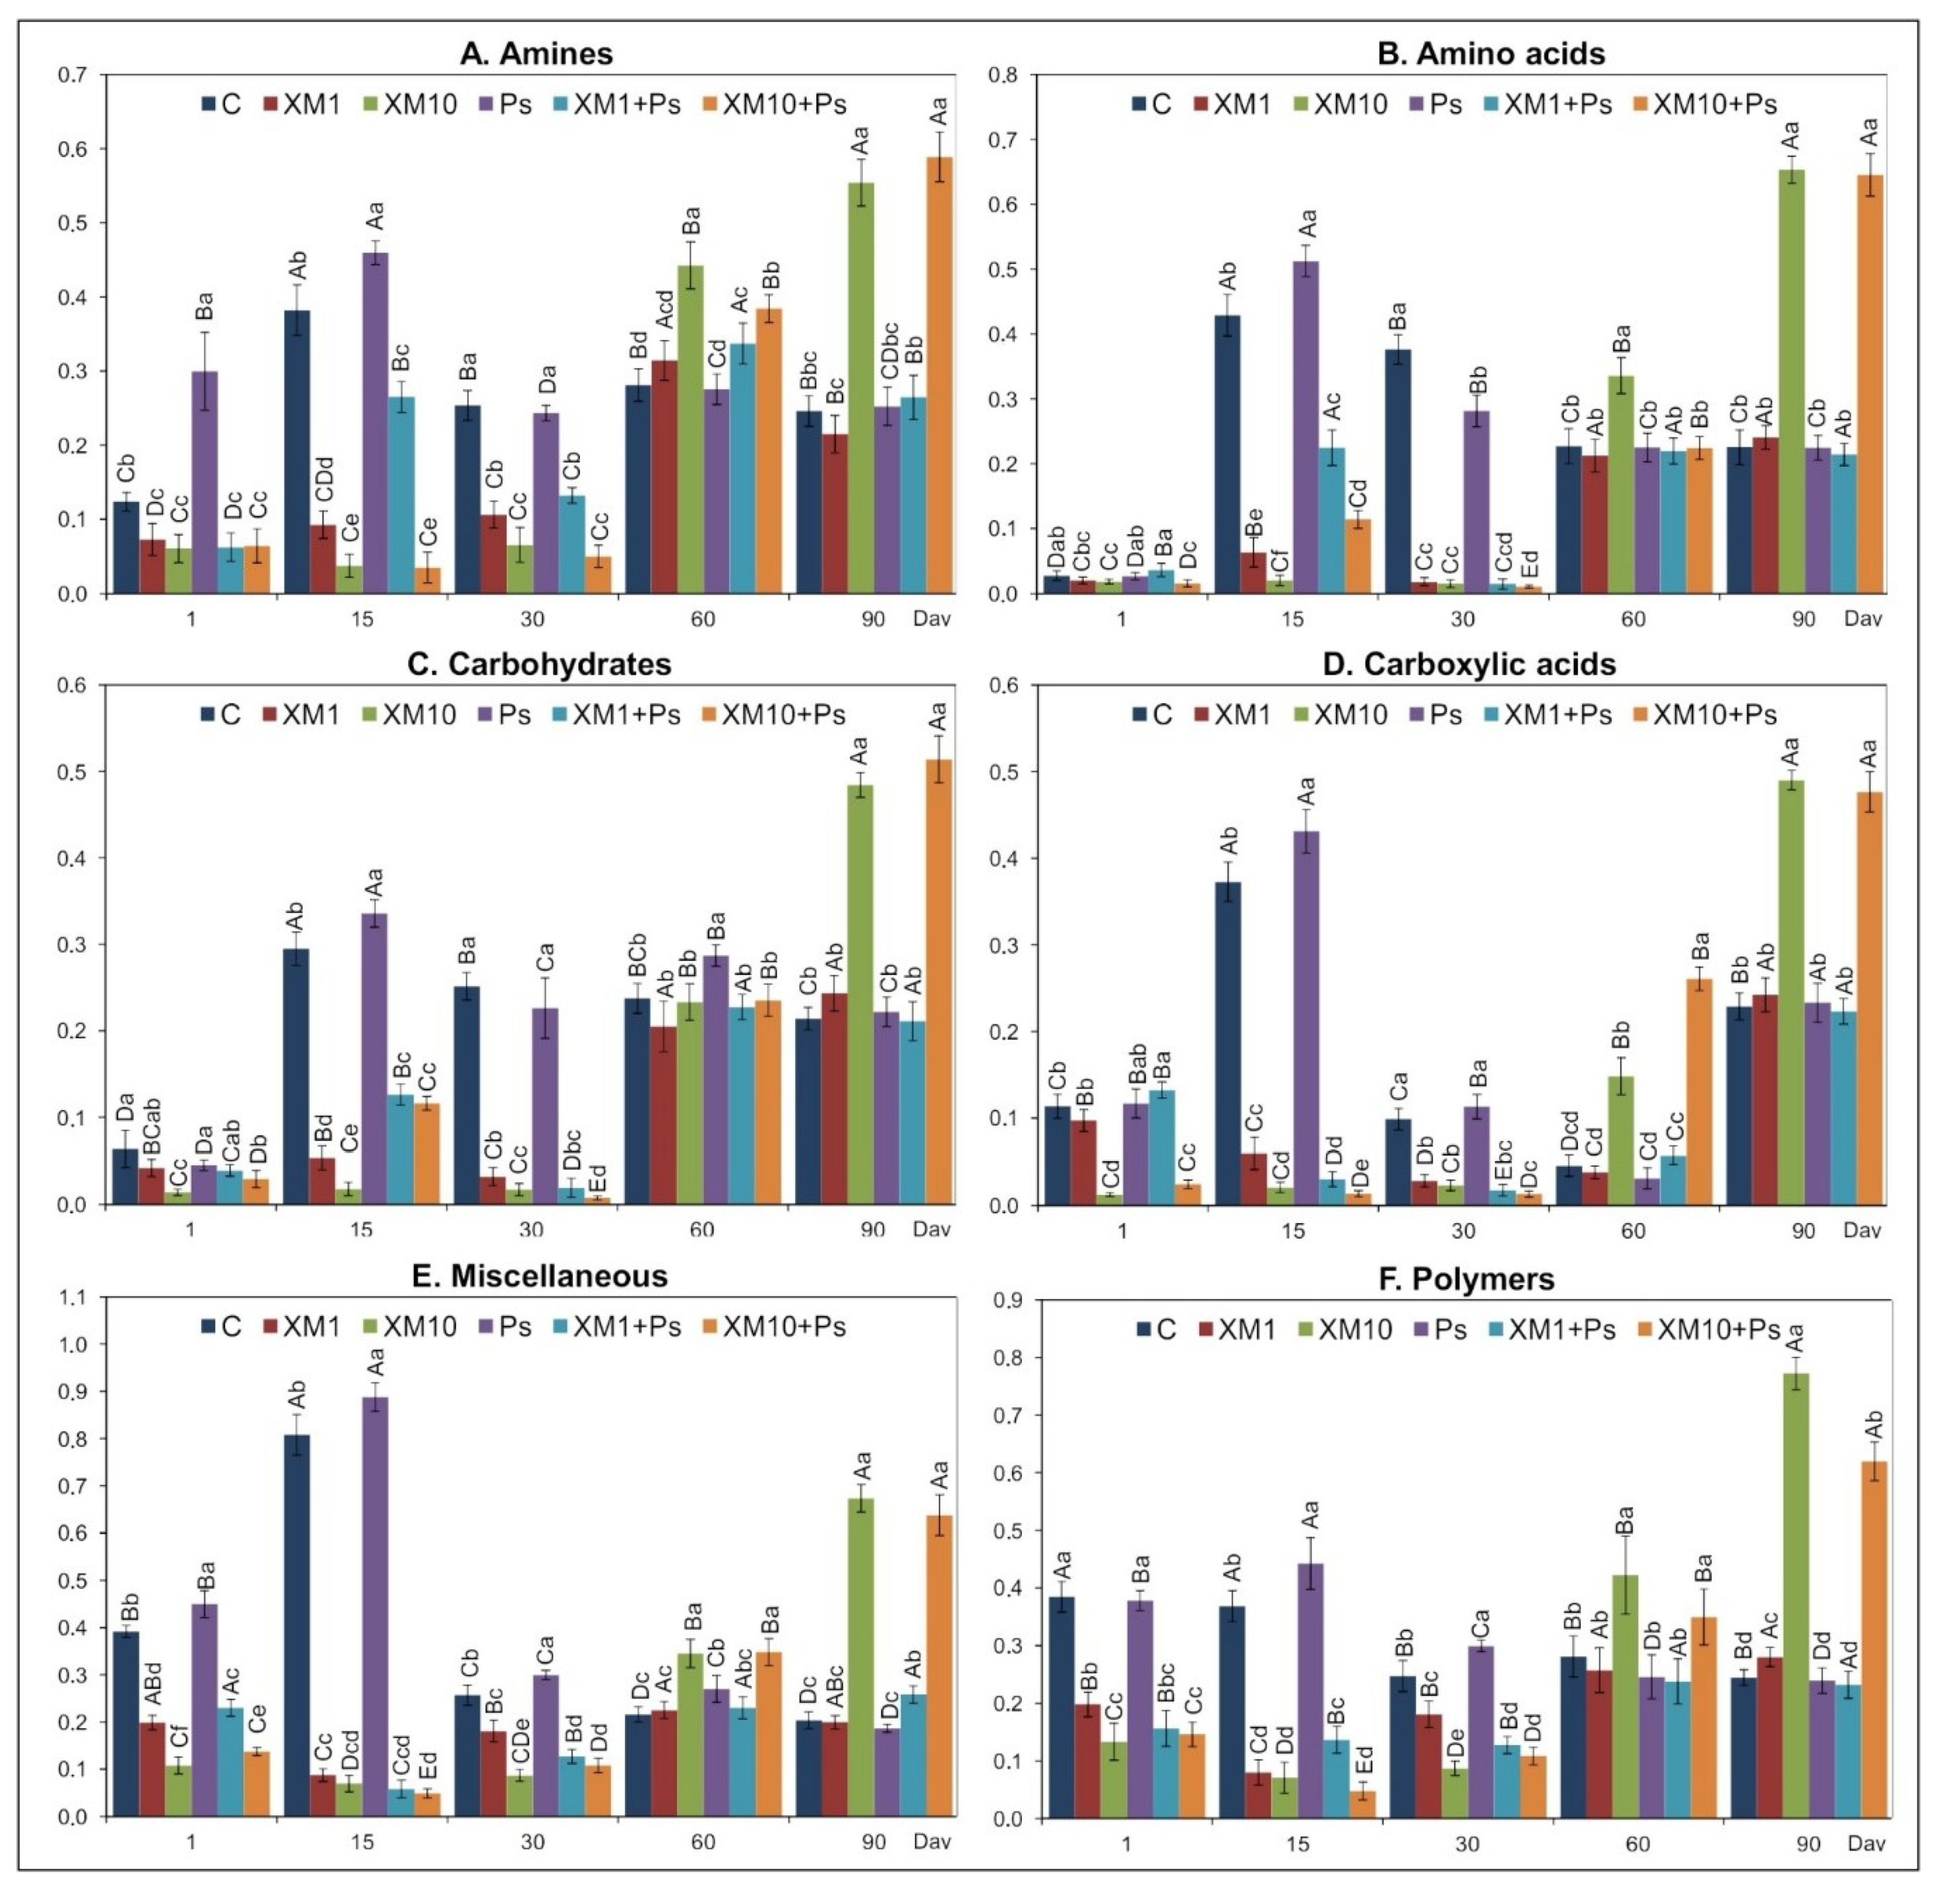
An analysis of the AWCD values showed that XM and/or strain MC1 changed the pattern of carbon substrate group utilization during the experiment. The introduction of XM at both dosages contributed to a decrease in the AWCD values for the utilization of all of the carbon substrate groups up to 30 days. In contrast, for soil inoculated only with strain MC1, the AWCD values increased up to 30 days for all the carbon substrate groups. On the following measurement days, i.e., on day 60 and 90, a significant increase in the catabolic activity of the microbial community analyzed for all of the substrate groups was observed in the XM+MC1 treatments. In many studies, changes in the preferential degradation by microorganisms of some of the substrate groups were observed over the course of an experimental period. For example, Xu et al. [
27] revealed that sulfadiazine at a higher concentration contributed to a decrease in the utilization rates of four categories of substrates (carboxylic acids, amino acids, carbohydrates, and aromatic acids). Also, Liu et al. [
58] observed a short-term decrease in the usage of carbohydrates and miscellaneous by the analyzed microbial community in soil treated with sulfamethoxazole. In contrast, the application of doxycycline generally contributed to a stimulation of the substrate utilization [
59].
In this study, it was noted that regardless of whether only XM was used alone or in combination with strain MC1, the antibiotic contributed to environmental stress conditions resulting in changes in the catabolic activity and functional diversity of the microbial community analyzed. The loss of the capability of the soil microbial community to utilize selected carbon substrates at the beginning of the experiment could be associated with the negative effect of XM on specific enzymes produced by microorganisms. Since XM is active against both Gram-positive and Gram-negative bacteria, some microorganisms could have been killed or their metabolic activity inhibited. As a consequence of this phenomenon, catabolic activity and functional diversity significantly decreased at the beginning of the experiment. However, the negative effect of the antibiotic in combination with the MC1 strain observed at the beginning of the experiment was slightly smaller compared to that observed for the soil contaminated with only XM at both dosages. This suggests that part of the negative antibiotic effect was abolished by inoculation with the MC1 strain. This is also confirmed by the results obtained for the soil only inoculated with the MC1 strain. Higher values of the parameters measured suggest that the bacterial strain introduced had the ability to survive in soil and increased the catabolic potential of the microbial community. Since the MC1 strain is resistant to many antibiotics, including cefuroxime, its activity in the soil has not been disturbed by XM and therefore a higher catabolic activity could have been observed for XM+Ps treatments in comparison with XM treatments. In addition, a higher catabolic activity for the Ps treatment could be the result of a larger starting number of microorganisms as compared to the non-inoculated control. Many studies on the degradation of organic contaminants in the soil environment showed synergy between inoculated strains and natural soil microflora, resulting in the accelerated degradation of pollutants [
60,
61,
62]. However, the lack of any effect after the introduction of bacterial strains into the soil was also observed. For example, a study by Cycoń et al. [
9] showed that the antibiotic-resistant strain of
Citrobacter freundii did not affect the catabolic activity and functional diversity of the soil microorganisms whether it was introduced alone or in combination with vancomycin. This phenomenon may be related to the survivability of the inoculants in the soil environment, which is often a foreign environment for them [
46]. Soil is a very complex ecosystem and many biotic and abiotic factors may determine the survival of the inoculants. In addition, there may be competition between the natural soil microflora and the strains of microorganisms introduced. The phenomenon of soil microorganisms producing various inhibitory substances that limit the activity of inoculants is also of great importance [
60,
63].
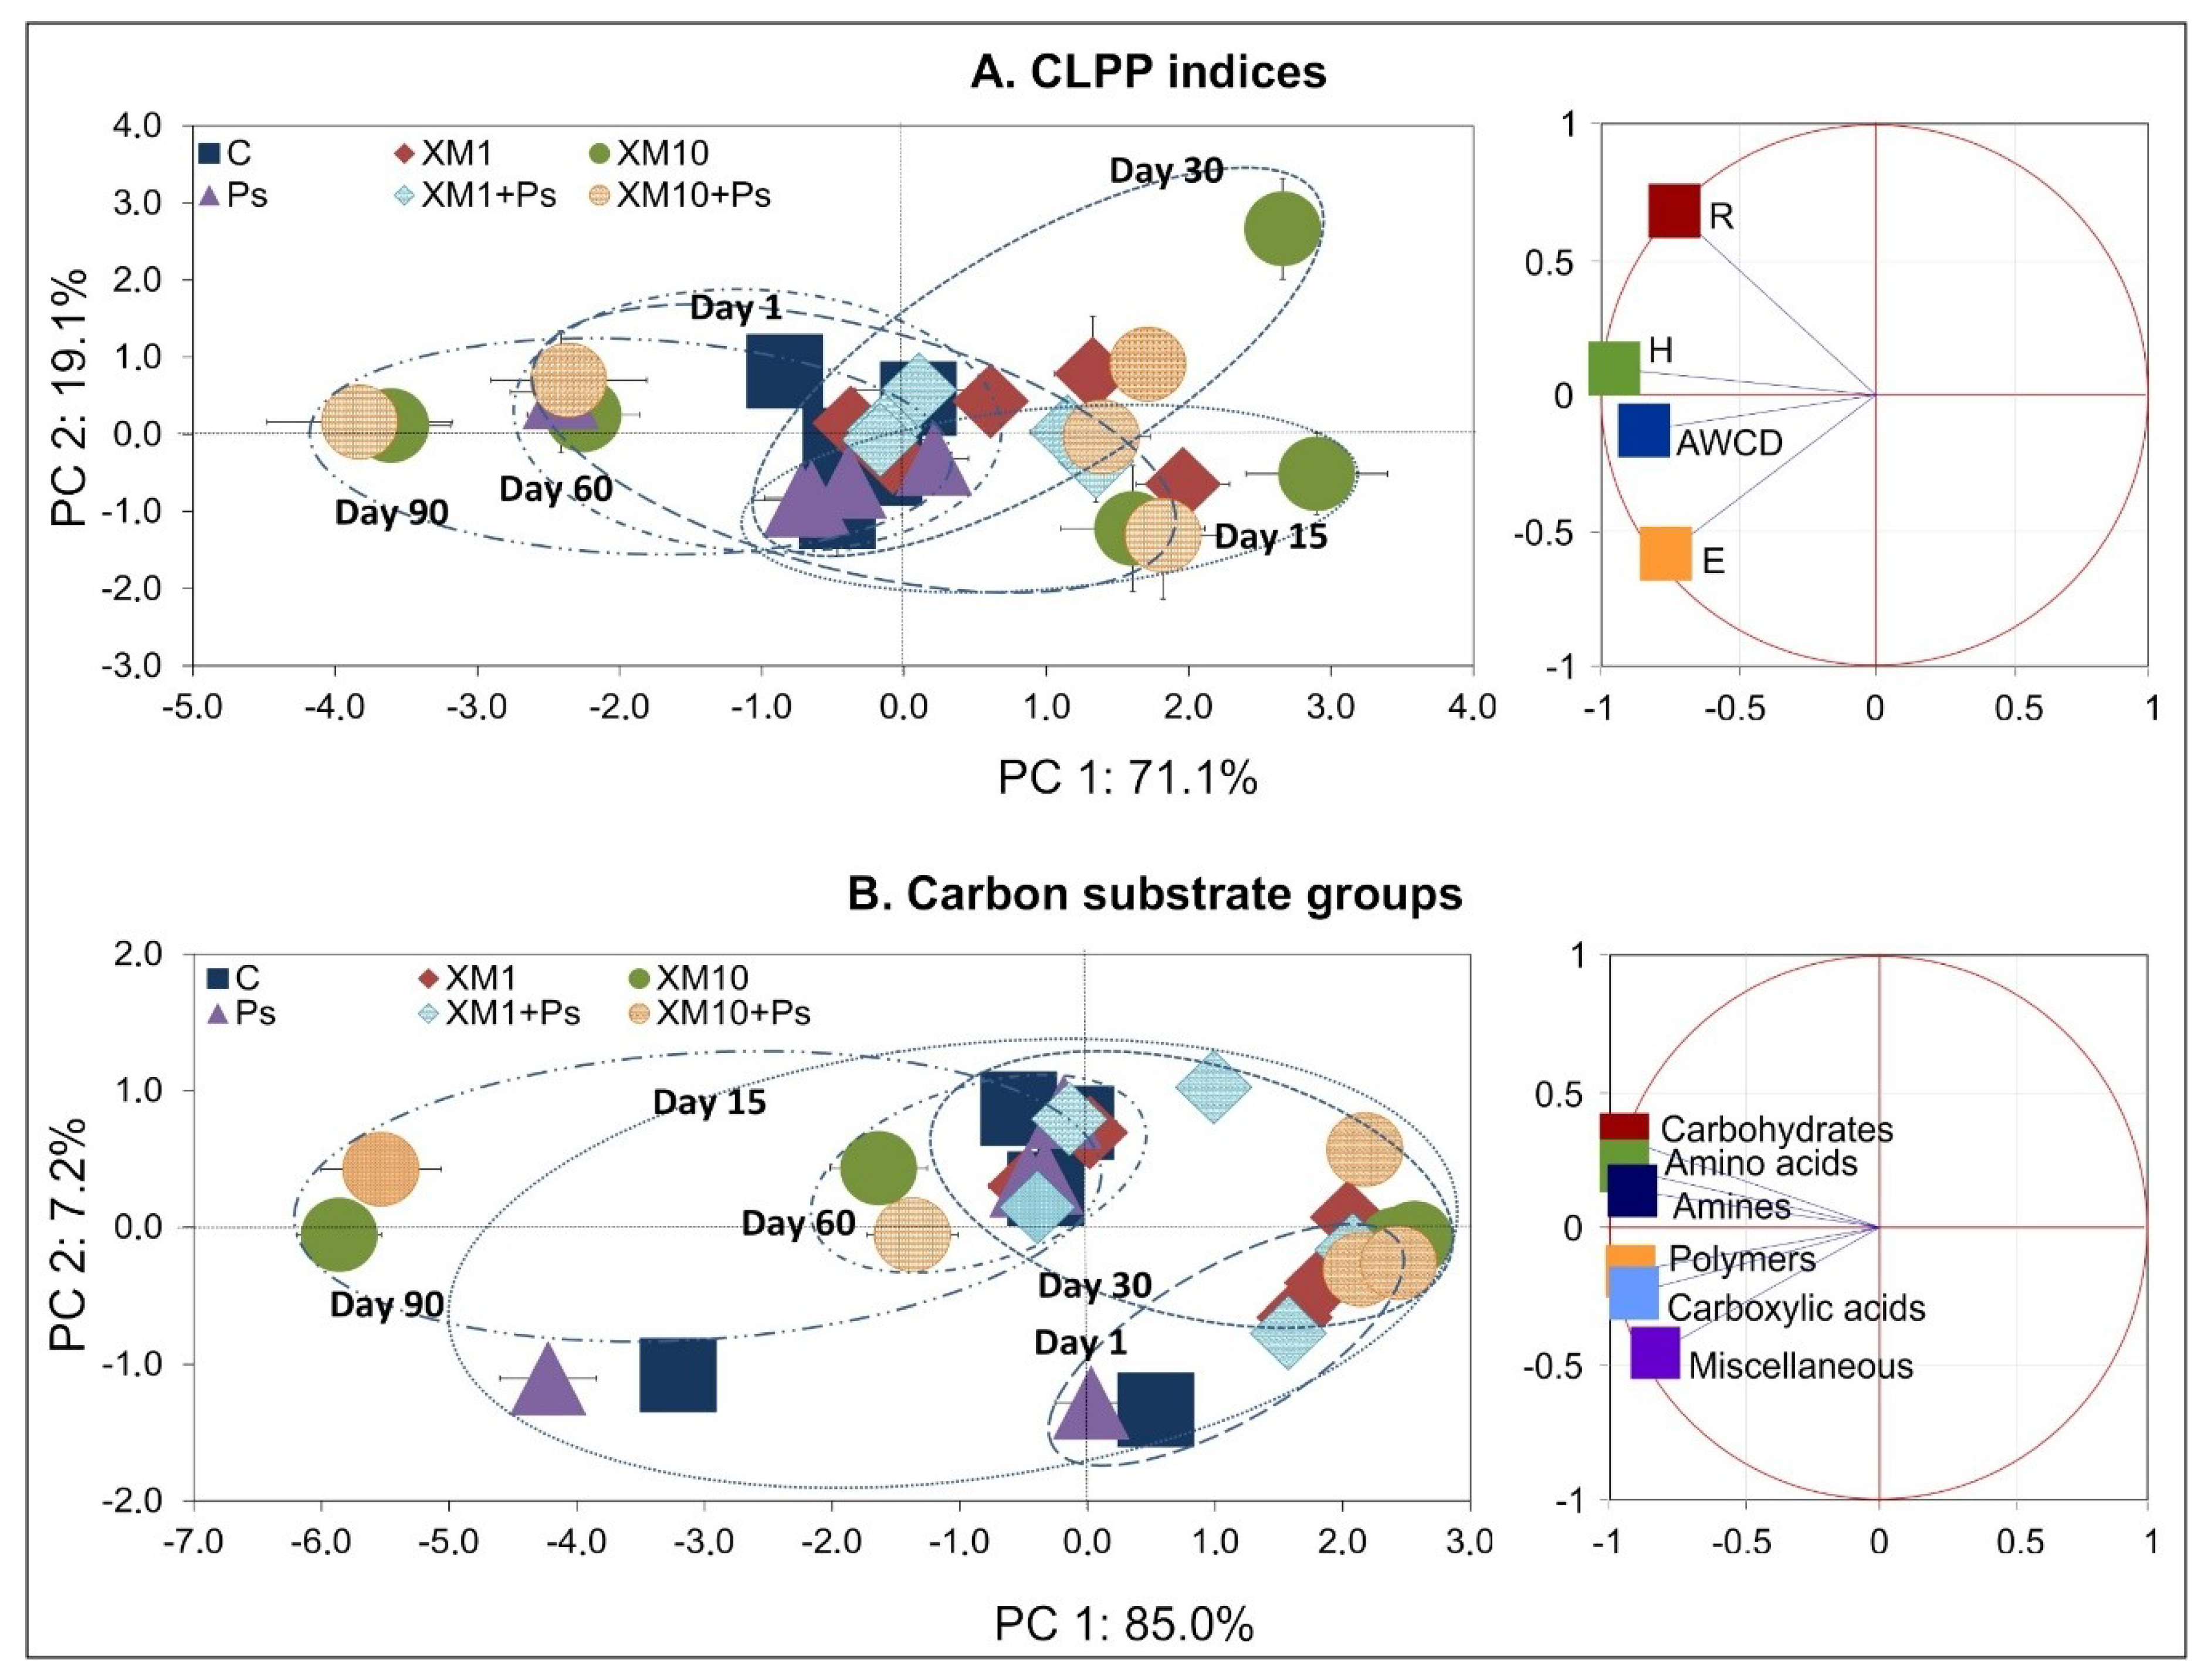
After the initial inhibition caused by XM, the values of the CLPP indices, i.e., AWCD, R, H, E and the AWCD values for the six carbon substrate groups increased over the next few sampling days. This effect could be related to the development of the ability of selected microorganisms to degrade the XM introduced into the soil and use it as a source of carbon and energy. This could result in an increase in the number of degrading microorganisms and therefore, an increase in enzyme production. Alternatively, the negative effect of XM could have been masked by the increased activity of other microorganisms capable of surviving in the presence of an antibiotic and/or using compounds released from the cells of killed microorganisms [
9,
64,
65]. The effect observed could also be related to the XM degradation in the soil. Available studies on degradation, however very scarce, have shown that XM belongs to a group of compounds with relatively low stability under soil conditions, as evidenced by the DT50 value at the level of several dozen days [
42]. In addition, the loss of the antibacterial properties of XM during the degradation in the soil could also have been of great importance.
The observed changes in the catabolic activity of the microbial community analyzed were reflected in its resistance to stress factors. Evaluation of the resistance of the CLPP indices and the metabolic activity expressed as the AWCD for the carbon substrate groups showed that the RS index was affected by XM and strain MC1. According to the interpretation proposed by Orwin and Wardle [
50], the RS and RL indices may have values between −1 and +1. A value of +1 for the RS index shows maximal resistance and that the exposure had no influence, while lower values show stronger effects (less resistance) related to either stimulation or inhibition. In the case of the RL index, a value of +1 at the sampling time shows maximal resilience, while lower values show a slower recovery rate. The results obtained generally suggest a low initial resistance of microorganisms to the introduction of XM and/or strain MC1, but they were resilient in the long term. A similar phenomenon was noted by Cycoń et al. [
9] and Baćmaga et al. [
66] who studied the effect of another antibiotic, vancomycin, and the pesticide azoxystrobin on the soil metabolic activity, respectively. Our results suggest that the properties of the microbial community are a key factor responsible for maintaining the soil balance. Despite the initial perturbations caused by stress factors, the initial balance may be restored [
67,
68,
69]. However, alternatively, there may be changes in the structure of microorganisms, but their activity related to the specific microbial process may be similar to that obtained from soil not subjected to stress factors [
37,
69,
70].

 ,
, 


