Influences of Clay Brick Particles on the Performance of Cement Stabilized Recycled Aggregate as Pavement Base


1
National Center for Materials Service Safety, University of Science and Technology Beijing, 30 Xueyuan Road, Haidian District, Beijing 100083, China
2
Beijing Key Laboratory of Transportation Engineering, Beijing University of Technology, 100 Pingleyuan, Chaoyang District, Beijing 100124, China
3
College of Metropolitan Transportation, Beijing University of Technology, 100 Pingleyuan, Chaoyang District, Beijing 100124, China
4
Department of Civil and Environmental Engineering, Virginia Tech, Blacksburg, VA 24061, USA
*
Author to whom correspondence should be addressed.
Sustainability 2018, 10(10), 3505; https://doi.org/10.3390/su10103505
Submission received: 21 August 2018
/
Revised: 18 September 2018
/
Accepted: 22 September 2018
/
Published: 30 September 2018
(This article belongs to the Special Issue Sustainable Infrastructure Materials and Systems)
Abstract
:This paper presents an investigation on the influences of clay brick particles on the performance of cement stabilized recycled aggregate as pavement base. The comparative tests of unconfined compressive strength, compressive modulus of resilience, frost resistance, scouring resistance, drying shrinkage and temperature shrinkage of 6 kinds of mixtures with different coarse and fine clay brick particle contents were carried out. Test results showed that the unconfined compressive strength of cement stabilized recycled aggregate was compromised by the clay brick particles, especially the lateral strength. The coarse clay brick particles had little influence on the compressive resilience modulus of the mixture, while the fine clay brick particles could significantly increase it. The frost resistance of the mixture increased first and then slightly decreased with the increase of the content of coarse clay brick particle, while it increased with the increase of fine particle content. The scoured mass loss increased with the increase of coarse clay brick particle content. However, it is discovered that the fine clay brick particles had almost no influences on the scoured mass loss. The addition of both coarse and fine clay brick particles could decrease the drying shrinkage of the mixture at early construction stage. The temperature shrinkage performance of the mixture was not so sensitive to the addition of clay brick particles. Generally, the cement stabilized recycled aggregate with clay brick particles could meet the requirements of the pavement base in many cases but it needs to be optimized in application with consideration of the load and climate conditions.
1. Introduction
With the fast development of urbanization in recent years, China’s construction industry has developed rapidly, resulting in a lot of problems, such as the generation of large amounts of construction waste. In China, about 1.8 billion tons of construction waste is produced every year [1]. By 2020, the amount of construction waste will even be more. Construction waste is the main source of municipal solid waste, mainly including residue, waste concrete, broken brick, waste asphalt, waste pipe, waste wood and so forth. At present, landfills or stacking are mainly used to deal with construction waste, which not only takes up large land area but also causes serious pollution.
Road construction needs a large amount of aggregate and therefore manufacturing recycled aggregate from building waste can significantly alleviate the shortage of natural aggregate resources and also help to solve the problem of building waste. There have been many researches on the application of construction waste in road by conducting the laboratory tests. Sobhan et al. [2] studied the flexural fatigue behavior of a stabilized fiber-reinforced pavement base material using recycled concrete aggregates. Chini et al. [3] evaluated the performance of recycled concrete aggregate as a base material and as an aggregate. Etxeberria et al. [4] analyzed the influence of the order of materials used in concrete production (made with recycled aggregates). Huang et al. [5] evaluated the feasibility of adding fired ware scrap, a waste ceramic material, into Portland cement concrete (PCC) and hot-mix asphalt (HMA). Thomas et al. [6], Xiao et al. [7] and Guo et al. [8] analyzed the durability properties of concrete made from recycled aggregates. It was shown that a higher recycled aggregate content and water/cement ratio can result in poor durability. Abdulla [9] evaluated the effect of recycled coarse aggregate type on concrete. The test results showed that the mechanical properties of recycled concrete were significantly affected by the original aggregate nature and quality.
Some clay brick particles are often found in the recycled aggregate of construction waste, which usually have effects on the performance of recycled aggregate. This has attracted the attention of many researchers. Chi et al. [10] studied the applicability of blending recycled concrete aggregates and crushed clay brick as subbase materials by comparing to the subbase materials prepared with natural aggregates. Chi et al. [11] also conducted an investigation on the use of recycled concrete aggregates and crushed clay brick for producing paving blocks. Khalaf [12] evaluated the possibility of using crushed clay brick as coarse aggregate for concrete manufacturing. Debieb et al. [13] tested the use of coarse and fine crushed bricks as aggregate in concrete. Bektas et al. [14] studied the effects of crushed clay brick aggregate on mortar durability. Cahim [15] conducted some tests on the mechanical properties of concrete made with crushed bricks. Syed Ishtiaq et al. [16] conducted a comprehensive testing program to study the effect of crushed clay bricks as coarse aggregate on the creep behavior of concrete. Kenai et al. [17] tested the durability performance of recycled concretes using coarse and fine crushed bricks. Yang et al. [18] conducted a study on the physical and mechanical properties of concrete with recycled concrete aggregate and crushed clay bricks. Ahmad et al. [19] investigated the creep behavior of normal strength concrete made from crushed clay bricks as coarse aggregate. Afshinnia et al. [20] studied the effect of ground clay brick on mitigating the alkali silica reaction in mortar bars. For pavement base materials evaluation, there have also been many research, like evaluation of erosion process in Rigid Pavement [21], performance evaluation of cement stabilized crushed stone pavement base materials [22], mix design of semi-rigid base material [23] and so forth.
Although there has been significant progress on the evaluation of mechanical properties of mixtures with recycled aggregate and crushed clay bricks like strength, stiffness, shrinkage and so forth., there still lacks sufficient research on some of the other performances like anti-freezing and anti-scouring performances. In this study, based on cement stabilized recycled aggregate pavement base, the effects of clay brick particles on the performance of cement stabilized recycled aggregate as pavement base were investigated by conducting the unconfined compressive strength, compressive resilience modulus, anti-freezing, anti-scouring, drying shrinkage and temperature shrinkage tests of 6 kinds of mixtures with different contents of coarse and fine clay brick particles. The test results could provide a reference for future application of cement stabilized recycled aggregate as pavement base.
2. Raw Materials and Tests
2.1. Raw Materials
The cement used in this study is the 32.5R composite Portland cement. The recycled aggregates are divided into recycled concrete aggregate (RCA) and recycled concrete and clay brick aggregate (RCBA). The RCBA can be divided into coarse (CRCBA) and fine (FRCBA), as shown in Figure 1. The RCA are divided into types of 10 mm–25 mm (10–25), 5 mm–10 mm (5–10) and 0 mm–3 mm (0–3) according to their particle size, as shown in Figure 2.
According to the “Test Methods of Aggregate for Highway Engineering (JTG E42-2005)” [24], the technical indexes and grain grading range of the RCA and RCBA were measured and tested, where the results are shown in Table 1 and Table 2. In Table 1, crushing value is the percentage by weight of the crushed material obtained when the test aggregates are applied under a given load.
According to the technical guideline JTG/T F20-2015 [25], the maximum crushing value accepted by the highest level requirements is 22%. So, the RAC can meet the requirements of all grade highways as base and subbase materials. The RCBA could meet the requirements of grade 2 and below highways as class I base and subbase materials, for which up to 35% and 40% crushing values are acceptable respectively. The components of CRCBA and FRCBA are shown in Table 3 and Table 4 respectively. For FRCBA, since the fine particles were too small to be sorted, only particles larger than 2.36 mm were sorted in the experiments. And the proportion of components in the particles larger than 2.36 mm was used as the representative values for all FRCBA.
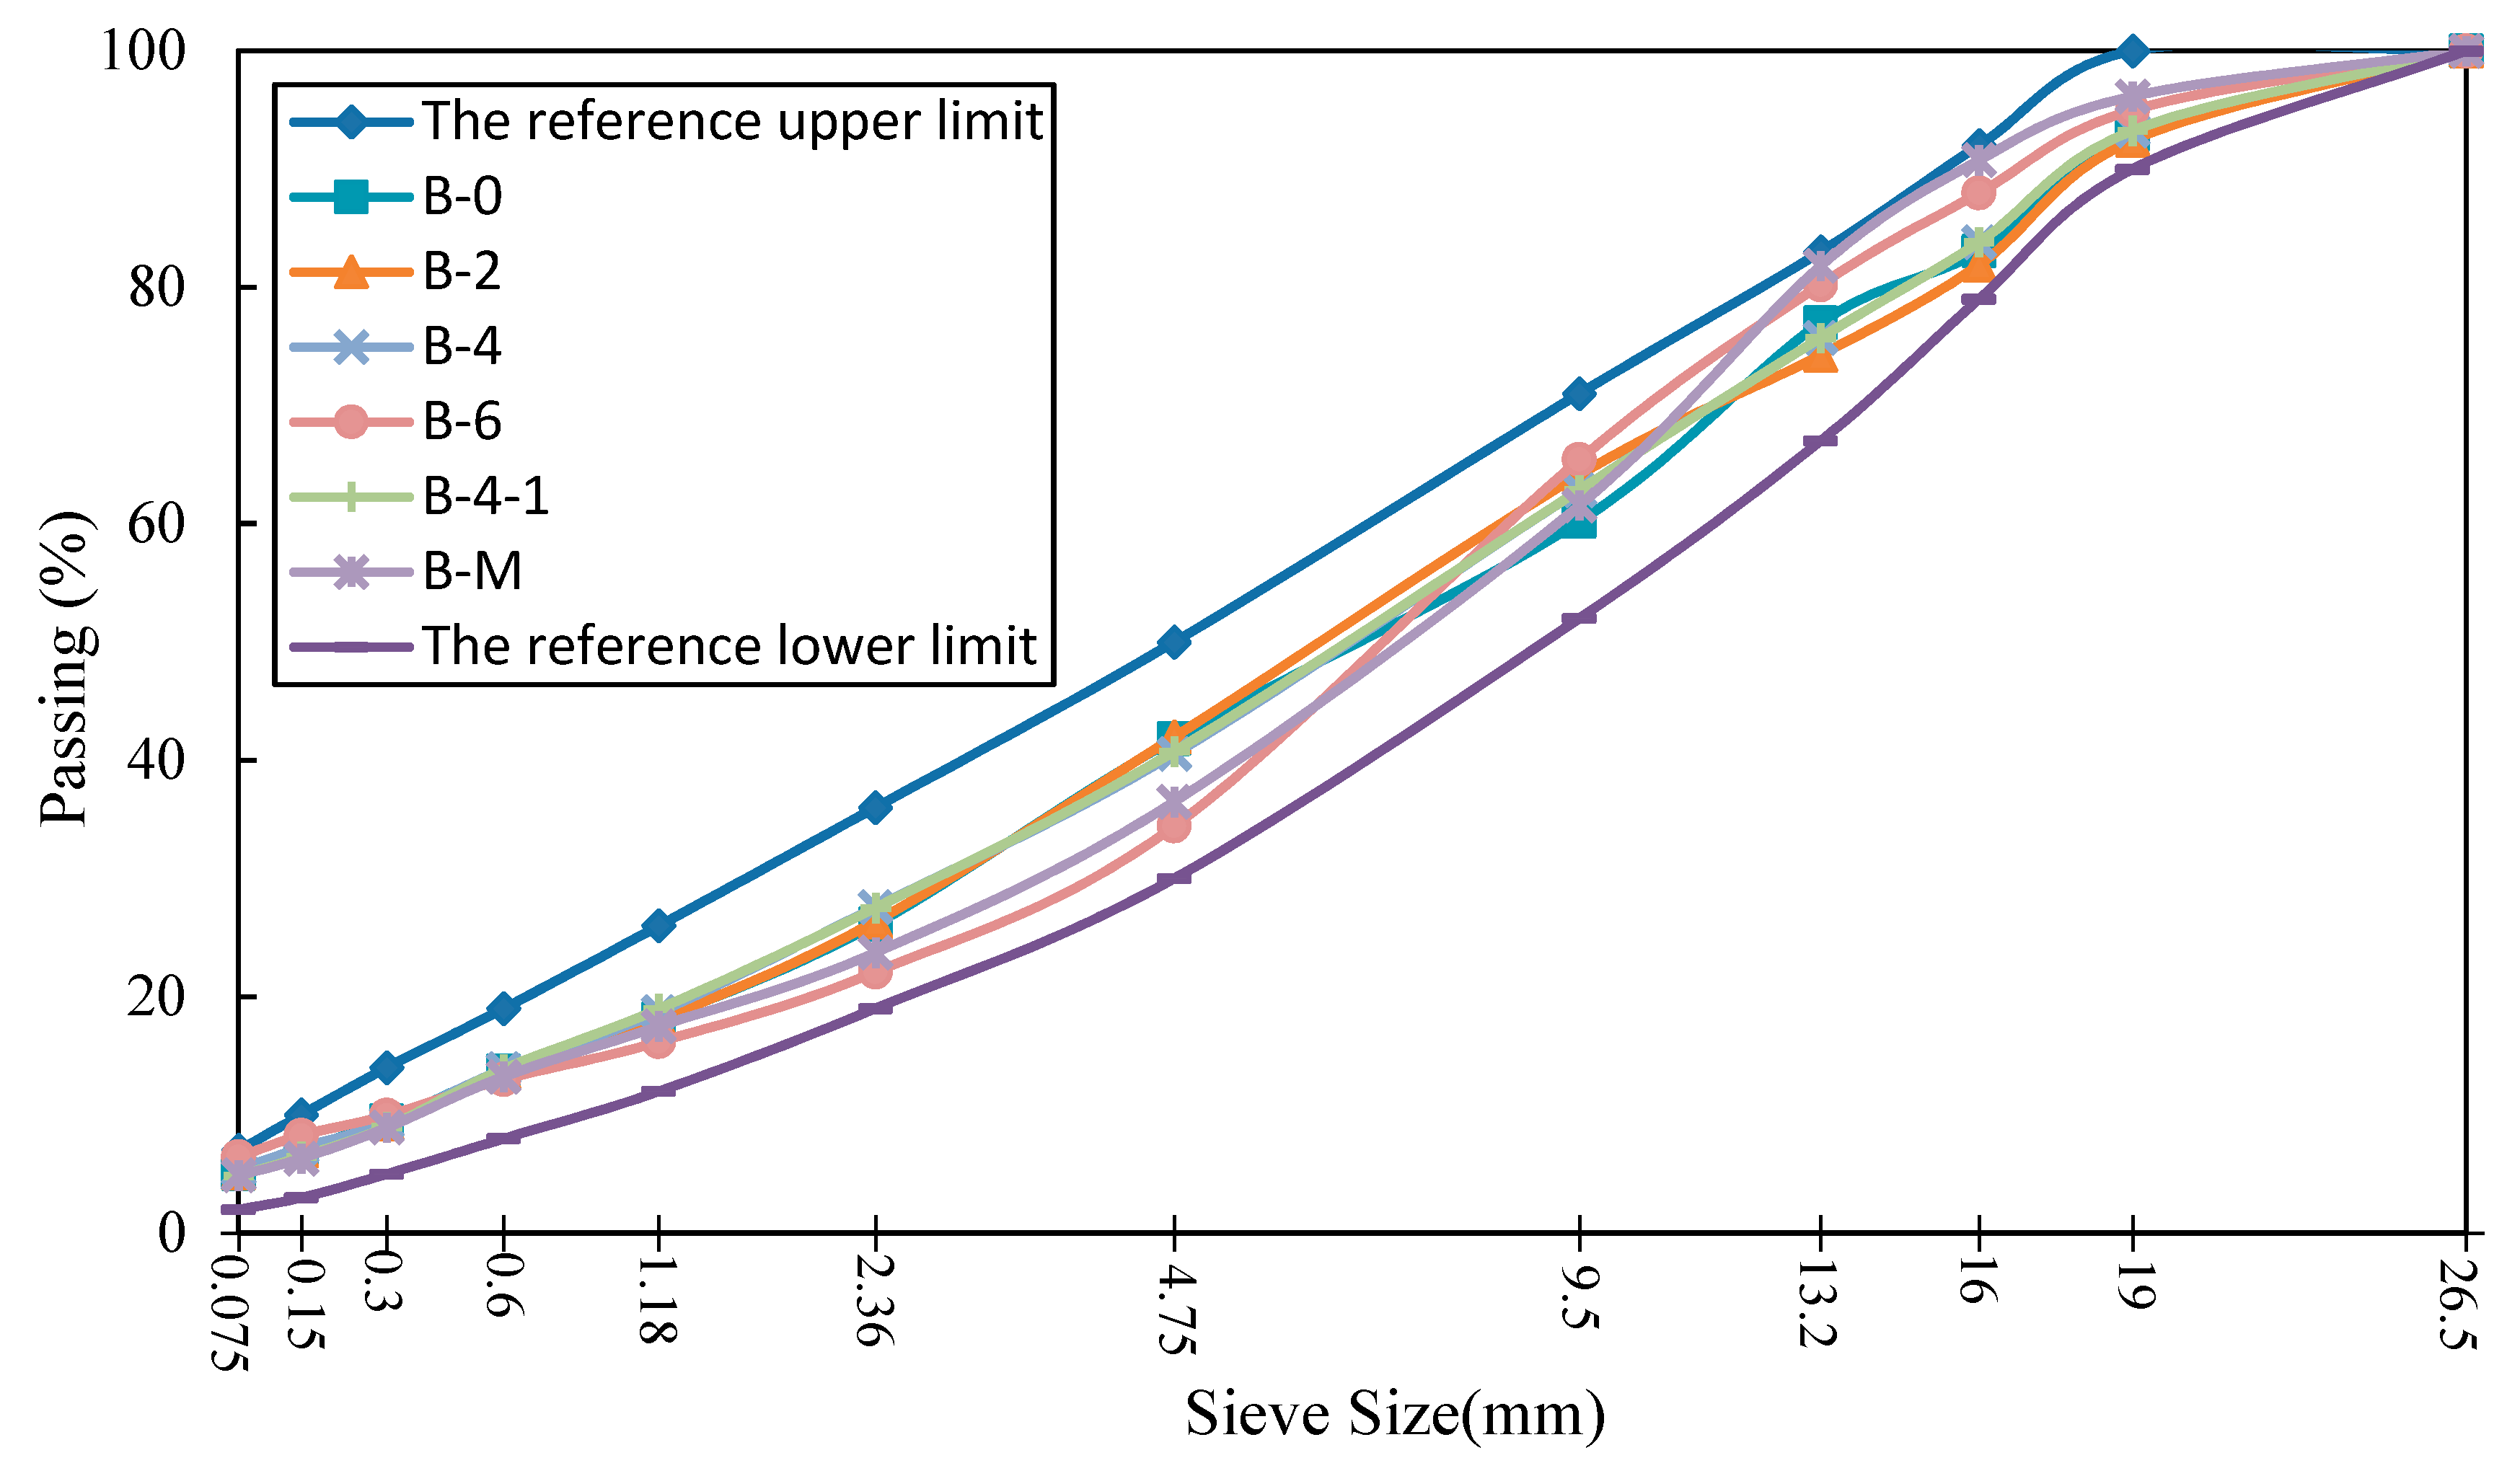
According to the C-C-3 grading range for cement stabilized materials (CSM) proposed by JTG/T F20-2015, 6 kinds of CSM with various CRCBA and FRCBA contents were designed to study its performance and the influences of the clay brick particles. Table 5 shows the composition of each CSM. Table 6 lists the content of brick particles of each CSM. Figure 3 depicts the gradations of the 6 kinds of CSM. A 5% cement dosage was used for all CSMs for eliminating the influence of cement dosage.
2.2. Test Methods
First of all, the compaction tests were carried out according to the T0804-1994 test method in JTG E51-2009 (Test Methods of Materials Stabilized with Inorganic Binder for Highway Engineering) [26] regulation to determine the optimum water content and maximum dry density, which were as shown in Table 7. Then the unconfined compressive strength test, compressive resilient modulus test, freeze-thaw test, anti-scouring test, and shrinkage test were carried out.
2.2.1. Unconfined Compressive Strength Test
The unconfined compressive strength test was conducted based on the T0805-1994 test method in JTG/T F20-2015 regulation. The specimen was a cylinder with a height of 150 mm and a diameter of 150 mm and the static pressure method was used to form the specimen with a 98% compaction degree. Figure 4 presents the specimens with mold and unconfined compression strength test. Two specimen groups were used, where each group had 9 specimens. According to the JTG E51-2009 regulation, 7d and 28d curing were conducted respectively at standard temperature of 20 °C ± 2 °C, relative humidity above 95% and saturated status for 24 h at the last day. Then the loading rate of 1 mm/min was applied to carry on the unconfined compressive strength test and the maximum pressure was recorded when the specimen was destroyed. Based on the requirements of E51-2009 [26], the representative value of unconfined compressive strength with 95% guarantee rate was selected as the result of each CSM, which was calculated in accordance with Equation (1)
where —average unconfined compressive strength of all specimens (MPa); S—standard error.
2.2.2. Compressive Resilient Modulus Test Method
The compressive resilience modulus test was performed referred to the T0808-1994 test method in JTG E51-2009 regulation and a servo hydraulic multi-functional material test system (UTM-100) produced by IPC company was used to carry out the test, as shown in Figure 5. The specimen was a cylinder with a height of 100 mm and a diameter of 100 mm, which was molded by static pressure method. Nine specimens were prepared for parallel experiments to ensure the reliability of the experimental results. 90d curing was conducted at standard temperature of 20 °C ± 2 °C, relative humidity above 95% and saturated status for 24 h at the last day. The compressive resilient modulus test was carried out by loading and unloading at seven levels: 0.1 MPa, 0.2 MPa, 0.3 MPa, 0.4 MPa, 0.5 MPa, 0.6 MPa and 0.7 MPa. The pre-loading was applied up to 0.3 MPa at the rate of 1 mm/min and maintained for 1 min. Then it was unloaded. After unloading for 1 min, the second pre-loading was applied. After 2 pre-loadings, loading and unloading according to the predetermined 7 load levels were applied as the following procedure: apply the load at first loading level and record the displacement sensor readings after the stable pressure for 1 min; after unloading for 0.5 min, record the displacement sensor readings again; record the displacement sensor readings after applying the second loading level; record the displacement sensor readings after 1 min and record the displacement sensor readings again after unloading for 0.5 min and so on, until the final loading and unloading tests are completed. The average of all load levels was considered as the result of the compressive resilience modulus () of each specimen. And the representative value of modulus of compressive resilience with 95% guarantee rate () was selected as the result of each CSM, which was calculated in accordance with Equation (2)
where ()—average compressive resilience modulus of all specimens (MPa); S—standard error.
2.2.3. Freeze-thaw Test Method
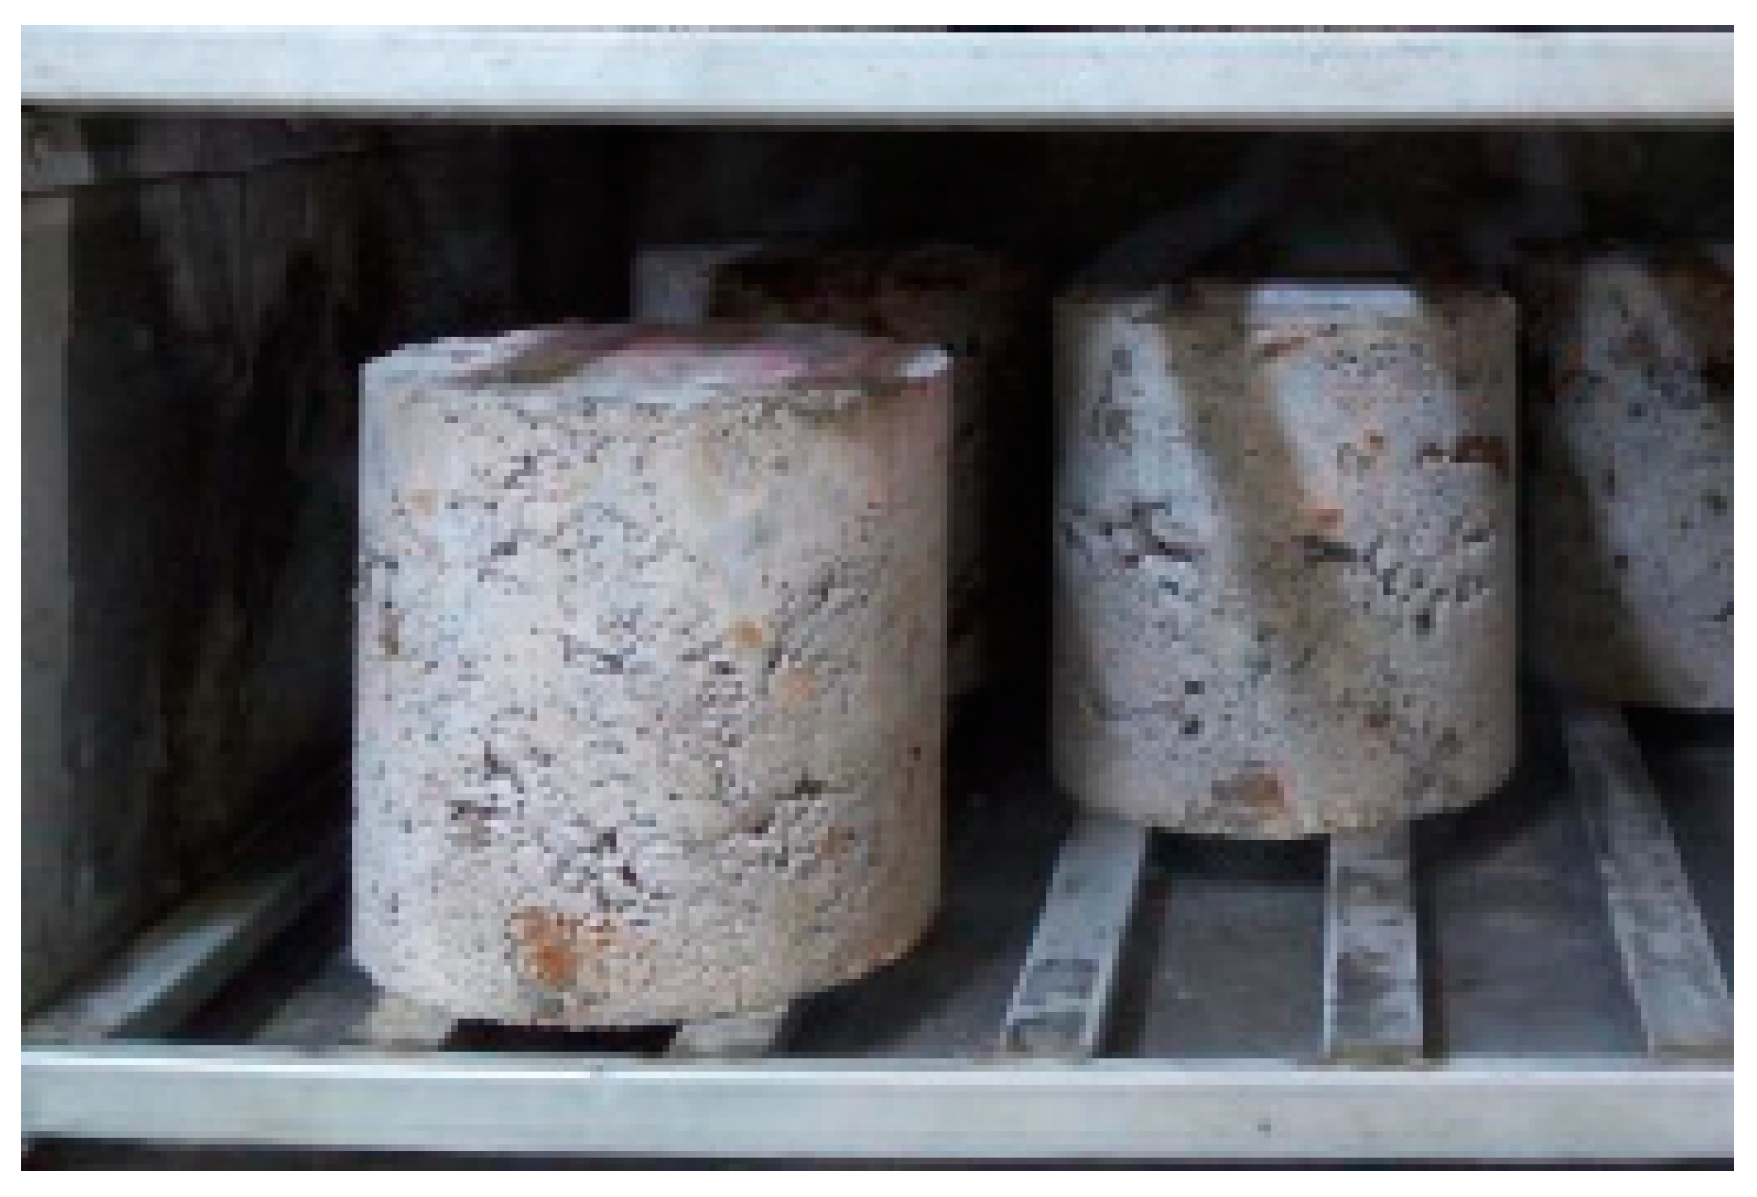
The freeze-thaw test was conducted according to the T0858-2009 test method in JTG E51-2009 regulation. Eighteen test specimens of each CSM were prepared, including 9 freeze-thaw specimens and 9 non-freeze-thaw contrast test specimens. The specimen was a cylinder with a height of 150 mm and a diameter of 150 mm, which was molded by the static pressure method, as shown in Figure 4a. 28d curing was conducted at standard temperature of 20 °C ± 2 °C, relative humidity above 95% and saturated status for 24 h at the last day. Then the 28d unconfined compressive strength was determined according to the T0805-1994 test method in JTG E51-2009 regulation. After 5 freeze-thaw cycles, the unconfined compressive strength was also determined by the same method. Each freeze-thaw cycle included a 16 h freezing with −18 °C followed by an 8 h thawing in 20 °C water. Figure 6 depicts freeze-thaw cycle specimen. The anti-freezing performance index of the material was calculated as follows
where, BDR—loss rate of compressive strength of specimens after 5 freeze-thaw cycles (%); —representative value of compressive strength with 95% guarantee rate after 5 freeze-thaw cycles (MPa); —representative value of the 95% compressive strength samples in the non-freeze-thaw cycles (MPa).
2.2.4. Anti-Scouring Test Method
The test of anti-scouring was carried out according to the test method of T0860-2009 in JTG E51-2009 regulation and the UTM-100 was used as the test equipment. The loading capacity of UTM-100 could reach 100 kN, which could meet the requirements of anti-scouring test. Six specimens were prepared for each CSM, where the manufacturing and curing methods were the same as those in the freeze-thaw test. In the test, the specimen was fixed in the scouring bucket with a rubber sheath surrounded it to avoid the possible damages from the fixture. The scouring bucket was firmly placed on the test machine and water was injected into the bucket, where the water surface was higher than the top of the test piece about 5 mm. A rubber pad with holes in vertical direction and 2 horizontal directions was laid on the top surface of the specimen to transform the pressure to the scouring force. In the test, the specimen was continuously scoured 30 min by a dynamic compressive pressure with the peak of 0.5 MPa and the frequency of 10 Hz. After the test, the specimen was unloaded from the machine and the muddy water was poured into a metal basin for precipitation. After 12 h, the upper part water was poured out carefully and the remaining sediment was dried in an oven to determine the weight of the residual material. The weight loss of the specimen during the scouring was calculated in accordance with Equation (4). And the average of the 6 specimens was taken as the final result.
where, P—weight loss rate due to scouring (%); —scoured weight (g); —specimen weight (g).
2.2.5. Drying Shrinkage Test Method
The drying shrinkage test was performed to evaluate the shrinkage performance due to water loss at early construction stage, which was in accordance with the test method of T0854-2009 in JTG 51-2009 regulation with modified curing and test conditions. The specimen for drying shrinkage test was a beam with dimensions of 100 mm × 100 mm × 400 mm, as shown in Figure 7. Six specimens were manufactured for each CSM, where 3 were used to measure the shrinkage deformation and the other 3 were used to measure the water loss rate. After 12 h curing at temperature of 20 °C ± 2 °C, relative humidity above 95%, the specimens were placed in the common laboratory room for 7d drying. The length of the test piece was measured with the Vernier caliper. The glass patch was adhered on two ends of the test piece. Five glass rods coated with lubricant on the floor of the contractile instrument were evenly placed. Then, the test specimen was put in the middle of the contractile instrument and 2 dial indicators were fixed on each end to measure the shrinkage deformation. The shrinkage deformation and the water loss were recorded every day during the 7d drying. The water loss rate and shrinkage coefficient were calculated according to Equation (5) through Equation (9). The average values were taken as the final results.
where, —the rate of water loss at the ith drying day(%); —the drying Shrinkage of at the ith drying day (mm); —the drying shrinkage strain at the ith drying day; —the coefficient of drying shrinkage at the ith drying day; —total shrinkage coefficient; —weight of the specimen at the ith drying day (g); —readings of the j micrometer at the ith drying day (mm); —length of standard specimen (mm); —drying weight of standard test specimen (g).
2.2.6. Temperature Shrinkage Test Method
The temperature shrinkage test was carried out according to the T0855-2009 test method in JTG E51-2009 regulation and 3 specimens were prepared for each CSM, where the manufacturing of the specimens was the same as that in the drying shrinkage test. The test temperature range was 40 °C to −10 °C and 6 temperature levels were set, where the difference of each level was 10 °C. After 7d curing at temperature of 20 °C ± 2 °C, relative humidity above 95% and saturated status for 24 h at the last day, the specimen was removed from the water tank and drying in an oven at 105 °C for 12 h so that there was no free water in the specimen. After that, the specimen was put in a dry and ventilated place until it cooled to the room temperature. The length of the specimen was measured by using the Vernier caliper. Then the specimen was instrumented as in the drying shrinkage test and put in the environment chamber. The test started from 40 °C. After the temperature reached the set level, maintain the constant temperature for 3 h and read the dial indicators 5 min before the end of temperature maintaining. Then lower the temperature to next level with a cooling rate of 0.5 °C/min. Repeat the above actions until the test was finished. The temperature shrinkage, thermo shrinkage strain and temperature shrinkage coefficient were calculated according to Equation (10) through Equation (13). The average values were taken as the final results.
where, —the observational temperature shrinkage at ith level (mm); —the temperature shrinkage strain at ith level; —the temperature shrinkage coefficient at ith level (10−6/°C); —total temperature shrinkage coefficient (10−6/°C); —reading of jth micrometer at ith level (mm); —initial length of the test specimen (mm); —temperature at ith level (°C).
3. Test Results
3.1. Unconfined Compressive Strength Analysis
According to the requirements of the unconfined compressive strength of the cement stabilized base in JTG/T F20-2015, all the CSMs containing CRCBA and FRCBA can meet the requirements of all grade highways with any traffic duty except the express highway and grade I highway with extremely heavy traffic duty. The recommended range of 7d unconfined compressive strength for those case that can be adapted are from 4 MPa to 6 MPa or lower. Figure 8 shows the effects of CRCBA and FRCBA on the unconfined compressive strength of the mixture. From Figure 8, it can be seen that the 7d unconfined compressive strength has a downward trend with the increase of CRCBA content. When the amount of CRCBA is greater than 20%, the 7d unconfined compressive strength no longer varies with the increase of CRCBA. The decrease trend of 28d (Figure 8b) unconfined compressive strength is consistent with that of 7d when the CRCBA content is below 20%. With the increasing of CRCBA content, the 28d unconfined compressive strength still decreases. When the CRCBA content is greater than 40%, the 28d unconfined compressive strength of the CSM no longer varies with the increase of CRCBA. Compared with the 7d unconfined compressive strength, the 28d unconfined compressive strength of each CSM is greatly improved, especially B-20, of which the 28d unconfined compressive strength is increased by 46.9% than the 7d strength. In addition, it is found that when B-4-1 has 10% more FRCBA than B-4, the strength of the mixture increases and the 7d and 28d unconfined compressive strengths only increase a bit by 9.94% and 4.74%, respectively. Compared with B-6, the 7d and 28d unconfined compressive strengths of B-M are decreased by 13.14% and 19.21%, respectively.
3.2. Modulus Analysis
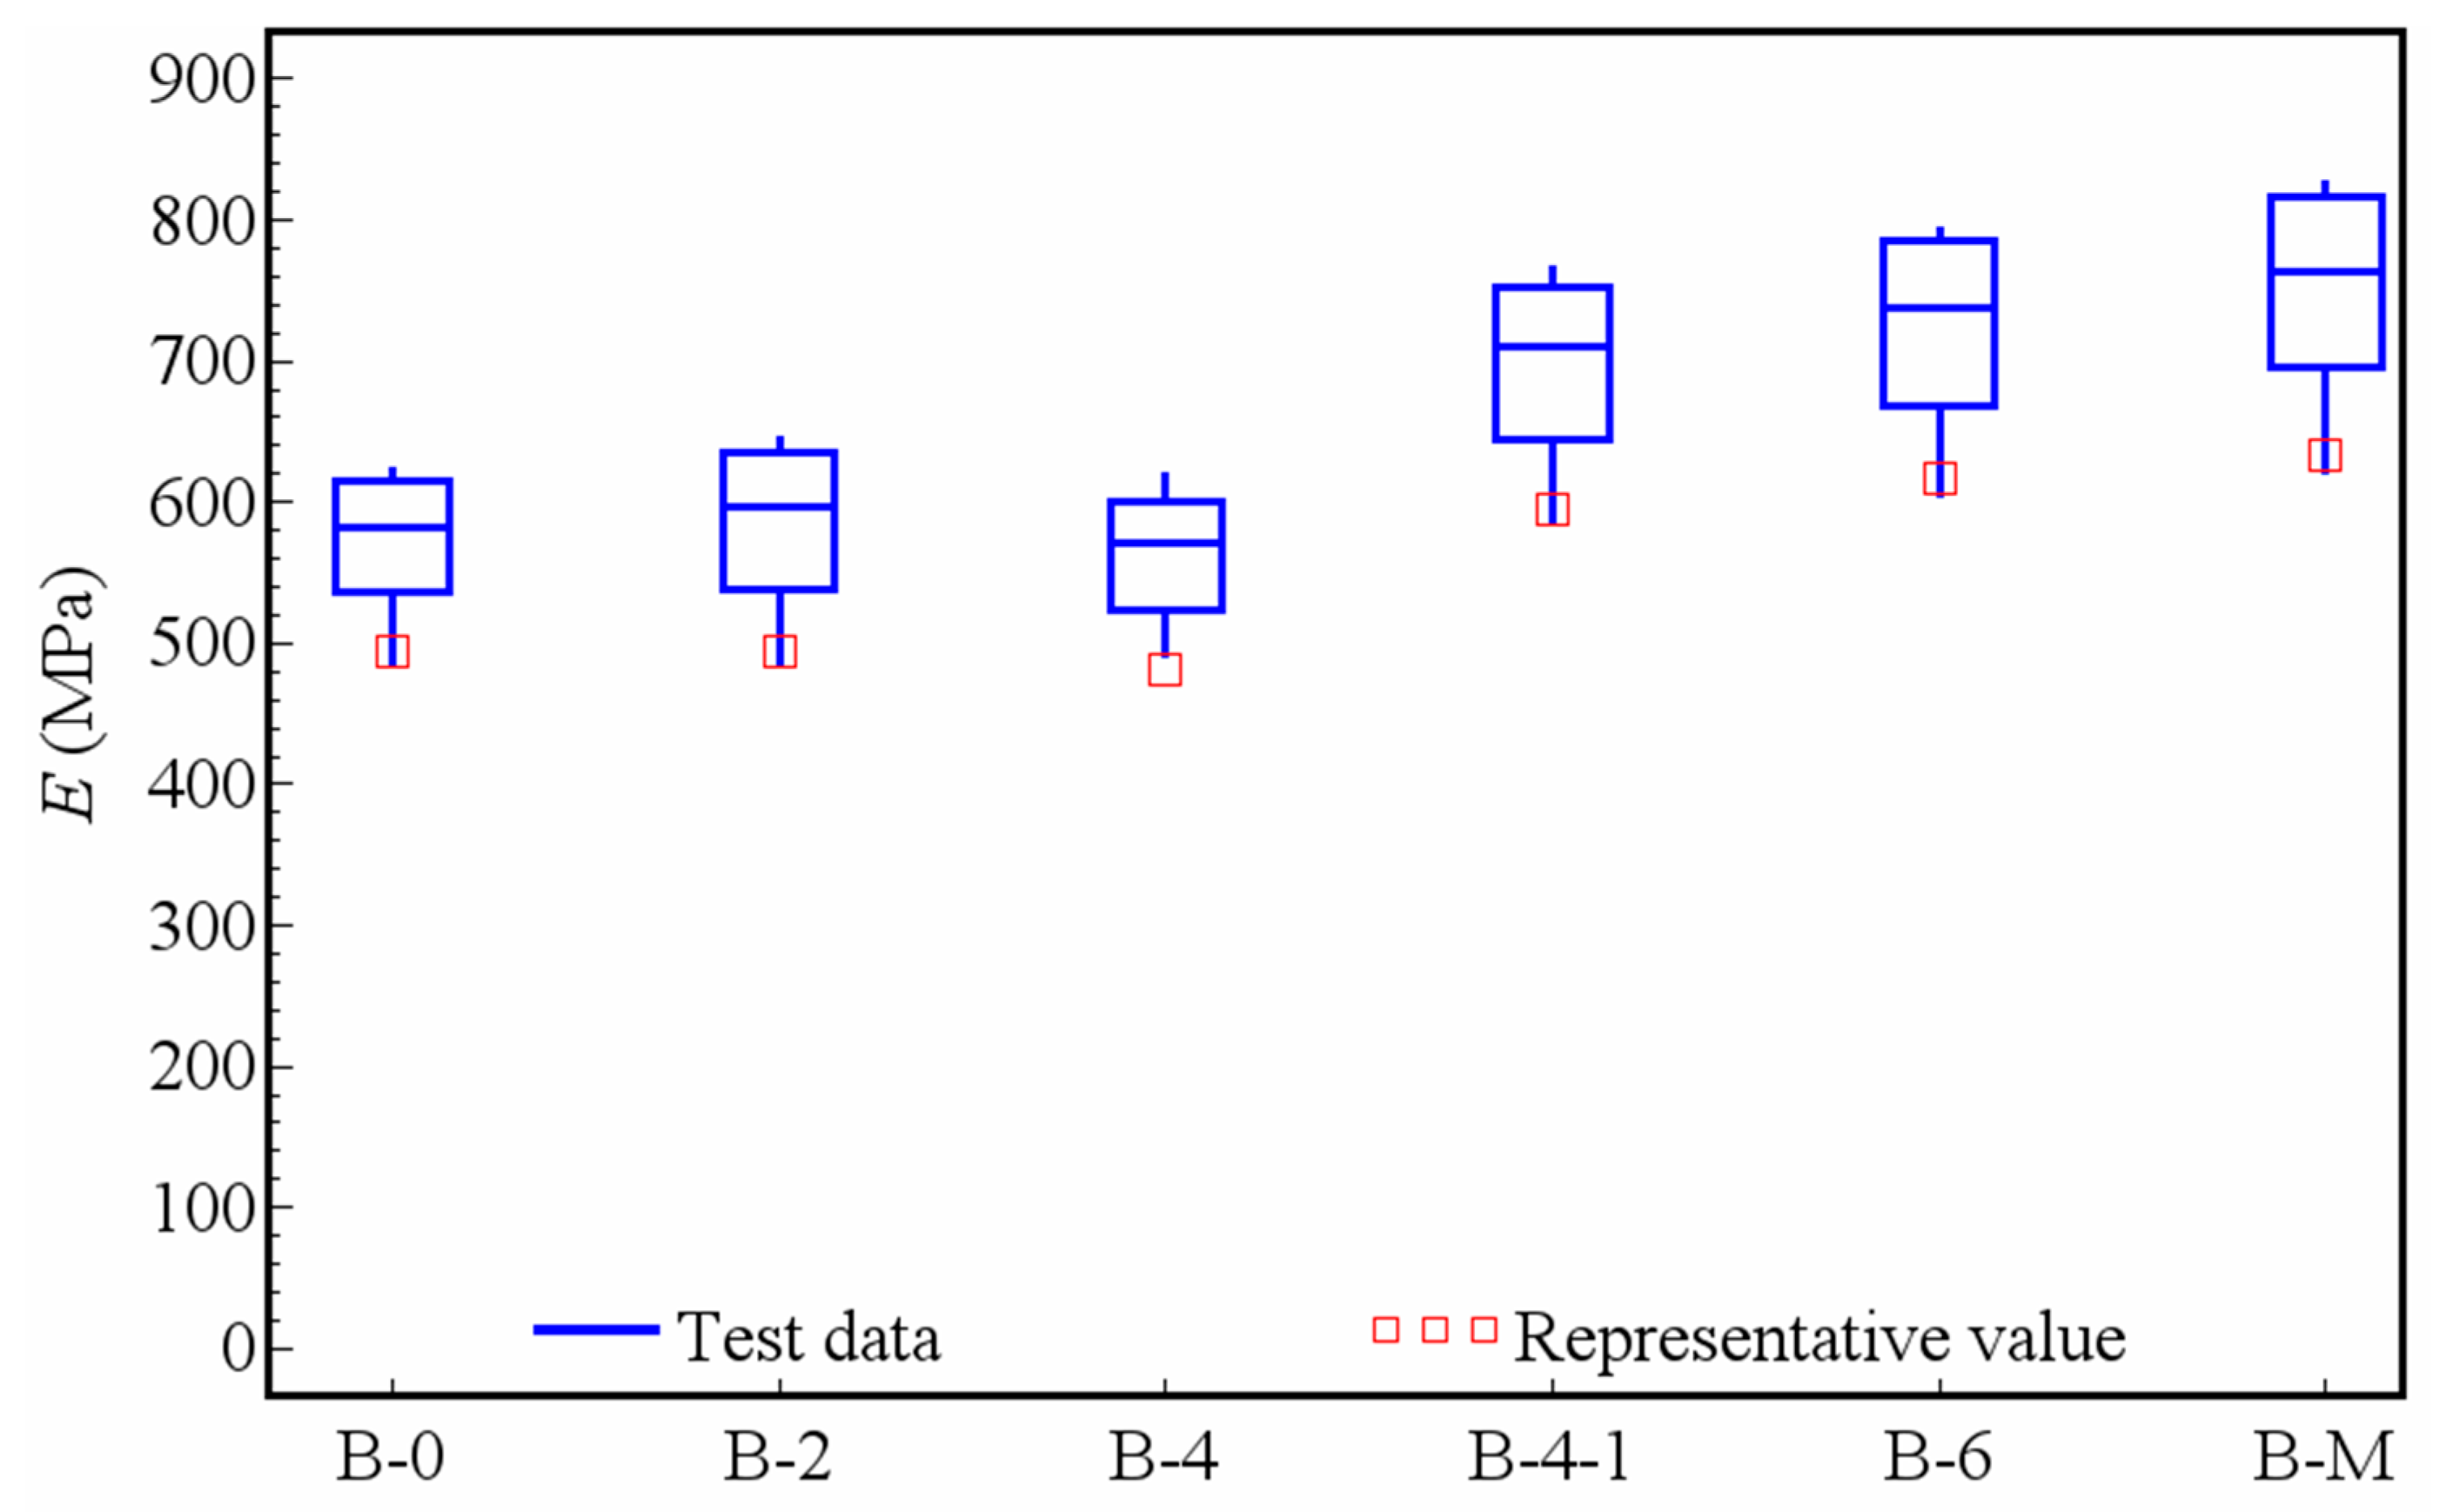
Figure 9 presents the influences of CRCBA and FRCBA on the compressive resilient modulus of CSM. As shown in Figure 9, the compressive resilience modulus of CSM remains constant first and then increase with the increase of CRCBA content. The compressive resilient modulus of B-6 increases by 28.1% in comparison with that of B-4. Additionally, B-4-1 has 10% more FRCBA than B-4 and the compressive resilience modulus of B-4-1 increases by 23.9% than that of B-4.
3.3. Frost Resistance Analysis
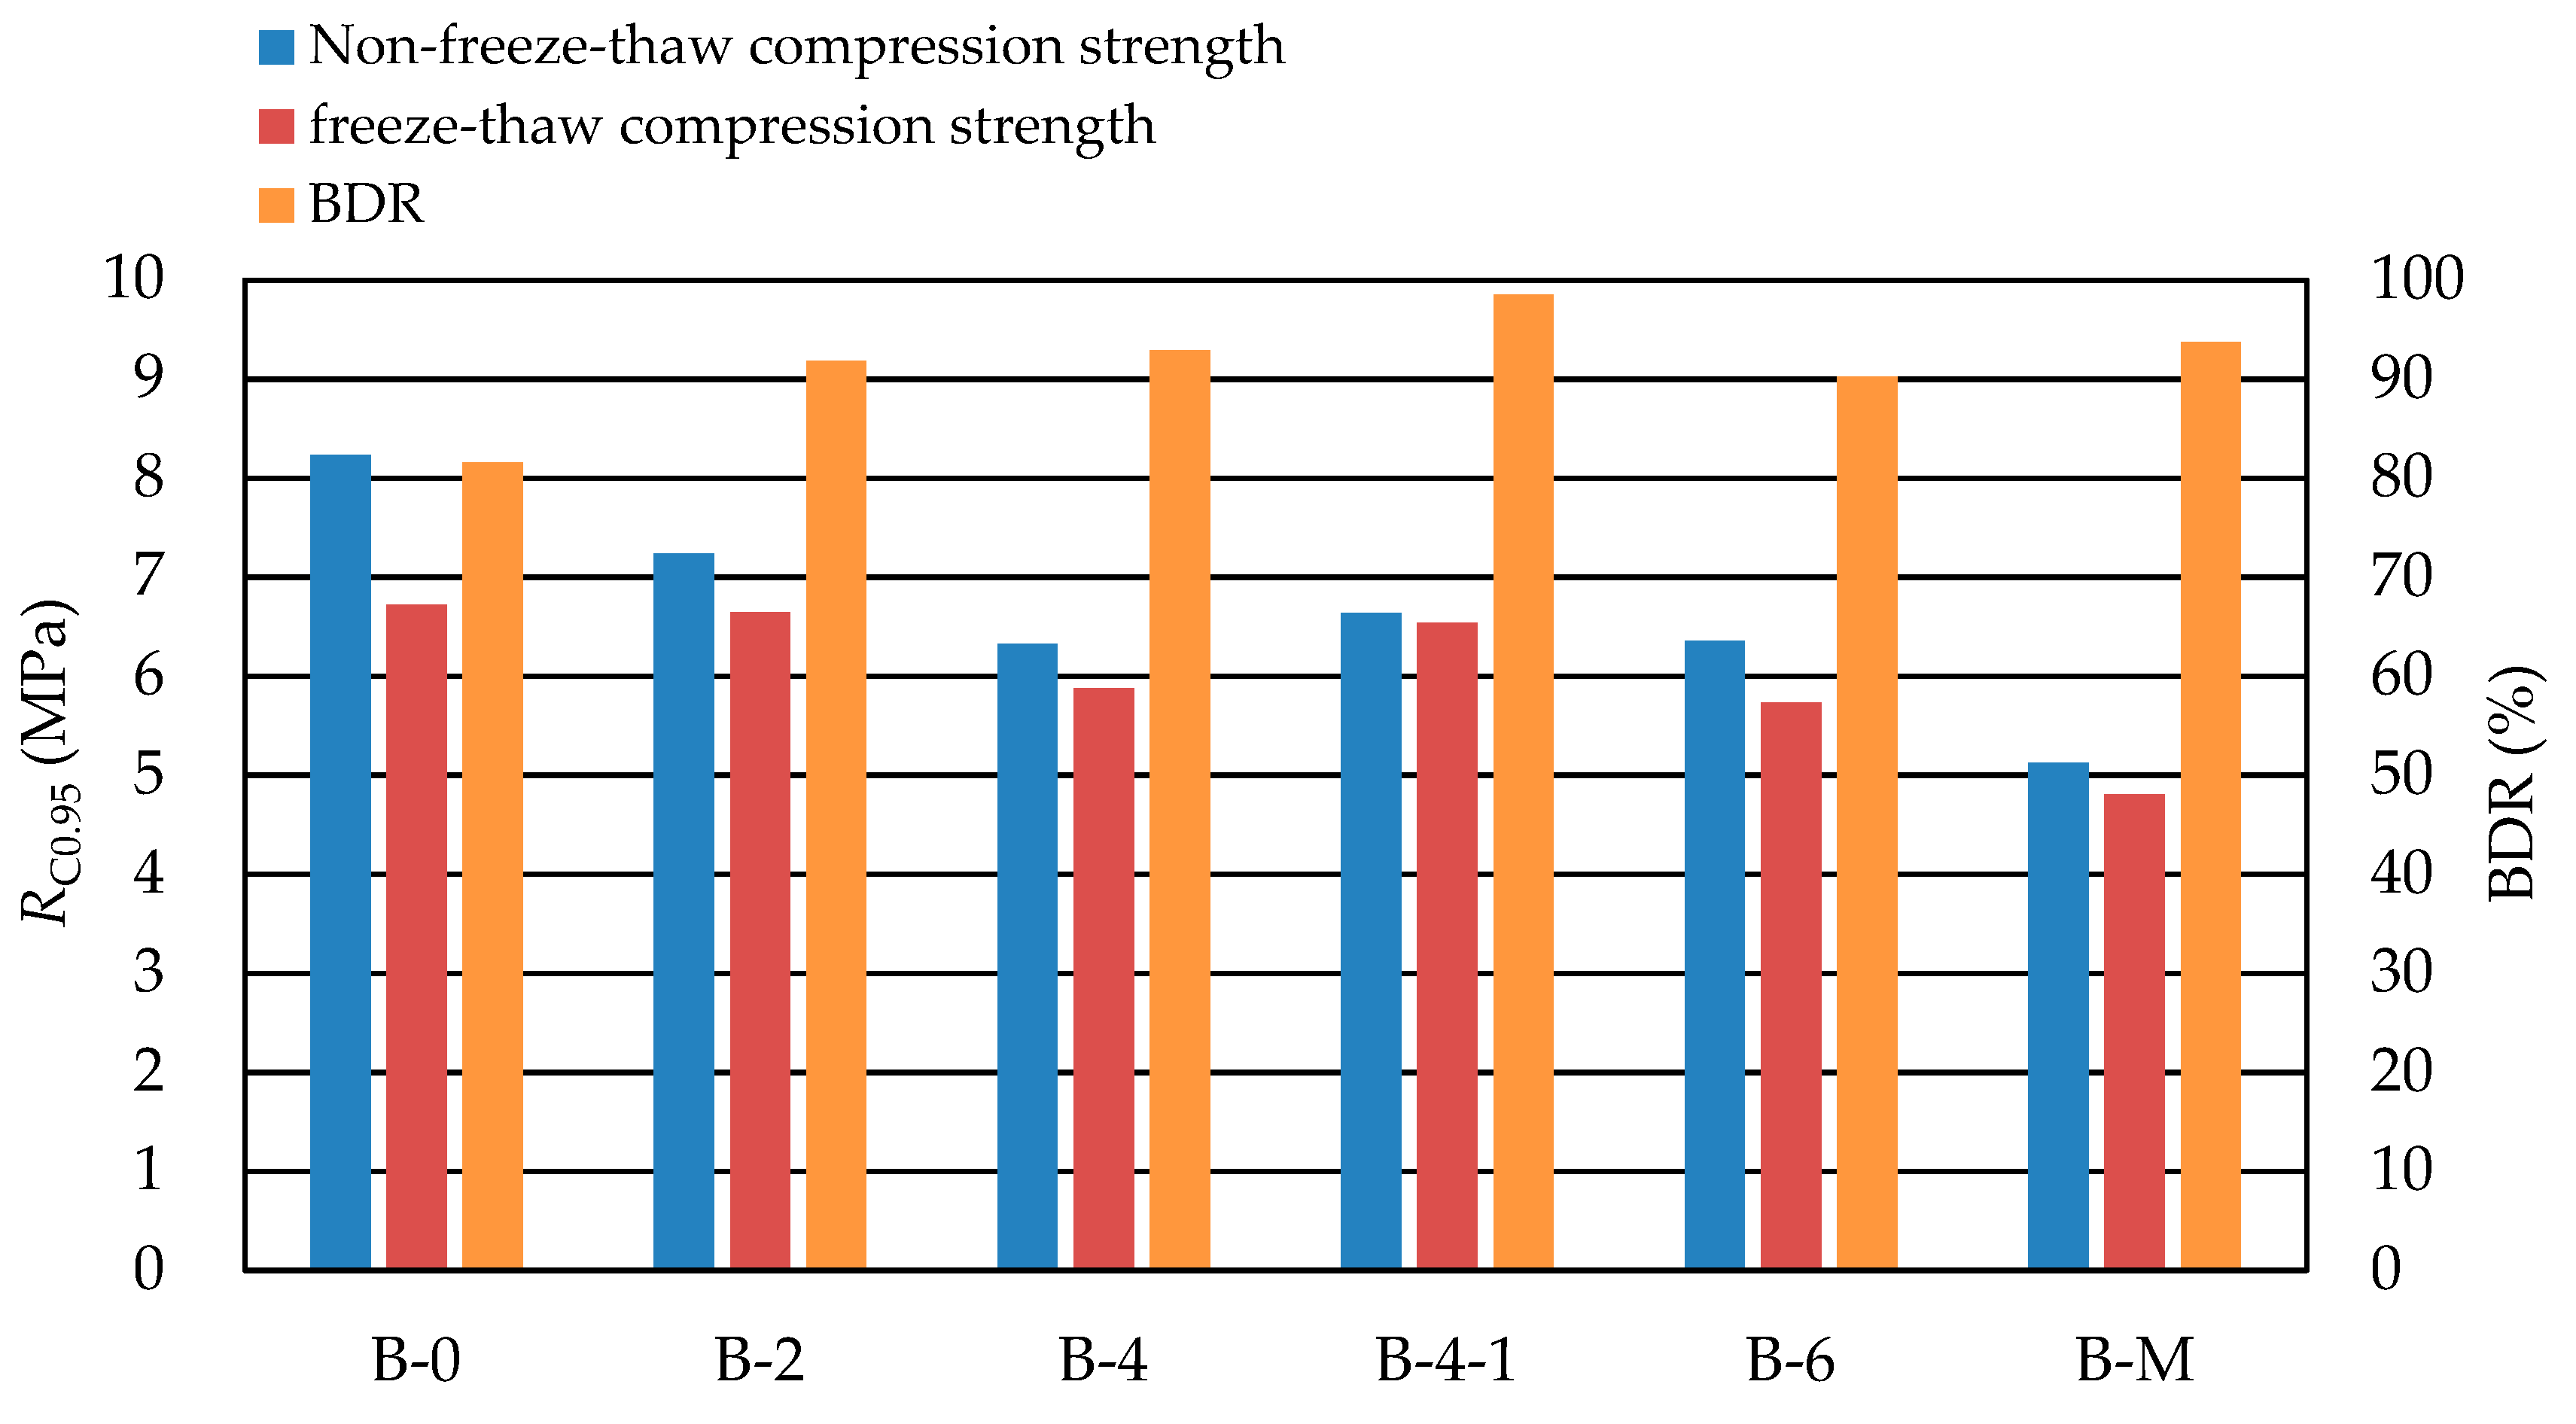
Figure 10 shows the influences of CRCBA and FRCBA on the frost resistance of CSM. According to Figure 10, the unconfined compressive strength decreases with the increase of CRCBA content whether before and after freeze-thaw cycles. And the unconfined compressive strength of each CSM decreases to a certain extent after 5 freeze-thaw cycles. BDR increases first and then decreases with the increase of CRCBA content. And the BDR of B-0 was the minimum one, 81.6%, indicating that the retained strength rate of CSM with no brick particles is the lowest. BDR differences between the CSMs with the CRCBA are not very large, which are between 90.2% and 92.9%. Compared with B-4, B-4-1 had 10% more FRCBA and its BDR increased by 5.6%. Compared with B-6, B-M had 30% more FRCBA and 10% less CRCBA and its BDR increased by 3.5%.
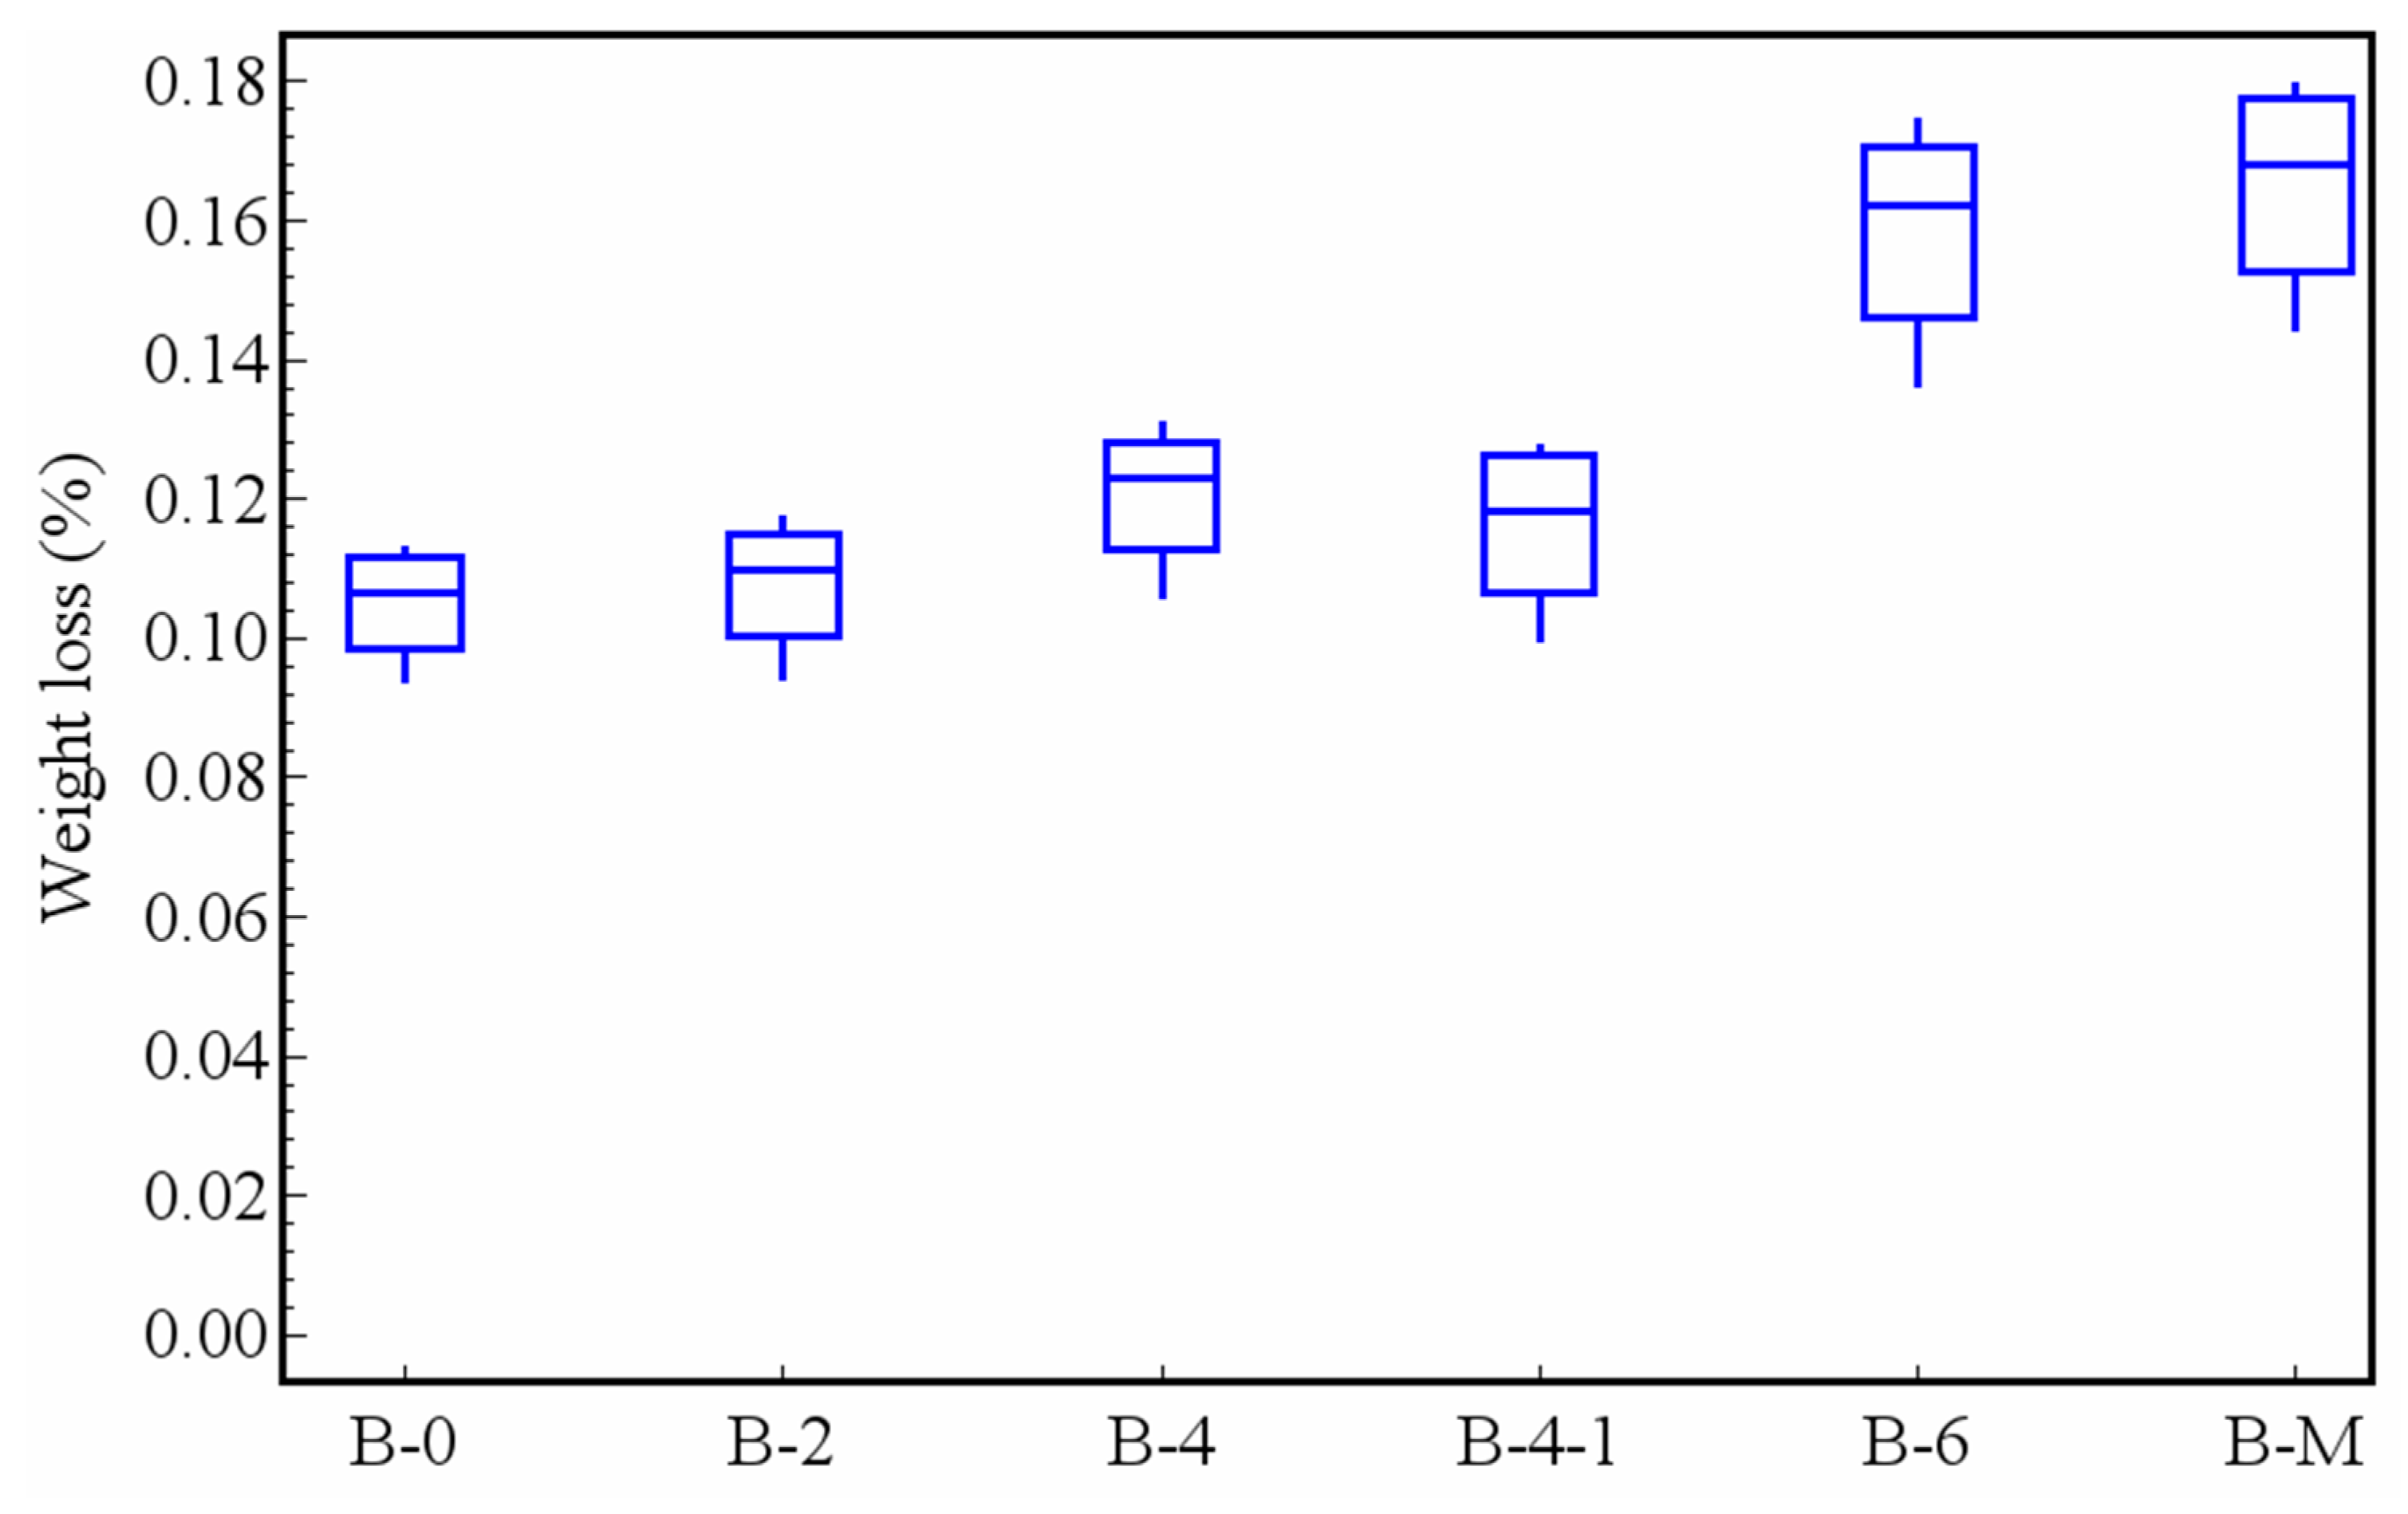
3.4. Anti-Scouring Performance Analysis
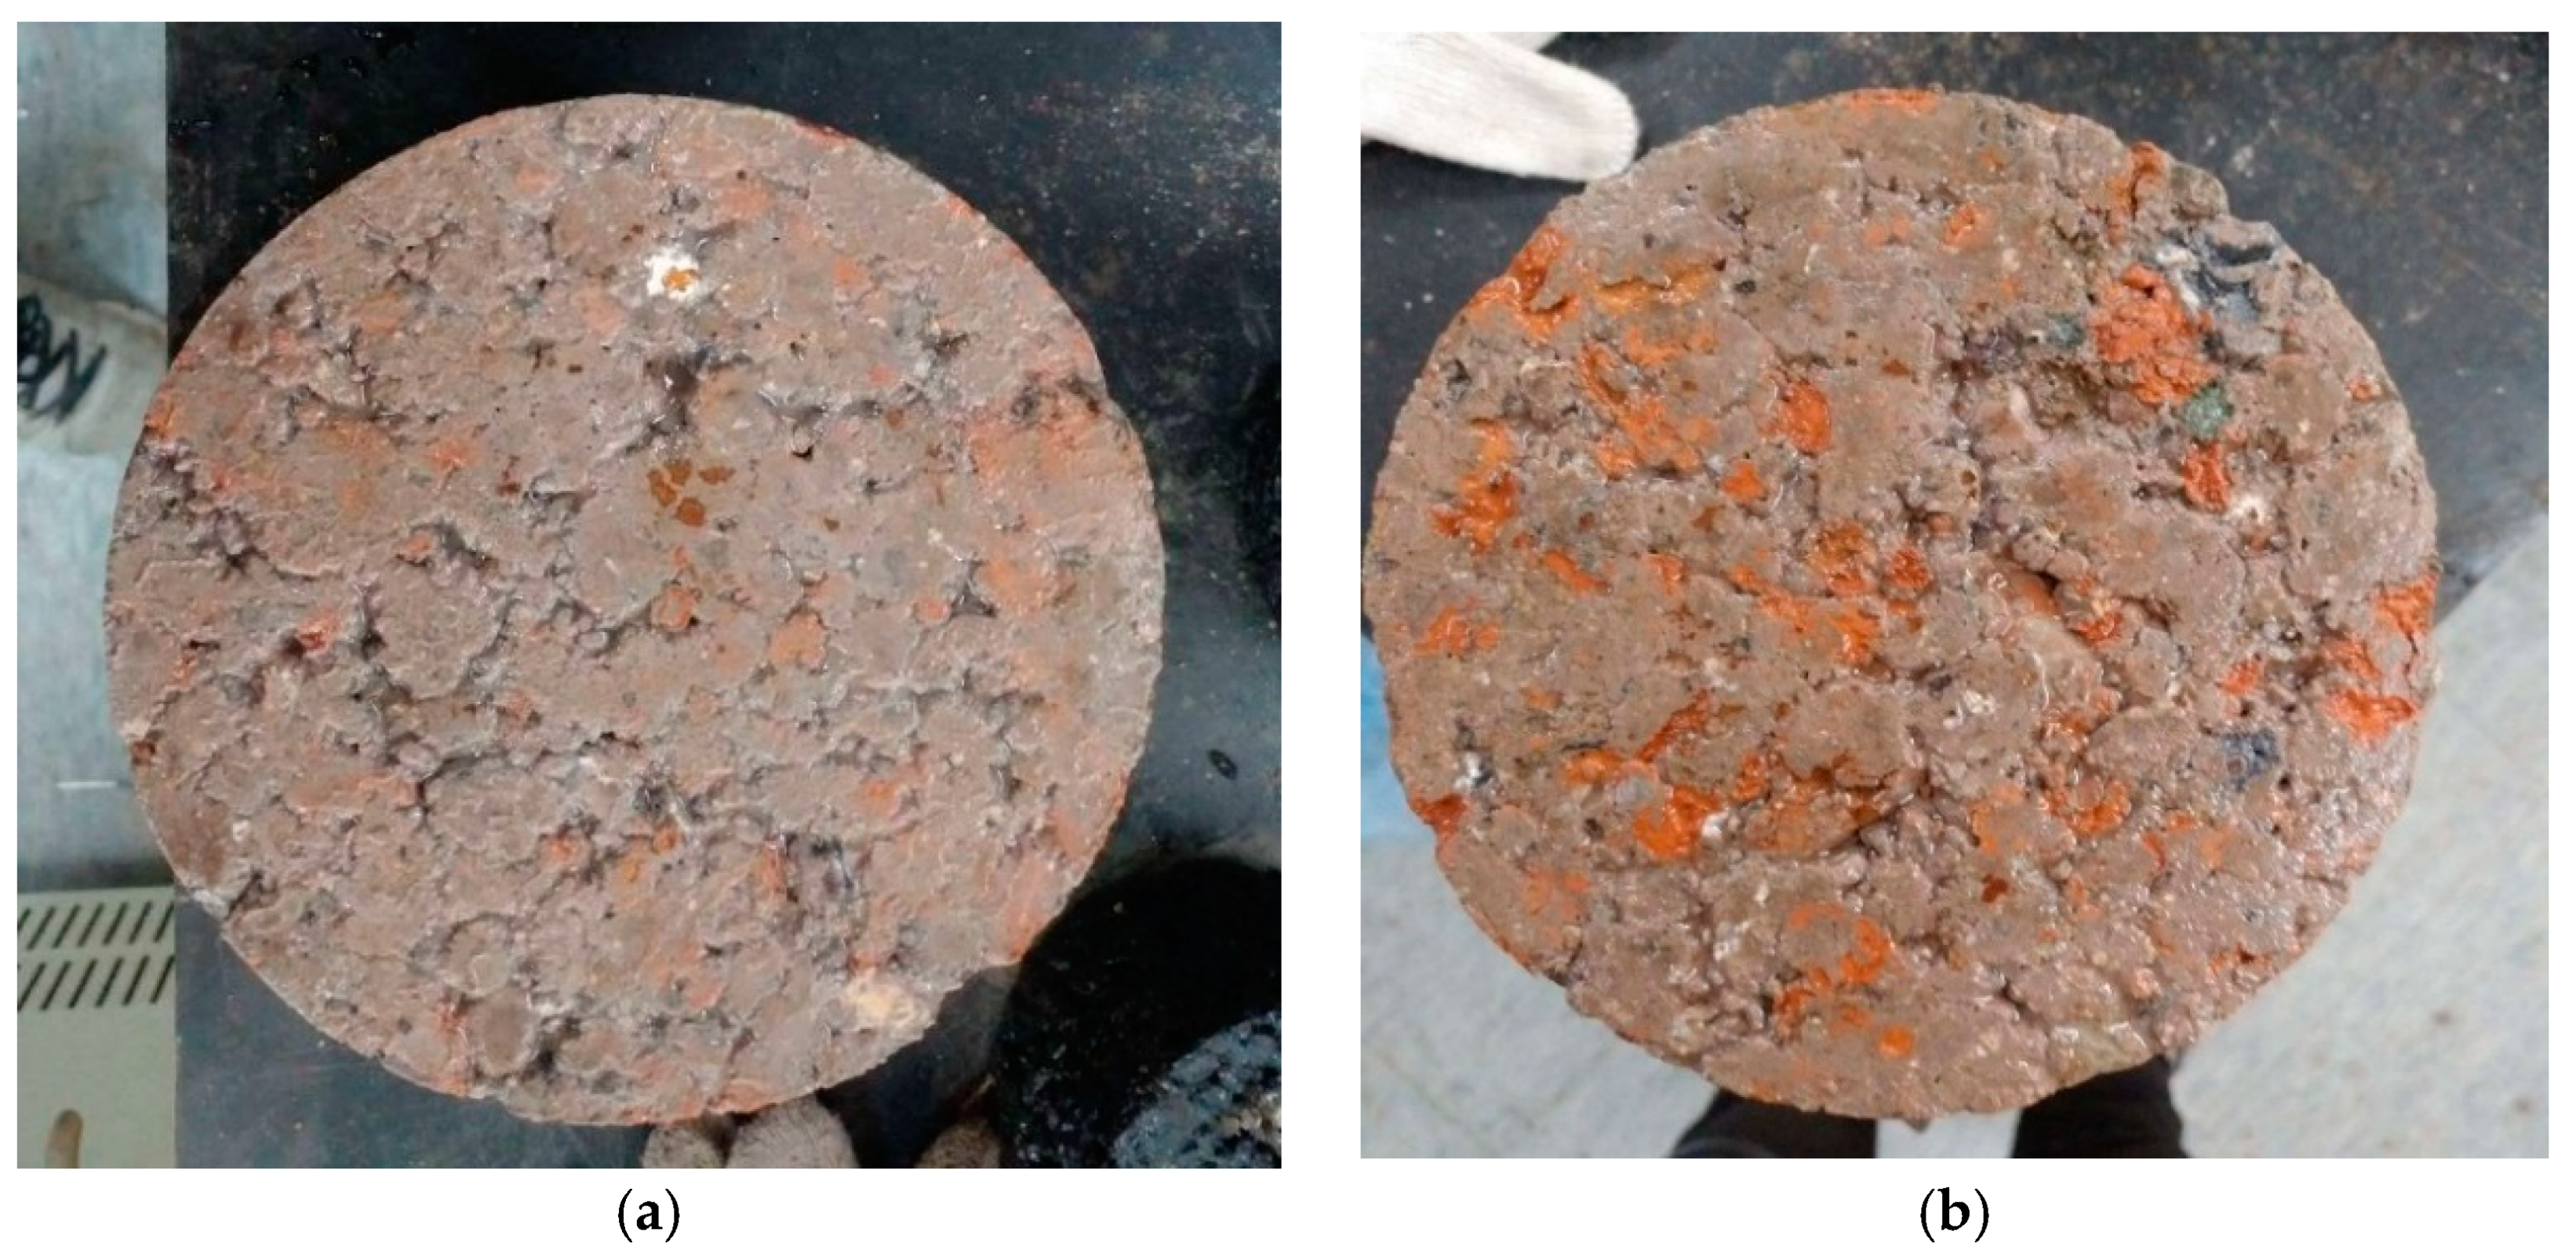
The surface images of a typical specimen before and after the anti-scouring test are shown in Figure 11. Figure 12 shows the influences of CRCBA and FRCBA on the scouring resistance of CSM. As shown in Figure 12, with the increase of CRCBA content, the weight loss increases gradually and that of B-6 increases by 51.4% compared with that of B-0, indicating that the influence of the amount of CRCBA on the anti-scouring performance is significant. In addition, the weight loss of B-4-1 decreases by 4.5% than that of B-4. The weight loss of B-M is 3.8% larger than that of B-6. The addition of FRCBA has very little influence on anti-scouring performance. Generally, the influence of CRCBA on the anti-scouring performance was greater than that of FRCBA.
3.5. Drying Shrinkage Performance
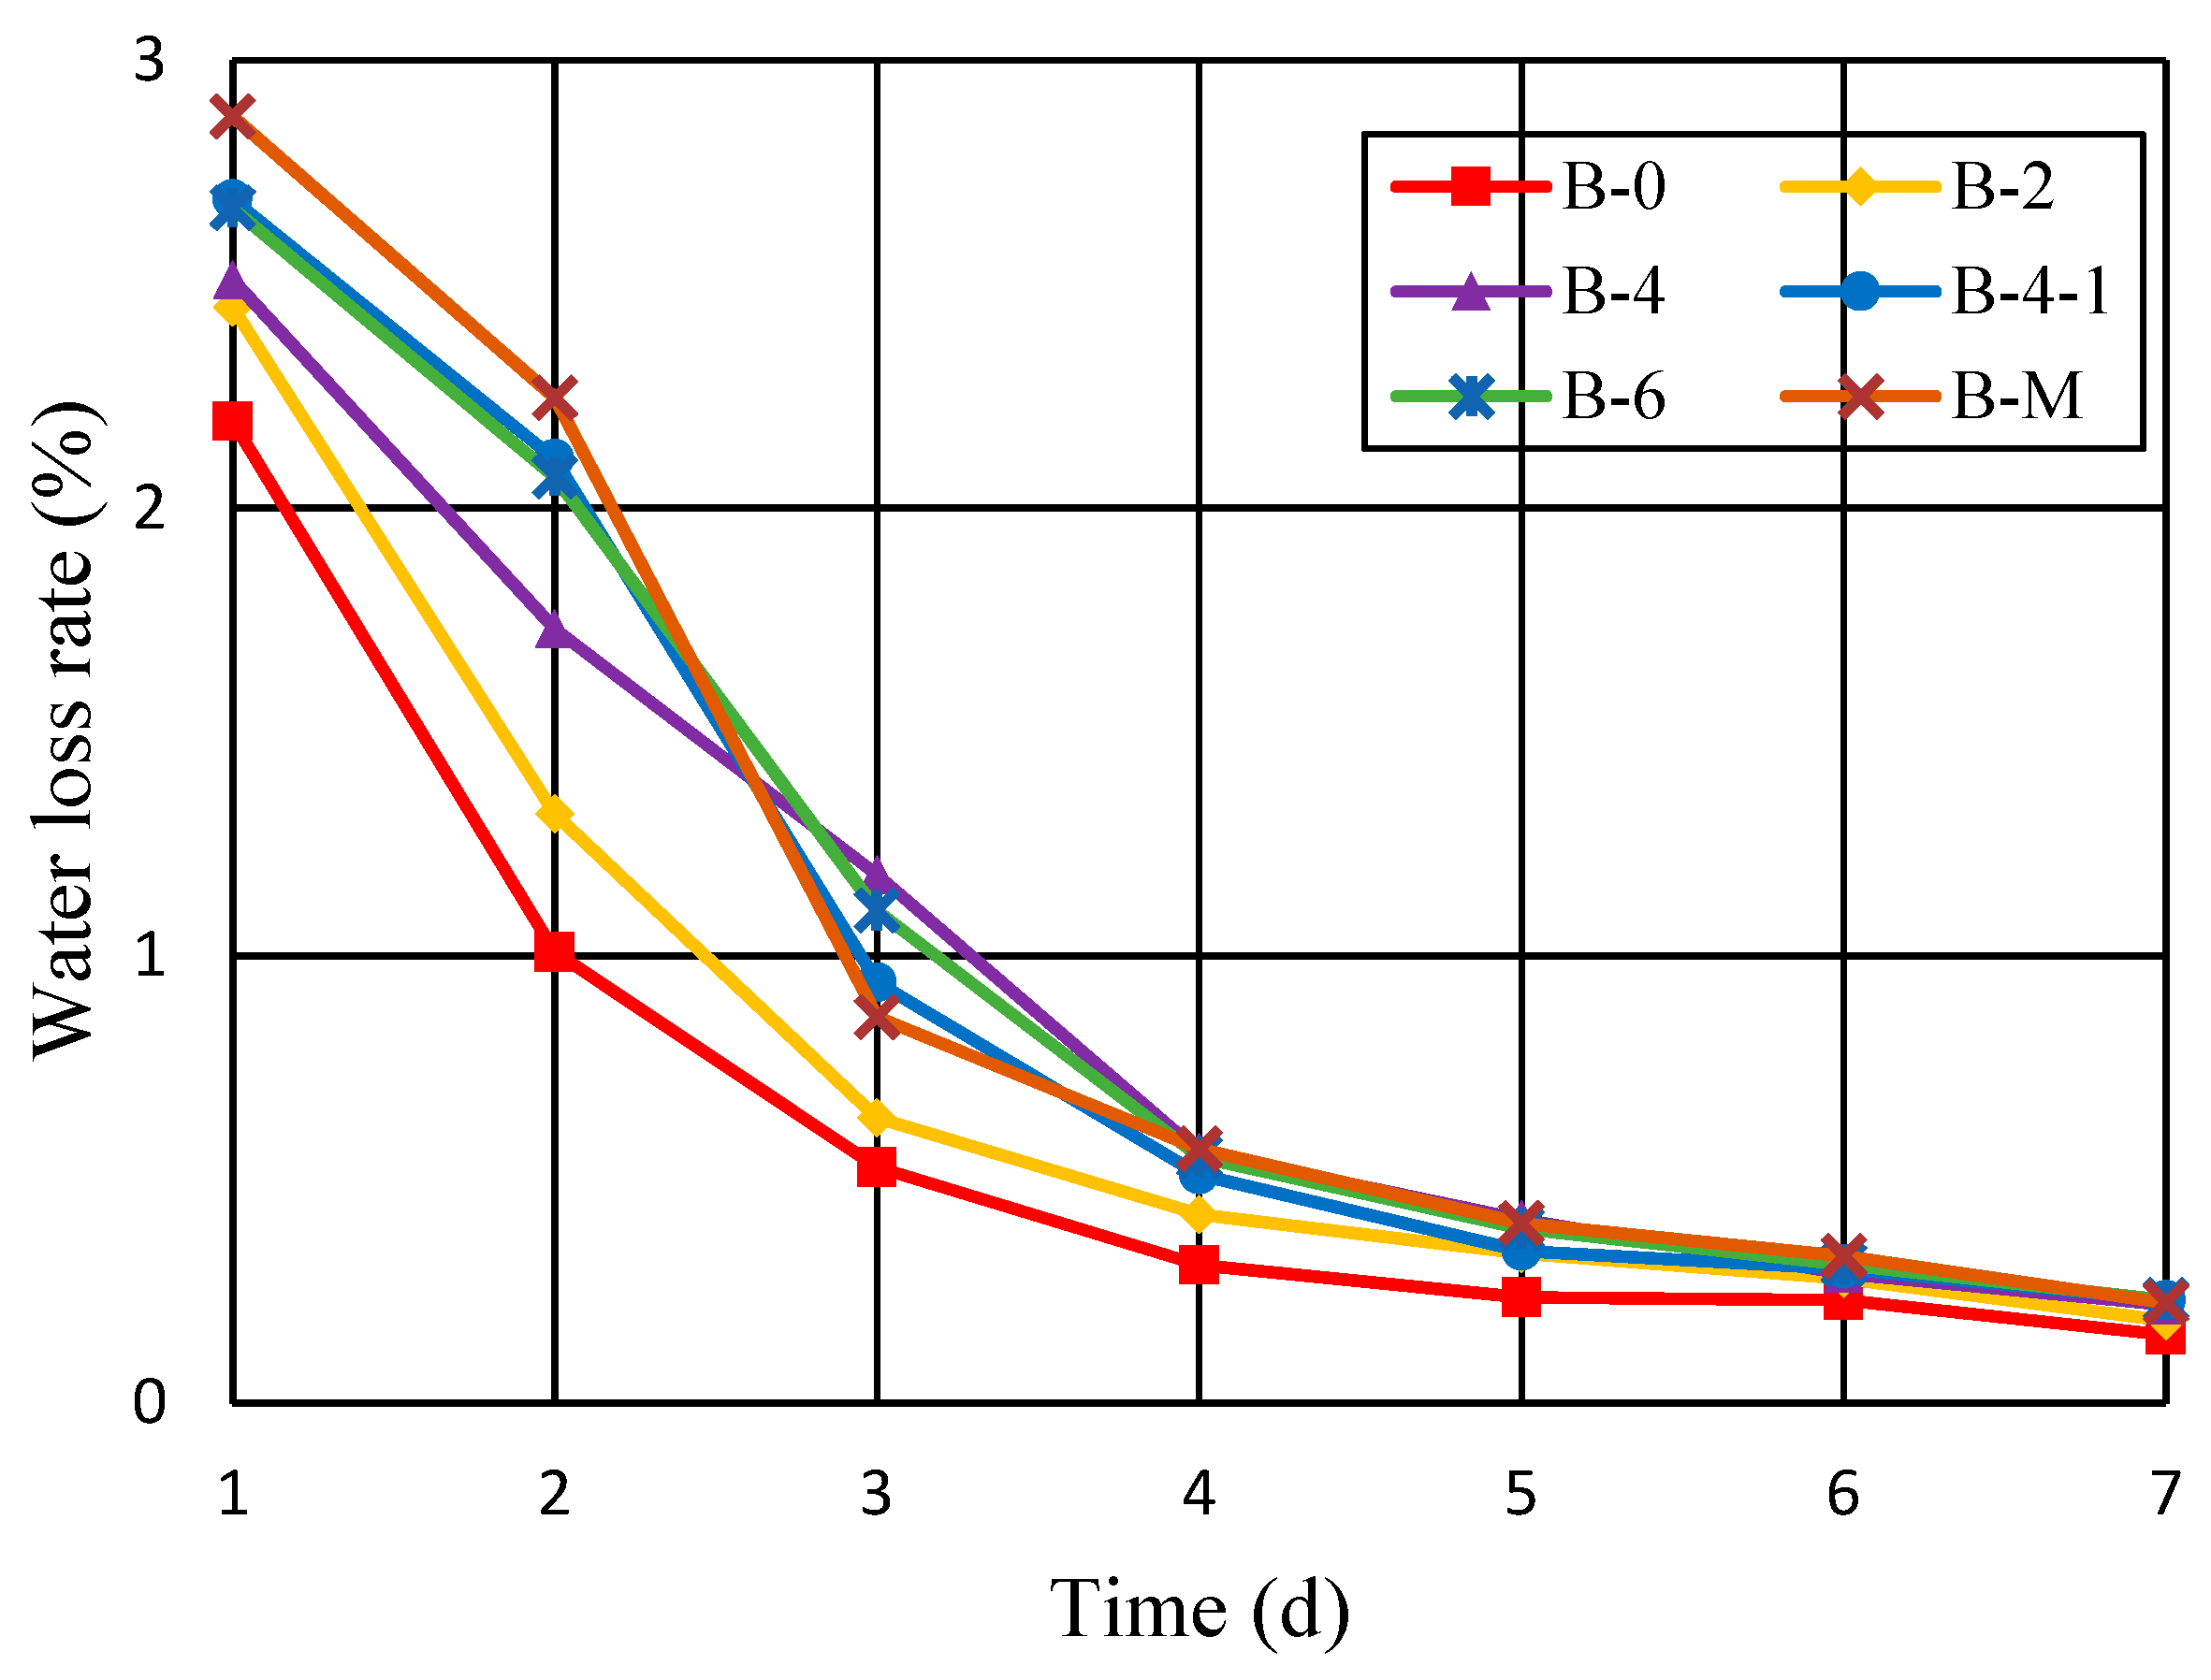
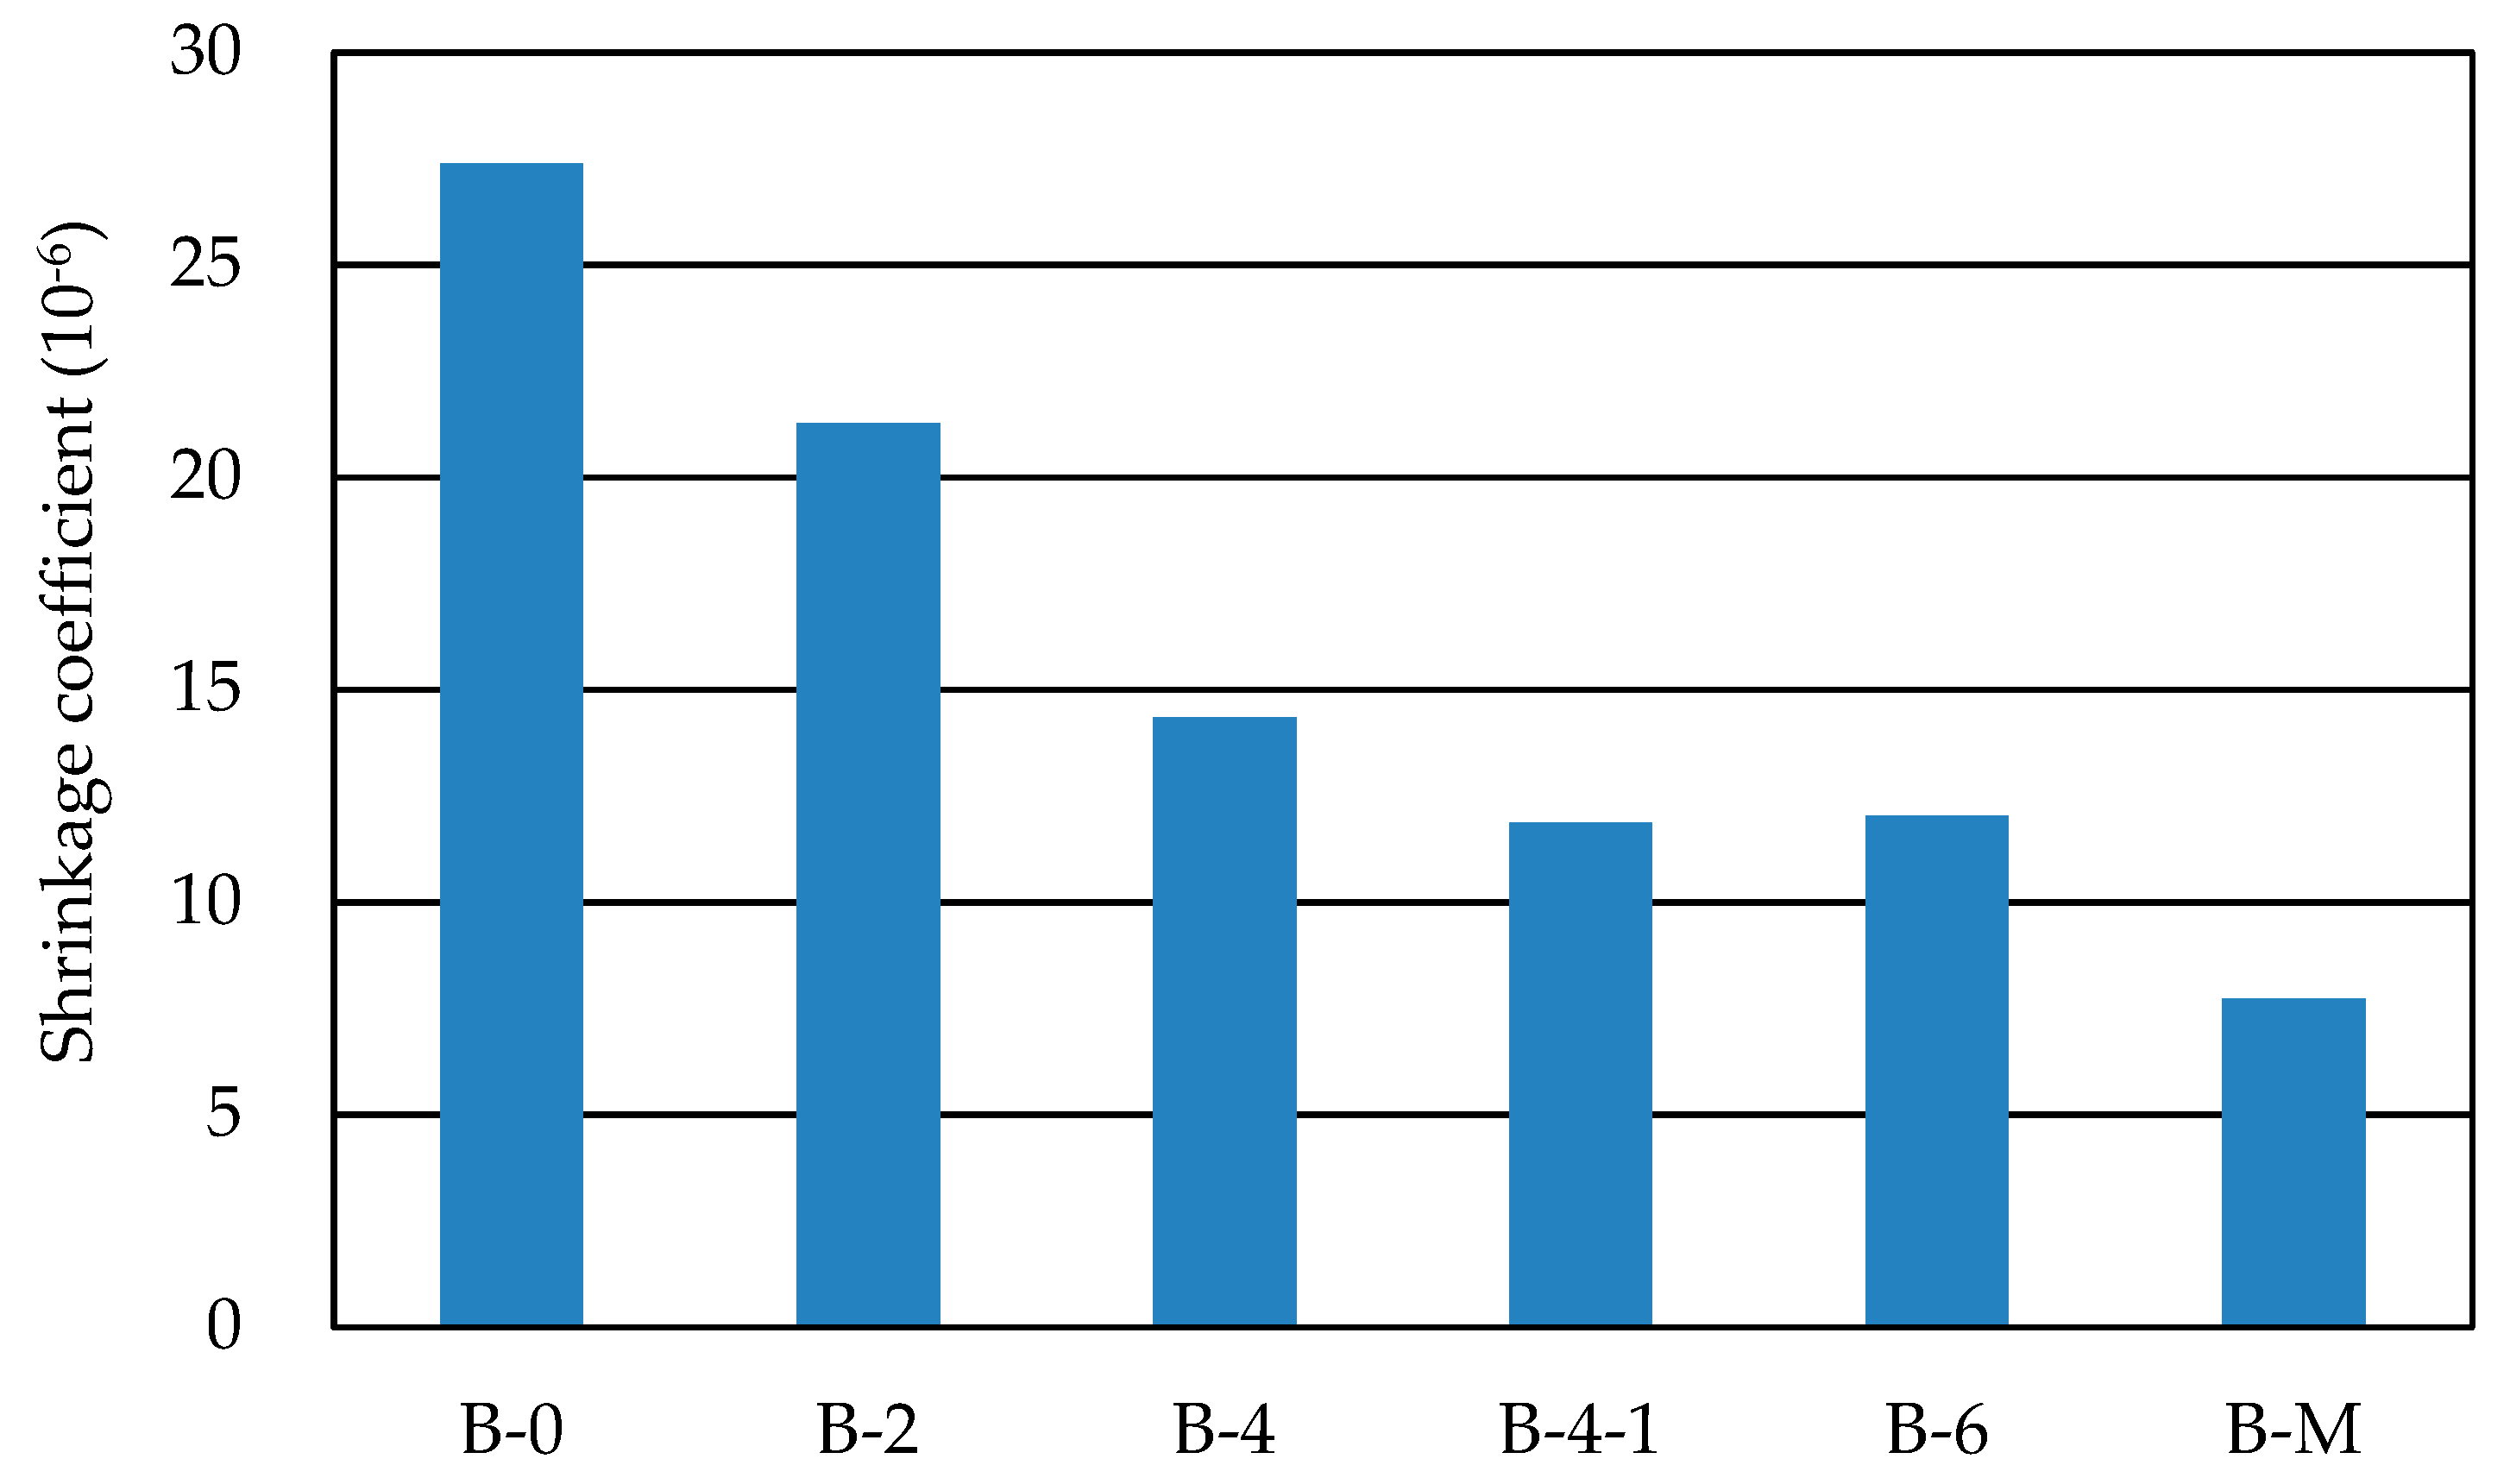
Figure 13 shows the relationship between the water loss rate and the drying days of each CSM. Figure 14 shows the influences of CRCBA and FRCBA on the drying shrinkage of CSMs at early construction stage respectively. As shown in Figure 13, the time variation trend of the water loss rate of each CSM is almost the same. The loss rate is relatively larger in the first two days. After the third day, the change of water loss rate begins to be stable. And the loss rate in each CSM accounts for 61.45% to 68.77% of the total loss rate related to the water loss during the whole test. As it can be seen from Figure 14, with the increase of CRCBA content, the drying shrinkage coefficient of CSM decreases gradually and the total drying shrinkage coefficient of B-6 decreases by 56% than that of B-0. In addition, the total drying shrinkage coefficient of B-4-1 decreases by 17.3% compared to that of B-4 and that of B-M decreases by 35.8% compared with that of B-6. It is shown both CRCBA and FRCBA have significant influences on the total drying shrinkage at early construction stage.
3.6. Temperature Shrinkage Performance
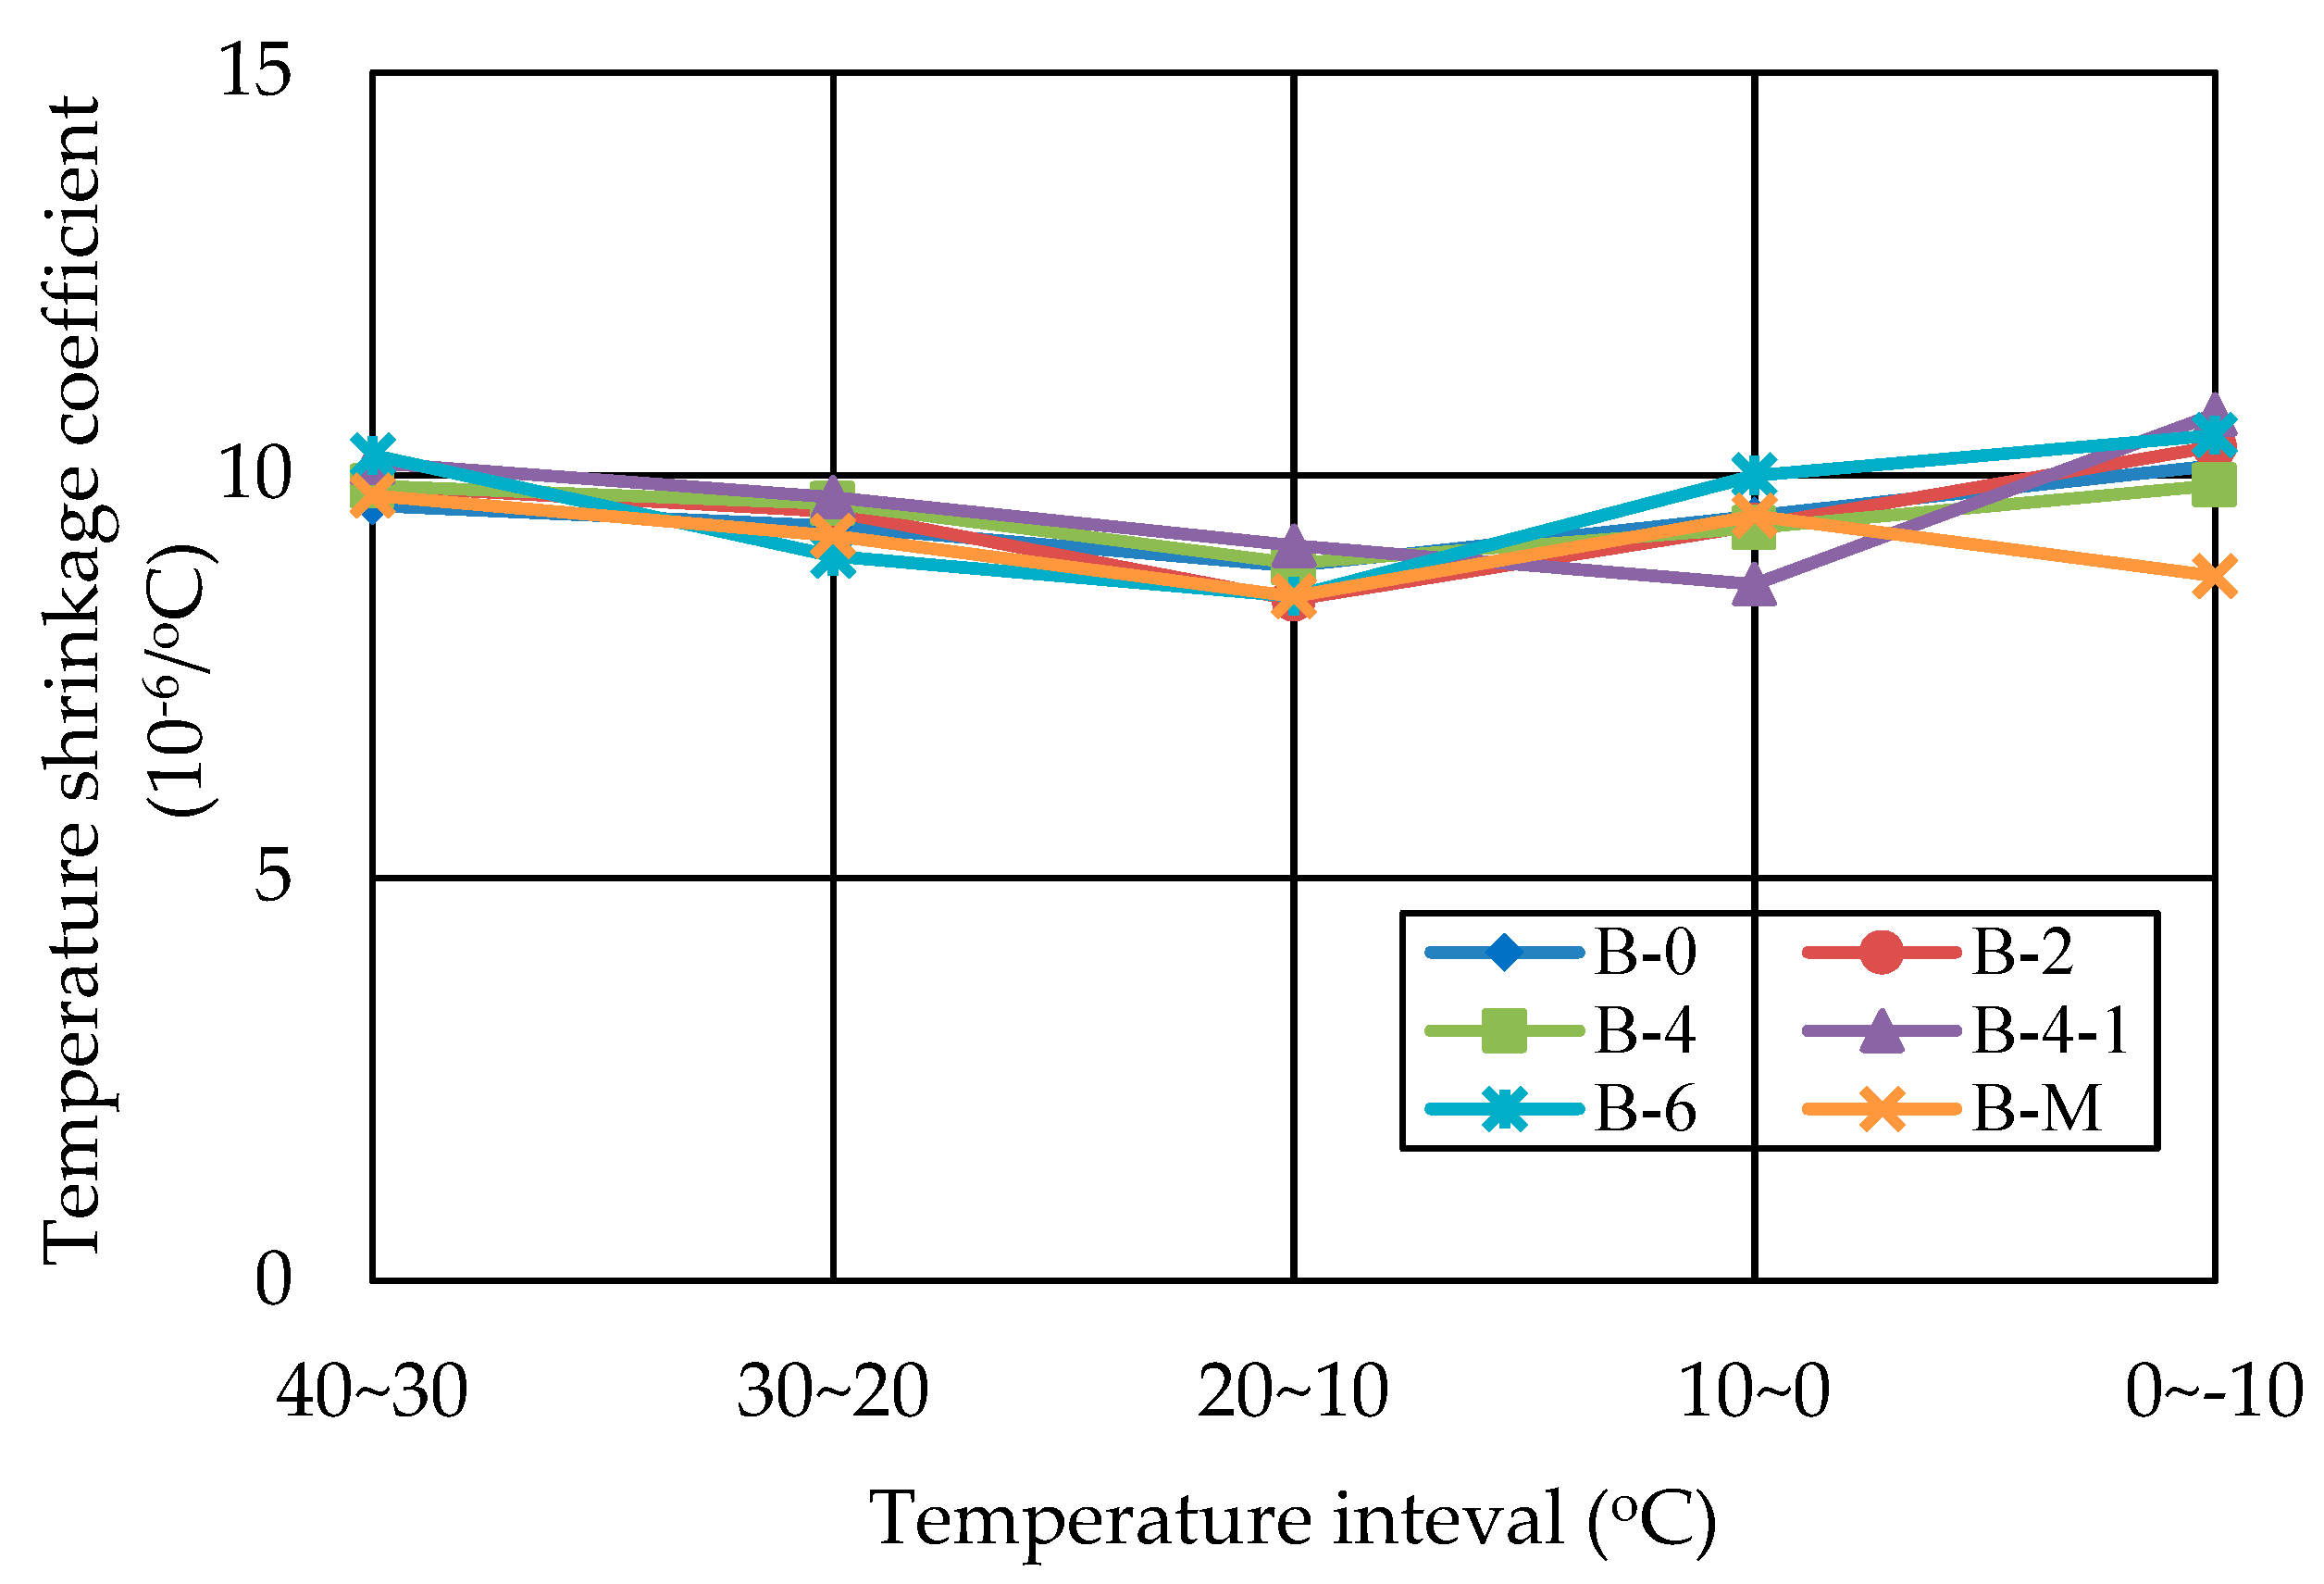
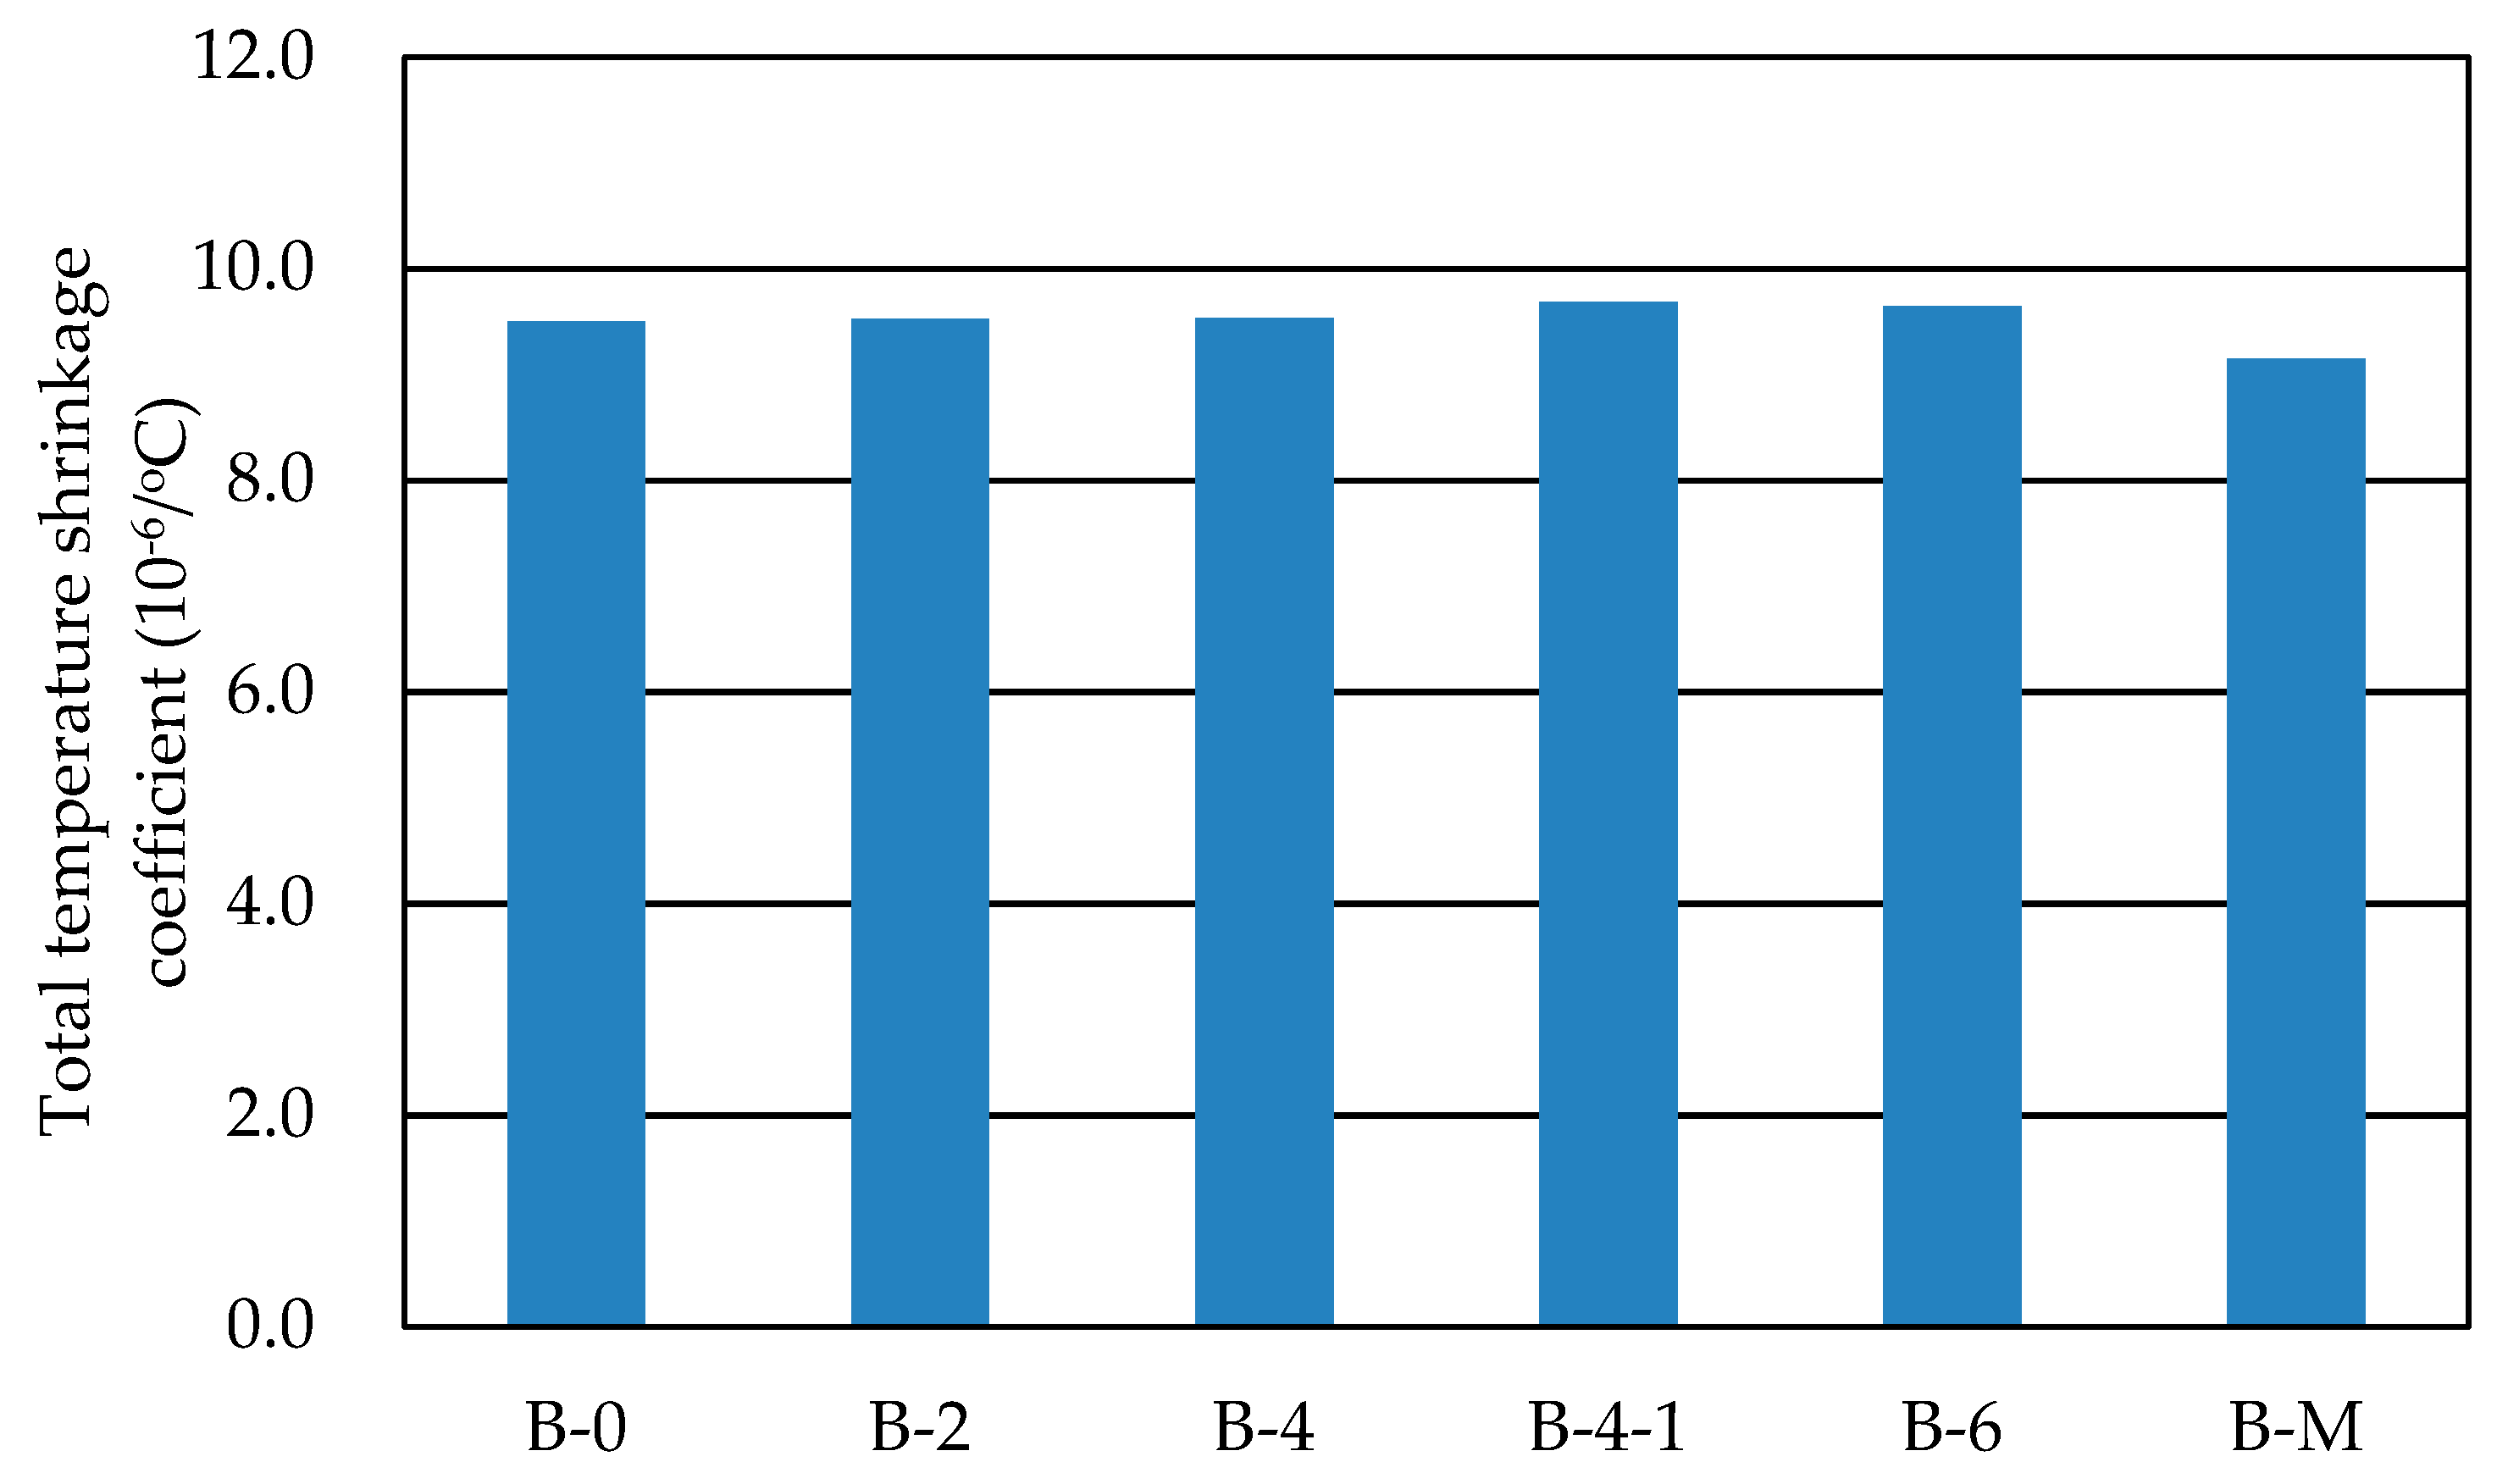
Figure 15 shows the influences of CRCBA and FRCBA on the temperature coefficient of each CSM at various temperatures. Figure 16 shows the influences of CRCBA and FRCBA on the average temperature shrinkage coefficient of CSM. As can be seen from Figure 15, the temperature shrinkage coefficient of each CSM fluctuates slightly with the change of temperature. For the CSM without FRCBA, the trends are consistent and the minimum attached to the temperature decreasing from 20 °C to 10 °C. The temperature shrinkage coefficient increases with temperature increase above 20 °C and decrease below 10 °C. The addition of FRCBA slightly changed the trends at temperature below 10 °C.
As shown in Figure 16, the average temperature shrinkage coefficient increases with the increase of CRCBA content. However, the amplitude is very small. The average temperature shrinkage coefficient of B-6 is only 1.6% larger than that of B-0. It is shown that the CRCBA content has little effect on the average temperature shrinkage coefficient of the CSMs. In addition, the average temperature shrinkage coefficient of B-4-1 increases by 1.7% compared with that of B-4 and that of B-M decreases by 5.2% compared with that of B-6. It is shown that the influence of FRCBA content on the average temperature shrinkage coefficient of CSM is also not so significant.
4. Discussion and Conclusions
Based on the test results, it is discovered that the use of CRCBA reduced the unconfined compressive strength in a certain extent. Although the unconfined compressive strength of 7d has no significant relationship with the amount of CRCBA, the increase of CRCBA content might affect the later strength of CSM. For example, the 7d unconfined compressive strength of B-4 is almost the same as B-2 but the 28d strength of B-4 is lower than that of B-2. A little of FRCBA increases the unconfined compressive strength to a certain extent. For example, the 7d and 28d strengths of B-4-1 are increased by 9.94% and 4.74%, respectively, compared with those of B-4. Compared with B-6, the strength of B-M decreases significantly and with the increase of curing age, the decreasing rate shows an increasing trend. Although, as aggregate applied in pavement base and subbase, the RCBA only can meet the requirements of grade 2 and below highways, the early strength of cement stabilized recycled aggregates with clay brick particles could meet the requirements of all grade highways except the extremely heavy duty express highway. The strength of the mixtures and the influence of different content of clay brick particles need further investigation, to better understand the mechanism of interaction of clay brick particle in the mixtures.
A small amount of clay brick particles has little effect on the resilience modulus of CSM. With the increase of clay brick particles, the modulus increases significantly. With the addition of coarse clay brick particles, the strength loss rate of the CSM decreases significantly after the freeze-thaw cycles, the scoured weight loss rate almost remains constant. The increase of clay brick particles could significantly reduce the drying shrinkage coefficient in the early stage of construction. The drying shrinkage coefficient decreased with the increase of clay brick particles (no matter what the particle size is). The drying shrinkage coefficient in the early period of B-0 decreased 71.8% in comparison with that of B-M. At the same time, the increase of clay brick particles had almost no effect on the temperature shrinkage performance of the mixture.
The influences of clay brick particles on the performances of cement stabilized recycled aggregate as pavement base were investigated. Some conclusions can be drawn as followings.
- (1)
- The clay brick particles can reduce the unconfined compressive strength of cement stabilized recycled aggregate. The reduction rate may increase with the increasing age of the mixture.
- (2)
- The addition of coarse clay brick particles has small influences on the compressive resilient modulus of the mixture and the addition of fine particle could significantly increase the compressive resilience modulus of the mixture.
- (3)
- The frost resistance of the mixture increases first and then slightly decreases with the increase of coarse clay brick particles. The addition of fine clay brick particles could enhance the frost resistance of the mixture.
- (4)
- The addition of clay brick particles had almost no influence on the scoured weight loss of the mixture; the addition of fine clay brick particles had almost no influence on the scoured weight loss of the mixture.
- (5)
- The drying shrinkage coefficient of the mixture decreases with the increase of clay brick particles no matter what the particle size is. The effect of clay brick particles on the temperature shrinkage performance of the mixture is not so significant.
- (6)
- Though the test evaluation of various performances shows that clay brick particles have different effects on the properties of cement stabilized pavement base materials, it can meet the requirements of the pavement base in many cases. For actual applications, it is still necessary to be optimized considering the load and climate conditions.
It should also be noted that clay brick particles are generally considered to compromise the performance of CSM. The main purpose of this paper is to investigate the possible influences of clay brick particles on CSM and the feasibility of CSM including clay brick particles used as pavement base. Many aspects need to be determined according to the specific conditions of the whole highway. So, in the current stage, it is really difficult to determine the “optimum clay brick particle content”. Future studies should take this issue into consideration.
Author Contributions
Conceptualization, Y.M., C.L. and W.Y.; Methodology, Y.H., Y.M. and C.L.; Software, N/A; Validation, W.Y., Y.H. and Y.M.; Formal Analysis, N/A; Investigation, Y.M., C.L., Y.H. and L.W.; Resources, N/A; Data Curation, Y.H. and Y.M.; Writing—Original Draft Preparation, W.Y. and C.L.; Writing—Review & Editing, Y.H., L.W. and Y.M.; Visualization, W.Y. and C.L.; Supervision, Y.M.; Project Administration, Y.M.; Funding Acquisition, Y.M.
Funding
This research was funded by the Science and Technology Project of Beijing Municipal Commission of Transport (2016-LZJKJ-01-006) which has been led by the Beijing Key Laboratory of Transportation Engineering, Beijing University of Technology.
Acknowledgments
The authors would like to thank the financial support from the Beijing Municipal Commission of Transport.
Conflicts of Interest
The authors declare no conflict of interest.
References
- Federal Report of Inspection on the Application of Law on the Prevention and Control of the Solid Waste in People’s Republic of China. 2017. Available online: http://npc.people.com.cn/n1/2017/1102/c14576-29622406.html (accessed on 11 February 2017).
- Sobhan, K.; Krizek, R.J. Fatigue Behavior of Fiber-Reinforced Recycled Aggregate Base Course. J. Mater. Civ. Eng. 1999, 11, 124–130. [Google Scholar] [CrossRef]
- Chini, A.R.; Kuo, S.S.; Armaghani, J.M.; Duxbury, J.P. Test of recycled concrete aggregate in accelerated test track. J. Transp. Eng. 2001, 127, 486–492. [Google Scholar] [CrossRef]
- Etxeberria, M.; Vázquez, E.; Marí, A.; Barra, M. Influence of amount of recycled coarse aggregates and production process on properties of recycled aggregate concrete. Cem. Concr. Res. 2007, 37, 735–742. [Google Scholar] [CrossRef]
- Huang, B.; Dong, Q.; Burdette, E.G. Laboratory evaluation of incorporating waste ceramic materials into portland cement and asphaltic concrete. Constr. Build. Mater. 2009, 23, 3451–3456. [Google Scholar] [CrossRef]
- Thomas, C.; Setién, J.; Polanco, J.A.; Alaejos, P.; Juan, M.S.D. Durability of recycled aggregate concrete. Constr. Build. Mater. 2013, 40, 1054–1065. [Google Scholar] [CrossRef]
- Xiao, J.; Lu, D.; Ying, J. Durability of Recycled Aggregate Concrete: An Overview. J. Adv. Concr. Technol. 2013, 11, 347–359. [Google Scholar] [CrossRef] [Green Version]
- Guo, H.; Shi, C.; Guan, X.; Zhu, J.; Ding, Y.; Ling, T.C. Durability of recycled aggregate concrete—A review. Cem. Concr. Compos. 2018, 89, 251–259. [Google Scholar] [CrossRef]
- Abdulla, N. Effect of recycled coarse aggregate type on concrete. J. Mater. Civ. Eng. 2015, 27, 04014273. [Google Scholar] [CrossRef]
- Chi, S.P.; Chan, D. Feasible use of recycled concrete aggregates and crushed clay brick as unbound road sub-base. Constr. Build. Mater. 2006, 20, 578–585. [Google Scholar] [CrossRef]
- Chi, S.P.; Chan, D. Paving blocks made with recycled concrete aggregate and crushed clay brick. Constr. Build. Mater. 2006, 20, 569–577. [Google Scholar] [CrossRef]
- Khalaf, F.M. Using crushed clay brick as coarse aggregate in concrete. J. Mater. Civ. Eng. 2006, 18, 518–526. [Google Scholar] [CrossRef]
- Debieb, F.; Kenai, S. The use of coarse and fine crushed bricks as aggregate in concrete. Constr. Build. Mater. 2008, 22, 886–893. [Google Scholar] [CrossRef]
- Bektas, F.; Wang, K.; Ceylan, H. Effects of crushed clay brick aggregate on mortar durability. Constr. Build. Mater. 2009, 23, 1909–1914. [Google Scholar] [CrossRef]
- Cahim, P. Mechanical properties of brick aggregate concrete. Constr. Build. Mater. 2009, 23, 1292–1297. [Google Scholar] [CrossRef]
- Syed Ishtiaq, A.; Sushanta, R. Effect of crushed clay brick as coarse aggregate on creep behavior of concrete. Adv. Mater. Res. 2011, 261–263, 178–181. [Google Scholar] [CrossRef]
- Kenai, S.; Debieb, F. Characterization of the durability of recycled concretes using coarse and fine crushed bricks and concrete aggregates. Mater. Struct. 2011, 44, 815–824. [Google Scholar] [CrossRef]
- Yang, J.; Du, Q.; Bao, Y. Concrete with recycled concrete aggregate and crushed clary bricks. Constr. Build. Mater. 2011, 25, 1935–1945. [Google Scholar] [CrossRef]
- Ahmad, S.; Roy, S. Creep behavior and its prediction for normal strength concrete made from crushed clary bricks as coarse aggregate. J. Mater. Civ. Eng. 2011, 24, 308–314. [Google Scholar] [CrossRef]
- Afshinnia, K.; Poursaee, A. The potential of ground clay brick to mitigate alkali-silica reaction in mortar prepared with highly reactive aggregate. Constr. Build. Mater. 2015, 95, 164–170. [Google Scholar] [CrossRef]
- Caro, S.; Caicedo, B.; Varela, D.; Monroy, J.; Wills, J.; Hernandez, M.A.; Velasquez, O.; Beltran, D. Experimental Evaluation of Erosion Processes in Rigid Pavements. In Airfield and Highway Pavements 2015: Innovative and Cost-Effective Pavements for a Sustainable Future; American Society of Civil Engineers: Reston, VA, USA, 2015; pp. 512–523. [Google Scholar]
- Zeng, M.; Tian, Z.; Xiao, J.; Wu, C. Performance of Cement Stabilized Crushed Stone Pavement Base Materials Containing Construction Waste. J. Wuhan Univ. Technol. 2016, 38, 34–38. [Google Scholar]
- Sheng, Y.; Li, H.; Chen, S. Mix Design of Semi-rigid Base Material Based on Anti-erosion Performance. J. Zhengzhou Univ. Eng. Sci. 2012, 33, 19–23. [Google Scholar]
- Research Institute of Highway, Ministry of Transport. Test Methods of Aggregate for Highway Engineering, JTG E42-2005; Ministry of Transport of the People’s Republic of China: Beijing, China, 2005.
- Research Institute of Highway, Ministry of Transport. Technical Guidelines for Construction of Highway Roadbases, JTG/T F20-2015; Ministry of Transport of the People’s Republic of China: Beijing, China, 2015.
- Research Institute of Highway, Ministry of Transport. Test Methods of Materials Stabilized with Inorganic Binders for Highway Engineering, JTG E51-2009; Ministry of Transport of the People’s Republic of China: Beijing, China, 2009.
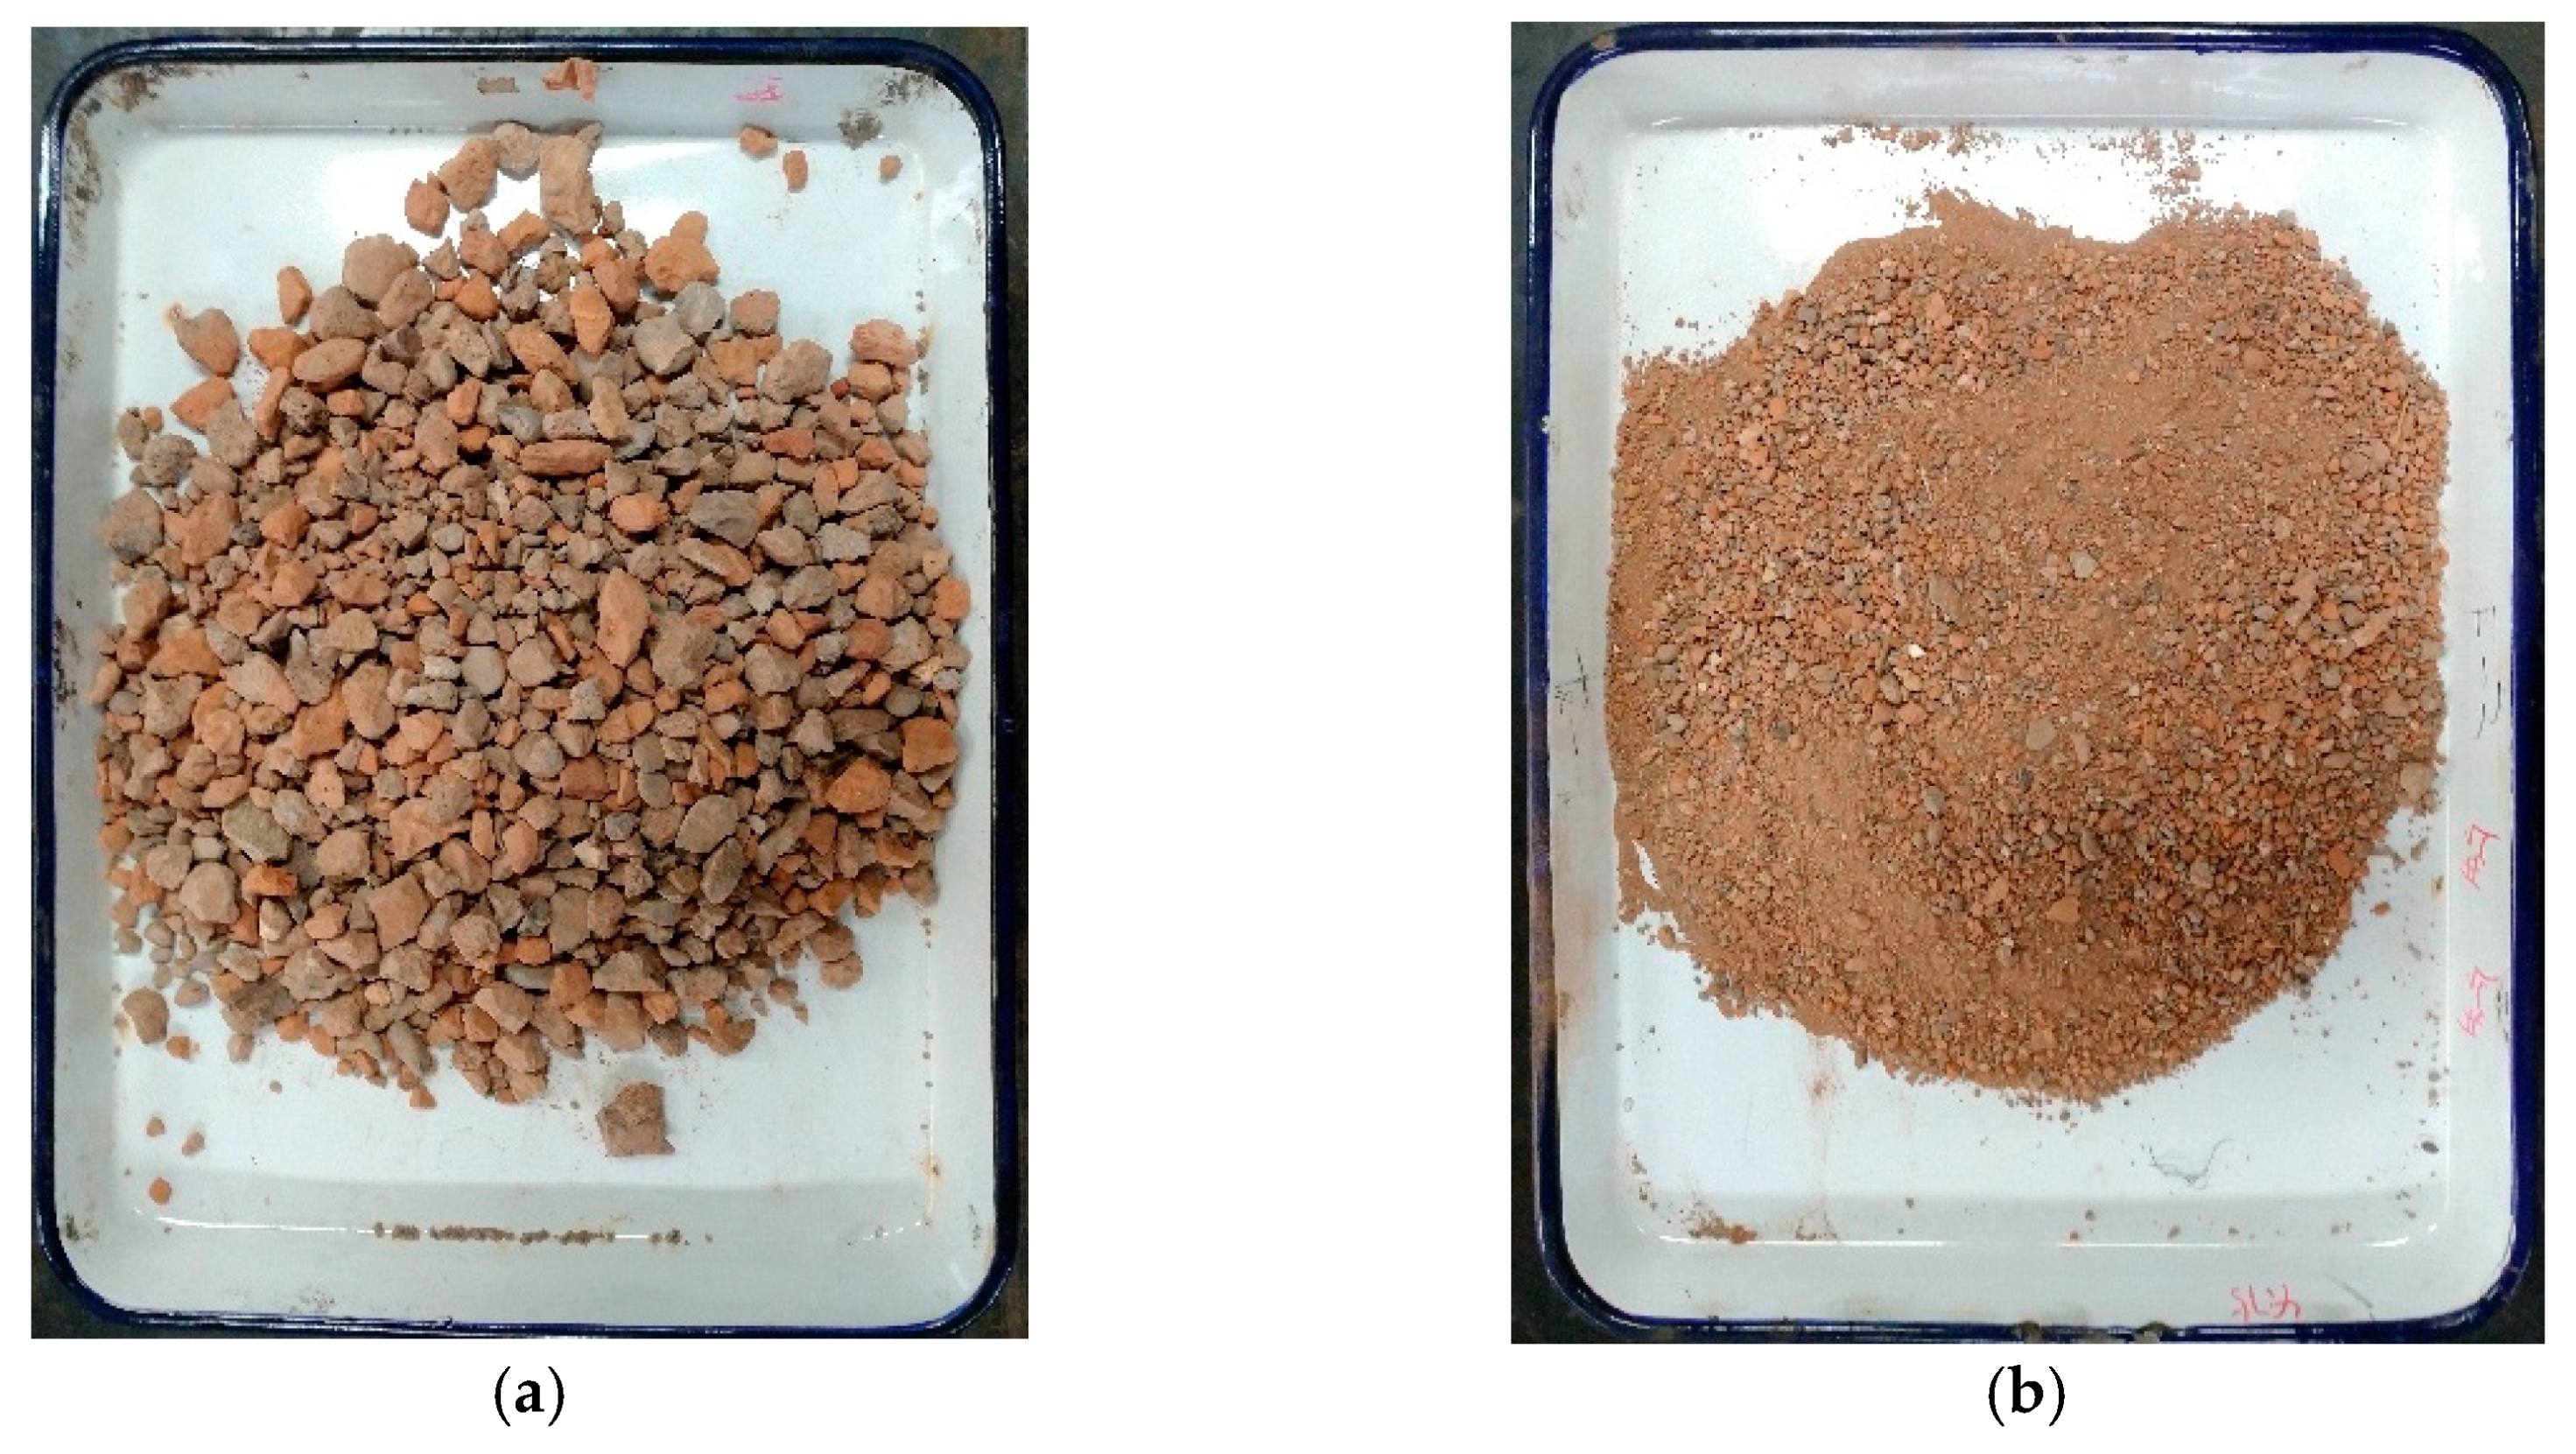
Figure 1.
Recycled concrete and clay brick aggregate (RCBA): (a) Coarse RCBA (CRCBA); (b) Fine RCBA (FRCBA).
Figure 1.
Recycled concrete and clay brick aggregate (RCBA): (a) Coarse RCBA (CRCBA); (b) Fine RCBA (FRCBA).

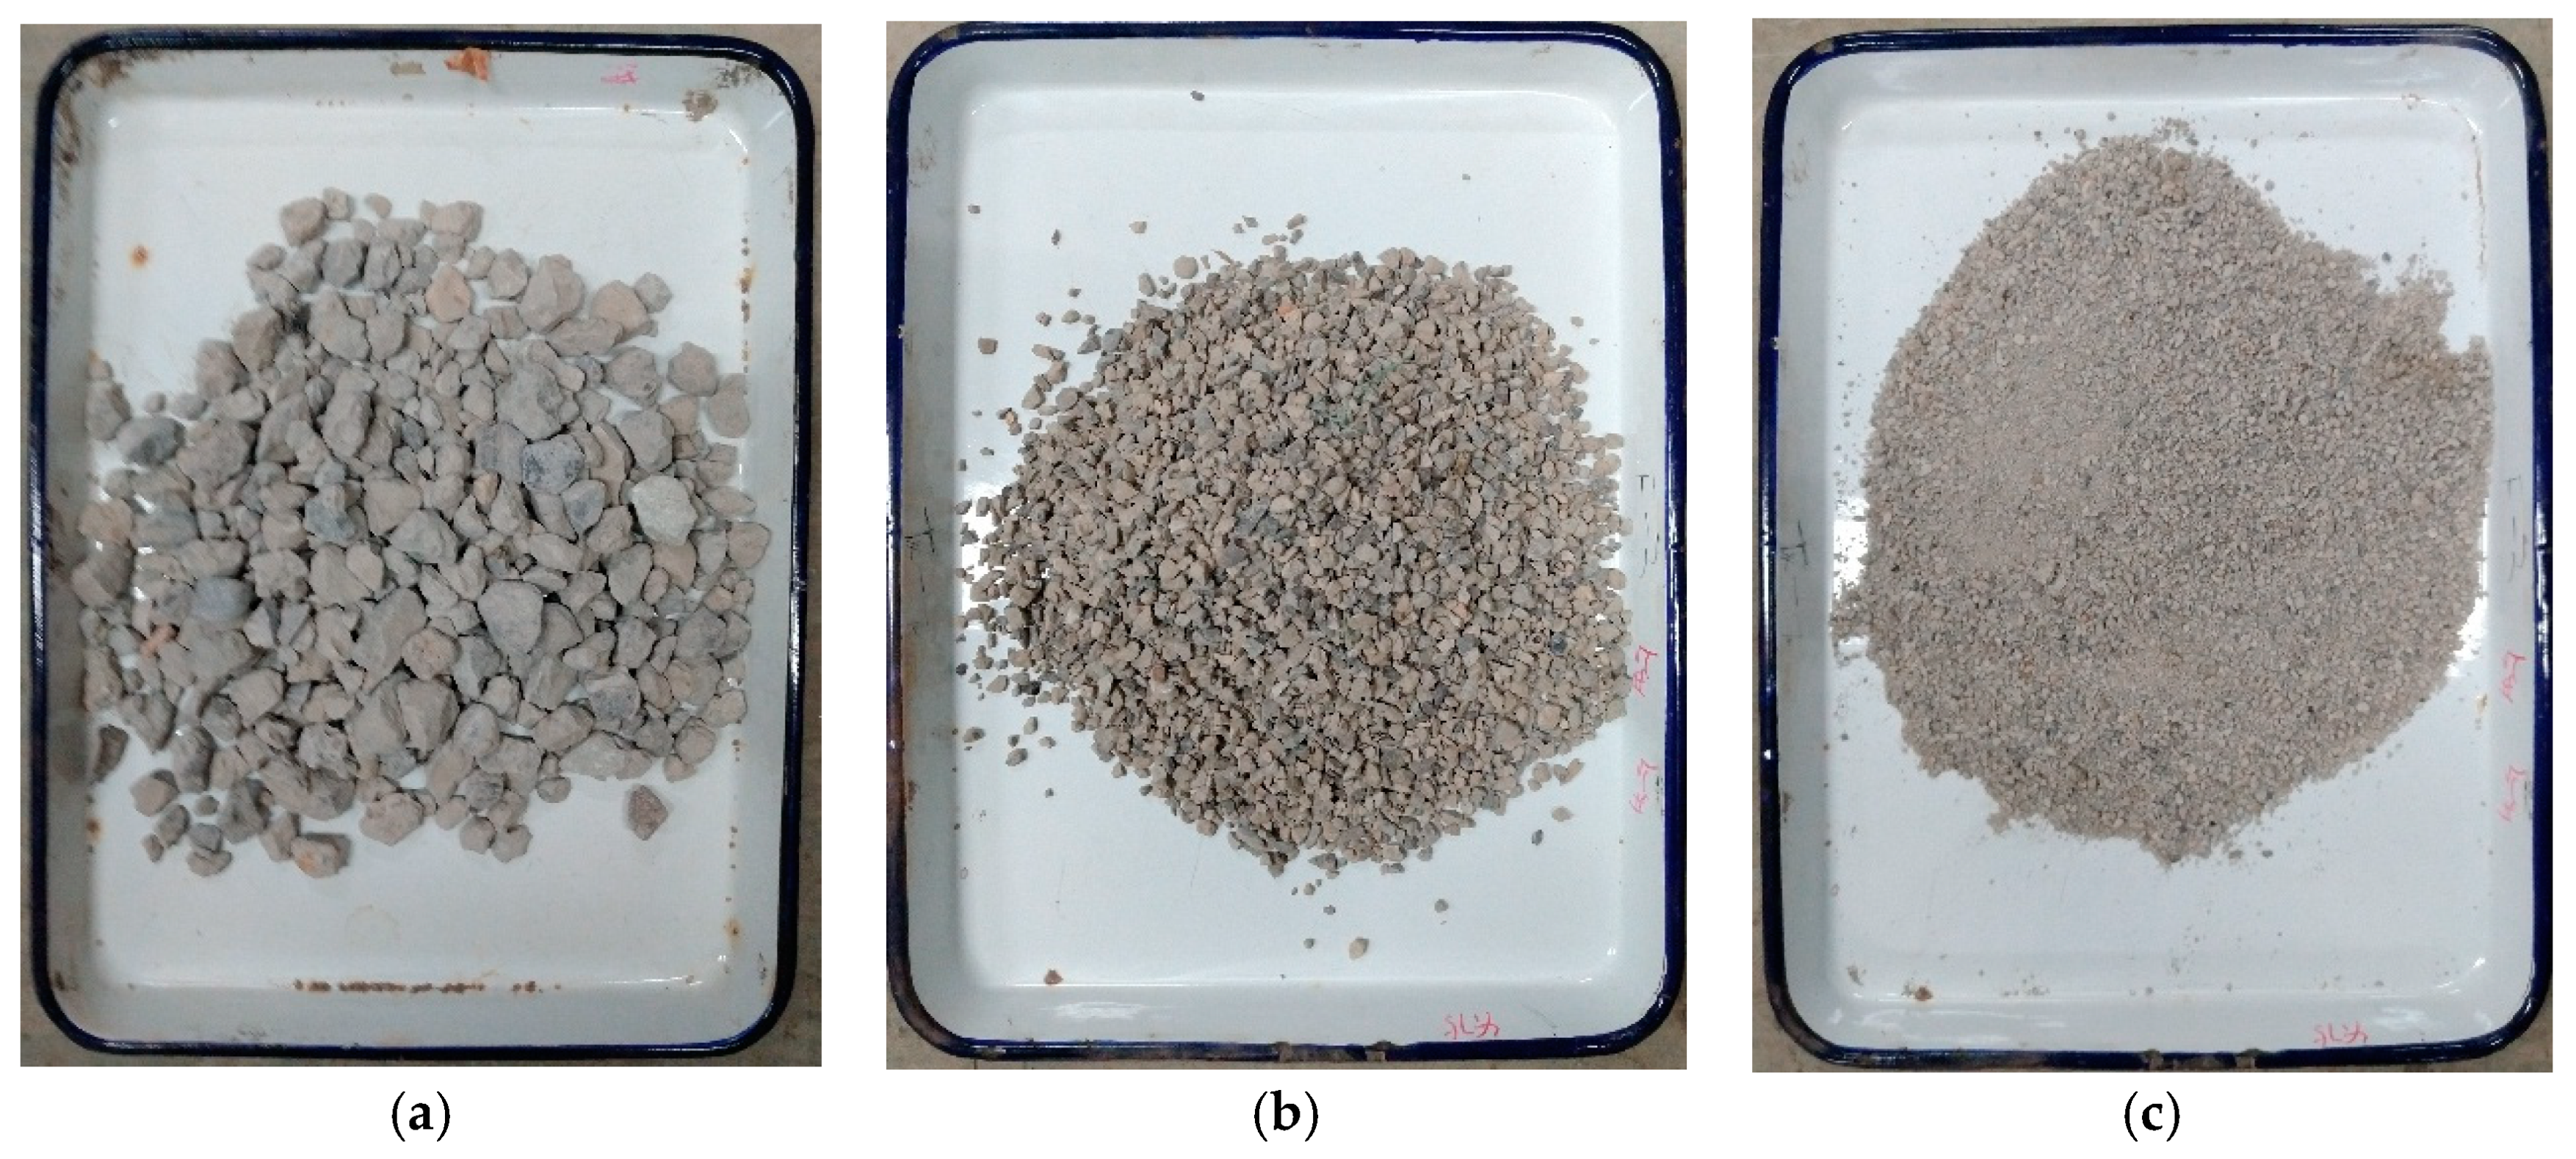
Figure 2.
RCA: (a) 10–25; (b) 5–10; (c) 0–3.

Figure 3.
Gradation curves.

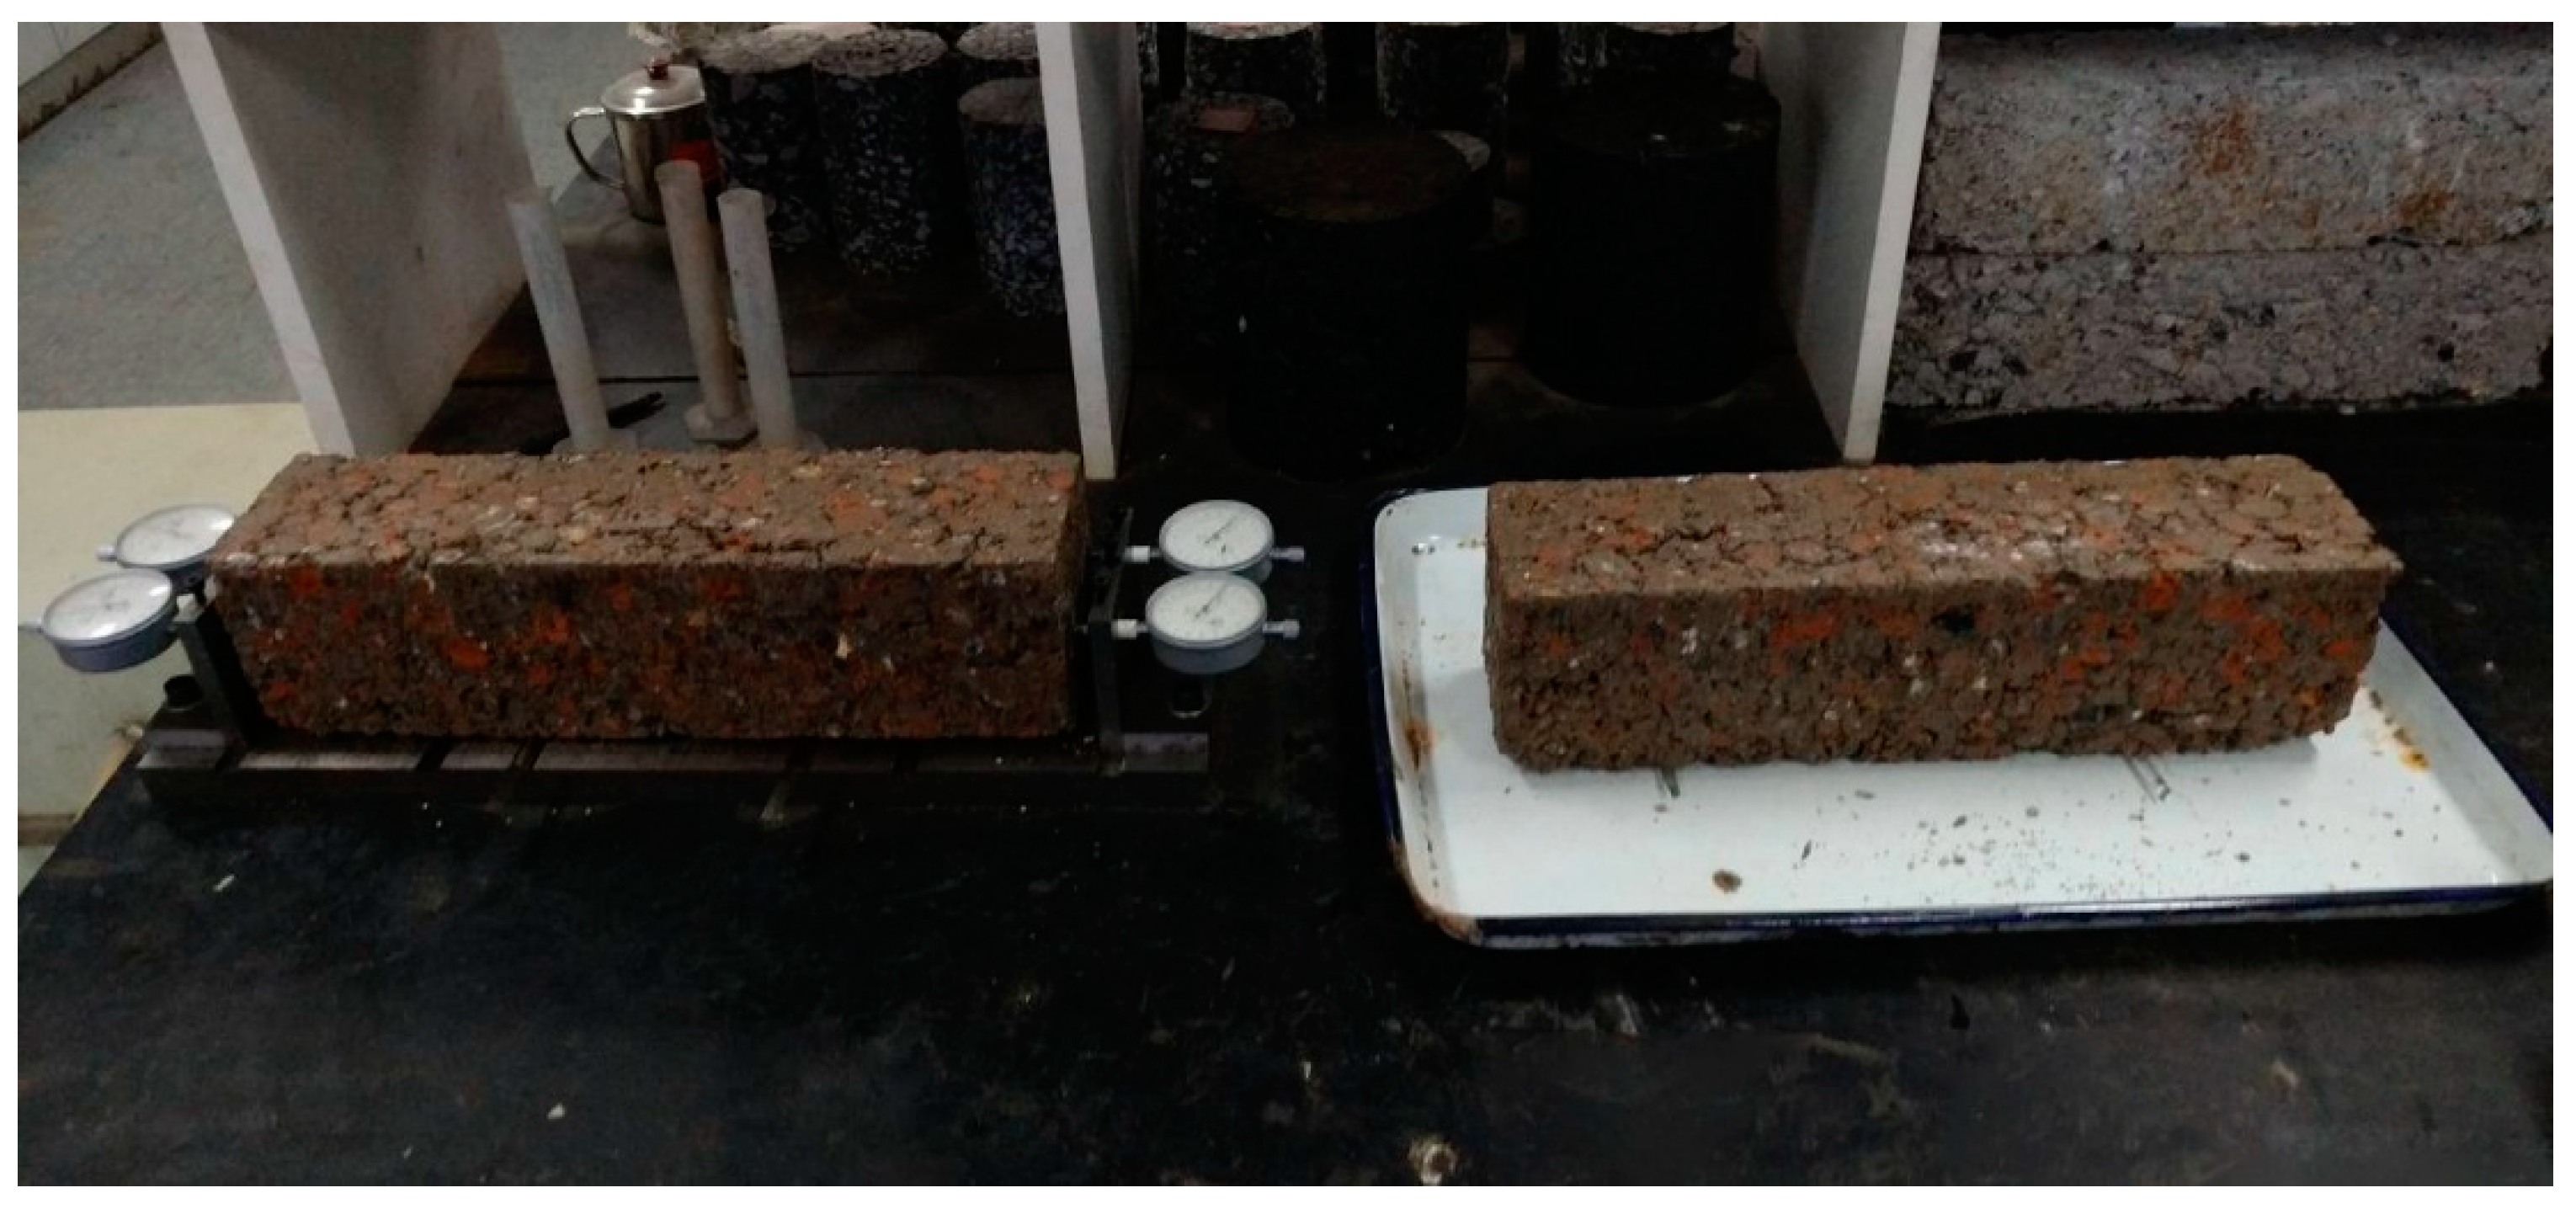
Figure 4.
Specimen with mold and unconfined compression strength test: (a) Specimen with mold; (b) Unconfined compression strength test.
Figure 4.
Specimen with mold and unconfined compression strength test: (a) Specimen with mold; (b) Unconfined compression strength test.

Figure 5.
Compressive resilience modulus test.

Figure 6.
Freeze-thaw cycle specimen.

Figure 7.
Shrinkage test specimen.

Figure 8.
Influences of CRCBA and FRCBA on the strength: (a) 7d; (b) 28d.

Figure 9.
Influences of CRCBA and FRCBA on the compression modulus of resilience.

Figure 10.
Influences of CRCBA and FRCBA on the frost resistance.

Figure 11.
Typical specimen surface before and after scouring: (a) Before scouring; (b) After scouring.
Figure 11.
Typical specimen surface before and after scouring: (a) Before scouring; (b) After scouring.

Figure 12.
Influences of CRCBA and FRCBA on the anti-erosion properties.

Figure 13.
Relationship between daily water loss rate and time.

Figure 14.
Influences of CRCBA and FRCBA on the drying shrinkage performance.

Figure 15.
Influences of CRCBA and FRCBA on the temperature shrinkage at various temperatures.

Figure 16.
Influences of CRCBA and FRCBA on the average temperature shrinkage performance.


Table 1.
Properties of RCBA and RCA.
| Aggregate Type | Apparent Density/kg/m3 | Bulk Density/kg/m3 | Porosity/% | Needle-Like Particle Content/% | Crushing Value | Water Content/% | Water Absorption Rate/% |
|---|---|---|---|---|---|---|---|
| CRCBA | 2586 | 1179 | 48 | 3.3 | 30.7 | 7.0 | 9.57 |
| FRCBA | 2477 | 1295 | 47 | - | 33.1 | 14.75 | 11.48 |
| RCA 10–25 | 2742 | 1455 | 48 | 2.0 | 10.5 | 2.9 | 3.8 |
| RCA 5–10 | 2738 | 1468 | 48 | 1.8 | 17.4 | 3.3 | 4.0 |
| RCA 0–3 | 2730 | 1460 | 47 | - | - | 4.5 | 4.3 |
Table 2.
Gradation range of RCBA and RCA.
| Sieve Size/mm | Passing Rate/% | ||||
|---|---|---|---|---|---|
| CRCBA | FRCBA | RCA 10–25 | RCA 5–10 | RCA 0–3 | |
| 26.5 | 100.00 | 100.00 | 100.00 | 100.0 | 100.00 |
| 19 | 99.40 | 100.00 | 76.75 | 100.0 | 100.00 |
| 16 | 98.50 | 100.00 | 44.34 | 100.0 | 100.00 |
| 13.2 | 92.20 | 100.00 | 24.43 | 100.0 | 100.00 |
| 9.5 | 74.40 | 100.00 | 3.89 | 100.0 | 100.00 |
| 4.75 | 23.70 | 96.00 | 1.02 | 38.4 | 100.00 |
| 2.36 | 9.70 | 72.50 | 0.99 | 2.8 | 75.40 |
| 1.18 | 7.90 | 54.60 | 0.96 | 2.1 | 45.28 |
| 0.6 | 7.10 | 40.20 | 0.96 | 2.0 | 28.70 |
| 0.3 | 6.40 | 24.80 | 0.89 | 2.0 | 13.71 |
| 0.15 | 6.00 | 14.60 | 0.75 | 1.1 | 7.89 |
| 0.075 | 5.00 | 10.70 | 0.57 | 0.4 | 4.81 |
Table 3.
Main components of CRCBA.
| Components | Weight/g | Weight Percentage/% | |
|---|---|---|---|
| Glass | 6.7 | 0.09 | |
| Ceramics | 36.3 | 0.49 | |
| Metal | 10 | 0.13 | |
| Organic materials | Plastic | 3 | 0.04 |
| Wood | 2.5 | 0.03 | |
| Pebble | 878.7 | 11.81 | |
| Mortar | 1612.6 | 21.67 | |
| Sand | 2989.9 | 40.18 | |
| Brick | 1882.5 | 25.30 | |
| Residual powder (high content of brick powder) | 18.5 | 0.25 | |
| Total | 7440.7 | 100.00 | |
Table 4.
Main components of FRCBA.
| Components | Weight/g | Weight Percentage/% |
|---|---|---|
| Mortar | 107.9 | 25.25 |
| Sand (include pebble) | 179.3 | 41.95 |
| Brick | 137.4 | 32.15 |
| Glass/Ceramics | 1.3 | 0.30 |
| Organics (include wood, plastic, rubber) | 1 | 0.23 |
| Others (include metal) | 0.5 | 0.12 |
| Total | 427.4 | 100.00 |
Table 5.
Composition of each CSM.
| ID | Proportion/% | |||||
|---|---|---|---|---|---|---|
| CRCBA | FRCBA | RCA 10–25 | RCA 5–10 | RCA 0–3 | Mineral Powder | |
| B-0 | 0 | 0 | 43 | 26 | 26 | 5 |
| B-2 | 20 | 0 | 32 | 18 | 26 | 4 |
| B-4 | 40 | 0 | 28 | 2 | 27 | 3 |
| B-4-1 | 40 | 10 | 28 | 1 | 20 | 1 |
| B-6 | 60 | 0 | 20 | 0 | 16 | 4 |
| B-M | 50 | 30 | 20 | 0 | 0 | 0 |
Table 6.
Contents of CRCBA, FRCBA and total brick particle of each CSM.
| ID | Content of CRCBA/% | Content of FRCBA/% | Total Content of Brick Particles/% |
|---|---|---|---|
| B-0 | 0 | 0 | 0 |
| B-2 | 20 | 0 | 5.06 |
| B-4 | 40 | 0 | 10.12 |
| B-6 | 60 | 0 | 15.18 |
| B-4-1 | 40 | 10 | 13.4 |
| B-M | 50 | 30 | 22.3 |
Table 7.
Optimal moisture content and maximum dry density.
| ID | Optimum Water Content/% | Maximum Dry Density/g/cm3 |
|---|---|---|
| B-0 | 8.8 | 2.132 |
| B-2 | 9.7 | 2.037 |
| B-4 | 11.5 | 1.986 |
| B-6 | 11.7 | 2.003 |
| B-4-1 | 11.3 | 1.997 |
| B-M | 12.42 | 1.923 |
© 2018 by the authors. Licensee MDPI, Basel, Switzerland. This article is an open access article distributed under the terms and conditions of the Creative Commons Attribution (CC BY) license (http://creativecommons.org/licenses/by/4.0/).
Share and Cite
MDPI and ACS Style
Miao, Y.; Yu, W.; Hou, Y.; Liu, C.; Wang, L. Influences of Clay Brick Particles on the Performance of Cement Stabilized Recycled Aggregate as Pavement Base. Sustainability 2018, 10, 3505. https://doi.org/10.3390/su10103505
AMA Style
Miao Y, Yu W, Hou Y, Liu C, Wang L. Influences of Clay Brick Particles on the Performance of Cement Stabilized Recycled Aggregate as Pavement Base. Sustainability. 2018; 10(10):3505. https://doi.org/10.3390/su10103505
Chicago/Turabian StyleMiao, Yinghao, Weixiao Yu, Yue Hou, Cong Liu, and Linbing Wang. 2018. "Influences of Clay Brick Particles on the Performance of Cement Stabilized Recycled Aggregate as Pavement Base" Sustainability 10, no. 10: 3505. https://doi.org/10.3390/su10103505
Note that from the first issue of 2016, this journal uses article numbers instead of page numbers. See further details here.