Impacts of Carbon Pricing on Brazilian Industry: Domestic Vulnerability and International Trade Exposure


1
Energy Planning Program, Graduate School of Engineering, Federal University of Rio de Janeiro, Centro de Tecnologia, Bloco C, Sala 211, Cidade Universitária, Ilha do Fundão, 21941-972 Rio de Janeiro, Brazil
2
Industrial Engineering, Federal University of Rio de Janeiro, Avenida Aluizio da Silva Gomes, 50, Novo Cavaleiros, Macaé, 27930-560 Macaé, Brazil
*
Author to whom correspondence should be addressed.
Sustainability 2018, 10(7), 2390; https://doi.org/10.3390/su10072390
Submission received: 10 May 2018
/
Revised: 4 July 2018
/
Accepted: 6 July 2018
/
Published: 9 July 2018
Abstract
:After COP 21, with the adoption of the Paris Agreement in December 2015, the outlook for carbon pricing policies has been widened. While the agreement does not directly establish a global carbon pricing, the provisions accounted for in Article 6 have the potential to increase international cooperation in favor of greenhouse gas (GHG) mitigation through market mechanisms. The Brazilian Nationally Determined Contribution (NDC) considers the use of such mechanisms, though the configuration of the Brazilian climate policy does not specify the economic instruments for carbon pricing. When examining the recent evolution of GHG emissions in Brazil, the already achieved reduction in deforestation sheds light on the need to address GHG mitigation in other sectors, such as industry. Therefore, this paper analyzes the impacts of carbon pricing on the Brazilian industry in terms of sectorial value added (VA), emissions intensity, international trade exposure, and the risk of carbon leakage. Results indicate that, considering a price of carbon of US$10/tCO2, the cost of reducing emissions from 35% to 45% (same range of the Brazilian NDC) could represent an impact of 0.3% to 3.7% on sectorial VA. However, results for emissions intensity and international trade reveal medium to high carbon leakage risks for all analyzed industrial sectors.
1. Introduction
Climate change is one of the greatest economic and political challenges faced by the world economies today [1]. It implies the need to reconcile the global nature of the problem with actions at regional, national, and/or local levels [2,3,4]. Impacts of climate change have increasingly been gaining a central role in political, economic, social, and environmental discussions, as countries, by signaling the transition to a low carbon development model, are looking for solutions and mechanisms to reduce emissions of greenhouse gases (GHG) that are technically and economically feasible [5].
With pressure on governments to urgently “decarbonize” the global economy, policy makers have turned to market solutions to reduce the carbon intensity of the economy [6,7,8,9]. In international discussions, there is a strong debate about alternative policies and instruments that can be used to put a price on carbon and signal to economic agents a development path based on low carbon emissions [10,11]. Policy makers have at their disposal command-and-control measures and market-based instruments. The latter includes the commercialization of GHG emissions permits (emissions trading schemes—ETS) and the taxation of emissions (carbon tax) [12]. Different designs of carbon pricing instruments (CPI) are being developed by countries, considering national and regional specificities as well as the dynamics of involved sectors [3,6,13].
There are several opportunities to reduce GHG emissions in Brazil [14,15]. More specifically, in the industrial sector, incentives for efficiency and processes innovations (R&D), new financing instruments, implementing specific regulatory instruments—such as a carbon pricing—and technological standards are key drivers for developing a low carbon industrial sector in Brazil [16,17]. Nevertheless, challenges also exist in this sector, such as the high abatement costs for some mitigation options, and the incipient stage of some technologies [18,19,20], the need for adaptability of those technologies to Brazilian plants, and the difficulty to obtain cheap loans and financing [16]. One great gap to be filled, therefore, is to analyze how CPIs can impact industrial sectors, in addition to understanding how such instruments would interact with other already existing policies, like industrial, trade, and tax policies. Evaluating the interactions between an eventual CPI and existing policies for the industrial sector should consider possible impacts on international competitiveness. It is also worth noting that carbon pricing policies for industry may indirectly impact other economic sectors, affecting the sectorial gross domestic product (GDP), trade balance, employment level, and the population’s purchasing power.
Therefore, this paper evaluates the possible impacts of CPI on the Brazilian industry in terms of sectorial value added (VA), emissions intensity, and international trade exposure. To do so, the next section highlights the current debate about the definition and design of CPI, followed by an analysis of the regulatory and institutional frameworks that constitute the Brazilian climate policy. Then, Section 3 presents the methods used in this study, which is composed by the country’s industrial sector characterization, its comparison to international benchmarks in terms of emission intensity, and the definition of the indicators selected for the analysis. Results are presented in Section 4 concerning Brazil’s industry GHG emission profile, its comparison to international benchmarks, besides simulating the impacts of CPI on Brazil’s industrial sectors in terms of VA, emissions intensity, and exposure to the international market. Finally, Section 5 summarizes the main findings of the paper.
2. Carbon Pricing Instruments in the Brazilian Climate Policy Framework
The (monetary) internalization of external costs should consider how to value these costs and which environmental policy instruments should be used to achieve the optimal level of pollution (social optimum) [20]. In this sense, the classical environmental policy instruments can be classified as command-and-control instruments (mandatory) or market instruments (incentives). The main differences between them are their cost-effectiveness, costs associated with monitoring, equity and distribution, flexibility, and level of information required [8,10,21,22]. Market instruments are seen as cost-effective when compared to command-and-control instruments, since they reach the environmental goal at the lowest abatement cost, given by the equalization of the marginal abatement cost among the different firms [6,23,24]. Compared to command-and-control mechanisms—like technological, efficiency, and emissions standards—economic instruments provide flexibility to pollutants in order to choose the economically best alternative to achieve the objectives of improving environmental quality and their timing [21,25,26].
2.1. Defining and Designing Carbon Pricing Instruments
Carbon pricing is based on the ‘polluter pays’ principle, which defines responsibility and establishes a cost for GHG emissions, internalizing the negative externality. This principle can be implemented through fiscal policies, for example a carbon tax, or by establishing a carbon market or a pollution trading system, known as emission trading schemes (ETS). By determining a price for GHG emissions, firms are encouraged to change their production processes to reduce their emissions per unit of output. These policies also affect consumer decisions, because rising prices of carbon-intensive goods encourage changes in consumption patterns toward less carbon-intensive goods.
These two instruments set the price differently [3,13]. Under a carbon tax, the price of carbon (sometimes only CO2, sometimes CO2e) emissions is defined directly by the regulatory authority. On the other hand, in the ETS, the amount of emissions is defined, rather than the price. That is, the price of emissions is set indirectly: the regulatory authority determines the total allowed amount of emissions and then the price is established by the supply and demand of licenses in the carbon market [26]. Some other issues are also relevant in designing a CPI, such as allocation methods, recycling policies, sectorial coverage, GHG reduction goals, MRV system, among others.
Although there is broad agreement among economists about the potential advantages of pricing GHG emissions, there is an intense debate as to which would be the best CPI option: ETS or carbon tax. Researchers and academics offer different perspectives on which instrument is better. For instance, some argue that a carbon tax is a more efficient method than an ETS, by stating that such a policy can act directly on issues related to equity and distribution, through different forms of recycling revenues [27,28,29,30,31,32]. In addition, the tax value is known by all economic agents and it does not change frequently as in the ETS, offering more security and stability [33,34,35,36]. Others, however, believe that the ETS is a more interesting instrument, since it is more cost-effective and dynamically efficient [6,7,25,37,38,39,40,41,42]. Some also argue that it provides opportunity for non-polluters, encouraging efficiency gains [43,44,45,46,47,48].
2.2. Carbon Pricing in the Brazilian Climate Policy
In Brazil, the National Policy on Climate Change (NPCC) promulgated through Law 12,187 of 29 December 2009 is the regulatory framework that guides the government under the climate change institutional arrangement. The NPCC aims to reduce anthropogenic GHG emissions and strengthen carbon removal through national sinks and foster measures that promote adaptation to climate change. Article 12 of the NPCC specifically states that the country has adopted GHG mitigation targets from 36.1% to 38.9% of its 2020 projected emissions as a voluntary commitment [49]. This goal should be achieved through sectorial plans for adaptation and mitigation of climate change that consider sectorial specificities. Brazil is also implementing its NPCC through a broad range of integrated policies and programs, including command-and-control measures, economic incentives, and public and private investments. However, changes in the emissions profile—as will be shown in Section 4—and potential new mitigation policies for the post 2020 period indicate the need to explore new economic instruments. In this context, the Brazilian Federal Government has shown an interest in analyzing CPI frameworks and assessing their potential impacts on the Brazilian economy [6,50,51].
Article 5 of the NPCC states that “the use of financial and economic mechanisms that are national in scope and referring to mitigation and adaptation to climate change” will be encouraged, emphasizing (in Article 6) that such mechanisms are among those already existing within the framework of the United Nations Framework Convention on Climate Change (UNFCCC), which must present environmental standards and quantifiable and verifiable targets [49]. Brazil already has a legal framework including the use of economic instruments as mechanisms for environmental protection, besides having experience in destining part of taxes collected for social and environmental purposes—for example, Ecological Tax on Circulation of Goods and Services (Ecological ICMS) and Contribution of Intervention in the Economic Domain—Fuel (CIDE Fuels). However, Article 6 (item VI) of the NPCC also refers to the possibility of taxing emissions. According to the paragraph, “fiscal and tax measures to encourage the reduction of emissions and removal of greenhouse gases, including differentiated rates, exemptions, compensations, and incentives, to be established in a specific law” may be used. Nevertheless, given the complexity of the tax system and the high tax burden, any attempt on taxing emissions will face resistance from citizens and companies [52].
Nonetheless, the NPCC also refers to the possibility of adopting a market system for trading emission certificates. In Article 4, item VIII, it is affirmed that “the development of the Brazilian Emission Reduction Market (MBRE) will be fostered” [50]. Another reference to the use of an ETS occurs in Article 9, which states that this market “will be operationalized in commodities and futures exchanges, stock exchanges and organized over-the-counter entities authorized by the Securities and Exchange Commission (CVM), where securities will be negotiated representing certified greenhouse gas emissions avoided”. In addition, Decree 7.390 (Decree 7.390/2010 regulates some articles of the NPCC and imposes targets for GHG emissions from economic sectors), dated 9 December 2010, states in its Article 4, Item V, Caption 3 that “sectorial targets may be used as parameters for the establishment of the Brazilian Emission Reduction Market—MBRE”. No reference to possible fiscal or tax measures of carbon is presented in this decree [53].
In addition, the Brazilian government presented its NDC at the 21st Conference of the Parties (COP 21) in 2015, whose main result was the establishment of the Paris Agreement. Through this document, Brazil indicated the intention of reducing GHG emissions by 37% below 2005 levels by 2025, with a subsequent indicative contribution to reduce emissions by 43% below 2005 levels by 2030. The target levels were not established in terms of sectorial commitments, however, for internal purposes, it indicates the expected effort from each sector, considering planning objectives and the feasibility of the mitigation effort [50,51]. The NDC document considers the use of economic mechanisms, but the configuration of the Brazilian climate policy is not clear in terms of economic instruments for carbon pricing. As stated in the NDC document, “Brazil reserves its position regarding the possibility of using any market mechanisms that may be established under the Paris Agreement” [51].
Therefore, from the analysis of the official documents associated with the design of the country’s climate policy, it is not clear how this policy will be designed in terms of economic mechanisms and instruments for carbon pricing to reach the goals assumed by the country. Actually, the Brazilian Ministry of Finance (MF) is in charge of coordinating the Partnership for Market Readiness (PMR) project in Brazil (the International Bank for Reconstruction and Development (IBRD) has established the PMR through a trust fund supported by capacity-building grants), aiming at assessing the suitability and feasibility of CPI implementation and their impacts on the Brazilian economy [54]. This includes conducting sectorial studies focusing on the electricity, fuel, industry, and agriculture sectors/subsectors, as well as drawing up proposals for different CPI designs in order to help evaluate the potential impacts of different options. This paper aims to support this goal.
3. Methods
As discussed in Section 2, CPI implementation in Brazil is still under discussion. Thus, the analysis of the economic and sectorial impacts of CPI on the country’s industrial sector should be seen as theory, based on a qualitative assessment or a quantitative modeling (input–output matrix or a computable general equilibrium—CGE, for example).
This study focuses on developing quantitative indicators of industrial vulnerability to CPI. These indicators were built from the primary data from public institutions, such as the Ministry of Mines and Energy (MME); Ministry of Science, Technology and Innovation (MCTI); Ministry of Finance (MF); Ministry of Development, Industry and Commerce (MDIC); the Brazilian Institute of Geography and Statistics (IBGE); the National Development Bank (BNDES); and National Industry Confederation (CNI), among others [13,55,56,57,58,59,60,61,62,63]. When related to international experiences, other sources were also used [64,65,66,67], as detailed in the following subsections.
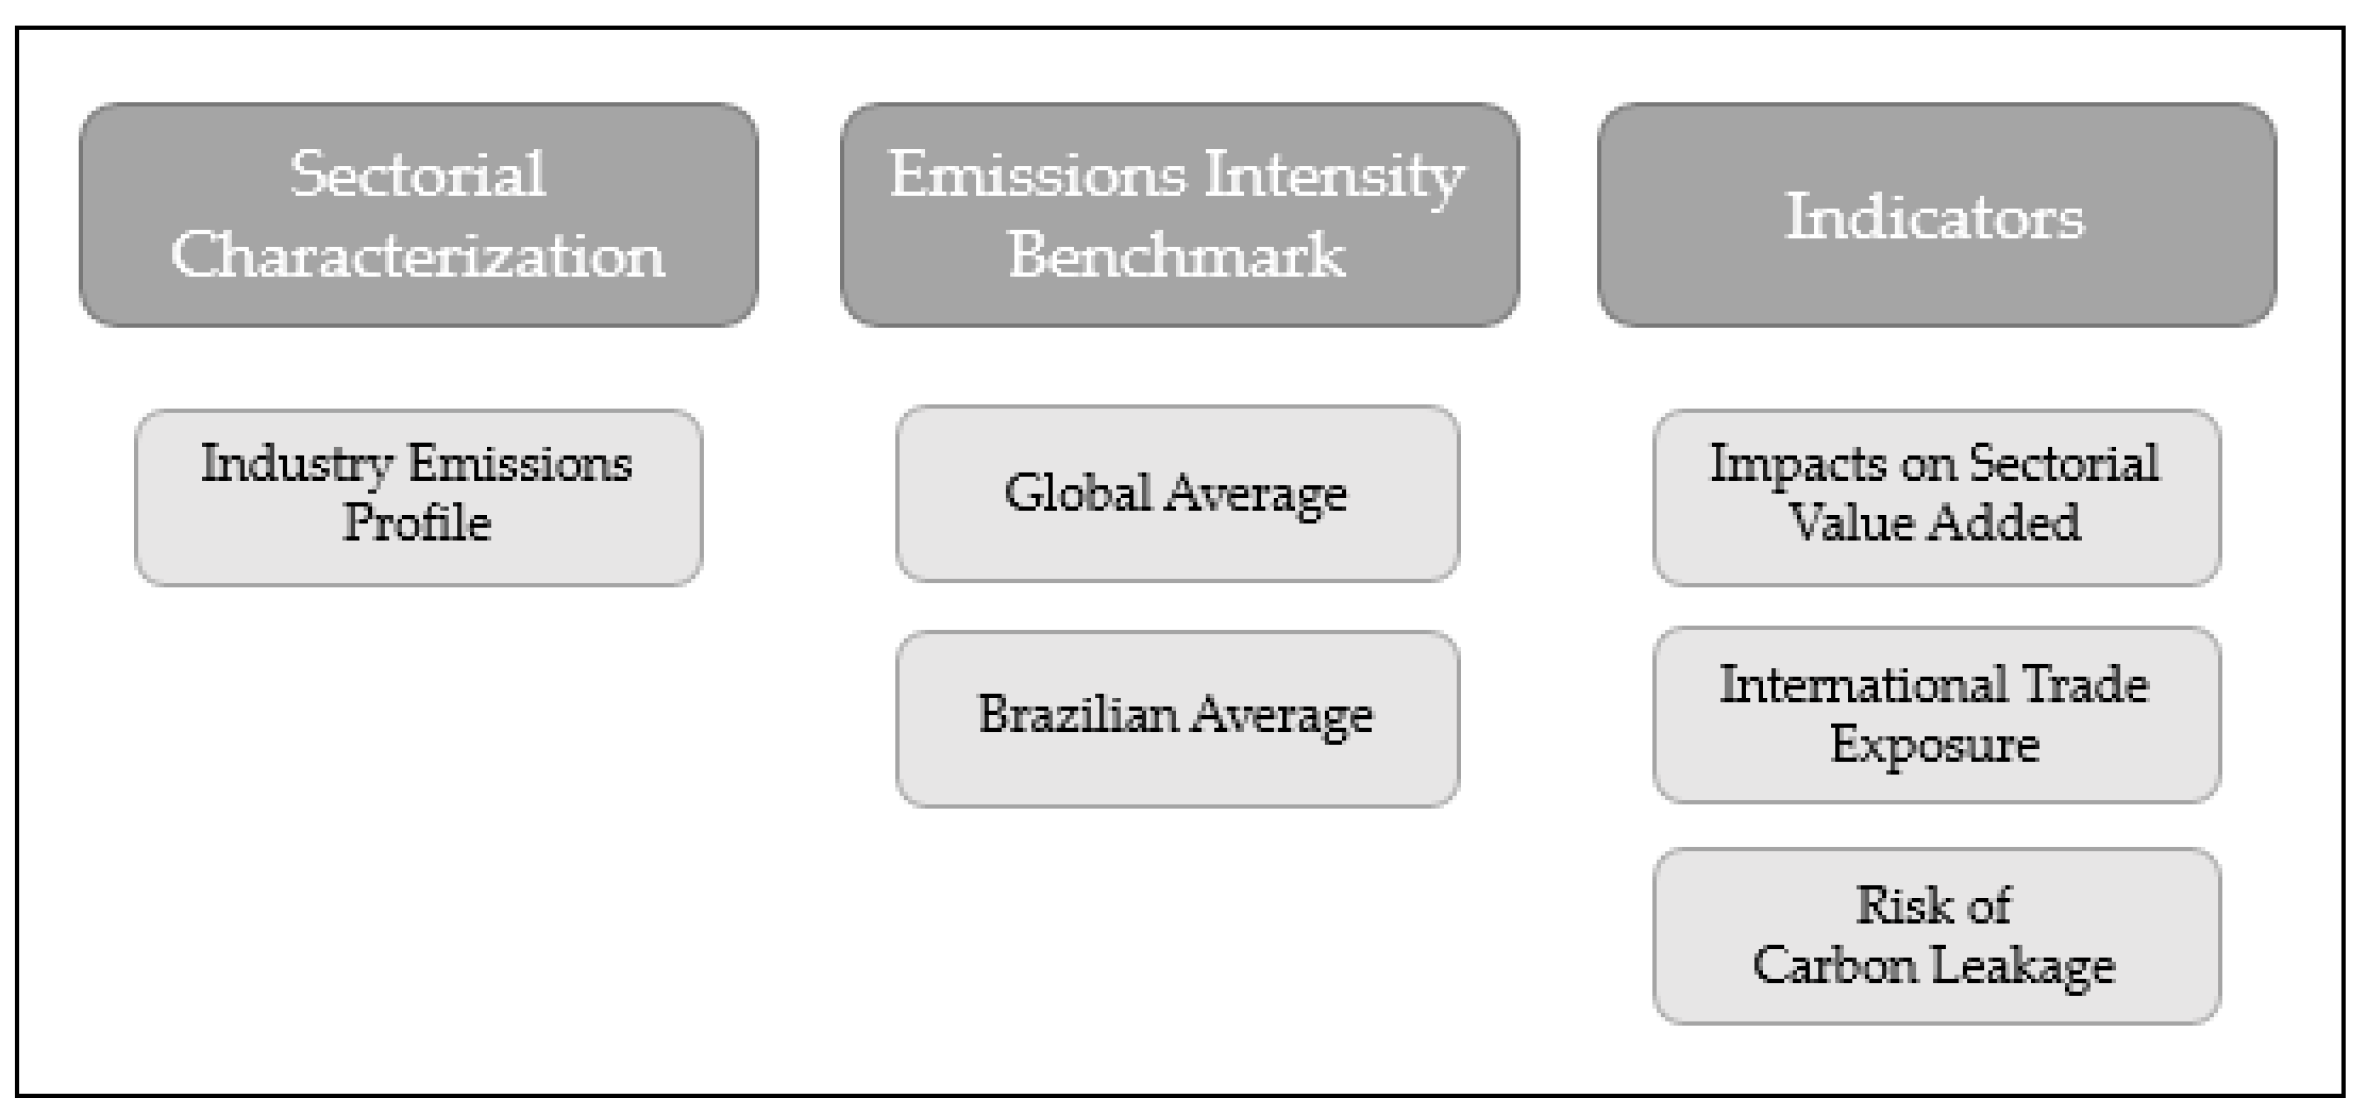
The methodological procedure of this study is divided into three steps, as represented in Figure 1: (i) sectorial characterization; (ii) comparison with international benchmarks in terms of GHG emissions; and (iii) definition of indicators for the analysis of CPI impacts on Brazil’s industrial sector.
3.1. Sectorial Characterization
The Brazilian industry characterization is based on data from the National Industry Confederation [55]. This includes the share in the world exports of manufactured products, the share in the world value added of manufactured goods and the productivity of the effective work [55]. In addition, in the context of climate policy and carbon pricing, the characterization of the country’s industry also includes a sectorial emissions analysis. In this case, primary data from the Third Brazilian Inventory of Anthropogenic Greenhouse Gas Emissions and Removals [56] is used. Emissions data covers the major Brazilian industrial sectors, that is, non-ferrous metals (includes aluminum subsector), non-metallic minerals (includes cement, lime and glass subsectors), iron and steel, pulp and paper, and chemicals. These sectors are considered equally in the National Industry Plan [57], developed by the Ministry of Development, Industry and Commerce (MDIC), according to the classification of the Third Brazilian National Inventory [56,68].
3.2. Emissions Intensity Benchmark
The average emission intensity (sectorial or by product), or an index based on the most efficient companies, can be adopted as benchmark for establishing a CPI. This benchmark can provide incentives for preventive actions and long-term efficiency gains, but the method can be data intensive, especially in the absence of large data series. Thus, international benchmarks can be useful, because public data is available, providing the analyst (regulator) with the information needed. Furthermore, most Brazilian industrial processes are based on mature processes, following consolidated international technological portfolios. As such, the position of the Brazilian industry in terms of emissions intensity can provide relevant information about the vulnerability of the industrial sectors to a possible carbon pricing. Due to these reasons, this study compares the global and the national averages for emissions intensity, in metric tons of CO2 per tons of product. For the global average emissions intensity, data is collected from the international literature [64,65,66,67], while, for the Brazilian average emissions intensity, it is retrieved from the Ministry of Mines and Energy, Ministry of Science, Technology and Innovation, National Development Bank, as well as on some other industry sectorial reports [13,59,60,61,62,63,69].
3.3. Definition of Indicators
Finally, this study analyzes the impacts of different carbon values (implicit or explicit prices) on the Brazilian industry, through the use of indicators. Three indicators were developed: (i) the impacts of carbon pricing in terms of VA; (ii) the emissions intensity; and (iii) the international trade exposure. The choice of these indicators is based on the international experience (and literature) concerning climate policy and CPI implementation, that is, they are widely used in these contexts [70,71,72].
3.3.1. Sectorial Value Added (VA)
The estimated impacts of the cost of carbon pricing on the VA express the relative weight of the cost of carbon on the rents of the production factors, notably, capital and labor. It is given by the ratio of the carbon cost to VA and it is calculated for different carbon prices (US$10/tCO2, US$25/tCO2, and US$50/tCO2), reflecting a range typically found in the literature and in the carbon pricing international experiences put in place so far [6,24,73,74,75,76]. The carbon cost to VA considers full emissions of the year 2010 and, thus, is a conservative indicator that assumes that the cost is fully absorbed by the industry, i.e., without considering any mitigation measure. For the calculation of the carbon cost, primary data from the sectorial emissions reported in the Third National Communication [68] and the VA reported by the Brazilian Institute of Geography and Statistics (IBGE) [69], expressed in US$ millions for the year 2010, is considered. The results represent the cost of carbon in relation to the VA—i.e., how much the carbon pricing could impact the return on the production factors (capital, labor) of these industries—under the conservative assumption that the sector does not abate any emissions.
Another possibility of interpreting the impacts on the VA is to simulate a carbon price according to different levels of reduction in absolute emissions. This alternative analysis shows the effects (in terms of % of the VA) of internalizing a carbon price for the year 2010. The priced emissions are the total emissions minus the reduction of emissions varying from 0% to 45%. This range roughly expresses the abatement potentials found in a study led by the Ministry of Science, Technology and Innovation [14] and covers the abatement of emissions needed to reach Brazil’s NDC targets (37% and 43%). The indicator is calculated for different carbon prices, from US$10/tCO2 to US$50/tCO2.
3.3.2. Emissions Intensity, International Trade Exposure, and Risk of Carbon Leakage
Both emissions intensity and trade exposure are useful indicators to qualitatively analyze the impacts on industrial competitiveness and assess the risk of carbon leakage. The risk of carbon leakage represents the potential transfer of production activities that emit GHG to other regions due to the adoption of carbon control policies. Usually, industries will look for locations with less stronger regulation to transfer their activities to, avoiding loss of competitiveness [71]. Assessing this potential transfer is a complex task. It involves market power exertion, i.e., the ability to pass through compliance costs. Thus, emissions and trade intensities can provide qualitative metrics for assessing this risk. Emissions intensity indicates the ratio of sectorial emissions over the VA, as shown in Equation (1) below.
i = industrial sector
The ability to pass-through compliance costs also depends on the sectorial exposure to international trade. Since trade is dynamic, technical difficulties arise when developing precise price metrics [72]. Thus, the international experience relies on trade share metrics to measure the cost pass-through ability [70]. Trade exposure is an indicator that expresses, through the export and trade shares, sectorial dependence on the international trade. It also represents trade intensity and the exposure of the sectorial production to international trade. Equations (2) and (3) show the export share and the trade share indicators, respectively.
i = industrial sector
The export share represents the sectorial export (or import) orientation, for which values above 50% indicate that a sector is export oriented. The export share (%Xi) indicator is equal to the sectorial exports (Xi) divided by the sum of sectorial imports (Mi) and exports (Xi). Similarly, the trade share expresses sectorial trade orientation, that is, how much the trade activity is relevant for the sector in relation to its total imports or its gross output (depending on the denominator). In this analysis, the trade share (Si) indicator is equal to the sum of Mi and Xi over the gross output (Yi), for which values above 50% represent propensity to trade.
Furthermore, by applying the indicators associated with emissions intensity, trade exposure and the risk of carbon leakage, this paper adopts a similar classification as the California Air Resources Board (CARB) methodology [70]. Notwithstanding, it relies on different thresholds than CARB does in its classification (CARB classifies emissions intensity (MtCO2e/Value Added) in high (≥5000), medium (between 1000 and 4999), low (between 100 and 999) and very low (<100)). Here, the emissions intensity classification is based on a narrower range, mainly due to a smaller sample: low (<1000); medium (from 1000 to 2499); and high (>2500). Regarding trade exposure classification, this paper also adopts different thresholds. Three categories are defined for export and trade shares: low (<10%); medium (from 10% to 24.9%); and high (>25%). To qualify the risk of carbon leakage, a combination of the indicators (emissions intensity and trade exposure) is used, following the CARB methodology. Such methodology describes that the amount of free allocation permits, during predetermined periods, is defined according to the exposure of the industrial sectors to risk [70]. As shown in Table 1, the risk of carbon leakage for each industrial sector is classified into three different categories—low, medium, and high—depending on the results for emissions intensity and trade exposure.
4. Results
This section presents the results in terms of characterization of the Brazilian industry and the impacts of carbon pricing over this sector. The former analysis focuses on the emissions profile and international emissions intensity comparison. The latter aims at assessing some indicators on carbon pricing impacts. These indicators are sectorial value added (VA), emissions intensity, international trade exposure, and risk of carbon leakage.
4.1. Characterization of the Brazilian Industry
In the last decade, the competitiveness of the Brazilian industry has fallen considerably in the global scenario, a tendency evidenced by the deterioration of indicators such as the country’s participation in the world exports of manufactured products, its share in the world value added of manufactured goods and the productivity of the effective work [55]. Thus, an analysis of the sectorial GDP reveals that the industrial sector has reduced its (relative) participation in economic production. The general fall, however, does not mean that industry has been producing less, but that the services sector is growing more rapidly [77].
The Brazilian industry has a high degree of economic linkage with other sectors and it is highly sensitive to macroeconomic policies [78,79]. Despite the relative contraction of the sector, the industry maintains its relevance to the national economy: in 2015, industry accounted for 15.7% of jobs in the country and 38.1% of national exports [55].
There is, however, no coherent framework of measures and policies to requalify and sustain a new growth cycle in the Brazilian industrial sector [17]. Such a gap becomes more relevant in the context of the consolidation of the low carbon economy, in which new competitiveness variables, such as energy and carbon intensity, can create unprecedented pressures for the sector.
4.1.1. Industry Emissions Profile
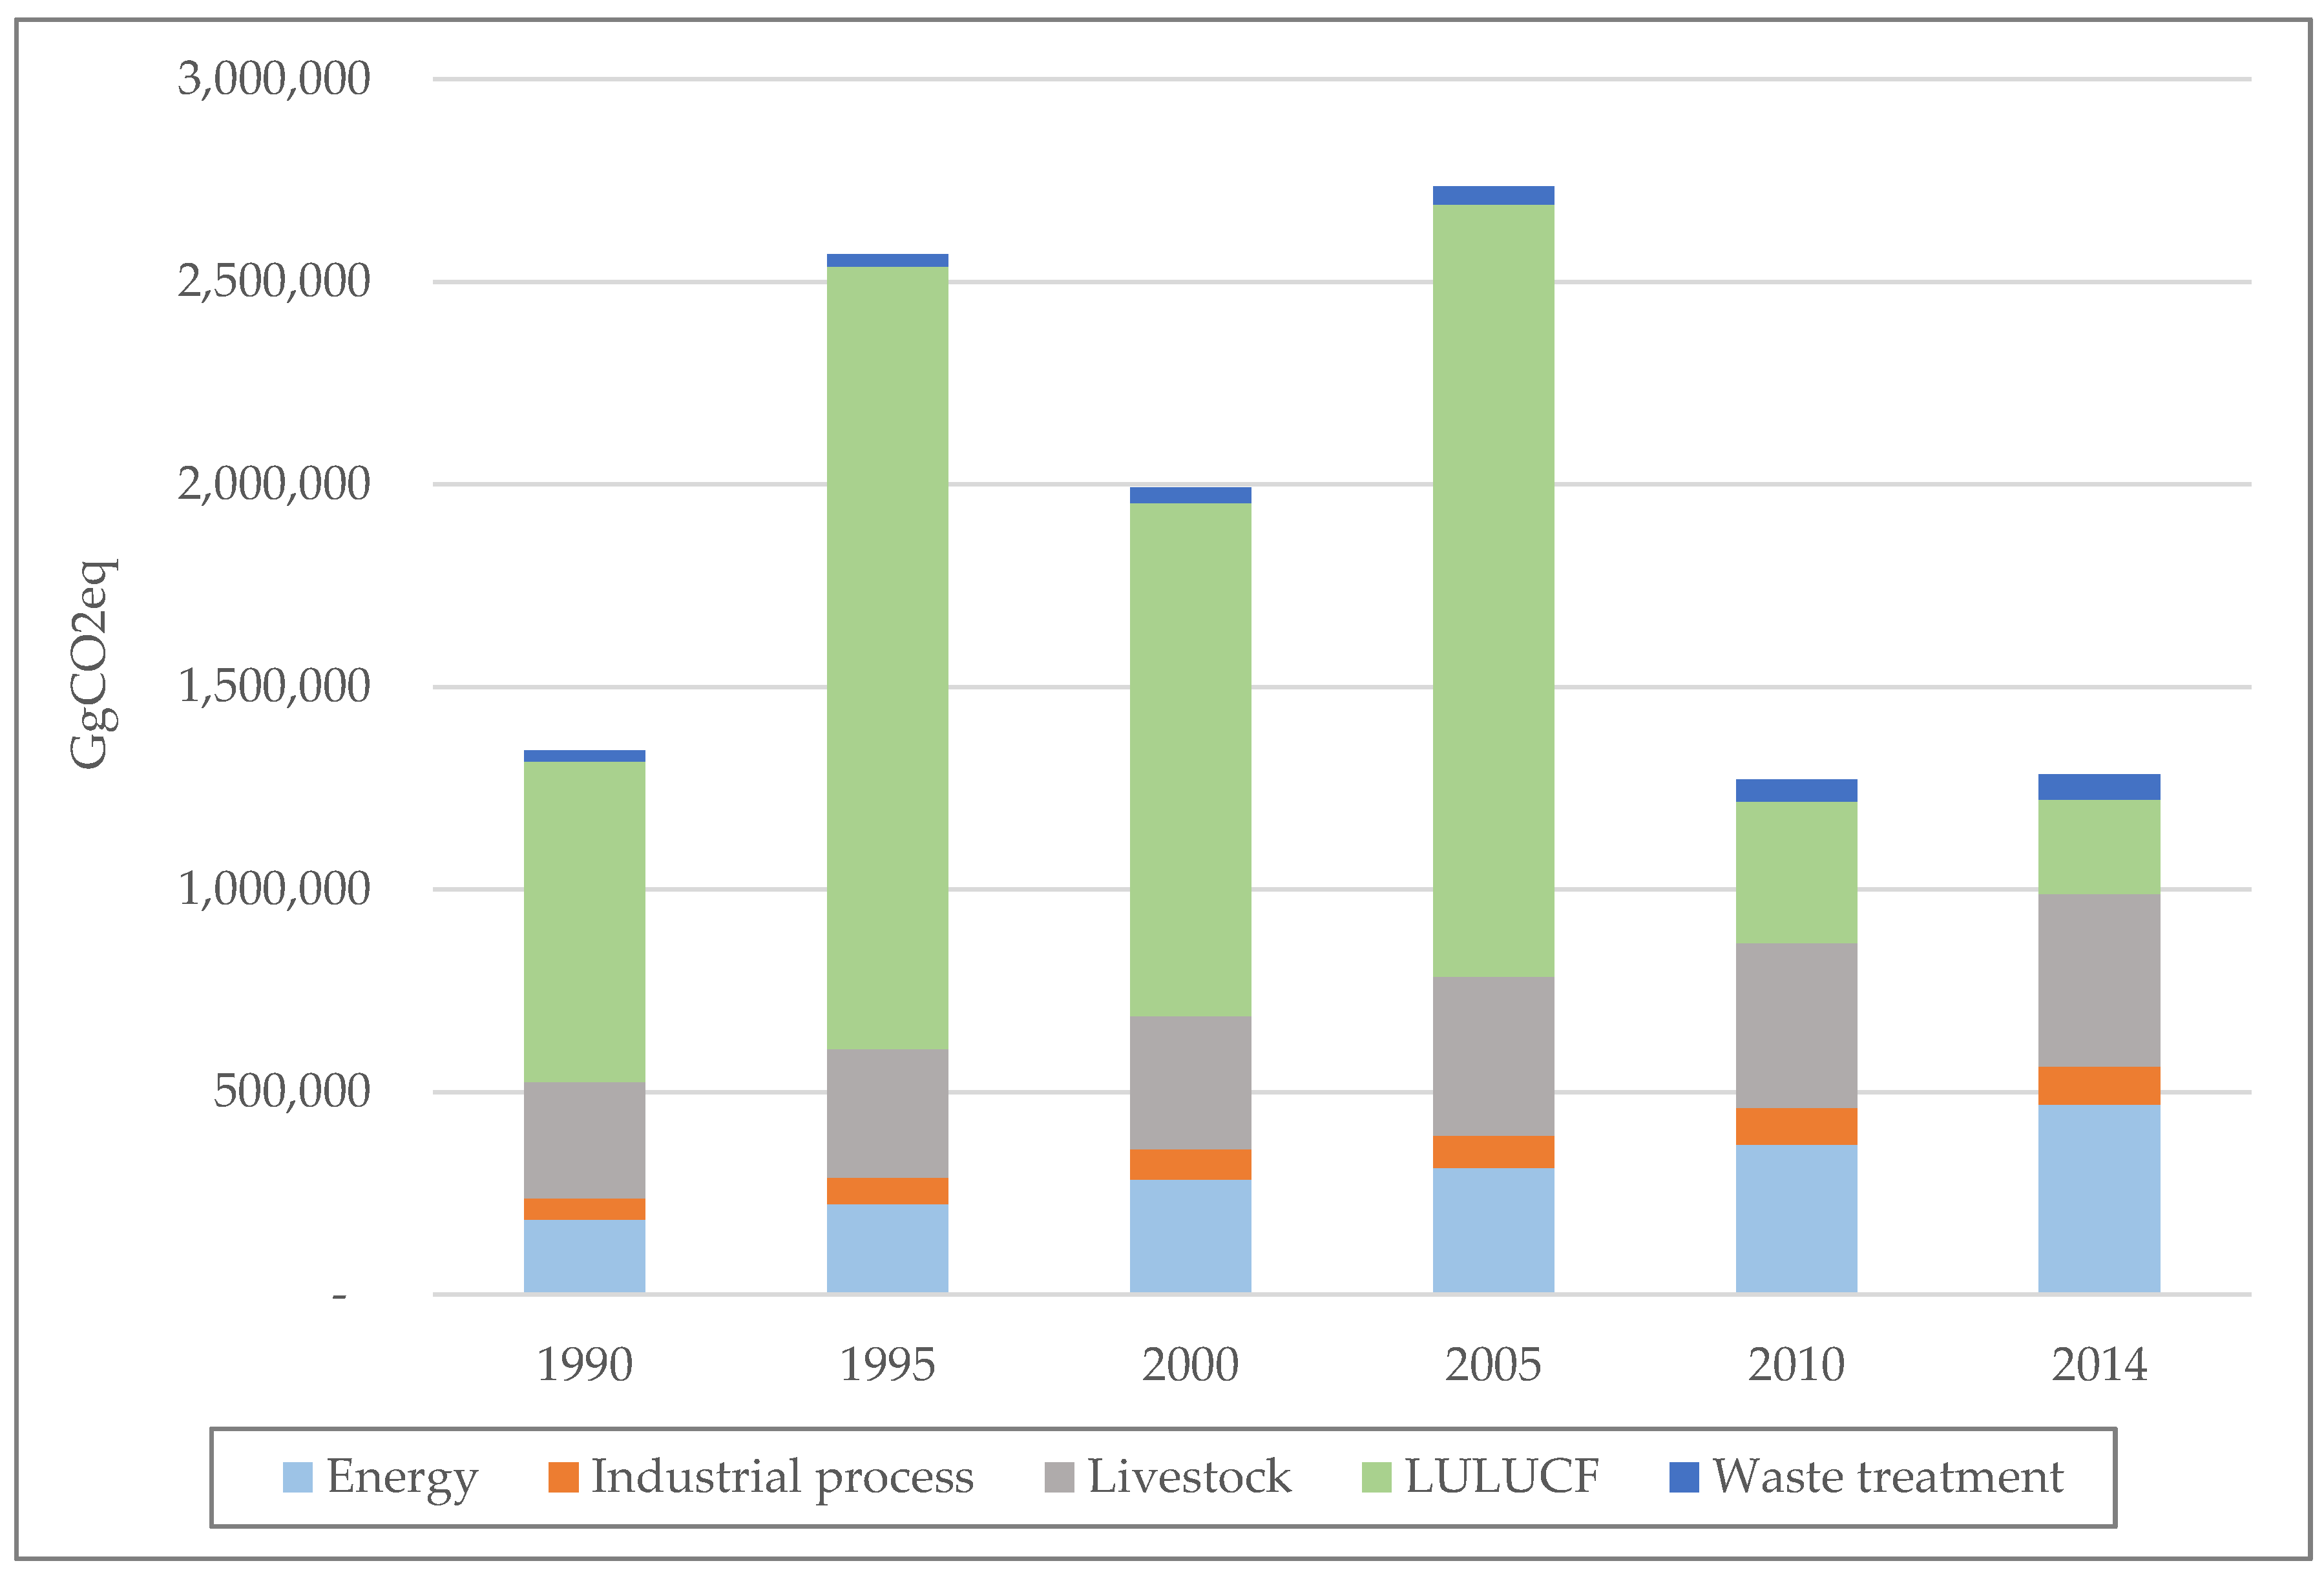
Considering sectorial emissions, if in recent decades the Brazilian industry has lost its relative position in the national economy, its GHG emissions gained importance as deforestation decreased (participation in net CO2 emissions from land use, land use change, and forestry reduced from 83.4% in 2005 to 42% in 2010 [56]). In 1990, the industrial sector accounted for 8.5% of the total GHG emissions (including fuel combustion and industrial processes), while in 2010 it reached 22.6% [56]. Figure 2 presents the total Brazilian GHG emissions in 1990, 1995, 2000, 2005, 2010, and 2014 (the latest available year by the Ministry of Science, Technology and Innovation (MCTI) [14]). The increase in both energy and industrial process emissions reflects the growth of the Brazilian economy (activity effect) throughout the period. Contrary to that evolution, there was a reduction in emissions from land use, land-use change, and forestry (LULUCF) after 2005, due to the decrease in deforestation. However, it remains to be seen whether this trend will reverse in the next decade due to governmental policies favoring land grabbing in Brazil implemented over the last three years [58]. This deforestation emission reversal trend can certainly pose new challenges to Brazil’s industrial sector to mitigate GHG emissions [58].
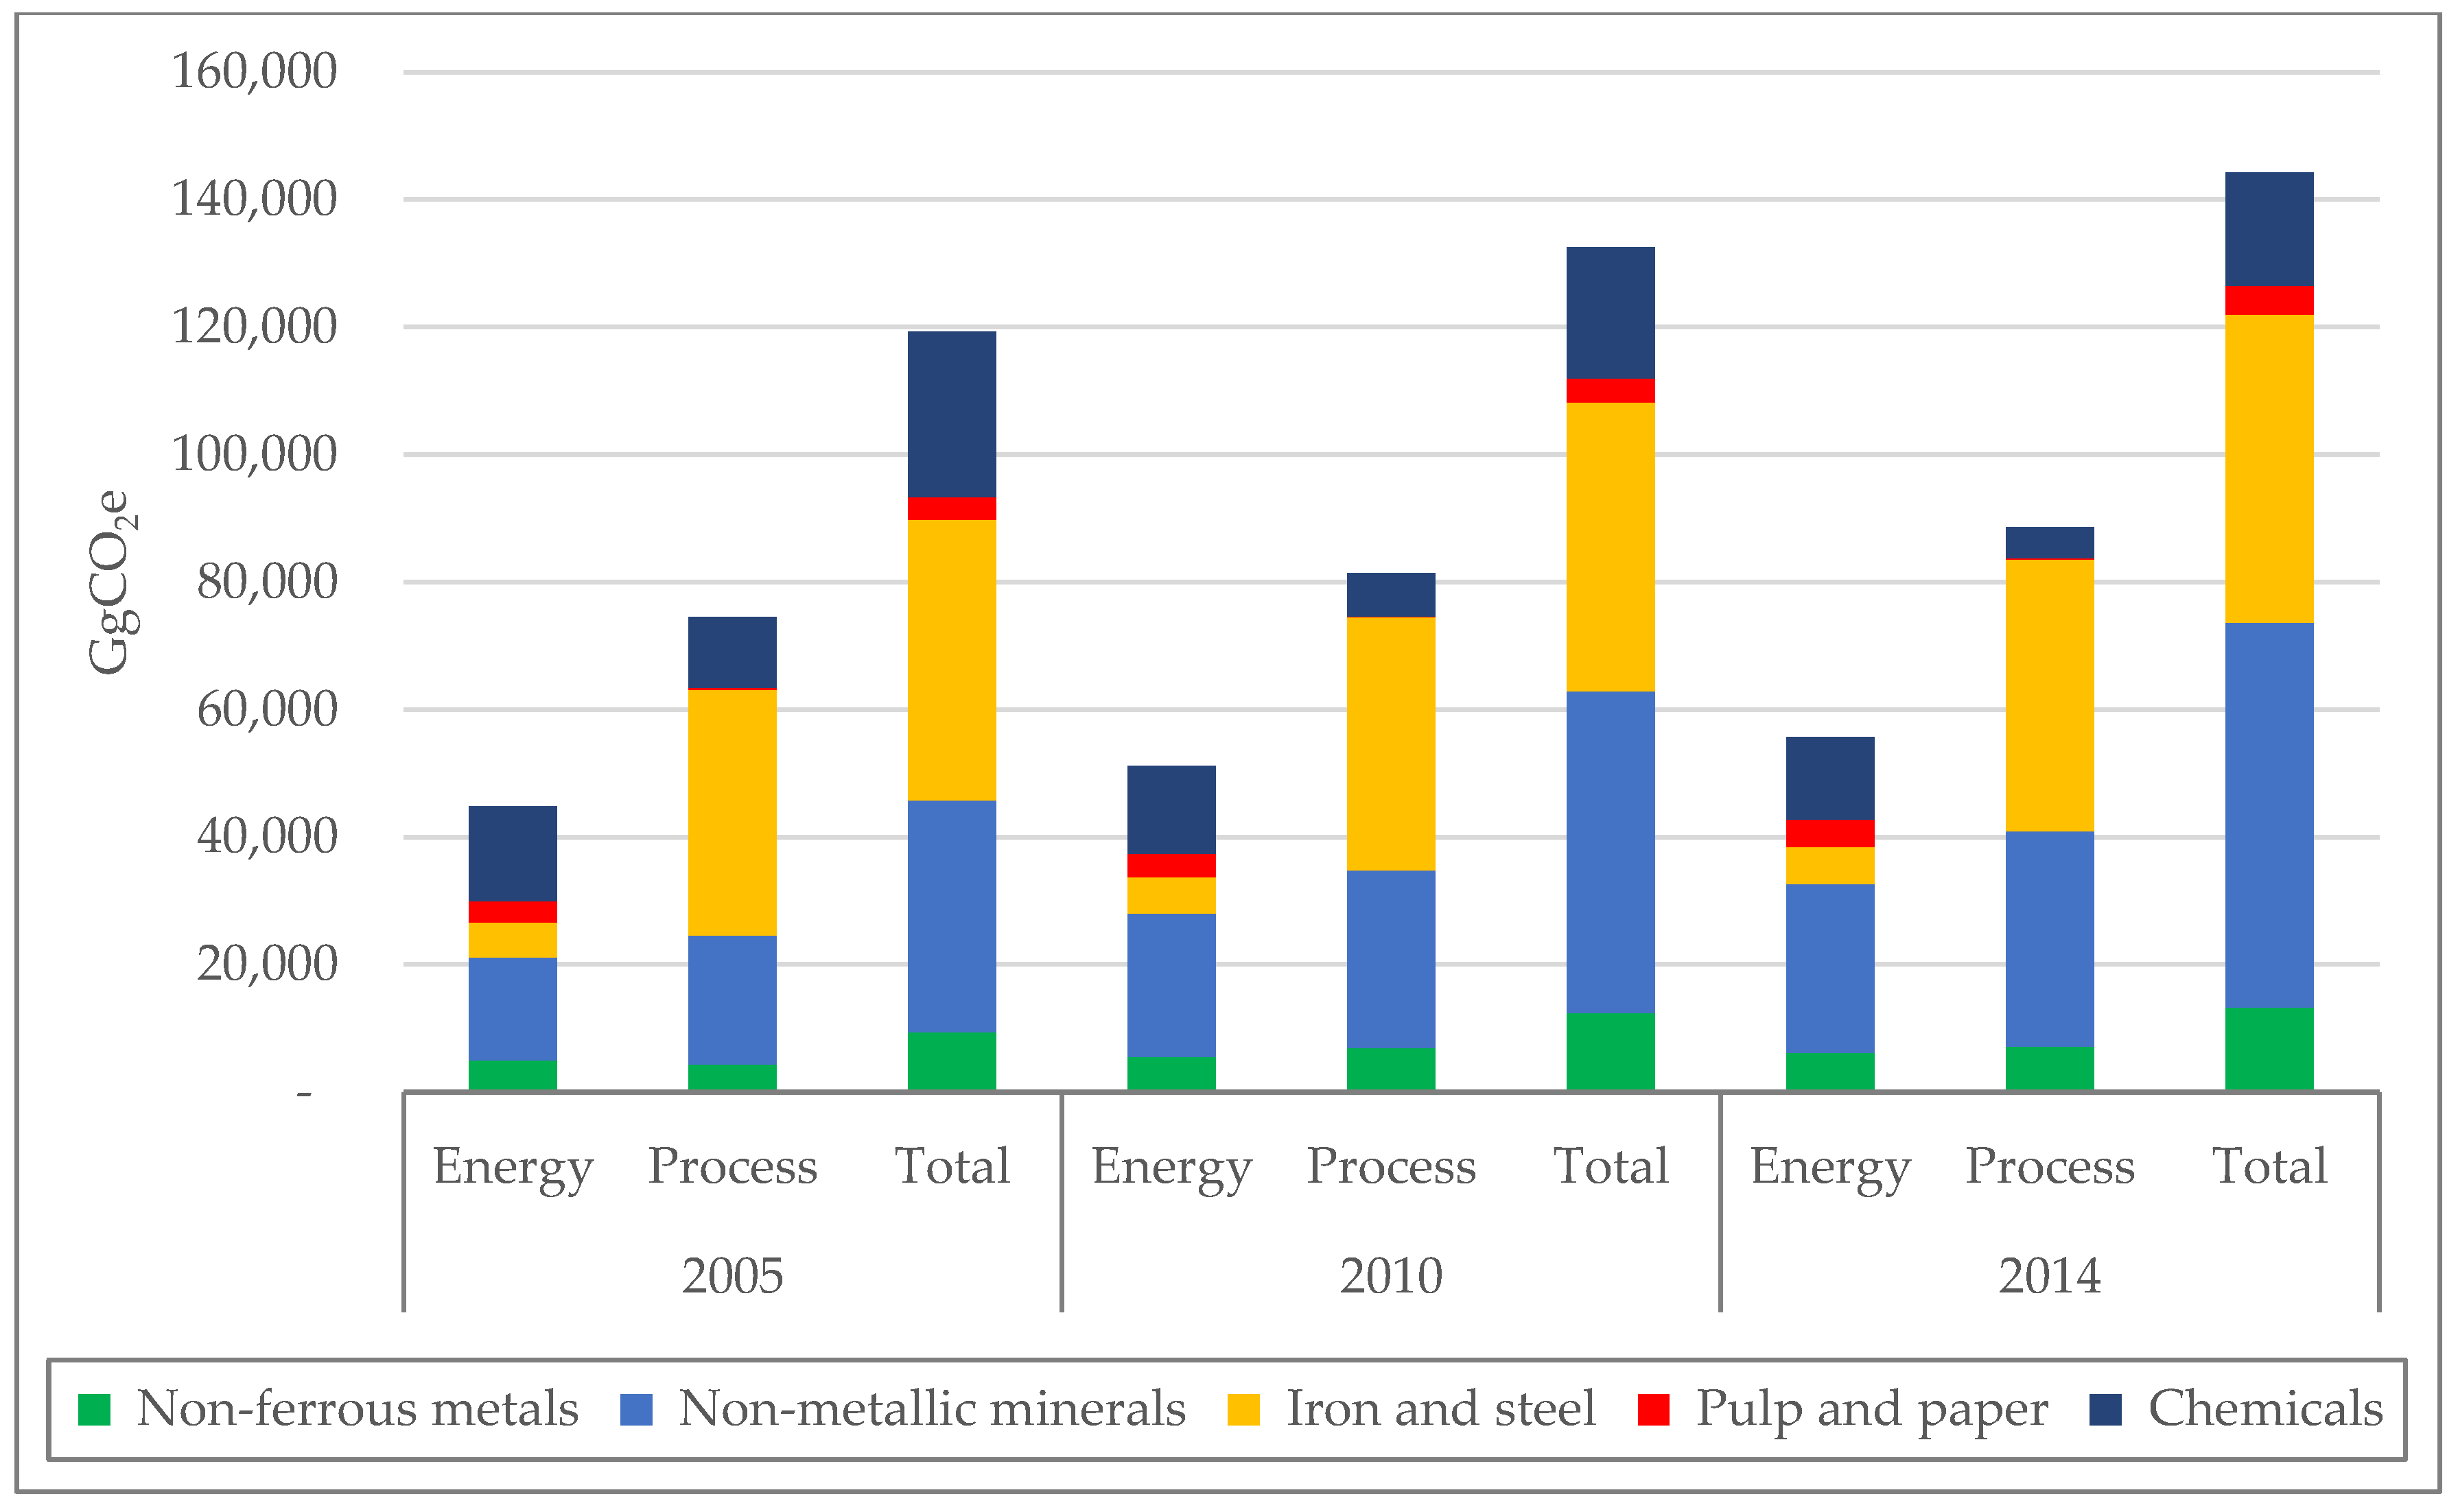
Figure 3 presents the total industrial GHG emissions by origin (energy or process) in 2005, 2010, and 2014. There was an 11% increase in total emissions from 2005 to 2010 (14% from fuel combustion (energy) emissions and 9% from industrial process emissions), while the comparison between 2014 and 2005 reveals a 21% increase in total GHG emissions (24% from energy emissions and 19% from process emissions). Contrary to that evolution, there is a reduction in emissions from the chemicals sector throughout the period, mainly in processes emissions.
As mentioned before, the Brazilian NDC [50,51] proposes a reduction of 37% by 2025 and 43% by 2030 in GHG emissions in relation to 2005 levels. The NDC quantifies some specific measures, such as reforestation and increase in the share of bioenergy in the Brazilian energy system. However, regarding the industrial sector, there is no precise quantification. Brazil’s NDC only mentions that the industrial sector should promote mitigation actions based on new clean technologies standards, energy efficiency measures, and low carbon infrastructure [51]. In fact, a less stringent target for Brazilian industry is only achievable due to the abatement measures of the agriculture, forestry and other land use (AFOLU) sectors, especially deforestation reduction targets [58]. Thus, the AFOLU abatement measures, which could possibly configure carbon offsets, would ensure broader caps for the industrial sector. Thus, a stronger (political) position by the Brazilian industrial sector against deforestation seems a natural least cost strategy [58], reducing the impacts of an eventual CPI over its competitiveness in the mid-run (or at least until 2030), since there would be more room left for increasing the industrial sector emissions.
4.1.2. International Emissions Intensity Comparison
Benchmarks can provide a basis for the allocation of permits in an ETS [6], usually based on the (past) production of (reference) companies. Table 2 compares the world and the Brazilian averages on emissions intensity, in tons of CO2 per tons of product.
Although the average values may show a large spread due to the different structures and processes, a national (or international) average can serve as a benchmark for comparing the country’s exposure to a carbon price, assuming a similar worldwide policy. For instance, when compared to the global average, the Brazilian Pulp and paper sector shows lower emissions intensity (0.2 versus 0.8–0.9), and the same happens to the non-ferrous metals sector (5.6 versus 9.1–9.6). Other sectors show average emissions intensity closer to the global average. For instance, iron and steel (1.3 versus 1.6–2.2) and non-metallic minerals (0.7 versus 0.6–0.8). The average emissions intensity of chemicals, in Brazil, is low (0.3), but there was no information available for the global average due to the sector heterogeneity.
Thus, defining a metric for carbon pricing based on international benchmarks could not provide incentive to lower Brazil’s sectorial emissions. Moreover, the Brazilian industry is not homogeneous, especially regarding technology. Thus, a national benchmark based on the most efficient plants could provide a better metric than an international benchmark. The difficulty relies on obtaining historical data. For some sectors, studies are not available, and research is required to establish national benchmarks [57].
4.2. Impacts of Carbon Pricing on the Brazilian Industry
Section 2 indicated that the configuration of the Brazilian climate policy is uncertain in terms of mechanisms and economic instruments for carbon pricing. Such a conclusion becomes much more complex after the analysis made in Section 4, that revealed the GHG emissions profile of Brazil’s industrial sectors.
Different efforts have been made to determine the (social) cost of carbon at both global and national levels. Regarding an ETS, such mechanisms are spreading around the world and new additions have nearly tripled the share of global emissions covered by emissions trading since the launch of the EU ETS in 2005 [6]. According to the 2018 Emissions Trade Worldwide Report from the International Carbon Action Partnership (ICAP), almost 15% of global emissions (7.4 GtCO2e) are currently covered by ETS. Economies with an ETS in place produce more than 50% of the global GDP and are home to almost a third of the global population [6]. These numbers reflect the steady expansion of ETS mechanisms and the strengthening of their implementation around the world. However, the average price for allowances varies a lot. In 2017, for instance, it shifted from US$3.76/tCO2e, in the Regional Greenhouse Gas Initiative (RGGI), to US$18.30/tCO2e, in the Korean Emissions Trading Scheme (KETS) [6].
The same happens when looking at carbon taxes. In terms of specific recommendations for a carbon tax, Nordhaus [73] suggested a value of US$30/tCO2e, while the Stern report recommended a much higher tax of over US$300/tCO2e globally [77]. According to [24], Japan has the lowest initial value of the tax (equivalent to US$2.54/tCO2e, US$2016), and Norway, the highest, reaching up to US$54/tCO2e (US$2016). Other studies show different average values such as US$65.77/tCO2 [75], varying from US$4.53/tCO2 to US$237/tCO2 [78]. That is, the carbon tax values indeed vary considerably.
Discussing and defining the price of carbon demands an analysis of its impacts on the Brazilian industry. For this purpose, indicators of the impacts of carbon pricing in terms of sectorial value added (VA), emissions intensity, and international trade exposure were applied, following the methods described in Section 3.
4.2.1. Sectorial Value Added (VA)
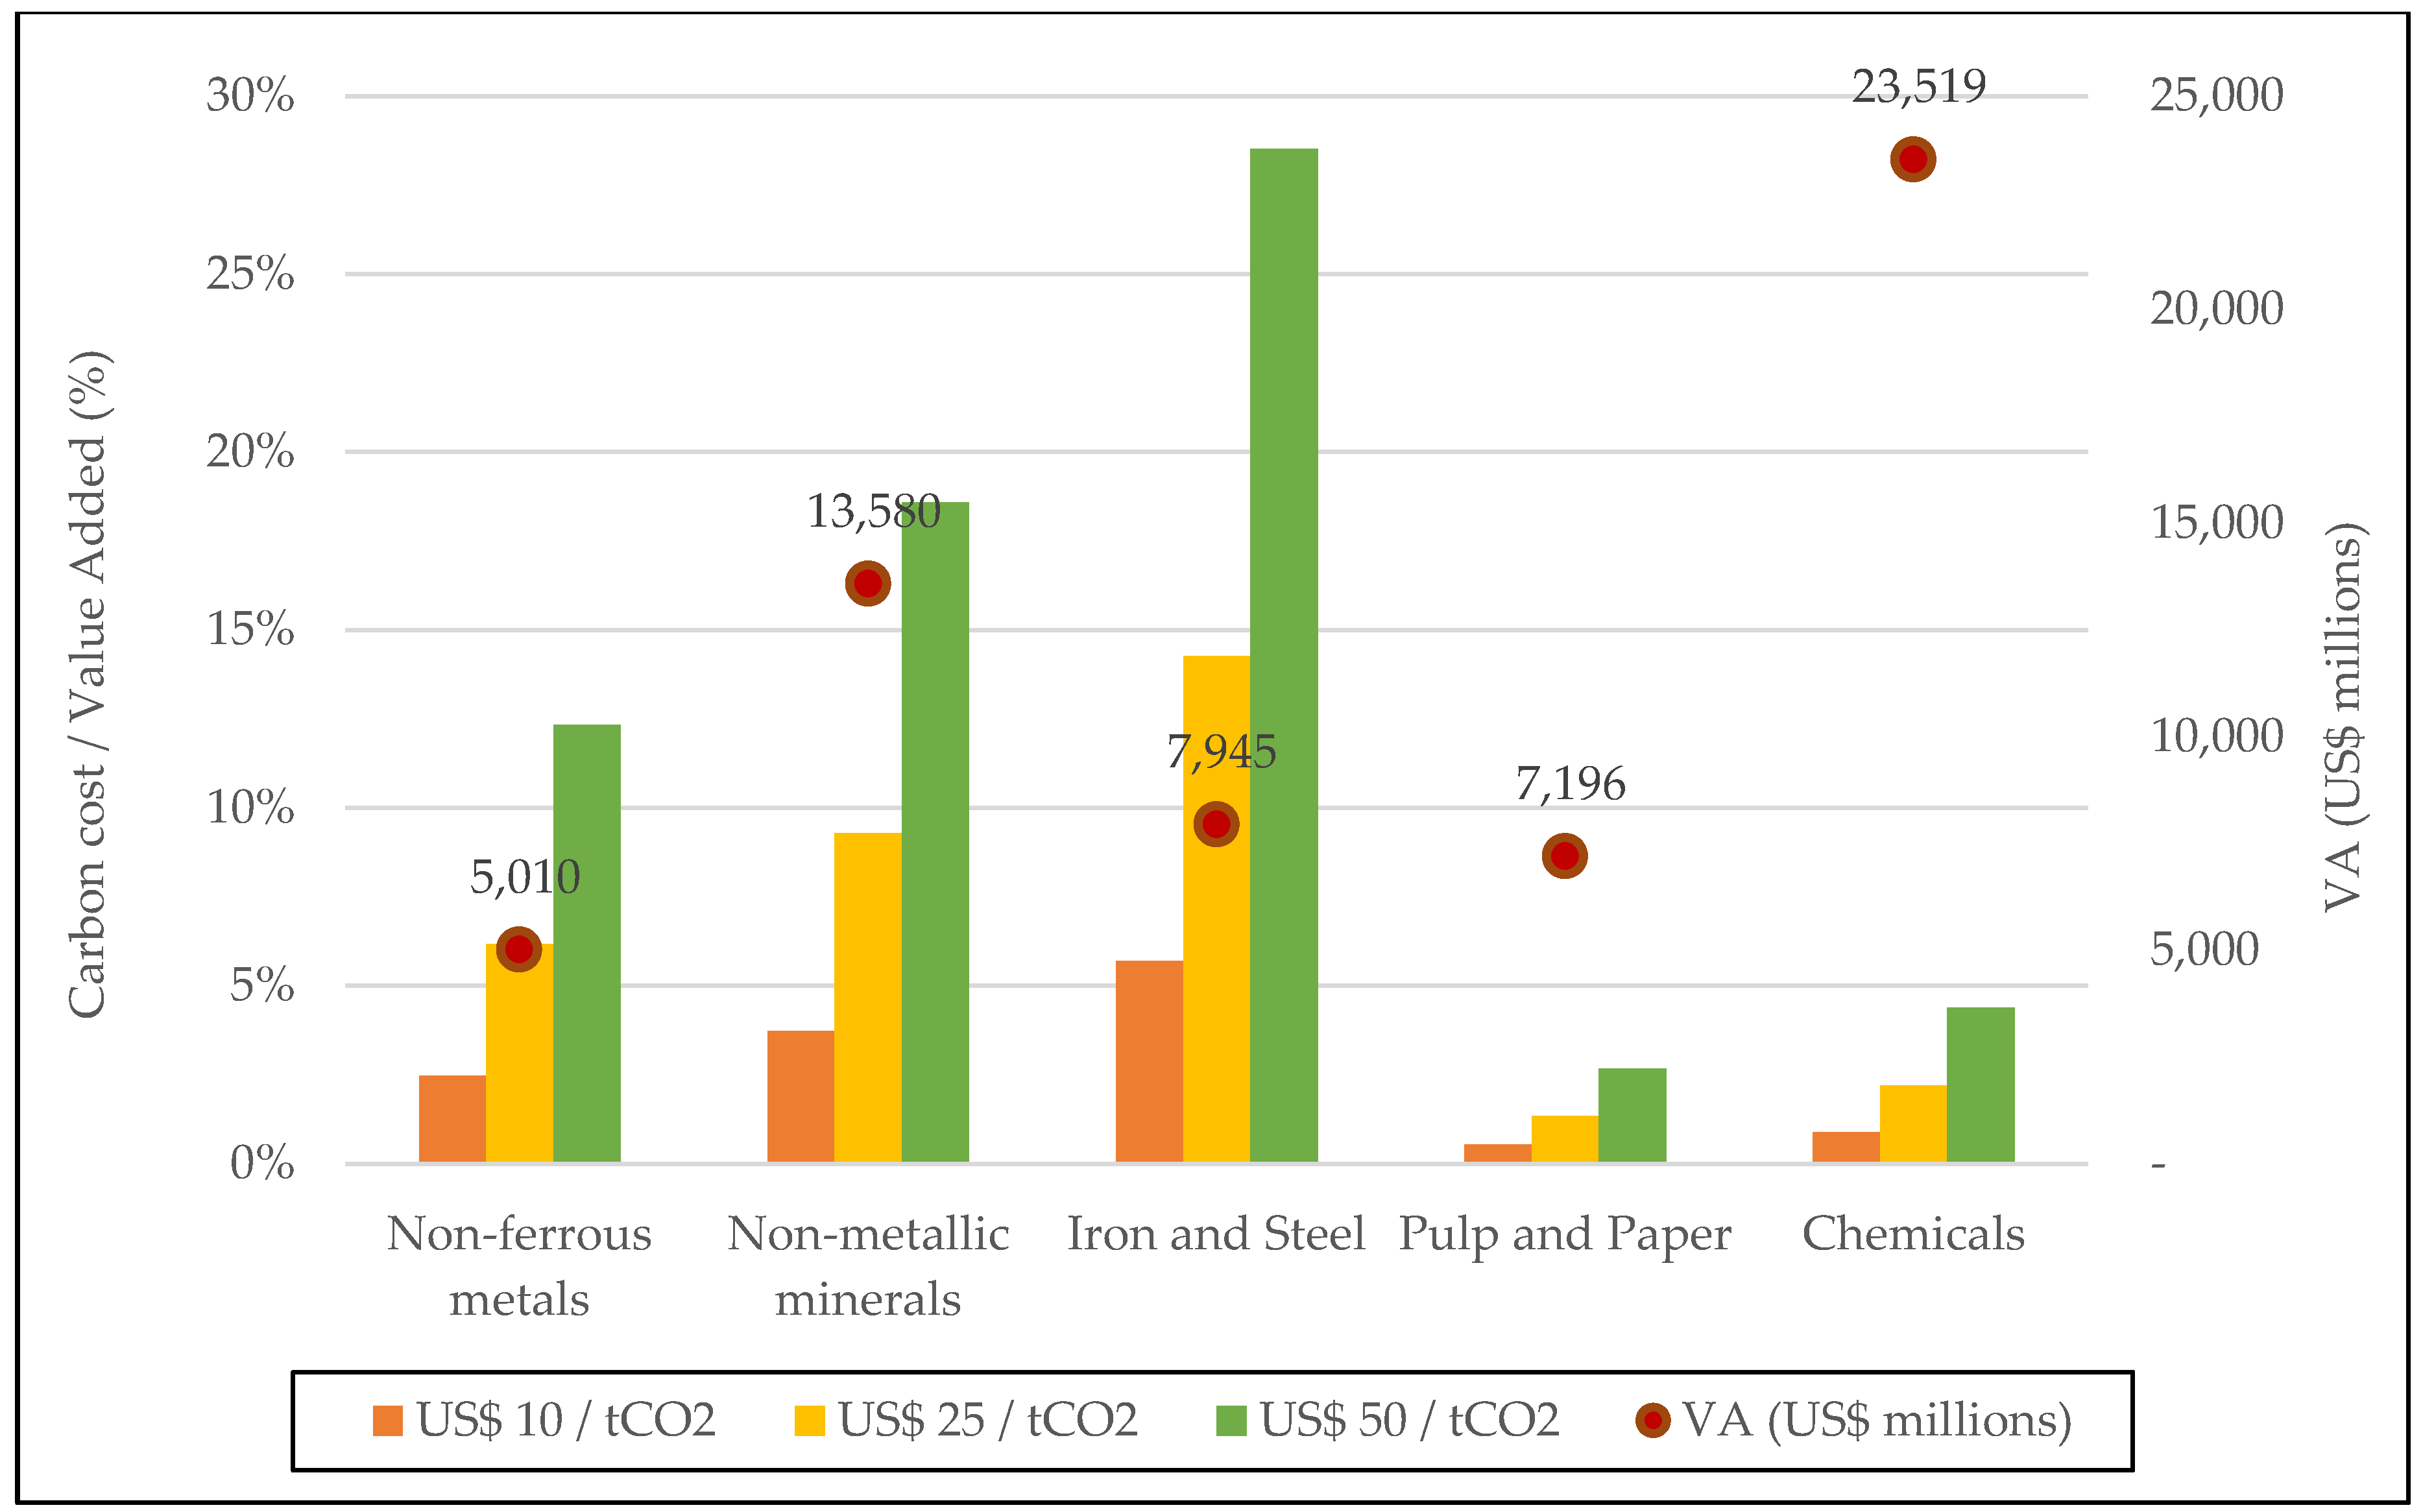
Figure 4 presents the impact of the cost of carbon pricing on the VA, given by the ratio of total tax expenditure to VA for different carbon prices (US$10/tCO2, US$25/tCO2, and US$50/tCO2).
The results represent the cost of carbon in relation to the sectorial VA, i.e., how much the carbon pricing could impact the return on the production factors (capital, labor) of these industries, under the conservative assumption that the sector does not abate any emissions. For all sectors, the impact of a carbon price of US$10/tCO2 would be less than 6% of the sectorial VA and would be less than 15% for values up to US$25/tCO2. Pulp and paper and chemicals would not face high impacts of carbon pricing even for a carbon price of US$50/tCO2.
As described in Section 4, another possibility of interpreting the impacts on the sectorial VA is to simulate a carbon price according to different levels of reduction in absolute emissions. Table 3 shows the impacts (in terms of % of the sectorial VA) of internalizing a carbon price for the year 2010. The priced emissions are the total emissions minus the reduction of emissions, varying from 0% to 45%. The values are calculated for different carbon prices, ranging from US$10/tCO2 to US$50/tCO2.
For a carbon price of US$10/tCO2 results show impacts below 3.1% for all the sectors, with values ranging from 0.5% (pulp and paper under a 45% emissions reduction scenario) to 3.1% (iron and steel under a 5% emissions reduction scenario). These impacts grow for higher carbon prices and could reach 27.1% for iron and steel under a 5% emissions reduction scenario with a US$50/tCO2 carbon price. Pulp and paper and chemicals showed the lowest impacts on the sectorial VA, even with higher carbon prices (US$50/tCO2). For the former, this can be explained by the share of black-liquor in final energy consumption, while for the latter it derives from the higher VA of chemical industry facilities.
If the carbon price were fully internalized by the industry (e.g., via a carbon tax or ETS with auction), the results presented in Table 2 reveal an upper limit for the mitigation cost as a share of VA. In other words, the difference between the emissions reduction levels (5–45%) and the case with no emission reduction (0%) expresses the maximum cost of a carbon pricing (as a share of VA), assuming the respective level of mitigation. For instance, by mitigating 45% of the pulp and paper emissions, considering a carbon price of US$10/tCO2, total expenditure of the sector would be 0.3% of its VA.
The range of reduction from 35% to 45% covers the same range of the NDC target (for the year 2025 and 2030) and could express the upper limits for the mitigation cost in a scenario where the NDC target is divided homogeneously between all the sectors in the economy (LULUCF, industry, etc.). Again, considering a carbon tax of US$10/tCO2, the cost of mitigation of reducing emissions from 35% to 45% could represent an impact of 0.3% to 3.7% on sectorial VA, depending on the sector assessed. Furthermore, considering a carbon price of US$10/tCO2, and the reduction target of 5% (the same as the industry plan) [57], the total sectorial expenditure would be under 0.7%.
4.2.2. Emissions Intensity, International Trade Exposure, and Risk of Carbon Leakage
Table 4 presents the results for sectorial emissions intensity, in tCO2/US$ millions, and for the emissions intensity classification. According to the criteria presented in Section 3, the pulp and paper and chemistry sectors have low emissions intensity (under 1000); non-ferrous metals (1248), medium emissions intensity; and non-metallic minerals (3328) and iron and steel (5525), high emissions intensity.
Table 5 presents the results for the export share, the trade share and the trade exposure classification. According to the results, the pulp and paper sector is export oriented (76% of export share), while the chemicals sector is import oriented (import share varies from 14% to 32%, depending on the segment). Moreover, trade share is a metric that represents trade intensity and the exposure of the sectorial production to international trade—e.g., non-metallic minerals production is less exposed to international trade (11%) than non-ferrous metals production (52%).
According to the criteria described in Section 3, all sectors would face high exposure to trade, except non-metallic minerals, with medium trade exposure (11%). As a consequence, the carbon leakage could become an expected but a not-desired outcome of a CPI on the Brazilian industrial sectors. Indeed, Table 6 shows the results of the risk of carbon leakage for the Brazilian industrial sector, considering the metrics described in Section 3. Non-ferrous metals, non-metallic minerals, and Iron and steel would face a high risk of carbon leakage, because they present medium to high indicators of emissions intensity and trade exposure. In turn, chemicals and pulp and paper have high exposure to international trade, these sectors would face a medium risk of leakage, due to their low emissions intensity.
5. Conclusions
Carbon pricing has increased worldwide. According to the Organization for Economic Co-operation and Development (OECD), in 2015, approximately 13% of global GHG emissions were covered by some pricing mechanism—three times the coverage of a decade ago. Approximately 40 national jurisdictions and 24 cities, states and regions have already implemented this type of instrument, representing an annual volume of 7 GtCO2e subject to economic regulation [72].
After COP 21, with the adoption of the Paris Agreement in December 2015, the outlook for carbon pricing policies has been widened. While the agreement does not directly establish a global carbon pricing, the provisions set out in Article 6 have the potential to increase international cooperation in favor of mitigation through market mechanisms.
NDCs from 101 countries indicate the interest in using economic instruments to achieve their goals [17]. Brazilian NDC is one of those that considered the use of market mechanisms, although it shows no clear indication of how these instruments will be used, reserving its position to adopt the mechanisms that will be established under the Paris Agreement.
However, in Brazil, carbon pricing has been considered as a CPI since at least 2011, when the country presented its application to the PMR to support the preparation and implementation of its carbon pricing instruments. In recent years, discussions about its design and implementation have reached new heights and ongoing studies coordinated by the Brazilian Ministry of Finance (MF) are seeking to assess possible configurations and impacts of CPI on the country’s economy. Nonetheless, the analysis made in Section 2 concludes that there is still an uncertainty about the configuration of the Brazilian climate policy in terms of mechanisms and economic instruments for carbon pricing.
In the context of uncertainty about the CPI to be implemented in Brazil (or its mix—hybrid mechanism), the main contribution of this paper is not to focus on its definition and design, but instead to analyze the impacts of carbon pricing in the Brazilian industry in terms of sectorial VA, emissions intensity, and international trade exposure. Although not directly addressed at the CPI level, the discussion of these instruments directly permeates the quantitative analysis carried out, especially when analyzing the impacts on VA and intensity metrics for assessing the exposure to carbon leakage. In this sense, it intends to contribute to the future definition of the CPI to be implemented in the Brazilian industry.
The Brazilian NDC quantifies some specific measures, such as reforestation and increase in the share of bioenergy in the Brazilian energy system, but there is no precise quantification regarding the industrial sector. It only mentions that the industrial sector should promote mitigation actions based on new clean technologies standards, energy efficiency measures, and low carbon infrastructure. This sector has received greater attention given the reduction of deforestation in Brazil after 2005 that implies a less stringent target for the Brazilian industry, so the AFOLU abatement measures, which configure carbon offsets, could ensure broader caps for the industrial sector.
Regarding international emissions intensity as a possible benchmark, results show that it should be analyzed very carefully. Defining a metric for carbon pricing based on an international benchmark, for almost all industrial sectors, would provide a perverse incentive, possibly increasing sectorial emissions. Therefore, defining a national benchmark based on the most efficient plants, for instance, could provide a better metric for the implementation of a CPI.
When analyzing the VA impacts for a carbon price of US$10/tCO2, the cost of reducing emissions from 35% to 45% (same range of the Brazilian NDC) could represent an impact of 0.3% to 3.7% on sectorial VA. Impacts grow for higher carbon prices and could reach 28.5% under a US$50/tCO2 carbon price. Pulp and paper and chemicals show lower impacts on the sectorial VA, even with higher carbon prices (US$50/tCO2) and lower emissions reduction.
Also, with regard to the emissions intensity classification, pulp and paper and chemistry sectors have low emissions intensity; non-ferrous metals, medium emissions intensity; and non-metallic minerals and iron and steel, high emissions intensity. Related to the international trade exposure analysis, results show that all sectors would face high exposure to trade, except Non-metallic minerals, with medium trade exposure. Consequently, carbon leakage could be considered as an expected outcome. Non-ferrous metals, non-metallic minerals, and iron and steel would face a high risk of carbon leakage, while chemicals and pulp and paper, face a medium risk of leakage.
Finally, in terms of implementing a CPI, if designed as a carbon tax or an ETS without free allocation (auctioning), the carbon pricing could generate revenues, which could enable the implementation of long-term social policies and short and medium-term compensatory policies. Different methods of recycling revenues are possible, for example, by reducing other taxes, by allocating it to families, by supporting the industry, by investing in climate funds, or by directing it to the central government budget. Thus, as discussed before, the adoption of some recycling alternatives—which were not considered in the scope of this paper—could lead to a reduction of sectorial impacts on competitiveness.
Author Contributions
The paper was produced with close collaboration between the authors. L.S. and R.G. drafted the version of the paper, developed the content, and wrote the paper. A.F.P.L. and A.S. supervised the research, contributed to conceiving and designing the research framework, and reviewed the content. All authors read and approved the final manuscript.
Funding
This research was funded by the National Council for Scientific and Technological Development (CNPq).
Acknowledgments
This work was supported by the National Council for Scientific and Technological Development (CNPq). The authors would like to thank the Brazilian Ministry of Finance (MF) and the World Bank (WB).
Conflicts of Interest
The authors declare no conflict of interest.
References
- Intergovernmental Panel on Climate Change (IPCC). Climate Change 2014: Synthesis Report; Contribution of Working Groups I, II and III to the Fifth Assessment Report of the IPCC; IPCC: Geneva, Switzerland, 2014; p. 151. [Google Scholar]
- Schütze, F.; Fürst, S.; Mielke, J.; Steudle, G.A.; Wolf, S.; Jaeger, C.C. The Role of Sustainable Investments in Climate Policy. Sustainability 2017, 9, 221. [Google Scholar] [CrossRef]
- Partnership for Market Readiness (PMR); International Carbon Action Partnership (ICAP). Emissions Trading in Practice: A Handbook on Design and Implementation; World Bank: Washington, DC, USA, 2016. [Google Scholar]
- Knight, E.R.W. The economic geography of European carbon market trading. J. Econ. Geogr. 2011, 11, 817–841. [Google Scholar] [CrossRef]
- High-Level Commission on Carbon Prices. Report of the High-Level Commission on Carbon Prices; World Bank: Washington, DC, USA, 2017; Available online: https://static1.squarespace.com/static/54ff9c5ce4b0a53decccfb4c/t/59244eed17bffc0ac256cf16/1495551740633/CarbonPricing_Final_May29.pdf (accessed on 2 April 2018).
- International Carbon Action Partnership (ICAP). Emissions Trading Worldwide: Status Report 2018; ICAP: Berlin, Germany, 2018; Available online: https://icapcarbonaction.com/en/?option=com_attach&task=download&id=547 (accessed on 15 April 2018).
- Perthuis, C.; Trotignon, R. Governance of CO2 markets: Lessons from the EU ETS. Energy Policy 2014, 75, 100–106. [Google Scholar] [CrossRef]
- Da Motta, R.S. A política nacional sobre mudança do clima: Aspectos regulatórios e de governança. In Mudança do Clima no Brasil: Aspectos Econômicos, Sociais e Regulatórios; da Motta, R.S., Hargrave, J., Luedemann, G., Sarmiento Gutierrez, M.B., Eds.; IPEA: Brasília, Brazil, 2011; Volume 1, ISBN 978-85-7811-108-3. [Google Scholar]
- Hasselknippe, H. Systems for carbon trading: An overview. Clim. Policy 2003, 3, 43–57. [Google Scholar] [CrossRef]
- World Bank; Ecofys; Vivid Economics. State and Trends of Carbon Pricing 2017; World Bank: Washington, DC, USA, 2017; ISBN (electronic) 978-1-4648-1218-7. [Google Scholar]
- Carbon Pricing Leadership Coalition (CPLC). What Are the Options for Using Carbon Pricing Revenues? Executive Briefing CPLC. 2016. Available online: http://pubdocs.worldbank.org/en/668851474296920877/CPLC-Use-of-Revenues-Executive-Brief-09-2016.pdf (accessed on 23 March 2018).
- Centro de Estudos em Sustentabilidade da Fundação Getúlio Vargas (GVces). Requerimento para um Sistema Nacional de Monitoramento, Relato e Verificação de Emissões de Gases de Efeito Estufa. Elementos para um Mercado de Carbono no Brasil; GVces-FGV/SP: São Paulo, Brazil, 2013; Available online: http://bibliotecadigital.fgv.br/dspace/bitstream/handle/10438/15351/Requerimentos%20para%20um%20Sistema%20Nacional%20de%20Monitoramento%2c%20Relato%20e%20Verifica%C3%A7%C3%A3o%20de%20Emiss%C3%B5es%20de%20Gases%20de%20Efeito%20Estufa%20-%20Vol.%201.pdf?sequence=1&isAllowed=y (accessed on 10 February 2018).
- Fankhauser, S.; Hepburn, C.; Park, J. Combining Multiple Climate Policy Instruments: How Not to Do It. Working Paper No. 48. 2011. Available online: http://www.lse.ac.uk/GranthamInstitute/wp-content/uploads/2014/02/WP38_UK-carbon-tax.pdf (accessed on 7 March 2018).
- Ministério da Ciência, Tecnologia e Inovação (MCTI). Cenários Integrados de Mitigação de Emissões de Gases de Efeito Estufa para o Brasil até 2050—Opções de Mitigação de Emissões de Gases de Efeito Estufa em Setores-Chave do Brasil; ONU Meio Ambiente: Brasília, Brazil, 2016. [Google Scholar]
- World Bank. Brazil Low-Carbon Country Study—Case Study; World Bank: Washington, DC, USA, 2010; Available online: http://siteresources.worldbank.org/BRAZILEXTN/Resources/Brazil_LowcarbonStudy.pdf (accessed on 12 January 2018).
- Conselho Empresarial Brasileiro para o Desenvolvimento Sustentável (CEBDS). Oportunidades e Desafio da NDC Brasileira para o Setor Empresarial—Setor Industrial; CEBDS: Rio de Janeiro, Brazil, 2017; Available online: http://biblioteca.cebds.org/oportunidades-desafios-metasndc (accessed on 25 March 2018).
- Precificação de Carbono: O Que o Setor Empresarial Precisa Saber para se Posicionar. 2016. Available online: http://biblioteca.cebds.org/precificacao-de-carbono (accessed on 3 April 2018).
- Pinto, R.G.D.; Szklo, A.S.; Rathmann, R. CO2 emissions mitigation strategy in the Brazilian iron and steel sector—From structural to intensity effects. Energy Policy 2018, 114, 380–393. [Google Scholar] [CrossRef]
- Henriques, M.F.; Dantas, F.; Schaeffer, R. Potential for reduction of CO2 emissions and a low-carbon scenario for the Brazilian industrial sector. Energy Policy 2010, 38, 1946–1961. [Google Scholar] [CrossRef]
- Alier, J.; Schulüpman, K. La Ecolología y la Economía; Fondo de Cultura Económica: México city, Mexico, 1998; ISBN 9789681636166. [Google Scholar]
- Perman, R.; Ma, Y.; McGilvray, J.; Common, M. Natural Resource and Environmental Economics, 3rd ed.; Longman: Harlow, UK, 1996; ISBN 0273655590. [Google Scholar]
- Pearce, D.; Turner, R. Economics of Natural Resources and the Environment; Johns Hopkins University Press: Baltimore, MD, USA, 1989; ISBN 9780745002026. [Google Scholar]
- Crampton, P.; MacKay, D.J.C.; Ockenfels, A.; Stoft, S. Global Carbon Pricing—The Path to Climate Collaboration; MIT Press: Cambridge, MA, USA, 2017; ISBN 9780262036269. [Google Scholar]
- Narassimahn, E.; Gallagher, K.S.; Koester, S.; Rivera Alejo, J. Carbon Pricing in Practice: A Review of the Evidence; Climate Policy Lab: Medford, MA, USA, 2017; Available online: https://sites.tufts.edu/cierp/files/2017/11/Carbon-Pricing-In-Practice-A-Review-of-the-Evidence.pdf (accessed on 13 April 2018).
- Rathmann, R. Impactos da Adoção de Metas de Redução de Emissão de Gases de Efeito Estufa Sobre a Competitividade de Setores Industriais Energo Intensivos do Brasil. Ph.D. Thesis, Energy Planning Program from the Federal University of Rio de Janeiro (COPPE/UFRJ), Rio de Janeiro, Brazil, 2012. [Google Scholar]
- Thomas, J.N.; Callan, S.J. Economia Ambiental: Fundamentos, Políticas e Aplicações; Cengage Learning: São Paulo, Brazil, 2010; ISBN 9788522109784. [Google Scholar]
- Shu, T.; Peng, Z.; Chen, S.; Wang, S.; Lai, K.K.; Yang, H. Government Subsidy for Remanufacturing or Carbon Tax Rebate: Which Is Better for Firms and a Low-Carbon Economy. Sustainability 2017, 9, 156. [Google Scholar] [CrossRef]
- Pollitt, H. The E3-razil Model. 2015. Available online: http://www.spe.fazenda.gov.br/noticias/seminario-politica-fiscal-verde/e3-brasil (accessed on 15 April 2018).
- IES-Brasil. Implicações Econômicas e Sociais de Cenários de Mitigação no Brasil—2030. 2015. Available online: http://www.centroclima.coppe.ufrj.br/images/Noticias/documentos/ies-brasil-2030/8_setor-industrial.pdf (accessed on 8 March 2018).
- Chen, Y.H.H.; Timilsina, G.R.; Landis, F. Economic implications of reducing carbon emissions from energy use and industrial processes in Brazil. J. Environ. Manag. 2013, 130, 436–446. [Google Scholar] [CrossRef] [PubMed]
- Wills, W. Modelagem dos Efeitos de Longo Prazo de Políticas de Mitigação de Emissão de Gases de Efeito Estufa na Economia do Brasil. Ph.D. Thesis, Energy Planning Program from the Federal University of Rio de Janeiro (COPPE/UFRJ), Rio de Janeiro, Brasil, 2013. [Google Scholar]
- Grottera, C. Impactos de Políticas de Redução de Emissão de Gases de Efeito Estufa sobre a Desigualdade de Renda no Brasil. Master’s Thesis, Energy Planning Program from the Federal University of Rio de Janeiro (COPPE/UFRJ), Rio de Janeiro, Brasil, 2013. [Google Scholar]
- Chen, W.; Zhou, J.-F.; Li, Y.-C. Effects of an Energy Tax (Carbon Tax) on Energy Saving and Emission Reduction in Guangdong Province-Based on a CGE Model. Sustainability 2017, 9, 681. [Google Scholar] [CrossRef]
- Magalhães, A.; Domingues, E.; Hewings, G. A Low Carbon Economy in Brazil: Policy Alternatives, Costs of Reducing Greenhouse Gas Emissions and Impacts on Households. Presented at the 18th Annual Conference on Global Economic Analysis, Melbourne, Australia, 17–19 June 2015. [Google Scholar]
- Instituto Escolhas. Impactos Sociais e Econômicos da Tributação de Carbono no Brasil. 2015. Available online: http://escolhas.org/wp-content/uploads/2016/09/impactos-economicos-e-sociais-da-tributacao-de-carbono-no-brasil.pdf (accessed on 14 March 2018).
- Wills, W.; Lefevre, J. The Impact of a Carbon Tax over the Brazilian Economy in 2030—Imaclim: The Hybrid CGE Model Approach. In Proceedings of the ISEE 2012 Conference—Ecological Economics and Rio +20: Challenges and Contributions for a Green Economy, Rio de Janeiro, Brasil, 16–19 June 2012. [Google Scholar]
- Yang, B.; Liu, C.; Su, Y.; Jing, X. The Allocation of Carbon Intensity Reduction Target by 2020 among Industrial Sectors in China. Sustainability 2017, 9, 148. [Google Scholar] [CrossRef]
- Ye, B.; Jiang, J.; Miao, L.; Li, J.; Peng, Y. Innovative Carbon Allowance Allocation Policy for the Shenzhen Emission Trading Scheme in China. Sustainability 2016, 8, 3. [Google Scholar] [CrossRef]
- Santos, L. Otimização do Valor de Produção no Brasil com Restrição de Emissão de Gases de Efeito Estufa a Partir de uma Análise Insumo-Produto. Master’s Thesis, Energy Planning Program from the Federal University of Rio de Janeiro (COPPE/UFRJ), Rio de Janeiro, Brazil, 2014. [Google Scholar]
- Gurgel, A.C.; Paltsev, S.; Reilly, J.; Metcalf, G. An analysis of US greenhouse gas cap-and-trade proposals using a forward-looking economic model. Environ. Dev. Econ. 2011, 16, 155–176. [Google Scholar] [CrossRef]
- Rathmann, R.; Júnior, M.F.H.; Szklo, A.S.; Schaeffer, R. Sistema Brasileiro de Cap-and-Trade no Setor Industrial: Vantagens, Desafios, Reflexos na Competitividade Internacional e Barreiras à Implementação; Policy Paper; Energy Planning Program from the Federal University of Rio de Janeiro (COPPE/UFRJ): Rio de Janeiro, Brazil, 2010. [Google Scholar]
- Keohane, N. Cap-and-trade rehabilitated: Using Tradable Permits to Control U.S. Greenhouse Gases. Rev. Environ. Econ. Policy 2009, 3, 42–62. [Google Scholar] [CrossRef]
- Choi, Y.; Lee, H.S. Are Emissions Trading Policies Sustainable? A Study of the Petrochemical Industry in Korea. Sustainability 2016, 8, 1110. [Google Scholar] [CrossRef]
- Laing, T.; Sato, M.; Grubb, M.; Comberti, C. The effects and side-effects of the EU emissions trading scheme. Wiley Interdiscip. Rev. Clim. Chang. 2014, 5, 509–519. [Google Scholar] [CrossRef] [Green Version]
- Castro, A.L.; Seroa da Motta, R. Mercado de Carbono no Brasil: Analisando efeitos de eficiência e distributivos. Rev. Parana. Desenvolv. 2013, 125, 57–78. [Google Scholar]
- Lise, W.; Sijm, J.; Hobbs, B.F. The Impact of the EU ETS on Prices, Profits and Emissions in the Power Sector: Simulation Results with the COMPETES EU20 Model. Environ. Resour. Econ. 2010, 47, 23–44. [Google Scholar] [CrossRef]
- Paltsev, S.; Reilly, J.M.; Jacoby, H.D.; Gurgel, A.C.; Metcalf, G.E.; Sokolov, A.P.; Holak, J.F. Assessment of US GHG cap-and-trade proposals. Clim. Policy 2008, 8, 395–420. [Google Scholar] [CrossRef]
- Stavins, R.N. A Meaningful U.S. Cap-and-Trade System to Address Climate Change. Harv. Environ. Law Rev. 2008, 32, 293–371. [Google Scholar] [CrossRef]
- Lei no. 12.187, de 29 Dezembro de 2009—Institui a Política Nacional Sobre Mudança do Clima (PNMC) e dá Outras Providências. 2009. Available online: http://www.planalto.gov.br/ccivil_03/_ato2007-2010/2009/lei/l12187.htm (accessed on 9 March 2018).
- Fundamentos para a Elaboração da Pretendida Contribuição Nacionalmente Determinada (iNDC) do Brasil no Contexto do Acordo de Paris sob a UNFCCC. 2015. Available online: http://www.mma.gov.br/images/arquivos/clima/convencao/indc/Bases_elaboracao_iNDC.pdf (accessed on 16 February 2018).
- Pretendida Contribuição Nacionalmente Determinada para Consecução do Objetivo da Convenção-Quadro das Nações Unidas sobre Mudança do Clima. 2015. Available online: http://www.mma.gov.br/images/arquivos/clima/convencao/indc/BRAZIL_iNDC_english.pdf (accessed on 16 February 2018).
- Pereira, C.; Bertholini, F. Beliefs or ideology: The imperative of social inclusion in Brazilian politics. Commonw. Comp. Politics 2017, 55, 377–401. [Google Scholar] [CrossRef]
- Decreto nº 7.390, de 9 de Dezembro de 2010—Regulamenta os Arts. 6o, 11 e 12 da Lei no 12.187, de 29 de Dezembro de 2009, Que Institui a Política Nacional sobre Mudança do Clima—PNMC, e dá Outras Providências. 2010. Available online: http://www.planalto.gov.br/ccivil_03/_ato2007-2010/2010/decreto/d7390.htm (accessed on 18 March 2018).
- Ministry of Finance (MF). Market Readiness Proposal under the Partnership for Market Readiness Program. 2014. Available online: https://www.thepmr.org/system/files/documents/Final%20MRP%20Brazil_29-08-2014.pdf (accessed on 1 April 2018).
- Confederação Nacional da Indústria (CNI). Projeto Sudeste Competitivo. 2015. Available online: http://arquivos.portaldaindustria.com.br/app/conteudo_18/2015/10/26/9977/ProjetoSudesteCompetitivo-SumrioExecutivo.pdf (accessed on 22 March 2018).
- Ministério da Ciência, Tecnologia e Inovação (MCTI). Terceiro Inventário Brasileiro de Emissões e Remoções Antrópicas de Gases de Efeito Estufa; MCTI: Brasília, Brazil, 2015. [Google Scholar]
- Ministério do Desenvolvimento, Indústria e Comércio (MDIC). Plano Setorial de Mitigação da Mudança Climática para a Consolidação de uma Economia de Baixa Emissão de Carbono na Indústria de Transformação—Plano Indústria. 2013. Available online: http://www.mma.gov.br/images/arquivo/80076/Industria.pdf (accessed on 15 April 2018).
- Rochedo, P.R.R.; Soares-Filho, B.; Schaeffer, R.; Viola, E.; Szklo, A.; Lucena, A.F.P.; Koberle, A.; Davis, J.L.; Rajão, R.; Rathmann, R. The threat of political bargaining to climate mitigation in Brazil. Nat. Clim. Chang. 2018, in press. [Google Scholar] [CrossRef]
- Vidal, A.C.F.; Hora, A.B. A Indústria de Papel e Celulose. BNDES Biblioteca Digital. 2012. Available online: https://www.bndes.gov.br/SiteBNDES/export/sites/default/bndes_pt/Galerias/Arquivos/conhecimento/livro60anos_perspectivas_setoriais/Setorial60anos_VOL1PapelECelulose.pdf (accessed on 15 March 2018).
- Associação Brasileira de Metalurgia, Materiais e Mineração (ABM). Panorama dos Metais Não-Ferrosos no Brasil e no Mundo. 2009. Available online: https://www.yumpu.com/pt/document/view/28541761/panorama-de-metais-nao-ferrosos-no-brasil-abm/3 (accessed on 17 March 2018).
- Ministério de Minas e Energia (MME). Anuário Estatístico do Setor de Transformação de Não-Metálicos. 2017. Available online: http://www.mme.gov.br/documents/1138775/1732813/ANU%C3%81RIO+N%C3%83O-METALICOS+2017+27.03.2018.pdf/d20dce50-bfe8-4718-8924-129038887835 (accessed on 19 March 2018).
- Centro de Gestão e Estudos Estratégicos (CGEE/MDIC). Levantamento dos Níveis de Produção de Aço e Ferro-Gusa, Cenário em 2020. Nota Técnica, Subsídios 2014 ao Plano Siderurgia do MDIC: Modernização da Produção de Carvão Vegetal. 2014. Available online: http://livrozilla.com/doc/1444319/levantamento-dos-n%C3%ADveis-de-produ%C3%A7%C3%A3o-de-a%C3%A7o-e-ferro-gusa (accessed on 19 March 2018).
- Bastos, V.D.; Costa, L.M. Déficit Comercial, Exportações e Perspectivas da Indústria Química Brasileira. 2011; pp. 163–206. Available online: https://web.bndes.gov.br/bib/jspui/bitstream/1408/2524/1/A%20BS%2033%20D%C3%A9ficit%20comercial%2c%20exporta%C3%A7%C3%B5es%20e%20perspectivas%20da%20ind%C3%BAstria%20qu%C3%ADmica%20brasileira_P.pdf (accessed on 19 March 2018).
- Carbo, M.C. Global Technology Roadmap for CCS in Industry: Biomass-Based Industrial CO2 Sources: Biofuels Production with CCS. 2011. Available online: https://www.ecn.nl/publications/PdfFetch.aspx?nr=ECN-E--11-012 (accessed on 28 March 2018).
- Heede, R. Tracing anthropogenic carbon dioxide and methane emissions to fossil fuel and cement producers, 1854–2010. Clim. Chang. 2014, 122, 229–241. [Google Scholar] [CrossRef]
- International Energy Agency (IEA). Greenhouse Gases from Major Industrial Sources—IV. The Aluminium Industry. Report PH3/23. 2000. Available online: http://www.ieaghg.org/docs/General_Docs/Reports/Aluminium%20industry.pdf (accessed on 10 March 2018).
- Greenhouse Gases from Major Industrial Sources—III. Iron and Steel Production. Report PH3/30. 2000. Available online: http://ieaghg.org/docs/General_Docs/Reports/PH3-30%20iron-steel.pdf (accessed on 11 March 2018).
- MCTI. Terceira Comunicação Nacional do Brasil à Convenção-Quadro das Nações Unidas—Volume II; MCTI: Brasília, Brasil, 2016. [Google Scholar]
- Instituto Brasileiro de Geografia e Estatística (IBGE). Matriz Insumo-Produto: Brasil 2010; Instituto Brasileiro de Geografia e Estatística: Brasília, Brasil, 2015. Available online: https://biblioteca.ibge.gov.br/pt/biblioteca-catalogo?view=detalhes&id=298180 (accessed on 4 March 2018).
- California Air Resources Board (CARB). Public Workshop Cap-and-Trade Program: Emissions Leakage Research and Monitoring. 2012. Available online: https://www.arb.ca.gov/cc/capandtrade/meetings/073012/emissionsleakage.pdf (accessed on 14 March 2018).
- Intergovernmental Panel on Climate Change (IPCC). Climate Change 2007: Working Group III: Mitigation of Climate Change; Executive Summary. 2007. Available online: http://www.ipcc.ch/publications_and_data/ar4/wg3/en/ch11s11-es.html (accessed on 1 April 2018).
- Organization for Economic Co-operation and Development (OECD). Effective Carbon Rates on Energy. 2016. Available online: http://www.oecd.org/tax/tax-policy/effective-carbon-rates-on-energy.htm (accessed on 15 April 2018).
- Nordhaus, W. Critical assumptions in the stern review on climate change. Science 2007, 317, 201–202. [Google Scholar] [CrossRef] [PubMed]
- Stern, N. The Economics of Climate Change: The Stern Review; Cambridge University Press: Cambridge, UK, 2007; Available online: https://journals.openedition.org/sapiens/240 (accessed on 3 April 2018).
- Clarke, L.K.; Jiang, K.; Akimoto, M.; Babiker, G.; Blanford, K.; Fisher-Vanden, J.-C.; Hourcade, V.; Krey, E.; Kriegler, A.; Löschel, D.; et al. Assessing Transformation Pathways. In Climate Change 2014: Mitigation of Climate Change; Contribution of Working Group III to the Fifth Assessment Report of the Intergovernmental Panel on Climate Change; Edenhofer, O., Pichs-Madruga, R., Sokona, Y., Farahani, E., Kadner, S., Seyboth, K., Adler, A., Baum, I., Brunner, S., Eickmeier, P., et al., Eds.; Cambridge University Press: Cambridge, UK; New York, NY, USA, 2014. [Google Scholar]
- Aldy, J.E. Long-Term Climate Policy: The Great Carbon Swap. 2016. Available online: http://www.progressivepolicy.org/wp-content/uploads/2016/11/The-Great-Swap-1.pdf (accessed on 14 April 2018).
- Instituto de Energia e Meio Ambiente (IEMA). Emissões de GEE do Setor de Energia, Processos Industriais e Uso de Produtos; Instituto de Energia e Meio Ambiente: São Paulo, Brasil, 2016; Available online: http://seeg.eco.br/wp-content/uploads/2016/09/FINAL-16-09-23-RelatoriosSEEG-PIUP_pdf (accessed on 15 April 2018).
- Empresa de Pesquisa Energética (EPE). O Compromisso do Brasil no Combate às Mudanças Climáticas: Produção e Uso de Energia; MME: Rio de Janeiro, Brasil, 2016. [Google Scholar]
- Barros, G.; Guilhoto, J.J.M. The Regional Economic Structure of Brazil in 1959: An Overview Based on an Interstate Input-Output Matrix. Rev. Bras. Econ. 2014, 68, 317–335. [Google Scholar] [CrossRef]
Figure 1.
Methodological procedure. Source: Own elaboration.

Figure 2.
Brazilian GHG emissions by origin in 1990, 1995, 2000, 2010, and 2014 (values in GgCO2e). Source: Own elaboration based on [14].
Figure 2.
Brazilian GHG emissions by origin in 1990, 1995, 2000, 2010, and 2014 (values in GgCO2e). Source: Own elaboration based on [14].

Figure 3.
Brazilian GHG emissions by origin in 2005, 2010, and 2014 (values in GgCO2e). Source: Own elaboration based on [14].
Figure 3.
Brazilian GHG emissions by origin in 2005, 2010, and 2014 (values in GgCO2e). Source: Own elaboration based on [14].

Figure 4.
Carbon cost in relation to the sectorial VA according to carbon prices (%) and sectorial VA (US$ millions)—2010. Source: Own elaboration based on [68,69].


Table 1.
Risk of carbon leakage according to emission intensity and trade exposure indicators. Source: [70].
Table 1.
Risk of carbon leakage according to emission intensity and trade exposure indicators. Source: [70].
| Risk of Carbon Leakage | Emissions Intensity | Trade Exposure |
|---|---|---|
| High | High | High |
| Medium | ||
| Low | ||
| Medium | High | |
| Medium | Medium | Medium |
| Low | ||
| Low | High | |
| Medium | ||
| Low | Low | Low |
Table 2.
Emissions intensity—global average and Brazilian average—year 2005 (in tons of CO2 per tons of product). Sources: References [64,65,66,67] for global average; References [14,59,60,61,62,63] for Brazilian average.
| Sector | Global Average | Brazilian Average |
|---|---|---|
| Non-ferrous metals | 9.1–9.6 | 5.6 |
| Non-metallic minerals | 0.6–0.8 | 0.7 |
| Iron and steel | 1.6–2.2 | 1.3 |
| Pulp and paper | 0.8–0.9 | 0.2 |
| Chemicals | n.a. | 0.3 |
Note: n.a.—non-available.
Table 3.
Impact on sectorial VA (%) according to carbon price (in US$/tCO2) and emissions reduction (% over total)—year 2010. Source: own elaboration based on [68,69].
| Sector | Carbon Price (US$/tCO2) | % Reduction in Sectorial Emissions | |||||
|---|---|---|---|---|---|---|---|
| 0% | 5% | 15% | 25% | 35% | 45% | ||
| Non-ferrous metals | 10 | 2.5% | 2.3% | 2.1% | 1.9% | 1.6% | 1.4% |
| 25 | 6.2% | 5.9% | 5.2% | 4.6% | 4.0% | 3.4% | |
| 50 | 12.3% | 11.7% | 10.5% | 9.3% | 8.0% | 6.8% | |
| Non-metallic minerals | 10 | 3.7% | 3.5% | 3.2% | 2.8% | 2.4% | 2.0% |
| 25 | 9.3% | 8.8% | 7.9% | 7.0% | 6.0% | 5.1% | |
| 50 | 18.6% | 17.7% | 15.8% | 13.9% | 12.1% | 10.2% | |
| Iron and steel | 10 | 5.7% | 5.4% | 4.8% | 4.3% | 3.7% | 3.1% |
| 25 | 14.3% | 13.5% | 12.1% | 10.7% | 9.3% | 7.8% | |
| 50 | 28.5% | 27.1% | 24.2% | 21.4% | 18.5% | 15.7% | |
| Pulp and paper | 10 | 0.5% | 0.5% | 0.5% | 0.4% | 0.3% | 0.3% |
| 25 | 1.3% | 1.3% | 1.1% | 1.0% | 0.9% | 0.7% | |
| 50 | 2.7% | 2.5% | 2.3% | 2.0% | 1.7% | 1.5% | |
| Chemicals | 10 | 0.9% | 0.8% | 0.7% | 0.7% | 0.6% | 0.5% |
| 25 | 2.2% | 2.1% | 1.9% | 1.6% | 1.4% | 1.2% | |
| 50 | 4.4% | 4.2% | 3.7% | 3.3% | 2.8% | 2.4% | |
Note: −impact ![Sustainability 10 02390 i001]() +impact.
+impact.
 +impact.
Table 4.
Emissions intensity classification and proposed trade exposure classification—2010. Source: own elaboration based on [58].
Table 4.
Emissions intensity classification and proposed trade exposure classification—2010. Source: own elaboration based on [58].
| Sectors | Emissions (tCO2) (A) | Sectorial VA (US$ Millions) (B) | Emissions/VA (tCO2/US$ Millions) (C) = (A) (B) | Emissions Intensity Classification <1000 (Low) 1000–2499 (Medium) >2500 (High) |
|---|---|---|---|---|
| Non-ferrous metals | 6,250,000 | 3411 | 1832 | Medium |
| Non-metallic minerals | 45,190,000 | 13,580 | 3328 | High |
| Iron and steel | 43,900,000 | 7945 | 5525 | High |
| Pulp and paper | 3,080,000 | 7196 | 428 | Low |
| Chemicals | 16,830,000 | 23,519 | 716 | Low |
Table 5.
Sectorial trade share and trade exposure classification—2010. Source: own elaboration based on [70].
Table 5.
Sectorial trade share and trade exposure classification—2010. Source: own elaboration based on [70].
| Sectors | Export Share (%X = Xi/(Xi + Mi)) | Trade Share (Si = Xi + Mi/Yi) | Trade Exposure Classification <10% (Low) 10–24.9% (Medium) >25% (High) |
|---|---|---|---|
| Non-ferrous metals | 60% | 52% | High |
| Non-metallic minerals | 51% | 11% | Medium |
| Iron and steel | 60% | 31% | High |
| Pulp and paper | 76% | 28% | High |
| Chemicals | 14–32% | 28–56% | High |
Table 6.
Emissions intensity, international trade exposure and risk of carbon leakage—2010. Source: own elaborations based on [70].
Table 6.
Emissions intensity, international trade exposure and risk of carbon leakage—2010. Source: own elaborations based on [70].
| Sectors | Emissions Intensity | International Trade Exposure | Risk of Carbon Leakage |
|---|---|---|---|
| Non-ferrous metals | Medium | High | High |
| Non-metallic minerals | High | Medium | High |
| Iron and steel | High | High | High |
| Pulp and paper | Low | High | Medium |
| Chemicals | Low | High | Medium |
© 2018 by the authors. Licensee MDPI, Basel, Switzerland. This article is an open access article distributed under the terms and conditions of the Creative Commons Attribution (CC BY) license (http://creativecommons.org/licenses/by/4.0/).
Share and Cite
MDPI and ACS Style
Santos, L.; Garaffa, R.; Lucena, A.F.P.; Szklo, A. Impacts of Carbon Pricing on Brazilian Industry: Domestic Vulnerability and International Trade Exposure. Sustainability 2018, 10, 2390. https://doi.org/10.3390/su10072390
AMA Style
Santos L, Garaffa R, Lucena AFP, Szklo A. Impacts of Carbon Pricing on Brazilian Industry: Domestic Vulnerability and International Trade Exposure. Sustainability. 2018; 10(7):2390. https://doi.org/10.3390/su10072390
Chicago/Turabian StyleSantos, Luan, Rafael Garaffa, André F. P. Lucena, and Alexandre Szklo. 2018. "Impacts of Carbon Pricing on Brazilian Industry: Domestic Vulnerability and International Trade Exposure" Sustainability 10, no. 7: 2390. https://doi.org/10.3390/su10072390
Note that from the first issue of 2016, this journal uses article numbers instead of page numbers. See further details here.