An Assessment of Regional Sustainability through Quality Labels for Small Farmers’ Products: A Slovak Case Study


1
Department of Environmental Management, Faculty of Natural Sciences, Matej Bel University in Banská Bystrica, Tajovského 40, 974 01 Banská Bystrica, Slovakia
2
Department of Corporate Economics and Management, Faculty of Economics, Matej Bel University in Banská Bystrica, Tajovského 10, 975 90 Banská Bystrica, Slovakia
*
Author to whom correspondence should be addressed.
Sustainability 2018, 10(4), 1273; https://doi.org/10.3390/su10041273
Submission received: 19 March 2018
/
Revised: 17 April 2018
/
Accepted: 17 April 2018
/
Published: 20 April 2018
(This article belongs to the Section Environmental Sustainability and Applications)
Abstract
:Regional product labelling can help develop regional business activities, especially with traditional regional products. Their general popularity is a significant source of income for less-developed regions. The Gemer-Malohont region is an economically underdeveloped area with a high unemployment rate. The subject of the survey was focused on regional food products that are made by small farmers. The analysis was carried out using data from a questionnaire survey on the period April–July 2017 in each of the region’s districts. The results obtained by the questionnaire survey were processed with the use of statistical methods (two-step cluster analysis, radar chart, box-plots, regression analysis) using Microsoft Excel and the IBM SPSS Statistics 23 software. We divided consumers into two groups—knowledgeable regional food purchasers and priced-oriented consumers—based on their preference for regional food and through cluster analysis. We show that the more developed regions (Rimavská Sobota and Rožňava) show a higher rate of purchase of regional foods. Less-developed regions (Poltár, Revúca) are represented by lower-income consumers for whom the food price is the decisive criterion. Local residents of backward regions should pay attention to domestic food and local small farmers who are tools for the creation of local capital and local development.
1. Introduction
An integral part of the European Union’s cohesion policy is an effort to improve the quality and safety of domestic products. A large number of domestic products shows specific characteristics related to their geographical origin, traditional production, use of traditional raw materials or other qualitative benefits [1]. These characteristics have an impact on consumer perception of products and purchasing decisions and support for the development of the regional economy. Velčovská and Sadílek [2] studied the growing interest of consumers for both quality and traditional products in European Union countries. Over the last few decades, the consumption of goods and services has increased dramatically across the world. This has led to diminished natural resources and severe harm to the environment, such as global warming, expanded environmental pollution and a decline of flora and fauna [3].
The idea of product labelling that informs the consumer regarding the environmental impact of products, their production and environmental impact was first implemented in Germany in 1978 [4]. Currently, the Ecolabel program covers the labelling scheme for environmentally suitable products. Such products can obtain an EU Ecolabel, which informs the consumer and at the same time certifies that the product meets the requirements for the elimination of direct and indirect environmental impacts on population health and species biodiversity and ecosystems [5,6].
Brands of regional food products are built on tradition, encompassing habits of manufacturing and consumption and they are based on the localization of production processes and the origin of raw materials [7]. It is a system of graphic designation of regional products, services and events. Each product or service, labelled with a regional brand, promotes not only the creator, producer or provider itself, but also the territory in which it was generated, thus forming its overall identity. Regional labelling is a way of building the regional identity, promotion and visibility of regions as well as a means to promote their economic, cultural and social development.
The main objective of this designation is to promote rural regions and to support the development of a socially-, culturally- and environmentally-oriented economy in areas that are interesting due to their natural and cultural heritage [8,9]. The regional designation concept should thus contribute to the economic recovery of regions with respect to all three pillars of sustainable development. The designation should help manufacturers, farmers and other entrepreneurs with the promotion and sale of local products and to increase the prestige of products through the reputation of the region. Adding value to local food through product certification promotes development by local people so they can pass it on to the next generation as a local brand [10]. Regional brands also contribute to the development of tourism. The appeal of tourist regions to visitors is differentiated through the brand. With regard to local residents, a brand can strengthen solidarity with the region and encourage public participation in different types of development in the region and mediate contacts between producers and other local participants.
OECD (Organisation for Economic Co-operation and Development) data from 2014 show that the Slovak Republic is ranked among the countries with the largest regional differences in income indicators (29th of 32 countries) and non/employment (21st of the 33 surveyed countries). This is mainly due to the high distance of the capital (Bratislava) from the rest of Slovakia. Differences exist in the level of income in individual regions and the lag of the regions of Eastern and Southern Central Slovakia in terms of the unemployment rate [11].
In 2015, the Slovak Republic adopted Act No. 336/2015 Coll. [12] for the support of the least-developed districts. The law identified the 12 least-developed districts in the Slovak Republic. The Gemer-Malohont region belongs to this group of districts. Goliaš [11] reports the highest unemployment rate of over 20% (in March 2017) in the districts of Rimavská Sobota, Revúca and Rožňava. This fact must be reflected in the monitored parameters, such as monthly income and the purchasing power of the population.
At present, examples of the local or regional branding of various, usually agricultural products can be found in almost all European countries. Growing demand for products with a known origin and guaranteed quality is a natural response to the globalization of production and supply. This subject opens the following research issues on the consumer side. Regional labelling should provide extensive information to consumers, not only information about the origin of the product. Producers must consider the characteristics of consumers and they must also pay attention to their demographics, socio-economic status, cultural traits, personality and attitudes. Consumers buy products based on credibility and references. In addition, they respond differently to products with and without labels. Competence, education and intellectual capital are factors that distinguish consumers who buy such products from those who do not buy them. The label becomes important to bridge producers and consumers. Consumers prefer safe and quality products and, similarly, consumers believe that the label serves as a guarantee of quality and origin.
The aim of this article is to provide a survey of local consumer opinions on the regional environmental labelling for Gemer-Malohont in Slovakia. The term regional food is interchangeable with the term origin food that is used by Bryla [13]. The original food is connected with traditions and territorially, which are key characteristics of regional food. The results of the questionnaire survey observed the knowledge of the respondents regarding regional labelling and the factors affecting the purchase of regional foods. The specific objective of this research was to determine: which consumer segments purchase regional food and which factors influence the purchase of regional foods. The innovation of the present article is based on the presentation of one of the least-developed regions of the Slovak Republic and on the demonstration of the potential of its regional development. The scientific objective of the article is to transfer knowledge of the sustainability of the production and sale of food and agricultural products. The research also includes exploring regional and rural development in the context of the development of local farms and promoting regional sustainability.
Theoretical Background
Environmental labelling is a voluntary instrument of environmental policy and it supports the development of regional activities and contributes to raising the standard of living [14]. Ecolabels are intended as a means for consumers to engage in sustainable consumption. The aim of the ecolabels is, as stated by Clancy et al. [15], to help consumers identify products that have a relatively low impact on the environment throughout their lifecycle. For example, the Ecolabel Index 2017 [16] contains a list of 465 ecolabels in 199 countries and 25 industries. Buckley [17] considers ecolabels to be a component of consumer choice.
The International Organization for Standardization (ISO) has structured and classified environmental labels into three types that correspond to the three communication channels according to Fracoisa-Lecomptea, et al. [18]. The type I ecolabels are certified by ISO 14024. Ecolabel type I and II helps consumers to identify so-called verified eco-products. The type III Ecolabel contains unclear information that makes it difficult for consumers to understand the impact of the product on the environment.
Environmental product labelling is seen as a tool to increase the demand for eco products, which leads to a reduction of the environmental impacts of production. We compare ecolabels to marketing eco-innovation. They offer information on the quality and performance of products in terms of their impact on the environment throughout their life cycle (life cycles assessment). Ecolabels, according to Baumeister and Onkila [19], should bring a change in consumer behaviour and contribute to environmental awareness. Ecological consumers are usually associated with environmentally responsible consumption that takes into account the environmental impact of purchasing, using and disposing of different products [3]. For this purpose, studies mapping positive changes in customer behaviour within various industrial sectors were created, covering the automobile industry [20], production of white and black technique [21], coffee production [22] and, wine production [23]. There are also studies challenging these positive changes in consumer behaviour [24,25,26,27].
The food industry is one of the key sectors in which ecolabels are attributed with a high weight. Eco-branded food products account for 5% of sales in Europe [28]. The total share of eco-labelled products is low on the market. The food sector has been identified as one of the segments in which the green market has continued to grow. The growth of other sectors has been interrupted [29].
In recent years, the regional labelling of products (especially food) has begun to develop more strongly in European countries in the context of product environmental labelling. Thanks to the careful use of natural resources in the area, the consumer, by purchasing these products, contributes to the protection of the environment, supports the economic development of the area and helps to restore the lives of the rural population [30]. Traditional food products are an important element of European culture, identity and heritage, contributing to the development and sustainability of rural areas and protecting them from spoilage. They offer consumers a wide range of choices associated with regional identity and sensory quality [31]. They are sold under different trademarks. Small farmers face a challenge to further improve the safety, health and quality of their products through various innovations that will enable them to maintain and expand their market share [32,33].
According to Štensova [34], regional brands in Slovakia are branded by labelling with approximately 10 years of history. Local action groups have been involved in creating and promoting regional brands. All regional brands in Slovakia have their own website, with the uniform appearance of the logotype expressing the typical symbol of the region.
The regional marking of Gemer-Malohont products was introduced in 2014 by the GEMER-MALOHONT Local Action Group [35]. These products come from local manufacturers, use traditional practices or local natural resources, contain a certain amount of manual work and are unique to the region. Among products from the region that have been marked “GEMER-MALOHONT® regional product” it is possible to find fruit juices, goat milk, ceramics, woven products, meat and meat products, home-made horseradish, honey, bee hives, cosmetics, wire and wood products and hand-embroidered pictures. The GEMER-MALOHONT® regional label is aimed at distinguishing, highlighting and supporting local producers and service providers who, in addition to their production and services, are also involved in job creation, building the region’s good name and preserving its traditions, values and uniqueness. A regional label designating local products or services will guarantee consumers the origin of the product or service in the region, as well as the use of traditional practices or local and regional resources.
2. Materials and Methods
The study aims to analyse and assess the opinion of the consumers on the regional branding in a selected region in Slovakia. The subject of the survey was regional food products that are made by small farmers. The analysis was carried out on the basis of original empirical research based on a questionnaire survey. The survey was conducted in the period April–July 2017 in each of the region’s districts. The questionnaire survey included 23 closed questions. Respondents were divided by gender, age, education, employment, monthly income, family status, number of kids and locality where they live. The other questions were focussed on consumer behaviour. The questionnaire was distributed in electronic and printed form through the GEMER-MALOHONT Local Action Group. The survey was realized with Slovak men and women, 18 years old or older, who are likely to buy food products. Initially 250 responses were obtained, of which 100 were excluded in the data cleaning process. We excluded the respondents who did not respond to the questions and whose answer was I don´t know. The final database included 150 respondents (Table 1).
The representativeness of the selected sample was guaranteed by respecting the geographic location and gender. In order to verify the representativeness of the sample, we used the nonparametric chi-squared test. According the results of the test, it is possible to say that the sample is representative by region (p-value = 0.848) and by gender (p-value = 0.573).
The selected sample corresponds very well to the general population in terms of gender and regional structure (Table 1). Women constituted 54.0% of the selected subject, which is a little greater than in the general population in the study region (51.7% in 2017 according to the database DATA.cube from the tatistical office of the Slovak Republic, 2018). The age structure of the selected sample does not correspond to the general population in the study region (Table 2). We observe these disproportions in the Rožňava and Revúca regions, with more people aged 18–26; in the Rimavská Sobota region, with more people aged 26–61; and in the Poltár region, with more people aged 62 and over than in the general population in the study region. We respected the level of education. The selected sample was similar to the regional sample, with little difference in value. The selected sample was very heterogeneous according to employment (professional activity). Employed respondents made up more than half of the studied group (57.3% of all studied regions), followed by students (17.4% in all studied regions), retirees (11.3% in all studied regions), unemployed people (9.3% in all studied regions) and women on maternity leave (4.7% in all studied regions). The selected sample resembled the general population in the studied region regarding family status (Table 2). The statistical data were not available on the income and number of children in the family by region (district). These disproportions of the selected sample do not misrepresent the present results because the sample is statistically evidenced by two characteristics (gender and region).
The results obtained from the questionnaire survey were statistically processed. We used the following methods: Microsoft Excel and IBM SPSS Statistics 23 software [36]. We used to the methods of two-step clustering, radar chart, box plots and linear regression analysis.
Using two-step clustering we determined the segment of consumers who do or do not purchase regional food products. Firstly, descriptive analysis was performed, followed by a cluster-analysis. Two-step cluster analysis is a method that requires only one pass through the data. The process consists of two major steps: the first step where initial clustering of observations into small sub-clusters is performed, followed by the process when these sub-clusters are treated as separate observations. The graphic output of the first step indicates the quality of the cluster solution. A value of more than 0.50 indicates a satisfactory cluster quality. The second step is grouping, where the sub-clusters are based on the analysis and are grouped into the required number of clusters [37]. In the cluster analysis we used the following categorical variables: purchase of home products, purchase of regional products, knowledge of regional branding and composition of the product. We observed the importance of variables. The most important variable was the purchase of regional products (predictor importance = 1) and the least important variable was the purchase of home products (predictor importance = 0.26).
Another method was a radar chart, which is a graphic method of displaying multivariate data in the form of a two-dimensional chart of three or more quantitative variables represented on axes starting from the same point. The values for adjacent variables in a single series are connected by lines, and frequently the polygonal shape that they create is filled with a colour. We used the same variables as in the case of the two-step cluster method. Then, we were interested in the distribution of the respondents by region, which was another variable. Only the purchase of regional products was included in another radar chart.
The food consumption expenditure by region was displayed through box-plots. Food consumption expenditure refers to the monetary value of acquired or purchased food, including only the expenditure for regional food products. The box plot has become the standard technique for presenting the five-number summary that consists of the minimum and maximum range values, the upper and lower quartiles and the median [38]. The dependent variable presented expenditure on regional food products and the independent variable presented the region.
Subsequently, we studied the relationship between monthly income and food consumption expenditure. We used linear regression analysis. Linear regression analysis is a statistical tool used to determine the probable change of one variable in relation to a given amount of change in another variable. The degree to which the variables are correlated to each other depends on the regression line. In addition, the regression provides information on the relationship between two or more variables. The dependent variable presented expenditure on regional food products and the independent variable presented monthly income.
The indicators of sustainable urban development were based on the European Thematic Strategy of Sustainable Urban Development and the European Indicators of Sustainable Urban Development. Our research focuses on the four districts of the Banskobystrica region that adopted the Regional Integrated Territorial Strategy in 2006. The objectives of the Regional Integrated Territorial Strategy of the Banskobystrica region are coping with the indicators of sustainable development, focusing on safe and environmentally-friendly transport in the region, more efficient access to public services, an increase in the competitiveness of the region, development of the region’s creative potential, improving the quality of the environment and ensuring sustainable development. The selected districts have poorly developed infrastructure and an agricultural character. Their potential lies in using domestic quality food production.
The Selection of the Survey Area
The territory of Slovakia is full of natural values and attractive phenomena of cultural and social heritage. Economically interesting areas have been and are the centre of attention of both professionals and the public. The southern part of Central Slovakia remains on the edge of this interest. The turbulent changes of the 1990s have reduced its share of industry, paralyzed the agricultural system and caused an increase in the unemployment rate. In the whole area there are few settlements (centres), relatively low population and a poorly developed network of communications. Hilbert et al. [39] highlighted the prevailing mono-functional and trifunctional use of land (agriculture, forestry, and mining), the regional or local character of industrial production, with extensive transport and recreational use of the landscape. The current situation is comparable to the above-mentioned characteristics and the potential of the country’s development should be oriented to its own regional development and the use of regional products and the promotion of modern elements of agro-tourism.
The Gemer-Malohont region is located in the central part of Southern Slovakia (in the past, it was part of the Banská Bystrica Self-Governing Region). It contains parts of the Slovak Ore Mountains, Rimavská Basin, Rožňavská Basin and of Slovak Karst. The region is rich in mineral resources and natural beauty, with a variety of flora and fauna and protected natural areas (surrounded by protected country areas, namely Cerová Vrchovina and the national park Muránska Planina). Gemer-Malohont is currently one of the most remote regions in the Slovak Republic. The agriculture is developing thanks to the quality of the land and climate. The inhabitants of the Gemer region have a rich cultural heritage and preserve their cultural traditions, but they are also open to modern culture.
In addition, the area is suitable for the development of industry and agriculture, but on the basis of geographical, natural and cultural determinants; it is particularly suitable for tourism, hiking, agro-tourism (according to SARIO (Slovak Investment and Trade Development Agency) it is the region with the highest amount of protected areas) and other commercial and economic activities, such as awarding regional quality labels. Its industrial base is represented mainly by food factories (Brewery and Malting Gemer Ltd., R.S.k. Ltd.—Cannery, Meat Industry—TAURIS Inc.).
3. Results and Discussion
The Gemer-Malohont region, as mentioned in the introduction, shows a high rate of unemployment. The high unemployment rate in the region was reflected in the monthly meat industry income of respondents. The majority (37%) was made up of respondents with a monthly income ranging from 351–500 EUR. There was almost the same percentage reported for single (51%) and married respondents (49%) in the research sample. There was a slight predominance of respondents with two children (38%) and permanent residency in rural areas (55%).
Through cluster analysis (a method of two-step clustering), we identified consumer groups in terms of their preference for regional foods. Based on the proposed segmentation criteria (buying domestic food, purchasing regional foods, awareness of regional labelling, food composition), we identified two clusters with a satisfactory quality of aggregation in the sample. With regard to the cluster size, the largest was Cluster 1 (regional branded consumers) which represented 57.7%, followed by Cluster 2 (priced consumers) with 42.3% (Table 3).
The analysis of the cluster profile of the variables presented statistical differences, as shown in Table 4. Cluster 1 had significance among females and people aged 26–61 with secondary school or university education of the first and the second degree. The dominant representation was for unemployed respondents with a monthly income 350–550 EUR. In the cluster, childless consumers or families with two children prevailed. These respondents come from the rural region of Rimavská Sobota. On the other hand, Cluster 2 had a slight predominance of males with secondary education. It included unemployed consumers aged 26–61 with a monthly income 350–550 EUR. Also, in Cluster 2 childless consumers or families with two children were predominant. The regional breakdown of respondents was balanced. The dominant locality was rural areas. In terms of the demographic and socio-economic characteristics the important variables that affect the profile of the cluster were gender (chi-square = 6.579, p-value = 0.010), age (chi-square = 7.193, p-value = 0.027) and region (chi-square = 10.701, p-value = 0.013).
Cluster 1 (regional branded consumers) are consumers who have some knowledge of regional labelling and buy these products at public events (Table 5). They do not buy regional foods in the shop but they will repeat the purchase of proven regional foods. The frequency of their purchasing is varied (2–4 times per week or more).
Their favourite way to find information about products is personal experience. Cluster 2 (Table 5) consists of priced consumers who have knowledge about regional labelling but prefer information about the price of a product. These consumers do not buy regional foods in the shop, they buy them at public events. The frequency of their purchases is more frequent (3–4 times per week or more). They look for information about products in leaflets because the key factor of their purchase is the price. The important variables for this cluster’s profile are regional labelling at public events (chi-square = 10.450, p-value = 0.001), knowledge of regional labelling (chi-square = 23.537, p-value = 0.000), buying a specific product (chi-square = 5.976, p-value = 0.015), repeat purchase of regional labelling (chi-square = 7.252, p-value = 0.007), travel for the product (chi-square = 8.596, p-value = 0.003) and promotion of products (chi-square = 19.177, p-value = 0.004).
Finally, a brief description of each of the clusters is presented. In the terms of Schumacher [40], we divided the consumers into two groups that match our cluster results. The first cluster (Table 3) represents regional branded consumers who have knowledge of regional labelling and therefore focus on buying domestic and regional food. These are predominantly female individuals (68.3%) of working age (26–61 years) who are employed (75.0%) with a monthly income of between 350 and 750 Euro. According to the thesis of Chalupová et al. [41], it is confirmed that women pay more attention to food labels and prefer home-grown food. The finding confirms several studies on the demographic characteristics of consumers [42,43,44,45], which have identified these so-called green consumers as women and younger people with a higher education and with higher monthly incomes. In terms of education, the first cluster is remarkable for containing of consumers with third grade education (66.7% of all third-grade graduates). Also child-free consumers are concentrated in this cluster (35.0%). The dominant representation was reported by consumers from the Rimavská Sobota district (61.7%) with a slight prevalence of rural areas (53.3%). Rimavská Sobota, in the Gemer-Malohont region, is a strategic business hub. Consumers in the first cluster belong to knowledgeable regional food purchasers (100.0% have knowledge of regional product labelling) for whom the composition of food is more important than the price. According to Gracia and de-Magistris [46], food labels are a guarantee of food quality and safety. Studies of the meaning and interpretation of the information on food packaging from the viewpoint of consumers that highlight the non-transparency of information on labels are emerging [19,47,48]. According to the Flash Eurobarometer [49], only 7.0% of consumers believes that the food labels provide sufficient and comprehensible information and almost 32.0% oppose this belief. In our research, the composition and price were balanced factors concerning the purchase of regional foods.
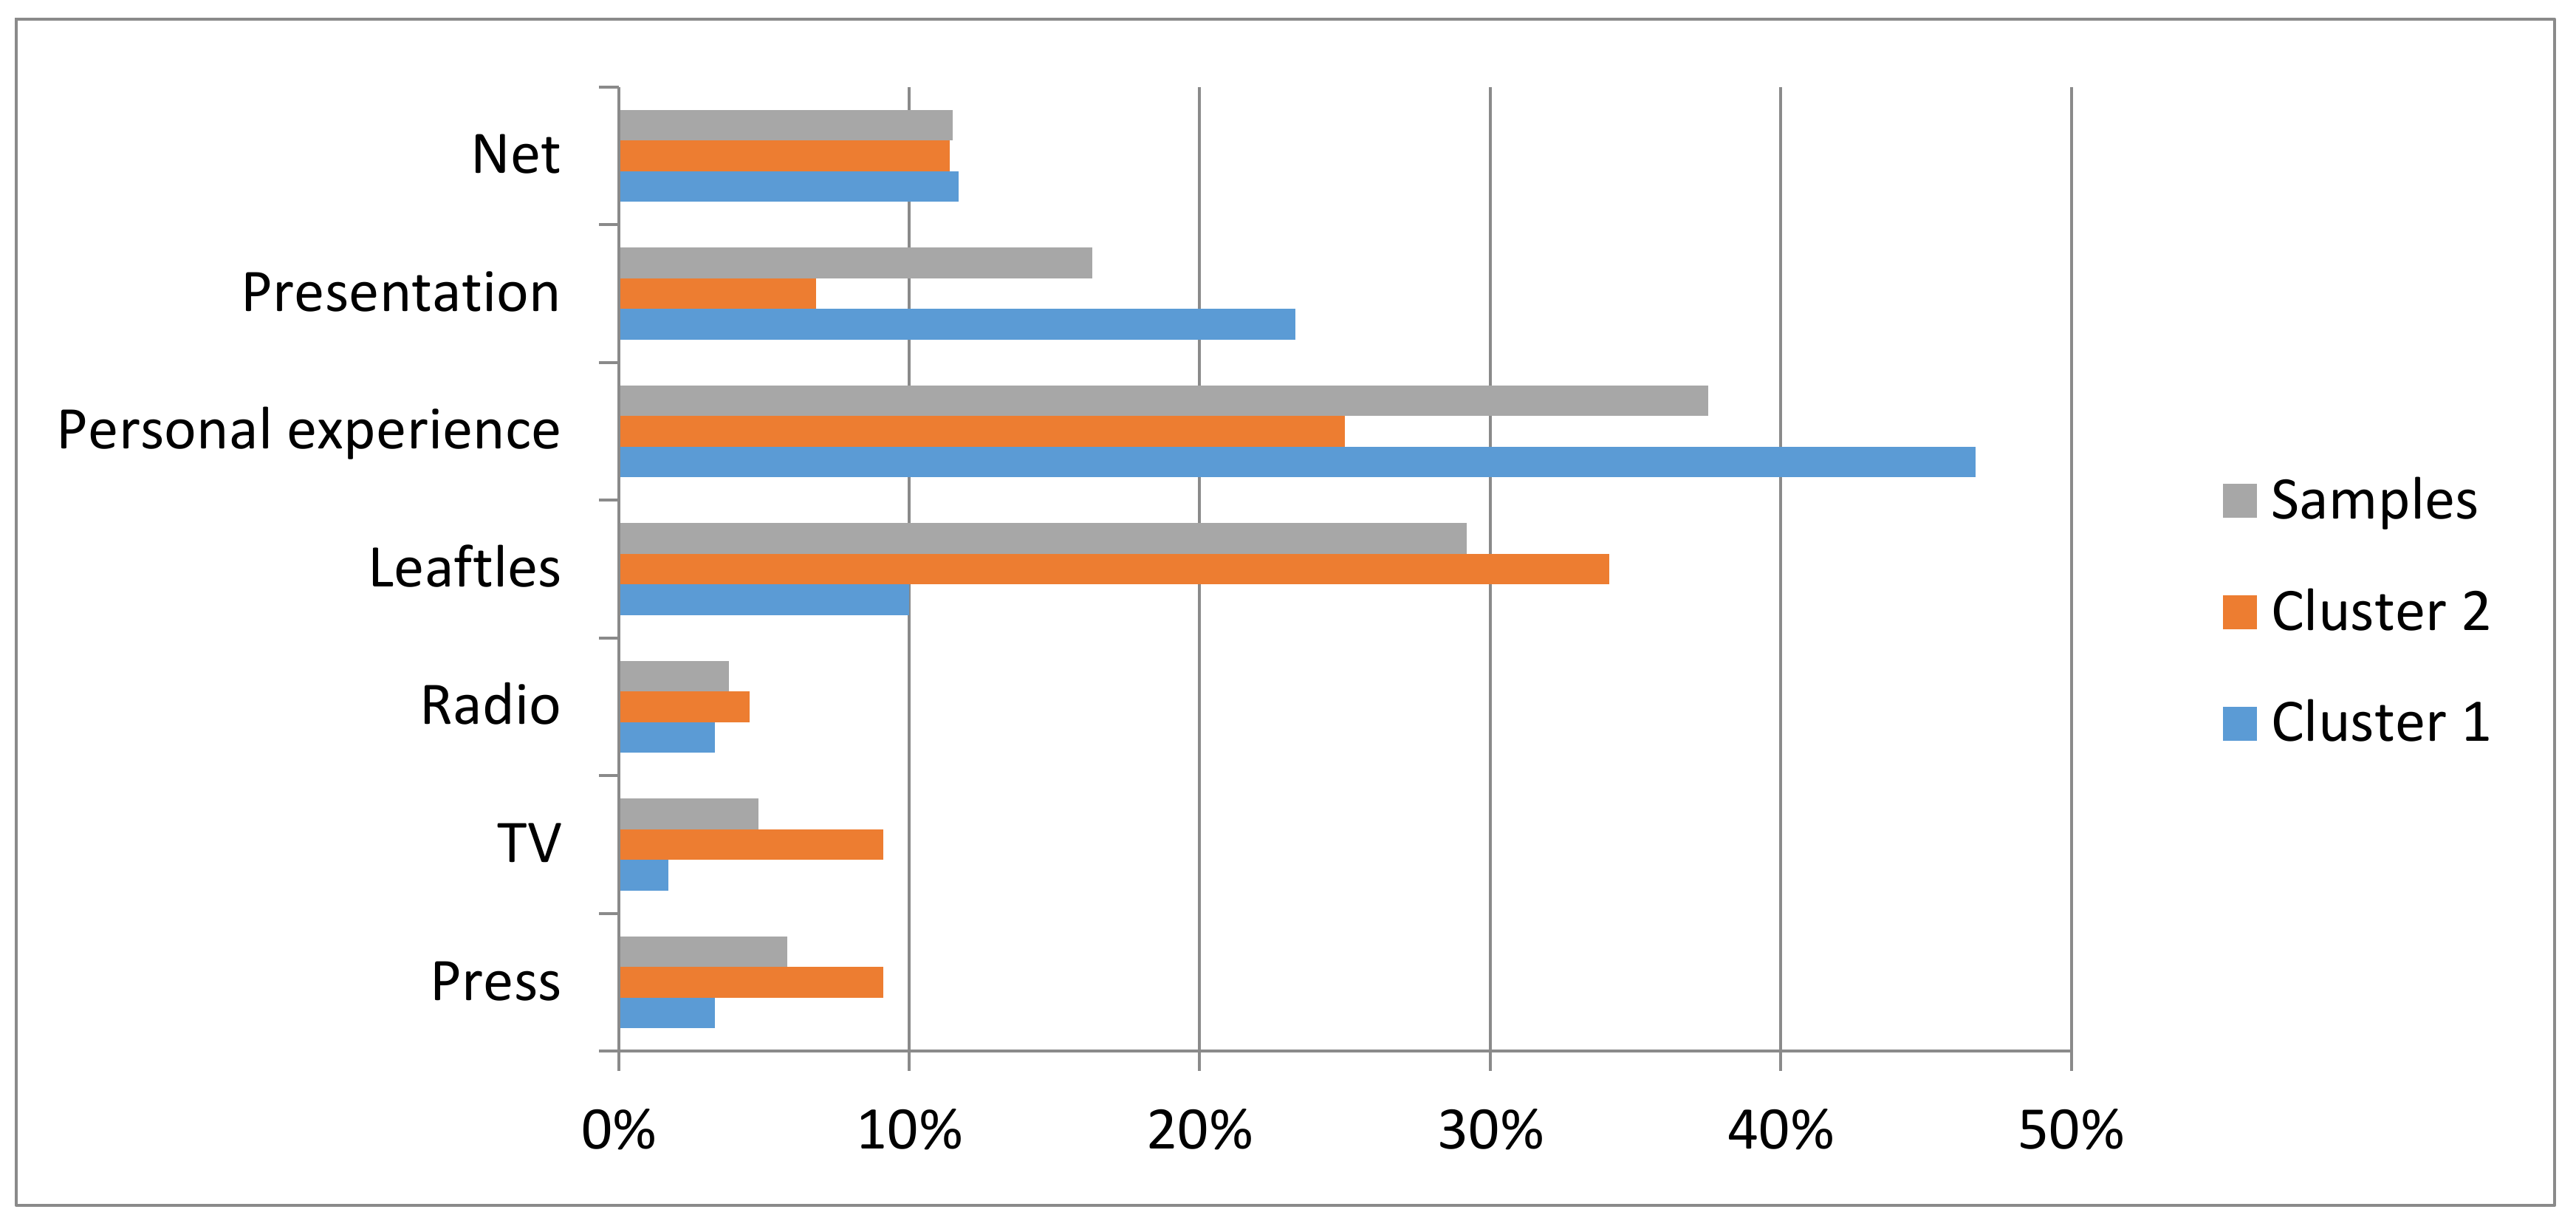
Consumers in the first cluster buy regional foods mostly at public events (91.1%). We have confirmed Fernández-Ferrín et al.’s [50] claim that these products are sold through short chains, i.e., shops in the producer’s yard, which guarantees the unique nature of the origin of the food and the means of production. More than half of the consumers (58.3%) buy specific foods and prefer re-purchase (98.3%). These consumers consider personal experience to be the most important source of information (46.7%) and do not even trust television advertising (1.7%). Personal experience was one of the most important forms of gathering information about regional foods found in the whole research sample (Figure 1). Zenetti and Klapper [51] state that consumers are less dependent on advertising if they have sufficient brand experience or experience with manufacturers. On the other hand, TV advertising according Frison et al. [52] belongs, on the producer’s side, to the most popular marketing tools (for the year 2012, the share of advertisement sales for food sales was 9.2%). We are inclined to Zenetti Klapper’s [51] opinion, which states that advertising’s effects on decisions to buy food depends on the heterogeneous perception of consumers.
The second cluster is the so-called priced consumers, who do not buy regional foods (Table 2). Up to 56.8% of them are men of working age (26–61 years) with a prevalence of secondary education (61.4%). We take the view of Schumacher [40] and Chalupová et al. [41] that men buy less regional products because a large part of these products are food and men more often buy technical devices. In this cluster, students, the unemployed and retirees have the largest representation in their groups (over 60%). Rural respondents (61.4%) with a larger family (three or more children) predominate slightly with a monthly income of up to 550 EUR (29.5%). From the point of view of the region, consumers in the Poltár and Revúca district are concentrated in this cluster.
All consumers of the second cluster had no knowledge of regional labelling (100.0%) and therefore do not search for such food (60.0%) or related public events (40%). The decisive factor for the purchase of food is the price (75.0%). This agrees with Srinivasan and Blomquista’s [53] assumption that regional foods are associated with so-called premium prices and therefore consumers of this cluster do not buy regional food. They obtain information about regional foods from leaflets (34.1%) or social sources (friends, relatives, acquaintances, personal experience) (Figure 1). They are not willing to travel for regional food (86.4%), as a result of their economic activity (45.4% of economically inactive consumers) and their monthly income. According to Berg and Preston [54], the geographic proximity of local foods and the benefits of their consumption are decisive factors.
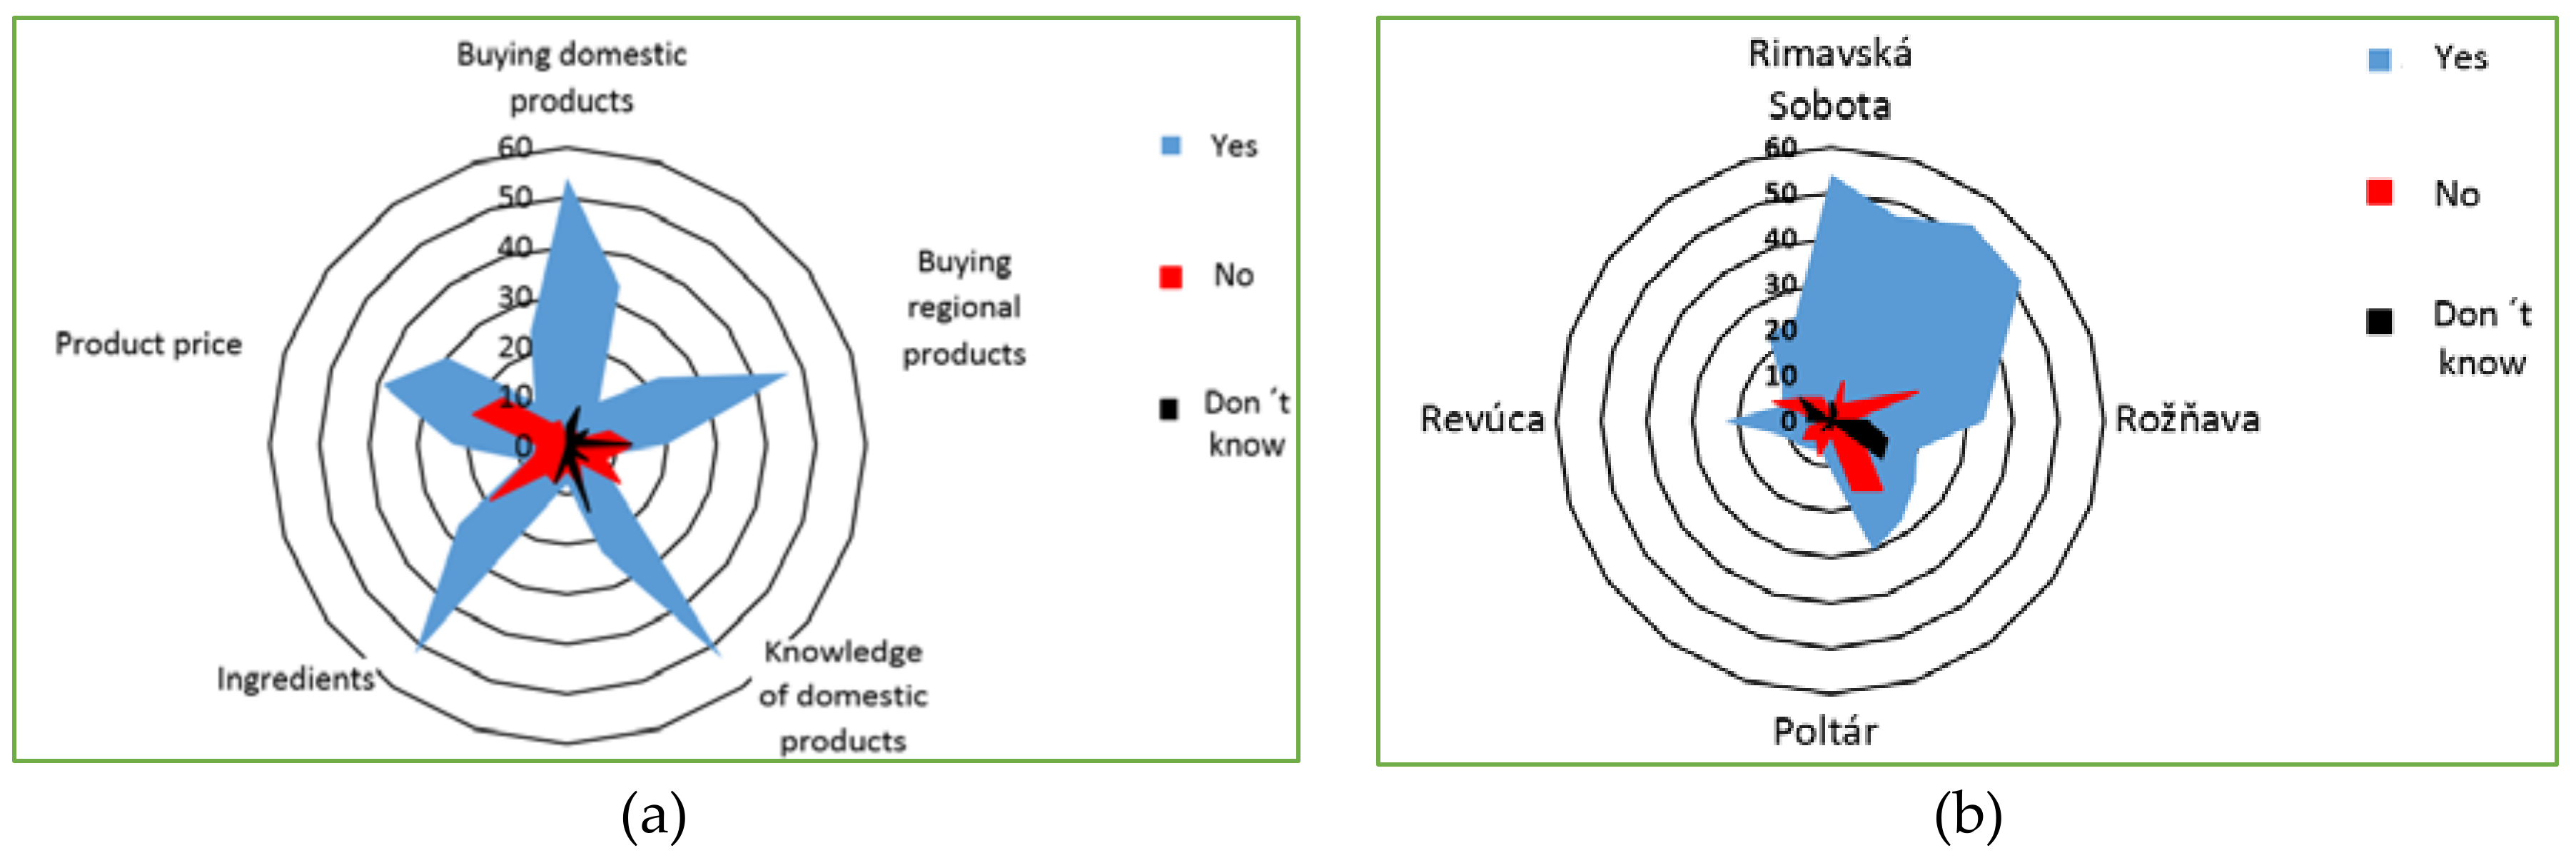
The results of the radar graphs (Figure 2) present the dependence of respondents’ answers in individual districts on questions related to the purchase of domestic food, the purchase of regional foods, their knowledge of regional labelling, their interest in the composition of regional foods and the price of regional foods. All questions were dominated by a positive response (Figure 2a), which is cheering. The assumption of purchasing a regional product is based on the fact that the respondent identifies the brand and the composition and takes into account the price in all four districts (Rimavská Sobota, Rožňava, Revúca and Poltár). As we have seen, negative responses were shown in the food composition assessment. The facts indicate that there are still consumers who prefer price at the expense of the composition (quality) of the food. This fact is justified on the basis of a low monthly income (average 350–550 EUR) in the mentioned districts. The assumption of purchasing a regional product relies on the fact that the respondent identifies the brand and the composition and considers the price in all four districts (Rimavská Sobota, Rožňava, Revúca and Poltár). As we have seen, the negative responses were reflected in the product composition assessment. This indicates that there are still consumers who prefer the price over the composition (quality) of the product. In these districts, this fact is justified by the low monthly income (Figure 2).
The evaluation of the obtained results, with regard to the district of the respondents, showed that in the Rimavska Sobota and Rožňava regions, the vast majority of consumers buy regional foods. On the contrary, the Poltár Region has the lowest knowledge and purchase of regional brands. This result reflects the concentration of economically active consumers with higher monthly incomes in the industrially developed regions of the region (Rimavská Sobota). The local inhabitants of behind-the-border regions (Poltár) should pay attention to domestic products to support local capital formation and local development. There was also a significant number of negative responses in Poltár, which shows lower knowledge and purchase of regional brands. This result was not good because in Poltár there is no developed industry (the glassworks and the brick factory were no longer in business). The built-up road infrastructure in Poltár is also weak. Residents should pay attention to domestic products to encourage local capital formation and local development.
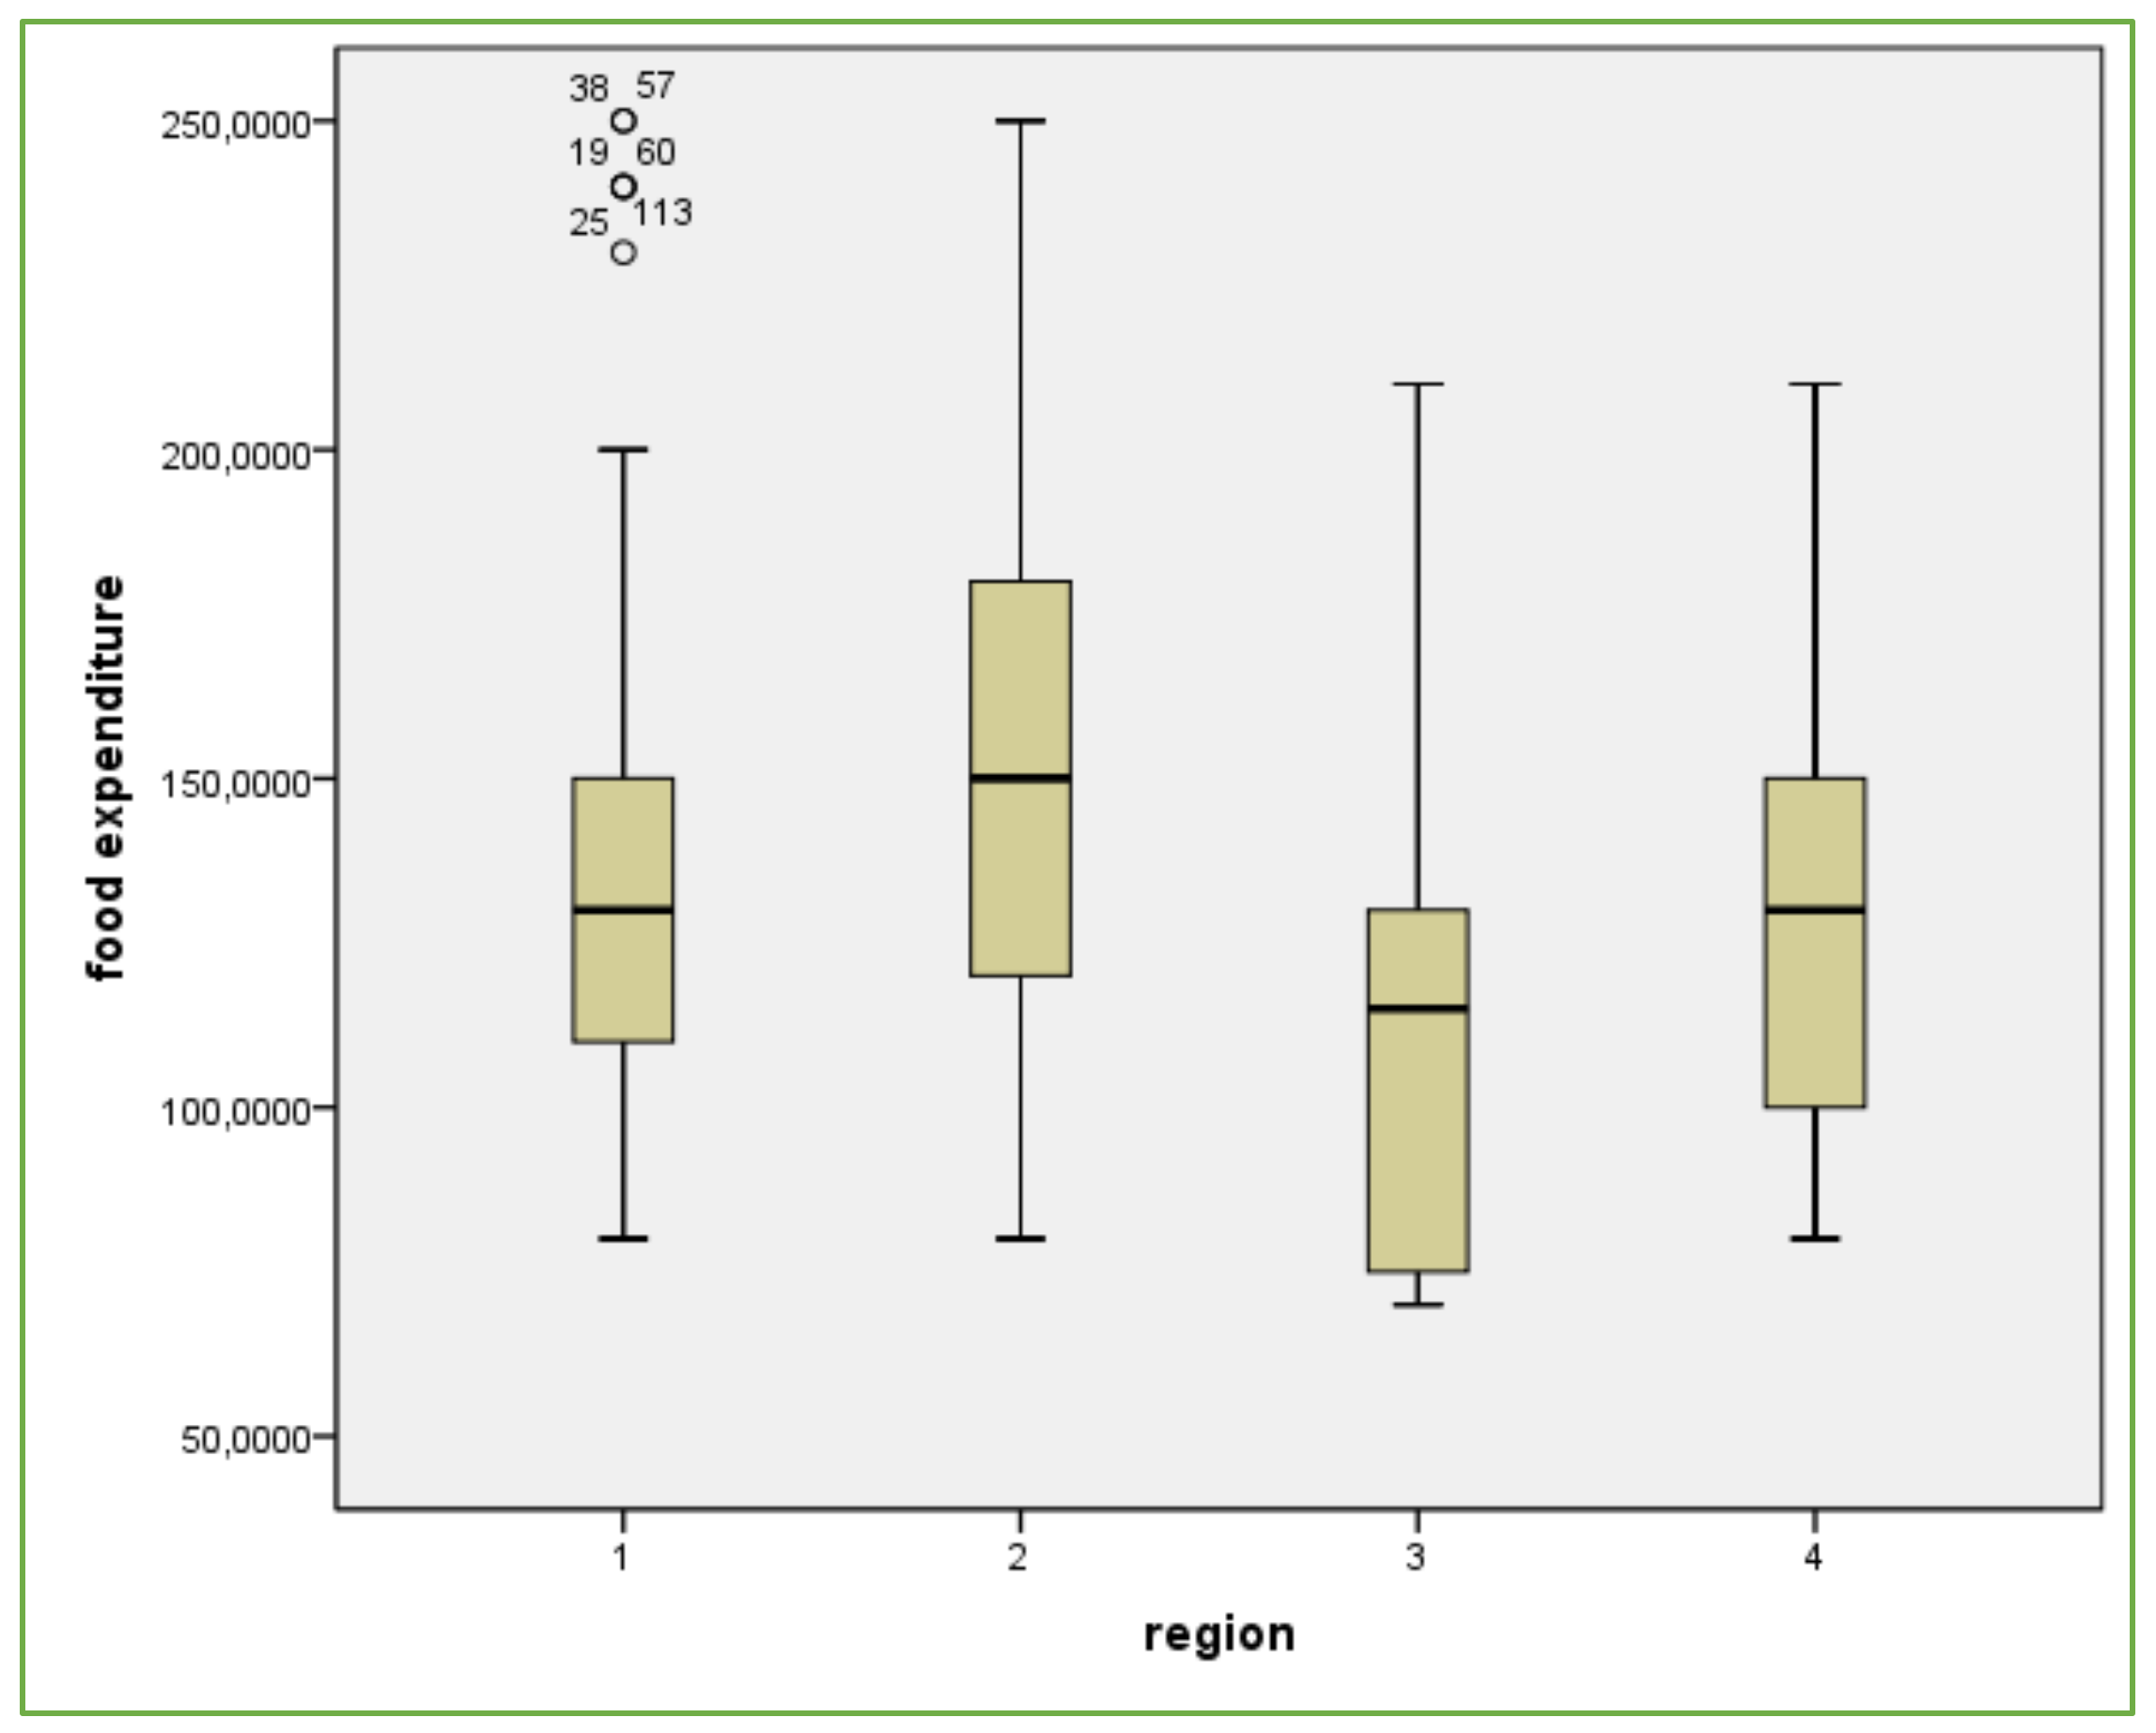
We also monitored regional food expenditure in our research into consumer behaviour. According to OECD data from 2017, the Slovak Republic spent € 7073.359 million on food, which is an increase of 15% compared to 2008. Food expenditure in the Gemer-Malohont region accounts for 21.6% of all household expenditure in the Slovak Republic. In connection with the Gemer-Malohont regional brand, we focused on the spending on regional food. The average value was about 139 EUR. The minimum cost of food expenditure in the Gemer-Malohont region was 70 EUR and the maximum was 250 EUR. The range of values was 180 EUR. Through the presented values we observed the significant differences across the Gemer-Malohont region.
We have displayed regional food expenditure by region (Figure 3) in the form of box-plots. In our case, we can state that the regional food expenditure is evenly distributed in Rimavská Sobota and Rožňava. The Rožňava region represents the region where consumer spending is spread over the widest range of values (from EUR 75 to EUR 250). The Rimavská Sobota region is the only region with extremely remote consumers whose regional food expenditure is higher. A significant concentration of consumers with lower food expenditure than the average is in the Poltár region. The Revúca region also shows an uneven distribution of regional food expenditure, which is concentrated at the bottom of the values.
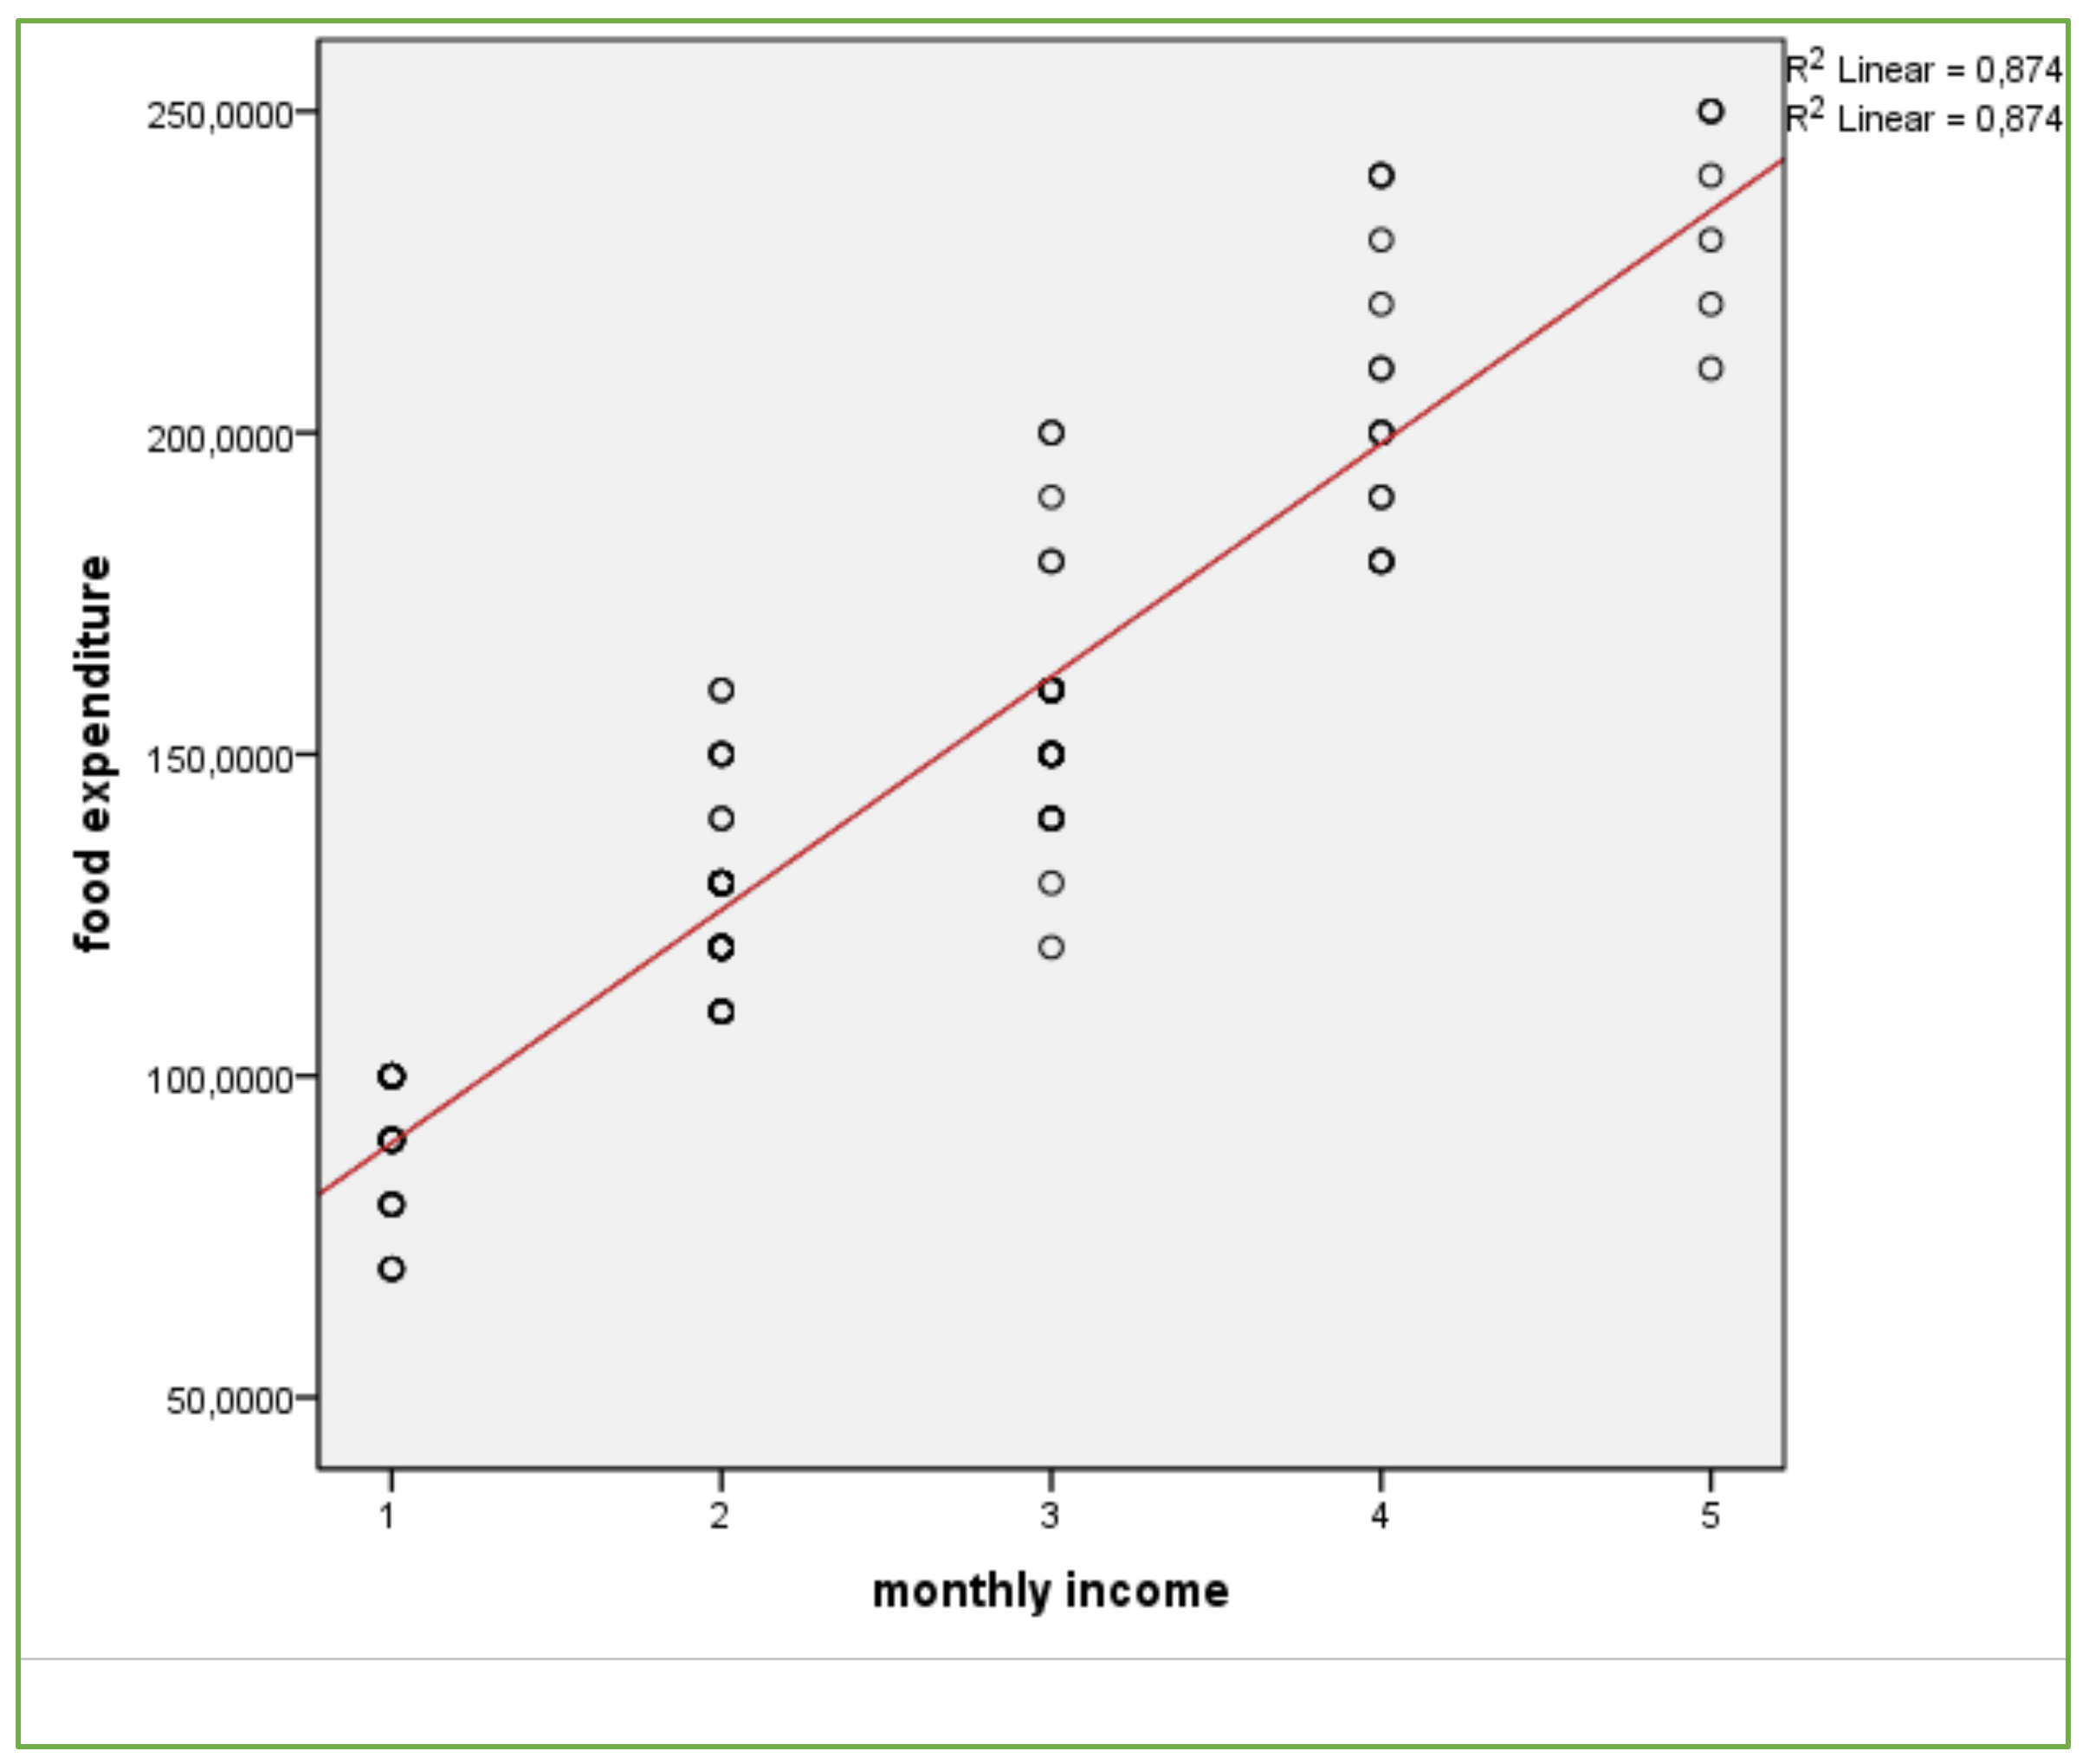
The box-plot dependence between the regional food expenditure and monthly income of respondents (Figure 4) is a linear dependence. It can be stated that the food expenditure increases with the increase of monthly income. We observed (Table 6) the strong dependence between monthly income and regional food expenditure (R = 0.935). The selected regression line explains the variability to 87% (R Square = 0.874). Based on the output ANOVA, we can state that the selected linear regression model was correct (Significance F = 0.000). Regional products have a higher price thanks to the quality. It is possible to assume that the quantity of food does not change but respondents are buying quality regional foods.
4. Conclusions
Environmental labelling is a concept that is applicable worldwide that has become part of the strategies as well as the policy of environmental protection, permanently sustainable development and social responsibility. Product labelling not only serves to set standards of product quality, it also has a direct influence on consumers and their buying behaviour, especially by informing them about whether a product reaches a certain level of product quality.
Food production forms the basis for the existence of our civilization. The tools used by man to sustain his existence affect the environmental conditions that determine the production capacity and diversity of natural resources. The economic development of rural areas guarantees the professional stability of their inhabitants and determines environmental protection. This aim may be achieved through the production of regional food [7,55].
The regional food market in Slovakia depends on multiple factors, including distribution channels, price levels, growth in company revenue and their knowledge of regional food. We can buy these products directly from the producer or at regional markets or regional events. Regional food is still poorly represented in supermarkets.
The results of the research show the consumers behaviour of a selected sample of consumers from the territory of Slovakia and their preference for regional foods. On the basis of the analyses carried out, we can state that the Gemer-Malohont region shows a clustering of consumers depending on the development of the territory. We have shown that the more developed regions (Rimavská Sobota and Rožňava) show a higher rate of purchase of regional foods. The rest of the regions (Poltár and Revúca) are represented by lower-income consumers for whom the food price is the decisive criterion. The surveyed region of Gemer-Malohont falls into an area with a larger share of small farmers on the market and a more favourable climate, which is a prerequisite for the development of regional brands.
The authors of the study are aware of some limitations. Firstly, the analysis was carried out only using the example of one regional brand in one European country and should therefore be replicated with a sample of other brands to provide more evidence. It is also wise to monitor and compare countries that differ in the cultural, economic and climatic environment. Secondly, we only looked at basic consumer characteristics. The innovation of the paper is the presentation of one of the least developed regions of the Slovak Republic and the demonstration of the potential of its regional development. In further research, it would be possible to examine psychological aspects of the consumers and their impact on the purchase of regional foods.
Acknowledgments
We received the funds KEGA 030UMB-4/2017 from the “Educational Centre for Integrated Safety” to cover the costs to publish in open access and VEGA 1/0651/17 from “Drafting the Innovative Synergetic Corporate Social Responsibility Model as a Perspective the Implementation of Responsible Entrepreneurschip in Small and Medium Enterprises”.
Author Contributions
Jana Jaďuďová and Jana Hroncová Vicianová conceived and designed the questionnaire; performed the experiments; analysed the data; Iveta Marková studies about ecolabelling problems with contents sustainability and wrote the paper; Emília Hroncová contributed analysis of statistical tools.
Conflicts of Interest
“The founding sponsors had no role in the design of the study; in the collection, analyses, or interpretation of data; in the writing of the manuscript, and in the decision to publish the results”.
References
- Gaviglio, A.; Bertocchi, M.; Demartini, E.A. Tool for the Sustainability Assessment of Farms: Selection, Adaptation and Use of Indicators for an Italian Case Study. Resources 2017, 6, 60. [Google Scholar] [CrossRef]
- Velčovská, Š.; Sadílek, T. Comparison of European Union quality labels utilization in Visegrad Group countries. J. Cent. Eur. Agric. 2014, 15, 179–197. [Google Scholar] [CrossRef]
- Syaekhoni, M.A.; Alfian, G.; Kwon, Y.S. Customer Purchasing Behavior Analysis as Alternatives for Supporting In-Store Green Marketing Decision-Making. Sustainability 2017, 9, 1–22. [Google Scholar] [CrossRef]
- Jaďuďová, J.; Kanianska, R.; Marková, I. Regional branding products in Slovakia in the intentions of green economy. Bus. Rev. 2016, 25, 9–17. [Google Scholar]
- Murin, I.; Marková, I.; Zelený, J.; Jaďuďová, J. Green Marketing as a Tool Influencing Consumerś Behavior: Slovak Case Study of Regional Mark Preference. Procedia Econ. Financ. 2015, 34, 260–267. [Google Scholar] [CrossRef]
- Gajarská, E. European national environmental label the environmental dimension of business. Enviromagazin 2014, 19, 32. (In Slovak) [Google Scholar]
- Bryla, P. The development of organic food market as an element of sustainable development concept implementation. Problem. Ekorozw. Probl. Sustain. Dev. 2015, 10, 79–88. [Google Scholar]
- Čadilová, K. Úvod. Regionální Značení Napříč Evropou; Asociace Regionálnich Značek o.s.: Litomyšl, Czech Republic, 2011; pp. 8–12. ISBN 978-80-254-9506-3. (In Slovak) [Google Scholar]
- Hrubalová, L. Regional Products in Tourism Offer of Slovak Republic and Czech Republic; Current Issues of Tourism, Development-Changes-Perspectives; College of Polytechnics Jihlava: Jihlava, Czech Republic, 2015; pp. 104–116. ISBN 978-80-88064-09-1. (In Slovak) [Google Scholar]
- Uchiyama, Y.; Tanaka, Y.; Matuoka, H.; Kohsaka, R. Expectations of residents and tourists of agriculture-related certification systems: Analysis of public perceptions. J. Ethn. Foods 2017, 4, 110–117. [Google Scholar] [CrossRef]
- Goliaš, P. Regional Differences in the SR—Overview of Important Statistics. Institute for Economic and Social Reforms. Available online: www.ineko.sk/file_download/1119 (accessed on 12 October 2017). (In Slovak).
- Law on the Promotion of the Least Developed Districts; Act No. 336/2015 Coll; 2015. (In Slovak)
- Bryla, P. The role of appeals to tradition in origin food marketing a survey among Polish consumers. Appetite 2015, 91, 302–310. [Google Scholar] [CrossRef] [PubMed]
- Miklenčičová, R. Perception of environmental product labelling by Slovak consumers. Procedia Econ. Financ. 2015, 34, 644–648. [Google Scholar] [CrossRef]
- Clancz, G.; Fröling, M.; Peters, G. Ecolabels as drivers of clothing design. J. Clean. Prod. 2015, 99, 345–353. [Google Scholar] [CrossRef]
- Ecolabel Index. 2017. Available online: http://www.ecolabelindex.com/ecolabels/ (accessed on 13 October 2017).
- Buckley, R. Tourism ecolabels. Ann. Tour. Res. 2002, 29, 183–208. [Google Scholar] [CrossRef]
- Fracois-Lecompte, A.; Bertrandias, L.; Bernard, Y. The environmental labelling rollout of consumer goods by public authorities: Analysis of and lesens learned from the french case. J. Clean. Prod. 2017, 161, 688–697. [Google Scholar] [CrossRef]
- Baumeister, S.; Onkila, T. An eco-label for the airline industry. J. Clean. Prod. 2017, 142, 1368–1376. [Google Scholar] [CrossRef]
- Noblet, C.; Teisl, M.; Rubin, J. Factors affecting consumer assessment of ecolabeled vehicles. Transp. Res. Part D 2006, 11, 422–431. [Google Scholar] [CrossRef]
- Sammer, K.; Wüstenhagen, R. The influence of eco-labelling on consumer behavior e results of a discrete choice analysis for washing machines. Bus. Strategy Environ. 2006, 15, 185–199. [Google Scholar] [CrossRef]
- Loureiro, M.; Lotade, J. Do fair trade and eco-labels in coffee wake up the consumer conscience? Ecol. Econ. 2005, 53, 129–138. [Google Scholar] [CrossRef]
- Delmas, M.; Lessem, N. Eco-premium or eco-penalty? Eco-labels and quality in the organic wine market. Bus. Soc. 2017, 56, 318–356. [Google Scholar] [CrossRef]
- Leire, C.; Thidell, Å. Product-related environmental information to guide consumer purchases—Review and analysis of research on perceptions, understanding and use among Nordic consumers. J. Clean. Prod. 2005, 13, 1061–1070. [Google Scholar] [CrossRef]
- Rahbar, E.; Wahid, N. Investigation of green marketing tools’ effect on consumers’ purchase behavior. Bus. Strategy Ser. 2011, 12, 73–83. [Google Scholar] [CrossRef]
- van Amstel, M.; Driessen, P.; Glasbergen, P. Eco-labelling and information asymmetry: A comparison of five eco-labels in Netherlands. J. Clean. Prod. 2008, 16, 263–276. [Google Scholar] [CrossRef]
- Young, W.; Hwang, K.; McDonald, S.; Oates, C. Sustainable consumption: Green consumer behavior when purchasing products. Sustain. Dev. 2010, 18, 20–31. [Google Scholar] [CrossRef]
- Rex, E.; Baumann, H. Beyond ecolabels: What green marketing can learn from conventional marketing. J. Clean. Prod. 2007, 15, 567–576. [Google Scholar] [CrossRef]
- Peattie, K.; Crane, A. Green marketing: Legend, myth, farce of prophesy? Qual. Mark. Res. Int. J. 2005, 8, 357–370. [Google Scholar] [CrossRef]
- Kanianska, R.; Jaďuďová, J.; Marková, I. Green Economy, 1st ed.; Belianum Publisher of Matej Bel University: Banská Bystrica, Slovakia, 2017; p. 205. ISBN 978-80-557-1258-1. (In Slovak) [Google Scholar]
- Guerrero, L.; Guardia, M.D.; Xicola, J.; Verbeke, W.; Vanhonacker, F.; Zakowska-Biemans, S.; Sajdakowska, M.; Sulmont-Rossé, C.; Issanchou, S.; Contel, M.; et al. Consumer-driven definition of traditional food products and innovation in traditional foods. A Qualitative cross-cultural study. Appetite 2009, 52, 345–354. [Google Scholar] [CrossRef] [PubMed]
- Granvik, M.; Joosse, S.; Hunt, A.; Hallbe, I. Confusion and Misunderstanding—Interpretations and Definitions of Local Food. Sustainability 2017, 9, 1981. [Google Scholar] [CrossRef]
- Lutz, J.; Smetschka, B.; Grima, N. Farmer Cooperation as a Means for Creating local Food Systems—Potentials and Challenges. Sustainability 2017, 9, 925. [Google Scholar] [CrossRef]
- Štensová, A. Regional brand products in SLOVAKIA in the context of regional development and tourism. DETUROPE Cent. Eur. J. Reg. Dev. Tour. 2013, 5, 37–59. Available online: http://www.deturope.eu/img/upload/content_20811366.pdf (accessed on 19 March 2018).
- MASM (Local Group of Malohont). Regional products. 2015. Available online: http://www.malohont.sk/files/_noviny_05-2015b.pdf (accessed on 30 October 2017).
- Sarstedt, M.; Mooi, E. Concise Guide to Market Research: The Process, Data, and Methods Using IBM SPSS Statistics, 1st ed.; Springer: Berlin, Germany, 2014; ISBN 978-3-642-53965-7. [Google Scholar]
- Kaščáková, A.; Nedelová, G. Statistical Methods for Social and Human Sciences; University of Matej Bel: Banská Bystrica, Slovakia, 2010. [Google Scholar]
- Potter, K. Methods for presenting statistical information: The box plot. Vis. Large Unstruct. Data Sets 2006, 4, 97–106. [Google Scholar]
- Hilbert, H.; Michal, P.; Bebej, J.; Lieskovská, Z.; Paluchová, K. The central of Slovakia (Hont, Novohrad, Gemer). Životné Prostredie 1998, 32, 34–39. (In Slovak) [Google Scholar]
- Schumacher, I. Ecolabelling consumers´preferences and taxation. Ecol. Econ. 2010, 69, 2202–2212. [Google Scholar] [CrossRef]
- Chalupová, M.; Prokop, M.; Rojík, S. Regional food preference and awareness of regional labels in Vysočina region (Czech Republic). Eur. Countrys. 2016, 8, 109–122. [Google Scholar] [CrossRef]
- Diamantopoulos, A.; Schlegelmilch, B.B.; Sinkovics, R.R.; Bohlen, G.M. Can socio-demographics still play a role in profiling green consumers? A review of the evidence and an empirical investigation. J. Bus. Res. 2003, 56, 465–480. [Google Scholar] [CrossRef]
- Peattie, K. Golden goose or wild goose? The hunt for the green consumer. Bus. Strategy Environ. 2001, 10, 187–199. [Google Scholar] [CrossRef]
- Velčovská, Š. Food Quality Labels and their Perception by Consumers in the Czech Republic. World Acad. Sci. Eng. Technol. 2012, 66, 154–160. [Google Scholar]
- Schupp, A.; Gillespie, J. Consumer Attitudes toward Potential Country-of-Origin Labelling Fresh or Frozen Beef. J. Food Distrib. Res. 2001, 32/3, 34–44. [Google Scholar]
- Gracia, A.; de-Magistris, T. Consumer preferences for food labelling: What ranks first? Food Control 2016, 61, 39–46. [Google Scholar] [CrossRef]
- Ilbánez-Forés, V.; Pacheco-Blanco, B.; Capuz-Rizo, S.F.; Boveda, M.D. Environmental product declarations: Exploring their evolution and the factors affecting their Damand in Europe. J. Clean. Prod. 2016, 116, 157–169. [Google Scholar] [CrossRef]
- Abe, K.; Higashida, K.; Ishikawa, J. Eco-Labelling Environment, and International Trade; Issues and Options for U.S.-Japan trade Policies; Stern, R.M., Ed.; University of Michigan Press: Ann Abor, MI, USA, 2000; pp. 227–248. [Google Scholar]
- European Commission. Flash Eurobarometer 367 Survey on the Attitudes of Europeans towards Building the Single Market for Green Products. 2013. Available online: https://data.europa.eu/euodp/data/dataset/S1048_367 (accessed on 1 November 2017).
- Fernández-Ferrín, P.; Calvo-Turrientes, A.; Bande, B.; Artaraz-Miňón, M.; Galán-Ladero, M.M. The valuation and purchase of food products that combine locala, regional and traditional features: The influence of consumer ethonocentrism. Food Qual. Preference 2018, 64, 138–147. [Google Scholar] [CrossRef]
- Zenetti, G.; Klapper, D. Advertising effects under consumer heterogeneity—The moderating role of brand experience, advertising recall and attitude. J. Retail. 2016, 92, 352–372. [Google Scholar] [CrossRef]
- Frison, S.; Dekimpe, M.G.; Croux, CH.; De Maeyer, P. Billboard and cinema advertising: Missed opportunity or spoiled arms? Int. J. Res. Mark. 2014, 31, 425–433. [Google Scholar] [CrossRef]
- Srinivasan, A.K.; Blomquist, G.C. Ecolabel paper towels: Consumer valuation and expenditure analysis. J. Environ. Manag. 2009, 90, 314–320. [Google Scholar] [CrossRef] [PubMed]
- Berg, N.; Preston, K.L. Willingness to pay for local foods?: Consumer preferences and shopping behavior at Otago farmers market. Transp. Res. Part A 2017, 103, 343–361. [Google Scholar] [CrossRef]
- Bryła, P. The perception of EU quality signs for origin and organic food products among Polish consumers. Qual. Assur. Saf. Crops Foods 2017, 9, 345–355. [Google Scholar] [CrossRef]
Figure 1.
Forms of information about regional products, expressed in %.

Figure 2.
Radar charts comparing the aggregate values of the ranges of regional tag data. Legend: (a) data summary according to the answers “yes, no, do not know”; (b) summary of responses by district.
Figure 2.
Radar charts comparing the aggregate values of the ranges of regional tag data. Legend: (a) data summary according to the answers “yes, no, do not know”; (b) summary of responses by district.

Figure 3.
Box-plots of regional food expenditure by region, expressed in EUR. Legend: region is in 1—Rimavská Sobota, 2—Rožňava, 3—Poltár, 4—Revúca.
Figure 3.
Box-plots of regional food expenditure by region, expressed in EUR. Legend: region is in 1—Rimavská Sobota, 2—Rožňava, 3—Poltár, 4—Revúca.

Figure 4.
Dependency of regional food expenditure and monthly income of respondents. Legend: monthly income is in 1—do 350 EUR, 2—351-550 EUR, 3—551-750 EUR, 4—751-950 EUR, 5—and 950 EUR.
Figure 4.
Dependency of regional food expenditure and monthly income of respondents. Legend: monthly income is in 1—do 350 EUR, 2—351-550 EUR, 3—551-750 EUR, 4—751-950 EUR, 5—and 950 EUR.


Table 1.
Socio-demographic characteristics of the respondents.
| Gender | Region | |||||||
|---|---|---|---|---|---|---|---|---|
| Male | Female | Rimavská Sobota | Rožňava | Poltár | Revúca | Total | ||
| Basic sample | Abs. frequency | 80,465 | 85,999 | 66,594 | 49,922 | 18,272 | 31,676 | 166,464 |
| Rel. frequency (%) | 48.3 | 51.7 | 40 | 30 | 11 | 19 | 100 | |
| Selected sample | Abs. frequency | 69 | 81 | 57 | 43 | 18 | 32 | 150 |
| Rel. frequency (%) | 46 | 54 | 38 | 28.7 | 12 | 21.3 | 100 | |
Table 2.
Socio-demographic characteristics of the respondents.
| Characteristics | Region Sample (%) | Selected Sample (%) | ||||||
|---|---|---|---|---|---|---|---|---|
| Rimavská Sobota | Rožňava | Poltár | Revúca | Rimavská Sobota | Rožňava | Poltár | Revúca | |
| Age | ||||||||
| 18–25 | 15.3 | 14.6 | 21.3 | 15.1 | 11.7 | 21.7 | 18.8 | 24.1 |
| 26–61 | 66.0 | 66.7 | 65.3 | 66.1 | 81.5 | 69.6 | 50.0 | 62.1 |
| 62 and more | 18.7 | 18.7 | 13.4 | 18.8 | 6.8 | 8.7 | 31.2 | 13.8 |
| Education | ||||||||
| Primary | 28.8 | 29.3 | 23.2 | 29.2 | 25.1 | 26.4 | 29.3 | 23.5 |
| Secondary | 59.5 | 57.8 | 64.7 | 61.2 | 55.2 | 56.3 | 61.2 | 62.1 |
| University 1st and 2nd degree | 11.2 | 12.4 | 11.8 | 9.2 | 19.0 | 17.0 | 9.2 | 14.0 |
| University 3rd degree | 0.5 | 0.5 | 0.3 | 0.4 | 0.7 | 0.3 | 0.3 | 0.4 |
| Family status | ||||||||
| Unmarried | 55.0 | 55.3 | 47.3 | 53.0 | 49.2 | 50.0 | 43.8 | 62.1 |
| Married | 45.0 | 44.7 | 52.7 | 47.0 | 50.8 | 50.0 | 56.2 | 37.9 |
| Employment | ||||||||
| Employed | 38.1 | 40.6 | 40.4 | 37.6 | 71.2 | 60.9 | 18.8 | 44.8 |
| Unemployed | 22.5 | 19.5 | 17.2 | 24.6 | 3.4 | 4.3 | 31.2 | 17.4 |
| Retired | 24.6 | 24.5 | 29.6 | 24.8 | 6.7 | 10.9 | 31.2 | 10.3 |
| On maternity leave | 6.1 | 7.1 | 7.3 | 6.6 | 6.8 | 4.3 | 0.0 | 3.4 |
| Student | 2.8 | 2.7 | 2.8 | 2.9 | 11.9 | 19.6 | 18.8 | 24.1 |
| Not identified | 5.9 | 5.6 | 2.7 | 3.5 | 0.0 | 0.0 | 0.0 | 0.0 |
Source: own research and calculations on the basis of the database DATA.cube from the statistical office of the Slovak Republic, 2018).
Table 3.
Label results for the clusters.
| Cluster 1 | Cluster 2 | |
|---|---|---|
| Relative share of cluster | 57.7% | 42.3% |
| Regional labelling in shops | 52.9% b | 60.0% b |
| Regional labelling public event | 91.1% a | 64.1% a |
| Knowledge of regional labelling | 100% a | 63.6% a |
| Product price | 61.7% a | 75.0% a |
| Buying a specific product | 58.3% a | 65.9% b |
| Repeat purchase of regional labelling | 98.3% a | 84.1% a |
| Travel for the product | 60.0% b | 86.4% b |
Each letter (a, b) indicates an answer: a = yes, b = no. Data on prevailing answers are reported.
Table 4.
Cluster profile demographics and socio-economic characteristics.
| Cluster 1 (% Total) | Cluster 2 (% Total) | Chi-Square | p-Value | |
|---|---|---|---|---|
| Gender | 6.579 | 0.010 | ||
| Male | 18.3 | 24.0 | ||
| Female | 39.4 | 18.3 | ||
| Age | 7.193 | 0.027 | ||
| 18–25 | 4.8 | 6.7 | ||
| 26–61 | 51.0 | 28.8 | ||
| 62 and more | 1.9 | 6.7 | ||
| Education | 2.814 | 0.421 | ||
| Primary | 2.9 | 0.0 | ||
| Secondary | 29.8 | 26.0 | ||
| University 1st and 2nd degree | 23.1 | 15.4 | ||
| University 3rd degree | 1.9 | 1.0 | ||
| Employment | 8.141 | 0.087 | ||
| Employed | 3.8 | 6.7 | ||
| Unemployed | 43.3 | 23.1 | ||
| Retired | 3.8 | 5.8 | ||
| On maternity leave | 3.8 | 1.0 | ||
| Student | 2.9 | 5.8 | ||
| Monthly income | 4.428 | 0.351 | ||
| <350 EUR | 10.6 | 9.6 | ||
| 351–550 EUR | 23.1 | 12.5 | ||
| 551–750 EUR | 18.3 | 10.6 | ||
| 751–950 EUR | 3.8 | 7.7 | ||
| >950 EUR | 1.9 | 1.9 | ||
| Number of children | 4.245 | 0.374 | ||
| 0 | 20.2 | 11.5 | ||
| 1 | 12.5 | 5.8 | ||
| 2 | 20.2 | 16.3 | ||
| 3 | 3.8 | 6.7 | ||
| 4 | 1.0 | 1.9 | ||
| Locality | 0.667 | 0.414 | ||
| Urban | 26.9 | 16.3 | ||
| Rural | 30.8 | 26.0 | ||
| Region | 10.701 | 0.013 | ||
| Rimavská Sobota | 35.6 | 12.5 | ||
| Rožňava | 10.6 | 12.5 | ||
| Poltár | 4.8 | 6.7 | ||
| Revúca | 6.7 | 10.6 |
Table 5.
Cluster profile preference for buying food.
| Cluster 1 (% Total) | Cluster 2 (% Total) | Chi-Square | p-Value | |
|---|---|---|---|---|
| Regional labelling in shops | 0.419 | 0.517 | ||
| No | 30.4 | 25.4 | ||
| Yes | 27.3 | 16.9 | ||
| Regional labelling public event | 10.450 | 0.001 | ||
| No | 5.0 | 15.0 | ||
| Yes | 52.7 | 27.3 | ||
| Knowledge of regional labelling | 23.537 | 0.000 | ||
| No | 0.0 | 14.5 | ||
| Yes | 57.7 | 27.8 | ||
| Product price | 2.051 | 0.152 | ||
| No | 22.1 | 10.6 | ||
| Yes | 35.6 | 31.7 | ||
| Buying a specific product | 5.976 | 0.015 | ||
| No | 24.0 | 27.9 | ||
| Yes | 33.7 | 14.4 | ||
| Repeat purchase of regional labelling | 7.252 | 0.007 | ||
| No | 1.0 | 6.7 | ||
| Yes | 56.7 | 35.6 | ||
| Travel for the product | 8.596 | 0.003 | ||
| No | 34.6 | 36.5 | ||
| Yes | 23.1 | 5.8 | ||
| Frequency of purchase | 4.427 | 0.219 | ||
| 1 of week | 6.7 | 7.7 | ||
| 2 of week | 21.2 | 7.7 | ||
| 3 of week | 16.3 | 15.4 | ||
| 4 of week and more | 13.5 | 11.5 | ||
| Propagation of products | 19.177 | 0.004 | ||
| Newspaper | 1.9 | 3.8 | ||
| TV | 1.0 | 3.8 | ||
| Radio | 1.9 | 1.9 | ||
| Leaflets | 5.8 | 14.4 | ||
| Personal experience | 26.9 | 10.6 | ||
| Presentation | 13.5 | 2.9 | ||
| Internet | 6.7 |
Table 6.
Linear regression outputs.
| Model Summary | |||||||||
| Model | R | R Square | Adjusted R Square | Std. Error of the Estimate | Change Statistics | ||||
| R Sqaures Change | F Change | df1 | df2 | Sif. F Change | |||||
| 1 | 0.935 a | 0.874 | 0.873 | 15.1086871 | 0.874 | 1027.382 | 1 | 148 | 0.000 |
| ANOVA | |||||||||
| Model | Sum of Squares | df | Mean Square | F | Sig. | ||||
| 1 Regression | 234,523.014 | 1 | 234,523.014 | 1027.382 | 0.000 b | ||||
| Residual | 33,784.319 | 148 | 228.272 | ||||||
| Total | 268,307.333 | 149 | |||||||
| Coefficients | |||||||||
| Model | Unstandardized Coefficients | Standardized Coefficients | t | Sig. | 95.0% Confidence Interval for B | ||||
| B | Std. Error | Beta | Lower Bound | Upper Bound | |||||
| 1 (Constant) | 53.338 | 2.940 | 18.144 | 0.000 | 47.529 | 59.147 | |||
| Monthly income | 36.241 | 1.131 | 0.935 | 32.053 | 0.000 | 34.007 | 38.475 | ||
a = Predictors (Constant) monthly income; b = Predictors (Constant) monthly income.
© 2018 by the authors. Licensee MDPI, Basel, Switzerland. This article is an open access article distributed under the terms and conditions of the Creative Commons Attribution (CC BY) license (http://creativecommons.org/licenses/by/4.0/).
Share and Cite
MDPI and ACS Style
Jaďuďová, J.; Marková, I.; Hroncová, E.; Vicianová, J.H. An Assessment of Regional Sustainability through Quality Labels for Small Farmers’ Products: A Slovak Case Study. Sustainability 2018, 10, 1273. https://doi.org/10.3390/su10041273
AMA Style
Jaďuďová J, Marková I, Hroncová E, Vicianová JH. An Assessment of Regional Sustainability through Quality Labels for Small Farmers’ Products: A Slovak Case Study. Sustainability. 2018; 10(4):1273. https://doi.org/10.3390/su10041273
Chicago/Turabian StyleJaďuďová, Jana, Iveta Marková, Emília Hroncová, and Jana Hroncová Vicianová. 2018. "An Assessment of Regional Sustainability through Quality Labels for Small Farmers’ Products: A Slovak Case Study" Sustainability 10, no. 4: 1273. https://doi.org/10.3390/su10041273
Note that from the first issue of 2016, this journal uses article numbers instead of page numbers. See further details here.