Improving the Green Building Evaluation System in China Based on the DANP Method


1
School of Economics & Management, Xiamen University of Technology, Xiamen 361024, China
2
Department of Industrial Engineering and Management, National Taipei University of Technology, Taipei 10608, Taiwan
3
Department of Information and Finance Management, National Taipei University of Technology, Taipei 10608, Taiwan
*
Author to whom correspondence should be addressed.
Sustainability 2018, 10(4), 1173; https://doi.org/10.3390/su10041173
Submission received: 19 March 2018
/
Revised: 6 April 2018
/
Accepted: 9 April 2018
/
Published: 13 April 2018
(This article belongs to the Special Issue Sustainability in Construction Engineering)
Abstract
:Against the background of sustainable development, green building practices could be part of the strategy for solving environmental and energy problems in developing countries. The aim of this paper is to explore a system for the assessment of green buildings in China that provides the government and stakeholders with ways to improve their strategies for green building development. We apply a hybrid model, developed by integrating the Decision-Making Trial and Evaluation Laboratory and Analytical Network Process (called DANP) method, to build an influential network relationship map (INRM) between assessment systems and to derive the criterion weights. The INRM and derived weights can help us to understand this complex assessment system and to set improvement priorities for green building development. The results demonstrate that indoor environment, materials, and smart facilities are the top three critical factors for green building evaluation. Finally, we discuss some management implications based on an actual case study with solutions provided using this model.
1. Introduction
In today’s world, there is a need to construct a large number of buildings in response to rapid urbanization, to truly improve the economic strength of a developing country. However, this building boom can contribute to the problems of climate change, global warming and environmental pollution to some extent. More than one third of total worldwide greenhouse gas emissions and energy exhaust are related to buildings [1]. At the same time, a sixth of the world’s freshwater usage, 40% of the raw materials and one fourth of wood harvested, are consumed by the construction industry [2,3]. Buildings are not only responsible for economic but also sustainable environmental development. In addition to construction, during the life cycle of the buildings, energy and water consumption, technological innovations and garbage disposal, are all related to environmental performance and these factors affect human health and sustainability. In other words, the construction of green buildings has become a multi-dimensional issue that can be viewed from multiple perspectives [4]. This makes the building of a suitable evaluation system for green building construction and operations, and how to find the factors that effect the implementation of green building assessment, a difficult but significant subject of study.
Numerous different levels of certification systems have been founded for green building evaluation, owing to different situations in different countries and regions. The primary green building assessment tools used around the world include the Leadership in Energy and Environmental Design (LEED) guidelines developed in the USA, the Building Research Establishment Environmental Assessment Method (BREEAM) of the UK, and the Green Building Labeling Assessment Standard for Green Buildings (CGBL) in China [1,5,6]. Currently, China is the largest construction market, with up to 2 billion square meters of annual construction and predicted to account for about 50% of new construction globally in the coming decade, it is the largest contributor of CO2 emissions in the world. Although the popularity of green buildings has grown in China, they only make up about 4% of the buildings in the world’s largest construction market. Furthermore, low levels of management and a lack of transparency during the design, construction and operation of the buildings make it difficult to truly implement a green building practice. With the government’s “One Belt, One Road” policy and continued urbanization, there will be more opportunities for China to accelerate its infrastructure construction. As a result of these factors and an increasing environmental awareness in China, a rational and effective building evaluation system needs to be constructed and utilized.
Many researchers have improved upon the existing rating tools and evaluation systems for green building performance assessment. For example, Balaban and Puppim de Oliveira [7] argued that a co-benefits approach could address energy and CO2 reduction. Their results demonstrate that green buildings could obtain a significant level of effectiveness in terms of energy and CO2 reduction, and improve health conditions for building users. Wong and Abe [8] noted that, although the Comprehensive Assessment System for Built Environment Efficiency (CASBEE) developed in Japan has been in use since 2002, it lacks a reward system to promote the adoption of the CASBEE guidelines. Based on the situation in Oman, Al-Jebouri et al. [4] developed a framework for green building construction and proposed an evaluation system for the construction industry. Dwaikat and Ali [9] proposed an earned value method to monitor a green building’s energy life cycle cost. Kang [10] produced a systematic model for green building assessment standards by using the Environmental Impact Assessment (EIA) framework. In his survey of 104 expert opinions he found that energy cost, environmental problems, water withdrawal, health, and company reputation to be the five drivers for operating Green Building (GB) technologies [11]. However, there appears to be a void in the literature on how to develop and improve a valid green building assessment tool within a developing country or area by applying a systemic decision model. For example, how to systematically determine the most important factors, such as operation management, material quality, indoor environment quality, and energy efficiency in green building performance evaluation and how to identify the relationship between these factors is currently lacking in most rating systems. Thus these factors fail to be implemented by construction departments and governments. Therefore, the existing system needs to be checked and improved upon by underlining green building related management and technology innovation [12].
The development of the Chinese national green building system construction is relativity young. For the evaluation and implementation of sustainable green building practices, China built a national 3-star Green Building rating system in 2006 by learning from the international rating systems, such as LEED and BREEAM. However, Ye et al. [6] argued that there have been about 17 national level and about 50 or more provincial level green building assessment standards practiced in China. However, a lack of understanding of green building incentive imbalances is the main reason for the slowdown in green building construction. Builders usually project long-term savings based on short-term costs, such as materials and labor costs, rather than energy efficiency or green building technologies. The increasing urbanization in China and growing awareness of environmental protection issues has encouraged the government to give priority to infrastructure development. Finding the factors of influence for a green building system may provide the answer as to how to promote the development of green buildings in China. However, few studies have focused on this topic.
This paper seeks to fill this gap in the research by proposing a causal relationship framework for improving green building assessment capabilities. This study proposes a hybrid Multiple Criteria Decision Making (MCDM) model that combines Decision-Making Trial and Evaluation Laboratory (DEEMATEL) and the Analytical Network Process (DANP) methods to construct interdependent connections among the assessment dimension and criteria [13,14,15,16]. Based on graph theory, the DEMATEL technology is a powerful tool to use the knowledge of experienced experts to arrange the structural model of a system [17]. The effect on each category and criterion is confirmed, making such complex systems easy to understand [18]. The derived influential network relationship map (INRM) can help decision makers understand the complex relationships in green building systems. The DANP method, based on the results of DEMATEL, can then be used to calculate the weights of the green building assessment criteria. The strength of the suggested model is that it can be used to build an orderly plan of complex systems, showing the cause-and-effect relationships and obtaining the influence weights of factors within a green building system. Consequently, differing from existing studies focusing on green building evaluation, this paper contributes to the literature by trying to construct a cause-and-effect system for green building assessment and environmental management that can not only assist construction companies and governments to identify the key factors for Green Buildings, but also provide direction for improvement.
The rest of this study is organized as follows. Section 2 gives a brief review of the relevant literature. Section 3 describes the DANP method used to build the INRM and find the weights of the criteria. The green building weighting system is introduced in Section 4. The results are discussed in Section 5, and some concluding remarks are presented in Section 6.
2. Literature Review
A review of the literature on green or sustainable building evaluation systems indicate that a structural assessment model for the production and management of effective green building is lacking. Most of the research in the past has been limited to a discussion about green building certification tools and agreements to evaluate energy efficiency, environmental problems, materials and resources and economic topics in the building industry [19,20,21]. Several of the studies related to green building or sustainable building evaluation and management published over the last decade are discussed below. The Building Research Establishment Environmental Assessment Method (BREEAM) is considered the first green building rating assessment in the world. It was created by the UK [22,23]. The Leadership in Energy and Environmental Design (LEED), China Green Building Labeling (CGBL), Comprehensive Assessment System for Built Environment efficiency (CASBEE) and other main systems were developed based on BREEAM. However, it is difficult to judge which evaluation system has the most complete assessment criteria for the certification of green buildings in a specific area. Some have compared green building rating tools in different areas and countries, including Shad et al. [1] who compared BREEAM, LEED, Green Star of Australia, CASBEE of Japan and proposed a new system for Iranian green building evaluation. Ali and Al Nsairat [5] discussed a green building rating system for residential buildings in Jordan based on a comparison of BREEAM, LEED, and the GB Tool.
Several academics [6,24,25,26] have proposed some suggestions regarding the development of a Chinese green building evaluation system and standards, but we found no research aimed at finding the relationship between the factors of the green building rating systems. Ye et al. [6] suggested an evaluation system for green building practices by proposing a three layer basis for general and specialized standards. Guo et al. [24] discussed the enforcement of civil building efficiency codes for the monitoring of energy consumption in China. Their results indicated an obvious increase in energy saving. Hong et al. [25] updated the design standards for energy efficiency in public buildings and compared the GB 50189-2014 standards for Chinese public buildings with USA standards. Yu et al. [26] proposed a rating method for green store buildings in China. They considered eight dimensions, landscape, energy efficiency, water efficiency, material and resources, indoor environment, construction management, and operation management, proposing 23 criteria for assessing green store buildings. The expert group decision analysis hierarchy process (AHP) method was used for deriving the relative importance of the dimensions.
Furthermore, Si et al. [27] also applied the AHP method for the selection of green technologies for assessing buildings. Their results indicated that social criteria, including occupant satisfaction, should be considered as part of the list. By studying LEED, BREEAM and other main international green building assessment tools, Ali and Al Nsairat [5] defined a new assessment system by considering the local context of Jordan, then used the AHP to weigh the importance of the criteria. Banani et al. [28] proposed a structure for sustainable non-residential building assessment for Saudi Arabia, and also applied the AHP method to weigh the proposed 36 criteria. Liu et al. [29] proposed a model of an evaluation system for green university assessment based on Fuzzy AHP (FAHP). The FAHP was also used to develop an expert system to assess green building performance considering such factors as environmental management, pollution, and energy management [30]. Sabaghi et al. [31] introduced a hybrid model combining FAHP with entropy to evaluate green products. With the exception of the AHP method, no other MCDM methods have been used for weighing the dimensions or criteria for a green building assessment system.
Although AHP is a widely used MCDM technology, it assumes the dimensions or criteria of the system to be independent with a unidirectional hierarchical relationship. However, the dimensions or criteria of an evaluation system are seldom independent in the real world. In contrast with previous studies that applied AHP to weight the green building rating system, this paper utilizes the DEMATEL-based ANP (DANP) method to explore the network relationship of green building criteria and the influential weights of the criteria in a complex evaluation system. This method can not only be used to build the network relationship of the evaluation system but also understand the cause-effect relationships between criteria for the construction of a better green building assessment system. The procedures are described in detail in the next section.
3. Methodology
In this section, we introduce the DANP model that combines DEMATEL with ANP to establish the interdependent structure and receive the weights of the dimensions and criteria. Government and the construction industry can figure out the complex relationship between green building management and the cause-effect within the criteria through the derived influenced network relationship map (INRM). The obtained weights of the criteria and the INRM can help governments and the construction industry to set improved priorities for bettering the green buildings in China. The detailed procedures are illustrated as follows [32,33,34,35,36,37,38].
3.1. DEMATEL Method
The DEMATEL method is used to establish the interrelationship between factors used to construct an INRM. The method is summarized as follows:
Step 1: Identify the direct relation average matrix M on a scale of 0–4 ranging from “no influence (0)” to “very high influential (4)”. Using the aforementioned scale, k respondents are asked to judge the extent of direct influence between two pairwise criteria, denoted by mij. Then, the direct relation average matrix M is acquired through the mean of the same criteria in the k matrices for the respondents. Matrix M is shown as Equation (1), where is n the number of criteria. Thus,
Step 2: Obtain the initial direct influence matrix , which is the multiplication of M and v.
Step 3: Calculate the total influence matrix T with Equation (4). The element tij indicates the indirect effects that criteria i has on criteria j. Thus,
where and I is an identity matrix.
Step 4: Derive each column sum (cj) and row sum (ri) from matrix T as follows:
The element cj in vector c denotes that the total effects received by criterion j received, from the other criteria. Similarly, ri represents the direct and indirect effects of factor i on the other criteria.
Step 5: Derive matrix TC based on the criteria and TD based on the dimensions. Matrix T could be differentiated into TC based on the criterion and TD based on the dimensions. Matrix TD is found by averaging the degree of criterion influence in each dimension.

Step 6: Get the INRM. Thus, ri + ci reflects the strength of the influences given and received on factor i, while ri − ci shows the net effect of factor i on the other factors. Clearly, if ri − ci is positive, factor i is a causal component, and if ri − ci is negative, then factor i is an affected component. As a result, the influence relationship map (INRM) can be finished by mapping the data set (ri + ci, ri − ci).
3.2. Obtain the ANP Weights Based on the DEMATEL Technique
The DEMATEL method is used to establish the interrelationship between factors used to construct an INRM. The method is summarized as follows. ANP is the method customarily used to construct an unweighted supermatrix for distributing the factor weights. In contrast to the AHP technique, the ANP considers the interdependency and relationship between factors or criteria. However, there are three main problems in the original ANP method. First, we have to assume the relationship structure of the evaluation system before using ANP. Second, it is difficult to understand the ANP questionnaire due to its complexity [39], the process of pairwise comparison is time-consuming and it is not easy to obtain consistent results. Third, the assumption that each cluster will have same equal weight seems irrational because of the different degrees of influence among the dimensions or clusters [16]. Luckily, these three shortcomings can be solved by using the DEMATEL-based ANP method. The degrees of influence of each dimension can be obtained by DEMATEL, then the ANP process can be applied to normalize the unweighted supermatrix. The details are as follows:
Step 7: Obtain the unweighted supermatrix. We get a matrix by normalizing TC.

For example, , which is a submatrix of TC can be normalized to , as follows:
![Sustainability 10 01173 i003]() where .
where .


The unweighted matrix supermatrix Wpq is transposed from matrix as follows:
As shown in Equation (11), Di denotes the ith dimension; cij denotes the jth criteria in the ith dimension.
Step 8: Derive the weighted supermatrix. Referring to step 5, we can get matrix TD by averaging the degree of the criterion influence in each dimension, which is derived by
where in is the number of criteria in dimension n; and jm is the number of criteria in the dimension m.
Then, we can obtain the weighted supermatrix by multiplying the unweighted supermatrix W with as follows:
Step 9: Calculate the DANP weights. Limit the weighted supermatrix by Equation (17) until the supermatrix has converged and become stable. The DANP weights can then be found by
4. Establishment of a Green Building Weighting System for China
We apply the proposed method that combines DEMATEL and ANP to determine the structure among the factors, and to survey the weights of each criterion and dimension. A city level green building assessment applied in Xiamen, which is located in southeastern China, is illustrated as an empirical example. Xiamen is a city with an external population of more than 65%, and many new buildings have been built in recent years. This city is famous for its good ecological environment and its higher requirements for green buildings. It can represent the average level of green building requirements in China.
4.1. Identification Dimensions and Criteria for Green Building Assessment
Many international rating systems share common indicators for the evaluation of building sustainability, including the quality of the indoor environment, energy and water efficiency, use of green material, innovativeness, site ecology and waste and pollution solutions [1,4,5,11,23,26,29,40,41,42]. Government, citizens and other stakeholders monitoring and participating in the operation management are also considered important factors for green building evaluation. Table 1 lists the main dimensions and criteria of the evaluation system described above.
First, we construct an evaluation system with 7 dimensions and 30 criteria that were obtained based from a review of the existing literature and international green building rating systems. To simplify some criteria and reflect the special characteristics of the Chinese environments, we designed a questionnaire and requested 10 experts to respond to the questions asked with linguistic variables, which ranged from very unimportant (0,0,1) to very important (9,10,10) (Table 2). Then, after discussion with the 10 experts, we extracted the essential criteria, as those having of a mean of 4.5 points or above and the results are displayed in Table 3. One dimension and 8 criteria were deleted after the initial survey.
4.2. DANP Method for Measuring the Relationship between Dimensions and Criteria
To measure the initial direct influence matrix, we designed a questionnaire with the aim of obtaining the degree of influence between any two indicators according to Table 3. During the survey, experts were asked to respond to a question by making pairwise comparisons of the degrees of influence between the criteria. As seen in Table A1 in Appendix, a 22 × 22 average initial direct influence matrix was obtained by averaging the experts’ questionnaire responses. The consistency gaps of the 10 questionnaires are 4.86%, which is smaller than 5%, and the confidence level is 95.14%, which is little more than 95%. Although the 10 experts cannot represent all relative stakeholders, the result shows a good consistency that can reflect parts of real situations.
The normalized directed-relation matrix can be obtained by Equations (2) and (3). After that, the total-influence matrix T (Table A2) is calculated by Equation (4). The total influence matrix of the dimensions can be calculated by averaging the influence matrix T within each dimension, as seen in Table A3. Table A4 reflects the sum of the influences given and received among criteria and dimensions and is obtained by implementing Equations (5) and (6) of step 4.
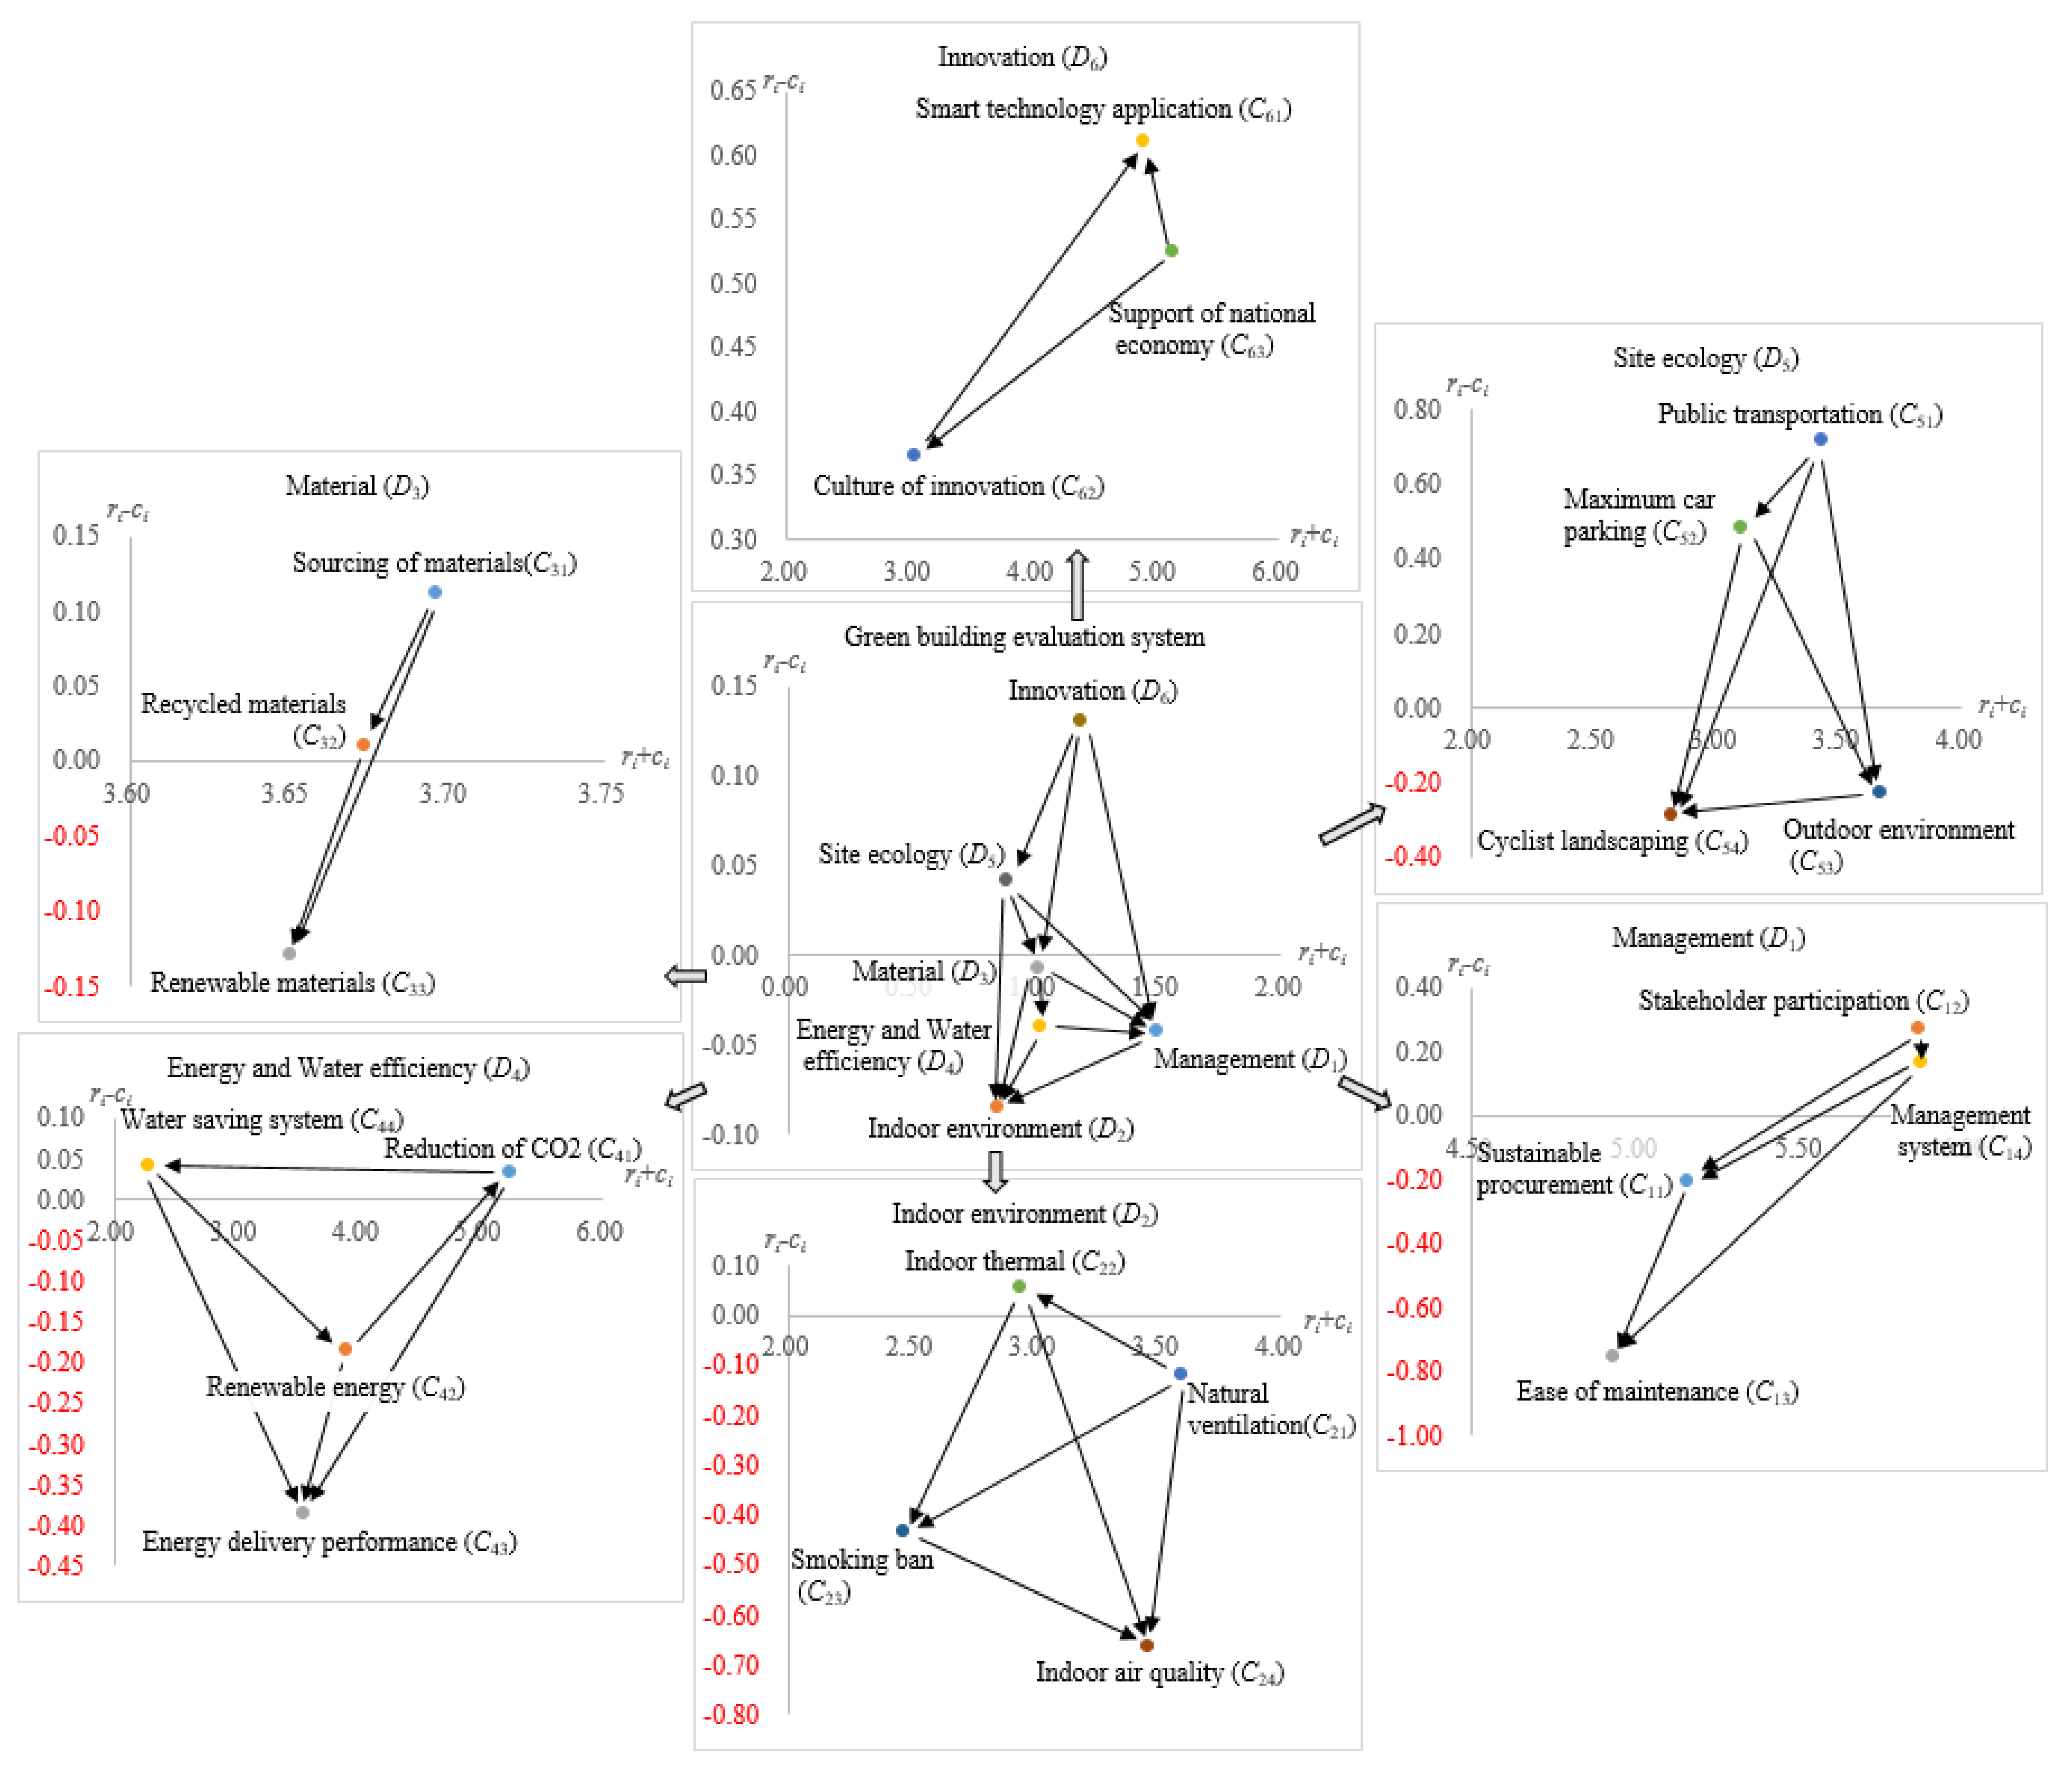
As we can see in Table A4, the largest (ri – ci) value (0.13) is for innovation (D6), so this is the most influential dimension. It means that innovation is the key to the development of a green building. Furthermore, innovation technology will have a deep influence on the other dimensions. In addition, management (D1) has the maximum value (ri + ci) (1.49), which means that it has the largest total influence degree within dimensions. As we know, green building operation, use of sustainable materials, improving energy efficiency, water saving, indoor environment and so on are also closely related to management in China. Therefore, management affects the other dimensions, like indoor environment, material, energy and water efficiency and site ecology, and it is also affected by innovation. The influence value, which is greater than the average of all criteria in the total influence matrix (0.09) is set as the threshold to determine the directions of influence between dimensions and criteria. As we can see in Figure 1, the influence network-relationship map (INRM) of the six dimensions and their subsystems can be plotted according to Table A2 and Table A4.
5. Discussion
While most studies applied AHP or ANP to investigate the indicators of green buildings, this study used DANP to derive the importance of indicators. DANP adopts the results of DEMATEL and concepts of ANP to calculate the weights of criteria. The influential degrees among criteria (Tc) and dimensions (TD) are obtained from DEMATEL, where we normalized Tc by considering the influential strength of each criterion within its dimension. Thus, the weighted supermatrix (step 12 in Section 3) takes into account the proportion of each criterion within its dimension and the degrees of influence between each dimension and other dimensions. As a result, we get the weight of the sub-factor first, then we obtain the weight of each dimension by summing the weights of criteria that belong to the same dimension. This process can avoid the time-consuming pairwise comparisons in the original ANP and obtain consistent results.
As illustrated in Figure 1, in dimension D1, stakeholder participation (C12) influences sustainable procurement (C11), ease of maintenance (C13) and management system (C14). This means that residents pursuing a greener environment, active governmental promotion of green building development, the development of green building materials and technology by engineers and participation by other stakeholders all have positive effects on green building sustainable development. In terms of the indoor environment (D2), the relationships between the four criteria are relatively weak, but natural ventilation (C21), indoor thermal environment (C22) and the banning of smoking (C23) all affect indoor air quality (C24). Indoor air quality is a very important criterion for green building assessment, being of the most concern to people and it is easily affected by the other elements. In the material dimension (D3), all three criteria influence each other. The sourcing of building materials is gradually getting more and more attention, with recycled and renewable materials becoming more and more attractive, a trend expected to continue into the future. Carbon dioxide emissions can be reduced by the use of renewable energy and an increase in energy transfer efficiency. Hence, experts consider renewable energy (C42) and energy delivery performance (C43) to have a strong influence on the reduction of CO2 (C41). With the increased use of private vehicles, the demand for parking spaces has become an urgent problem. With the increase in popularity of the sharing economy and the enhancement of green awareness, people also expect to have access to bicycle systems (C54) and public transportation (C51) near these buildings. In dimension D6, smart technology (C61), a culture of innovation (C62) and support of the national economy (C63) all affect each other.
The assessment system for a green building is mapped in Figure 1 with innovation (D6) on the top and management (D1) on the right. This means that D6 is the main factor that influences the other dimensions. At the same time, management is a complex factor, which affects the other dimension, and it is also affected by all other dimensions except for the indoor environment (D2). Thus, we must consider innovation and management seriously if we want to extend and develop green building assessment systems effectively in China. The results can also be plotted, as shown in Figure 2, where the innovation is a major cause and management is located in the center of the system. “Energy and water efficiency” and “indoor environment” are affected by the other dimensions. Furthermore, the influence weight can be calculated by the DANP method (Table 4). In Table 4, management (D1) and innovation (D6) are the two most significant dimensions, sharing an importance of 40.91% in the green building assessment system. This also exactly confirms the findings of the INRM.
From Table 4, management (D1) has the largest weight, followed by innovation (D6), indoor environment (D2), materials (D3), energy and water efficiency (D4) and site ecology. In terms of the criteria, supporting the national economy (C63) (6.74%), management system (C14) (6.18%), and application of smart technology (C61) (6.16%) are the three most significant criteria, followed by ease of maintenance (C13), stakeholder participation (C14), and sustainable procurement (C11). On the other hand, water saving systems (C44) (2.39%), maximum car parking (C52) (2.76%) and access to public transportation (C51) (2.89%) are the least important criteria in the system. These results verify the results of the DEMATEL analysis again where management (D1) and innovation (D6) are the top two priorities in the green building evaluation system, because the six most significant criteria are related to management and innovation.
Although management has the largest degree of total influence, its net influence value is negative, which means that the quality of the management is related to other dimensions, especially innovation (D6). Therefore, technical and cultural innovation, as well as the support of the national economy, are important for the improvement of management quality. Indoor environment (D2), materials (D3) and energy and water (D4) have almost the same weights, and they are affected by management and innovation. Although site ecology (D5) accounts for the smallest weight, we cannot ignore its contribution for the assessment system. The increasing popularity of the sharing economy in work and in daily life have a positive impact on green building.
6. Conclusions
Six dimensions and 22 criteria were selected based on the literature review and expert questionnaire responses were used to build a green building assessment system for China. These dimensions include management, indoor environment, materials, energy and water, site ecology and innovation. One should be conscious of the fact that these dimensions and criteria are quite similar to those of international tools such as BREEAM and LEED, but their priorities are somewhat different, due to consideration of the Chinese context.
Differing from previous studies, this paper applied a hybrid MCDM model to construct the green building assessment system. First, the DEMATEL method was used to find the complex relationship among dimensions and criteria. Then, the INRM was constructed as shown in Figure 1. The INRM can reflect the causal relationship among the dimensions and criteria. After that, the DEMATEL-based ANP method was applied to calculate the influence weights of the criteria.
The results indicate that management and innovation are the two most important factors for assessing green buildings practices in China, making up about 41% of the total evaluation weight. This includes the three highest weighted criteria, support of the national economy, management system and smart technology innovation, which represent 19% of the total assessment criteria weights. Unlike the results from past studies, the weights of energy and water resources, indoor environment and other indicators are not very high, but this does not mean that these indicators are not important. In fact, the weight distribution of the evaluation index system in this study is balanced, and the difference between the highest weight and the minimum is not very large, just 4.3%. This means that the development of green buildings in China is at a preliminary stage, and there is still a certain gap between developed countries and China. It is urgent to promote the development and popularization of green buildings through management and innovation.
This paper offers several contributions to the literature. First, most previous studies ignored the relationship between criteria. In this study, a hybrid model with DANP model was used to analyze the complex assessment system, and a clear map can be obtained showing the causal relationships among dimensions and criteria. The key dimensions and criteria are found to help the Chinese government and the construction industry to realize how to implement green buildings in China. Second, this hybrid model can reduce the complexity of the ANP method while taking into account the extent of the impact between dimensions and criteria.
There are some limitations on the application of the DANP model. We just interviewed 10 experts and got the data. Although the average gap-ratio in consistency is smaller than 5%, we cannot conclude that they can represent all stakeholders’ consensus. The experts’ opinions differ somewhat from each other owing to their different backgrounds. We used the fuzzy logic method to remedy this problem. Perhaps other methods, such as the Delphi or Grey relational analysis, can be used to solve this problem. The empirical data are limited to Xiamen city in China, so research findings may vary for other areas and countries. With regards to future research, some green building cases can be collected for performance evaluation by the application of TOPSIS and other models based on the DANP model in this paper. At the same time, the proposed model can also be used for handling similar decision making problems in other industries.
Acknowledgments
The authors are extremely grateful to Sustainability Journal editorial team’s valuable comments on improving the quality of this article. This research was supported by the Social Science Fund of Fujian Province under Grant FJ2016B101, China.
Author Contributions
Qi-Gan Shao analyzed the data, literature review, and article writing. James J. H. Liou and Sung-Shun Weng dealt with the research design, and article writing. Yen-Ching Chuang, completed the article writing and formatting. Finally, James J. H. Liou and Sung-Shun Weng revised the paper.
Conflicts of Interest
The authors declare no conflict of interest.
Appendix A. Results in Detail
This study applied the DANP model to build an influential network relationship map (INRM) between assessment systems and to derive the 22 criterion weights. As mentioned in Section 4, we collected 10 experts’ questionnaires and the results to measure the total influence matrix T. Table A1 shows the 22 × 22 average initial direct influence matrix that was obtained by averaging the experts’ questionnaire responses.
Table A2 shows the total influential relationship among 22 criteria. Table A3 illustrates the relationship among the six dimensions. Table A4 reflects the sum of influences received or given from the degree of the influence of each dimension and criterion within its dimension. The results indicate that innovation (D6) is the main cause in the green building assessment systems because it has largest net influence (ri – ci).
The weights of criteria were obtained from the DANP process. Table A5 illustrates the unweighted supermatrix, which was obtained by transposing the normalized influence matrix Tc based on Equations (8)–(12). The weighted supermatrix W based on Equations (13)–(16) is shown in Table A6.

Table A1.
Initial direct influence matrix.
| C11 | C12 | C13 | C14 | C21 | C22 | C23 | C24 | C31 | C32 | C33 | C41 | C42 | C43 | C44 | C51 | C52 | C53 | C54 | C61 | C62 | C63 | |
|---|---|---|---|---|---|---|---|---|---|---|---|---|---|---|---|---|---|---|---|---|---|---|
| C11 | 0.00 | 1.80 | 3.60 | 2.80 | 1.00 | 1.00 | 0.00 | 1.20 | 3.00 | 3.20 | 3.20 | 2.20 | 2.40 | 1.80 | 1.80 | 0.20 | 0.20 | 1.20 | 0.80 | 2.80 | 0.60 | 2.00 |
| C12 | 2.40 | 0.00 | 3.00 | 3.60 | 1.20 | 0.80 | 3.00 | 1.80 | 2.80 | 2.40 | 2.40 | 1.80 | 2.40 | 1.60 | 2.20 | 1.80 | 2.00 | 3.00 | 2.60 | 2.40 | 2.80 | 2.00 |
| C13 | 3.20 | 1.80 | 0.00 | 3.20 | 1.80 | 1.40 | 0.80 | 1.60 | 1.00 | 1.40 | 1.40 | 1.00 | 1.20 | 1.00 | 1.00 | 1.80 | 1.20 | 1.60 | 1.00 | 1.80 | 0.80 | 1.00 |
| C14 | 3.20 | 3.80 | 3.20 | 0.00 | 1.20 | 1.20 | 3.00 | 1.40 | 1.40 | 1.60 | 1.60 | 1.80 | 1.60 | 2.20 | 2.00 | 2.80 | 3.00 | 2.60 | 2.60 | 2.80 | 2.40 | 1.40 |
| C21 | 0.20 | 1.00 | 1.80 | 1.00 | 0.00 | 3.40 | 2.20 | 3.40 | 1.40 | 0.60 | 0.60 | 3.20 | 2.80 | 2.60 | 0.00 | 0.00 | 0.00 | 0.60 | 0.00 | 1.00 | 0.00 | 1.40 |
| C22 | 0.20 | 1.00 | 1.60 | 1.00 | 2.80 | 0.00 | 0.80 | 2.20 | 0.40 | 0.80 | 0.80 | 2.60 | 2.80 | 2.40 | 0.00 | 0.00 | 0.00 | 0.40 | 0.00 | 0.80 | 0.40 | 1.60 |
| C23 | 0.20 | 1.40 | 1.20 | 1.60 | 2.20 | 0.80 | 0.00 | 3.40 | 0.00 | 0.60 | 0.60 | 1.20 | 0.60 | 0.60 | 0.00 | 0.00 | 0.00 | 0.60 | 0.00 | 0.40 | 0.00 | 0.00 |
| C24 | 0.80 | 2.00 | 2.00 | 1.40 | 2.60 | 1.20 | 2.60 | 0.00 | 0.80 | 0.40 | 0.40 | 1.00 | 1.40 | 1.20 | 0.00 | 0.00 | 0.00 | 1.00 | 0.00 | 0.40 | 0.20 | 1.60 |
| C31 | 2.20 | 2.80 | 1.80 | 2.00 | 1.80 | 0.60 | 0.00 | 2.60 | 0.00 | 3.40 | 3.40 | 1.20 | 1.00 | 1.40 | 0.00 | 0.00 | 0.00 | 0.80 | 0.00 | 0.20 | 0.40 | 2.20 |
| C32 | 3.40 | 2.00 | 1.60 | 1.60 | 0.80 | 0.40 | 0.40 | 0.80 | 2.20 | 0.00 | 3.00 | 3.00 | 1.60 | 0.80 | 0.00 | 0.20 | 0.00 | 0.80 | 0.00 | 0.80 | 0.40 | 2.20 |
| C33 | 3.40 | 2.00 | 1.80 | 1.60 | 1.00 | 0.40 | 0.40 | 1.00 | 2.20 | 1.80 | 0.00 | 2.60 | 1.40 | 0.80 | 0.00 | 0.00 | 0.00 | 0.40 | 0.00 | 1.20 | 0.40 | 2.20 |
| C41 | 2.60 | 2.20 | 1.60 | 2.00 | 3.20 | 1.80 | 2.20 | 2.20 | 1.80 | 1.80 | 1.60 | 0.00 | 2.20 | 2.20 | 0.80 | 1.80 | 1.60 | 2.20 | 1.80 | 2.20 | 0.80 | 2.20 |
| C42 | 2.80 | 1.80 | 1.40 | 1.40 | 1.60 | 1.00 | 0.60 | 1.40 | 0.80 | 1.40 | 1.20 | 3.20 | 0.00 | 1.60 | 0.20 | 0.40 | 0.40 | 1.00 | 0.60 | 1.40 | 0.40 | 2.20 |
| C43 | 2.00 | 1.40 | 1.80 | 1.60 | 1.20 | 1.60 | 0.60 | 1.40 | 0.80 | 0.80 | 0.80 | 2.20 | 1.20 | 0.00 | 0.40 | 0.40 | 0.20 | 1.00 | 0.40 | 1.00 | 0.40 | 1.80 |
| C44 | 2.40 | 1.40 | 1.80 | 1.60 | 0.00 | 0.00 | 0.00 | 0.00 | 0.20 | 0.00 | 0.00 | 1.40 | 0.60 | 0.80 | 0.00 | 0.20 | 0.20 | 0.60 | 0.20 | 1.20 | 0.60 | 2.20 |
| C51 | 1.80 | 2.60 | 2.60 | 3.00 | 0.60 | 0.60 | 0.00 | 0.60 | 0.40 | 0.40 | 0.40 | 2.20 | 0.60 | 0.60 | 0.20 | 0.00 | 2.80 | 2.40 | 2.20 | 2.00 | 1.00 | 2.40 |
| C52 | 1.40 | 2.20 | 2.20 | 2.80 | 0.60 | 0.60 | 0.40 | 1.00 | 0.40 | 0.40 | 0.40 | 1.20 | 0.60 | 0.60 | 0.60 | 2.00 | 0.00 | 2.40 | 2.60 | 2.00 | 0.80 | 1.00 |
| C53 | 0.80 | 2.60 | 2.20 | 2.20 | 0.80 | 0.80 | 0.20 | 1.20 | 0.60 | 0.80 | 0.40 | 1.60 | 0.60 | 1.00 | 0.60 | 1.40 | 1.20 | 0.00 | 2.60 | 1.20 | 1.00 | 1.40 |
| C54 | 1.20 | 2.20 | 1.20 | 1.80 | 0.20 | 0.20 | 0.00 | 0.20 | 0.20 | 0.20 | 0.20 | 1.60 | 0.20 | 0.40 | 0.00 | 1.20 | 1.60 | 1.20 | 0.00 | 1.20 | 0.80 | 1.40 |
| C61 | 1.60 | 1.80 | 3.20 | 3.40 | 1.60 | 2.00 | 1.20 | 2.00 | 1.60 | 1.00 | 1.60 | 2.20 | 2.20 | 2.80 | 3.00 | 2.40 | 2.20 | 1.60 | 1.60 | 0.00 | 2.00 | 1.80 |
| C62 | 1.60 | 2.40 | 1.80 | 2.40 | 0.60 | 0.60 | 1.20 | 0.80 | 0.60 | 0.80 | 0.80 | 1.00 | 0.80 | 0.80 | 0.80 | 0.80 | 0.60 | 1.00 | 1.00 | 2.00 | 0.00 | 2.00 |
| C63 | 2.80 | 3.00 | 2.00 | 1.80 | 1.00 | 0.80 | 0.80 | 1.20 | 2.80 | 2.40 | 2.40 | 2.40 | 2.00 | 2.00 | 1.60 | 1.80 | 1.60 | 2.40 | 2.60 | 3.00 | 2.80 | 0.00 |
Note: The average gap-ratio in consensus (%) = 4.86% < 5%, where m is the number of criteria (m = 22), s is the sample of 10 experts (s = 10) whose practical experience and significant confidence reach 95.14% (more than 95%).
Table A2.
Total-influence matrix of criteria.
| C11 | C12 | C13 | C14 | C21 | C22 | C23 | C24 | C31 | C32 | C33 | C41 | C42 | C43 | C44 | C51 | C52 | C53 | C54 | C61 | C62 | C63 | |
|---|---|---|---|---|---|---|---|---|---|---|---|---|---|---|---|---|---|---|---|---|---|---|
| C11 | 0.11 | 0.15 | 0.18 | 0.17 | 0.09 | 0.08 | 0.06 | 0.10 | 0.14 | 0.14 | 0.15 | 0.15 | 0.13 | 0.12 | 0.08 | 0.06 | 0.06 | 0.10 | 0.08 | 0.14 | 0.07 | 0.13 |
| C12 | 0.18 | 0.14 | 0.20 | 0.21 | 0.11 | 0.08 | 0.13 | 0.13 | 0.14 | 0.14 | 0.14 | 0.16 | 0.14 | 0.13 | 0.10 | 0.10 | 0.11 | 0.16 | 0.13 | 0.15 | 0.12 | 0.15 |
| C13 | 0.15 | 0.13 | 0.10 | 0.16 | 0.10 | 0.08 | 0.07 | 0.10 | 0.08 | 0.09 | 0.09 | 0.11 | 0.09 | 0.09 | 0.06 | 0.08 | 0.07 | 0.10 | 0.07 | 0.11 | 0.06 | 0.10 |
| C14 | 0.19 | 0.21 | 0.20 | 0.14 | 0.11 | 0.09 | 0.13 | 0.13 | 0.11 | 0.12 | 0.12 | 0.16 | 0.13 | 0.14 | 0.10 | 0.12 | 0.13 | 0.15 | 0.13 | 0.16 | 0.11 | 0.14 |
| C21 | 0.08 | 0.09 | 0.11 | 0.09 | 0.06 | 0.11 | 0.09 | 0.13 | 0.08 | 0.06 | 0.06 | 0.14 | 0.12 | 0.11 | 0.03 | 0.03 | 0.03 | 0.06 | 0.04 | 0.08 | 0.03 | 0.09 |
| C22 | 0.07 | 0.08 | 0.10 | 0.08 | 0.11 | 0.04 | 0.06 | 0.10 | 0.05 | 0.06 | 0.06 | 0.12 | 0.11 | 0.10 | 0.03 | 0.03 | 0.03 | 0.05 | 0.03 | 0.07 | 0.04 | 0.09 |
| C23 | 0.05 | 0.07 | 0.07 | 0.08 | 0.08 | 0.04 | 0.03 | 0.11 | 0.03 | 0.04 | 0.04 | 0.07 | 0.05 | 0.05 | 0.02 | 0.02 | 0.02 | 0.04 | 0.02 | 0.04 | 0.02 | 0.04 |
| C24 | 0.07 | 0.10 | 0.10 | 0.09 | 0.10 | 0.06 | 0.09 | 0.05 | 0.06 | 0.05 | 0.05 | 0.08 | 0.08 | 0.07 | 0.02 | 0.03 | 0.03 | 0.06 | 0.03 | 0.05 | 0.03 | 0.08 |
| C31 | 0.13 | 0.14 | 0.12 | 0.13 | 0.09 | 0.06 | 0.05 | 0.12 | 0.06 | 0.13 | 0.13 | 0.11 | 0.09 | 0.09 | 0.03 | 0.04 | 0.04 | 0.07 | 0.04 | 0.07 | 0.05 | 0.12 |
| C32 | 0.15 | 0.12 | 0.12 | 0.12 | 0.07 | 0.05 | 0.05 | 0.08 | 0.11 | 0.06 | 0.12 | 0.14 | 0.10 | 0.08 | 0.03 | 0.04 | 0.04 | 0.07 | 0.04 | 0.08 | 0.05 | 0.11 |
| C33 | 0.15 | 0.12 | 0.12 | 0.11 | 0.07 | 0.05 | 0.05 | 0.08 | 0.10 | 0.10 | 0.06 | 0.13 | 0.09 | 0.07 | 0.03 | 0.04 | 0.04 | 0.06 | 0.04 | 0.09 | 0.05 | 0.11 |
| C41 | 0.16 | 0.16 | 0.15 | 0.16 | 0.14 | 0.10 | 0.11 | 0.13 | 0.11 | 0.11 | 0.11 | 0.11 | 0.13 | 0.13 | 0.06 | 0.09 | 0.09 | 0.13 | 0.10 | 0.13 | 0.07 | 0.14 |
| C42 | 0.14 | 0.12 | 0.11 | 0.11 | 0.09 | 0.07 | 0.06 | 0.09 | 0.07 | 0.09 | 0.08 | 0.14 | 0.06 | 0.09 | 0.04 | 0.05 | 0.05 | 0.08 | 0.06 | 0.09 | 0.05 | 0.11 |
| C43 | 0.11 | 0.10 | 0.11 | 0.10 | 0.07 | 0.07 | 0.05 | 0.08 | 0.06 | 0.06 | 0.07 | 0.11 | 0.08 | 0.05 | 0.04 | 0.04 | 0.04 | 0.07 | 0.05 | 0.08 | 0.04 | 0.09 |
| C44 | 0.10 | 0.08 | 0.09 | 0.09 | 0.03 | 0.03 | 0.03 | 0.04 | 0.04 | 0.04 | 0.04 | 0.08 | 0.05 | 0.05 | 0.03 | 0.03 | 0.03 | 0.05 | 0.04 | 0.07 | 0.04 | 0.09 |
| C51 | 0.13 | 0.15 | 0.15 | 0.16 | 0.07 | 0.06 | 0.05 | 0.08 | 0.07 | 0.07 | 0.07 | 0.13 | 0.08 | 0.08 | 0.05 | 0.05 | 0.11 | 0.12 | 0.11 | 0.12 | 0.07 | 0.12 |
| C52 | 0.10 | 0.13 | 0.13 | 0.14 | 0.06 | 0.05 | 0.05 | 0.08 | 0.06 | 0.06 | 0.06 | 0.10 | 0.07 | 0.07 | 0.05 | 0.09 | 0.04 | 0.11 | 0.10 | 0.11 | 0.06 | 0.09 |
| C53 | 0.09 | 0.13 | 0.12 | 0.12 | 0.07 | 0.06 | 0.05 | 0.08 | 0.06 | 0.07 | 0.06 | 0.10 | 0.07 | 0.07 | 0.05 | 0.07 | 0.07 | 0.06 | 0.10 | 0.09 | 0.06 | 0.09 |
| C54 | 0.08 | 0.10 | 0.08 | 0.10 | 0.04 | 0.03 | 0.03 | 0.04 | 0.04 | 0.04 | 0.04 | 0.08 | 0.05 | 0.05 | 0.03 | 0.06 | 0.07 | 0.07 | 0.04 | 0.07 | 0.05 | 0.07 |
| C61 | 0.15 | 0.16 | 0.19 | 0.19 | 0.11 | 0.10 | 0.09 | 0.13 | 0.11 | 0.10 | 0.11 | 0.16 | 0.13 | 0.14 | 0.11 | 0.11 | 0.10 | 0.12 | 0.10 | 0.09 | 0.10 | 0.14 |
| C62 | 0.11 | 0.13 | 0.12 | 0.13 | 0.06 | 0.05 | 0.07 | 0.07 | 0.06 | 0.07 | 0.07 | 0.09 | 0.07 | 0.07 | 0.05 | 0.06 | 0.05 | 0.08 | 0.07 | 0.10 | 0.04 | 0.10 |
| C63 | 0.18 | 0.19 | 0.17 | 0.17 | 0.10 | 0.08 | 0.08 | 0.11 | 0.14 | 0.13 | 0.14 | 0.16 | 0.13 | 0.13 | 0.09 | 0.10 | 0.09 | 0.14 | 0.12 | 0.16 | 0.12 | 0.10 |
Table A3.
Total-influence matrix of dimensions.
| D1 | D2 | D3 | D4 | D5 | D6 | |
|---|---|---|---|---|---|---|
| D1 | 0.16 | 0.10 | 0.12 | 0.12 | 0.10 | 0.12 |
| D2 | 0.08 | 0.08 | 0.05 | 0.07 | 0.04 | 0.06 |
| D3 | 0.13 | 0.07 | 0.10 | 0.08 | 0.05 | 0.08 |
| D4 | 0.12 | 0.07 | 0.07 | 0.08 | 0.06 | 0.08 |
| D5 | 0.12 | 0.06 | 0.06 | 0.07 | 0.08 | 0.08 |
| D6 | 0.16 | 0.09 | 0.10 | 0.11 | 0.09 | 0.11 |
Table A4.
Sum of influences given and received on criteria and dimensions.
| Dimensions | ri | ci | ri + ci | ri − ci | Criteria | ri | ci | ri + ci | ri − ci |
|---|---|---|---|---|---|---|---|---|---|
| D1 | 0.73 | 0.77 | 1.49 | −0.04 | C11 | 2.47 | 2.68 | 5.15 | −0.20 |
| C12 | 3.06 | 2.79 | 5.86 | 0.27 | |||||
| C13 | 2.09 | 2.84 | 4.93 | −0.75 | |||||
| C14 | 3.01 | 2.85 | 5.86 | 0.17 | |||||
| D2 | 0.38 | 0.46 | 0.85 | −0.08 | C21 | 1.74 | 1.86 | 3.60 | −0.12 |
| C22 | 1.50 | 1.44 | 2.94 | 0.06 | |||||
| C23 | 1.02 | 1.45 | 2.47 | −0.43 | |||||
| C24 | 1.40 | 2.06 | 3.46 | −0.66 | |||||
| D3 | 0.50 | 0.51 | 1.01 | −0.01 | C31 | 1.90 | 1.79 | 3.70 | 0.11 |
| C32 | 1.84 | 1.83 | 3.67 | 0.01 | |||||
| C33 | 1.76 | 1.89 | 3.65 | −0.13 | |||||
| D4 | 0.49 | 0.53 | 1.02 | −0.04 | C41 | 2.64 | 2.60 | 5.24 | 0.03 |
| C42 | 1.86 | 2.04 | 3.90 | −0.18 | |||||
| C43 | 1.58 | 1.97 | 3.55 | −0.39 | |||||
| C44 | 1.16 | 1.12 | 2.28 | 0.04 | |||||
| D5 | 0.46 | 0.42 | 0.88 | 0.04 | C51 | 2.07 | 1.35 | 3.43 | 0.72 |
| C52 | 1.79 | 1.31 | 3.11 | 0.48 | |||||
| C53 | 1.72 | 1.95 | 3.67 | −0.23 | |||||
| C54 | 1.26 | 1.55 | 2.82 | −0.29 | |||||
| D6 | 0.66 | 0.53 | 1.19 | 0.13 | C61 | 2.75 | 2.14 | 4.90 | 0.61 |
| C62 | 1.70 | 1.34 | 3.04 | 0.36 | |||||
| C63 | 2.83 | 2.31 | 5.15 | 0.52 |
Table A5.
The un-weighted supermatrix W.
| C11 | C12 | C13 | C14 | C21 | C22 | C23 | C24 | C31 | C32 | C33 | C41 | C42 | C43 | C44 | C51 | C52 | C53 | C54 | C61 | C62 | C63 | |
|---|---|---|---|---|---|---|---|---|---|---|---|---|---|---|---|---|---|---|---|---|---|---|
| C11 | 0.18 | 0.24 | 0.30 | 0.28 | 0.28 | 0.23 | 0.17 | 0.31 | 0.32 | 0.34 | 0.34 | 0.31 | 0.27 | 0.24 | 0.17 | 0.20 | 0.19 | 0.35 | 0.26 | 0.41 | 0.19 | 0.39 |
| C12 | 0.25 | 0.19 | 0.27 | 0.29 | 0.24 | 0.18 | 0.28 | 0.29 | 0.34 | 0.33 | 0.33 | 0.30 | 0.27 | 0.24 | 0.19 | 0.21 | 0.21 | 0.31 | 0.26 | 0.36 | 0.29 | 0.35 |
| C13 | 0.29 | 0.24 | 0.18 | 0.30 | 0.29 | 0.23 | 0.19 | 0.29 | 0.31 | 0.34 | 0.35 | 0.31 | 0.27 | 0.25 | 0.17 | 0.26 | 0.22 | 0.30 | 0.23 | 0.41 | 0.23 | 0.36 |
| C14 | 0.26 | 0.28 | 0.27 | 0.19 | 0.24 | 0.20 | 0.28 | 0.27 | 0.32 | 0.34 | 0.34 | 0.30 | 0.25 | 0.26 | 0.19 | 0.24 | 0.24 | 0.28 | 0.25 | 0.39 | 0.28 | 0.33 |
| C21 | 0.20 | 0.25 | 0.30 | 0.25 | 0.15 | 0.29 | 0.23 | 0.34 | 0.38 | 0.31 | 0.31 | 0.35 | 0.30 | 0.28 | 0.07 | 0.20 | 0.19 | 0.38 | 0.23 | 0.38 | 0.17 | 0.45 |
| C22 | 0.20 | 0.25 | 0.29 | 0.25 | 0.36 | 0.13 | 0.19 | 0.33 | 0.30 | 0.35 | 0.35 | 0.33 | 0.31 | 0.28 | 0.07 | 0.21 | 0.20 | 0.36 | 0.23 | 0.34 | 0.20 | 0.46 |
| C23 | 0.17 | 0.27 | 0.27 | 0.29 | 0.31 | 0.17 | 0.11 | 0.41 | 0.26 | 0.37 | 0.37 | 0.38 | 0.27 | 0.26 | 0.10 | 0.19 | 0.19 | 0.41 | 0.21 | 0.42 | 0.21 | 0.37 |
| C24 | 0.20 | 0.27 | 0.28 | 0.24 | 0.33 | 0.20 | 0.30 | 0.17 | 0.36 | 0.32 | 0.32 | 0.31 | 0.31 | 0.28 | 0.10 | 0.19 | 0.18 | 0.41 | 0.22 | 0.32 | 0.20 | 0.48 |
| C31 | 0.25 | 0.27 | 0.24 | 0.24 | 0.30 | 0.18 | 0.15 | 0.37 | 0.19 | 0.40 | 0.41 | 0.33 | 0.27 | 0.28 | 0.11 | 0.20 | 0.19 | 0.38 | 0.23 | 0.29 | 0.21 | 0.50 |
| C32 | 0.30 | 0.24 | 0.23 | 0.23 | 0.29 | 0.20 | 0.20 | 0.31 | 0.36 | 0.21 | 0.43 | 0.40 | 0.28 | 0.22 | 0.10 | 0.22 | 0.19 | 0.37 | 0.23 | 0.33 | 0.20 | 0.47 |
| C33 | 0.30 | 0.24 | 0.24 | 0.23 | 0.29 | 0.20 | 0.20 | 0.31 | 0.40 | 0.37 | 0.23 | 0.39 | 0.28 | 0.23 | 0.10 | 0.21 | 0.20 | 0.35 | 0.24 | 0.35 | 0.19 | 0.45 |
| C41 | 0.26 | 0.25 | 0.24 | 0.25 | 0.30 | 0.21 | 0.22 | 0.28 | 0.33 | 0.34 | 0.33 | 0.25 | 0.30 | 0.30 | 0.15 | 0.23 | 0.21 | 0.31 | 0.25 | 0.39 | 0.21 | 0.41 |
| C42 | 0.29 | 0.25 | 0.23 | 0.23 | 0.30 | 0.22 | 0.19 | 0.30 | 0.30 | 0.35 | 0.34 | 0.42 | 0.19 | 0.28 | 0.12 | 0.21 | 0.20 | 0.34 | 0.25 | 0.37 | 0.19 | 0.44 |
| C43 | 0.26 | 0.23 | 0.26 | 0.25 | 0.27 | 0.26 | 0.18 | 0.29 | 0.33 | 0.33 | 0.34 | 0.40 | 0.28 | 0.18 | 0.14 | 0.22 | 0.19 | 0.35 | 0.24 | 0.35 | 0.20 | 0.45 |
| C44 | 0.28 | 0.22 | 0.25 | 0.24 | 0.27 | 0.22 | 0.22 | 0.30 | 0.35 | 0.32 | 0.33 | 0.37 | 0.25 | 0.26 | 0.12 | 0.22 | 0.21 | 0.34 | 0.24 | 0.35 | 0.21 | 0.45 |
| C51 | 0.22 | 0.25 | 0.26 | 0.27 | 0.28 | 0.23 | 0.19 | 0.30 | 0.33 | 0.33 | 0.34 | 0.39 | 0.24 | 0.23 | 0.14 | 0.13 | 0.28 | 0.31 | 0.27 | 0.38 | 0.23 | 0.40 |
| C52 | 0.21 | 0.25 | 0.26 | 0.28 | 0.26 | 0.22 | 0.21 | 0.32 | 0.33 | 0.33 | 0.34 | 0.34 | 0.25 | 0.24 | 0.17 | 0.25 | 0.13 | 0.32 | 0.30 | 0.42 | 0.23 | 0.34 |
| C53 | 0.19 | 0.28 | 0.26 | 0.27 | 0.27 | 0.23 | 0.19 | 0.32 | 0.33 | 0.35 | 0.32 | 0.35 | 0.23 | 0.26 | 0.16 | 0.24 | 0.22 | 0.19 | 0.34 | 0.36 | 0.25 | 0.38 |
| C54 | 0.22 | 0.28 | 0.23 | 0.27 | 0.27 | 0.22 | 0.21 | 0.30 | 0.33 | 0.33 | 0.34 | 0.41 | 0.22 | 0.24 | 0.13 | 0.25 | 0.29 | 0.30 | 0.16 | 0.37 | 0.25 | 0.39 |
| C61 | 0.22 | 0.23 | 0.27 | 0.28 | 0.26 | 0.24 | 0.20 | 0.30 | 0.34 | 0.31 | 0.35 | 0.29 | 0.24 | 0.26 | 0.21 | 0.25 | 0.24 | 0.27 | 0.23 | 0.28 | 0.30 | 0.41 |
| C62 | 0.22 | 0.26 | 0.24 | 0.27 | 0.25 | 0.20 | 0.26 | 0.29 | 0.31 | 0.34 | 0.35 | 0.32 | 0.25 | 0.25 | 0.18 | 0.23 | 0.21 | 0.30 | 0.26 | 0.42 | 0.16 | 0.42 |
| C63 | 0.26 | 0.27 | 0.24 | 0.24 | 0.27 | 0.21 | 0.21 | 0.30 | 0.34 | 0.33 | 0.33 | 0.32 | 0.26 | 0.25 | 0.17 | 0.22 | 0.21 | 0.30 | 0.27 | 0.42 | 0.31 | 0.27 |
Table A6.
The weighted supermatrix .
| C11 | C12 | C13 | C14 | C21 | C22 | C23 | C24 | C31 | C32 | C33 | C41 | C42 | C43 | C44 | C51 | C52 | C53 | C54 | C61 | C62 | C63 | |
|---|---|---|---|---|---|---|---|---|---|---|---|---|---|---|---|---|---|---|---|---|---|---|
| C11 | 0.06 | 0.06 | 0.06 | 0.06 | 0.06 | 0.06 | 0.06 | 0.06 | 0.06 | 0.06 | 0.06 | 0.06 | 0.06 | 0.06 | 0.06 | 0.06 | 0.06 | 0.06 | 0.06 | 0.06 | 0.06 | 0.06 |
| C12 | 0.06 | 0.06 | 0.06 | 0.06 | 0.07 | 0.07 | 0.07 | 0.07 | 0.06 | 0.06 | 0.06 | 0.06 | 0.06 | 0.06 | 0.06 | 0.06 | 0.06 | 0.06 | 0.06 | 0.06 | 0.06 | 0.06 |
| C13 | 0.06 | 0.06 | 0.06 | 0.06 | 0.07 | 0.07 | 0.07 | 0.07 | 0.06 | 0.06 | 0.06 | 0.06 | 0.06 | 0.06 | 0.06 | 0.06 | 0.06 | 0.06 | 0.06 | 0.06 | 0.06 | 0.06 |
| C14 | 0.06 | 0.06 | 0.06 | 0.06 | 0.07 | 0.07 | 0.07 | 0.07 | 0.06 | 0.06 | 0.06 | 0.06 | 0.06 | 0.06 | 0.06 | 0.06 | 0.06 | 0.06 | 0.06 | 0.06 | 0.06 | 0.06 |
| C21 | 0.04 | 0.04 | 0.04 | 0.04 | 0.05 | 0.05 | 0.05 | 0.05 | 0.04 | 0.04 | 0.04 | 0.04 | 0.04 | 0.04 | 0.04 | 0.04 | 0.04 | 0.04 | 0.04 | 0.04 | 0.04 | 0.04 |
| C22 | 0.04 | 0.04 | 0.04 | 0.04 | 0.04 | 0.04 | 0.04 | 0.04 | 0.04 | 0.04 | 0.04 | 0.04 | 0.04 | 0.04 | 0.04 | 0.04 | 0.04 | 0.04 | 0.04 | 0.04 | 0.04 | 0.04 |
| C23 | 0.04 | 0.04 | 0.04 | 0.04 | 0.04 | 0.04 | 0.04 | 0.04 | 0.04 | 0.04 | 0.04 | 0.04 | 0.04 | 0.04 | 0.04 | 0.04 | 0.04 | 0.04 | 0.04 | 0.04 | 0.04 | 0.04 |
| C24 | 0.05 | 0.05 | 0.05 | 0.05 | 0.05 | 0.05 | 0.05 | 0.05 | 0.05 | 0.05 | 0.05 | 0.05 | 0.05 | 0.05 | 0.05 | 0.05 | 0.05 | 0.05 | 0.05 | 0.05 | 0.05 | 0.05 |
| C31 | 0.05 | 0.05 | 0.05 | 0.05 | 0.06 | 0.06 | 0.06 | 0.06 | 0.05 | 0.05 | 0.05 | 0.05 | 0.05 | 0.05 | 0.05 | 0.05 | 0.05 | 0.05 | 0.05 | 0.05 | 0.05 | 0.05 |
| C32 | 0.05 | 0.05 | 0.05 | 0.05 | 0.06 | 0.06 | 0.06 | 0.06 | 0.05 | 0.05 | 0.05 | 0.05 | 0.05 | 0.05 | 0.05 | 0.05 | 0.05 | 0.05 | 0.05 | 0.05 | 0.05 | 0.05 |
| C33 | 0.06 | 0.06 | 0.06 | 0.06 | 0.06 | 0.06 | 0.06 | 0.06 | 0.06 | 0.06 | 0.06 | 0.06 | 0.06 | 0.06 | 0.06 | 0.06 | 0.06 | 0.06 | 0.06 | 0.06 | 0.06 | 0.06 |
| C41 | 0.06 | 0.06 | 0.06 | 0.06 | 0.06 | 0.06 | 0.06 | 0.06 | 0.06 | 0.06 | 0.06 | 0.06 | 0.06 | 0.06 | 0.06 | 0.06 | 0.06 | 0.06 | 0.06 | 0.06 | 0.06 | 0.06 |
| C42 | 0.05 | 0.05 | 0.05 | 0.05 | 0.05 | 0.05 | 0.05 | 0.05 | 0.05 | 0.05 | 0.05 | 0.05 | 0.05 | 0.05 | 0.05 | 0.05 | 0.05 | 0.05 | 0.05 | 0.05 | 0.05 | 0.05 |
| C43 | 0.04 | 0.04 | 0.04 | 0.04 | 0.05 | 0.05 | 0.05 | 0.05 | 0.04 | 0.04 | 0.04 | 0.04 | 0.04 | 0.04 | 0.04 | 0.04 | 0.04 | 0.04 | 0.04 | 0.04 | 0.04 | 0.04 |
| C44 | 0.02 | 0.02 | 0.02 | 0.02 | 0.03 | 0.03 | 0.03 | 0.03 | 0.02 | 0.02 | 0.02 | 0.02 | 0.02 | 0.02 | 0.02 | 0.02 | 0.02 | 0.02 | 0.02 | 0.02 | 0.02 | 0.02 |
| C51 | 0.03 | 0.03 | 0.03 | 0.03 | 0.03 | 0.03 | 0.03 | 0.03 | 0.03 | 0.03 | 0.03 | 0.03 | 0.03 | 0.03 | 0.03 | 0.03 | 0.03 | 0.03 | 0.03 | 0.03 | 0.03 | 0.03 |
| C52 | 0.03 | 0.03 | 0.03 | 0.03 | 0.03 | 0.03 | 0.03 | 0.03 | 0.03 | 0.03 | 0.03 | 0.03 | 0.03 | 0.03 | 0.03 | 0.03 | 0.03 | 0.03 | 0.03 | 0.03 | 0.03 | 0.03 |
| C53 | 0.04 | 0.04 | 0.04 | 0.04 | 0.05 | 0.05 | 0.05 | 0.05 | 0.04 | 0.04 | 0.04 | 0.04 | 0.04 | 0.04 | 0.04 | 0.04 | 0.04 | 0.04 | 0.04 | 0.04 | 0.04 | 0.04 |
| C54 | 0.03 | 0.03 | 0.03 | 0.03 | 0.04 | 0.04 | 0.04 | 0.03 | 0.03 | 0.03 | 0.03 | 0.03 | 0.03 | 0.03 | 0.03 | 0.03 | 0.03 | 0.03 | 0.03 | 0.03 | 0.03 | 0.03 |
| C61 | 0.06 | 0.06 | 0.06 | 0.06 | 0.07 | 0.07 | 0.07 | 0.07 | 0.06 | 0.06 | 0.06 | 0.06 | 0.06 | 0.06 | 0.06 | 0.06 | 0.06 | 0.06 | 0.06 | 0.06 | 0.06 | 0.06 |
| C62 | 0.04 | 0.04 | 0.04 | 0.04 | 0.04 | 0.04 | 0.04 | 0.04 | 0.04 | 0.04 | 0.04 | 0.04 | 0.04 | 0.04 | 0.04 | 0.04 | 0.04 | 0.04 | 0.04 | 0.04 | 0.04 | 0.04 |
| C63 | 0.07 | 0.07 | 0.07 | 0.07 | 0.07 | 0.07 | 0.07 | 0.07 | 0.07 | 0.07 | 0.07 | 0.07 | 0.07 | 0.07 | 0.07 | 0.07 | 0.07 | 0.07 | 0.07 | 0.07 | 0.07 | 0.07 |
References
- Shad, R.; Khorrami, M.; Ghaemi, M. Developing an Iranian green building assessment tool using decision making methods and geographical information system: Case study in Mashhad city. Renew. Sustain. Energy Rev. 2017, 67, 324–340. [Google Scholar] [CrossRef]
- Dixit, M.K.; Culp, C.H.; Fernández-Solís, J.L. System boundary for embodied energy in buildings: A conceptual model for definition. Renew. Sustain. Energy Rev. 2013, 21, 153–164. [Google Scholar] [CrossRef]
- Yeheyis, M.; Hewage, K.; Alam, M.S.; Eskicioglu, C.; Sadiq, R. An overview of construction and demolition waste management in Canada: A lifecycle analysis approach to sustainability. Clean Technol. Environ. Policy 2012, 15, 81–91. [Google Scholar] [CrossRef]
- Al-Jebouri, M.F.A.; Saleh, M.S.; Raman, S.N.; Rahmat, R.A.A.B.O.K.; Shaaban, A.K. Toward a national sustainable building assessment system in Oman: Assessment categories and their performance indicators. Sustain. Cities Soc. 2017, 31, 122–135. [Google Scholar] [CrossRef]
- Ali, H.H.; Al Nsairat, S.F. Developing a green building assessment tool for developing countries: Case of Jordan. Build. Environ. 2009, 44, 1053–1064. [Google Scholar] [CrossRef]
- Ye, L.; Cheng, Z.; Wang, Q.; Lin, H.; Lin, C.; Liu, B. Developments of Green Building Standards in China. Renew. Energy 2015, 73, 115–122. [Google Scholar] [CrossRef]
- Balaban, O.; Puppim de Oliveira, J.A. Sustainable buildings for healthier cities: Assessing the co-benefits of green buildings in Japan. J. Clean Prod. 2017, 163, 68–78. [Google Scholar] [CrossRef]
- Wong, S.C.; Abe, N. Stakeholders’ perspectives of a building environmental assessment method: The case of CASBEE. Build. Environ. 2014, 82, 502–516. [Google Scholar] [CrossRef]
- Dwaikat, L.; Ali, K. Measuring the Actual Energy Cost Performance of Green Buildings: A Test of the Earned Value Management Approach. Energies 2016, 9, 188. [Google Scholar] [CrossRef]
- Kang, H.J. Development of a systematic model for an assessment tool for sustainable buildings based on a structural framework. Energy Build. 2015, 104, 287–301. [Google Scholar] [CrossRef]
- Darko, A.; Chan, A.P.C.; Owusu-Manu, D.G.; Ameyaw, E.E. Drivers for implementing green building technologies: An international survey of experts. J. Clean Prod. 2017, 145, 386–394. [Google Scholar] [CrossRef]
- Chenari, B.; Dias Carrilho, J.; Gameiro da Silva, M. Towards sustainable, energy-efficient and healthy ventilation strategies in buildings: A review. Renew. Sustain. Energy Rev. 2016, 59, 1426–1447. [Google Scholar] [CrossRef]
- Hsu, C.C.; Liou, J.J.H.; Chuang, Y.C. Integrating DANP and modified grey relation theory for the selection of an outsourcing provider. Expert Syst. Appl. 2013, 40, 2297–2304. [Google Scholar] [CrossRef]
- Huang, C.N.; Liou, J.J.H.; Chuang, Y.C. A method for exploring the interdependencies and importance of critical infrastructures. Knowl.-Based Syst. 2014, 55, 66–74. [Google Scholar] [CrossRef]
- Hung, Y.H.; Huang, T.L.; Hsieh, J.C.; Tsuei, H.J.; Cheng, C.C.; Tzeng, G.H. Online reputation management for improving marketing by using a hybrid MCDM model. Knowl.-Based Syst. 2012, 35, 87–93. [Google Scholar] [CrossRef]
- Liou, J.J.H. Building an effective system for carbon reduction management. J. Clean Prod. 2015, 103, 353–361. [Google Scholar] [CrossRef]
- Chen, S.H.; Lin, W.T. Analyzing determinants for promoting emerging technology through intermediaries by using a DANP-based MCDA framework. Technol. Forecast. Soc. 2017, 9, 1–17. [Google Scholar] [CrossRef]
- Liou, J.J.H.; Hsu, C.C.; Chen, Y.S. Improving transportation service quality based on information fusion. Transp. Res. Part A-Policy Pract. 2014, 67, 225–239. [Google Scholar] [CrossRef]
- Bozovic-Stamenovic, R.; Kishnani, N.; Tan, B.K.; Prasad, D.; Faizal, F. Assessment of awareness of Green Mark (GM) rating tool by occupants of GM buildings and general public. Energy Build. 2016, 115, 55–62. [Google Scholar] [CrossRef]
- Chen, X.; Yang, H.; Lu, L. A comprehensive review on passive design approaches in green building rating tools. Renew. Sustain. Energy Rev. 2015, 50, 1425–1436. [Google Scholar] [CrossRef]
- Li, Y.Y.; Chen, P.H.; Chew, D.A.S.; Teo, C.C. Exploration of critical resources and capabilities of design firms for delivering green building projects: Empirical studies in Singapore. Habitat Int. 2014, 41, 229–235. [Google Scholar] [CrossRef]
- Alyami, S.H.; Rezgui, Y. Sustainable building assessment tool development approach. Sustain. Cities Soc. 2012, 5, 52–62. [Google Scholar] [CrossRef]
- Lee, W.L. A comprehensive review of metrics of building environmental assessment schemes. Energy Build. 2013, 62, 403–413. [Google Scholar] [CrossRef]
- Guo, Q.; Wu, Y.; Ding, Y.; Feng, W.; Zhu, N. Measures to enforce mandatory civil building energy efficiency codes in China. J. Clean Prod. 2016, 119, 152–166. [Google Scholar] [CrossRef]
- Hong, T.; Li, C.; Yan, D. Updates to the China Design Standard for Energy Efficiency in public buildings. Energy Policy 2015, 87, 187–198. [Google Scholar] [CrossRef]
- Yu, W.; Li, B.; Yang, X.; Wang, Q. A development of a rating method and weighting system for green store buildings in China. Renew. Energy 2015, 73, 123–129. [Google Scholar] [CrossRef]
- Si, J.; Marjanovic-Halburd, L.; Nasiri, F.; Bell, S. Assessment of building-integrated green technologies: A review and case study on applications of Multi-Criteria Decision Making (MCDM) method. Sustain. Cities Soc. 2016, 27, 106–115. [Google Scholar] [CrossRef]
- Banani, R.; Vahdati, M.M.; Shahrestani, M.; Clements-Croome, D. The development of building assessment criteria framework for sustainable non-residential buildings in Saudi Arabia. Sustain. Cities Soc. 2016, 26, 289–305. [Google Scholar] [CrossRef]
- Liu, Z.W.; Gao, P.Z.; Kang, Y.W. Low-Carbon Building Assessment and Model Construction. Appl. Mech. Mater. 2013, 361–363, 903–907. [Google Scholar] [CrossRef]
- Nilashi, M.; Zakaria, R.; Ibrahim, O.; Majid, M.Z.A.; Mohamad Zin, R.; Chugtai, M.W.; Aminu Yakubu, D. A knowledge-based expert system for assessing the performance level of green buildings. Knowl.-Based Syst. 2015, 86, 194–209. [Google Scholar] [CrossRef]
- Sabaghi, M.; Mascle, C.; Baptiste, P.; Rostamzadeh, R. Sustainability assessment using fuzzy-inference technique (SAFT): A methodology toward green products. Expert Syst. Appl. 2016, 56, 69–79. [Google Scholar] [CrossRef]
- Chen, F.H.; Hsu, T.S.; Tzeng, G.H. A balanced scorecard approach to establish a performance evaluation and relationship model for hot spring hotels based on a hybrid MCDM model combining DEMATEL and ANP. Int. J. Hosp. Manag. 2011, 30, 908–932. [Google Scholar] [CrossRef]
- Varmazyar, M.; Dehghanbaghi, M.; Afkhami, M. A novel hybrid MCDM model for performance evaluation of research and technology organizations based on BSC approach. Evaluation Program Plan. 2016, 58, 125–140. [Google Scholar] [CrossRef] [PubMed]
- BRE. BREEAM New Construction: Non-Domestic Buildings (Technical Manual SD5073–2.0:2011); Building Research Establishment Ltd.: Watford, UK, 2011. [Google Scholar]
- Supeekit, T.; Somboonwiwat, T.; Kritchanchai, D. DEMATEL-modified ANP to evaluate internal hospital supply chain performance. Comput. Ind. Eng. 2016, 102, 318–330. [Google Scholar] [CrossRef]
- Uygun, Ö.; Kaçamak, H.; Kahraman, Ü.A. An integrated DEMATEL and Fuzzy ANP techniques for evaluation and selection of outsourcing provider for a telecommunication company. Comput. Ind. Eng. 2015, 86, 137–146. [Google Scholar] [CrossRef]
- Ou Yang, Y.P.; Shieh, H.M.; Tzeng, G.H. A VIKOR technique based on DEMATEL and ANP for information security risk control assessment. Inf. Sci. 2013, 232, 482–500. [Google Scholar] [CrossRef]
- BRE. Background to the Green Guide to Specification: Methodology and Sponsors; Building Research Establishment Ltd.: Watford, UK, 2015; Available online: http://www.bre.co.uk/greenguide/page.jsp?id=2069 (accessed on 6 April 2018).
- Chen, I.S. A combined MCDM model based on DEMATEL and ANP for the selection of airline service quality improvement criteria: A study based on the Taiwanese airline industry. J. Air Transp. Manag. 2016, 57, 7–18. [Google Scholar] [CrossRef]
- Darko, A.; Chan, A.P.C.; Ameyaw, E.E.; He, B.J.; Olanipekun, A.O. Examining issues influencing green building technologies adoption: The United States green building experts’ perspectives. Energy Build. 2017, 144, 320–332. [Google Scholar] [CrossRef]
- Arslan, F. The Role of Green Buildings in Sustainable Production: Example of Inci Aku Industrial Battery Factory, Turkey. Dokuz Eylül Üniversitesi Sosyal Bilimler Enstitüsü Dergisi 2017, 19, 119–145. [Google Scholar] [CrossRef]
- Chiu, W.Y.; Tzeng, G.H.; Li, H.L. A new hybrid MCDM model combining DANP with VIKOR to improve e-store business. Knowl.-Based Syst. 2013, 37, 48–61. [Google Scholar] [CrossRef]
Figure 1.
Influential network relation map (INRM).

Figure 2.
Major influence route.

Table 1.
Green building evaluation system.
| Dimension | Criteria | Source |
|---|---|---|
| Management | Sustainable procurement Stakeholder participation Ease of maintenance Management system | [4]; [34]; [16]; [26]; |
| Indoor environment | Indoor air quality Natural ventilation Smoking ban Indoor thermal control Lighting zones and controls | [38]; [4]; [1]; [26]; [9]; |
| Materials | Sourcing of materials Recycled materials Renewable materials Hard landscaping | [1]; [11]; [29]; [34]; [4]; |
| Energy and Water efficiency | Reduction of CO2 Drying spacing Renewable energy Energy delivery performance Water saving system Water-saving facilities Water monitoring | [22]; [23]; [9]; [41] [34]; [4]; |
| Innovation | Smart technology application Culture of innovation Support of national economy | [26]; [4] [34]; [4]; |
| Site ecology | Public transportation Maximum car parking Outdoor environment Cyclist landscaping | [38]; [4]; |
| Waste and Pollution solutions | Garbage classification and sorting Drainage system Flood risk | [11]; [34]; [11]; |
Table 2.
Linguistic variables for ranking criteria.
| Linguistic Variables | Very Unimportant | Unimportant | Slightly Unimportant | Fair | Slightly Important | Important | Very Important |
|---|---|---|---|---|---|---|---|
| Triangular fuzzy set | (0,0,1) | (0,1,3) | (1,3,5) | (3,5,7) | (5,7,9) | (7,9,10) | (9,10,10) |
Table 3.
Extracted dimensions and criteria.
| Dimension | Criteria |
|---|---|
| Management (D1) | Sustainable procurement (C11) |
| Stakeholder participation (C12) | |
| Ease of maintenance (C13) | |
| Management system (C14) | |
| Indoor environment (D2) | Natural ventilation (C21) |
| Indoor thermal (C22) | |
| Smoking ban (C23) | |
| Indoor air quality (C24) | |
| Material (D3) | Sourcing of materials (C31) |
| Recycled materials (C32) | |
| Renewable materials (C33) | |
| Energy and Water efficiency (D4) | Reduction of CO2 (C41) |
| Renewable energy (C42) | |
| Energy delivery performance (C43) | |
| Water saving system (C44) | |
| Site ecology (D5) | Public transportation (C51) |
| Maximum car parking (C52) | |
| Outdoor environment (C53) | |
| Cyclist landscaping (C54) | |
| Innovation (D6) | Smart technology application (C61) |
| Culture of innovation (C62) | |
| Support of national economy (C63) |
Table 4.
Influence weights of the green building assessment system.
| Local Weight | Ranking | Local Weight | Ranking | Global Weight | Ranking | ||
|---|---|---|---|---|---|---|---|
| D1 | 0.2374 | 1 | C11 | 0.242 | 4 | 0.0573 | 6 |
| C12 | 0.251 | 3 | 0.0596 | 5 | |||
| C13 | 0.253 | 2 | 0.0601 | 4 | |||
| C14 | 0.254 | 1 | 0.0604 | 2 | |||
| D2 | 0.1468 | 5 | C21 | 0.275 | 2 | 0.0404 | 15 |
| C22 | 0.211 | 4 | 0.0310 | 19 | |||
| C23 | 0.212 | 3 | 0.0311 | 18 | |||
| C24 | 0.302 | 1 | 0.0443 | 11 | |||
| D3 | 0.1583 | 4 | C31 | 0.326 | 3 | 0.0516 | 10 |
| C32 | 0.332 | 2 | 0.0525 | 9 | |||
| C33 | 0.342 | 1 | 0.0542 | 8 | |||
| D4 | 0.1656 | 2 | C41 | 0.338 | 1 | 0.0560 | 7 |
| C42 | 0.266 | 2 | 0.0440 | 12 | |||
| C43 | 0.254 | 3 | 0.0421 | 13 | |||
| C44 | 0.142 | 4 | 0.0235 | 22 | |||
| D5 | 0.1284 | 6 | C51 | 0.221 | 3 | 0.0283 | 20 |
| C52 | 0.211 | 4 | 0.0271 | 21 | |||
| C53 | 0.319 | 1 | 0.0410 | 14 | |||
| C54 | 0.249 | 2 | 0.0320 | 17 | |||
| D6 | 0.1636 | 3 | C61 | 0.368 | 2 | 0.0603 | 3 |
| C62 | 0.229 | 3 | 0.0374 | 16 | |||
| C63 | 0.403 | 1 | 0.0659 | 1 |
© 2018 by the authors. Licensee MDPI, Basel, Switzerland. This article is an open access article distributed under the terms and conditions of the Creative Commons Attribution (CC BY) license (http://creativecommons.org/licenses/by/4.0/).
Share and Cite
MDPI and ACS Style
Shao, Q.-G.; Liou, J.J.H.; Weng, S.-S.; Chuang, Y.-C. Improving the Green Building Evaluation System in China Based on the DANP Method. Sustainability 2018, 10, 1173. https://doi.org/10.3390/su10041173
AMA Style
Shao Q-G, Liou JJH, Weng S-S, Chuang Y-C. Improving the Green Building Evaluation System in China Based on the DANP Method. Sustainability. 2018; 10(4):1173. https://doi.org/10.3390/su10041173
Chicago/Turabian StyleShao, Qi-Gan, James J. H. Liou, Sung-Shun Weng, and Yen-Ching Chuang. 2018. "Improving the Green Building Evaluation System in China Based on the DANP Method" Sustainability 10, no. 4: 1173. https://doi.org/10.3390/su10041173
Note that from the first issue of 2016, this journal uses article numbers instead of page numbers. See further details here.