A Decision-Making Model for Evaluating and Selecting Suppliers for the Sustainable Operation and Development of Enterprises in the Aerospace Industry

Abstract
:1. Introduction
2. Literature Review
2.1. Criteria for Supplier Evaluation and Selection
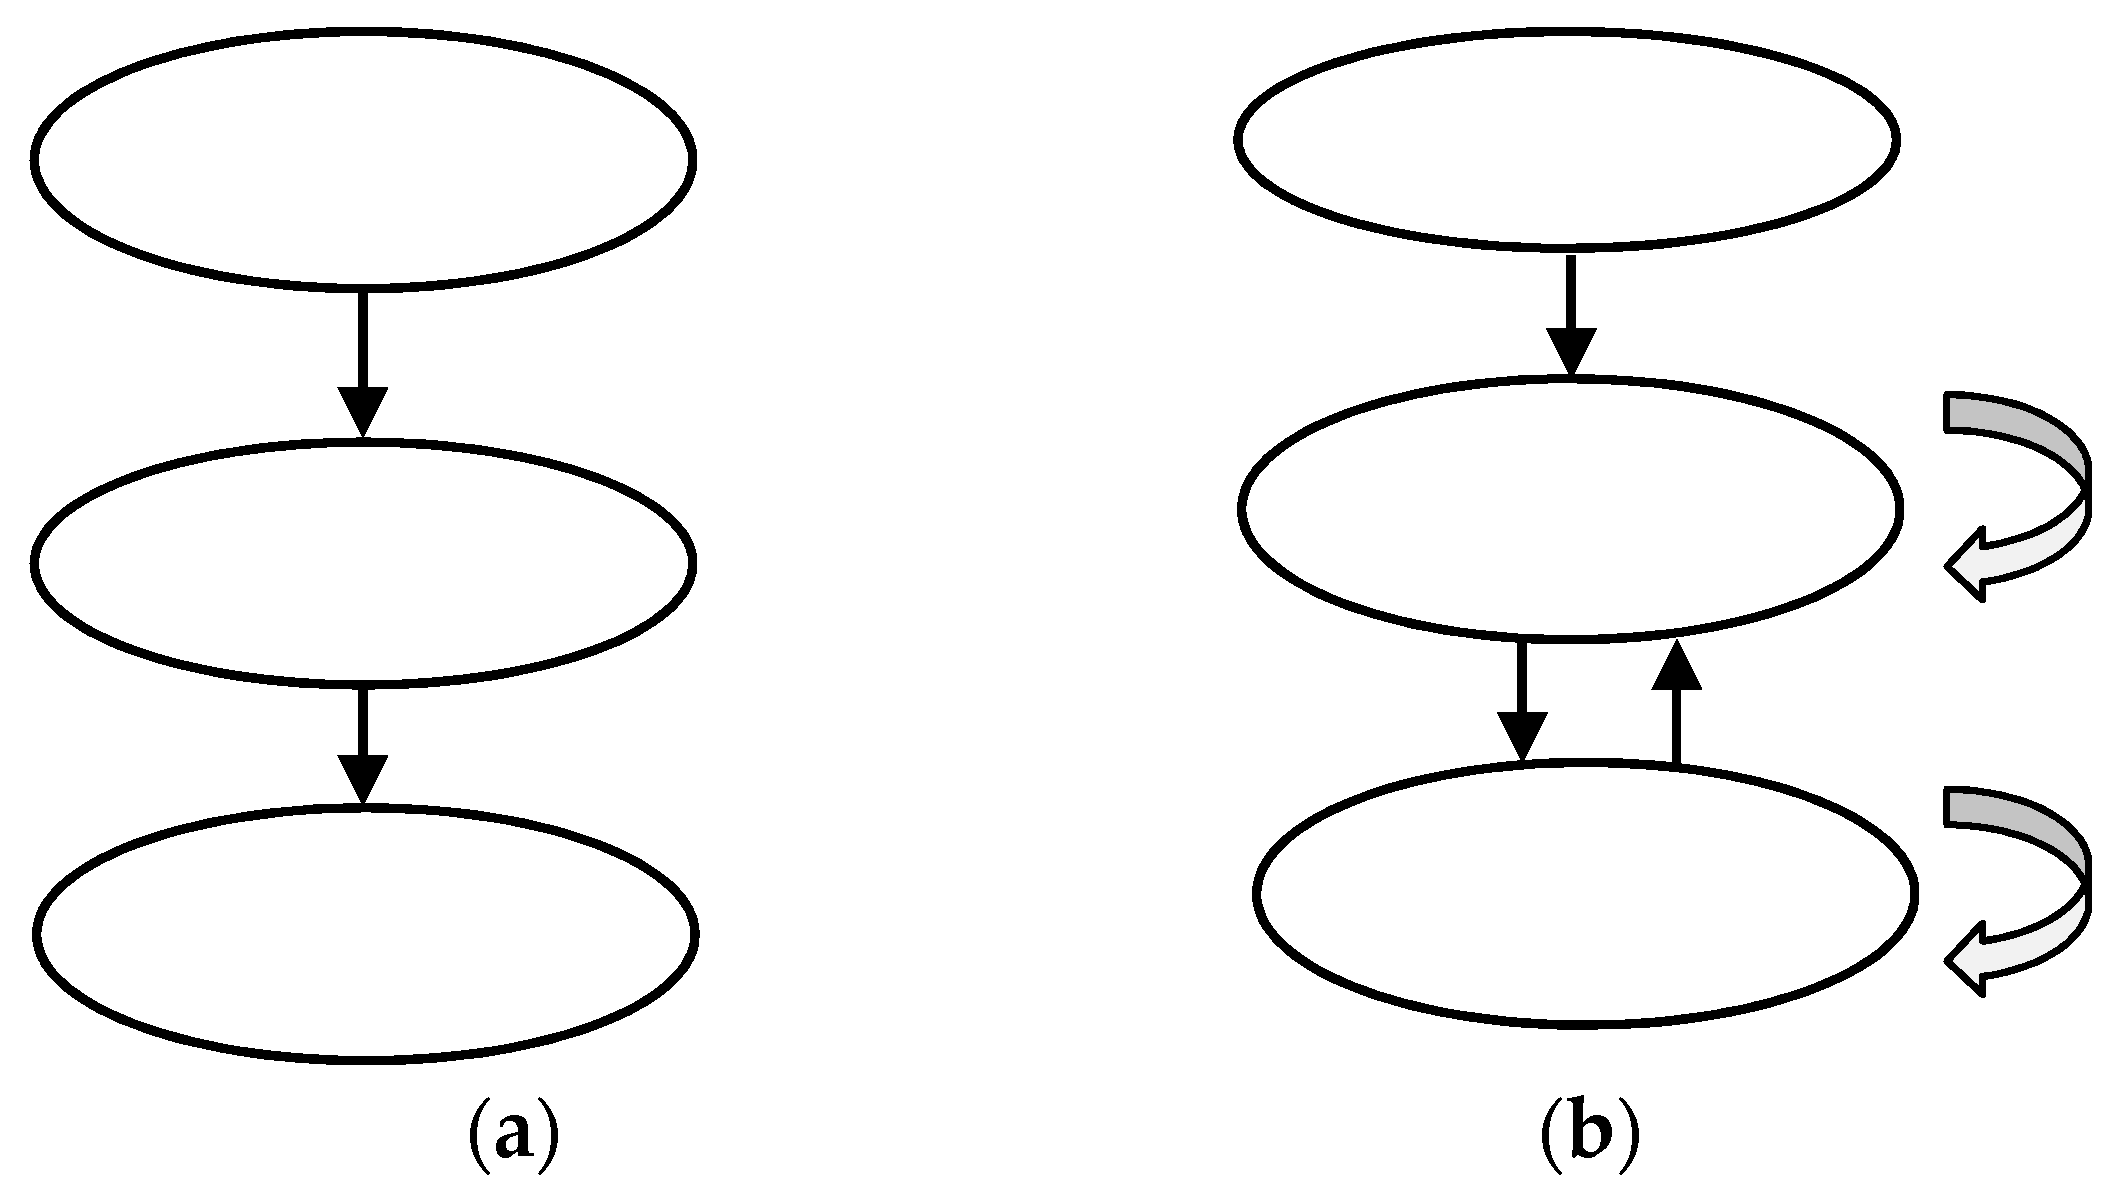
2.2. Analytic Network Process
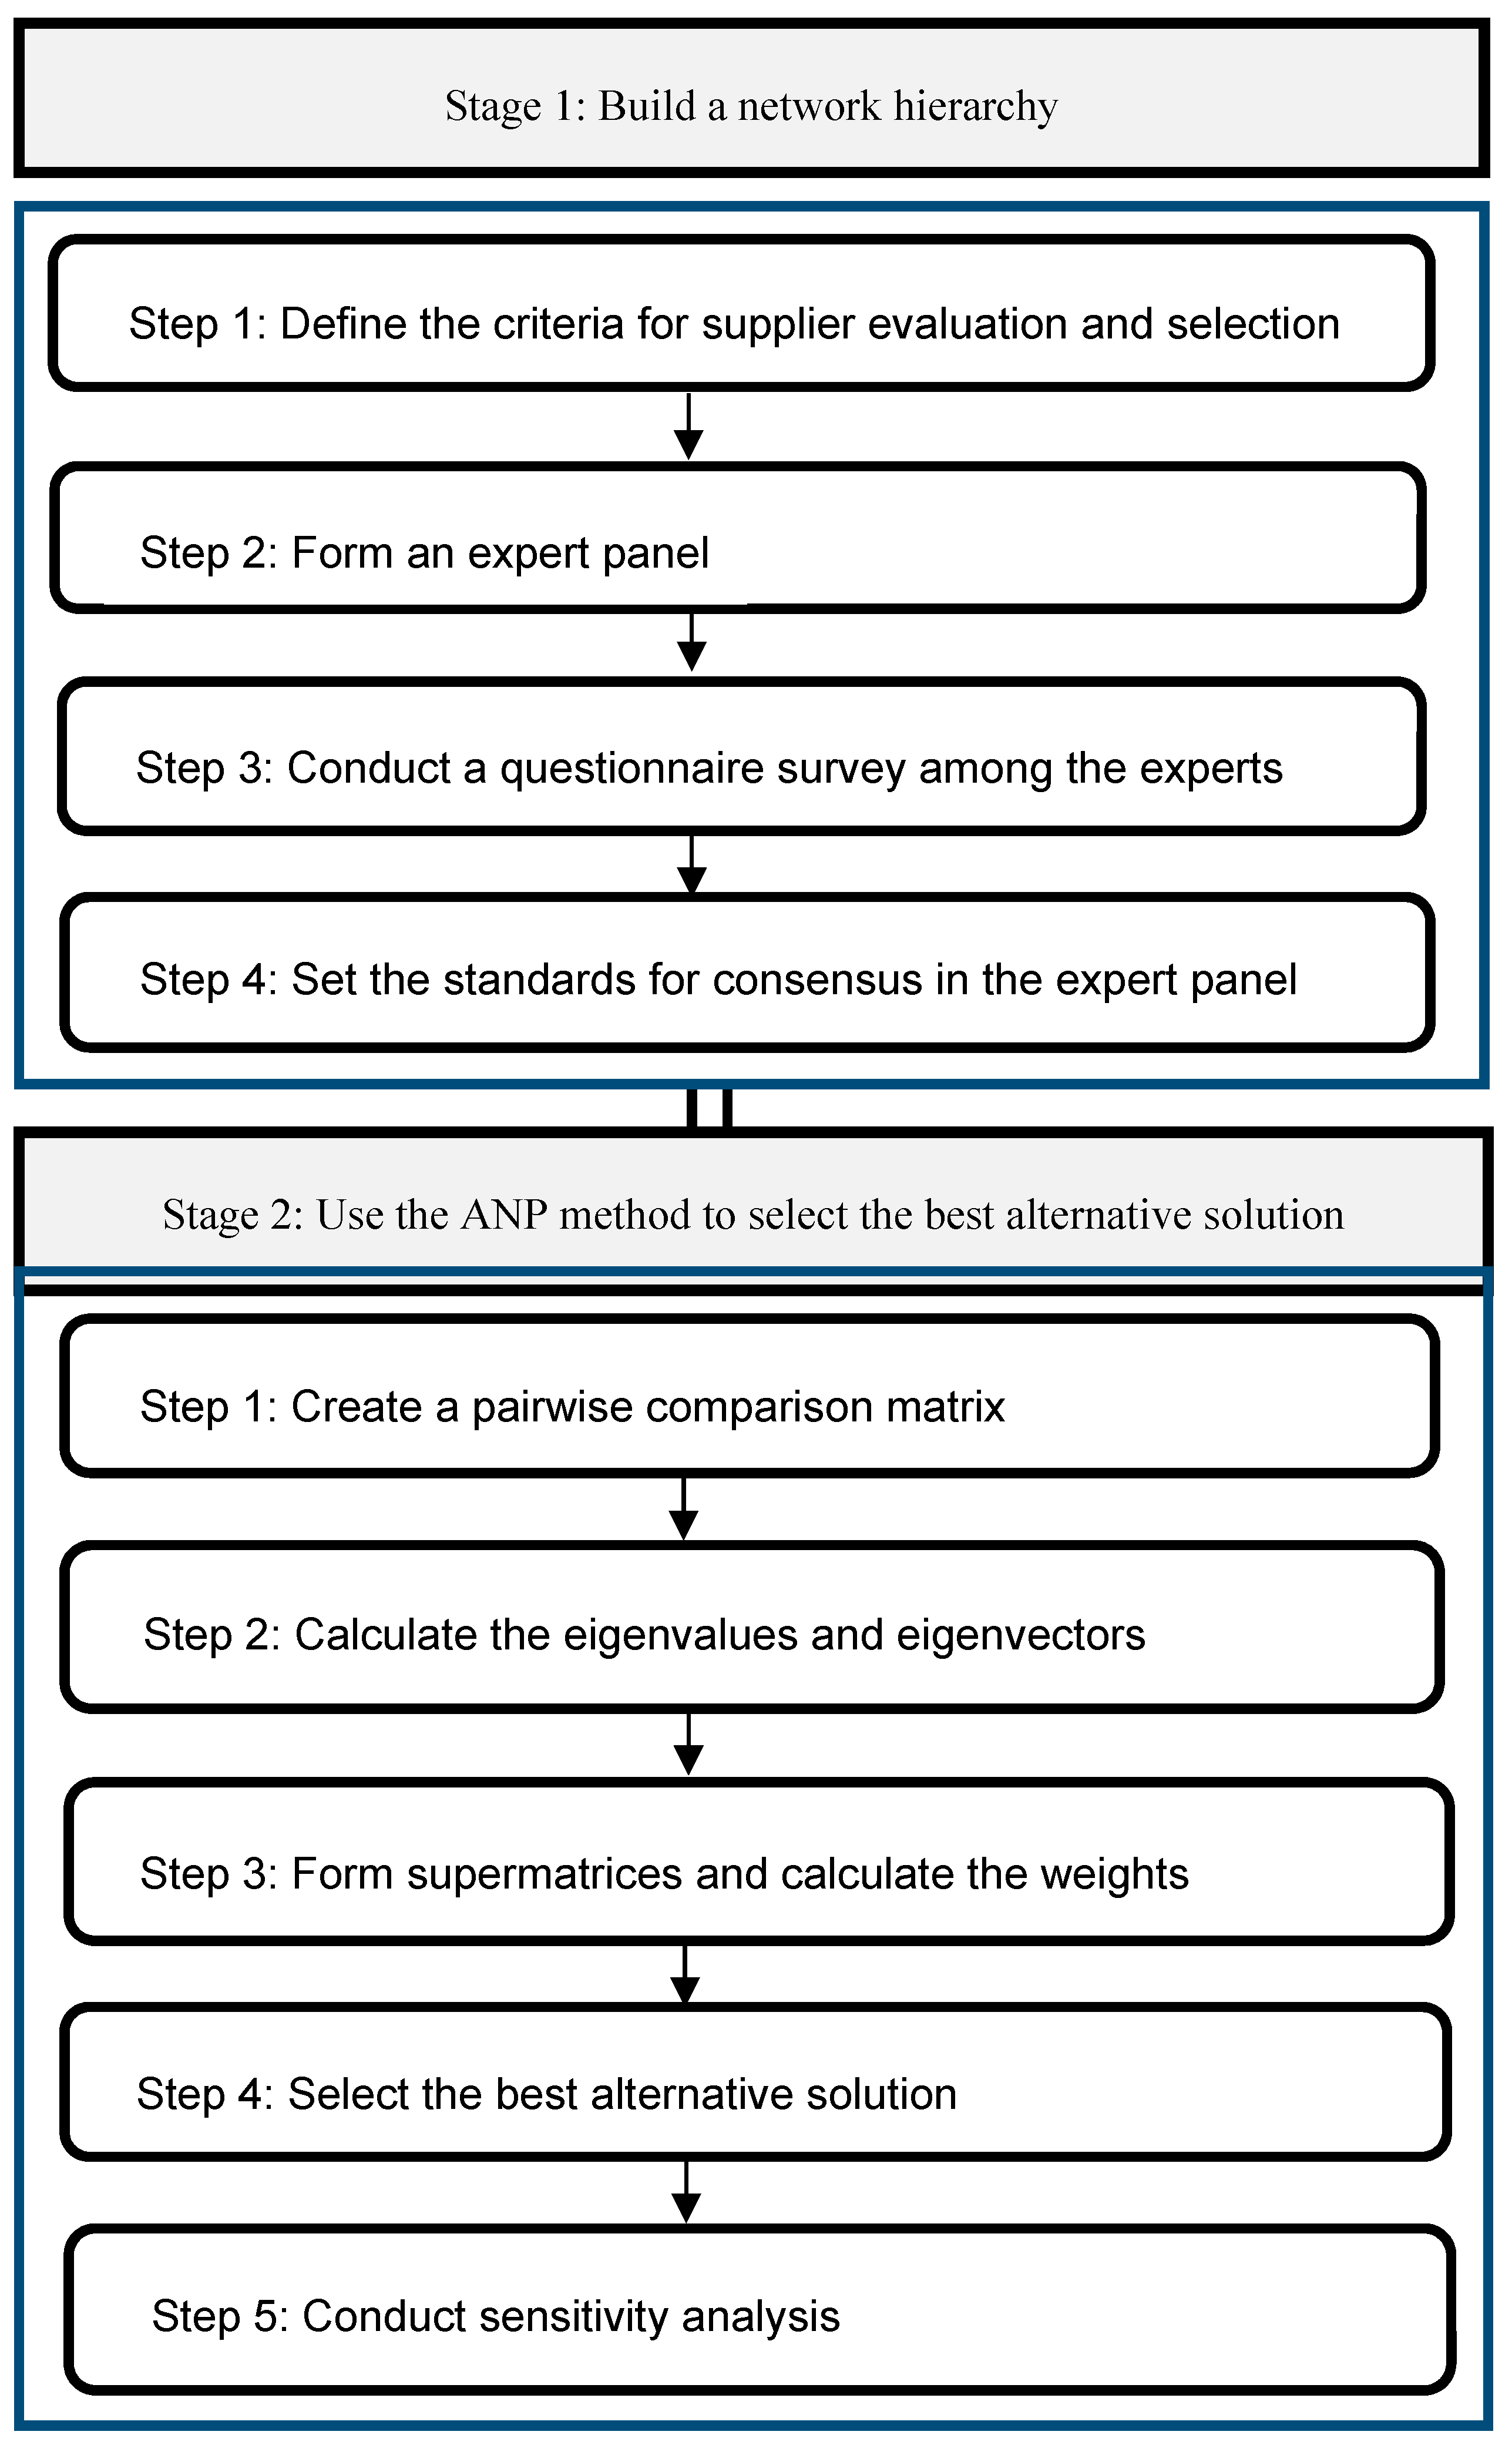
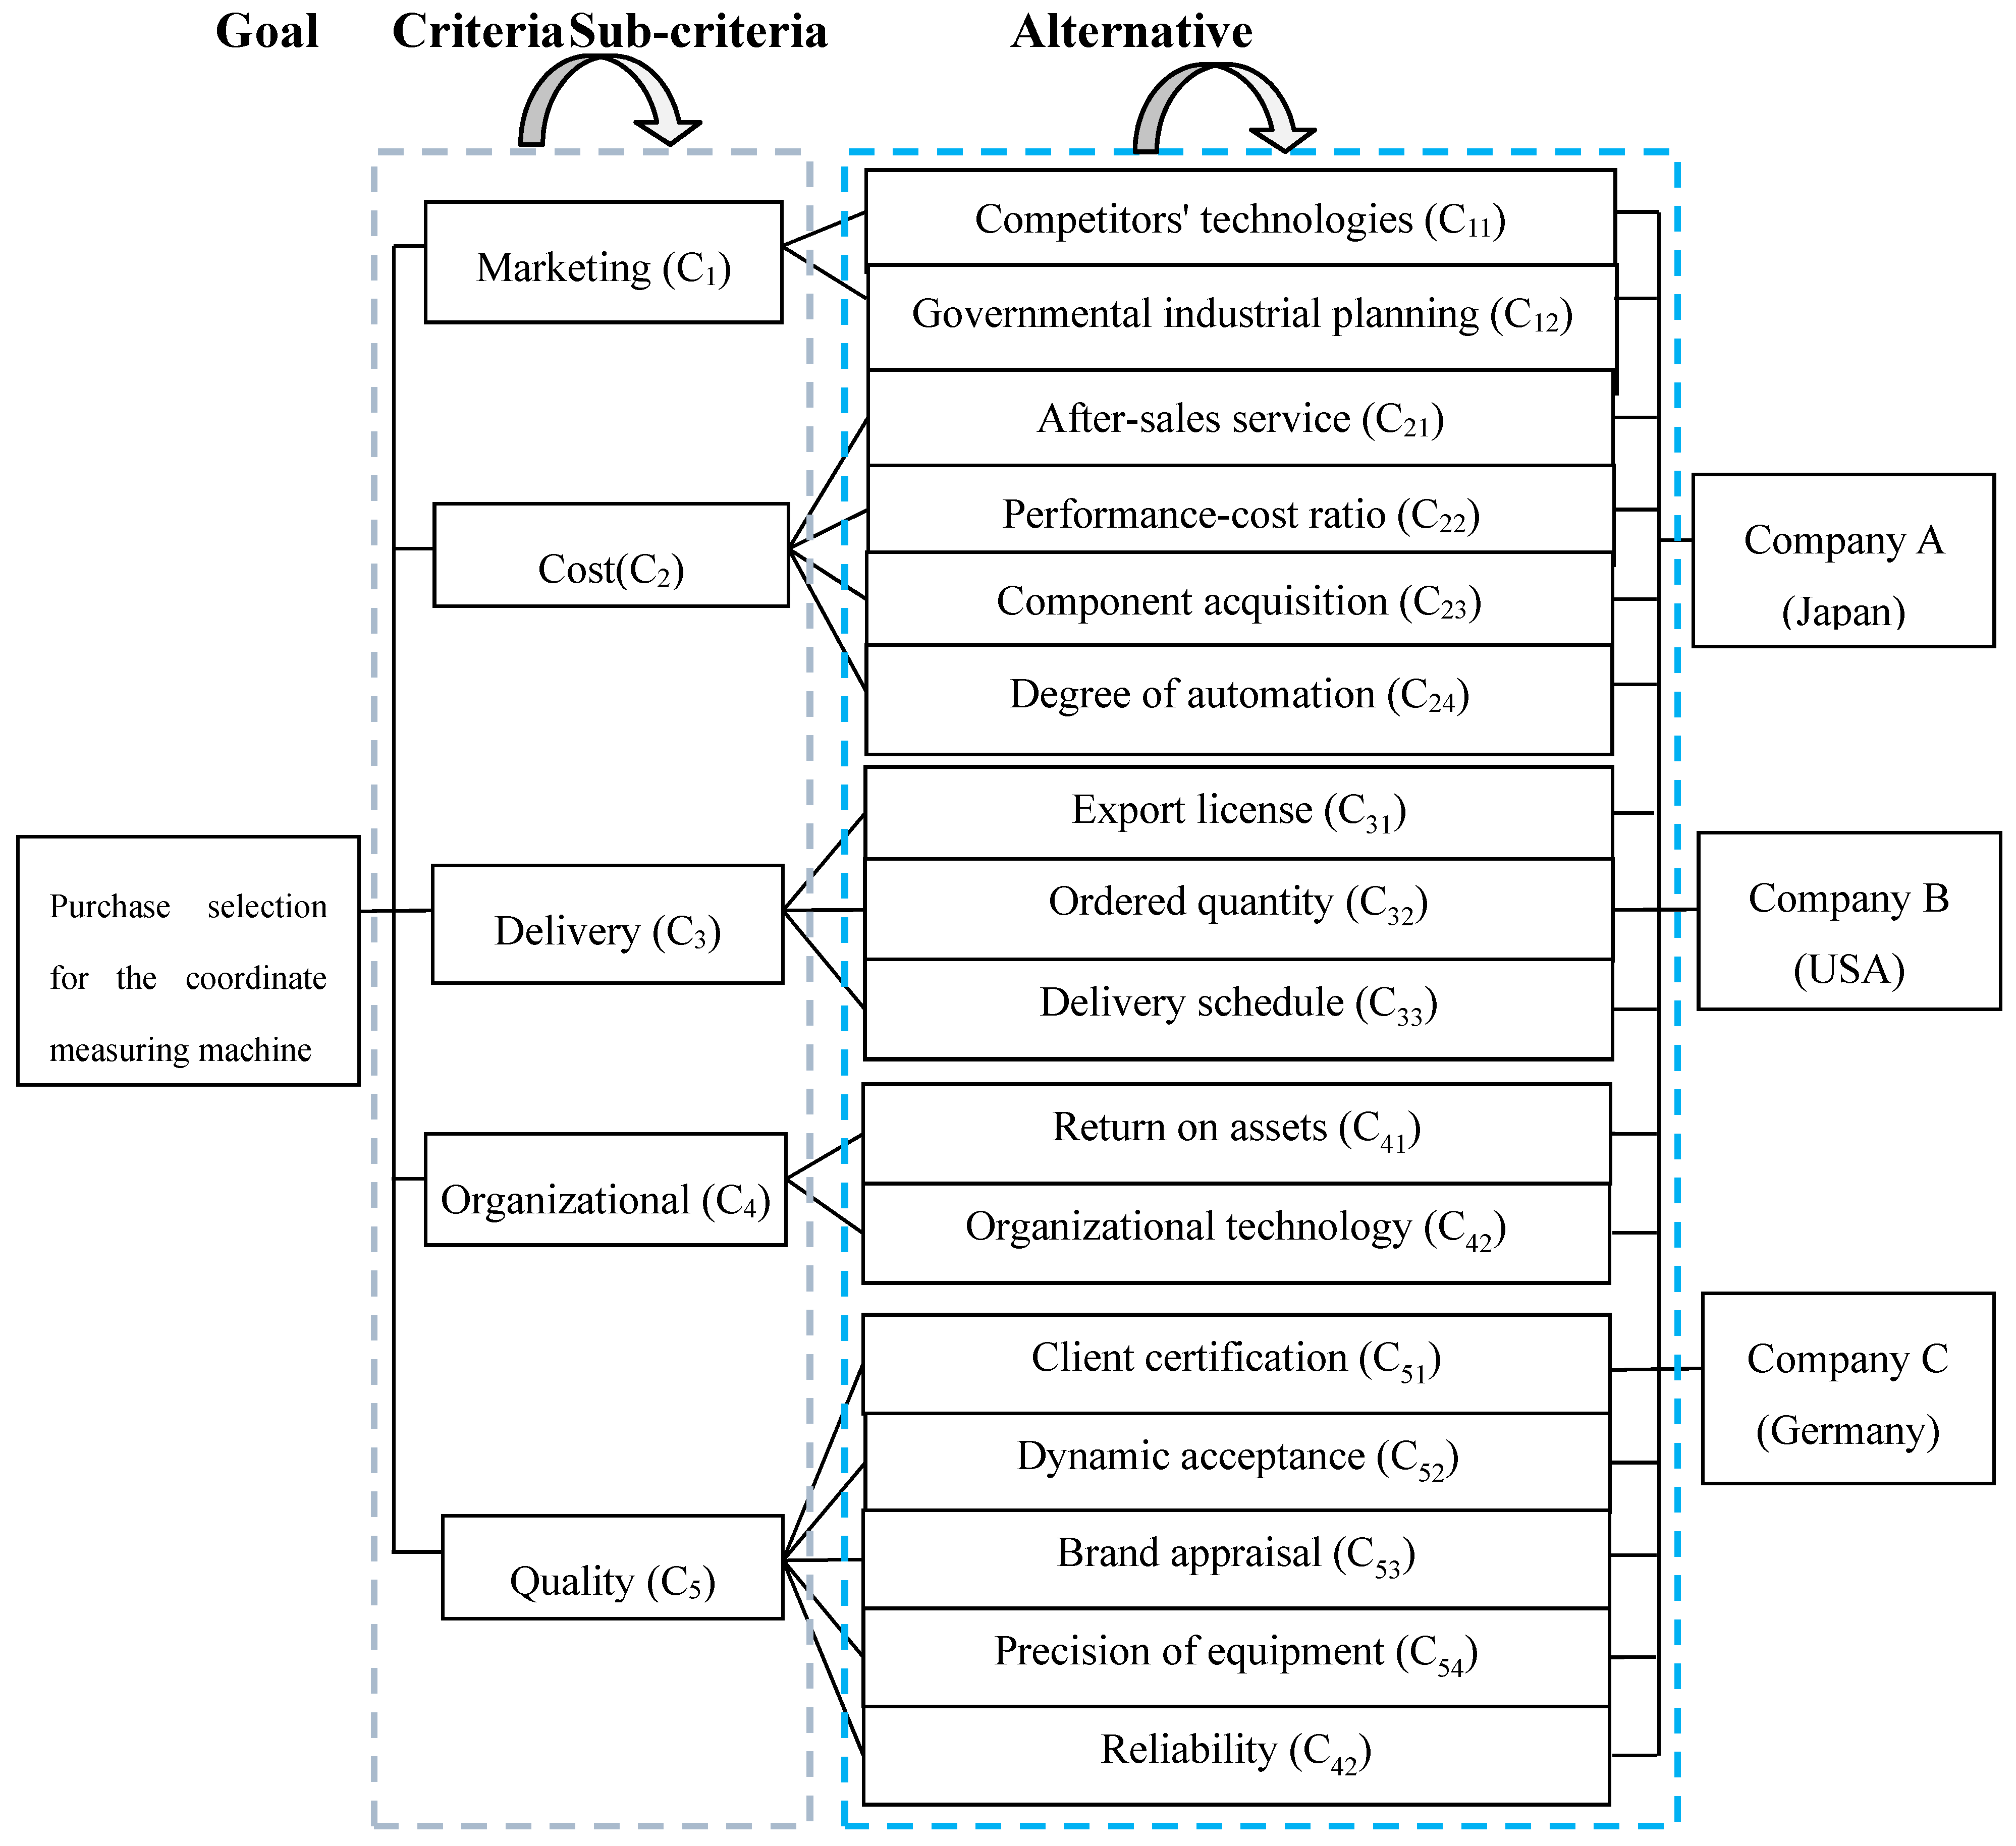
3. Building a Model for Supplier Evaluation and Selection
- Step 1: Define the criteria for supplier evaluation and selection.
- Step 2: Form an expert panel.
- Step 3: Conduct a questionnaire survey among the experts.
- Step 4: Set the standards for consensus in the expert panel.
- Step 1: Create a pairwise comparison matrix.
- Step 2: Calculate the eigenvalues and eigenvectors.
- Step 3: Form supermatrices and calculate the weights.
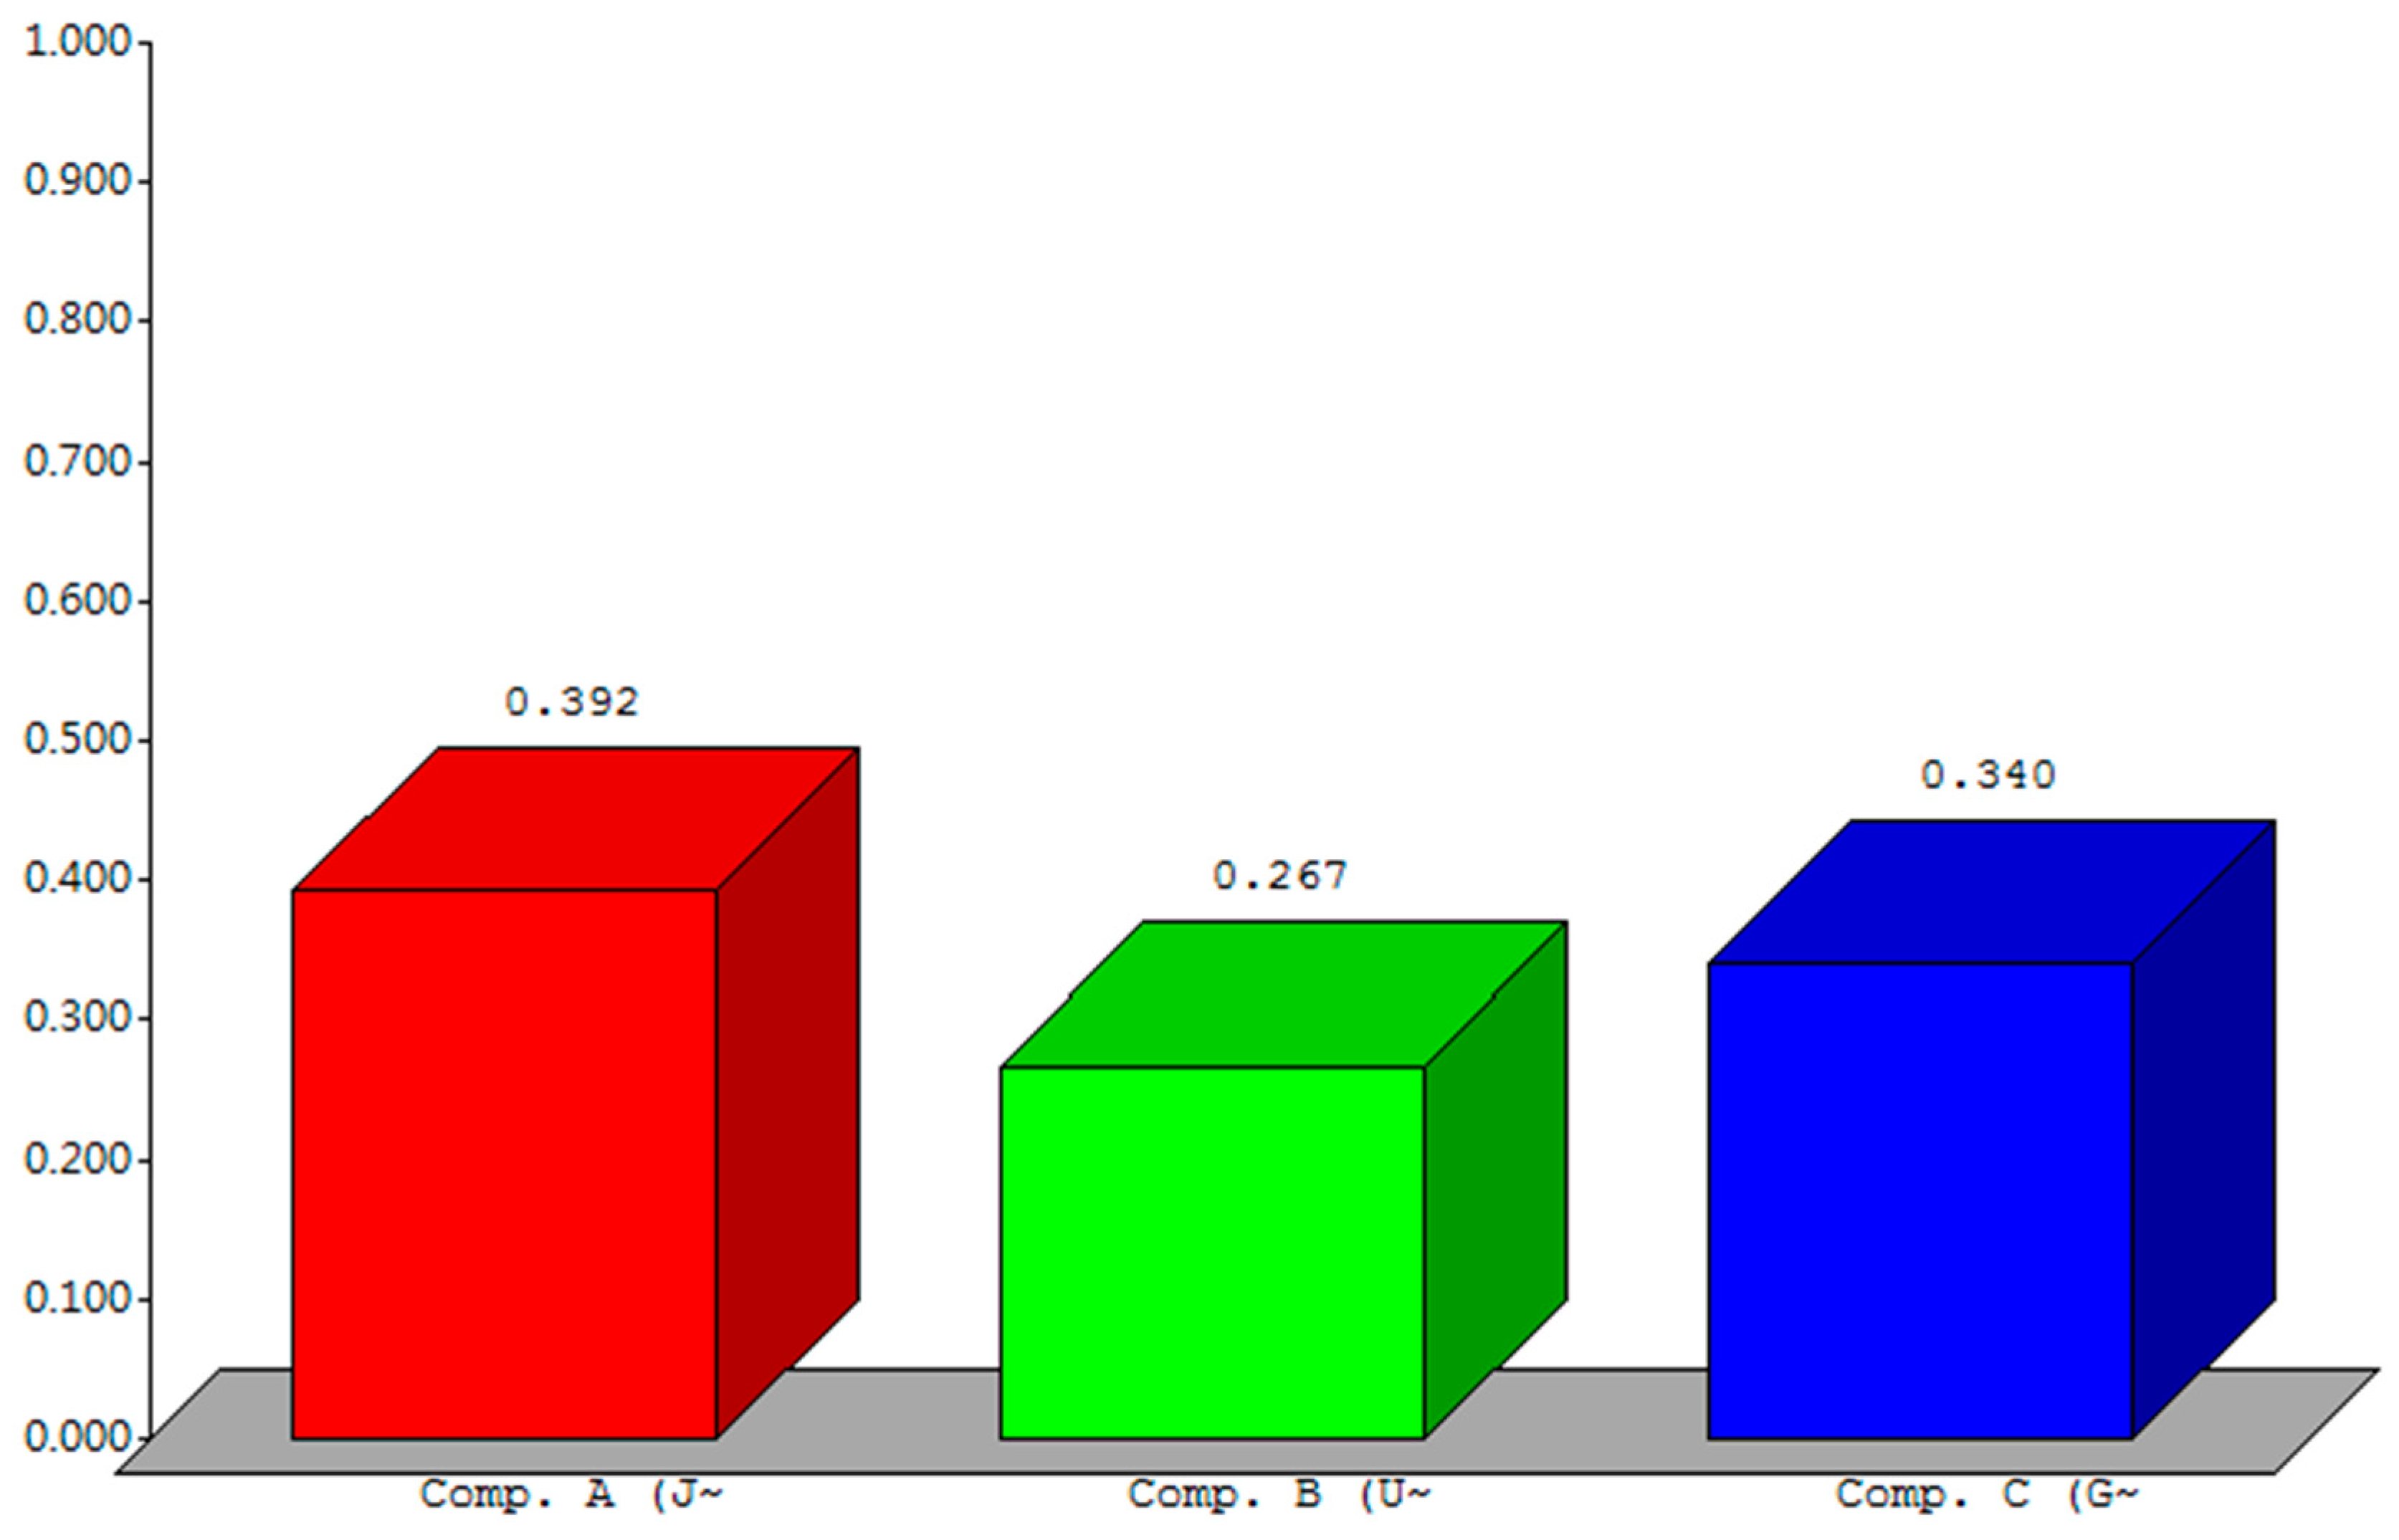
- Step 4: Select the best alternative solution.
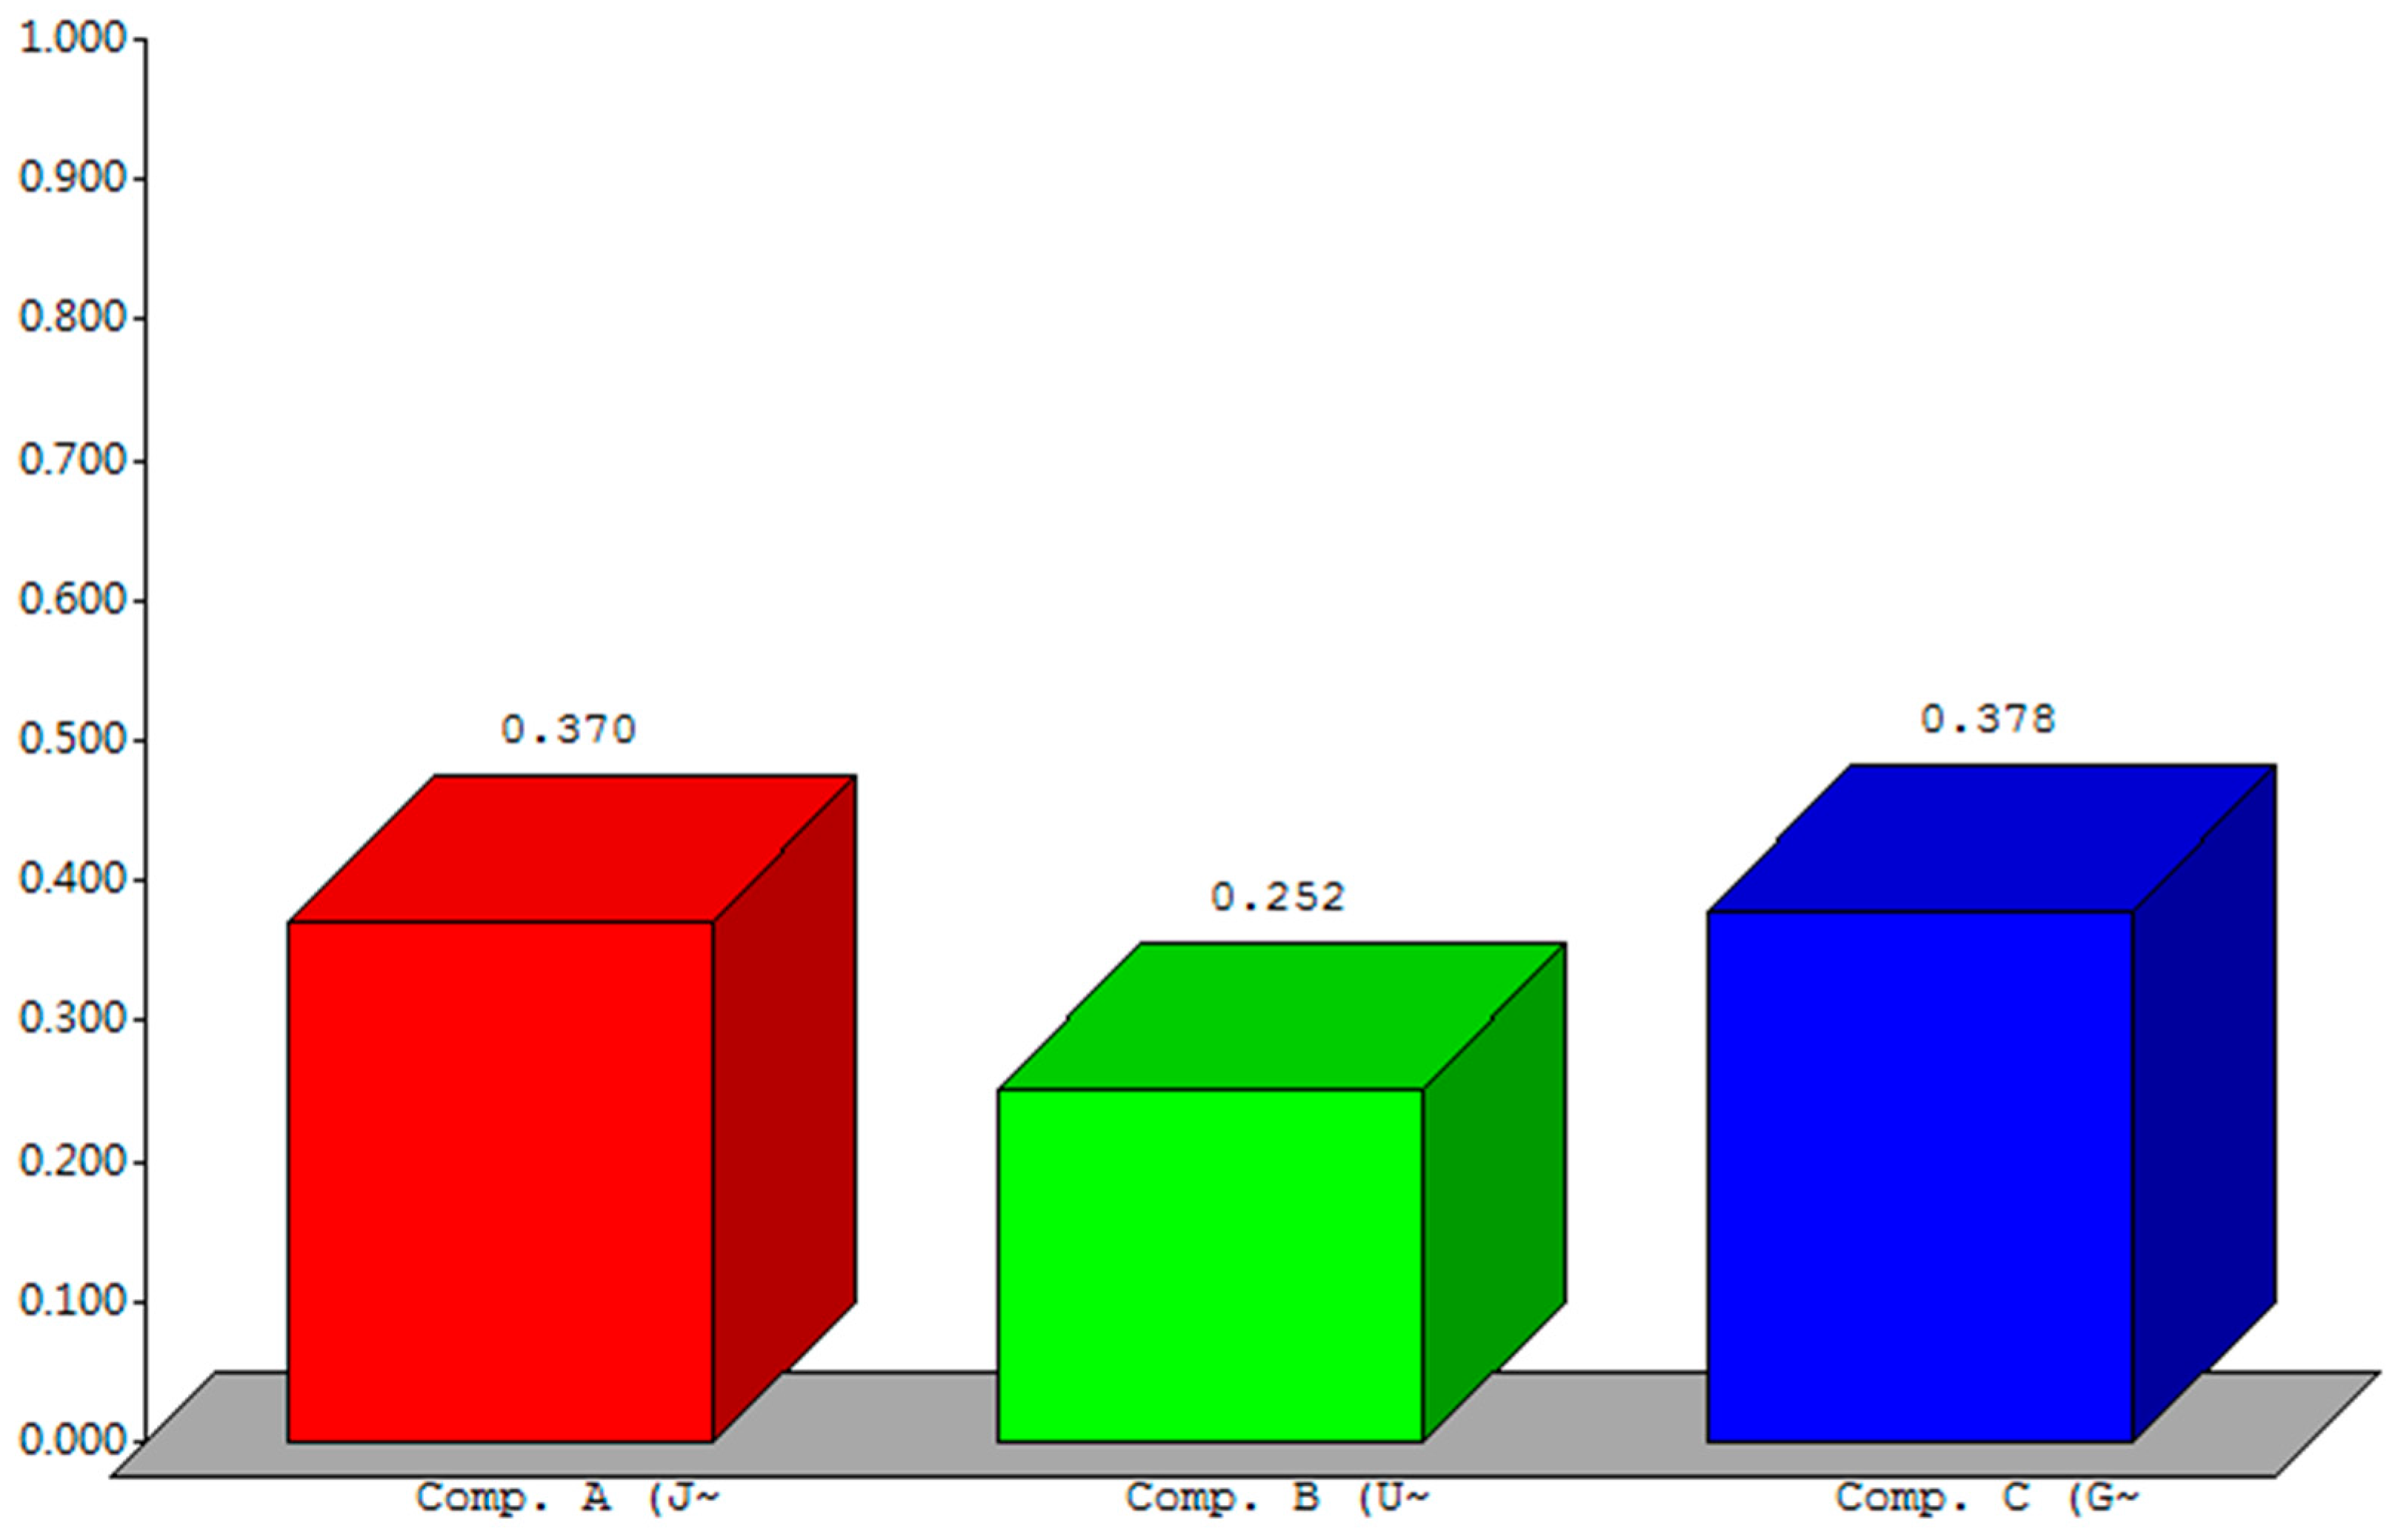
- Step 5: Conduct sensitivity analysis.
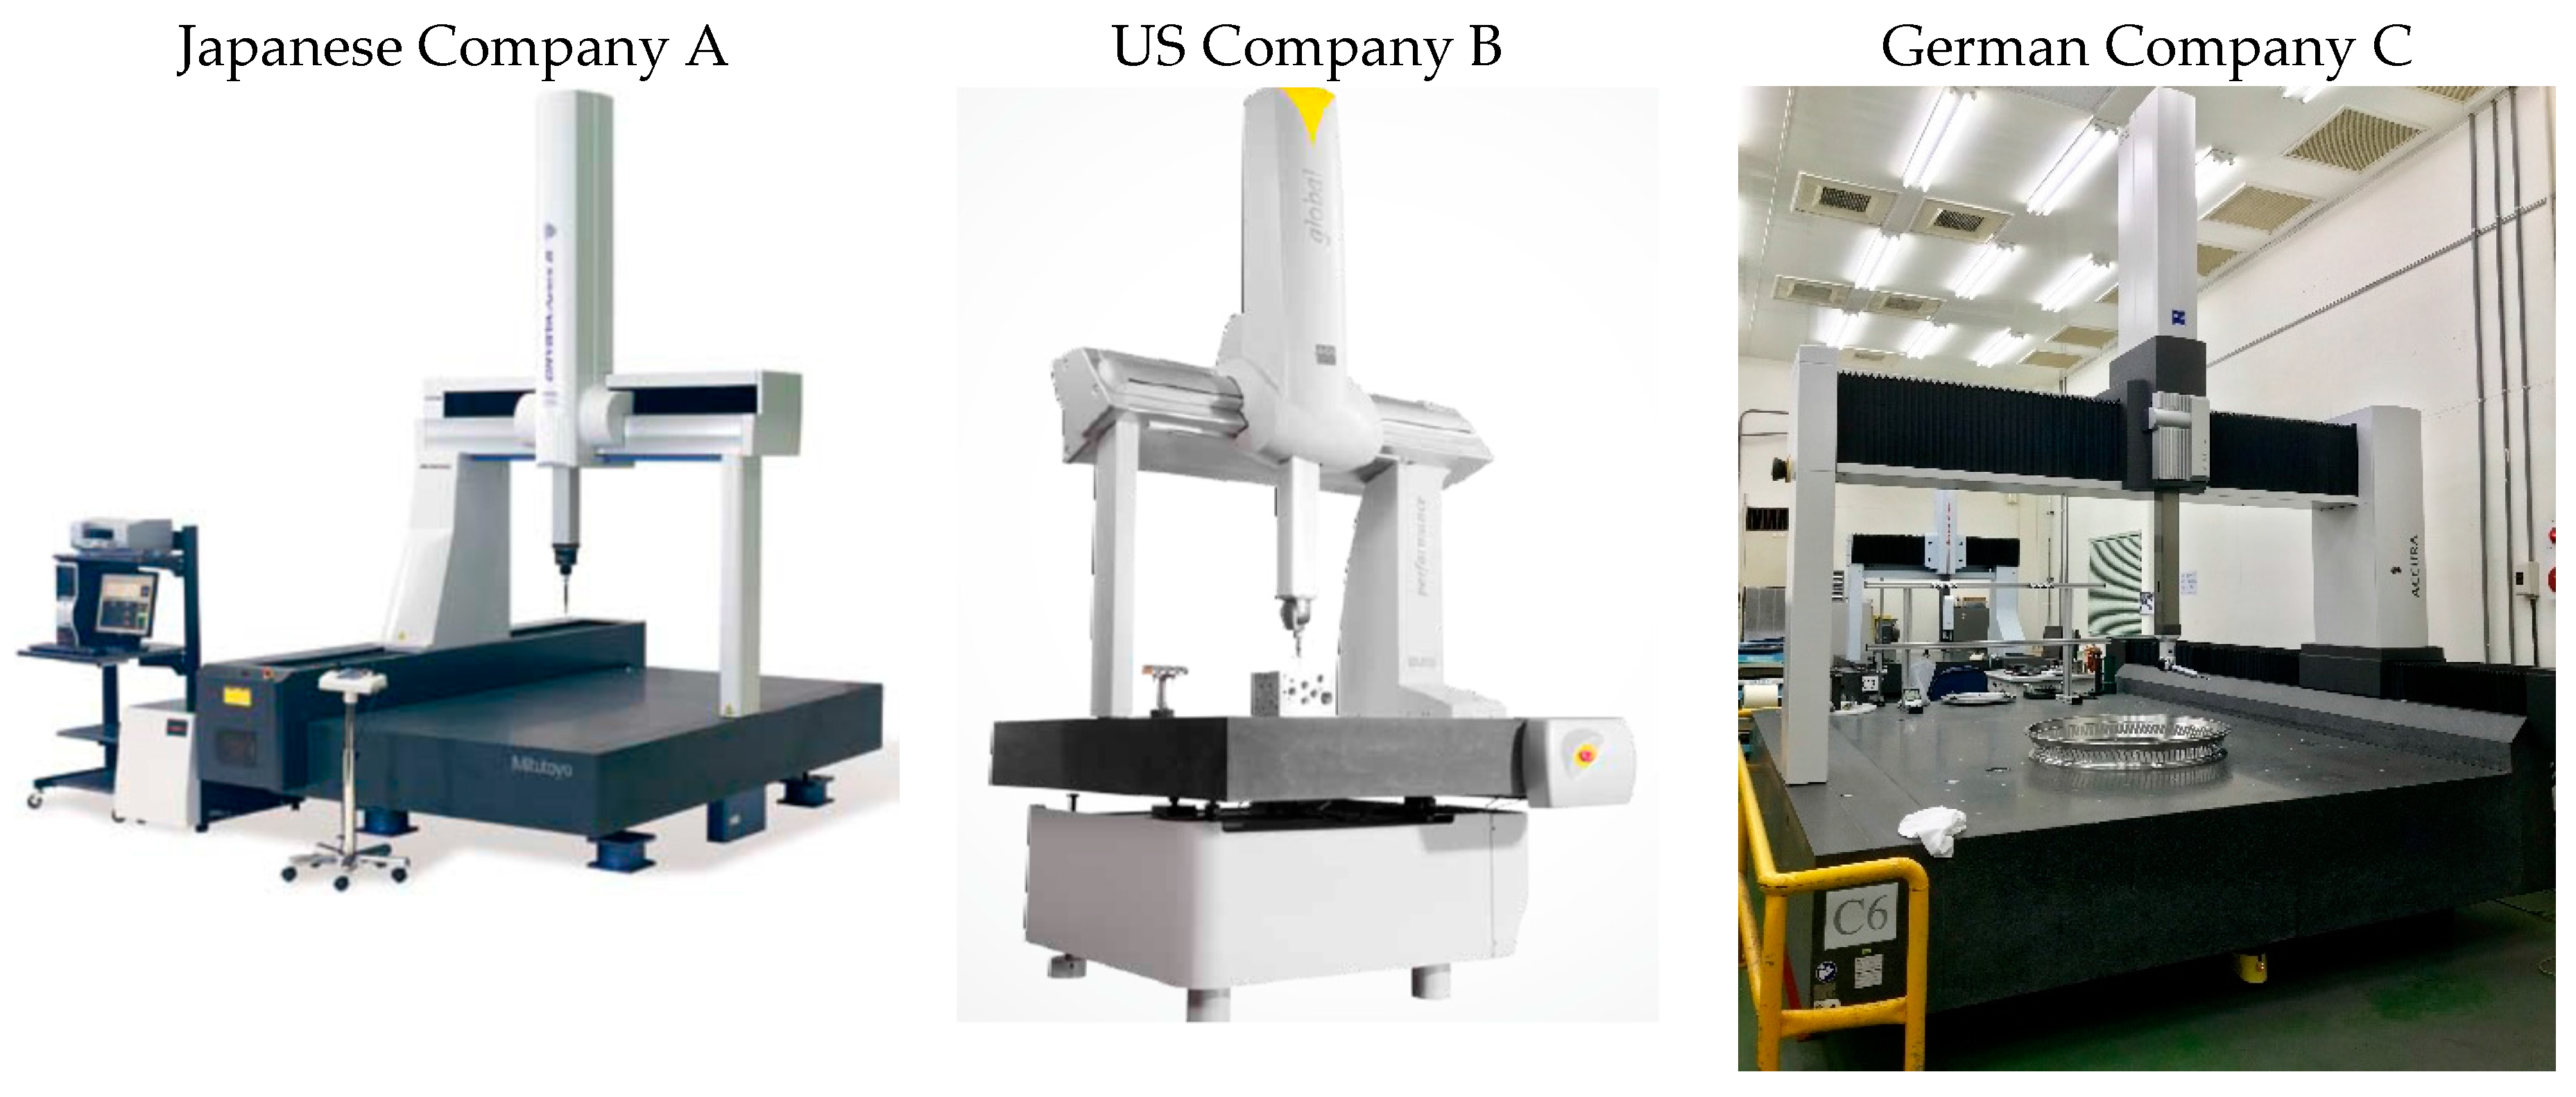
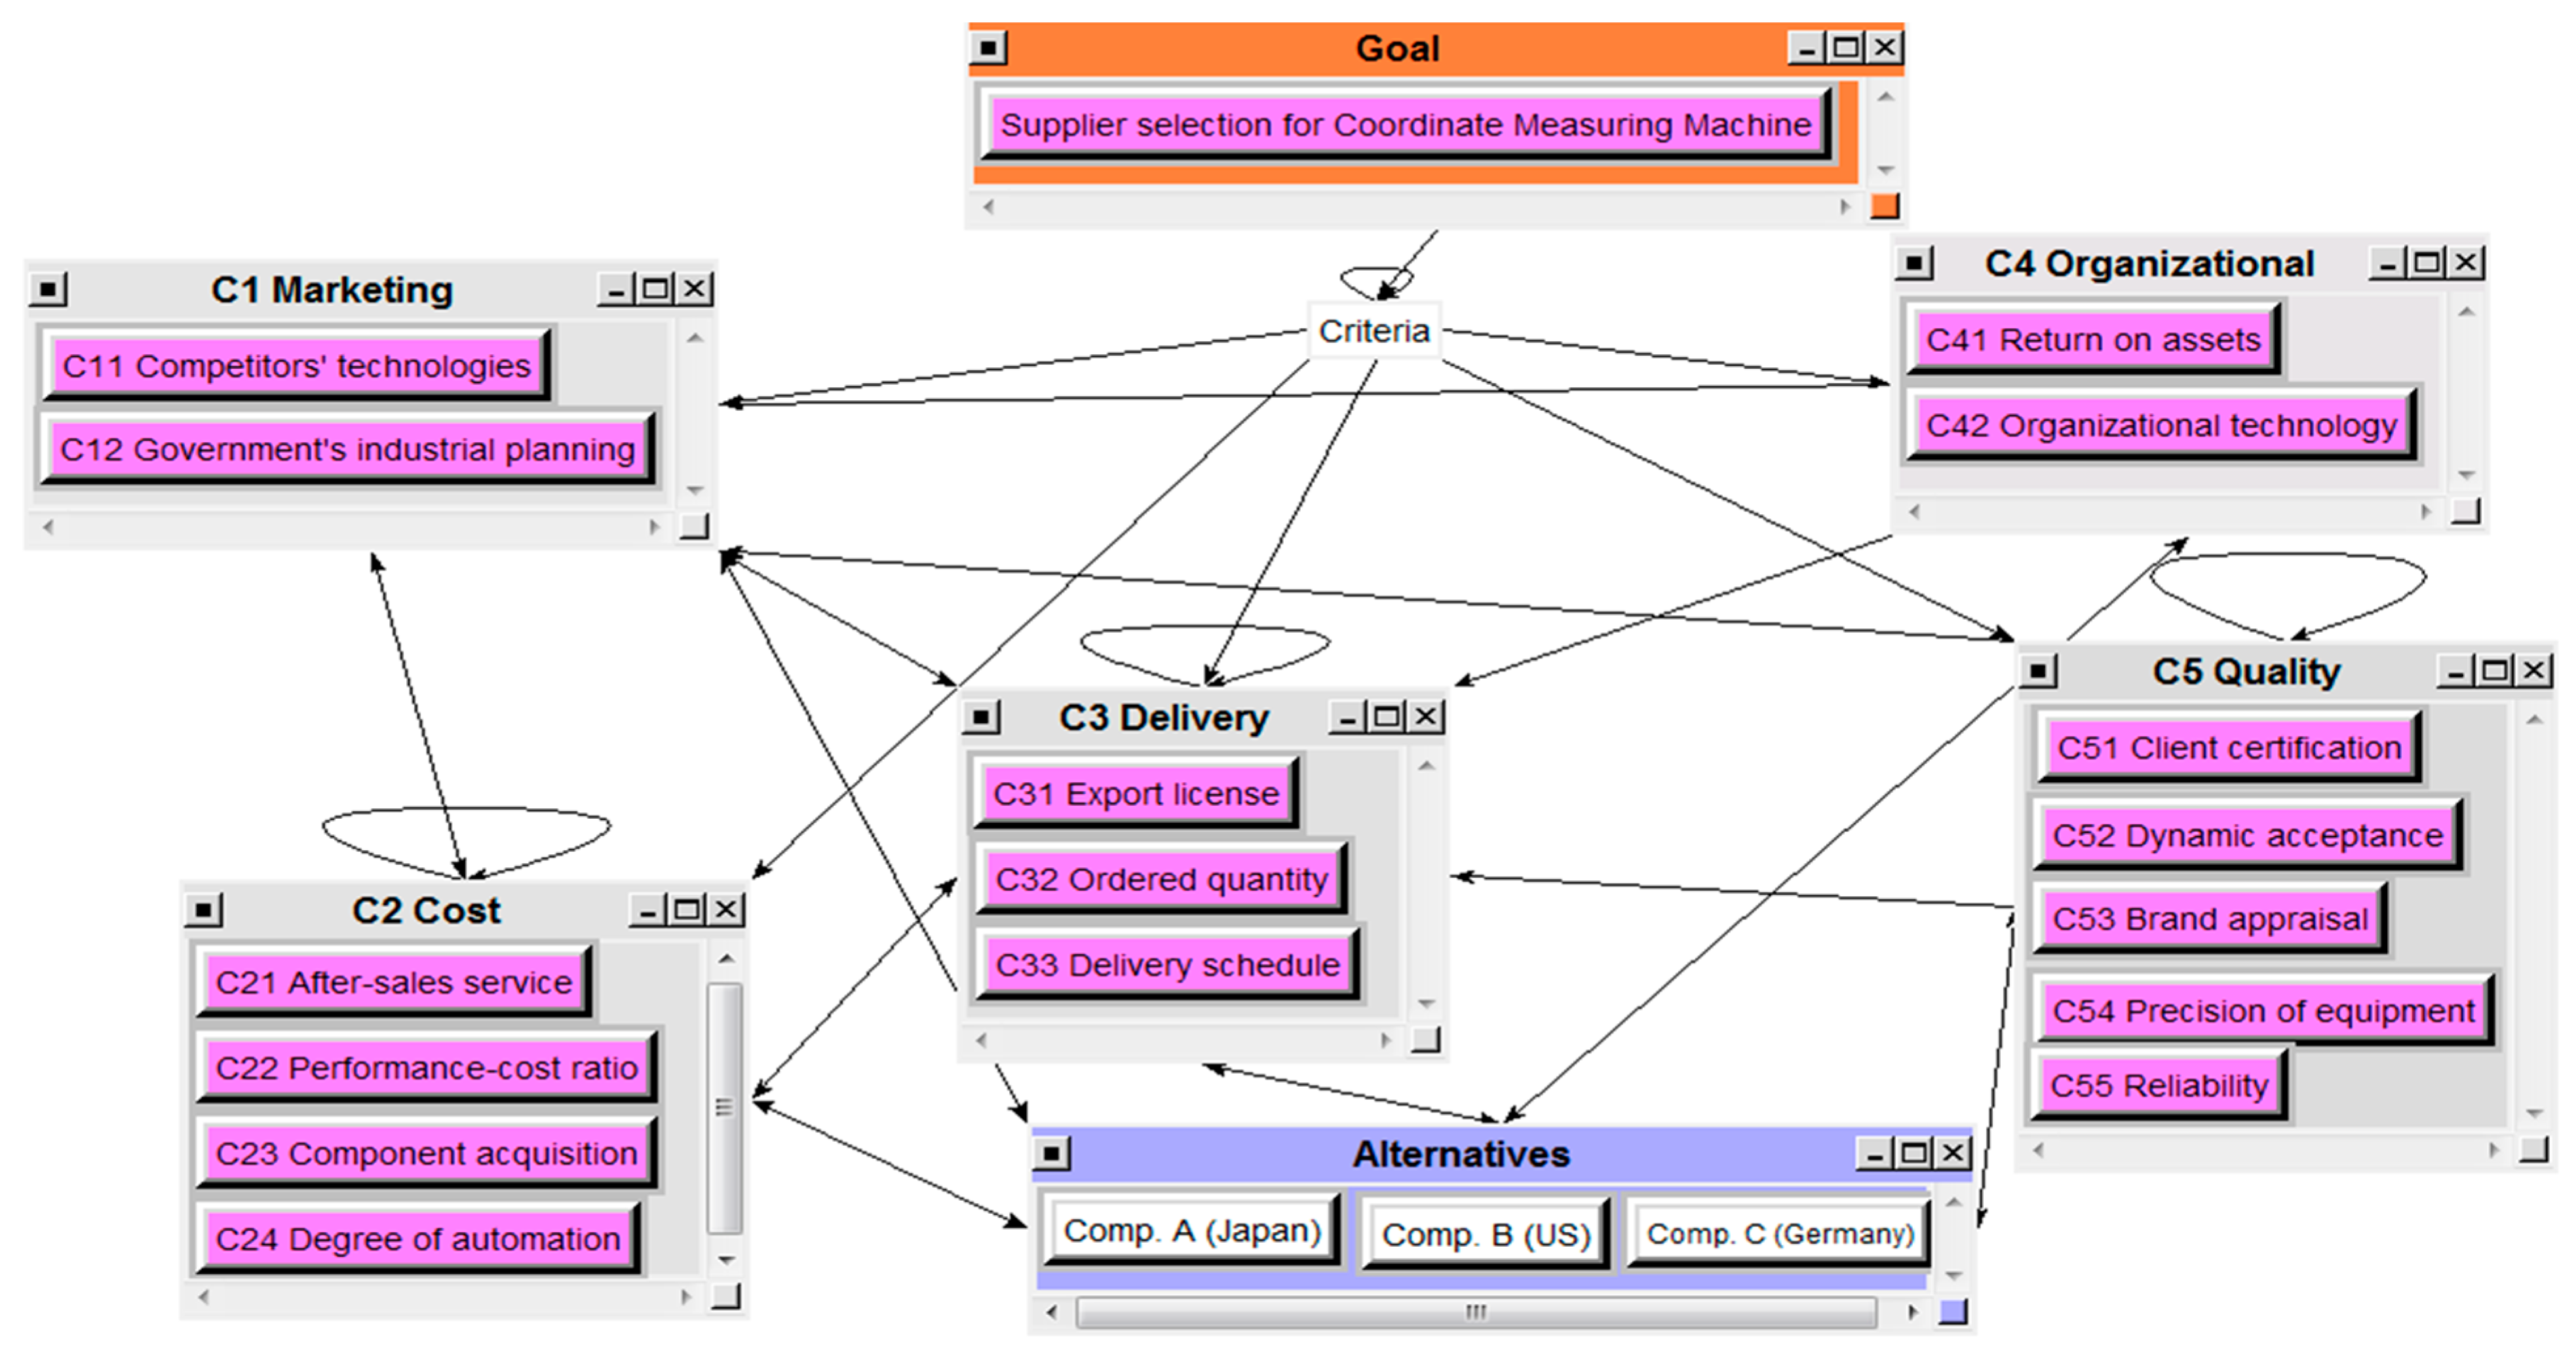
4. Application of the Model to Aerowin
5. Conclusions
Acknowledgments
Author Contributions
Conflicts of Interest
References
- International Air Transport Association, 20 Year Passenger Forecast. Available online: http://www.iata.org/publications/store/pages/20-year-passenger-forecast.aspx (accessed on 7 February 2017).
- Jiang, S.Y. Driving Force of Taiwan’s Machine Tool Industry Toward Industry 4.0: Aerospace Industry; TrendForce: Topology Research Institute, Taipei, Taiwan, 2017. [Google Scholar]
- AIDC. Communications. Conception and Implementation Status of Taiwan’s Aerospace Team 4.0 Alliance; AIDC Newsletter Team: Taichung, Taiwan, 2016; pp. 1–8. [Google Scholar]
- Donald, R.; O’Shaughnessy, J.L. Decision Criteria Used in Buying Different Categories of Products. J. Purch. Mater. Manag. 1982, 18, 9–14. [Google Scholar]
- McCutcheon, D.M.; Grant, R.A.; Hartley, J. Determinants of New Product Designer’s Satisfaction with Suppliers’ Contributions. J. Eng. Technol. Manag. 1997, 14, 273–290. [Google Scholar] [CrossRef]
- Goffin, K.; Szwejczewski, M.; New, C. Managing suppliers: When fewer can mean more. Int. J. Phys. Distrib. Logist. Manag. 1997, 27, 422–436. [Google Scholar] [CrossRef]
- Byun, D.H. The AHP approach for selecting an automobile purchase model. Inf. Manag. 2001, 38, 289–297. [Google Scholar] [CrossRef]
- Bharadwaj, N. Investigating the Decision Criteria Used in Electronic Components Procurement. Ind. Mark. Manag. 2004, 33, 317–323. [Google Scholar] [CrossRef]
- Liao, J.J. A Study of the Supplier Evaluation & Selection Mode in the Short-Run Manufacturing Sector: Exemplified by an Aerospace Industrial Company. Master’s Thesis, I-Shou University, Kaohsiung, Taiwan, June 2004. [Google Scholar]
- Supply-Chain Operations Reference-Model Version 7.0 Overview. Available online: http://www.supply-chain.org/ (accessed on 30 September 2005).
- Ávila, P.; Mota, A.; Pires, A.; Bastos, J.; Putnik, G.; Teixeira, J. Supplier’s Selection Model based on an Empirical Study. Proced. Technol. 2012, 5, 525–634. [Google Scholar] [CrossRef]
- Syu, J.B. Procurement and Supply Management, 4th ed.; Best Wise Publishing Co., Ltd.: Taipei, Taiwan, 2014. [Google Scholar]
- Francisco, R.L.J.; Osiro, L.; Carpinetti, L.C.R. A comparison between Fuzzy AHP and Fuzzy TOPSIS methods to supplier selection. Appl. Soft Comput. 2014, 21, 194–209. [Google Scholar]
- Jafar, R.; Fahim, P.B.M.; Tavasszy, L. Supplier selection in the airline retail industry using a funnel methodology: Conjunctive screening method and fuzzy AHP. Expert Syst. Appl. 2014, 41, 8165–8179. [Google Scholar]
- Lin, H.F.; Huang, Y.W. Using analytic network process to measure the determinants of low cost carriers purchase intentions: A comparison of potential and current customers. J. Air Transp. Manag. 2015, 49, 9–16. [Google Scholar] [CrossRef]
- Erginel, N.; Gecer, A. Fuzzy multi-objective decision model for calibration supplier selection problem. Comput. Ind. Eng. 2016, 102, 166–174. [Google Scholar] [CrossRef]
- Seyyed, A.D.; Siew, I.N.; Yuhanis, A.A.; Jo, A.H. An investigation of key competitiveness indicators and drivers of full-service airlines using Delphi and AHP techniques. J. Air Transp. Manag. 2016, 52, 23–34. [Google Scholar]
- Luthra, S.; Govindan, K.; Kannan, D.; Mangla, S.K.; Garg, C.P. An integrated framework for sustainable supplier selection and evaluation in supply chains. J. Clean. Prod. 2017, 140, 1686–1698. [Google Scholar] [CrossRef]
- Chou, Y.C.; Yang, C.H.; Lu, C.H.; Dang, V.T.; Yang, P.A. Building Criteria for Evaluating Green Project Management: An Integrated Approach of DEMATEL and ANP. Sustainability 2017, 9, 740. [Google Scholar] [CrossRef]
- Saaty, T.L. Decision Making with Dependence and Feedback: The Analytic Network Process; RWS Publications: Pittsburgh, PA, USA, 1996. [Google Scholar]
- Meade, L.M.; Sarkis, J. Analyzing Organizational Project Alternatives for Agile Manufacturing Processes: An Analytical Network Approach. Int. J. Prod. Res. 1999, 37, 241–261. [Google Scholar] [CrossRef]
- Cheng, E.W.L.; Li, H. Analytic Network Process Applied to Project Selection. J. Constr. Eng. Manag. 2005, 131, 459–466. [Google Scholar] [CrossRef]
- Saaty, T.L. The Analytic Hierarchy Process; McGraw-Hill: New York, NY, USA, 1980. [Google Scholar]
- Linstone, H.A.; Murray, T. The Delphi Method: Techniques and Applications; Addison-Wesley Publishing Company: Boston, MA, USA, 1975. [Google Scholar]
- Murry, J.W.; Hammons, J.O. Delphi: A Versatile Methodology for Conducting Qualitative Research. The Review of Higher Education 1995, 18, 423–436. [Google Scholar] [CrossRef]
- CNC 3D Measuring Machine. Available online: http://saas5.startialab.com/acti_books/491/6411/_SWF_Window.html (accessed on 4 February 2018).
- Coordinate Measuring Machines. Available online: http://www.hexagonmi.com/products/coordinate-measuring-machines (accessed on 14 February 2018).
- ZEISS ACCURA Bridge-Type Measuring Machine. Available online: https://www.zeiss.com/metrology/products/systems/bridge-type-cmms/accura.html (accessed on 14 April 2018).
- Dickson, G.W. An Analysis of Supplier Selection System and Decision. J. Purch. 1966, 2, 5–17. [Google Scholar] [CrossRef]
- Croom, S.R. The dyadic capabilities concept: Examining the processes of key supplier involvement in collaborative product development. Eur. J. Purch. Suppl. Manag. 2001, 7, 29–37. [Google Scholar] [CrossRef]
- Deshmukh, A.J.; Chaudhari, A.A. A Review for Supplier Selection Criteria and Methods. Technol. Syst. Manag. 2011, 145, 283–291. [Google Scholar]
- ISO/IEC 9126. Information Technology-Software Product Evaluation-Quality Characteristics and Guidelines for their Use; International Standard Organization: Geneva, Switzerland, 1991. [Google Scholar]
- Morehouse, D. Essential of TQM, 2nd ed.; Taylor & Francis: Gower, Aldershot, UK, 1996. [Google Scholar]
- Kast, F.; Rosenzweig, J.E. Organization and Management: Systems Approach (Management); McGraw-Hill Education: New York, NY, USA, 1974. [Google Scholar]
- Feigenbaum, A.V. Total Quality Control; McGraw-Hill: New York, NY, USA, 1961. [Google Scholar]
- Lin, C.T.; Chang, C.W.; Chen, C.B. Grey Relational Analysis Evaluation of Digital Video Recorder System. J. Inf. Optim. Sci. 2005, 26, 123–133. [Google Scholar]
- Chang, C.W.; Wu, C.R.; Lin, C.T.; Chen, H.C. An Application of AHP and Sensitivity Analysis for Selecting the Best Slicing Machine. Comput. Ind. Eng. 2007, 55, 296–307. [Google Scholar] [CrossRef]
- Chang, C.W. Constructing an Evaluation Model to Assess the Supply Chain Management System in the Taiwan Semiconductor Industry. J. Test. Eval. 2016, 44, 183–193. [Google Scholar] [CrossRef]
- Parente, F.; Anderson, P.J. Delphi inquiry systems. In Judgmental Forecasting; Wright, G., Ayton, P., Eds.; John Wiley and Sons: New York, NY, USA, 1987; pp. 129–156. [Google Scholar]
- Faherty, V. Continuing social work education: Results of a Delphi survey. J. Educ. Soc. Work 1979, 15, 12–19. [Google Scholar] [CrossRef]


 indicates interdependence between criteria.
indicates interdependence between criteria.
indicates interdependence between criteria.


| Criteria | Definition | Documentation | Sub-criteria |
|---|---|---|---|
| Market factors | Manufacturer evaluation involves factors such as brand image, manufacturing cost, delivery schedule and performance-cost ratio. | [17,29,30,31] | Product type Industry trends Competitors’ technologies Governmental industrial planning |
| Cost | Costs refer to expenses that are incurred by the production department for manufacturing products or providing services, including various direct and manufacturing expenses. | [10,30,32,33] | After-sale service Performance-cost ratio Safety devices Added value of productivity Component acquisition Reduction in labor time Requirements for manufacturing processes Degree of automation Equipment compatibility Warranty cost |
| Delivery | Delivery involves the lead time of administrative operations, purchase of raw materials, manufacture, transport, inspection and acceptance and contingency handling. | [10,12] | Export license Delivery time Punctual delivery Ordered quantity Delivery schedule Order fulfillment Response speed Terms of trade |
| Organizational planning | According to the actual conditions of the workshops, the company’s manufacture procedure and quality assurance departments, the fitness for use is evaluated and the requirements for manufacture and maximum equipment load in respect of the machines to be purchased are determined. | [33] | Fitness for use Return on assets Product selection Organizational technology |
| Information factors | Regarding new machines to be purchased, the company evaluates the reduction in labor time, industry status, maintainability and serviceability according to information provided by the manufacturers. | [17,34] | Information acquisition Industry status Equipment status Support from the information system |
| Quality | Quality assurance is to define, create and control quality-related costs and evaluate and determine whether products or services meet the requirements for quality, reliability and safety and control the costs incurred in the factory or by the customers in respect of non-conforming products or services. | [35,36,37,38] | Client certification Dynamic acceptance Brand appraisal Precision of equipment Industrial safety specifications Differences in equipment between Taiwan and overseas countries/regions Maximum load of equipment Reliability |
| Source of Experts | Members | Quantity | Percentage |
|---|---|---|---|
| Industrial circle | Three members of Aerowin, two members of AirAsia, two members of Magnate Technology, two members of GMTC, three members of AIDC and two members of Drewloong | 14 | 50.00 |
| Government circle | Four members of the Ministry of Economic Affairs and two members of the National Development Council | 6 | 21.43 |
| Academic circle | Three members of academic institutions, two members from the Metal Industries Research & Development Center and three members of the Industrial Technology Research Institute | 8 | 28.57 |
| Total | 28 | 100 | |
| Criteria | Importance | Quartile Deviation | Delete if Reaching a Consensus | Sub-Criteria | Importance | Quartile Deviation | Delete if Reaching a Consensus |
|---|---|---|---|---|---|---|---|
| Market factors | 4.37 | 0.61 | Consensus not reached | Product type | 3.89 | 0.48 | Delete |
| Industry trend | 4.29 | 0.72 | Delete | ||||
| Competitors’ technologies | 4.78 | 0.79 | Consensus not reached | ||||
| Government’s industrial planning | 3.86 | 0.46 | Consensus not reached | ||||
| Cost | 4.67 | 0.76 | Consensus not reached | After-sale service | 4.52 | 0.76 | Consensus not reached |
| Performance-cost ratio | 4.81 | 0.81 | Consensus not reached | ||||
| Safety device | 4.21 | 0.49 | Delete | ||||
| Added value of productivity | 3.81 | 0.43 | Delete | ||||
| Component acquisition | 4.82 | 0.83 | Consensus not reached | ||||
| Reduction in labor time | 4.11 | 0.44 | Delete | ||||
| Requirements for manufacture procedure | 3.96 | 0.48 | Delete | ||||
| Degree of automation | 4.28 | 0.71 | Consensus not reached | ||||
| Equipment compatibility | 3.36 | 0.43 | Delete | ||||
| Warranty cost | 3.92 | 0.45 | Delete | ||||
| Delivery | 4.42 | 0.66 | Consensus not reached | Export license | 4.98 | 0.93 | Consensus not reached |
| Delivery time | 3.97 | 0.48 | Delete | ||||
| Punctual delivery | 3.57 | 0.37 | Delete | ||||
| Ordered quantity | 4.87 | 0.87 | Consensus not reached | ||||
| Delivery schedule | 4.79 | 0.85 | Consensus not reached | ||||
| Order fulfillment | 3.89 | 0.47 | Delete | ||||
| Response speed | 3.77 | 0.45 | Delete | ||||
| Terms of trade | 3.76 | 0.47 | Delete | ||||
| Organizational planning | 4.27 | 0.54 | Consensus not reached | Fitness for use | 3.32 | 0.32 | Delete |
| Return on assets | 4.38 | 0.67 | Consensus not reached | ||||
| Product selection | 3.61 | 0.36 | Delete | ||||
| Organizational technology | 4.52 | 0.74 | Consensus not reached | ||||
| Information factors | 3.89 | 0.48 | Delete | Information acquisition | 3.13 | 0.35 | Delete |
| Industry status | 3.26 | 0.37 | Delete |
| Criteria | Marketing (C1) | Cost (C2) | Delivery (C3) | Organizational Planning (C4) | Quality (C5) | Weight |
|---|---|---|---|---|---|---|
| Marketing (C1) | 1 | 2.195 | 1.266 | 0.922 | 2.711 | 0.110 |
| Cost (C2) | 0.456 | 1 | 0.576 | 0.420 | 1.235 | 0.242 |
| Delivery (C3) | 0.790 | 1.735 | 1 | 0.728 | 2.142 | 0.139 |
| Organizational planning (C4) | 1.085 | 2.381 | 1.373 | 1 | 2.941 | 0.101 |
| Quality (C5) | 0.369 | 0.810 | 0.467 | 0.340 | 1 | 0.298 |
| Sub-Criteria under Criterion C1 | Competitor’s Technologies (C11) | Governmental Industrial Planning (C12) | Weight |
|---|---|---|---|
| Competitor’s Technologies (C11) | 1 | 1.214 | 0.548 |
| Government’s Industrial Planning (C12) | 0.824 | 1 | 0.452 |
| Criteria | Criterion Weight (w21) | Sub-Criteria | Sub-Criterion Weight (w32) |
|---|---|---|---|
| C1 | 0.110 | C11 | 0.548 |
| C12 | 0.452 | ||
| C2 | 0.242 | C21 | 0.290 |
| C22 | 0.365 | ||
| C23 | 0.190 | ||
| C24 | 0.156 | ||
| C3 | 0.139 | C31 | 0.650 |
| C32 | 0.214 | ||
| C33 | 0.136 | ||
| C4 | 0.101 | C41 | 0.556 |
| C42 | 0.444 | ||
| C5 | 0.298 | C51 | 0.343 |
| C52 | 0.221 | ||
| C53 | 0.106 | ||
| C54 | 0.167 | ||
| C55 | 0.162 |
| Goal | C1 | C2 | C3 | C4 | C5 | C11 | C12 | C21 | C22 | C23 | C24 | C31 | C32 | C33 | C41 | C42 | C51 | C52 | C53 | C54 | C55 | A | B | C | |
|---|---|---|---|---|---|---|---|---|---|---|---|---|---|---|---|---|---|---|---|---|---|---|---|---|---|
| Goal | 0 | 0 | 0 | 0 | 0 | 0 | 0 | 0 | 0 | 0 | 0 | 0 | 0 | 0 | 0 | 0 | 0 | 0 | 0 | 0 | 0 | 0 | 0 | 0 | 0 |
| C1 | 0.128 | 0 | 0 | 0 | 0 | 0 | 0.000 | 0.000 | 0.000 | 0.000 | 0.000 | 0.000 | 0.000 | 0.000 | 0.000 | 0.000 | 0.000 | 0.000 | 0.000 | 0.000 | 0.000 | 0.000 | 0 | 0 | 0 |
| C2 | 0.281 | 0 | 0 | 0 | 0.226 | 0.499 | 0.000 | 0.000 | 0.000 | 0.000 | 0.000 | 0.000 | 0.000 | 0.000 | 0.000 | 0.000 | 0.000 | 0.000 | 0.000 | 0.000 | 0.000 | 0.000 | 0 | 0 | 0 |
| C3 | 0.162 | 0.583 | 0.430 | 0 | 0.349 | 0.321 | 0.000 | 0.000 | 0.000 | 0.000 | 0.000 | 0.000 | 0.000 | 0.000 | 0.000 | 0.000 | 0.000 | 0.000 | 0.000 | 0.000 | 0.000 | 0.000 | 0.548 | 0.167 | 0.200 |
| C4 | 0.118 | 0.417 | 0 | 0.350 | 0 | 0.180 | 0.000 | 0.000 | 0.000 | 0.000 | 0.000 | 0.000 | 0.000 | 0.000 | 0.000 | 0.000 | 0.000 | 0.000 | 0.000 | 0.000 | 0.000 | 0.000 | 0.452 | 0.833 | 0.800 |
| C5 | 0.311 | 0 | 0.570 | 0.650 | 0.424 | 0 | 0.000 | 0.000 | 0.000 | 0.000 | 0.000 | 0.000 | 0.000 | 0.000 | 0.000 | 0.000 | 0.000 | 0.000 | 0.000 | 0.000 | 0.000 | 0.000 | 0.553 | 0.176 | 0.188 |
| C11 | 0.000 | 0.548 | 0 | 0 | 0 | 0 | 0 | 0 | 0.500 | 0.250 | 0.167 | 0.200 | 0.167 | 0.200 | 0.167 | 0.750 | 0.200 | 0.200 | 0.167 | 0.167 | 0.200 | 0.143 | 0.202 | 0.349 | 0.428 |
| C12 | 0.000 | 0.452 | 0 | 0 | 0 | 0 | 0 | 0 | 0.500 | 0.750 | 0.833 | 0.800 | 0.833 | 0.800 | 0.833 | 0.250 | 0.800 | 0.800 | 0.833 | 0.833 | 0.800 | 0.857 | 0.062 | 0.056 | 0.055 |
| C21 | 0.000 | 0 | 0.290 | 0 | 0 | 0 | 0.288 | 0.334 | 0 | 0 | 0 | 0 | 0.323 | 0.510 | 0.508 | 0 | 0 | 0 | 0 | 0 | 0 | 0 | 0.183 | 0.420 | 0.330 |
| C22 | 0.000 | 0 | 0.365 | 0 | 0 | 0 | 0.381 | 0.224 | 0.750 | 0 | 0.800 | 0 | 0.214 | 0.221 | 0.270 | 0 | 0 | 0 | 0 | 0 | 0 | 0 | 0.131 | 0.094 | 0.195 |
| C23 | 0.000 | 0 | 0.190 | 0 | 0 | 0 | 0.059 | 0.274 | 0 | 0 | 0 | 0 | 0.059 | 0.063 | 0.049 | 0 | 0 | 0 | 0 | 0 | 0 | 0 | 0.208 | 0.184 | 0.088 |
| C24 | 0.000 | 0 | 0.156 | 0 | 0 | 0 | 0.273 | 0.168 | 0.25 | 0 | 0.200 | 0 | 0.404 | 0.206 | 0.173 | 0 | 0 | 0 | 0 | 0 | 0 | 0 | 0.661 | 0.722 | 0.717 |
| C31 | 0.000 | 0 | 0 | 0.650 | 0 | 0 | 0.510 | 0.497 | 0.492 | 0.125 | 0.085 | 0.085 | 0 | 0 | 0.250 | 0.069 | 0.208 | 0.429 | 0.167 | 0.240 | 0.143 | 0 | 0.800 | 0.750 | 0.333 |
| C32 | 0.000 | 0 | 0 | 0.214 | 0 | 0 | 0.200 | 0.212 | 0.159 | 0.125 | 0.177 | 0.177 | 0 | 0 | 0.750 | 0.191 | 0.131 | 0.429 | 0.167 | 0.210 | 0.143 | 0 | 0.200 | 0.250 | 0.667 |
| C33 | 0.000 | 0 | 0 | 0.136 | 0 | 0 | 0.291 | 0.291 | 0.349 | 0.750 | 0.738 | 0.738 | 1 | 1 | 0 | 0.741 | 0.661 | 0.143 | 0.667 | 0.550 | 0.714 | 0 | 0.247 | 0.218 | 0.223 |
| C41 | 0.000 | 0 | 0 | 0 | 0.556 | 0 | 0 | 0 | 0 | 0 | 0 | 0 | 0 | 0 | 0 | 0 | 0 | 0 | 0 | 0 | 0 | 0 | 0.234 | 0.180 | 0.231 |
| C42 | 0.000 | 0 | 0 | 0 | 0.444 | 0 | 0 | 0 | 0 | 0 | 0 | 0 | 0 | 0 | 0 | 0 | 0 | 0 | 0 | 0 | 0 | 0 | 0.148 | 0.173 | 0.159 |
| C51 | 0.000 | 0 | 0 | 0 | 0 | 0.343 | 0 | 0 | 0 | 0 | 0 | 0 | 0 | 0 | 0 | 0 | 0 | 0 | 0.169 | 0.121 | 0 | 0.250 | 0.144 | 0.190 | 0.190 |
| C52 | 0.000 | 0 | 0 | 0 | 0 | 0.221 | 0 | 0 | 0 | 0 | 0 | 0 | 0 | 0 | 0 | 0 | 0 | 0.251 | 0 | 0.575 | 0.200 | 0.750 | 0.227 | 0.239 | 0.196 |
| C53 | 0.000 | 0 | 0 | 0 | 0 | 0.106 | 0 | 0 | 0 | 0 | 0 | 0 | 0 | 0 | 0 | 0 | 0 | 0.673 | 0.469 | 0 | 0.800 | 0 | 0 | 0 | 0 |
| C54 | 0.000 | 0 | 0 | 0 | 0 | 0.167 | 0 | 0 | 0 | 0 | 0 | 0 | 0 | 0 | 0 | 0 | 0 | 0 | 0.308 | 0.304 | 0 | 0 | 0 | 0 | 0 |
| C55 | 0.000 | 0 | 0 | 0 | 0 | 0.162 | 0 | 0 | 0 | 0 | 0 | 0 | 0 | 0 | 0 | 0 | 0 | 0.075 | 0.055 | 0 | 0 | 0 | 0 | 0 | 0 |
| A | 0 | 0 | 0 | 0.361 | 0.400 | 0.403 | 0.395 | 0.388 | 0.405 | 0.387 | 0.377 | 0.367 | 0.388 | 0.393 | 0.382 | 0.382 | 0.357 | 0.430 | 0.376 | 0 | 0 | 0 | 0 | 0 | 0 |
| B | 0 | 0 | 0 | 0.308 | 0.267 | 0.257 | 0.264 | 0.273 | 0.234 | 0.281 | 0.280 | 0.287 | 0.271 | 0.272 | 0.266 | 0.275 | 0.303 | 0.232 | 0.269 | 0 | 0 | 0 | 0 | 0 | 0 |
| C | 0 | 0 | 0 | 0.330 | 0.333 | 0.340 | 0.341 | 0.339 | 0.361 | 0.331 | 0.342 | 0.346 | 0.341 | 0.335 | 0.352 | 0.344 | 0.340 | 0.338 | 0.355 | 0 | 0 | 0 | 0 | 0 | 0 |
| Goal | C1 | C2 | C3 | C4 | C5 | C11 | C12 | C21 | C22 | C23 | C24 | C31 | C32 | C33 | C41 | C42 | C51 | C52 | C53 | C54 | C55 | A | B | C | |
|---|---|---|---|---|---|---|---|---|---|---|---|---|---|---|---|---|---|---|---|---|---|---|---|---|---|
| Goal | 0 | 0 | 0 | 0 | 0 | 0 | 0 | 0 | 0 | 0 | 0 | 0 | 0 | 0 | 0 | 0 | 0 | 0 | 0 | 0 | 0 | 0 | 0 | 0 | 0 |
| C1 | 0.128 | 0 | 0 | 0 | 0 | 0 | 0 | 0 | 0 | 0 | 0 | 0 | 0 | 0 | 0 | 0 | 0 | 0 | 0 | 0 | 0 | 0 | 0 | 0 | |
| C2 | 0.281 | 0 | 0 | 0 | 0.117 | 0.133 | 0 | 0 | 0 | 0 | 0 | 0 | 0 | 0 | 0 | 0 | 0 | 0 | 0 | 0 | 0 | 0 | 0 | 0 | |
| C3 | 0.162 | 0.290 | 0.133 | 0 | 0.181 | 0.086 | 0 | 0 | 0 | 0 | 0 | 0 | 0 | 0 | 0 | 0 | 0 | 0 | 0 | 0 | 0 | 0 | 0 | 0 | |
| C4 | 0.118 | 0.207 | 0 | 0.154 | 0 | 0.048 | 0 | 0 | 0 | 0 | 0 | 0 | 0 | 0 | 0 | 0 | 0 | 0 | 0 | 0 | 0 | 0 | 0 | 0 | |
| C5 | 0.311 | 0 | 0.177 | 0.285 | 0.220 | 0 | 0 | 0 | 0 | 0 | 0 | 0 | 0 | 0 | 0 | 0 | 0 | 0 | 0 | 0 | 0 | 0 | 0 | 0 | |
| C11 | 0 | 0.276 | 0 | 0 | 0 | 0 | 0 | 0 | 0.092 | 0.069 | 0.031 | 0.055 | 0.028 | 0.034 | 0.028 | 0.252 | 0.067 | 0.035 | 0.029 | 0.029 | 0.035 | 0.039 | 0.085 | 0.026 | 0.031 |
| C12 | 0 | 0.227 | 0 | 0 | 0 | 0 | 0 | 0 | 0.092 | 0.207 | 0.153 | 0.220 | 0.141 | 0.135 | 0.141 | 0.084 | 0.269 | 0.140 | 0.146 | 0.146 | 0.140 | 0.236 | 0.070 | 0.129 | 0.124 |
| C21 | 0 | 0 | 0.200 | 0 | 0 | 0 | 0.102 | 0.119 | 0 | 0 | 0 | 0 | 0.140 | 0.221 | 0.221 | 0 | 0 | 0 | 0 | 0 | 0 | 0 | 0.141 | 0.045 | 0.048 |
| C22 | 0 | 0 | 0.251 | 0 | 0 | 0 | 0.135 | 0.080 | 0.250 | 0 | 0.267 | 0 | 0.093 | 0.096 | 0.117 | 0 | 0 | 0 | 0 | 0 | 0 | 0 | 0.052 | 0.089 | 0.109 |
| C23 | 0 | 0 | 0.131 | 0 | 0 | 0 | 0.021 | 0.097 | 0 | 0 | 0 | 0 | 0.026 | 0.027 | 0.021 | 0 | 0 | 0 | 0 | 0 | 0 | 0 | 0.016 | 0.014 | 0.014 |
| C24 | 0 | 0 | 0.107 | 0 | 0 | 0 | 0.097 | 0.060 | 0.083 | 0 | 0.067 | 0 | 0.176 | 0.089 | 0.075 | 0 | 0 | 0 | 0 | 0 | 0 | 0 | 0.047 | 0.107 | 0.084 |
| C31 | 0 | 0 | 0 | 0.365 | 0 | 0 | 0.173 | 0.169 | 0.148 | 0.057 | 0.026 | 0.039 | 0 | 0 | 0.085 | 0.033 | 0.100 | 0.156 | 0.061 | 0.087 | 0.052 | 0 | 0.025 | 0.018 | 0.038 |
| C32 | 0 | 0 | 0 | 0.120 | 0 | 0 | 0.068 | 0.072 | 0.048 | 0.057 | 0.053 | 0.080 | 0 | 0 | 0.255 | 0.092 | 0.063 | 0.156 | 0.061 | 0.076 | 0.052 | 0 | 0.040 | 0.036 | 0.017 |
| C33 | 0 | 0 | 0 | 0.076 | 0 | 0 | 0.099 | 0.099 | 0.105 | 0.339 | 0.222 | 0.334 | 0.340 | 0.340 | 0 | 0.357 | 0.318 | 0.052 | 0.242 | 0.200 | 0.260 | 0 | 0.128 | 0.140 | 0.139 |
| C41 | 0 | 0 | 0 | 0 | 0.268 | 0 | 0 | 0 | 0 | 0 | 0 | 0 | 0 | 0 | 0 | 0 | 0 | 0 | 0 | 0 | 0 | 0 | 0.089 | 0.084 | 0.037 |
| C42 | 0 | 0 | 0 | 0 | 0.214 | 0 | 0 | 0 | 0 | 0 | 0 | 0 | 0 | 0 | 0 | 0 | 0 | 0 | 0 | 0 | 0 | 0 | 0.022 | 0.028 | 0.074 |
| C51 | 0 | 0 | 0 | 0 | 0 | 0.252 | 0 | 0 | 0 | 0 | 0 | 0 | 0 | 0 | 0 | 0 | 0 | 0 | 0.070 | 0.050 | 0 | 0.163 | 0.070 | 0.062 | 0.064 |
| C52 | 0 | 0 | 0 | 0 | 0 | 0.162 | 0 | 0 | 0 | 0 | 0 | 0 | 0 | 0 | 0 | 0 | 0 | 0.104 | 0 | 0.238 | 0.083 | 0.488 | 0.066 | 0.051 | 0.066 |
| C53 | 0 | 0 | 0 | 0 | 0 | 0.078 | 0 | 0 | 0 | 0 | 0 | 0 | 0 | 0 | 0 | 0 | 0 | 0.279 | 0.194 | 0 | 0.331 | 0 | 0.042 | 0.049 | 0.045 |
| C54 | 0 | 0 | 0 | 0 | 0 | 0.122 | 0 | 0 | 0 | 0 | 0 | 0 | 0 | 0 | 0 | 0 | 0 | 0 | 0.128 | 0.126 | 0 | 0 | 0.041 | 0.054 | 0.054 |
| C55 | 0 | 0 | 0 | 0 | 0 | 0.119 | 0 | 0 | 0 | 0 | 0 | 0 | 0 | 0 | 0 | 0 | 0 | 0.031 | 0.023 | 0 | 0 | 0 | 0.065 | 0.068 | 0.056 |
| A | 0 | 0 | 0 | 0 | 0 | 0 | 0.110 | 0.122 | 0.073 | 0.108 | 0.070 | 0.110 | 0.022 | 0.022 | 0.021 | 0.071 | 0.072 | 0.018 | 0.018 | 0.017 | 0.020 | 0.028 | 0 | 0 | 0 |
| B | 0 | 0 | 0 | 0 | 0 | 0 | 0.094 | 0.081 | 0.047 | 0.072 | 0.049 | 0.064 | 0.016 | 0.016 | 0.016 | 0.049 | 0.049 | 0.013 | 0.013 | 0.014 | 0.011 | 0.020 | 0 | 0 | 0 |
| C | 0 | 0 | 0 | 0 | 0 | 0 | 0.101 | 0.102 | 0.062 | 0.093 | 0.062 | 0.098 | 0.019 | 0.020 | 0.020 | 0.062 | 0.061 | 0.017 | 0.016 | 0.016 | 0.016 | 0.026 | 0 | 0 | 0 |
| Goal | C1 | C2 | C3 | C4 | C5 | C11 | C12 | C21 | C22 | C23 | C24 | C31 | C32 | C33 | C41 | C42 | C51 | C52 | C53 | C54 | C55 | A | B | C | |
|---|---|---|---|---|---|---|---|---|---|---|---|---|---|---|---|---|---|---|---|---|---|---|---|---|---|
| Goal | 0 | 0 | 0 | 0 | 0 | 0 | 0 | 0 | 0 | 0 | 0 | 0 | 0 | 0 | 0 | 0 | 0 | 0 | 0 | 0 | 0 | 0 | 0 | 0 | 0 |
| C1 | 0 | 0 | 0 | 0 | 0 | 0 | 0 | 0 | 0 | 0 | 0 | 0 | 0 | 0 | 0 | 0 | 0 | 0 | 0 | 0 | 0 | 0 | 0 | 0 | 0 |
| C2 | 0 | 0 | 0 | 0 | 0 | 0 | 0 | 0 | 0 | 0 | 0 | 0 | 0 | 0 | 0 | 0 | 0 | 0 | 0 | 0 | 0 | 0 | 0 | 0 | 0 |
| C3 | 0 | 0 | 0 | 0 | 0 | 0 | 0 | 0 | 0 | 0 | 0 | 0 | 0 | 0 | 0 | 0 | 0 | 0 | 0 | 0 | 0 | 0 | 0 | 0 | 0 |
| C4 | 0 | 0 | 0 | 0 | 0 | 0 | 0 | 0 | 0 | 0 | 0 | 0 | 0 | 0 | 0 | 0 | 0 | 0 | 0 | 0 | 0 | 0 | 0 | 0 | 0 |
| C5 | 0 | 0 | 0 | 0 | 0 | 0 | 0 | 0 | 0 | 0 | 0 | 0 | 0 | 0 | 0 | 0 | 0 | 0 | 0 | 0 | 0 | 0 | 0 | 0 | 0 |
| C11 | 0.055 | 0.055 | 0.055 | 0.055 | 0.055 | 0.055 | 0.055 | 0.055 | 0.055 | 0.055 | 0.055 | 0.055 | 0.055 | 0.055 | 0.055 | 0.055 | 0.055 | 0.055 | 0.055 | 0.055 | 0.055 | 0.055 | 0.055 | 0.055 | 0.055 |
| C12 | 0.037 | 0.037 | 0.037 | 0.037 | 0.037 | 0.037 | 0.037 | 0.037 | 0.037 | 0.037 | 0.037 | 0.037 | 0.037 | 0.037 | 0.037 | 0.037 | 0.037 | 0.037 | 0.037 | 0.037 | 0.037 | 0.037 | 0.037 | 0.037 | 0.037 |
| C21 | 0.048 | 0.048 | 0.048 | 0.048 | 0.048 | 0.048 | 0.048 | 0.048 | 0.048 | 0.048 | 0.048 | 0.048 | 0.048 | 0.048 | 0.048 | 0.048 | 0.048 | 0.048 | 0.048 | 0.048 | 0.048 | 0.048 | 0.048 | 0.048 | 0.048 |
| C22 | 0.042 | 0.042 | 0.042 | 0.042 | 0.042 | 0.042 | 0.042 | 0.042 | 0.042 | 0.042 | 0.042 | 0.042 | 0.042 | 0.042 | 0.042 | 0.042 | 0.042 | 0.042 | 0.042 | 0.042 | 0.042 | 0.042 | 0.042 | 0.042 | 0.042 |
| C23 | 0.120 | 0.120 | 0.120 | 0.120 | 0.120 | 0.120 | 0.120 | 0.120 | 0.120 | 0.120 | 0.120 | 0.120 | 0.120 | 0.120 | 0.120 | 0.120 | 0.120 | 0.120 | 0.120 | 0.120 | 0.120 | 0.120 | 0.120 | 0.120 | 0.120 |
| C24 | 0.098 | 0.098 | 0.098 | 0.098 | 0.098 | 0.098 | 0.098 | 0.098 | 0.098 | 0.098 | 0.098 | 0.098 | 0.098 | 0.098 | 0.098 | 0.098 | 0.098 | 0.098 | 0.098 | 0.098 | 0.098 | 0.098 | 0.098 | 0.098 | 0.098 |
| C31 | 0.092 | 0.092 | 0.092 | 0.092 | 0.092 | 0.092 | 0.092 | 0.092 | 0.092 | 0.092 | 0.092 | 0.092 | 0.092 | 0.092 | 0.092 | 0.092 | 0.092 | 0.092 | 0.092 | 0.092 | 0.092 | 0.092 | 0.092 | 0.092 | 0.092 |
| C32 | 0.023 | 0.023 | 0.023 | 0.023 | 0.023 | 0.023 | 0.023 | 0.023 | 0.023 | 0.023 | 0.023 | 0.023 | 0.023 | 0.023 | 0.023 | 0.023 | 0.023 | 0.023 | 0.023 | 0.023 | 0.023 | 0.023 | 0.023 | 0.023 | 0.023 |
| C33 | 0.065 | 0.065 | 0.065 | 0.065 | 0.065 | 0.065 | 0.065 | 0.065 | 0.065 | 0.065 | 0.065 | 0.065 | 0.065 | 0.065 | 0.065 | 0.065 | 0.065 | 0.065 | 0.065 | 0.065 | 0.065 | 0.065 | 0.065 | 0.065 | 0.065 |
| C41 | 0.075 | 0.075 | 0.075 | 0.075 | 0.075 | 0.075 | 0.075 | 0.075 | 0.075 | 0.075 | 0.075 | 0.075 | 0.075 | 0.075 | 0.075 | 0.075 | 0.075 | 0.075 | 0.075 | 0.075 | 0.075 | 0.075 | 0.075 | 0.075 | 0.075 |
| C42 | 0.083 | 0.083 | 0.083 | 0.083 | 0.083 | 0.083 | 0.083 | 0.083 | 0.083 | 0.083 | 0.083 | 0.083 | 0.083 | 0.083 | 0.083 | 0.083 | 0.083 | 0.083 | 0.083 | 0.083 | 0.083 | 0.083 | 0.083 | 0.083 | 0.083 |
| C51 | 0.174 | 0.174 | 0.174 | 0.174 | 0.174 | 0.174 | 0.174 | 0.174 | 0.174 | 0.174 | 0.174 | 0.174 | 0.174 | 0.174 | 0.174 | 0.174 | 0.174 | 0.174 | 0.174 | 0.174 | 0.174 | 0.174 | 0.174 | 0.174 | 0.174 |
| C52 | 0.010 | 0.010 | 0.010 | 0.010 | 0.010 | 0.010 | 0.010 | 0.010 | 0.010 | 0.010 | 0.010 | 0.010 | 0.010 | 0.010 | 0.010 | 0.010 | 0.010 | 0.010 | 0.010 | 0.010 | 0.010 | 0.010 | 0.010 | 0.010 | 0.010 |
| C53 | 0.006 | 0.006 | 0.006 | 0.006 | 0.006 | 0.006 | 0.006 | 0.006 | 0.006 | 0.006 | 0.006 | 0.006 | 0.006 | 0.006 | 0.006 | 0.006 | 0.006 | 0.006 | 0.006 | 0.006 | 0.006 | 0.006 | 0.006 | 0.006 | 0.006 |
| C54 | 0.013 | 0.013 | 0.013 | 0.013 | 0.013 | 0.013 | 0.013 | 0.013 | 0.013 | 0.013 | 0.013 | 0.013 | 0.013 | 0.013 | 0.013 | 0.013 | 0.013 | 0.013 | 0.013 | 0.013 | 0.013 | 0.013 | 0.013 | 0.013 | 0.013 |
| C55 | 0.020 | 0.020 | 0.020 | 0.020 | 0.020 | 0.020 | 0.020 | 0.020 | 0.020 | 0.020 | 0.020 | 0.020 | 0.020 | 0.020 | 0.020 | 0.020 | 0.020 | 0.020 | 0.020 | 0.020 | 0.020 | 0.020 | 0.020 | 0.020 | 0.020 |
| A | 0.018 | 0.018 | 0.018 | 0.018 | 0.018 | 0.018 | 0.018 | 0.018 | 0.018 | 0.018 | 0.018 | 0.018 | 0.018 | 0.018 | 0.018 | 0.018 | 0.018 | 0.018 | 0.018 | 0.018 | 0.018 | 0.018 | 0.018 | 0.018 | 0.018 |
| B | 0.012 | 0.012 | 0.012 | 0.012 | 0.012 | 0.012 | 0.012 | 0.012 | 0.012 | 0.012 | 0.012 | 0.012 | 0.012 | 0.012 | 0.012 | 0.012 | 0.012 | 0.012 | 0.012 | 0.012 | 0.012 | 0.012 | 0.012 | 0.012 | 0.012 |
| C | 0.010 | 0.010 | 0.010 | 0.010 | 0.010 | 0.010 | 0.010 | 0.010 | 0.010 | 0.010 | 0.010 | 0.010 | 0.010 | 0.010 | 0.010 | 0.010 | 0.010 | 0.010 | 0.010 | 0.010 | 0.010 | 0.010 | 0.010 | 0.010 | 0.010 |
| C11 | Japan Brand (A1) | US Brand (A2) | Germany Brand (A3) | Weight |
|---|---|---|---|---|
| Japan Brand (A1) | 1 | 1.172 | 1.095 | 0.361 |
| US Brand (A2) | 0.853 | 1 | 1.070 | 0.308 |
| Germany Brand (A3) | 0.913 | 0.935 | 1 | 0.331 |
| Alternatives | Sub-Criteria of Level 3 | |||||||||||||||
|---|---|---|---|---|---|---|---|---|---|---|---|---|---|---|---|---|
| C11 | C12 | C21 | C22 | C23 | C24 | C31 | C32 | C33 | C41 | C42 | C51 | C52 | C53 | C54 | C55 | |
| A1 | 0.361 | 0.400 | 0.403 | 0.395 | 0.388 | 0.405 | 0.387 | 0.377 | 0.367 | 0.388 | 0.393 | 0.382 | 0.382 | 0.357 | 0.430 | 0.376 |
| A2 | 0.308 | 0.267 | 0.256 | 0.264 | 0.273 | 0.234 | 0.281 | 0.280 | 0.287 | 0.271 | 0.272 | 0.266 | 0.275 | 0.303 | 0.232 | 0.289 |
| A3 | 0.330 | 0.333 | 0.340 | 0.341 | 0.339 | 0.361 | 0.331 | 0.342 | 0.346 | 0.341 | 0.335 | 0.352 | 0.344 | 0.340 | 0.338 | 0.355 |
© 2018 by the authors. Licensee MDPI, Basel, Switzerland. This article is an open access article distributed under the terms and conditions of the Creative Commons Attribution (CC BY) license (http://creativecommons.org/licenses/by/4.0/).
Share and Cite
Lin, C.-T.; Hung, K.-P.; Hu, S.-H. A Decision-Making Model for Evaluating and Selecting Suppliers for the Sustainable Operation and Development of Enterprises in the Aerospace Industry. Sustainability 2018, 10, 735. https://doi.org/10.3390/su10030735
Lin C-T, Hung K-P, Hu S-H. A Decision-Making Model for Evaluating and Selecting Suppliers for the Sustainable Operation and Development of Enterprises in the Aerospace Industry. Sustainability. 2018; 10(3):735. https://doi.org/10.3390/su10030735
Chicago/Turabian StyleLin, Chin-Tsai, Kuang-Peng Hung, and Shu-Hsien Hu. 2018. "A Decision-Making Model for Evaluating and Selecting Suppliers for the Sustainable Operation and Development of Enterprises in the Aerospace Industry" Sustainability 10, no. 3: 735. https://doi.org/10.3390/su10030735