Article

The Influencing Factors, Regional Difference and Temporal Variation of Industrial Technology Innovation: Evidence with the FOA-GRNN Model

1
School of Business Administration, Wonkwang University, 460 Iksandae-ro, Iksan 54538, Jeonbuk, Korea
2
School of Management Science and Engineering, Hebei GEO University, Shijiazhuang 050031, China
*
Author to whom correspondence should be addressed.
Sustainability 2018, 10(1), 187; https://doi.org/10.3390/su10010187
Submission received: 26 December 2017 / Revised: 6 January 2018 / Accepted: 12 January 2018 / Published: 15 January 2018
(This article belongs to the Special Issue Big Data and Predictive Analytics for Sustainability)

Abstract

:
Technology innovation is a motivating force for sustainable development. The recognition and measurement of influencing factors are a basic prerequisite of technology innovation research. In response to the gaps and shortages of existing theories and methods, this paper builds the impact indicators of technology innovation, the proposed FOA-GRNN model, and analyzes the influencing factors, regional differences and temporal variations of technology innovation based on industrial above-scale enterprises of 31 provinces in China from 2008 to 2015. The empirical results show that innovation investment is a determinant of technology innovation in China, and is more and more significant; meanwhile a wide gap of innovation resource between Eastern China and Western China exists. In general, the enterprise scale has a negative effect: with enlargement of enterprise in China, the innovation efficiency of enterprise will decline, while the effect has regional disparity, with positive influence in Central and Western China, and negative influence in Eastern China. Government support has negative effects on technology innovation: indirect equity investment contributes more to technology innovation than direct fund support. Innovation environment has positive and weak effects on technology innovation, but it is the biggest obstacle in Western China, and the innovation environment in China has improved continuously. This paper provides new evidence that can shine some light on determining the factors affecting technology innovation, and also presents a novel approach, which comprises characteristics of nonlinear function approximation, high accuracy and a small sample.

1. Introduction

Nowadays the utilization of energy and natural resources in most developing countries is characterized by extensive utilization mode, low overall utilization level and backward utilization technique. Economic development excessively relies on resource and energy investment that brings about massive waste and pollution [1,2]. Industrial businesses have historically contributed to regional pollution levels. Therefore, technology innovation of industrial business is the critical stimuli for a developing country to drive a sustainable development and low-carbon economy. When the influencing factors of regional technology innovation are accurately analyzed and grasped, the core mechanisms behind technology innovation will be revealed, and policies and countermeasures in accordance with geographical situation and development phase will be properly formulated for promoting technology innovation. That will contribute to industrial upgrading and sustainable development of the ecology, economy and society.
There are many factors that influence technology innovation, such as innovation investment, environmental innovation, enterprise scale and government support, but some influencing factors are controversial. For instance, some studies conclude that market competition could stimulate the impetus of enterprise technology innovation [3], while others believed that monopolies associated with monopolization of research and development (R&D) revenue could motivate technology innovation [4]. Some scholars argue that small or medium-sized enterprises perform more efficiently in technology innovation [5,6], while others contend that large firms tended to invest more in R&D than done small ones [7]. Some research shows that foreign direct investment brings the spillover effect of technology innovation [8], while others confirm that foreign-invested enterprises occupy the market share of local firms [9]. This contradictory set motivates us to search for what factors influence technology innovation, and verify how the influence size varies in space and time through a new methodological perspective, unlike a traditional research method (e.g., multiple regression, MR). That will shine some light on the controversy.
Most previous researchers use multiple regression (MR) as the preferred statistical method to study the factors affecting technology innovation. However, MR cannot capture non-linear relationships among the analyzed variables, and it has many inherent strict limits in practical application, such as assuming that independent variables are normally distributed, non-relevant and independent, and that function form must be pre-existing and linear [10]. The generalized regression neural network (GRNN) has strong mapping and generalization ability, and can fit an arbitrary non-linear relationship without an accurate mathematical model. GRNN also has a better performance in the treatment of small samples or unstable data [11,12]. Although GRNN is widely used in engineering fields [13,14,15], there is little credible research introducing GRNN to the research of industrial technology innovation currently. In addition, the spread parameter of GRNN has a significant influence on prediction performance. The fruit fly optimization algorithm (FOA) is a new kind of parameter optimization algorithm; compared with other evolutionary algorithms, its program is simple, understood easily, fast in convergence and will not easily fall into local optimum [12]. This study utilizes FOA to optimize the spread parameter of GRNN, and establishes the FOA-GRNN model, which is more precise and robust. It then employs FOA-GRNN to analyze factors affecting industrial technology innovation. That extends the prior research and fills a research gap.
The rest of this article is organized as follows. The relevant literatures on the topic and research hypotheses are formulated in Section 2. The principle of MIV, FOA and GRNN are described in Section 3. The empirical analysis taking China as research object is given in Section 4. Finally, conclusions are drawn and future research is suggested in Section 5.

2. Literature Review and Hypotheses

Applying for and acquiring patents is a fundamental measure occupying and protecting R&D outcomes by law, which will make enterprise able to achieve unique competitive advantages and obtain above-average returns. As an intangible asset, a patent has great commercial value. Its quality and quantity represent the innovation ability and core competence of enterprise [16,17]. Compared with new product sales revenue and new product export sales revenue, patent application quantity is a more objective, scientific and easy to acquire statistic data point [18]. Therefore, scholars widely use patent application as a general indicator to measure technology innovation ability [19,20,21].
Enterprise is the main body of technology innovation activities and the chief executor of innovation applications as well. R&D expenditure and R&D employees are major R&D investments. Most studies have shown that technology innovations within enterprise are attributed to R&D investment, because R&D investment may lead to innovation outputs that result in increases in market share and productivity through new products and more efficient process innovations [22,23,24]. Meanwhile, R&D investment is clouded by uncertainty such as the returns and payback time, the commercial chances of new products/services, and the threat of imitation by rivals, so some scholars demonstrated that R&D investment by young firms appeared significantly riskier than mature firms. Because young firms might either enjoy large upside gains or large downside losses, R&D investment was a double-edged sword for them [7,25]. Nevertheless, we formulate the following Hypothesis 1:
Hypothesis 1. (H1):
Innovation investment has a main and positive effect on technology innovation, while regional differences and temporal variations of effect size exist.
Regional innovative environment has an important impact on local businesses. Many elements constitute a regional innovative environment, and foreign direct investment, regional income and high-quality talent are considered in our study.
Foreign direct investment (FDI) will bring market competition pressure and a spillover effect of technology innovation, which will invigorate the innovative vitality of local enterprises [26,27]. However, FDI also will take some domestic market share, when the crowding out effect predominates, and the development and technology innovation of local enterprise will be restrained [28,29]. So FDI has two opposite effects on enterprise technology innovation.
Generally, the customer’s expectations on quality of product and service increase as an economy develops. The market demand of customers living in developed areas leads that of customers in less developed areas. Therefore, enterprises in developed areas have more incentive to improve the quality of products or services through technology innovation so as to create a competitive advantage ahead of time and trend [30,31,32].
Technology innovation has technology- and knowledge-intensive characteristics. The competition of technology innovation ultimately is a competition of talent and human resources. Colleges and universities take on the important tasks of providing intelligent support and talent reserves for knowledge and technology innovation [33,34].
In our study, we assume that the spillover of FDI on technology innovation exists, but has regional disparity. The regional income and high-quality talent have a positive effect on regional technology innovation. Accordingly, we state our second hypothesis in the following way:
Hypothesis 2. (H2):
Innovative environment has a positive effect on technology innovation, while regional differences and temporal variations of effect size exist.
There are many arguments about the relationship between enterprise scale and innovation efficiency [35,36]. For instance, Pavitt, Robson and Townsend (1987) found that there was a u-shaped relationship between innovation efficiency and enterprise size; the innovation efficiency of smaller or larger enterprise was higher than that of medium-sized enterprise. Stock, Greis and Fischer (2002) studied the relationship between enterprise scale and dynamic innovation, and asserted that R&D productivity decreased with scale; small businesses performed more efficiently in dynamic innovation. Shefer and Frenkel (2005) argued that expenditure on R&D was primarily influenced by a firm’s size; R&D spending increased with scale, large firms tended to invest more in R&D than do small ones.
These disparities of previous results leave a debate on whether enterprise scale is negatively correlated to technology innovation, and regional disparity exists. Therefore, we put forward the third hypothesis as below:
Hypothesis 3. (H3):
Enterprise scale is negatively correlated to technology innovation, and the effect size has regional differences and temporal variations.
The leverage effect or crowding out effect of a government R&D fund is a focus of argument in the academic field. Some scholars believe that fundamental innovations have the attributes of a common product, which is characterized by high costs, long cycle, and big risk, but the R&D revenue cannot be monopolized, so serious market malfunction exists in the fundamental research fields. Therefore, the fundamental research for enterprises needs government support via preferential taxation policies and grants to reduce innovation cost and risk, and overcome market failure [37,38]. However, other scholars argue that the efficiency of government funding is lower than enterprise R&D funding, meaning that improper government fund could mute enterprise R&D activities, bring about crowding out effects to enterprise innovation investment, and lead to the decrease of enterprise innovation efficiency [39,40].
The property right structure, especially state-owned enterprise, also has important influence on technology innovation. The state-owned enterprise has inherent advantages in technology innovation, whose quantity and quality of knowledge stock and intellectual capital are far superior to non-state enterprise. Meanwhile, it also can enjoy more innovation preferential policies [41]. However, once the regulation is absent, the enterprise owner will exist in name only; the serious principal-agency problem will cause negative effects on long-term behavior and enterprise incentive mechanisms, and this will lead, finally, to wastage of R&D expenditure and personnel, decreasing the innovation efficiency [42].
In consideration of serious agency problems in government funds and state-owned enterprises, we formulate the fourth hypothesis as below:
Hypothesis 4. (H4):
Government support has a negative effect on technology innovation, and the effect size has regional differences and temporal variations.

3. Methods

3.1. MIV

The mean impact value (MIV) is proposed by Dombi et al., which is considered to be one of the best indicators for evaluating the correlation of variables [43]. The FOA-GRNN model is initially trained and established by history data. After the accuracy of the model is proved by testing data, one independent variable respectively increases and decreases by 10% and other independent variables remain unchanged to form two new samples P1 and P2. Then P1 and P2 are inputted into the FOA-GRNN model to obtain two simulation results A1 and A2. The difference between A1 and A2 is the impact value (IV) of the independent variable on the dependent variable. The average value of IV is the MIV of independent variable. Thus, MIV can be used to measure the effect size of the independent variable on the dependent variable. The symbol expresses positive or negative effect, and the absolute value represents the effect size.

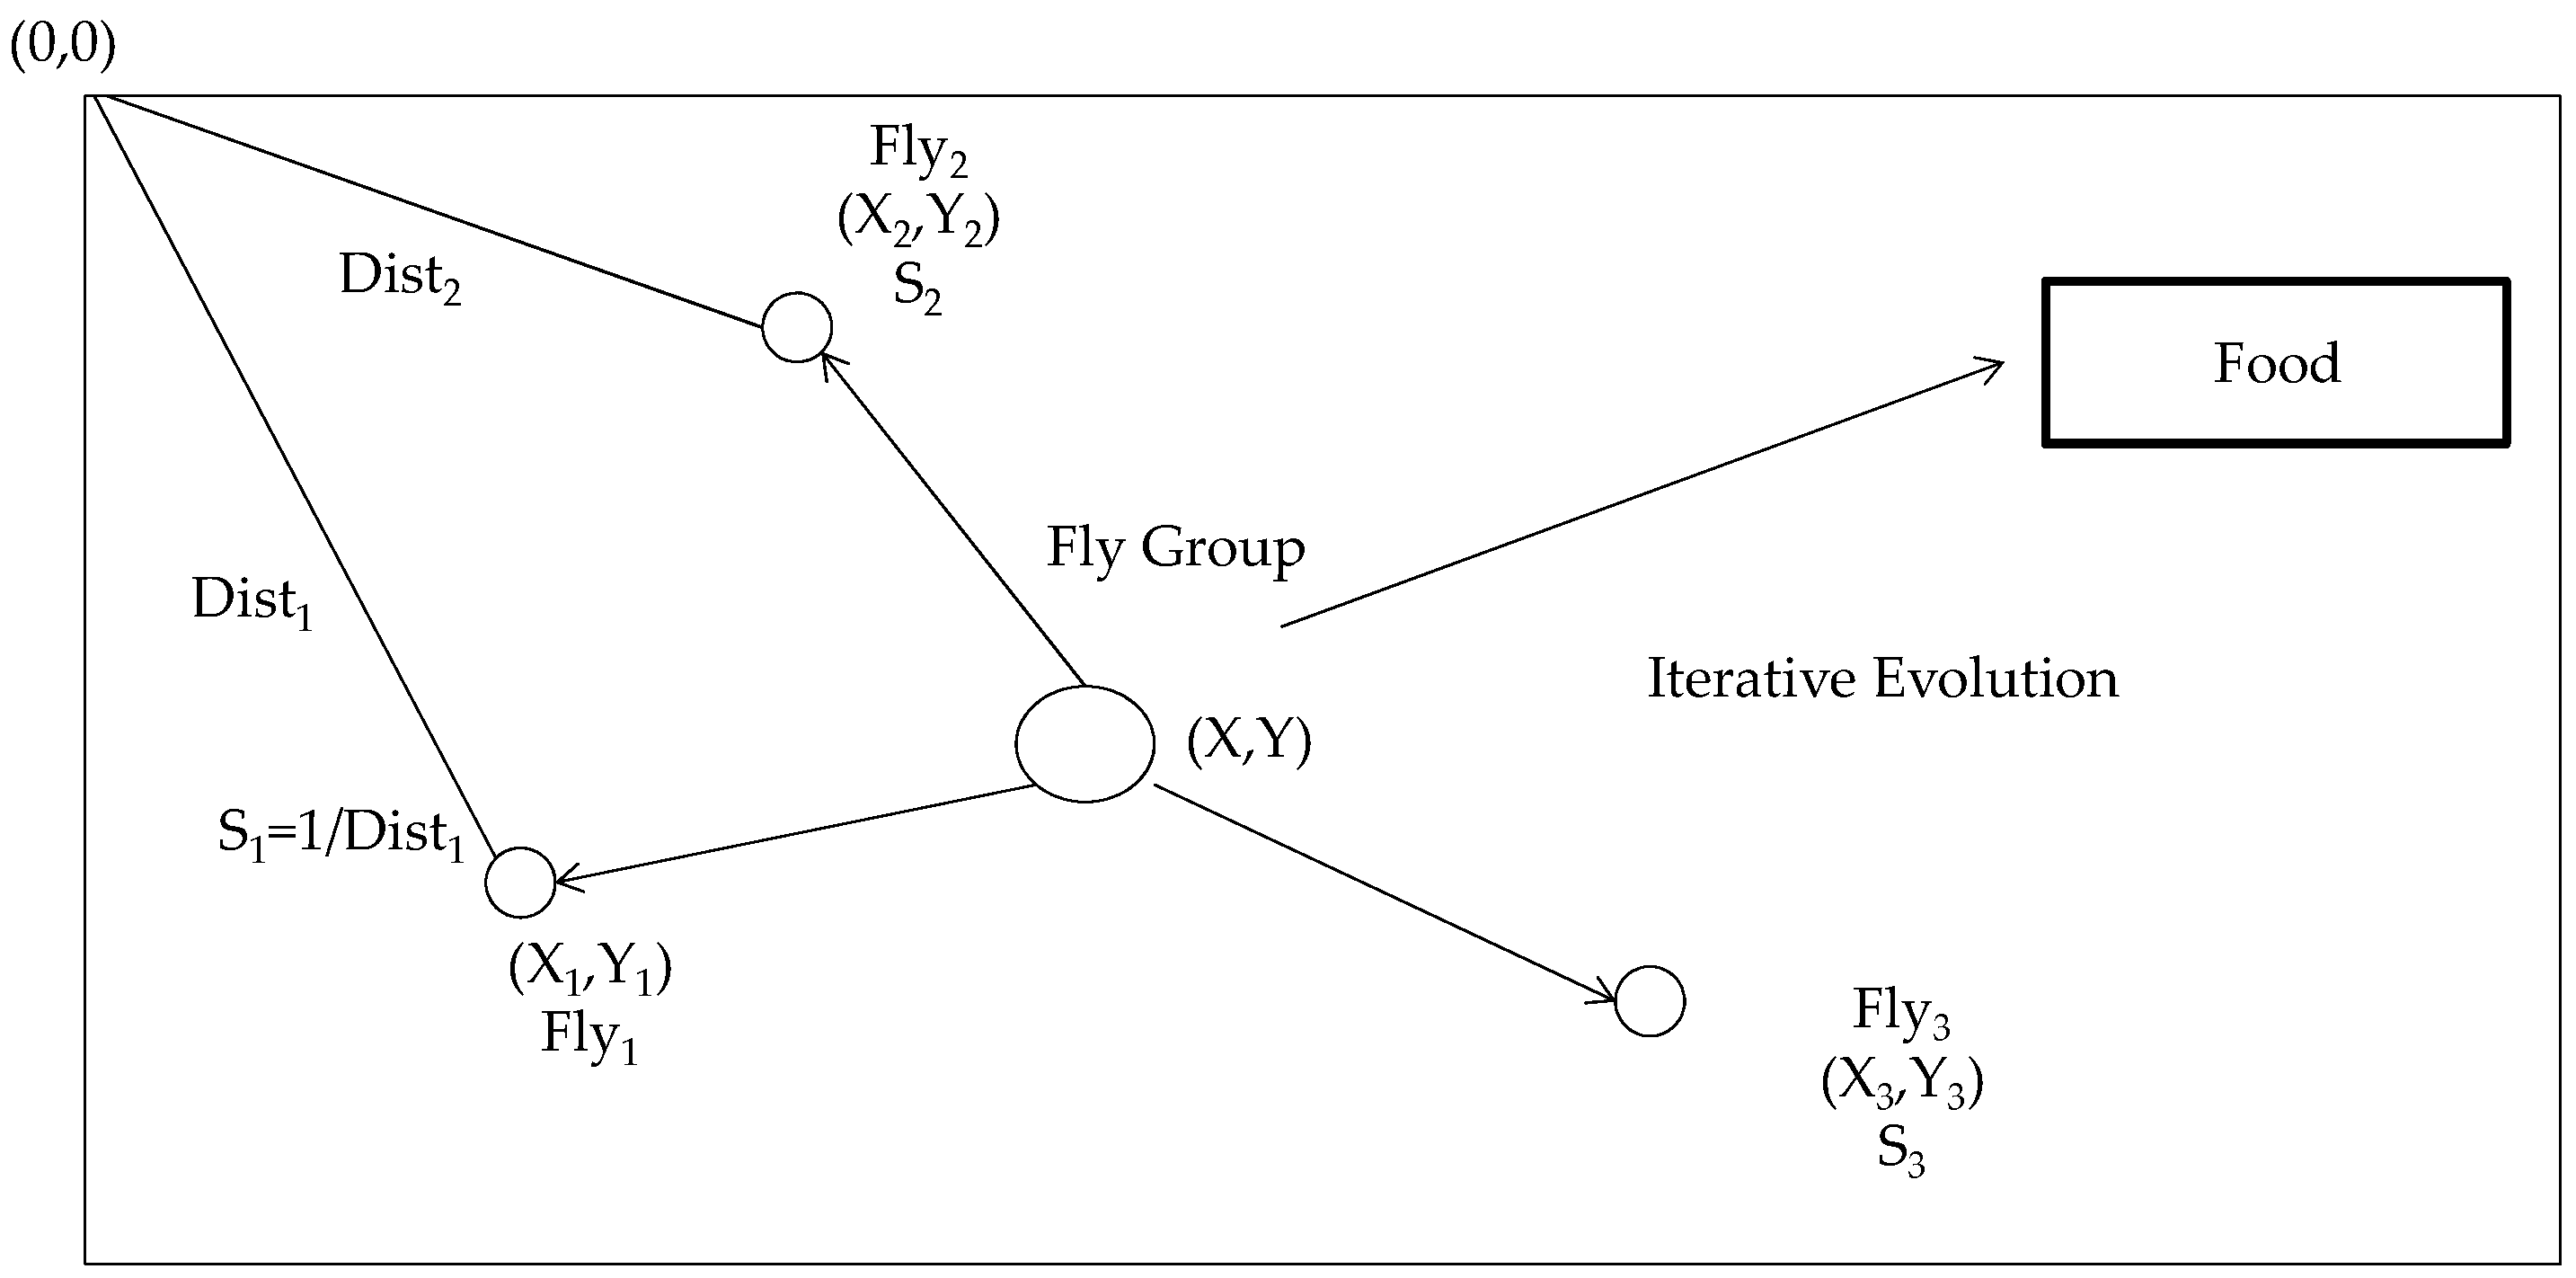
3.2. Fruit Fly Optimization Algorithm

The fruit fly optimization algorithm is a new method to search for global solutions by simulating fruit fly foraging behavior, proposed by Taiwanese scholar Pan Wen-Chao. The sensory perceptions of the fruit fly, especially smell and vision, are superior to other species. When the olfactory organ perceives food smells floating in the air, or the visual organ discovers foods and fruit fly colonies, the fruit fly will fly near that location [44]. The foraging food process of the fruit fly is shown in Figure 1.
The main operations of the fruit fly optimization algorithm are described as below.
1. The initialization of fruit fly position and generation of fruit fly population
The position of fruit fly in initial population is randomly set.
X0 = random()
Y0 = random()
2. The initialization of direction and distance for fruit fly to forage food via olfactory organ
Xi = X0 + L
Yi = Y0 + L
In Formulas (3) and (4), L is one adjustment parameter, for controlling the search range and direction.
3. The calculation of smell judgment value
Due to the initial location of food being unclear, the distance between the origin and fruit fly position is calculated. The smell judgment value of fruit fly position is measured by the reciprocal of distance.
D i s t i = X i 2 + Y i 2
S i = 1 D i s t i
4. The calculation of fitness value
Each smell judgment value represents one position of the fruit fly. The smell judgment value is regarded as the spread parameter of GRNN, the reciprocal of root mean square error (RMSE) between the predicted values and actual values is treated as fitness function of fruit fly. The fruit fly with higher fitness is superior, and the fruit fly with lower fitness is inferior.
F i = 1 R M S E i = 1 1 n j = 1 n ( y ^ j y j ) 2
where Fi represents the fitness of fruit fly i, n is the size of testing data set, y ^ j is the prediction value of GRNN, y j is the actual value of testing data.
5. The regeneration of fruit fly population
The best fruit fly with highest fitness is picked out, and the abscissa and ordinate values of best fruit fly position are expressed as “Xbest” and “Ybest”. The new fruit flies will be regenerated around the best fruit fly, and then the new fruit fly population is born. The direction and distance of the new fruit fly is adjusted based on the position of best fruit fly in previous generation.
Xnew = Xbest + M × random() − L
Ynew = Xbest + M × random() − L
In the formulas (8) and (9), M and L are adjustment parameters, for controlling the search range and direction of the new fruit fly.
6. The iterative optimization
The operations of steps 2–5 are executed repeatedly until the fitness of the best fruit fly in the current loop is not better than the previous one or the terminating condition is satisfied.

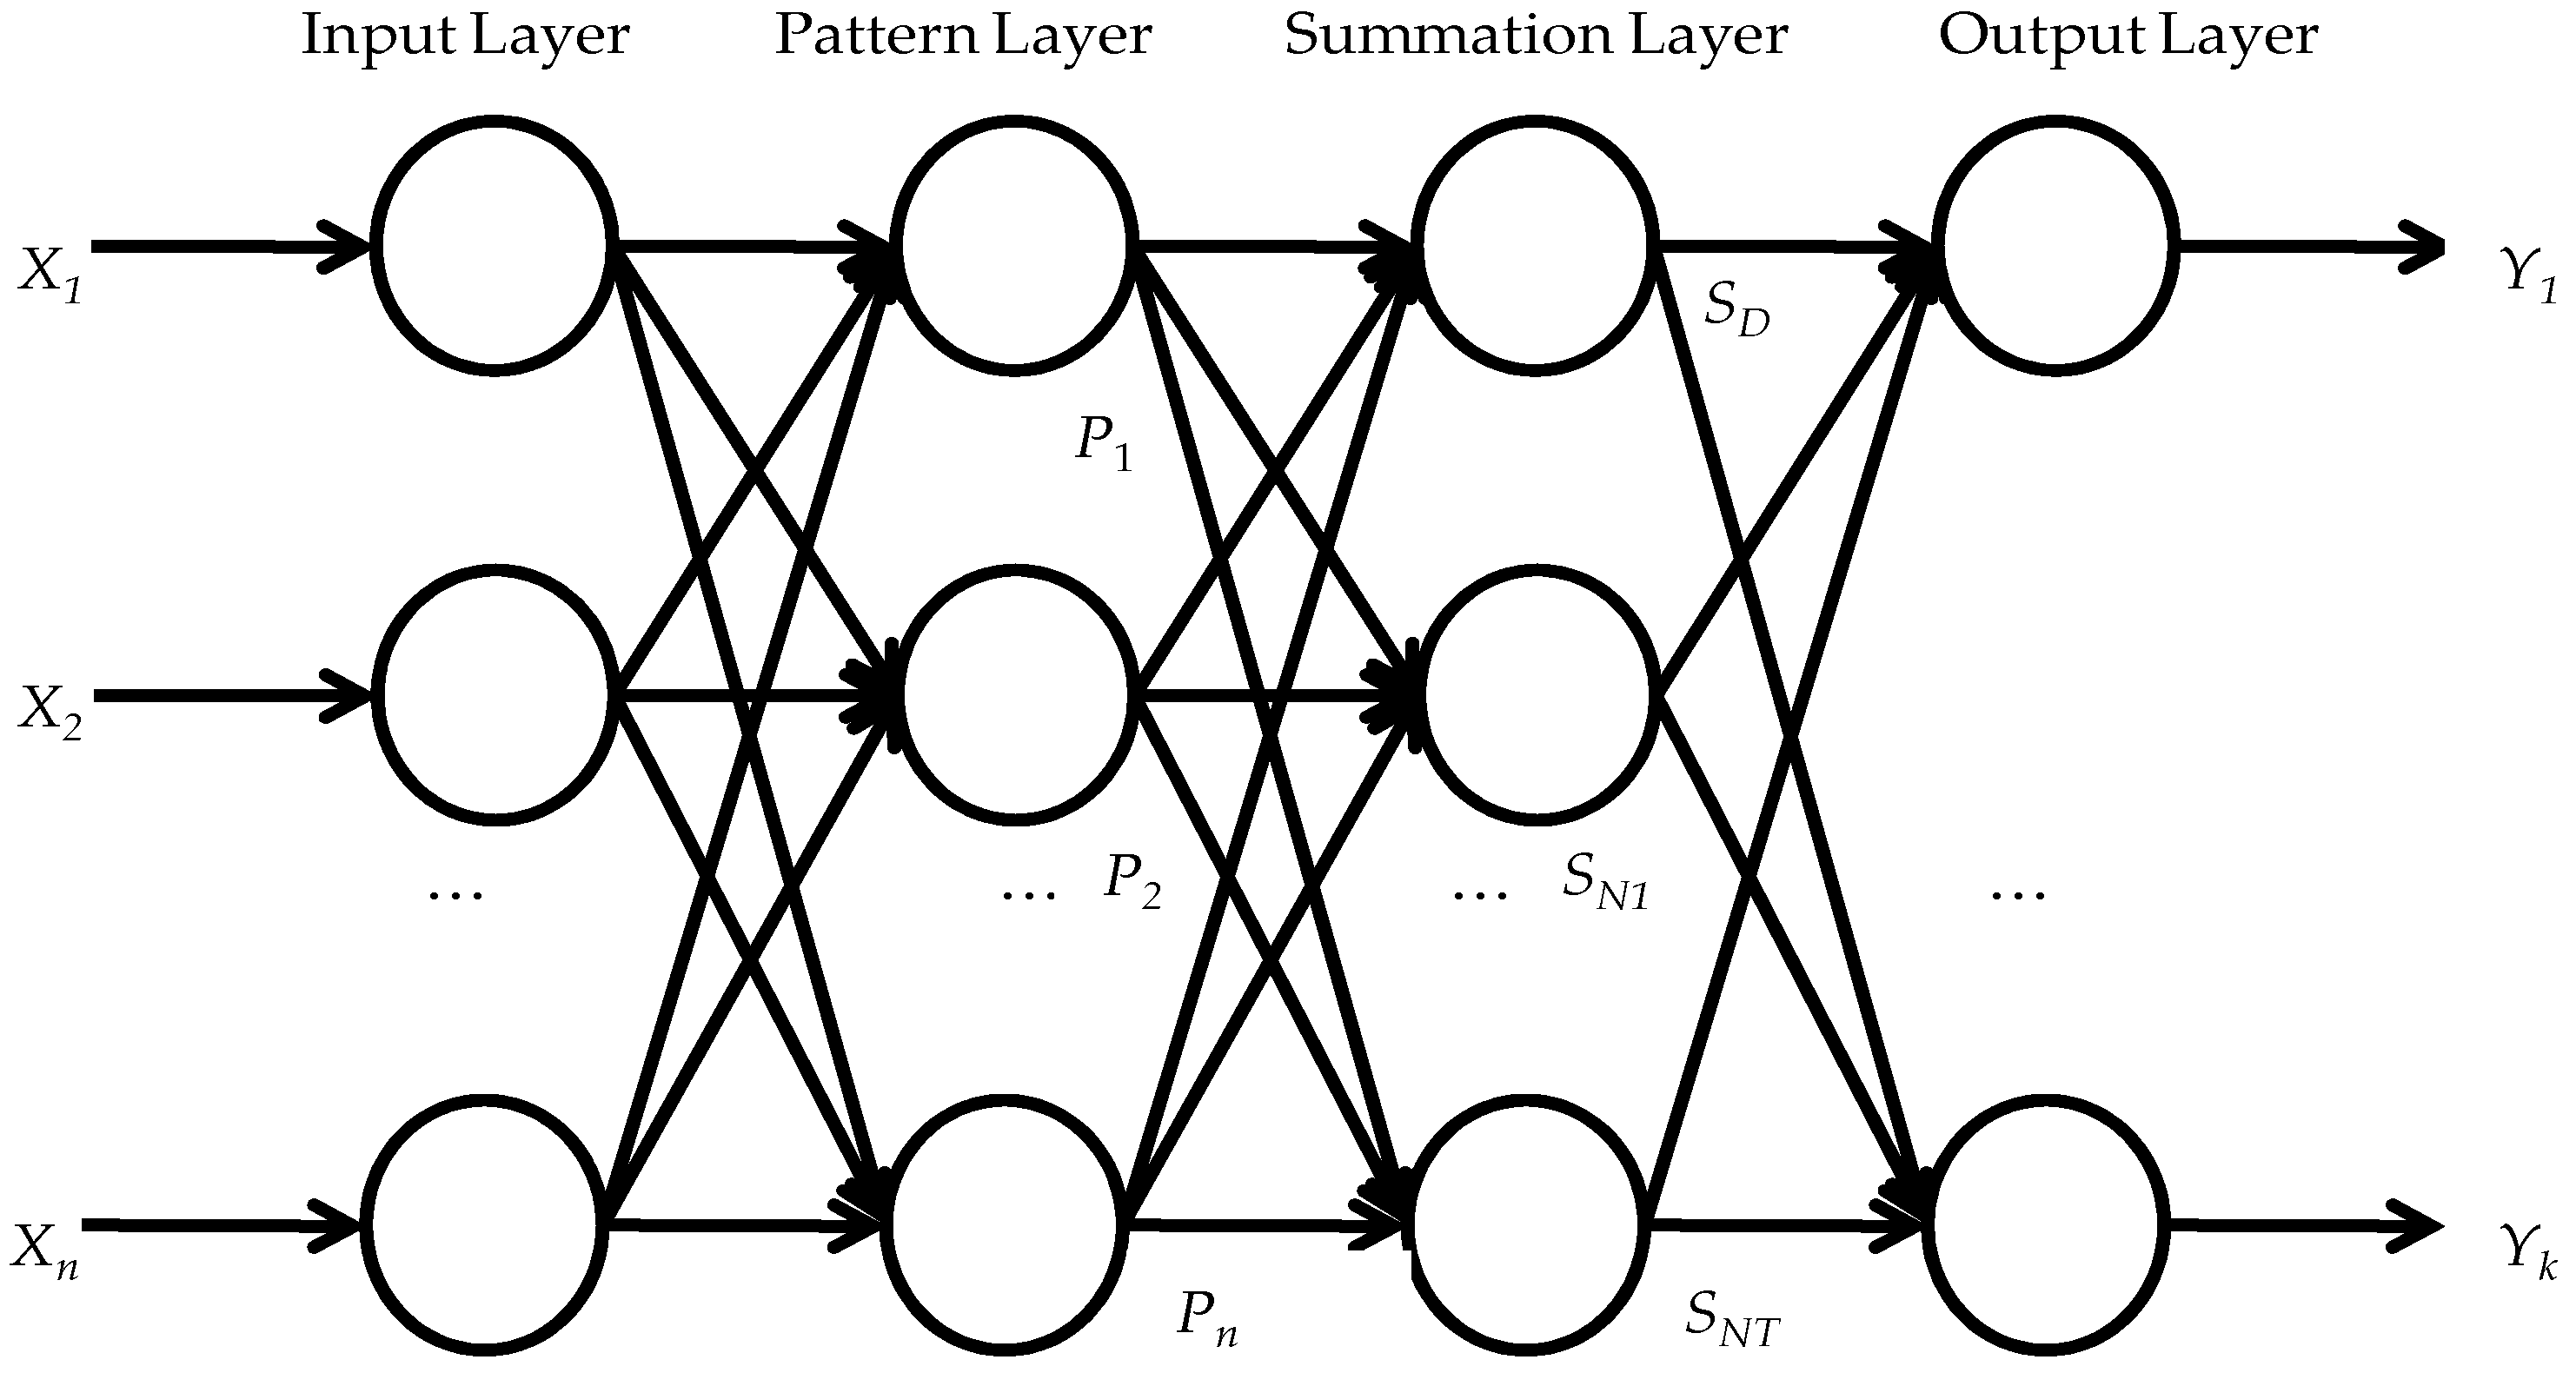
3.3. Generalized Regression Neural Network Model

The generalized regression neural network (GRNN) is a kind of radial basis function (RBF) neural network, proposed by American scholar Donald F. Specht in 1992 [45]. GRNN converges to the optimized regression surface accumulating more sample size, and has stronger nonlinear mapping and approximation ability, which is very suitable for solving nonlinear problems. Meanwhile, the parameter that needs to be adjusted by GRNN is only one, so GRNN has higher fault tolerance and faster learning speed. GRNN also has strong adaptability to unstable data and small sample data.
Similar to the RBF neural network, the GRNN network structure is composed of an input layer, pattern layer, summation layer and output layer, as shown in Figure 2, wherein X = [x1,x2,…,xn]T represents network input vector, Y = [y1,y2,…,yk]T represents network out vector.
1. Input layer
The input layer is responsible for transmitting a learning sample to the pattern layer. The input layer neurons are simply distributed, and their number is equal to the input vector dimension.
2. Pattern layer
The pattern layer neurons are associated with the learning samples, equal in number. Assuming that X is input vector, Xi is the one learning sample corresponding to pattern layer neuron i. The output value of pattern layer neuron i is equal to the exponentiation of the squared Euclidean distance between input vector X and learning sample Xi. The computation formula is shown below.
D i 2 = ( X X i ) T ( X X i )
The transfer function of pattern layer neuron i is shown in Formula (11).
p i = exp [ ( X X i ) T ( X X i ) 2 σ 2 ] , i = 1 , 2 , , n
3. Summation layer
The summation layer neuron is used for the calculation of the outputs of pattern layer neurons. The summation calculation is classed into the arithmetic summation method and weighted summation method. If using the arithmetic summation method, the sum of the connection weights between the pattern layer neurons and the summation layer neurons is 1. The output value of the summation layer neuron i is computed by Formula (12).
s i = i = 1 n exp [ ( X X i ) T ( X X i ) 2 σ 2 ]
The transfer function of the summation layer neuron i is shown in Formula (13).
S D = i = 1 n P i
When the weighted summation method is adopted, the element j in the output sample Yi is the connection weight between pattern layer neuron i and summation layer neuron j. The output value of summation layer neuron i is computed by Formula (14).
s i = i = 1 n Y i exp [ ( X X i ) T ( X X i ) 2 σ 2 ]
The transfer function of summation layer neuron i is shown in Formula (15).
S N j = i = 1 n y i j P i , j = 1 , 2 , , k
4. Output layer
The outputs of output layer neurons are obtained through division operation of the summation layer neurons. The output layer neurons correspond to the output variables, and the number of output layer neurons is equal to the output vector dimension k. The output value of output layer neuron j is computed by Formula (16).
y j = S N j S D , j = 1 , 2 , , k

4. Data Collection and Model Comparison

4.1. Data Collection and Input Variables Reduction

This paper takes the technology innovation of industrial enterprises in China as an example. Following the principles of comprehensive and data accessibility, the measurable indicators of influencing factors on technology innovation are set as shown in Table 1.
China’s National Bureau of Statistics (http://www.stats.gov.cn/), which is the most authoritative and scientific statistical institution in China, has the most valuable and detailed statistics about China. Hence, we collected technology innovation data of industrial above-scale enterprises of 31 provinces in China during the period of 2008–2015 year. Data from 2008 to 2014 (7/8 of total data) were used as training data, and the rest of the data in 2015 year (1/8 of total data) were used as testing data.
The descriptive statistics and correlation coefficients of variables are reported in Table 2. It indicates that the correlation between independent variable V6 and dependent variable Y is not significant with the Pearson correlation coefficient of −0.114. Correlation is the basis for any functional relationship, so the independent variable V6 is eliminated from the prediction indicators.
In addition, the Pearson correlation coefficients among most other independent variables reach the significant level (p < 0.05 or 0.01), which indicates there is a large amount of repetitive information between independent variables. The testing value of Kaiser-Meyer-Olkin Measure of Sampling Adequacy (KMO’s MSA) and χ2 are 0.728 and 1732.166 with significant (p < 0.000). Thus, we used principal component analysis to eliminate collinearity among variables and reduce variables’ quantities.
Four factors were extracted from input variables, namely: innovation investment, innovation environment, enterprise scale and government support. The accumulated rotation sums of squared loading of factors extracted from input variables were 87.348%. Detailed information on factor analysis is listed in Table 3.

4.2. Methods and Performance Comparison

After factor analysis, this study used least square method via SPSS software to obtain the multiple regression, as shown in Equation (17).
Y = −0.775 + 0.334 × F1 + 0.075 × F2 − 0.023 × F3 − 0.046 × F4
In the equation, F1F4 respectively represents the common factor extracted by factor analysis. The R2 value was 0.886 and adjusted R2 value was 0.885, which proved that the regression model fitted well. The hypothesis of regression equations and regression coefficients were tested for significance. By using ANOVA, we found that the F value was 474.136, and the p value was 0.000 < 0.001, which indicated that at least one regression coefficient of independent variable was not 0, and the established regression model had statistical significance. The p values of four independent regression coefficients were 0.000, 0.000, 0.004 and 0.000. It is reasonable to deduce that β1, β2, β3, and β4 are not 0 (p < 0.05).
The root mean square error (RMSE), mean absolute error (MAE) and mean absolute percentage error (MAPE) are used to assess the prediction accuracy of models. The smaller the value of RMSE, MAE or MAPE is, the less the forecasting error is, the better the model fit is, and vice versa.
This study applied MR and FOA-GRNN to predict the performance of industrial technology innovation. In Table 4, a rather precise prediction is exhibited by FOA-GRNN (RMSE = 4963.17, MAE = 2832.58, MAPE = 3.3722), and multiple regression has the fairly large error (RMSE = 9683.06, MAE = 6568.23, MAPE = 8.5432). In accurate predictions, the FOA-GRNN is advantageous over multiple regression.

5. Results

5.1. Impact Size Analysis

Taking four common factors as input variables and the number of patent applications as the output variable, the FOA-GRNN model has been established, trained and tested, then, while respectively increasing and decreasing each input variable by 10%, other input variables remained unchanged to obtain the MIV of each variable affecting industrial technology innovation performance, as shown in Table 5.
Table 5 shows that the most important influencing factor is innovation investment (MIV = 442.32), followed by enterprise scale (MIV = −49.11), government support (MIV = −31.03) and innovation environment (MIV = 22.97). Among four influencing factors, innovation investment and innovation environment are positively correlated with technology innovation; enterprise scale and government support are negatively correlated with technology innovation. The MIV of innovation investment is much greater than other influencing factors. The results are consistent with that of multiple regression, and Hypotheses 1–4 (i.e., innovation investment and innovation environment have positive effects, enterprise scale and government support have negative effects) are found to be supported.

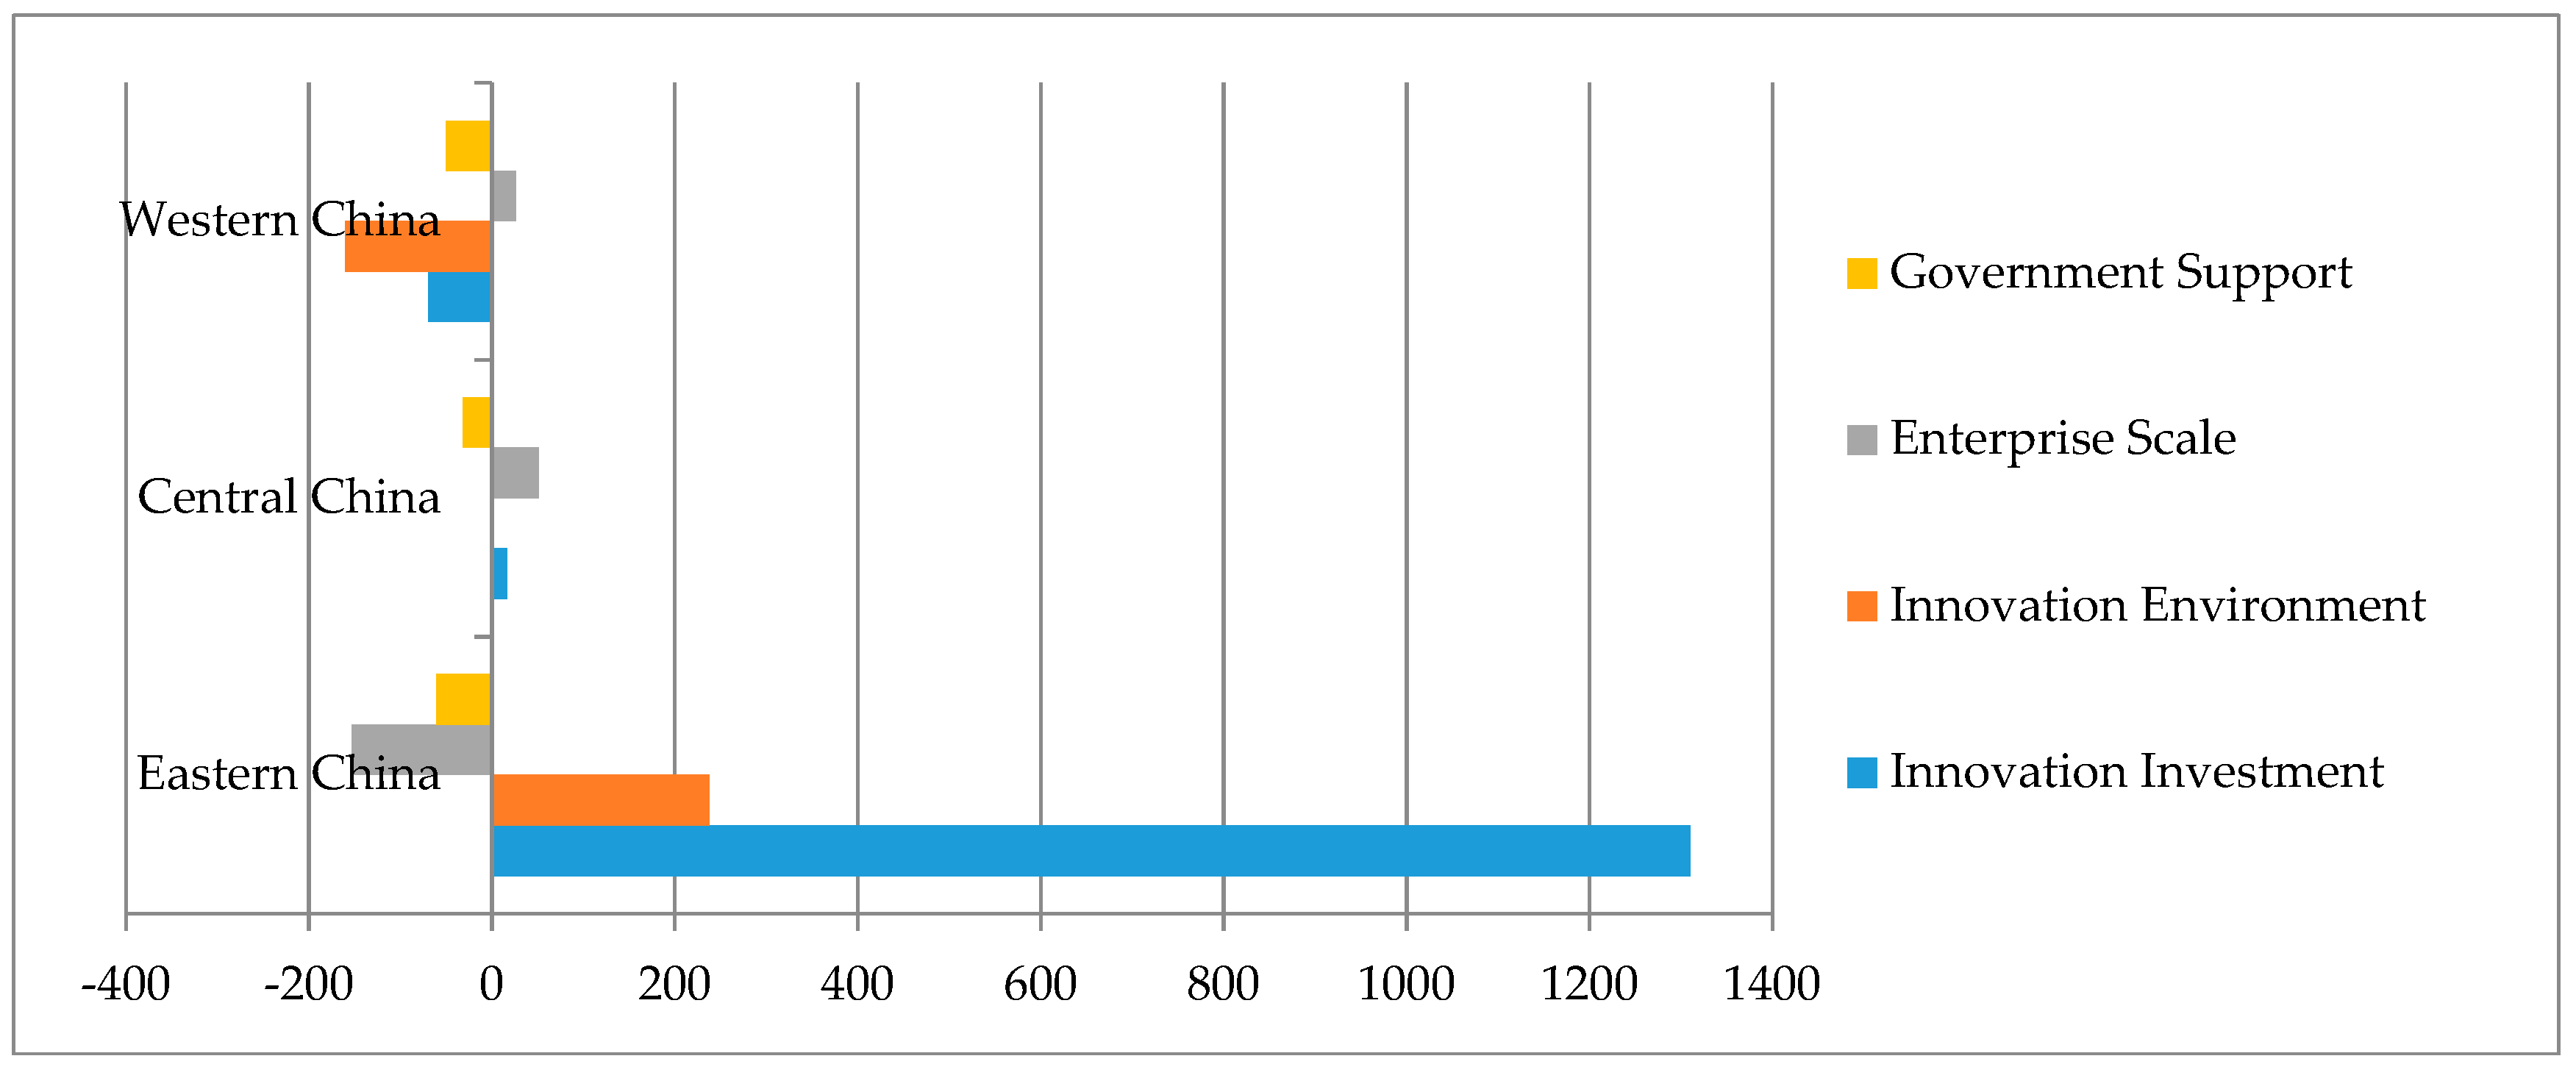
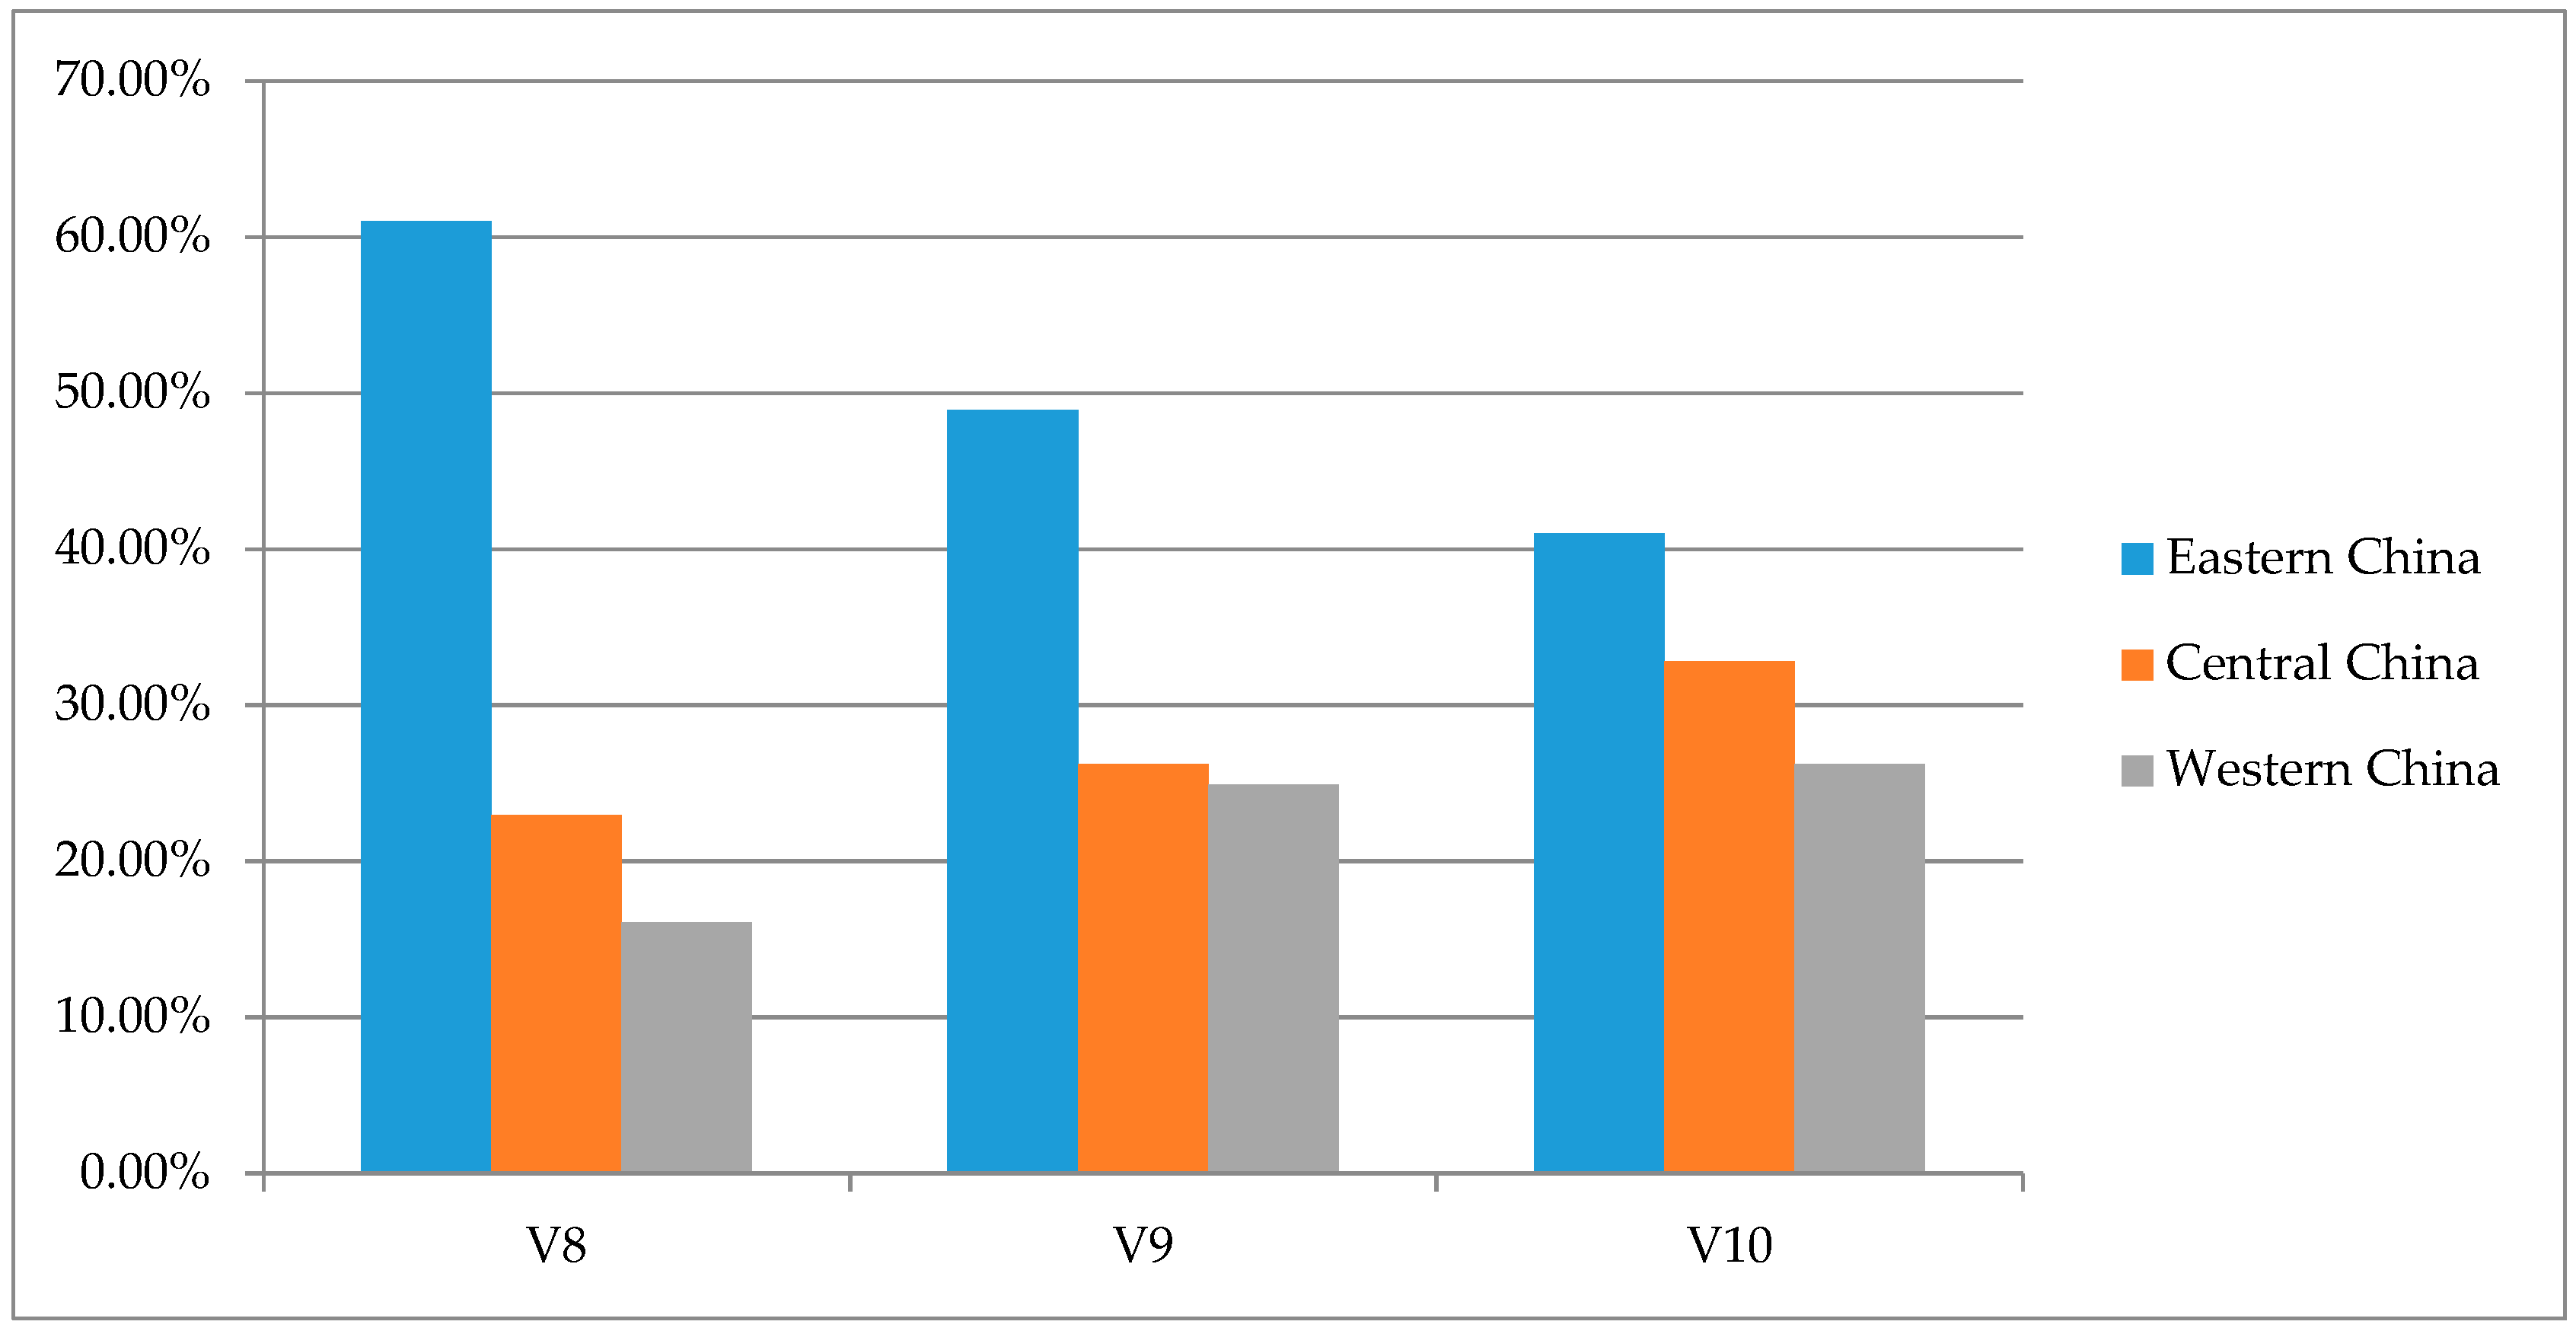
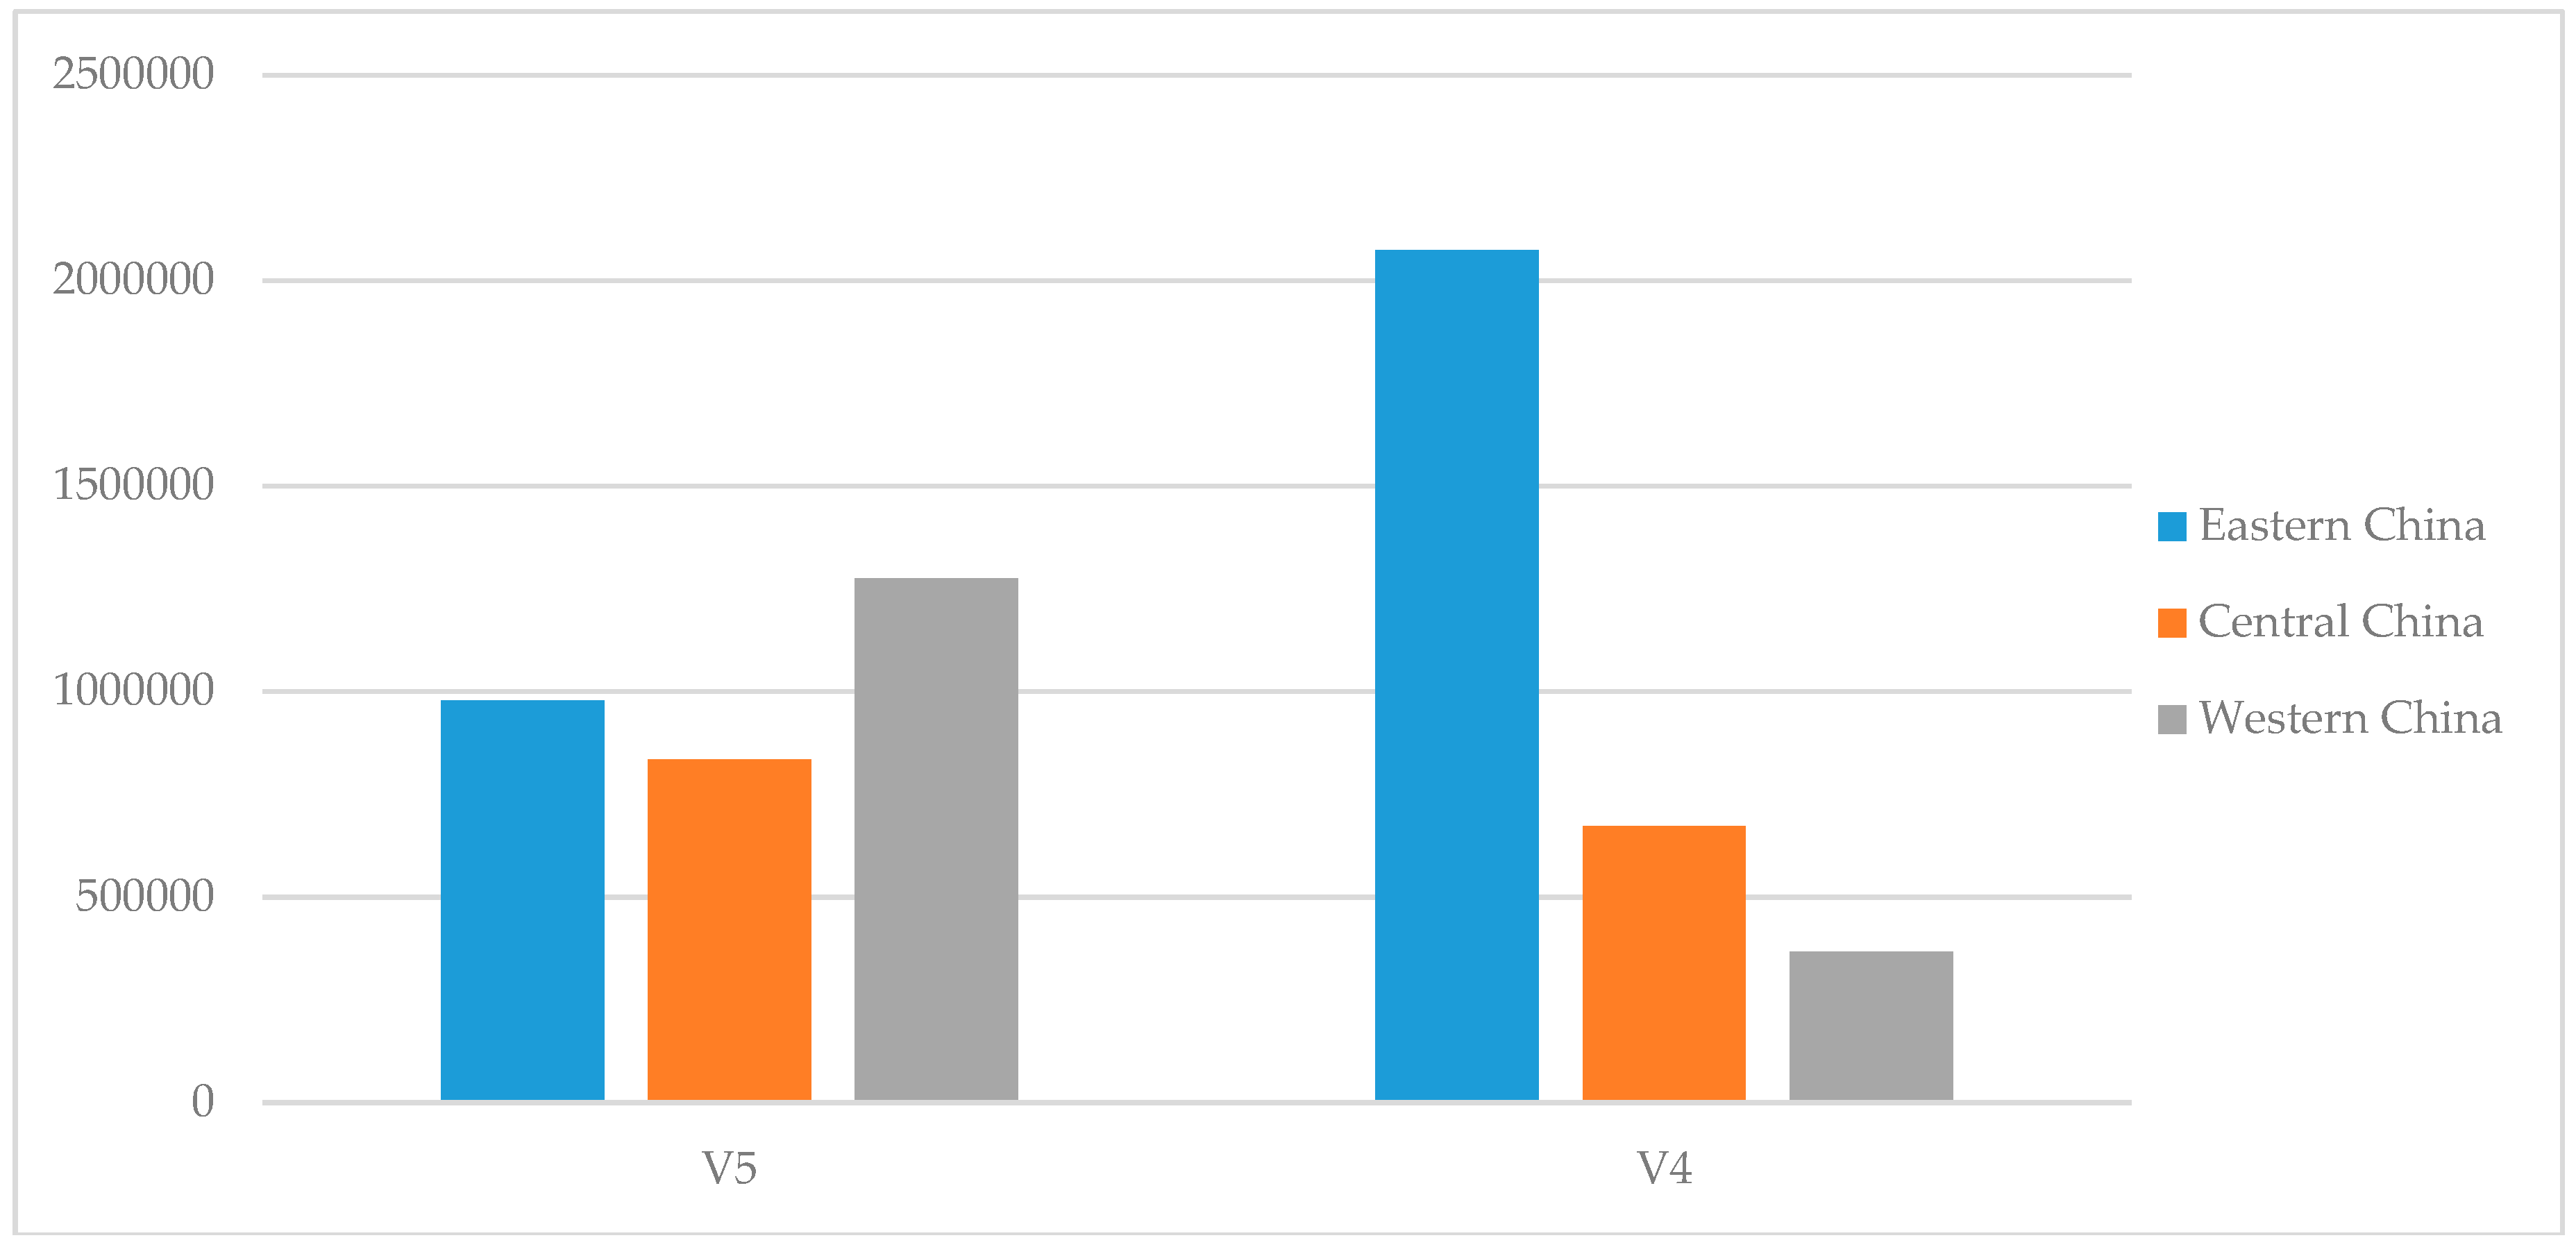
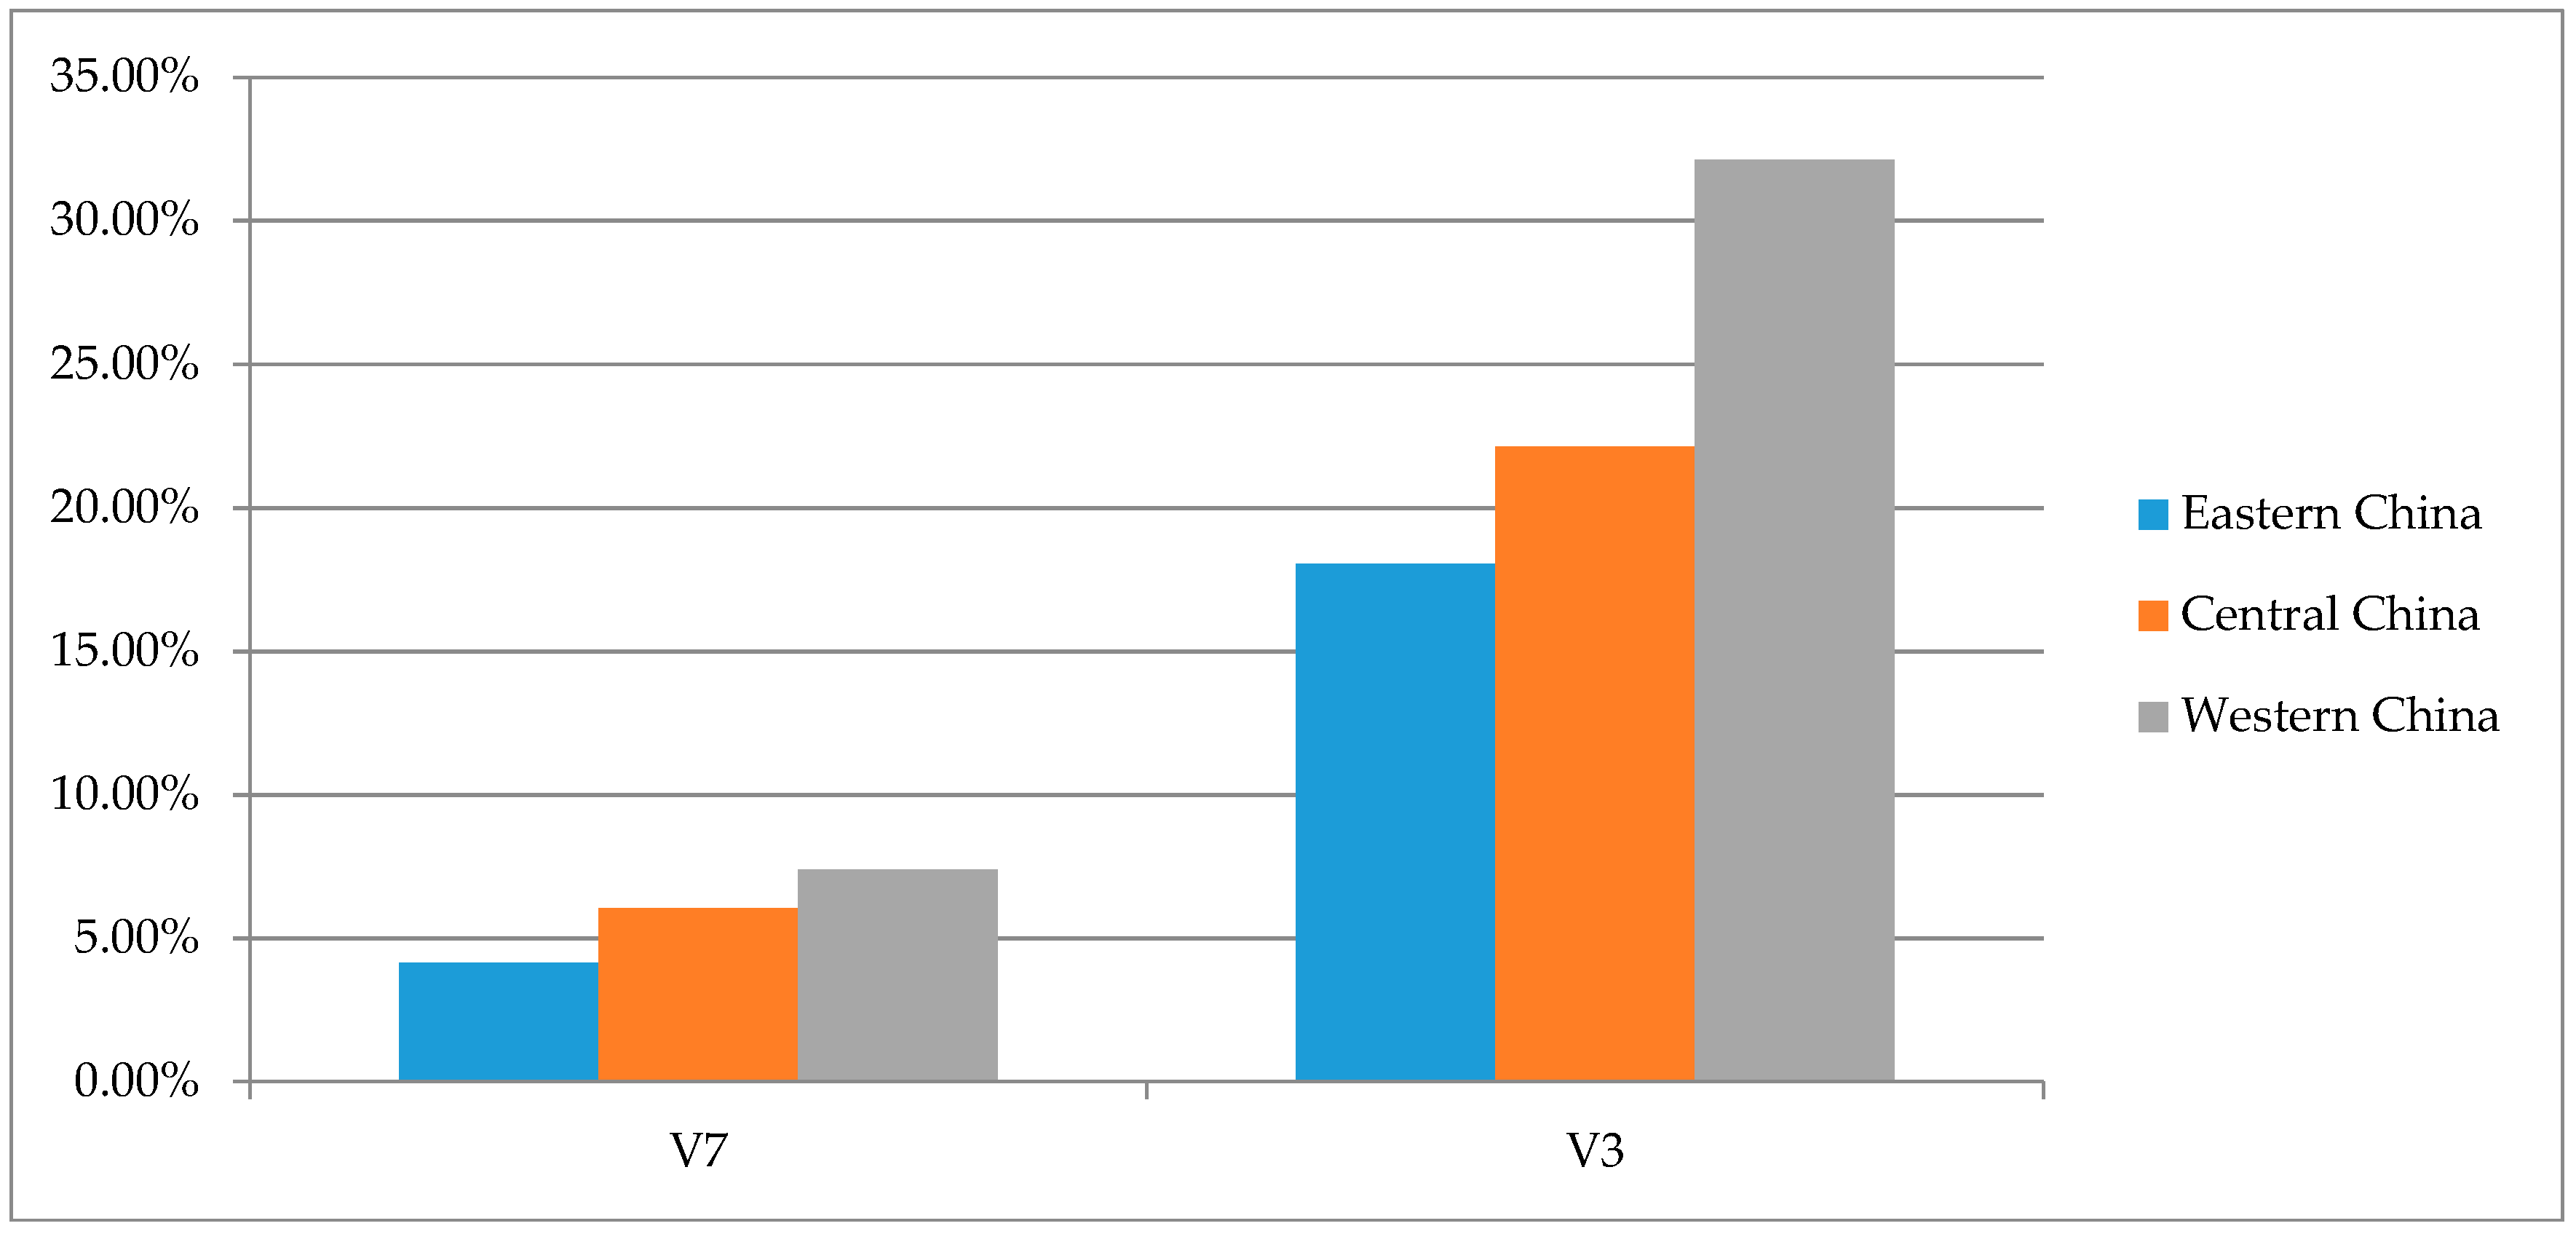
5.2. Regional Disparity Analysis

According to economic development level, the 31 provinces in China are divided into three regions: Eastern China, Central China and Western China, then the MIV and statistics of influencing factors are compiled and calculated.
Within the regions, as shown in Figure 3, innovation investment is the determinant of technology innovation in Eastern China. Enterprise scale, innovation investment and innovation environment have important influence on technology innovation in Central China. Innovation environment is the main restricting factor in Western China.
The MIV of innovation investment in Eastern, Central and Western China is 1309.87, 16.39 and −69.00 respectively (Figure 3), which reveals that innovation investment is the determinant of technology innovation in Eastern China, while it has negative effect in Western China, where innovation investment is seriously insufficient, constraining the improvement of technology innovation. The statistics also shows that R&D expenditure (V1), R&D personnel full time equivalent (V2) and industrial above-scale enterprise quantity (V4) account for 74.09%, 72.10% and 66.61% in Eastern China, 16.64%, 18.23% and 21.60% in Central China, 9.27%, 9.67% and 11.78% in Western China (Figure 4). Obviously, innovation investments mainly concentrate on Eastern China, with little investment in Central and Western China. Huge innovation investment difference exists in the eastern, central and western areas.
The MIV of innovation environment in Eastern, Central and Western China is 237.96, 1.51 and −159.81 respectively, which shows that innovation environment in Eastern China contributes more than Western China, where innovation environment has a negative effect, and is the biggest obstacle restricting technology innovation (Figure 3). The statistics also show that the proportion of finished products of foreign-invested industrial enterprises (V8), per capita GDP (V2) and average number of students in general college per one hundred thousand people(V10) account for 60.99%, 48.88% and 40.99% in Eastern China, 22.95%, 26.23% and 32.78% in Central China, 16.06%, 24.88% and 26.23% in Western China (Figure 5). It can be found that the statistics of innovation environment in Eastern China are superior to that of Central and Western China, but the regional disparity of innovation environment is less than that of innovation investment.
The MIV of enterprise scale in Eastern, Central and Western China is −152.90, 51.06 and 25.95 respectively, which shows that the impact of the enterprise scale varies in different areas, with positive influences in Central and Western China, but a negative influence in Eastern China. The statistics also reveal that the average output value of industrial above-scale enterprises (V5) in Eastern, Central and Western China is 977,790 thousand, 834,870 thousand and 1,275,170 thousand respectively. The industrial above-scale enterprise quantity (V4) of Eastern, Central and Western China is 2,074,034, 672,614 and 366,928 (Figure 6). The enterprises in Eastern China emerge with features of smaller scale and larger quantity, while larger scale and least quantity are the characteristics of Western China.
The MIV of government support in Eastern, Central and Western China is −60.64, −31.49 and −50.291 respectively (Figure 3), which indicates that in all regions of China, the greater government support, the poorer technology innovation performance. Government support funds are excessively involved in enterprise R&D activities. The statistics show that the proportion of government funds accounted for by internal R&D expenditure (V7) and the proportion of state capital of industrial above-scale enterprises (V3) account for 4.15% and 18.05% in Eastern China, 6.04% and 22.13% in Central China, 7.39% and 32.11% in Western China (Figure 7). The statistic indicators of government support are highest in Western China and the lowest in Eastern China.
The above-mentioned results confirm the hypotheses H1–H4, i.e., the effects of innovation investment, innovation environment, enterprise scale and government support all have regional differences.

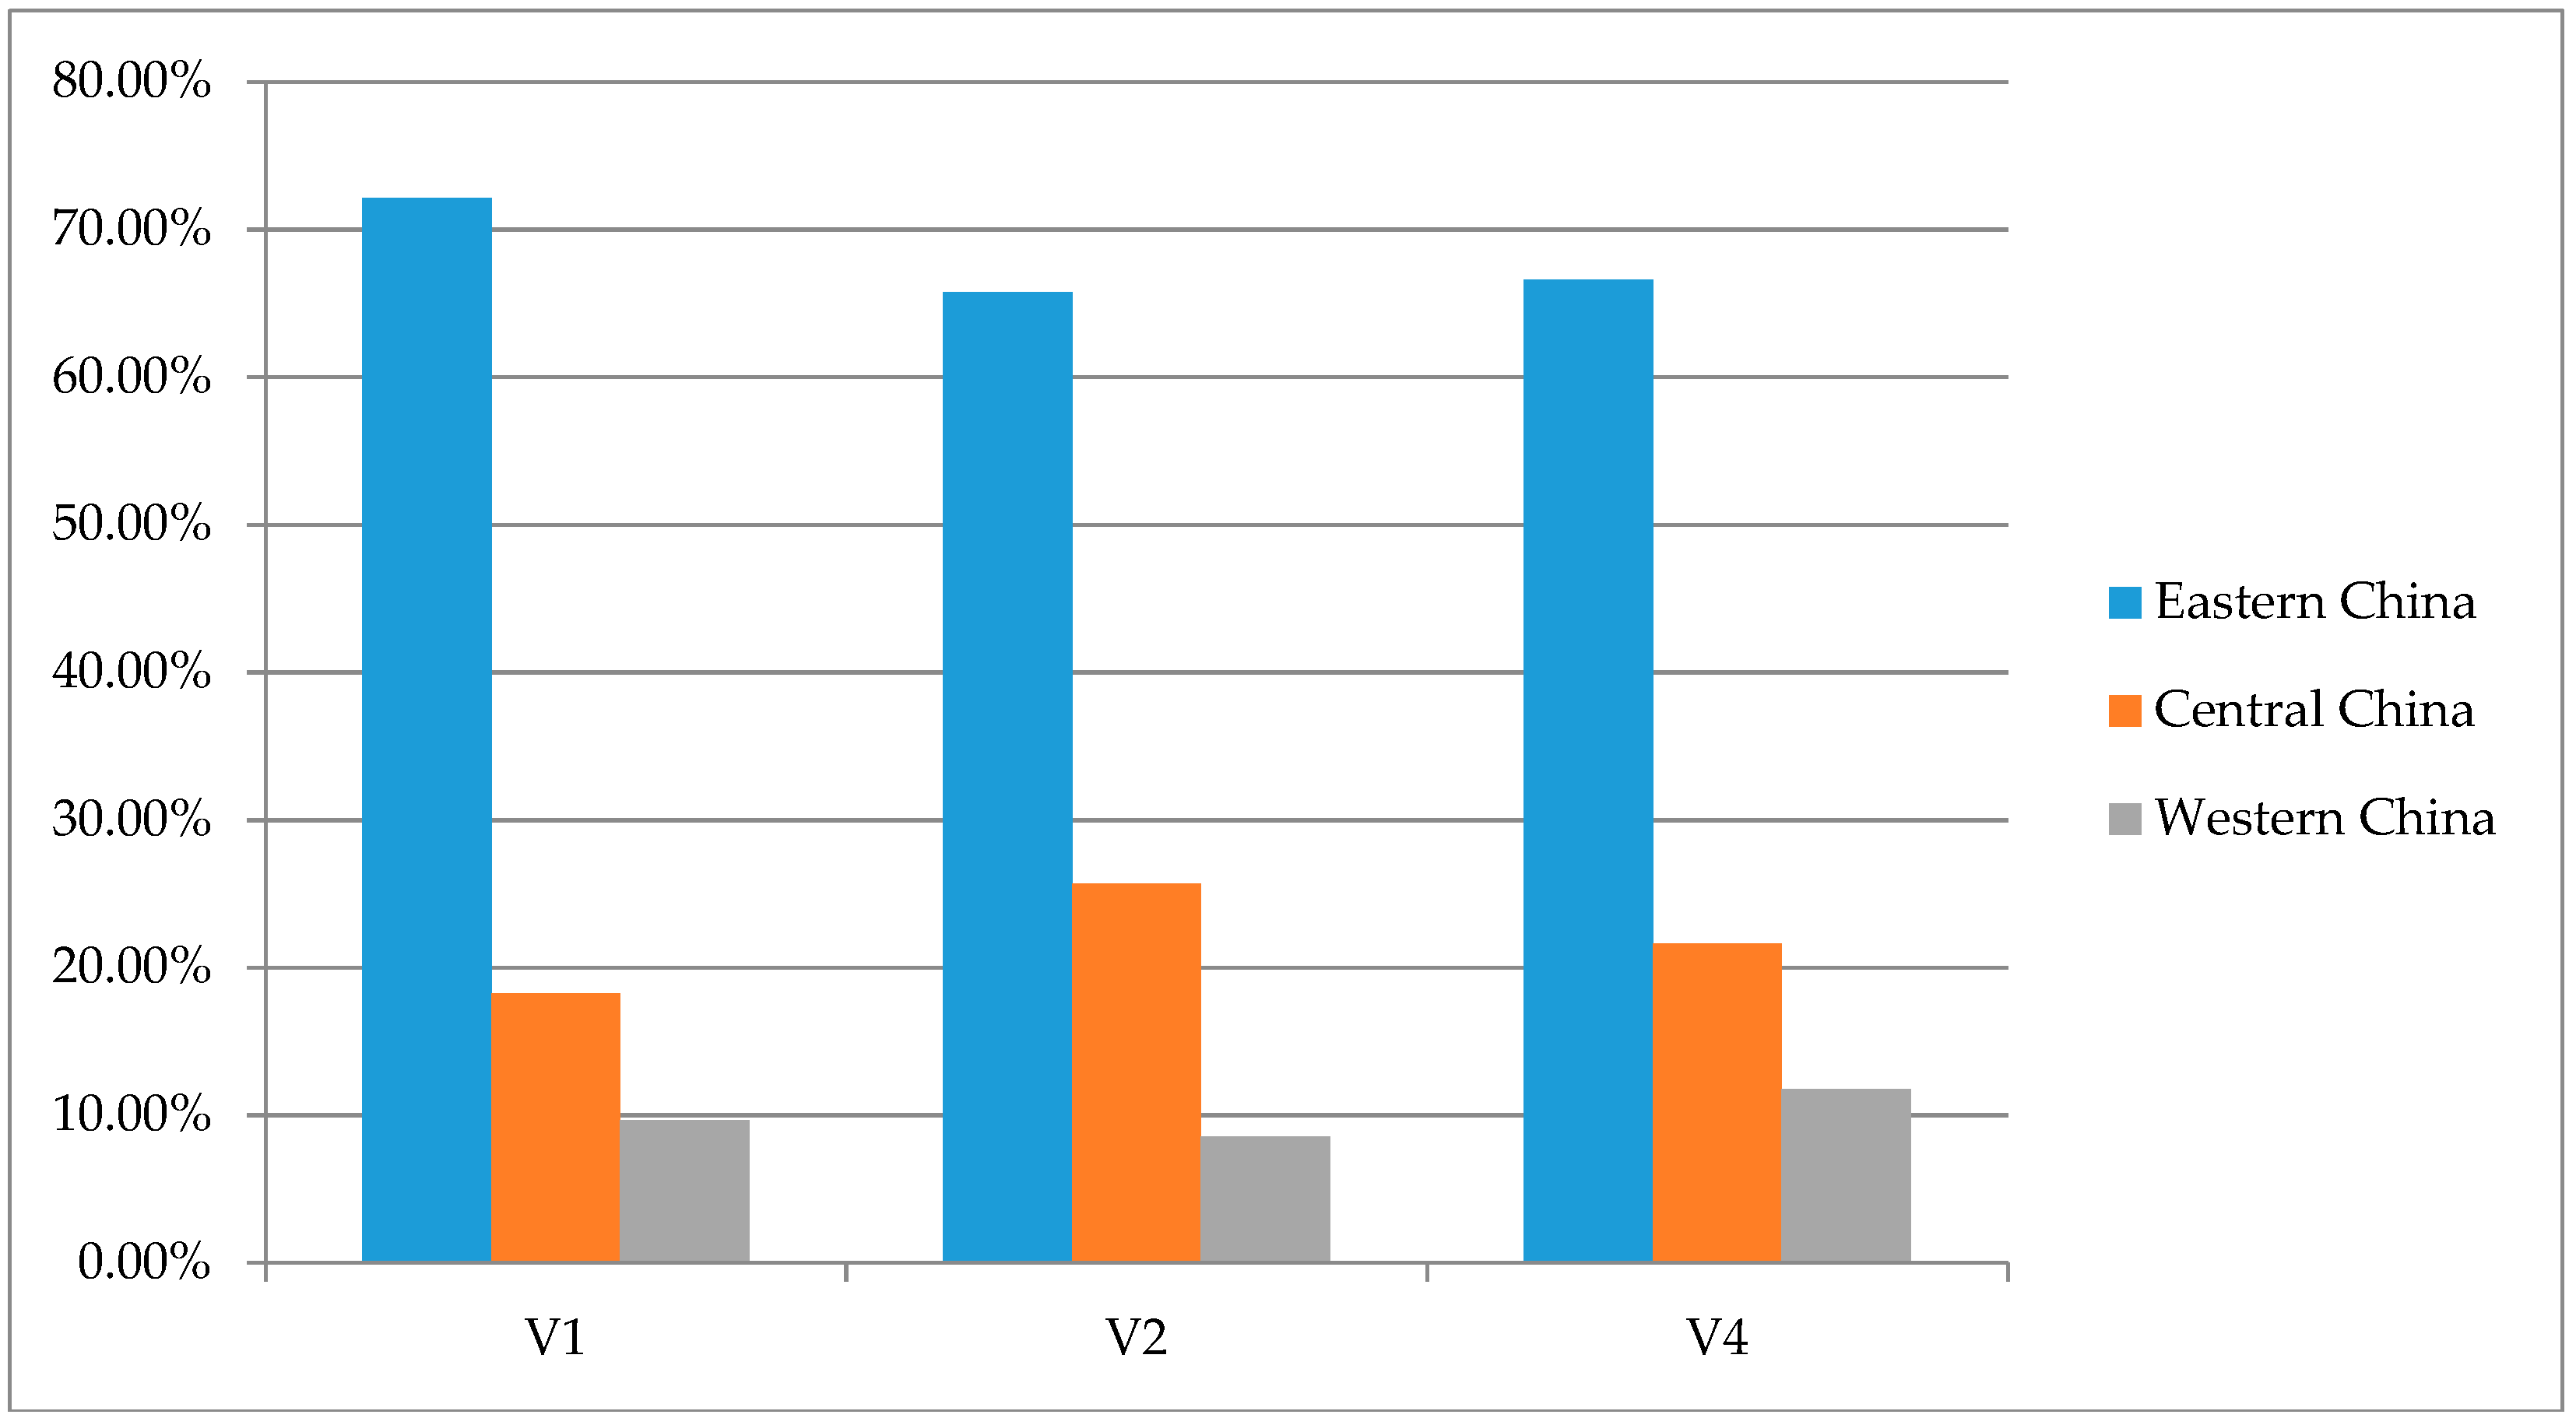
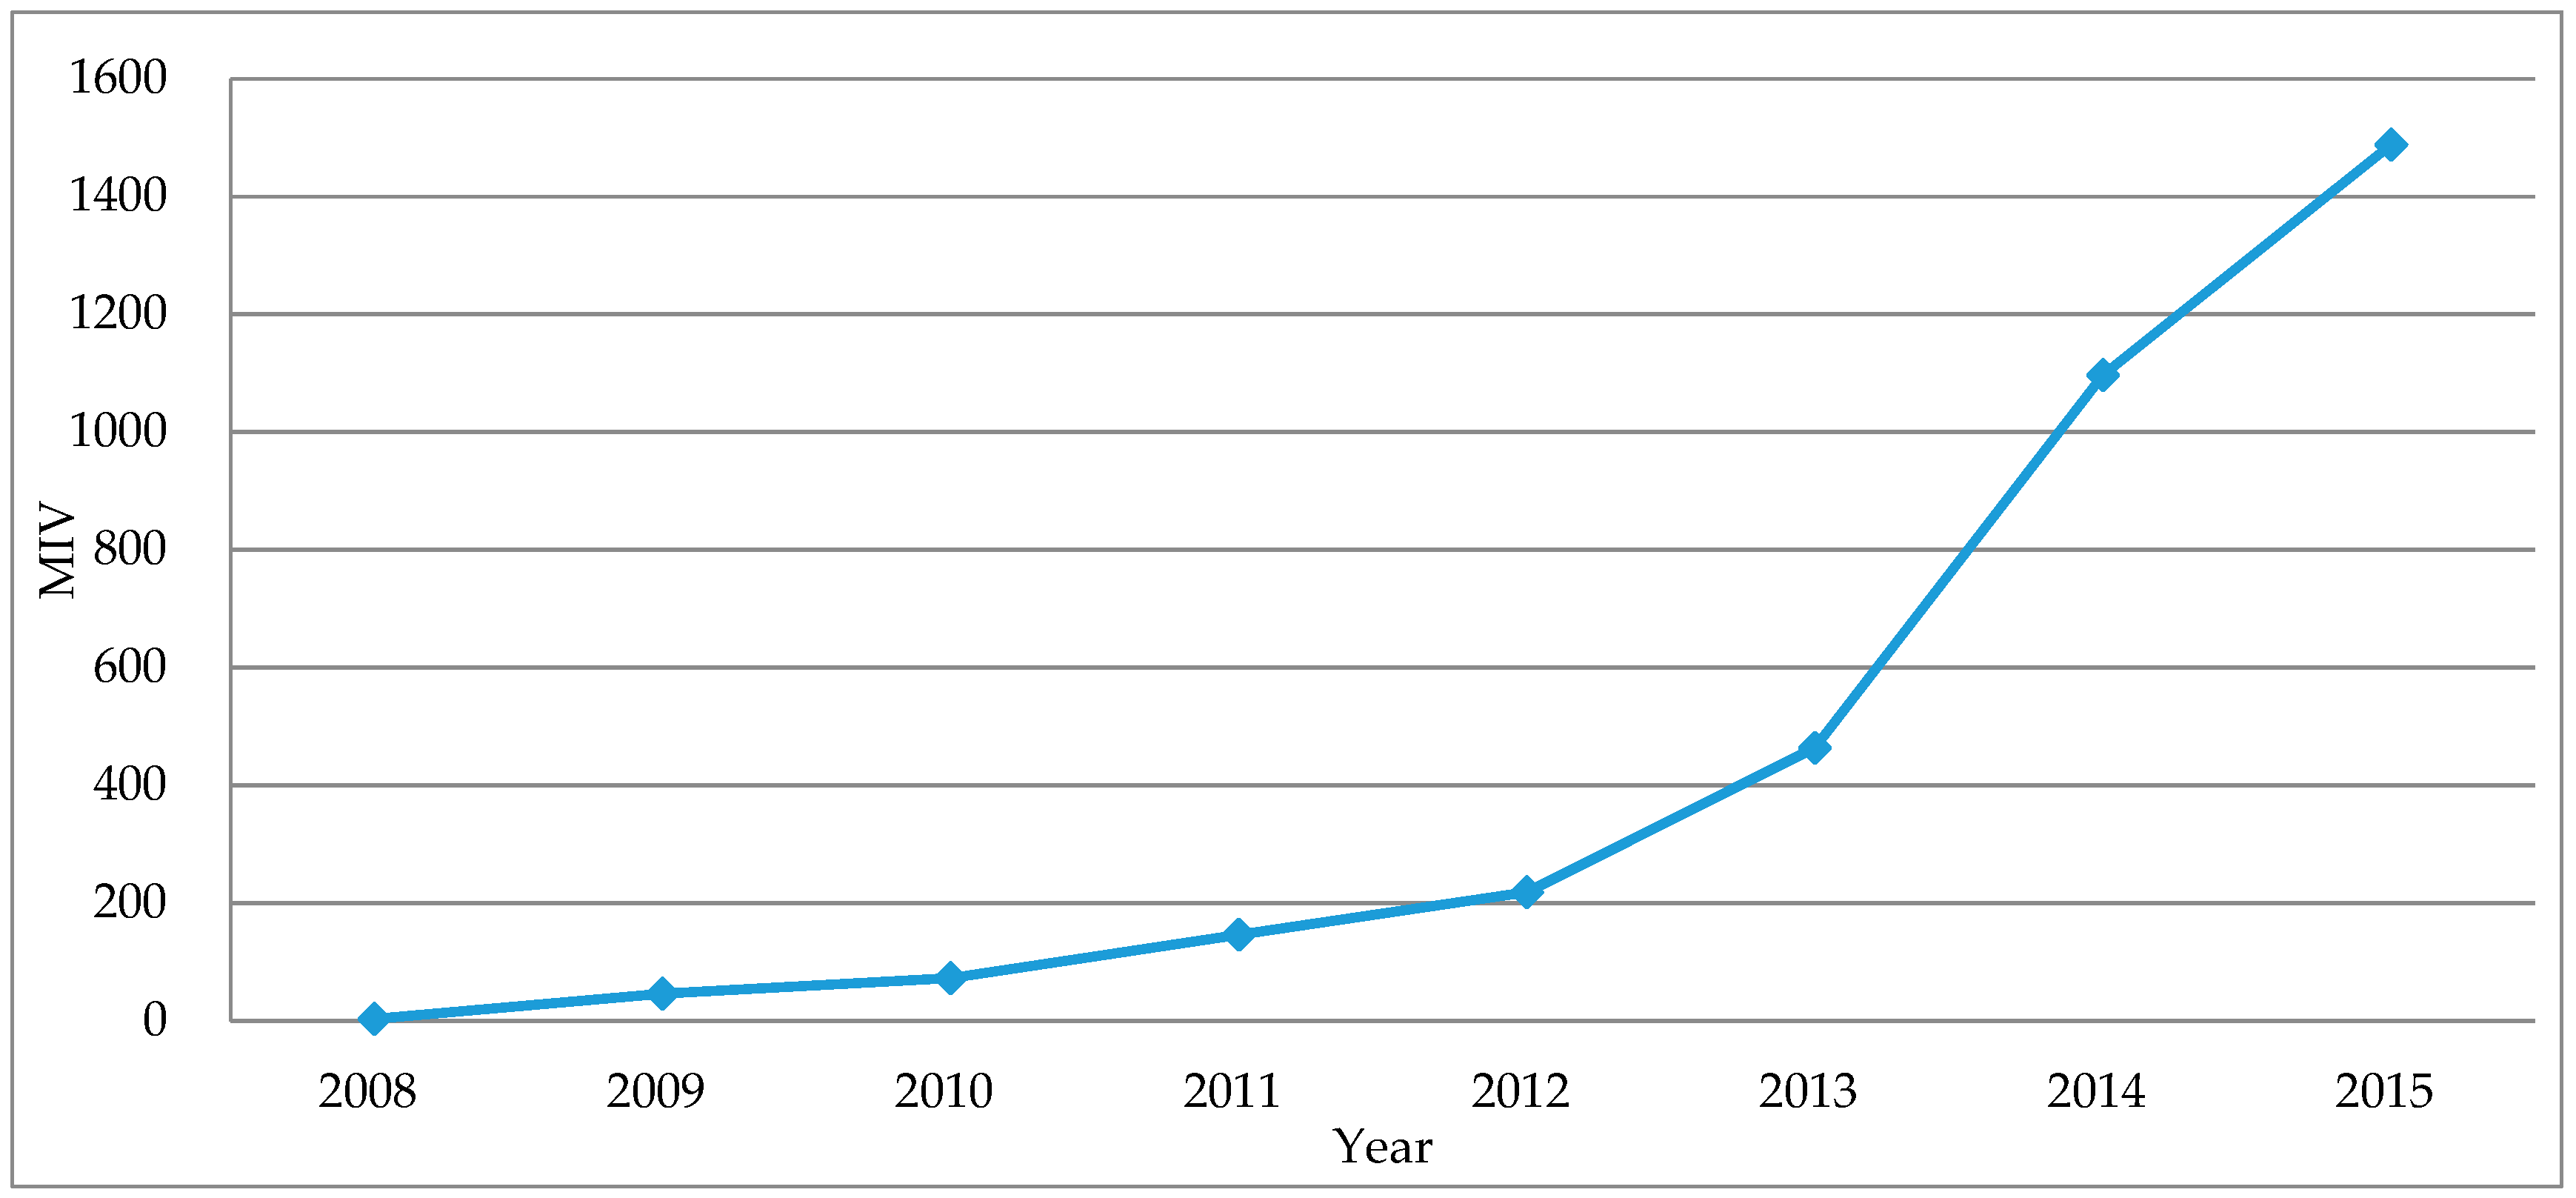
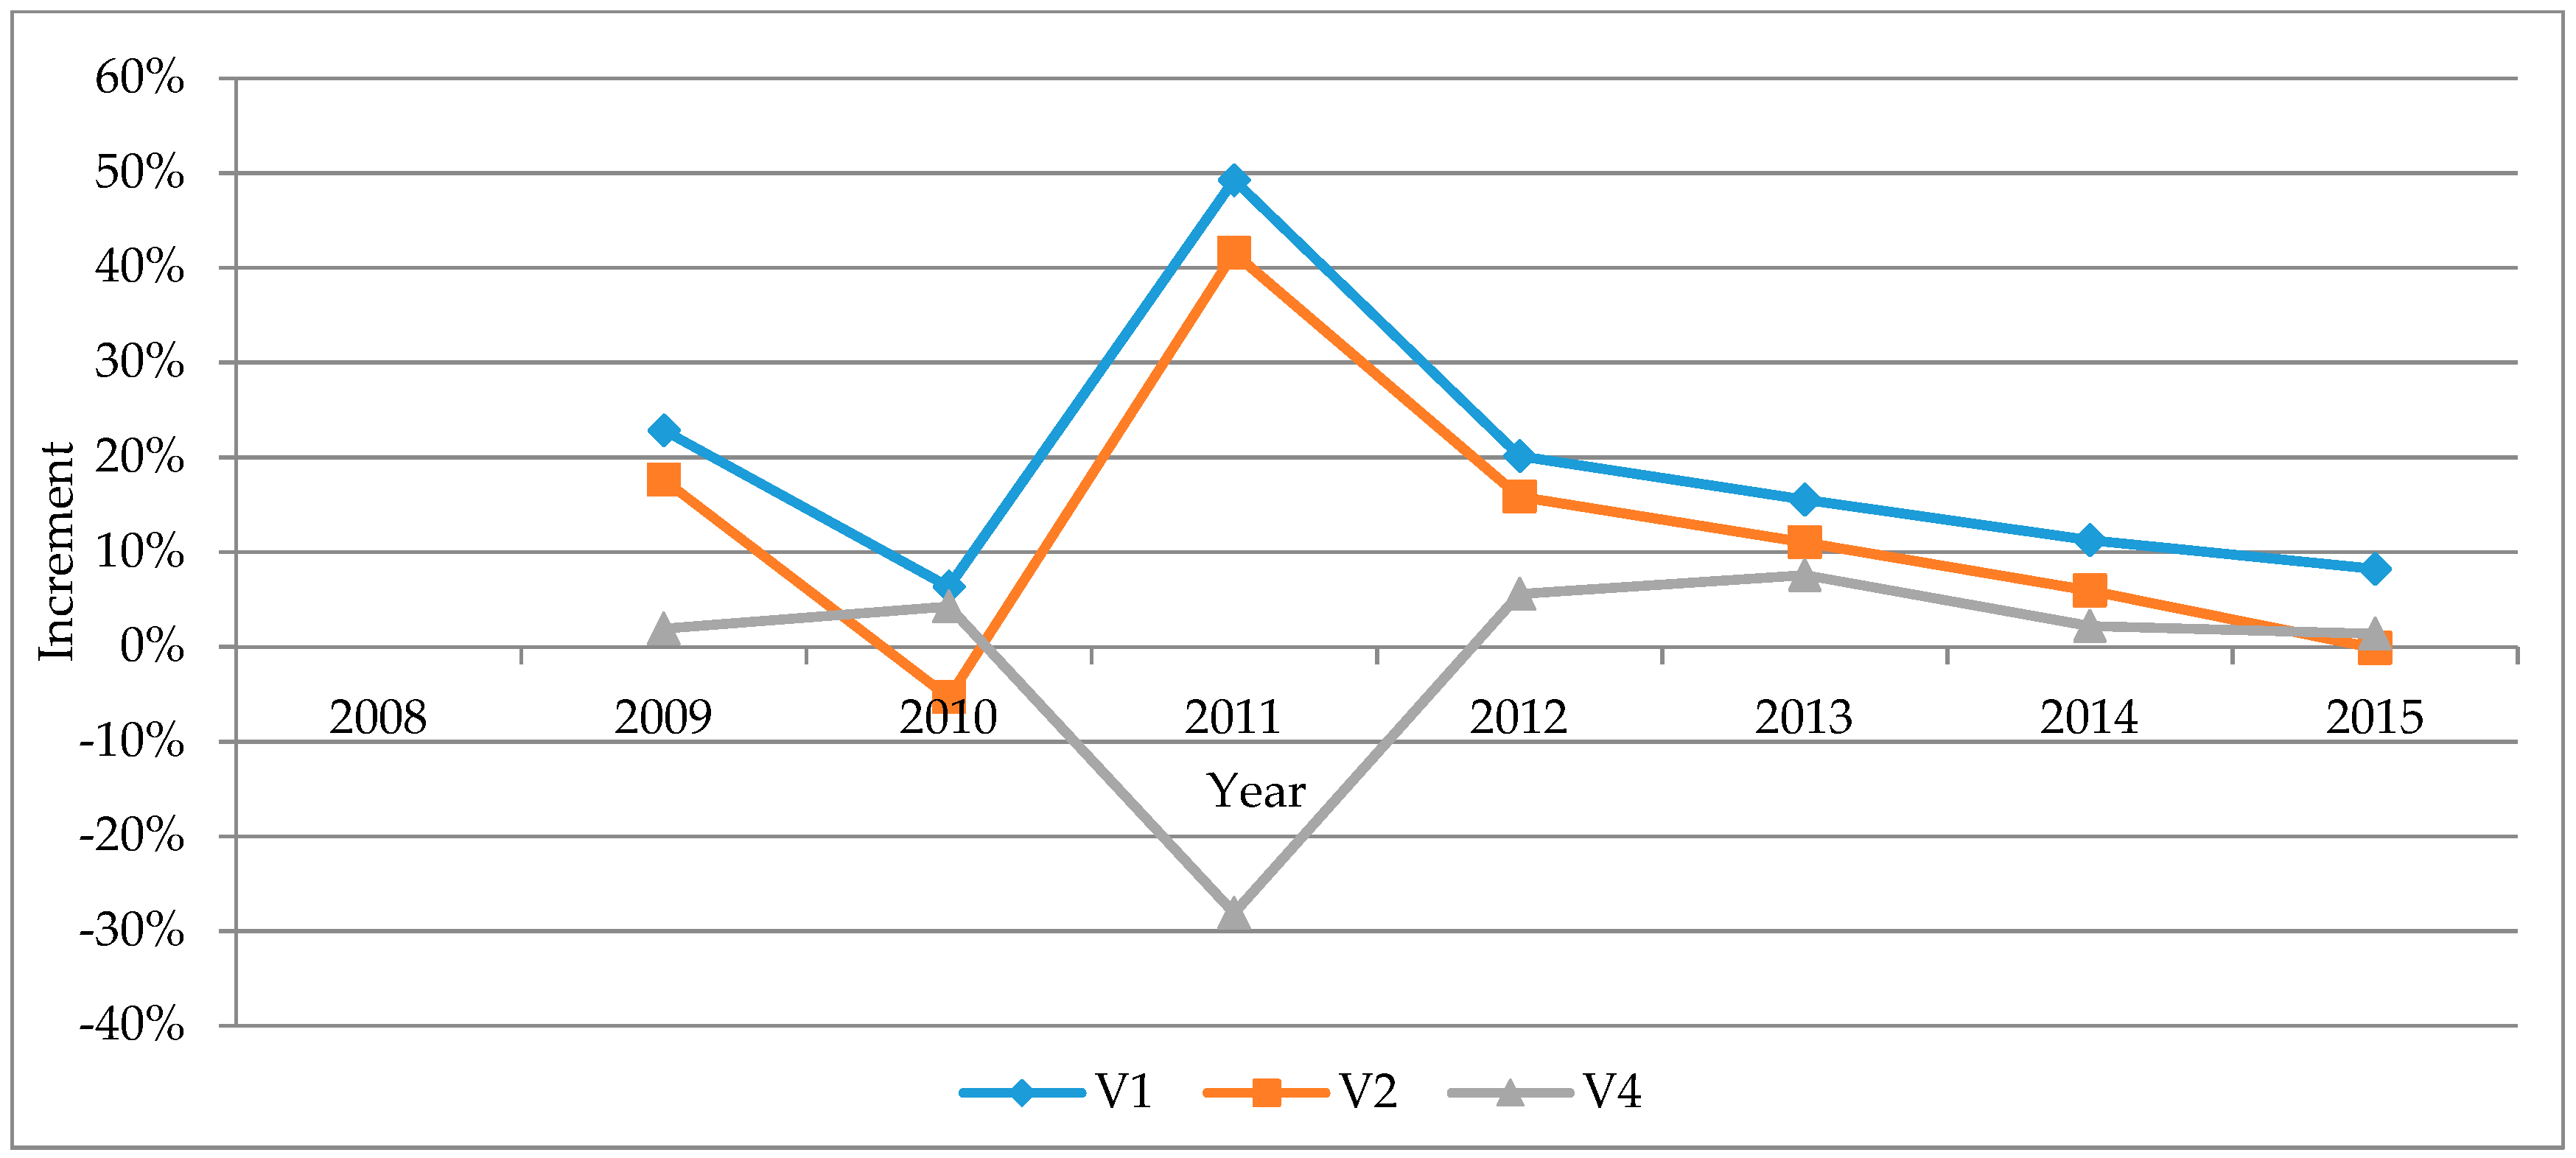
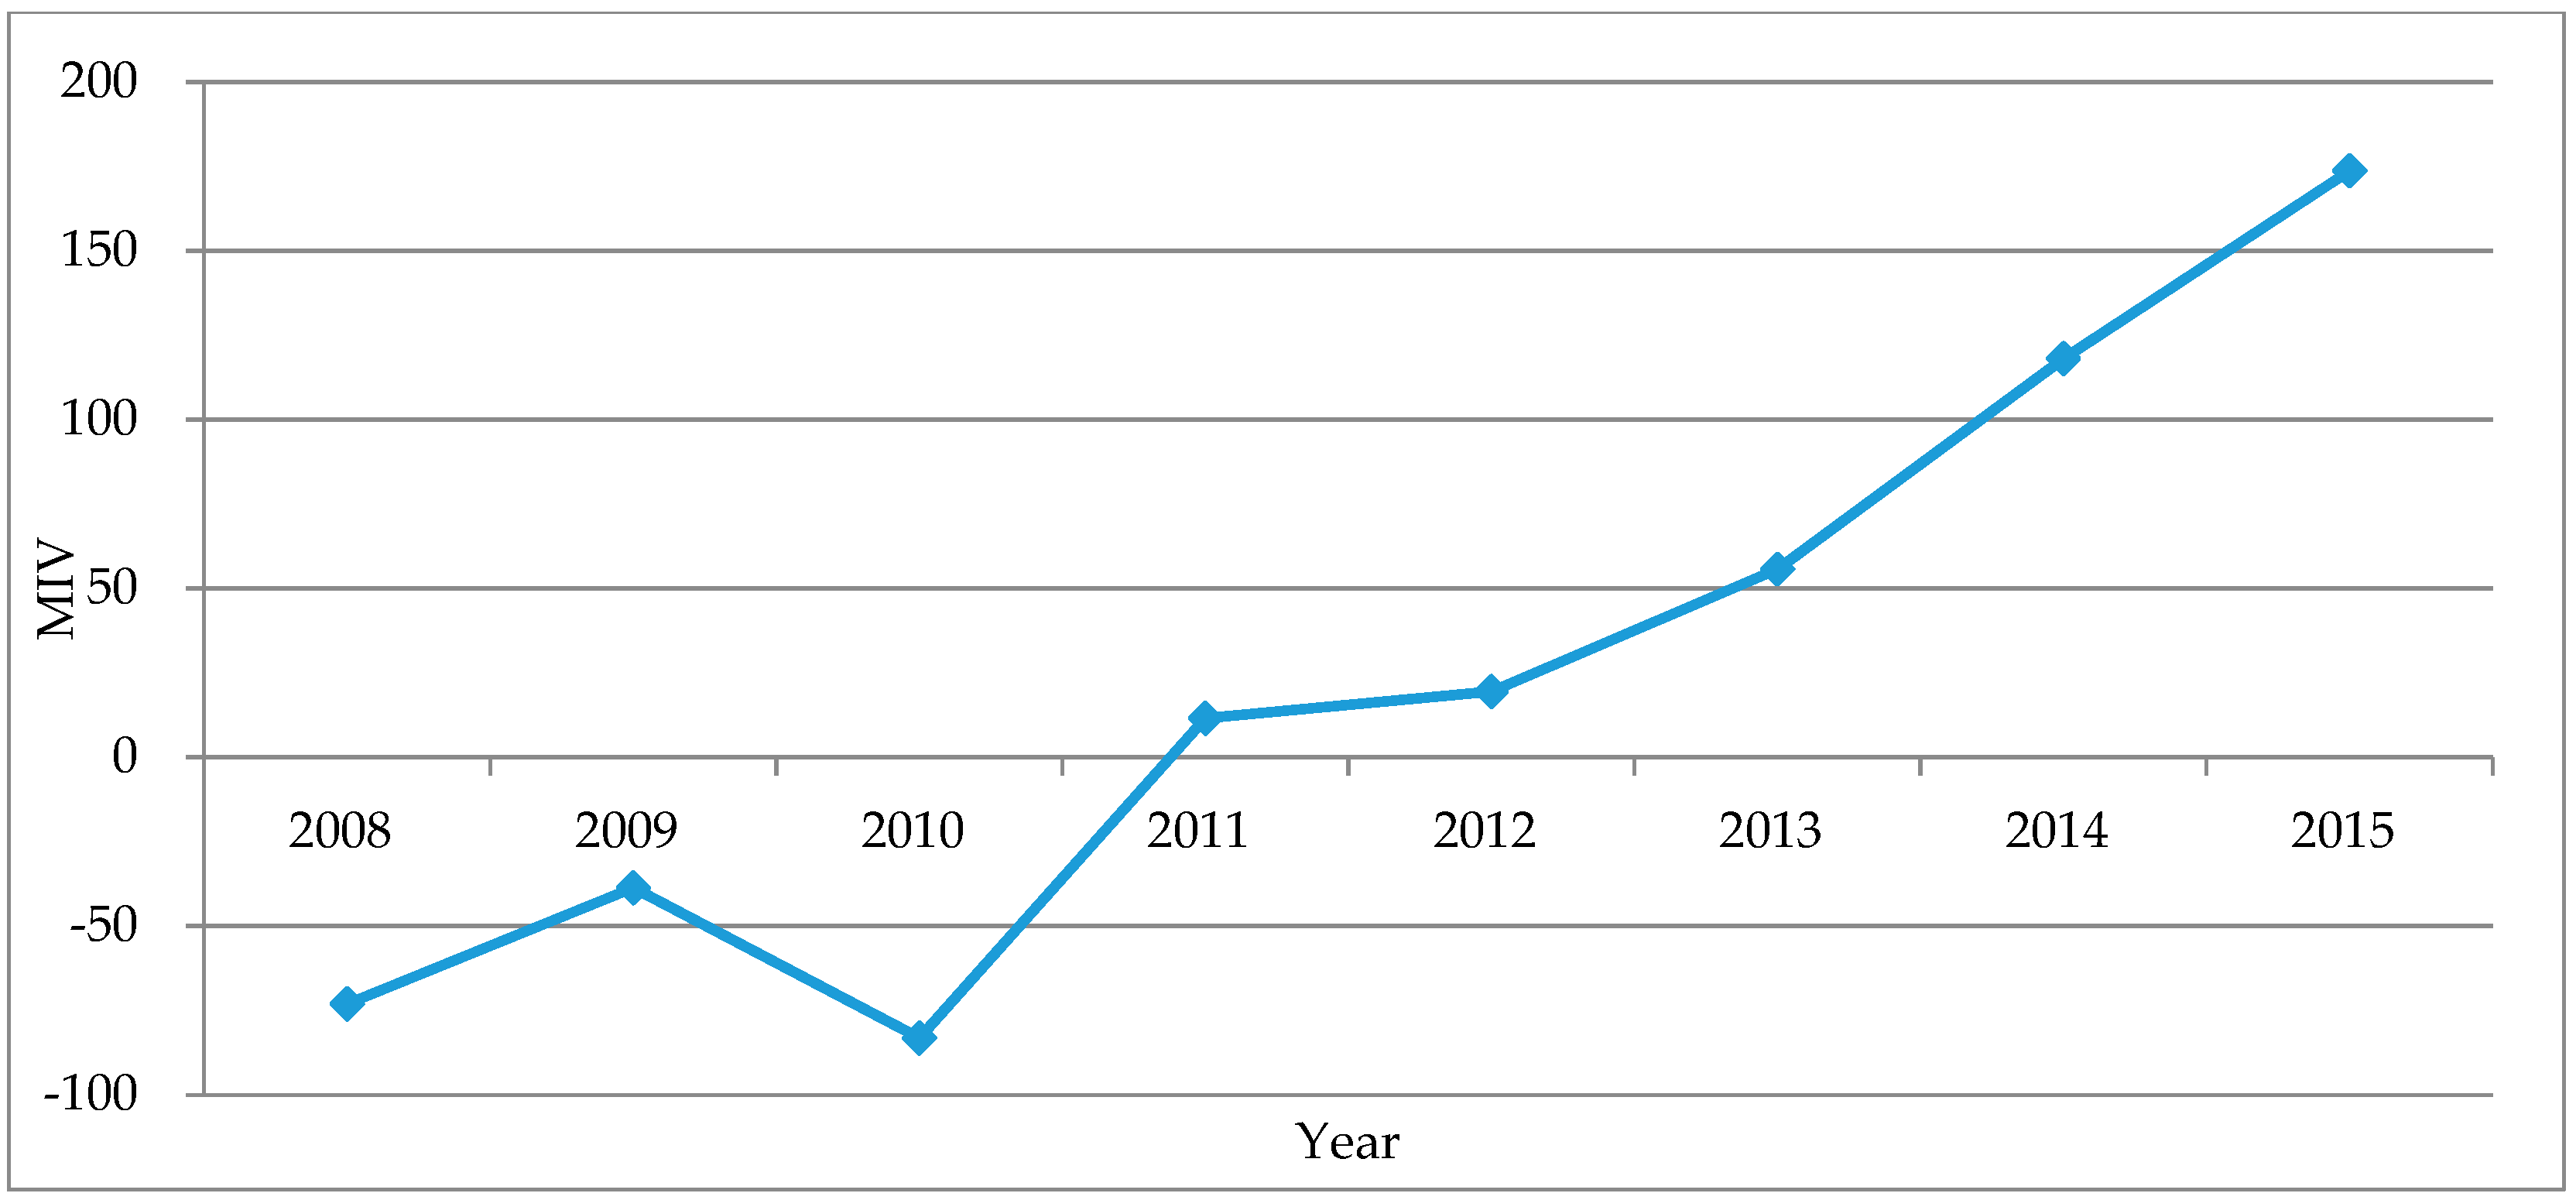
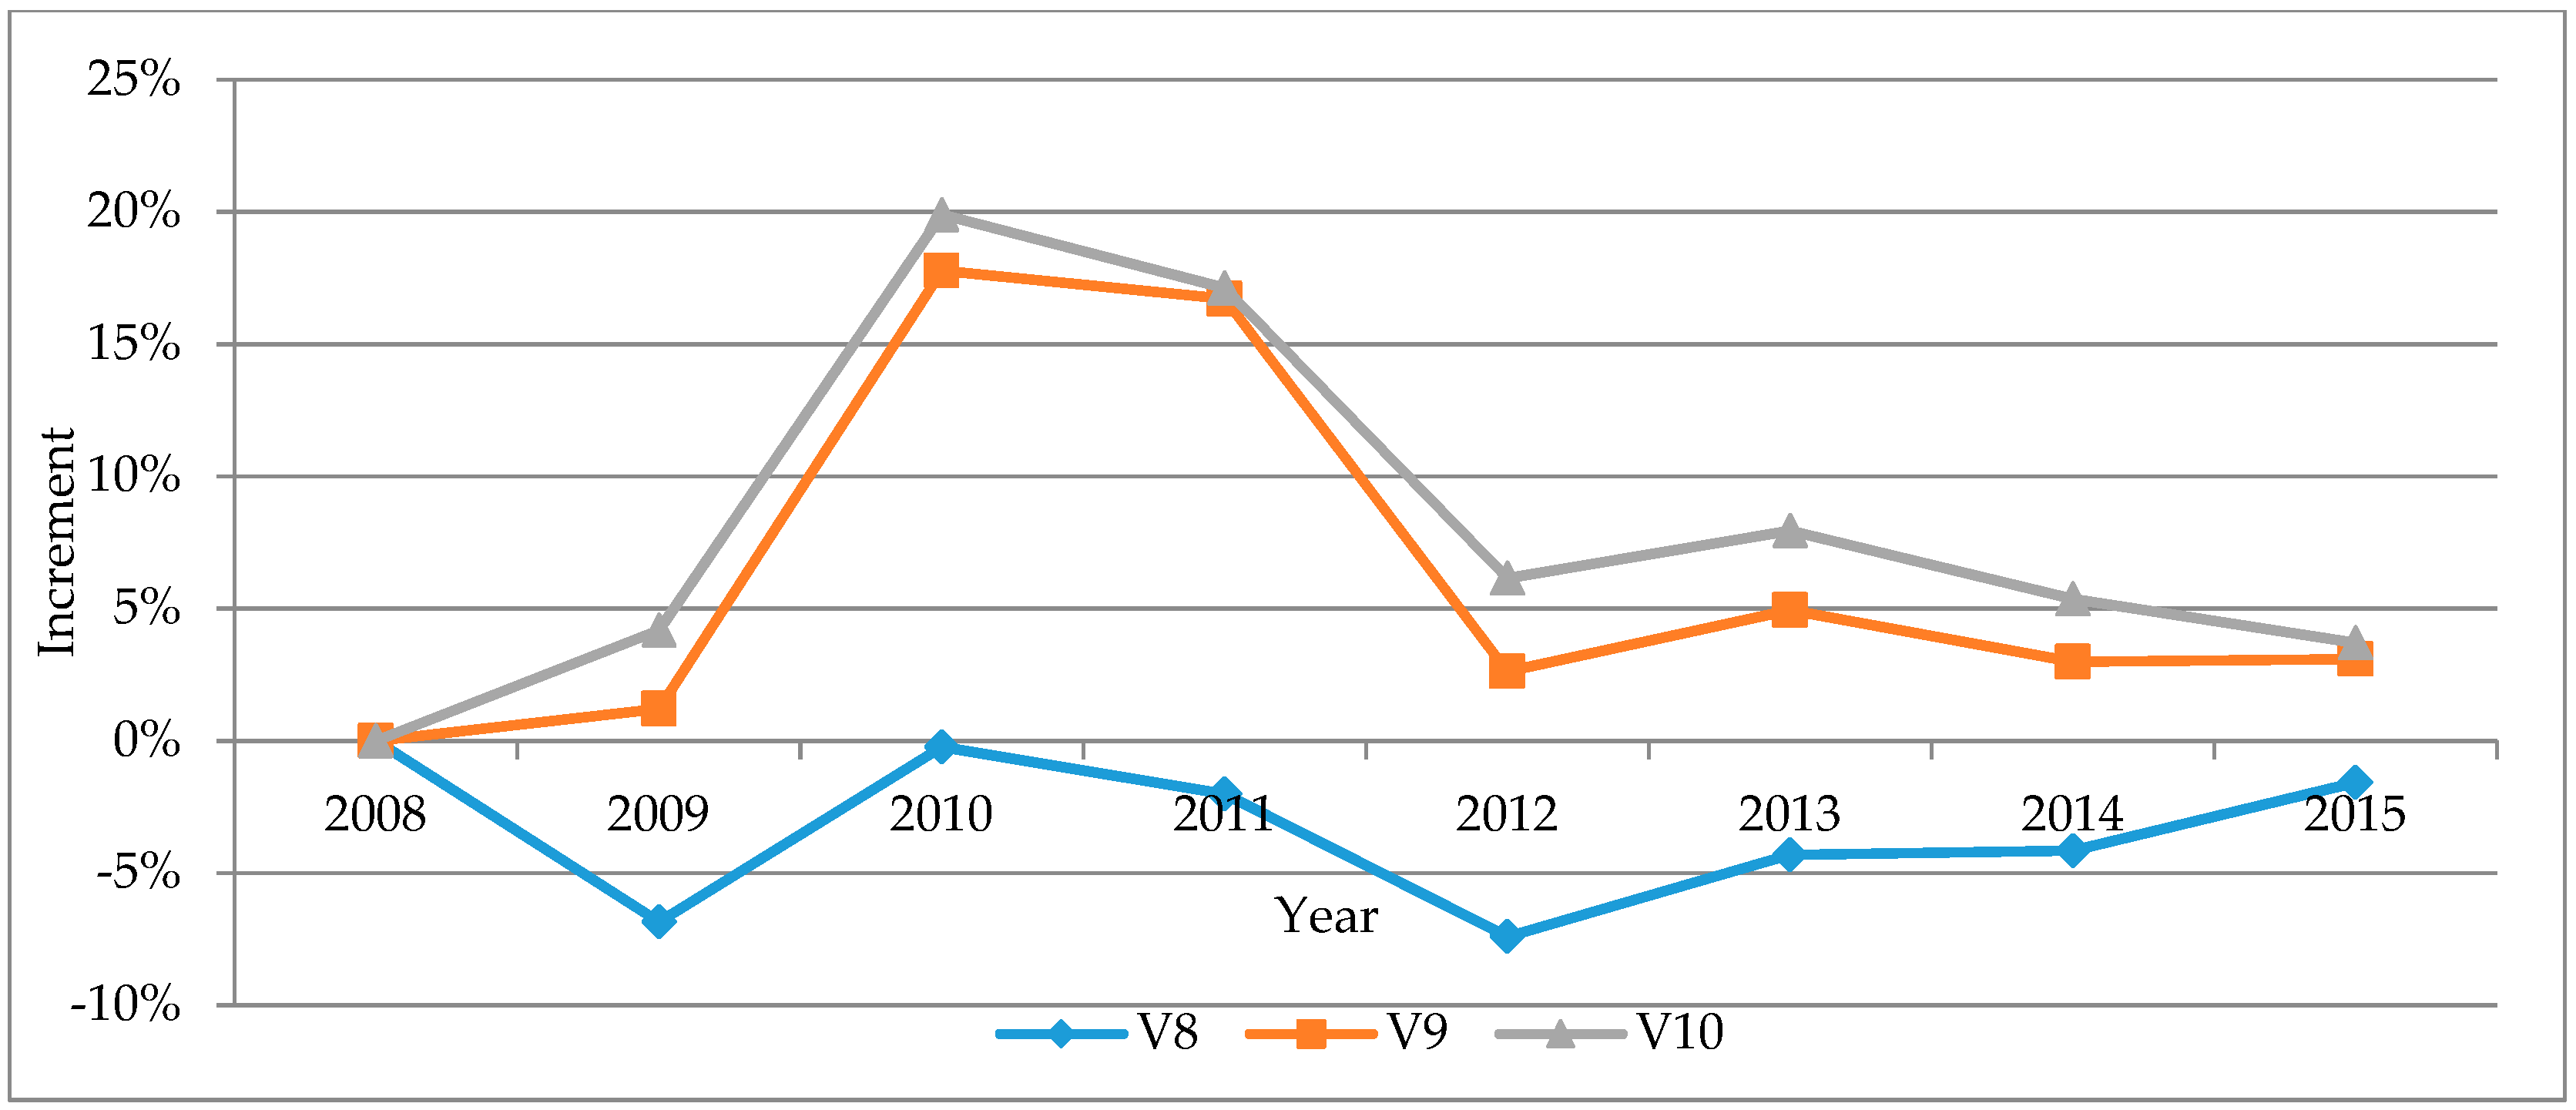
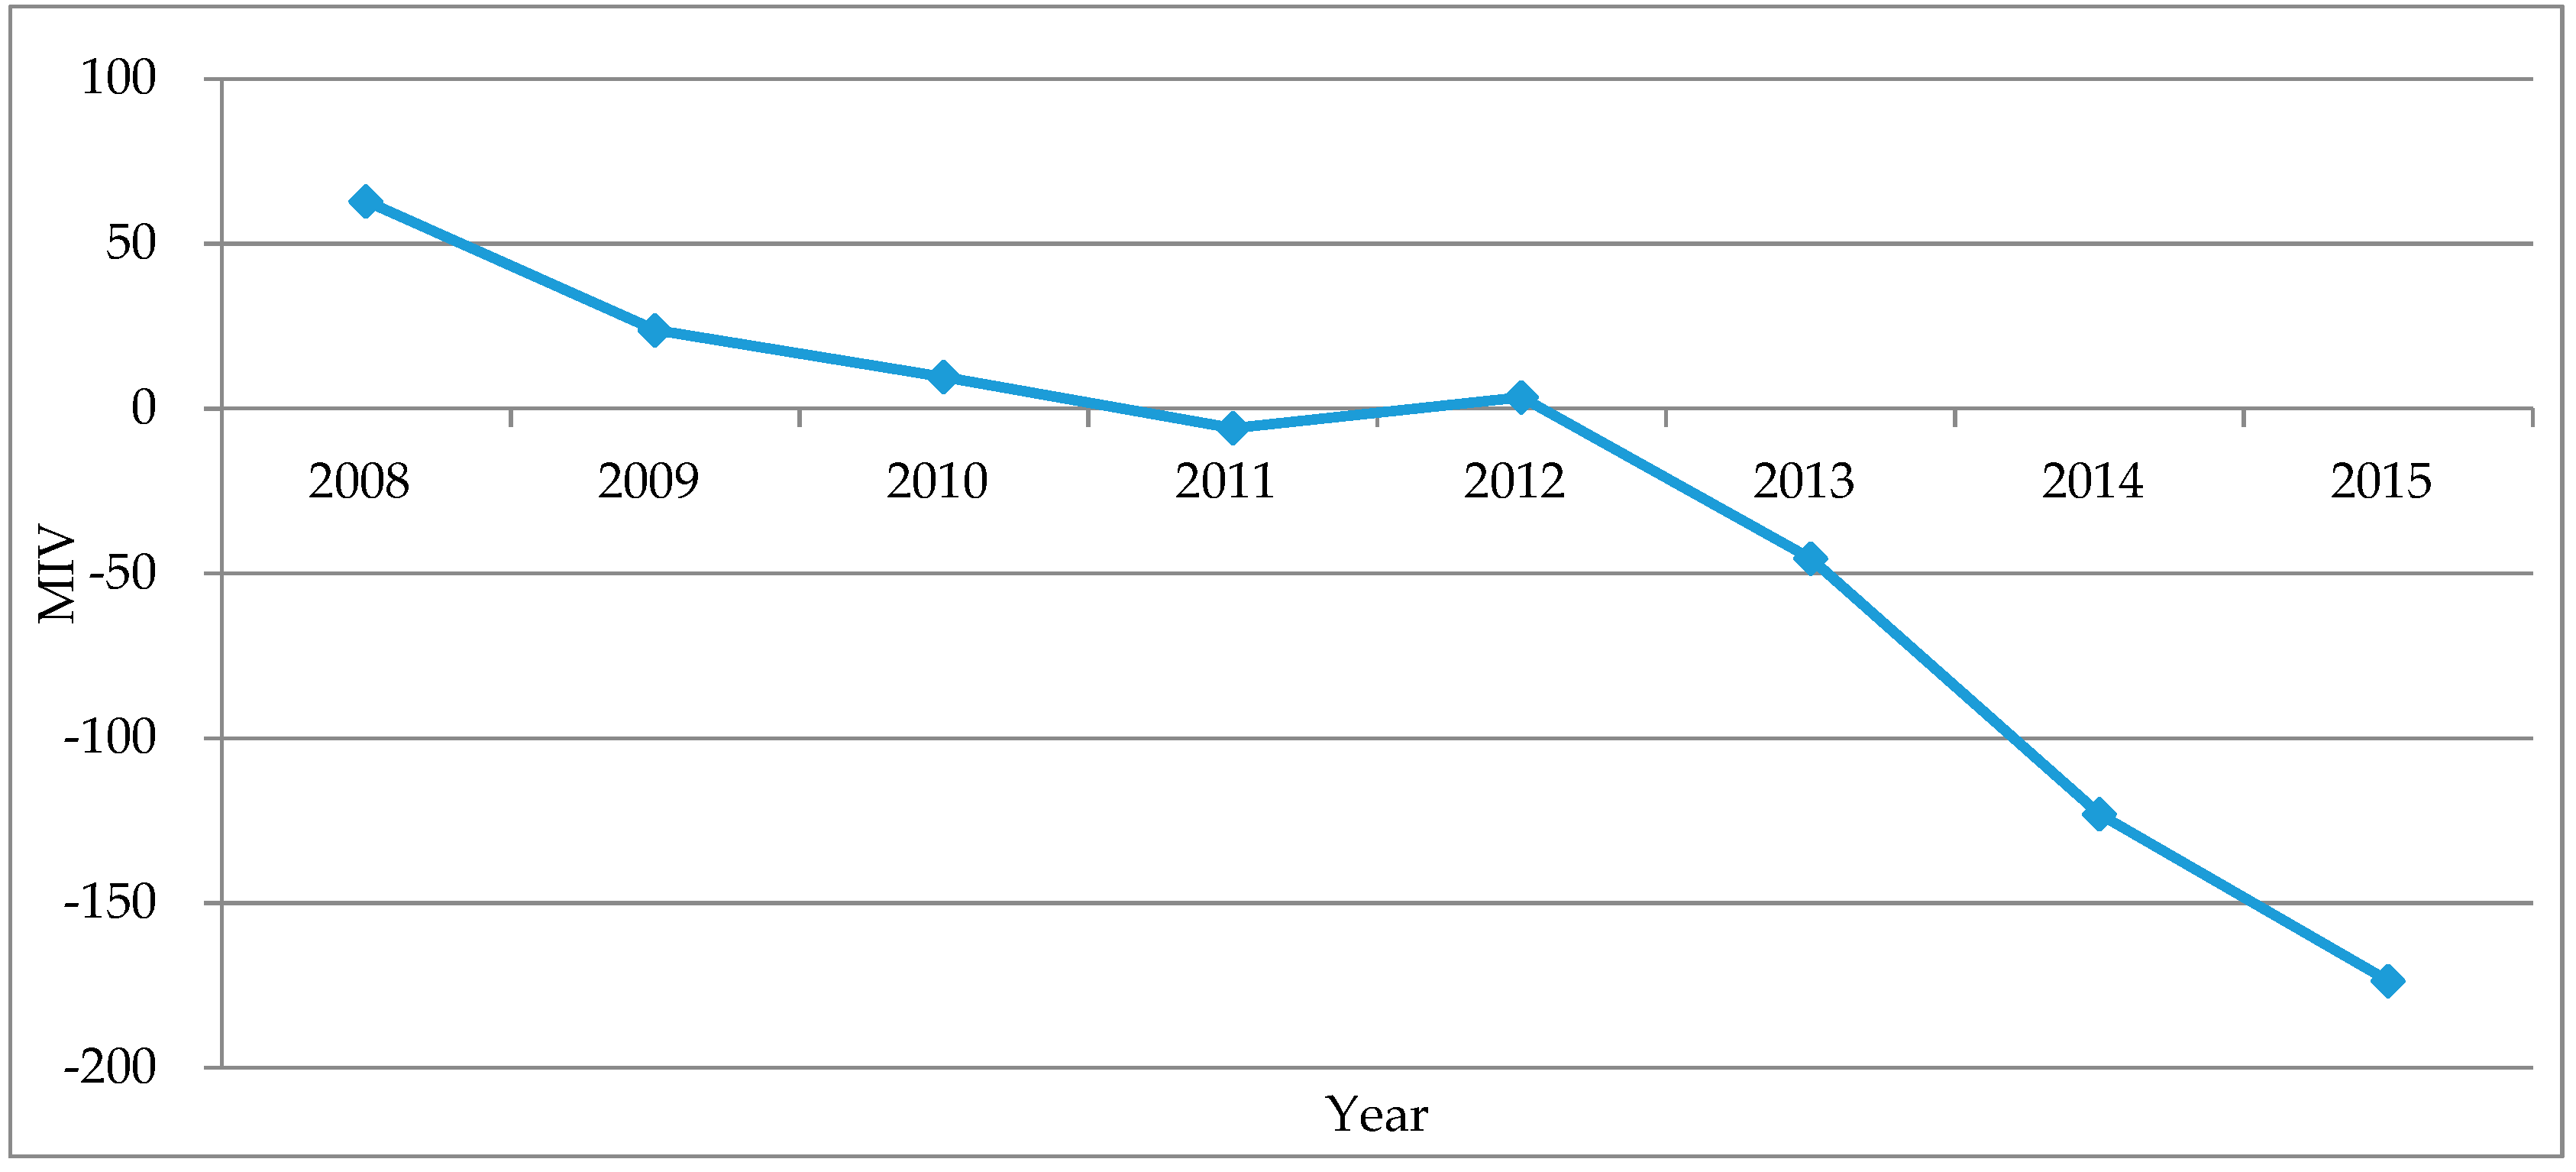
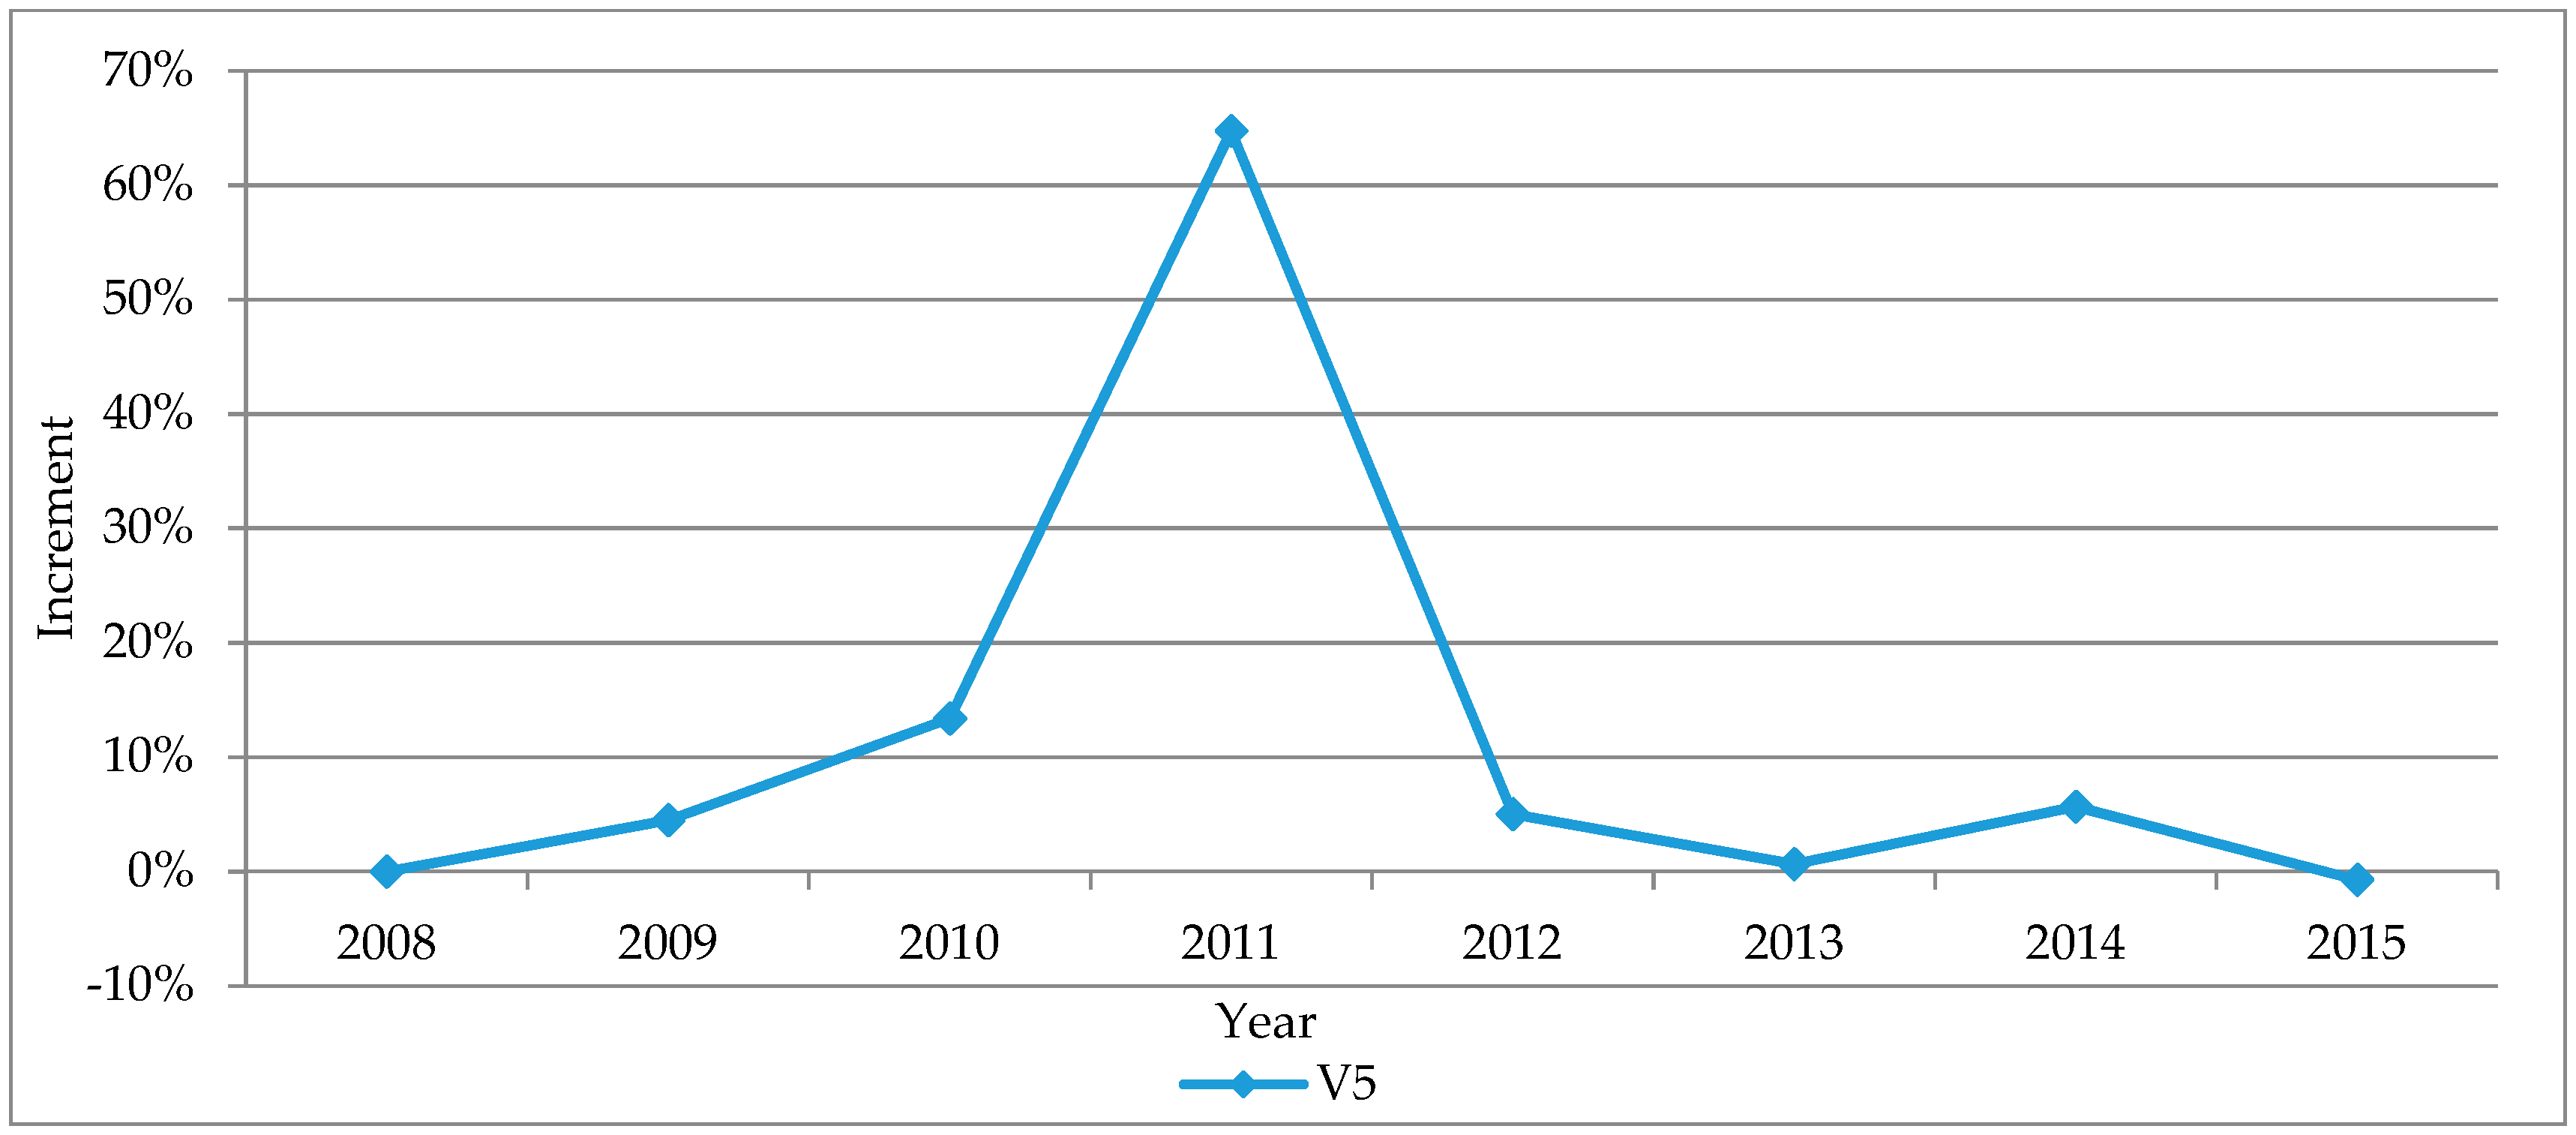
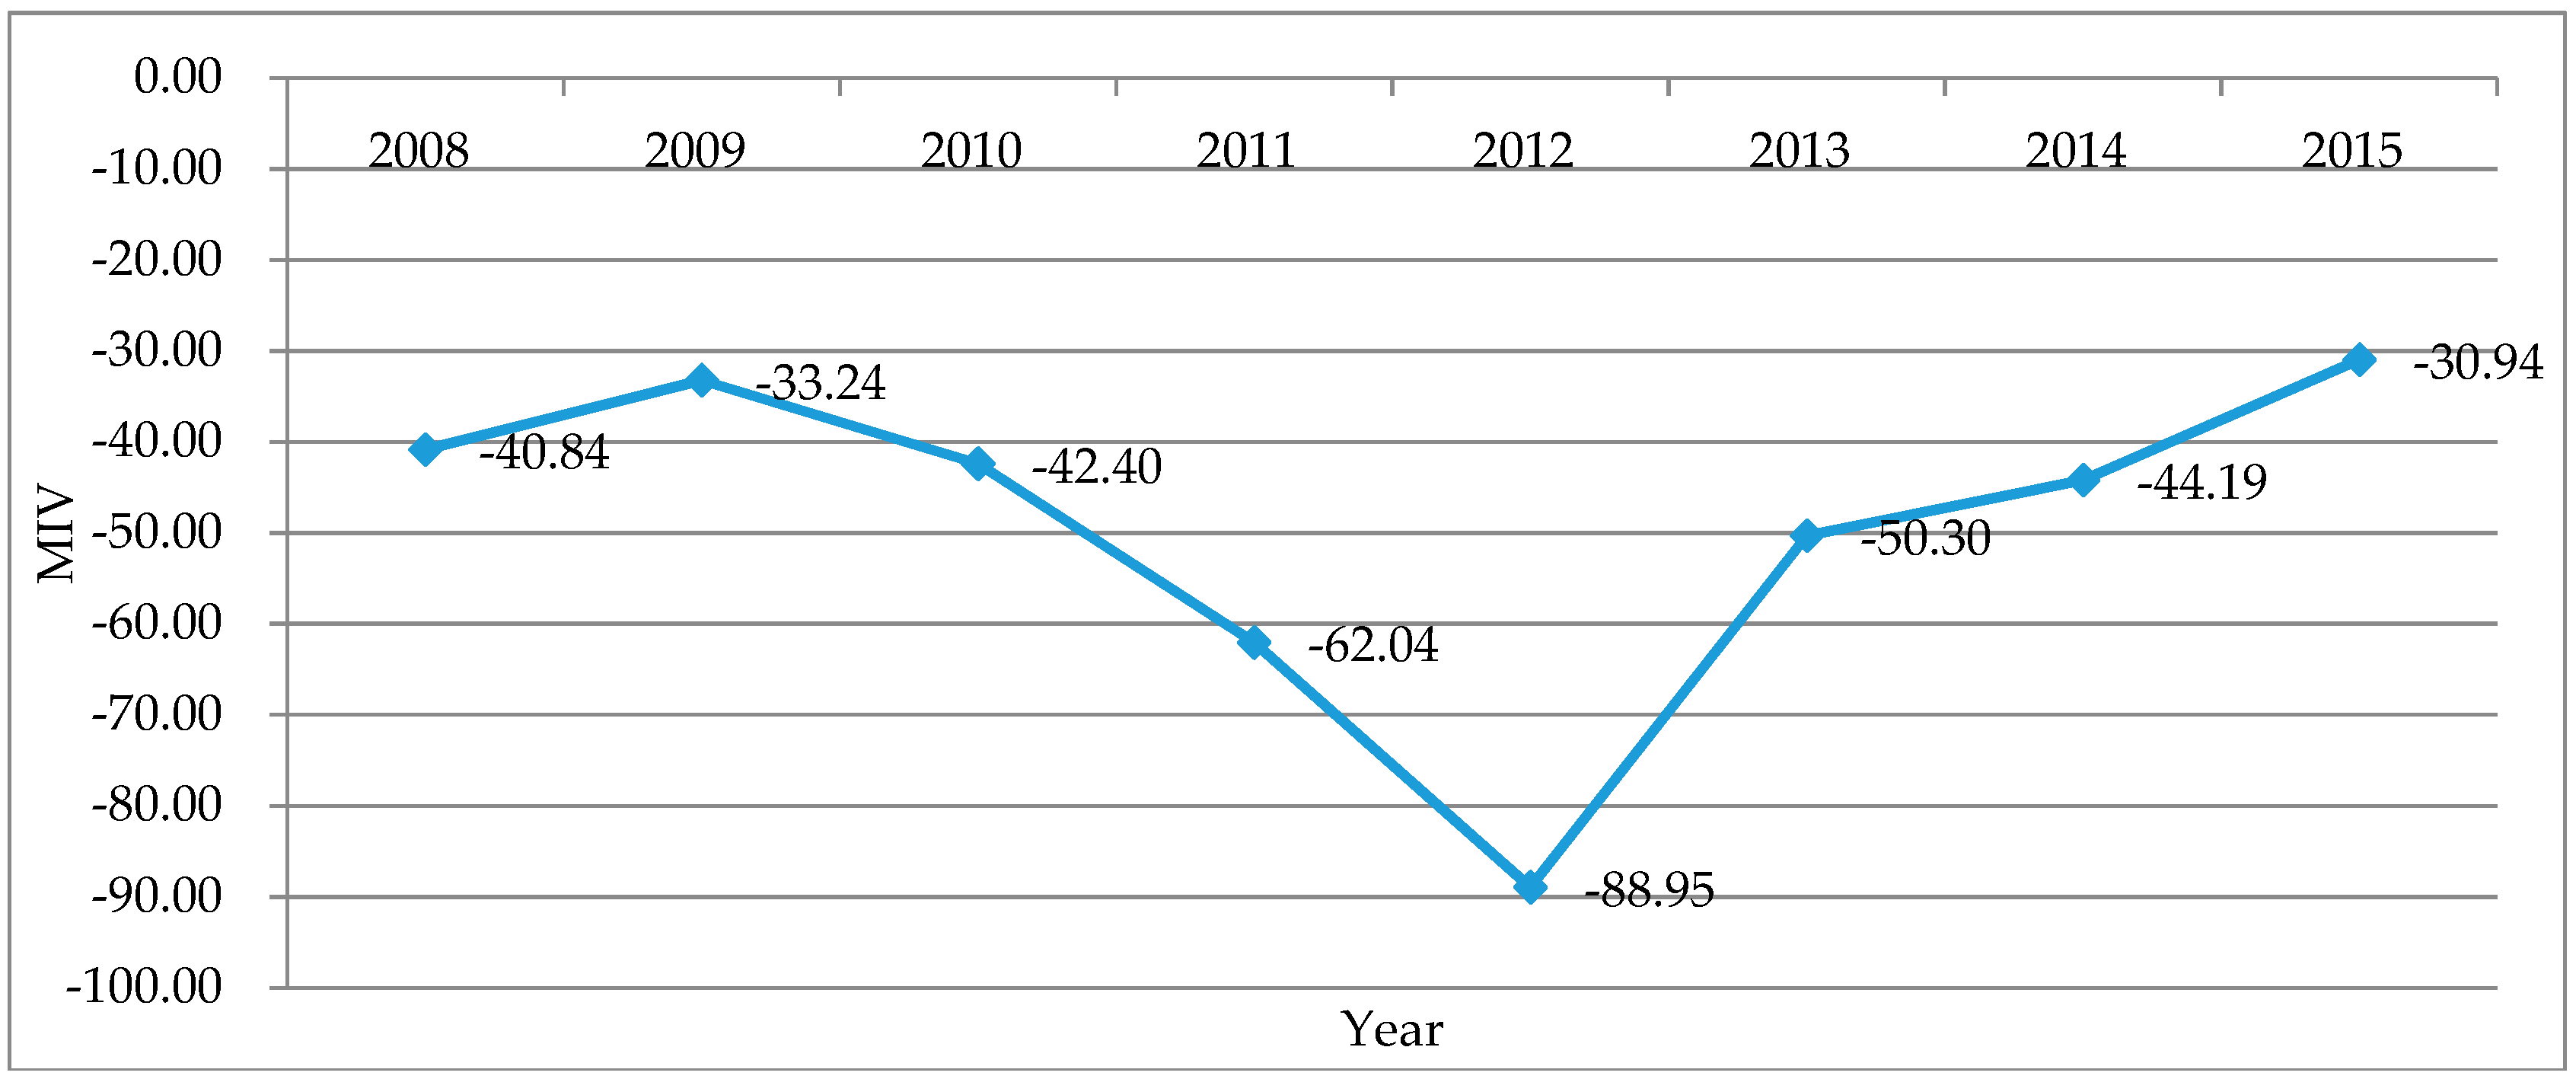
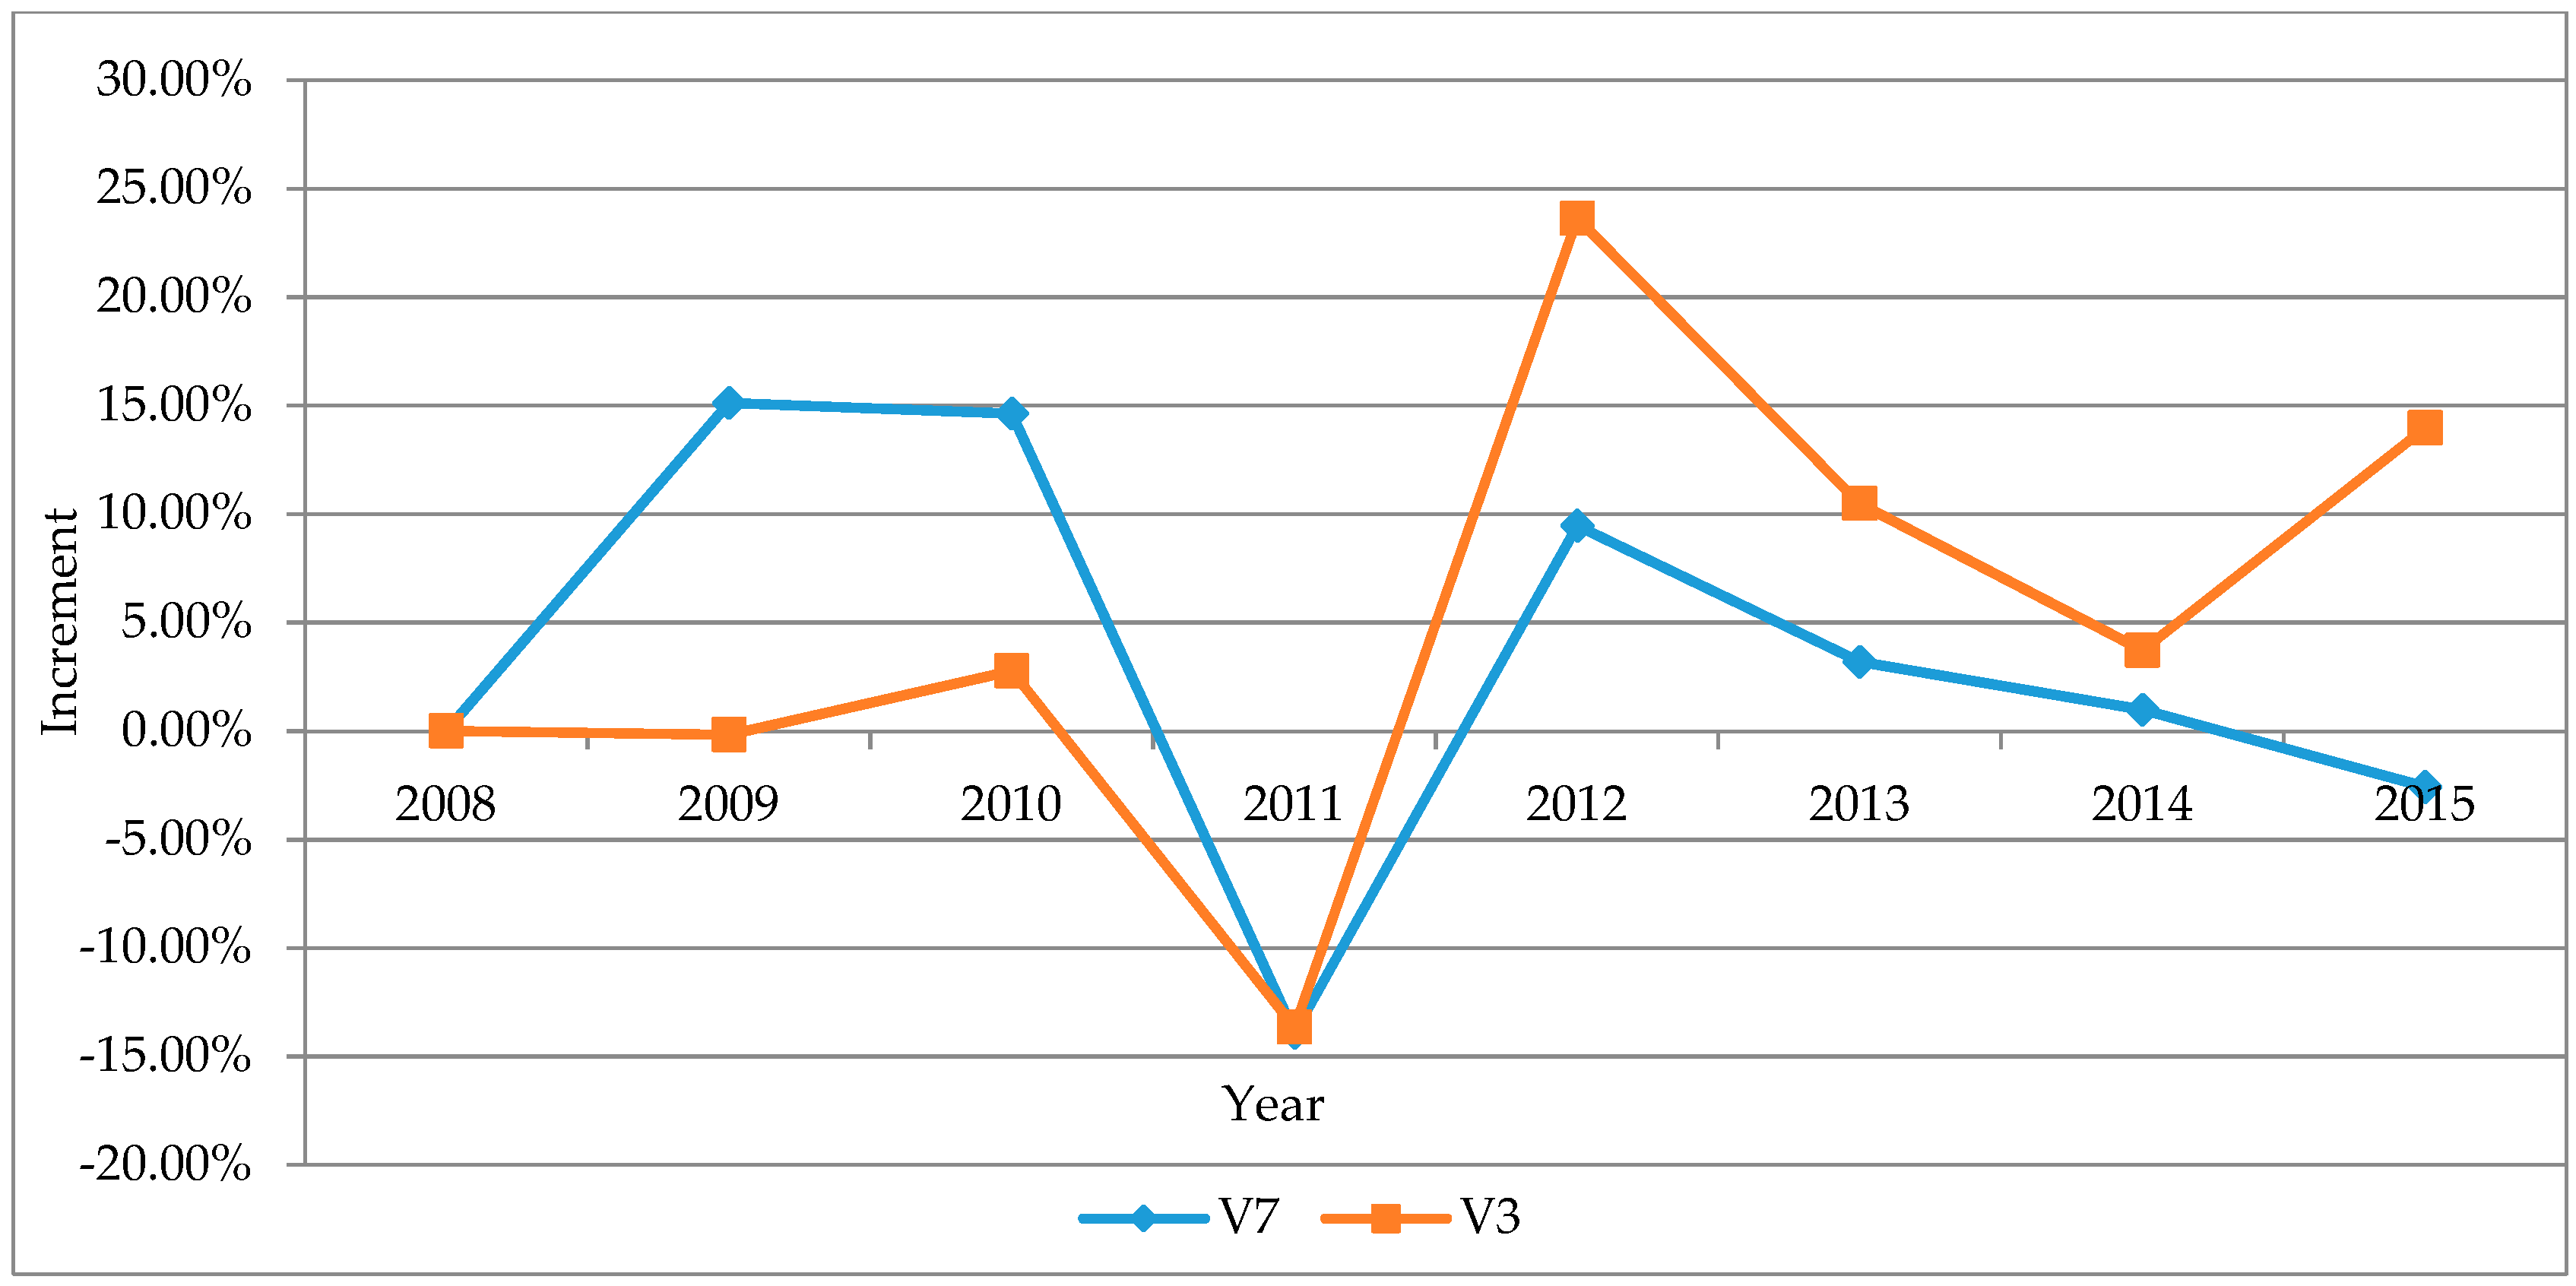
5.3. Temporal Disparity Analysis

The annual MIV from 2008 to 2015 indicates that the size of the innovation investment effect on technology innovation has jumped dramatically (Figure 8). The statistics of innovation investment indicators shows that the R&D expenditure (V1) and R&D personnel full time equivalent (V2) has experienced rapid growth and decline. Industrial above-scale enterprise quantity (V4) dropped sharply in 2011, and then recovered rapidly and the overall growth remained stable (Figure 9).
The annual MIV of the innovation environment has transformed from negative to positive, which demonstrates innovation environment in China has optimized continually (Figure 10). The statistics of the innovation environment indicators shows that per capita GDP (V2) and average number of students in general college per one hundred thousand people (V10) grew rapidly and then fell, while the proportion of finished products of foreign-invested industrial enterprises (V8) continued to decline from 2008 to 2015 (Figure 11).
However, the MIV of the enterprise scale slid from positive to negative, indicating that enterprises in China continued to expand, which led to the asphyxia of competition and the decline of regional innovation vitality (Figure 12). The statistical indicator also shows that the average output value of industrial above-scale enterprises (V5) had been increasing from 2008 to 2015; particularly in 2011, the enterprise scale had grown markedly, and the first decline appeared in 2015 (Figure 13).
The negative effect size of government support initially increased, and then decreased, which implies that after experiencing blind investment, the Chinese government gradually realized the problems and altered the direction and support mode. However, the negative effect of government support still existed (Figure 14). The statistical indicators of government support show that the proportion of government funds accounted for by internal R&D expenditure (V7) and the proportion of state capital of industrial above-scale enterprises (V3) had undergone the adjustment process: first increase, then decrease, and then increase, and finally decrease. In general, the proportion of government funds accounted for internal R&D expenditure (V7) had fallen, and the proportion of the state capital of industrial above-scale enterprises (V3) had risen, which indicated the Chinese government had adjusted their way of supporting innovation activities, gradually changing from direct R&D funds investment to indirect equity investment (Figure 15).
These findings support the hypotheses H1–H4, i.e., that the effects of innovation investment, innovation environment, enterprise scale and government support all vary with time.

6. Conclusions and Discussion

The objective of this paper is to investigate the affecting factors, regional differences and temporal variations of technology innovation. In our study, the FOA-GRNN model as a novel research method was established and applied. MR plays an important role in the identification of influencing factors and measurement of effect size, but the impact analysis of the FOA-GRNN model takes into account non-linearity, so the conclusions that differ from previous studies are obtained and summarized as follows.
Ranking by effect size, the influencing factors of technology innovation are innovation investment, enterprise scale, government support and innovation environment. Therefore, innovation investment and innovation environment have positive effects, while enterprise scale and government support have negative effects.
Innovation investment is the determinant of technology innovation, but the effect size has regional disparity. Innovation resources (R&D expenditure, R&D employee and enterprise) mainly concentrate on Eastern China, but are seriously insufficient in Western China, thus restricting technology innovation of Central and Western China. Between 2008 and 2015, innovation resources in China grew rapidly and the effect on technology innovation was more and more obvious.
Enterprise scale has negative effects on technology innovation generally, while the effect varies in different regions, with positive influences in Central and Western China, but negative influence in Eastern China. In Eastern China, small and medium enterprise (SME) is more efficient than large enterprise in technology innovation, but Central and Western China are just the opposite. In view of annual data, the enterprise scale in China is becoming larger and larger, which led to the asphyxia of competition and the decline of innovation vitality.
Government support has negative effects on technology innovation in all regions of China, indicating that government support funds were excessively involved in enterprise R&D activities, but inefficient. However, the Chinese government has gradually changed from direct R&D funds investment to indirect equity investment, which reduced the negative effect.
Innovation environment has a positive influence on technology innovation, but the effect is weak. Nonetheless, it is the biggest obstacle restricting technology innovation in Western China. Innovation environment in Eastern China is superior to that of Central and Western China. For the past few years, the innovation environment in China had improved continuously.
In view of the influencing factors, regional differences and temporal variations of industrial technology innovation, policy implications should be further improved as follows.
Central-Western China should greatly receive industrial transfer from Eastern China and cultivate local enterprises to raise innovation investment. The investments of R&D expenditure and employees are the determinants of technology innovation, but innovation resources are seriously insufficient in Western China. Enterprise is the main body of technology innovation. Western China has geographic, resource and human advantages. Hence, comparative advantage determined by factor endowment of Central and Western China should be fully utilized to attract enterprises from Eastern China and cultivate local enterprises. That will ultimately narrow the gap of innovation investment between Eastern China and Central-Western China, and form rational regional division and cooperation of industries.
Western China should strive to optimize the innovation environment for absorbing foreign direct investment and talents. Innovative environment is the main constraint on technology innovation in Western China, with the lowest statistical indicators. Therefore, Western China should reform government departments, regulate government action and improve administrative efficiency and the business environment. Meanwhile, talent strategy should be implemented to establish a set of introduction, development, incentive and indemnification mechanisms, offering intellectual support and human resources for enterprise technology innovation.
Eastern China should break the monopoly, introduce competition and a build competitive market. Enterprise scale is the biggest obstacle for technology innovation in Eastern China. Fierce market competition will stimulate enterprise to innovate on products and processes for improving quality and reducing cost. Empirical evidence proved that small and medium enterprises (SMEs) were more efficient in technology innovation in Eastern China. The government of Eastern China should take legislative, administrative and other measures to build a fair, orderly competition environment for SMEs, as well as prevent monopoly and unfair competition, which will lead to an energetic and productive market, stimulating the impetus of enterprise technical innovation.
The Chinese government should adjust the direction and way of innovation investment, reducing government interference in enterprise R&D activities. Fundamental innovation has the attribute with common product, so government support is necessary. However, the government fund has a principal-agency problem, along with lower efficiency than private R&D funds. Government support mode can be divided into two categories: a direct way and an indirect way, which are referred to as financial support and equity investment. The equity investment has a greater impact on enterprise innovation performance. Therefore, the Chinese government should adjust the direction and mode of innovation investment, from direct financial support to the indirect way, such as equity investment, tax preferences and financial subsidy.
This study presented a novel prediction method (FOA-GRNN) that has higher prediction accuracy, faster calculation speed, fewer adjusted parameters and more powerful processing ability for small samples. Initially it applied the FOA-GRNN model to analyze the influencing factors, regional differences and temporal variations of technology innovation. Our study adds prospects that are not available to conventional multiple regression (MR), and shines some light on contradictory sets of current research.
Despite the contributions of this study, further research should take into account other influencing factors such as R&D expenditure structure, market structure, property right structure and technology diffusion. These factors also have significant effects on technology innovation of enterprise, and the effect type and size are in dispute. In addition, the FOA-GRNN model should be further tested and developed through its application to other business and economic domains.

Acknowledgments

This research was funded by the Soft Science Research Project of Hebei Province in China (Grant No. 154576295) and the National Social Science Foundation of China (Grant No. 17BGL202).

Author Contributions

Yongli Zhang collected data, compiled program module for calculation, and prepared drafts. Sanggyun Na gave conceptual advice and checked the syntax error. Jianguang Niu and Beichen Jiang edited the manuscript.

Conflicts of Interest

The authors declare no conflict of interest.

References

  1. Sun, X.; Xiong, S.; Zhu, X.; Zhu, X.; Li, Y.; Li, B.L. A new indices system for evaluating ecological-economic-social performances of wetland restorations and its application to Taihu Lake Basin, China. Ecol. Model. 2015, 295, 216–226. [Google Scholar] [CrossRef]
  2. Dai, J.; Chen, B.; Hayat, T.; Alsaedi, A.; Ahmad, B. Sustainability-based economic and ecological evaluation of a rural biogas-linked agro-ecosystem. Renew. Sustain. Energy Rev. 2015, 41, 347–355. [Google Scholar] [CrossRef]
  3. Schumpeter, J.A. Capitalism, Socialism and Democracy; Harper & Row: New York, NY, USA, 1942. [Google Scholar]
  4. Freitas, L.C.D.; Kaneko, S. Is there a causal relation between ethanol innovation and the market characteristics of fuels in Brazil? Ecol. Econ. 2012, 74, 161–168. [Google Scholar] [CrossRef]
  5. Pavitt, K.; Robson, M.; Townsend, J. The size distribution of innovating firms in the UK: 1945–1983. J. Ind. Econ. 1987, 35, 297–316. [Google Scholar] [CrossRef]
  6. Stock, G.N.; Greis, N.P.; Fischer, W.A. Firm size and dynamic technological innovation. Technovation 2002, 22, 537–549. [Google Scholar] [CrossRef]
  7. Shefer, D.; Frenkel, A. R&D, firm size and innovation: An empirical analysis. Technovation 2005, 25, 25–32. [Google Scholar]
  8. Farla, K.; De Crombrugghe, D.; Verspagen, B. Institutions, foreign direct investment, and domestic investment: Crowding out or crowding in? World Dev. 2016, 88, 1–9. [Google Scholar] [CrossRef]
  9. Danakol, S.H.; Estrin, S.; Reynolds, P.; Weitzel, U. Foreign direct investment via M&A and domestic entrepreneurship: Blessing or curse? Small Bus. Econ. 2017, 48, 599–612. [Google Scholar]
  10. Hua, Z.; Wang, Y.; Xu, X. Predicting corporate financial distress based on integration of support vector machine and logistic regression. Expert Syst. Appl. 2007, 33, 434–440. [Google Scholar] [CrossRef]
  11. Luo, W.; Fu, Z. Application of generalized regression neural network to the agricultural machinery demand forecasting. Appl. Mech. Mater. 2013, 278–280, 2177–2181. [Google Scholar] [CrossRef]
  12. Hu, R.; Wen, S.; Zeng, Z.; Huang, T. A short-term power load forecasting model based on the generalized regression neural network with decreasing step fruit fly optimization algorithm. Neurocomputing 2017, 221, 24–31. [Google Scholar] [CrossRef]
  13. Chelgani, S.C.; Jorjani, E. Microwave irradiation pretreatment and peroxyacetic acid desulfurization of coal and application of GRNN simultaneous predictor. Fuel 2011, 90, 3156–3163. [Google Scholar] [CrossRef]
  14. Ladlani, I.; Houichi, L.; Djemili, L.; Heddam, S.; Belouz, K. Modeling daily reference evapotranspiration (ET 0) in the north of Algeria using generalized regression neural networks (GRNN) and radial basis function neural networks (RBFNN): A comparative study. Meteorol. Atmos. Phys. 2012, 118, 163–178. [Google Scholar] [CrossRef]
  15. Ceryan, N.; Okkan, U.; Kesimal, A. Application of generalized regression neural networks in predicting the unconfined compressive strength of carbonate rocks. Rock Mech. Rock Eng. 2012, 45, 1055–1072. [Google Scholar] [CrossRef]
  16. Souitaris, V. Firm-specific competencies determining technological innovation: A survey in Greece. R&D Manag. 2002, 32, 61–77. [Google Scholar]
  17. Ernst, H. Patent applications and subsequent changes of performance: Evidence from time-series cross-section analyses on the firm level. Res. Policy 2001, 30, 143–157. [Google Scholar] [CrossRef]
  18. Trajtenberg, M. A penny for your quotes: Patent citations and the value of innovations. In Patents, Citations, and Innovations: A Window on the Knowledge Economy; MIT Press: Cambridge, MA, USA, 2002; pp. 25–50. [Google Scholar]
  19. Chen, Y.S.; Chang, K.C. Analyzing the nonlinear effects of firm size, profitability, and employee productivity on patent citations of the US pharmaceutical companies by using artificial neural network. Scientometrics 2010, 82, 75–82. [Google Scholar] [CrossRef]
  20. Basmann, R.L.; McAleer, M.; Slottje, D. Patent activity and technical change. J. Econom. 2007, 139, 355–375. [Google Scholar] [CrossRef]
  21. Shu, C.; Wang, Q.; Gao, S. Firm patenting, innovations, and government institutional support as a double-edged sword. J. Prod. Innov. Manag. 2014, 32, 290–305. [Google Scholar] [CrossRef]
  22. Zhong, W.; Yuan, W.; Li, S.X.; Huang, Z. The performance evaluation of regional R&D investments in China: An application of DEA based on the first official China economic census data. Omega 2011, 39, 447–455. [Google Scholar]
  23. Alarcón, S.; Sánchez, M. External and Internal R&D, Capital Investment and Business Performance in the Spanish Agri-Food Industry. J. Agric. Econ. 2013, 64, 654–675. [Google Scholar]
  24. Koc, T.; Ceylan, C. Factors impacting the innovative capacity in large-scale companies. Technovation 2007, 27, 105–114. [Google Scholar] [CrossRef]
  25. Coad, A.; Segarra, A.; Teruel, M. Innovation and firm growth: Does firm age play a role? Res. Policy 2016, 45, 387–400. [Google Scholar] [CrossRef]
  26. Wang, Y.; Ning, L.; Li, J.; Prevezer, M. Foreign direct investment spillovers and the geography of innovation in Chinese regions: The role of regional industrial specialization and diversity. Reg. Stud. 2016, 50, 805–822. [Google Scholar] [CrossRef]
  27. Smith, N.; Thomas, E. Regional conditions and innovation in Russia: The impact of foreign direct investment and absorptive capacity. Reg. Stud. 2017, 51, 1412–1428. [Google Scholar] [CrossRef]
  28. Wu, J.; Ma, Z.; Zhuo, S. Enhancing national innovative capacity: The impact of high-tech international trade and inward foreign direct investment. Int. Bus. Rev. 2017, 26, 502–514. [Google Scholar] [CrossRef]
  29. Alfaro, L. Gains from foreign direct investment: Macro and micro approaches. World Bank Econ. Rev. 2017, 30, 2–15. [Google Scholar]
  30. Slater, S.F.; Mohr, J.J.; Sengupta, S. Radical product innovation capability: Literature review, synthesis, and illustrative research propositions. J. Prod. Innov. Manag. 2014, 31, 552–566. [Google Scholar] [CrossRef]
  31. Tseng, S.C.; Hung, S.W. A framework identifying the gaps between customers’ expectations and their perceptions in green products. J. Clean. Prod. 2013, 59, 174–184. [Google Scholar] [CrossRef]
  32. Lin, R.J.; Tan, K.H.; Geng, Y. Market demand, green product innovation, and firm performance: Evidence from Vietnam motorcycle industry. J. Clean. Prod. 2013, 40, 101–107. [Google Scholar] [CrossRef]
  33. Cubas, G.; Ravikumar, B.; Ventura, G. Talent, labor quality, and economic development. Rev. Econ. Dyn. 2016, 21, 160–181. [Google Scholar] [CrossRef]
  34. Woo, Y.; Kim, E.; Lim, J. The Impact of Education and R&D Investment on Regional Economic Growth. Sustainability 2017, 9, 676. [Google Scholar] [CrossRef]
  35. Huang, Y.; Salike, N.; Yin, Z.; Zeng, D.Z. Enterprise Innovation in China: Does Ownership or Size Matter? (No. 2017-06); Xi’an Jiaotong-Liverpool University, Research Institute for Economic Integration: Suzhou, China, 2017. [Google Scholar]
  36. Mei, L.; Shao, W. The effect of firm size on regional innovation efficiency in China. Mod. Econ. 2016, 7, 1035–1049. [Google Scholar] [CrossRef]
  37. Szczygielski, K.; Grabowski, W.; Pamukcu, M.T.; Tandogan, V.S. Does government support for private innovation matter? Firm-level evidence from two catching-up countries. Res. Policy 2017, 46, 219–237. [Google Scholar] [CrossRef]
  38. Guo, D.; Guo, Y.; Jiang, K. Government-subsidized R&D and firm innovation: Evidence from China. Res. Policy 2016, 45, 1129–1144. [Google Scholar]
  39. Huang, Q.; Jiang, M.S.; Miao, J. Effect of government subsidization on Chinese industrial firms’ technological innovation efficiency: A stochastic frontier analysis. J. Bus. Econ. Manag. 2016, 17, 187–200. [Google Scholar] [CrossRef]
  40. Hong, J.; Feng, B.; Wu, Y.; Wang, L. Do government grants promote innovation efficiency in China’s high-tech industries? Technovation 2016, 57, 4–13. [Google Scholar] [CrossRef]
  41. Zhang, H.Y.; Shi, J.C. On the technical efficiency of new product in Chinese provincial industry. Econ. Res. J. 2011, 1, 83–96. [Google Scholar]
  42. Wu, Y.B. The determinants of innovation—Empirical study based on Chinese manufacturing industry. World Econ. Pap. 2008, 2, 46–58. [Google Scholar]
  43. Jiang, J.L.; Su, X.; Zhang, H.; Zhang, X.H.; Yuan, Y.J. A novel approach to active compounds identification based on support vector regression model and mean impact value. Chem. Boil. Drug Des. 2013, 81, 650–657. [Google Scholar] [CrossRef] [PubMed]
  44. Pan, W.T. A new fruit fly optimization algorithm: Taking the financial distress model as an example. Knowl. Based Syst. 2012, 26, 69–74. [Google Scholar] [CrossRef]
  45. Holland, J.H. Adaptation in Natural and Artificial Systems; MIT Press: Cambridge, MA, USA, 1992. [Google Scholar]
Figure 1. The foraging food process of fruit fly.
Sustainability 10 00187 g001
Figure 2. The topological structure of GRNN.
Sustainability 10 00187 g002
Figure 3. The comparison of influencing factor in different economic regions of China.
Sustainability 10 00187 g003
Figure 4. The statistics of innovation investment in different economic regions of China.
Sustainability 10 00187 g004
Figure 5. The statistics of innovation environment in different economic regions of China.
Sustainability 10 00187 g005
Figure 6. The statistics of enterprise scale in different economic regions of China.
Sustainability 10 00187 g006
Figure 7. The statistics of government support in different economic regions of China.
Sustainability 10 00187 g007
Figure 8. The MIV tendency of innovation investment in China.
Sustainability 10 00187 g008
Figure 9. The tendency of statistic indicators of innovation investment in China.
Sustainability 10 00187 g009
Figure 10. The MIV tendency of innovation environment in China.
Sustainability 10 00187 g010
Figure 11. The tendency of statistic indicators of innovation environment in China.
Sustainability 10 00187 g011
Figure 12. The MIV tendency of enterprise scale in China.
Sustainability 10 00187 g012
Figure 13. The tendency of statistic indicators of enterprise scale in China.
Sustainability 10 00187 g013
Figure 14. The MIV tendency of government support in China.
Sustainability 10 00187 g014
Figure 15. The tendency of statistic indicators of government support in China.
Sustainability 10 00187 g015
Table 1. Indicators description.
Indicator TypeCodeIndicator
Dependent variableYNumber of patent applications of industrial above-scale enterprises
Independent variablesV1R&D expenditure of industrial above-scale enterprises
V2R&D personnel full time equivalent of industrial above-scale enterprises
V3Proportion of state capital of industrial above-scale enterprises
V4Number of industrial above-scale enterprises
V5Average output value of industrial above-scale enterprises
V6The ratio of technology import expenditure to digestive absorption expenditure
V7The proportion of government funds accounted for internal R&D expenditure
V8The proportion of finished products of foreign-invested industrial enterprises
V9Per capita GDP
V10Average number of students in general college per one hundred thousand people
Table 2. Description statistics and correlation coefficients between variables (N = 248).
VariableMeanSDV1V2V3V4V5V6V7V8V9V10Y
V12,082,4692,893,0551
V264,53988,7200.962 **1
V32513−0.412 **−0.459 **1
V412,55514,6360.776 **0.826 **−0.549 **1
V51056597−0.164 **−0.216 **0.468 **−0.427 **1
V61237−0.139 *−0.128 *0.129 *−0.116−0.146 *1
V764−0.284 **−0.294 **0.411 **−0.349 **0.161 *−0.0321
V819150.463 **0.487 **−0.474 **0.464 **−0.213 **−0.114−0.276 **1
V940,00521,0460.532 **0.461 **−0.136 *0.293 **0.202 **−0.186 **−0.136 *0.597 **1
V1023999480.176 **0.126 *0.1080.0560.097−0.170 **0.1210.479 **0.703 **1
Y13,48522,0420.928 **0.966 **−0.414 **0.750 **−0.162 *−0.114−0.268 **0.476 **0.491 **0.143 *1
Note: * p < 0.05, ** p < 0.01.
Table 3. Factor analysis results.
FactorsVariablesFactor LoadingsCommunalityEigenvaluesExplained Variance
Innovation InvestmentV20.9500.9662.83031.446
V10.9430.956
V40.8210.859
Innovation EnvironmentV100.9140.8782.15223.909
V90.8320.888
V80.7230.806
Enterprise ScaleV50.9240.8771.56617.402
Government SupportV70.9320.8991.31314.591
Total explained variance 87.348
Note: Extraction Method: Principal Component Analysis. Rotation Method: Varimax with Kaiser Normalization.
Table 4. The comparison of prediction result.
ModelRMSEMAEMAPEStability
FOA-GRNN4963.172832.583.3722Yes
Multiple Regression9683.066568.238.5432Yes
Table 5. The MIV of factor affecting industrial technology innovation.
Innovation InvestmentInnovation EnvironmentEnterprise ScaleGovernment Support
442.3222.97−49.11−31.03

