Article

Influence of Tillage Practices, Organic Manures and Extrinsic Factors on β-Glucosidase Activity: The Final Step of Cellulose Hydrolysis

1
Departamento de Producción Agraria, Universidad Politécnica de Madrid, Av. Puerta de Hierro 2, 28040 Madrid, Spain
2
Scotland’s Rural College, West Mains Road, Edinburgh EH9 3JG, UK
3
The James Hutton Institute, Invergowrie, Dundee DD2 5DA, UK
*
Author to whom correspondence should be addressed.
Soil Syst. 2018, 2(2), 21; https://doi.org/10.3390/soilsystems2020021
Submission received: 12 March 2018 / Revised: 5 April 2018 / Accepted: 6 April 2018 / Published: 10 April 2018

Abstract

:
β-glucosidase is a key enzyme in the C-cycle, and its activity is strongly influenced by soil management practices and by extrinsic factors such as weather conditions. However, the variability of β-glucosidase activity (BGa) over time and how this variability is affected by tillage and organic fertilization remain poorly elucidated. We investigated how contrasting tillage practices (zero, minimum, conventional or deep) and organic amendment application (dairy cattle slurry or green compost) govern BGa. Strong correlations (r = −0.98; p < 0.001) were found between BGa and preceding cumulative rainfall for soil without crops. Under cropped soil conditions, BGa was 53% greater under zero and minimum tillage than under ploughed treatments (p < 0.05) six years after their applications. These differences could be explained by associated effects of tillage on organic matter content, electrical conductivity and water stable aggregates. The separated organic residue experiment showed that BGa was 36% greater in soil amended with slurry than in soil amended with compost (p < 0.05) five years after their applications. Finally, the response ratio of BGa was calculated in order to study the effect size of each treatment at each sampling period. This simple strategy mitigated the variation on BGa measurements between two sampling periods, and may be applied in future studies to improve the interpretation of other potential soil quality indicators that are sensitive to seasonal changes.

1. Introduction

β-glucosidase is a key enzyme in the C-cycle, as it is involved in the terminal process of the degradation of cellulose (β-1,4-d-glucose polymer), the most abundant organic compound in the terrestrial biosphere, comprising almost 50% of the biomass synthesized by photosynthetic fixation of CO2 [1]. Soil β-glucosidase is produced mainly by saprotrophic microorganisms such as bacteria and fungi, but it is also present in root exudates and in the gut of soil fauna [2]. β-glucosidase cleaves β-d-glucosidic linkages in glucose-substituted molecules or disaccharide such as cellobiose, whose concentration represents one of the key bottlenecks in cellulose enzymatic hydrolysis.
BGa provides an early indication of changes in the status and turnover of soil organic matter (SOM) [3]. This enzyme assay is also useful because it is strongly and positively correlated with soil fertility variables such as available nitrogen or phosphorus and with other soil quality variables such as soil microbial biomass carbon (MBC) [4,5]. Hence, BGa can provide a meaningful integrative measure of physico-chemical and biological quality changes in soils due to organic amendments [6]. However, β-glucosidase activity (BGa) and other indicators of soil biological activity such us MBC or N mineralization are sensitive to seasonal changes [7], and thus the causal agents of these changes must be identified. In this way, the seasonal changes in biology indicators could be discriminated from true soil-quality variations due to the study treatment.
BGa is very sensitive to soil management [3] and is related to MBC [8]. Both BGa and MBC tend to be higher under no-till than under conventional tillage and indicate a higher microbial capability to catalyze carbohydrates [9]. However, further research is needed to explain how contrasting tillage practices (i.e., zero, minimum, conventional or deep tillage) affect BGa over time.
The multifactor relationship between soil microbial communities, soil management and litter decomposition in agroecosystems, is not well understood [10]. Therefore, the influence of different soil managements or organic amendments on soil enzymatic activity over time needs to be investigated in order to shed light on these relationships. Finally, it is convenient to find a method to reduce the transient effect of extrinsic factors (especially those from weather conditions) on BGa measurements. Ultimately, such method should improve and facilitate the interpretation of measurements, even when comparing results from samples taken at different times and under different field conditions.
The principal objectives of this work were: (1) to identify main weather variables that affect BGa and (2) to quantify the effects of different soil management systems (T0, T1, T2 and T3) and organic amendments (O0, O1 and O2) on some selected soil properties. In addition, (3) we tried to outline a method to reduce the transient effect of extrinsic factors (that depend on the time of sampling and are unrelated to treatments) for comparing BGa results obtained in different seasons. Our main hypotheses were that (1) precipitation and temperature could explain part of the variability of BGa, and that (2) No-till (T0) and minimum tillage (T1) could increase BGa and other soil quality parameters compared with plough managements (T2 and T3). Similarly, organic treatments (O1 and O2) should improve BGa and other soil quality variables compared with the control (O0).

2. Materials and Methods

2.1. Field Site and Experiments

Experimental plots were located in Scotland (GPS 56°27′15″ N, 03°04′50″ W) under an udic moisture regime and a mesic temperature regime. The soil was a Fluventic Humudept [11] with a sandy loam texture. It was freely drained and underlain by colluvial sand at a depth of 60 cm [12]. The rainfall in the study area was distributed evenly throughout the year (average monthly precipitation between 44 mm in April and 72 mm in January), resulting an annual average of 664 mm (30 year average), and evapotranspiration is limited by the cool temperatures, with mean daily temperature between 3.3 °C in January and 14.7 °C in July.
The tillage experiment was established with four cultivation treatments in triplicate and a split plot design. These were: zero tillage (T0), where the seeds were directly drilled and most of the crop residues were removed as in the other treatments; minimum tillage (T1), where the soil was disc-cultivated to a depth of 7 cm before the seeds were drilled; conventional tillage (T2) by inversion ploughing to 20 cm with a mouldboard plough and discing, followed by compaction by wheeling the entire plot area with a tractor; and deep inversion ploughing (T3) to 40 cm and discing. We selected these four treatments because we considered them as the most representative and contrasting practices for studying the tillage effects. The plots (33 m × 33 m) were cultivated annually, sown with winter barley and fertilized with 180/180/180 kg ha−1 year−1 of N, P and K.
A separated organic residue experiment was established one year later than the tillage experiment on a split plot design with three replicates. The treatments were: a control without organic residue applied (O0); 40 t ha−1 of dairy cattle slurry (O1); and 200 t ha−1 of municipal green-waste compost (O2). In this experiment, the organic matter forms were applied at experimental rates with the purpose of (i) recycling some highly available organic byproducts, and (ii) determining whether the addition of large amounts of organic matter harm the soil quality. The compost was primarily from garden refuse (Discovery Compost, Dundee City Council, Dundee, UK), meeting the specification of the British Standards Institution [13]. The compost contained 52% dry matter with a total N concentration of 1.39%. The slurry was 4.9% solids with a total N concentration of 3.65% [14]. The amendments were applied to the soil surface prior to incorporation to a depth of 15 cm with a minimum tillage disc cultivator. The plots (15 m × 30 m) were tilled with a disc cultivator, and were sown as in the tillage experiment (above).
A grass-reference area of three plots was located in the zone between the tillage and organic experiments (112 m × 12 m). This third area of study was undisturbed, and was permanently covered by a spontaneous sward. This uncropped soil was considered the reference to discuss the temporal variability of BGa without interference by soil management.

2.2. Measured Variables

Two random locations per plot (and three plots per treatment) were sampled at 0–5 cm and 10–15 cm depth in each sample period. These sampling depths had different soil structure (and a transitional layer at 5–10 cm) as revealed by visual evaluation of soil structure [15]. Samples were collected from the grass-reference in January 2007, June 2009, September 2011, December 2011 and July 2013 in order to study the seasonal variability of BGa. The samples from the tillage experiment and the organic field experiment were collected in two sampling periods to study the tillage and organic treatment effects on BGa and their changes between the two sampling periods. The first sampling period was three years after the beginning of the tillage experiment, and the second sampling period was six years after the beginning of the tillage experiment.
β-glucosidase (EC 3.2.1.21) activity was determined according to Hoffman and Dedeken [16], among others [17,18]. For each soil sample, two subsamples and one control (without substrate) of 5 g of field-moist soil (<2 mm) were incubated for 3 h at 37 °C in a buffered solution (acetate buffer 2 M with pH 6.2), using 2-(hydroxymethyl)phenyl-β-d-glucopyranoside (salicin) as a substrate. Saligenin (2-(hydroxymethyl)phenol) was released from the substrate after the cleavage of β-d-glucosidic linkages. The saligenin was determined colorimetrically (at 578 nm) and the results were expressed as μg saligenin (g of dry soil)−1 3 h−1. The BGa results were contrasted with the classification used by Böhme and Böhme [19] where the class ‘very weak’ applies when BGa <25 μg saligenin (g of dry soil)−1 3 h−1 and the class ‘very strong’ applies when BGa >150 μg saligenin (g of dry soil)−1 3 h−1.
Daily averages of air temperature, precipitation, soil temperature (at 10 cm) and solar radiation were recorded with an automatic meteorological station located in the experimental field. Additional soil variables were measured to identify the main drivers of the effects tillage and organic amendment on BGa in the second sampling period. These variables, measured in air-dry sieved soils (<2 mm) were: organic matter content (SOM) (measured with hot hydrogen peroxide), which is related to soil compactibility [20]; electric conductivity (EC) and pH determined in 1:2.5 soil:water suspensions; the Middleton’s dispersion ratio defined as [(% dispersed silt + clay after mild dispersion)/(% dispersed silt + clay after drastic dispersion)] × 100 [21] as a rapid measure of structure stability; and water stable aggregates, measured according to Kemper and Rosenau [22] (Table 1).

2.3. Data Analysis

Data were analyzed with the Statgraphics Centurion XVI software (StatPoint Technologies Inc., Warrenton, VA, USA). The tillage factor (T0, T1, T2 and T3) and the organic factor (O0, O1 and O2) were studied separately. Analyses of variance were conducted using the General Linear Model inside each depth. Comparison of means between treatments was done using the least significance difference (LSD) test at p < 0.05. Data were also analyzed to find predictor variables that fit a parametric statistical model. The response ratio (BGa-ratio) was calculated dividing the BGa measured in each treatment by the control (Equation (3)). In such a way, the effect size of each treatment at each sampling period was evaluated. Finally, Spearman’s rank correlation coefficients were calculated in order to study the relationships among measured and calculated parameters.

3. Results

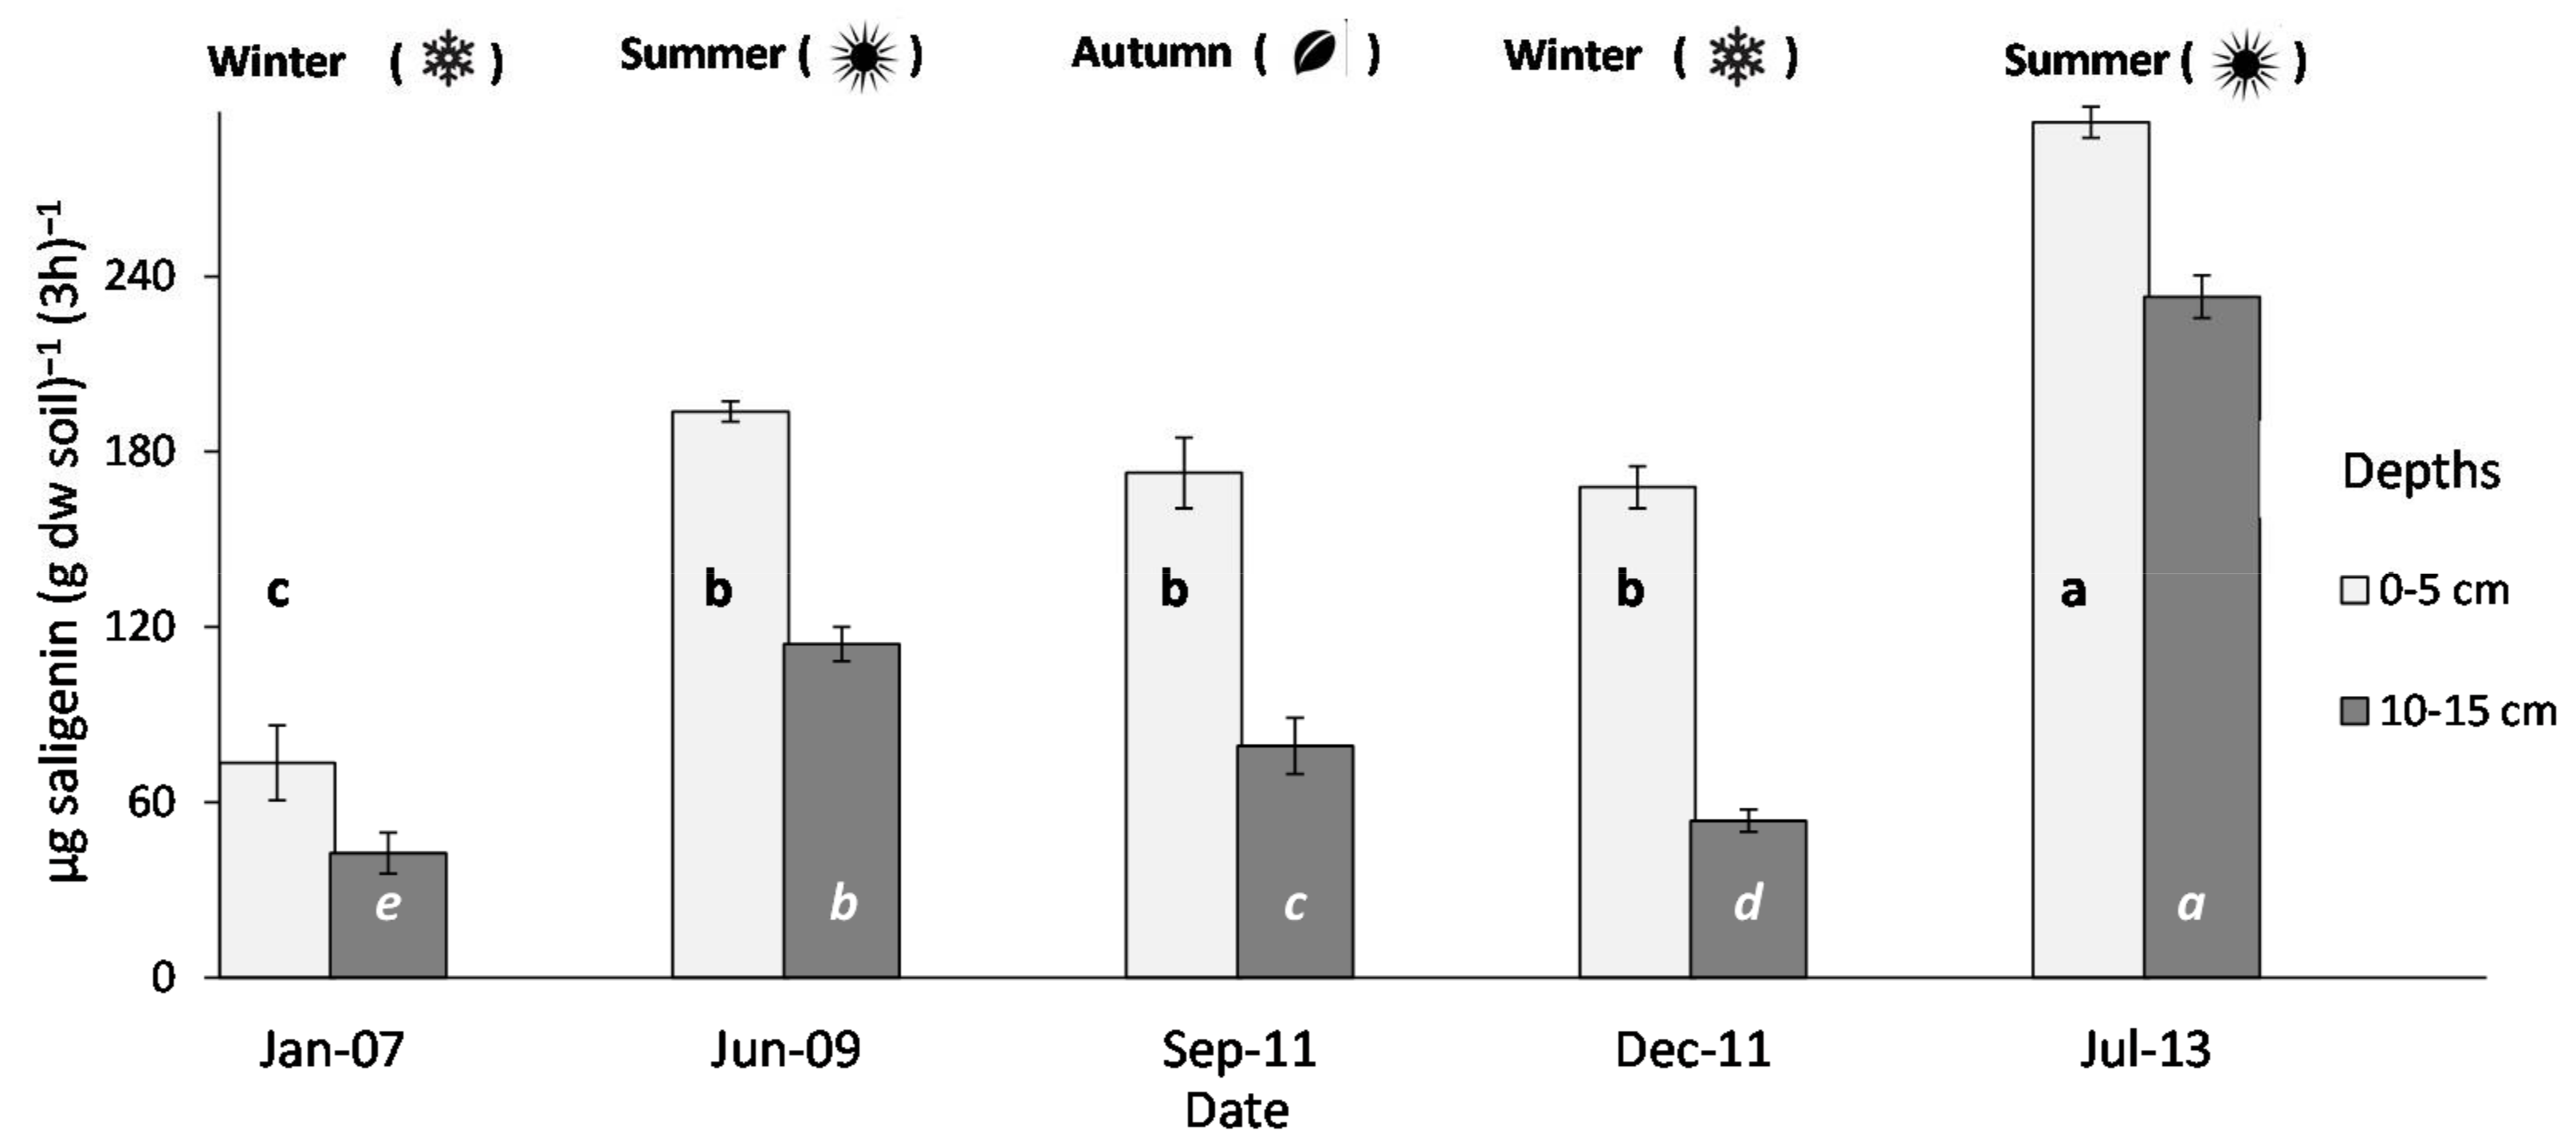
3.1. β-Glucosidase Activity under Grass-Reference Soil and Relationships with Meteorological Data

According to Böhme and Böhme [19] classification, all the BGa of the grass-reference soil at 0–5 cm depth belonged to the ‘very strong’ class (>150 μg saligenin g−1 3 h−1) except in the samples taken in January 2007 (Figure 1). However, the BGa data showed significant temporal variability in both studied layers during the experiment. There was a significant negative correlation (r = −0.98; p < 0.001) between average BGa in grass-reference at 0–5 cm depth and total rainfall during the 12 days before each sampling (∑ rain 12 days). Nevertheless, significant correlations were not found between BGa and the other meteorological parameters (i.e., daily soil temperature, air temperature, solar radiation, or total rainfall during periods other than 11 or 12 days before each sampling).
Equations (1) and (2) show the adjusted simple regression models found for describing the relationship between BGa in both soil layers and the rainfall before each sampling. These equations indicate that, as rainfall before sampling increases, enzyme activity decreases:
BGa   0 5 = 667 × (   rain   12   days ) 0.5   ,
Correlation coefficient; r = −0.98 Significance level: p = 0.0005.
BGa   10 15 = 335 × (   rain   12   days ) 0.5   ,
Correlation coefficient; r = −0.99 Significance level: p = 0.0003. where: BGa0–5 is the β-glucosidase activity at a depth of 0–5 cm and BGa10–15 at a depth of 10–15 cm measured in μg saligenin (g of dry soil)−1 3 h−1. In addition, Σ Rain 12 days is the total rainfall during the 12 days before sampling (mm). Plotting of Equations (S1) and (S2) are shown in Figure S1.

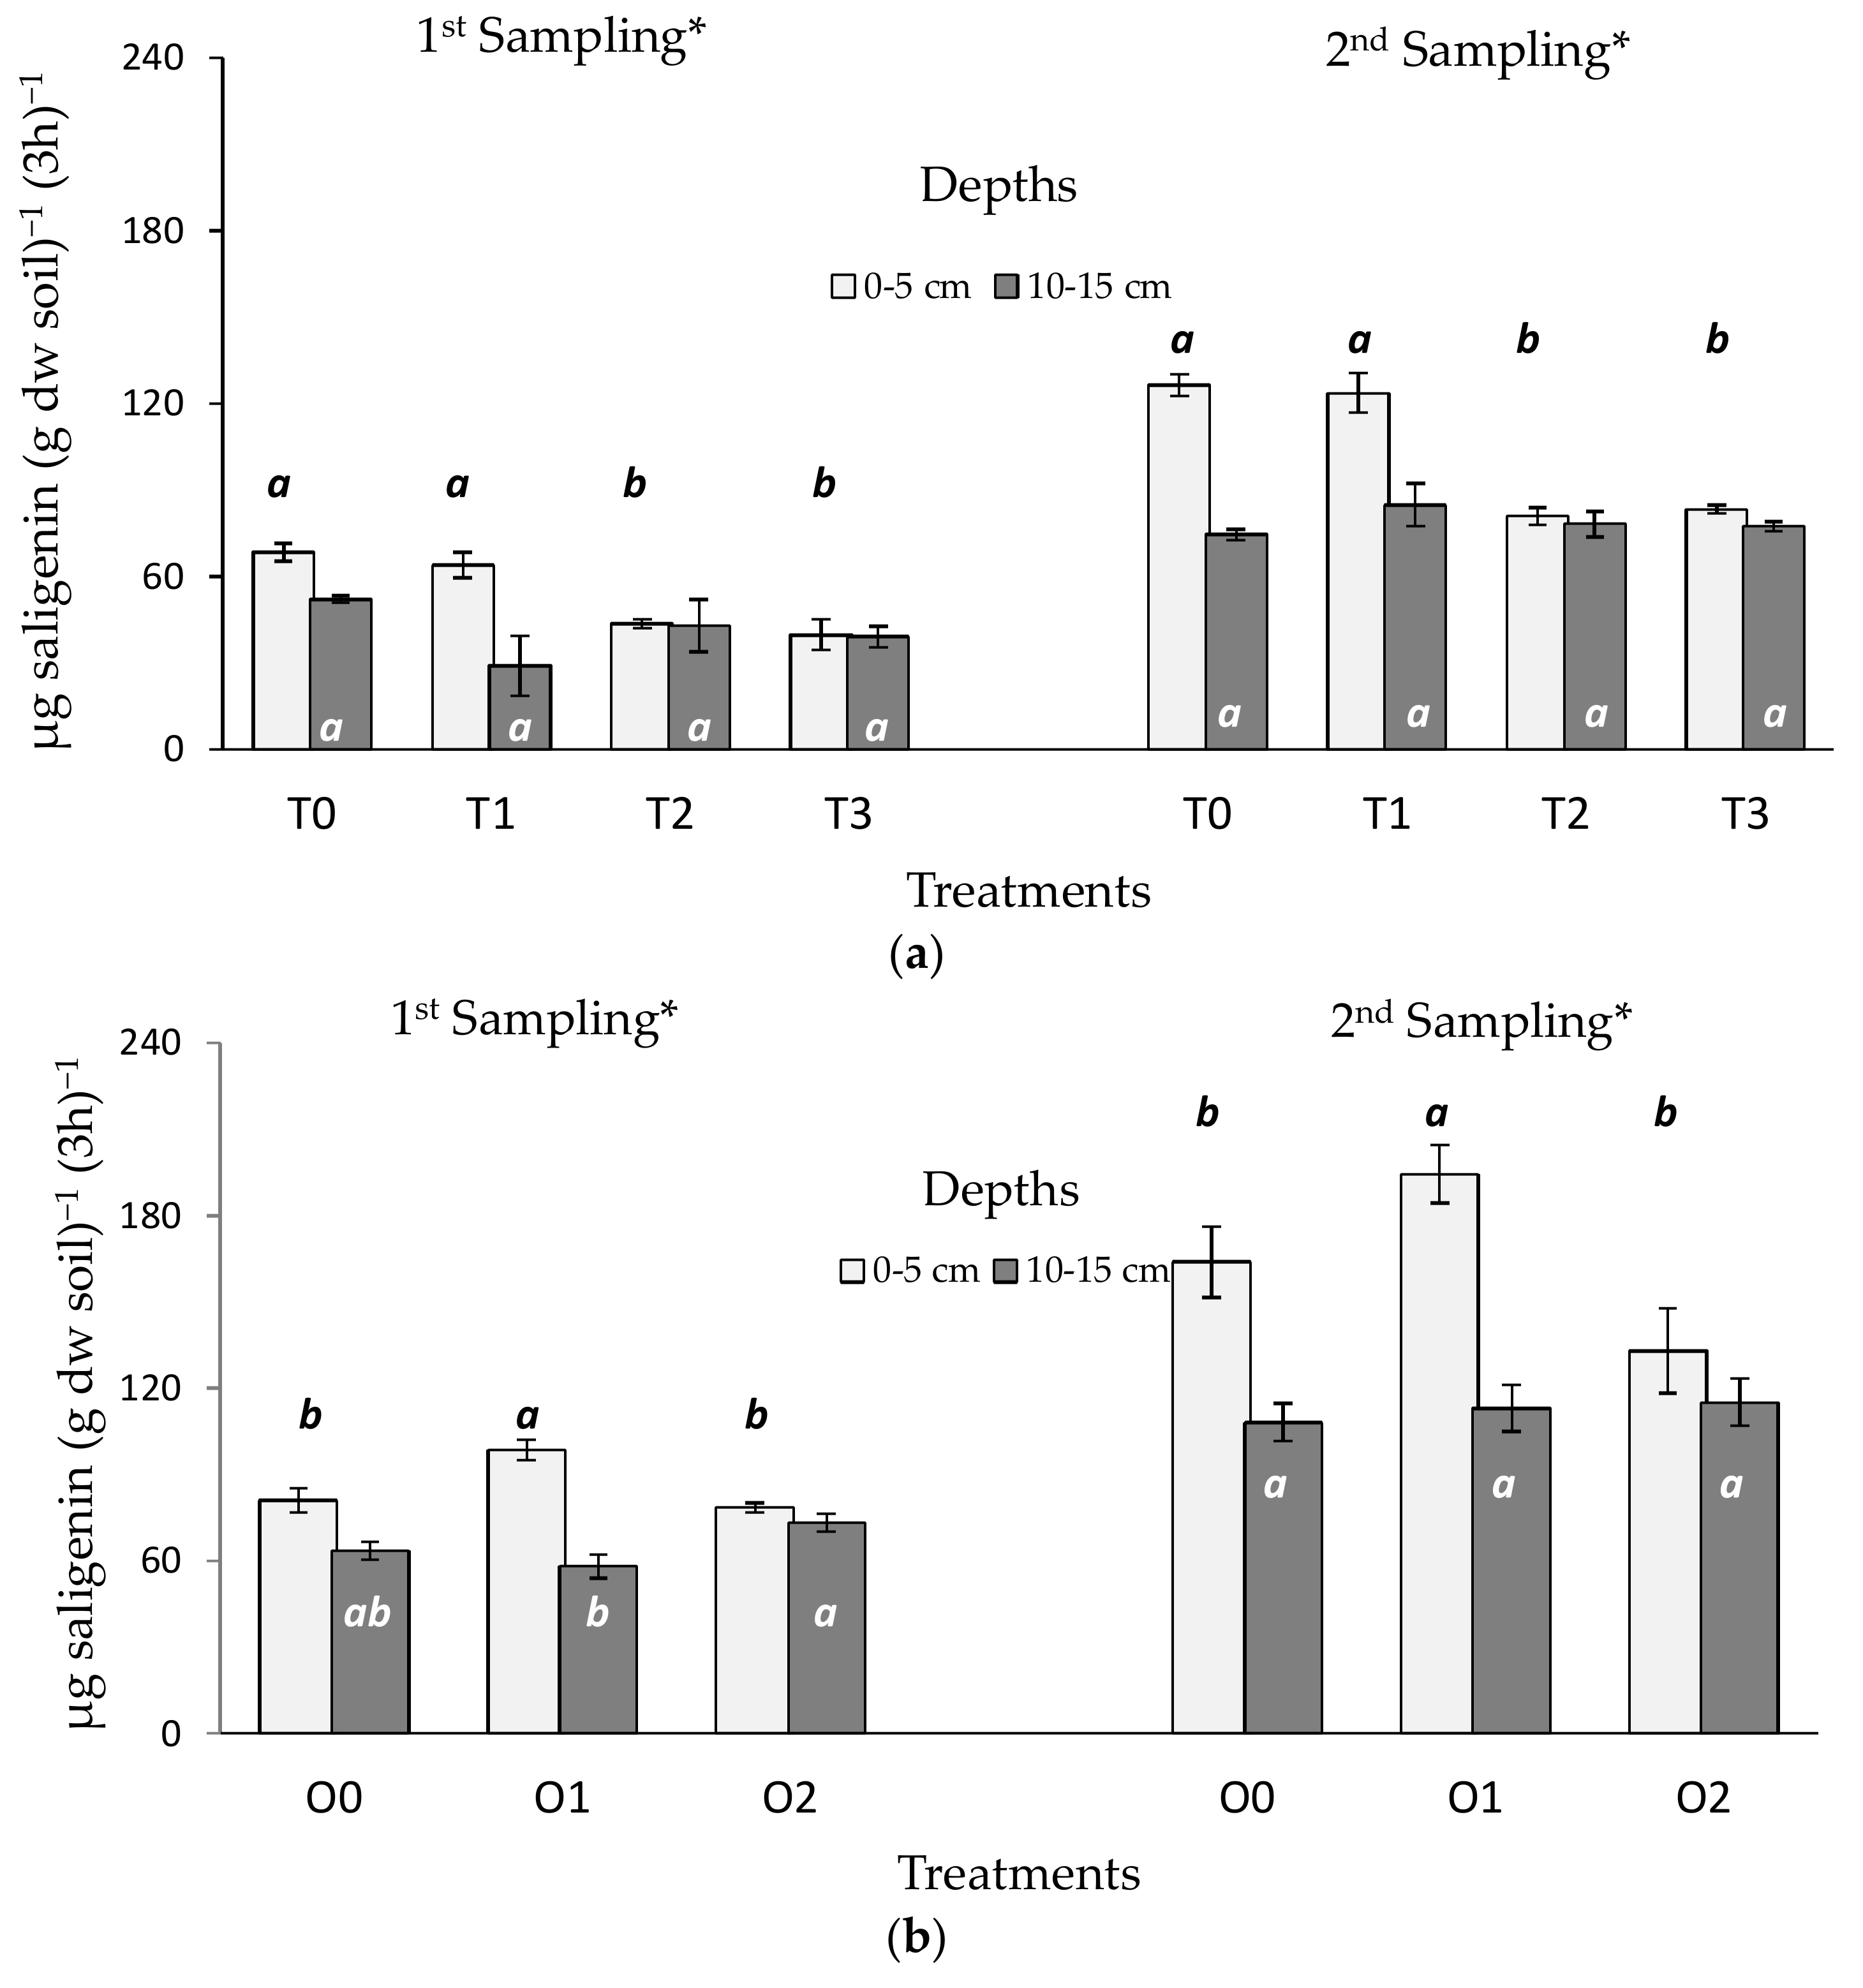
3.2. Tillage and Organic Residue Experiments

The BGa values for all treatments and at all depths were significantly higher in the second sampling period than in the first one (Figure 2). In addition, the treatment with the highest BGa at 0–5 cm depth was the same in both sampling periods. Within tillage treatments, higher BGa was measured for treatments without soil inversion (T0 and T1) than under ploughing (T2 and T3). Furthermore, ploughing (T2 and T3) reduced SOM content and EC at 0–5 cm depth, and slightly increased soil pH at 0–5 cm as well as at 10–15 cm depth (Table 2). According to the thresholds of Dermott [23] and Mariscal-Sancho et al. [20], the dispersion ratio measurements under T2 and T3 at 0–5 cm depth indicated very stable aggregates (dispersion ratio < 5) and were smaller than under T0 and T1. In contrast, the water stable aggregates percentage was higher in T0 and T1 than in ploughed treatments.
The results of BGa in O1 were 35.8% (p < 0.05) higher than in O2 at 0–5 cm depth on average and the BGa in O2 was not significantly different to that of O0. The SOM %, EC, pH and water stable aggregates percentage were higher in O2 than in O1 at 0–5 cm depth, while the dispersion-ratio was smaller in O2 than in O1 (Table 2). Differences of the same sense between O1 and O2 were also observed at 10–15 cm depth. Comparing the cropped treatments (T or O) with the grass-reference, the application of dairy cattle slurry tilled with a disc cultivator (O1) was the only soil management that enhanced BGa.
Both BGa and BGa-ratio (described below) in the second sampling (six years after T treatments and five years after O treatments) were correlated (p < 0.05) with all variables measured in the tillage experiment at 0–5 cm depth. However, BGa was not significantly correlated with any of the other variables in the organic experiment, whilst BGa-ratio was significantly correlated with SOM, dispersion ratio and water stable aggregates percentage at 0–5 cm depth (Table 3).

4. Discussion

4.1. Temporal Variability of β-Glucosidase Activity and Rainfall

The temporal variability of BGa during the grass-reference survey (Figure 1) and in all treatments and depths in both experimental fields (Figure 2) suggest that part of the BGa variability is not explained by the soil treatments alone. Following the data analysis, the most striking result was found under the grass-reference soil, where accumulated total rainfall during the 12 days prior to sampling had a significant correlation with BGa at 0–5 cm (r = −0.98, p = 0.0005) and also at 10–15 cm (r = −0.99, p = 0.0003) depth (Equations (1) and (2)). The grass-reference was a permanent, unfertilized grass sward for which the only management was occasional mowing. Therefore, the effects of soil management and changes in the crop roots on soil enzyme activities (described by several authors such as Niemi et al. [24] or Vepsäläinen et al. [25]) were avoided or minimized, and thus the interpretation of the BGa data had less explanatory variables. Therefore, Equations (1) and (2) could indicate some causal and negative relationship between rainfall and BGa.
Extracellular enzymes are stabilized by adsorption on clay surfaces [26] and, therefore, the low clay content of these soils (<15%) limited extracellular enzyme adsorption and allowed the leaching of β-glucosidase. Actually, the leaching of β-glucosidase in loam and silt loam soils has been previously described in field and laboratory experiments [27,28].
BGa was measured under standard conditions in the laboratory (all samples had the same pH, temperature, and with an excess of substrate in dissolution) and, hence, the values obtained were assumed to be proportional to the concentration of the active β-glucosidase molecules in the medium sampled. Therefore, the leaching of β-glucosidase is bound to cause a reduction in BGa. Furthermore, the leaching of unabsorbed or free β-glucosidase could have a large impact on our measurements of BGa because free β-glucosidase is a more active form than β-glucosidase stabilized with clay or organic colloids [29].
This leaching of β-glucosidase could explain why BGa tended to be much greater in all treatments and depths during periods without leaching, due to low rainfall (such as July 2013) compared with periods with high leaching, due to high rainfall (such as January 2007) (Figure 1). Furthermore, the accumulated β-glucosidase favors the production of glucose, which increases the microbial activity that is mainly responsible for the synthesis of additional β-glucosidase. This behavior could be one of the reasons why the relationship between BGa and the total rainfall during the 12 days before sampling (Σ Rain 12 days) was nonlinear (Figure S1). From another point of view, Yan et al. [29] indicate that the half-life of free β-glucosidase is 95.9 days at 25 °C, which denotes that β-glucosidase decomposition had less influence on the active β-glucosidase content than the leaching of β-glucosidase under udic regimes.
BG is produced mainly by soil microbial communities that are also affected by soil management practices [30]. This interaction could explain why we did not obtain satisfactory models that included soil management plus weathering variables to describe the BGa in the tillage and organic experiments. In addition, the period of time (12 days) referred to in Equations (1) and (2) is related to the interaction between total rain necessary to saturate the grass-reference soil before leaching and other soil-weather related processes and, therefore, this timescale cannot be generalized. Hence, Equations (1) and (2) simply indicate that BGa in cultivated soils tends to increase with decreasing rainfall (as was shown in Figure 2), but the model does not accurately estimate BGa for cropped soils.
Our observations under an udic moisture regimen contrast with those of Mediterranean and other semi-arid ecosystems. In these xeric areas, water is the main limiting factor of microbial activities, and there is a positive correlation between soil water content and soil enzyme activities [31].

4.2. Tillage and Organic Treatments

The decreases of SOM content in ploughed soils are associated with the increase of SOM oxidation [32] caused by soil management such as T2 and T3, whereas the increases of soil acidity under no-till are usually associated with the acidifying effect of nitrification of ammoniacal fertilizers and the decomposition of crop residues at the surface [33]. This superficial acidification was decreased by tillage, probably by mixing with deeper soil of higher pH and, consequently, the highest pH at 0–5 cm depth was measured in T3. In contrast to the tillage treatments, the grass-reference was not subjected to nutrient ion uptake by the crops and therefore presented higher EC. However, EC in grass-reference at 10–15 cm depth was of the same order as O2, which can release a large amount of mineralized components following five years of the compost application (Table 2).
The dispersion ratio and the water stable aggregates’ percentage at 0–5 cm depth were influenced by both the tillage and the organic treatments. The increase in SOM content and the decrease in mechanical disturbance tend to improve soil aggregation [33]. Consequently, the water stable aggregates percentage in T0 and T1 were higher than in ploughed treatments (Table 2). In this way, the highest OM content (15%) in the compost treatment tended to stabilize the soil structure and could explain why O2 showed the smallest dispersion ratio and the highest water stable aggregates inside the organic experiment.
Our data suggest a direct correlation between the degree of alteration of microbial biotopes by tillage and the decrease of BGa. Thus, T1 and T2 had higher BGa than T3 and T4 but lower than the grass-reference at 0–5 cm depth. Only the slurry treatment (O1), which added a labile organic substrate [34], had a larger BGa than the grass-reference (Figure 1 and Figure 2). However, the composted leaf and woody material (O2) provided relatively recalcitrant substrates, which meant that the amendment could only be utilized by a restricted fraction of the microbial biomass [35], and thus there were no significant differences between the BGa for O2 and O0.
According to Griffiths et al. [36], who worked on the same plots, the bulk density of O2 decreased significantly (from 1.25 ± 0.03 to 0.83 ± 0.04 g cm−3) at 2–7 cm depth. O2 also improved the soil visual structure score and water retention compared with O0. Paterson et al. [14] also showed that O1 and O2 increased plant biomass production relative to the unamended control (O0), with O2 having the largest effect on growth, and, therefore, we conclude that the large amount of organic matter provided by O2 improved the overall soil quality. Nevertheless, the highest BGa-ratio values (described below) in the second sampling period were measured under T1 and O1 (Table 2), suggesting that minimum tillage and the application of slurry could be considered recommended treatments for improving an important aspect of the biological soil quality.
Crop yields were similar among all tillage treatments at the beginning of the experiments, but, four years later, T0 and T1 had 72% and 78% of the yield of T3 [37]. This is because zero tillage (T0) can decrease aeration of the surface soil [33], especially during wet growing seasons, such as those that occurred in the east of Scotland during the years under study. Poor aeration can limit root development and, therefore, crop yield [38]. By contrast, ploughing (T2 and T3) is a particularly effective method of seedbed preparation because it can (i) provide surface aeration for the topsoil, especially for spring crops after wet winters, (ii) control weeds and (iii) remediate superficial compaction.
The highest significant correlation (Table 3) between the measured variables in the tillage experiment was found between SOM content and EC (r = 0.90, p < 0.01), which is common in sandy soil due to the increased cation exchange capacity provided by soil OM. The fact that the cation exchange capacity favors proton retention in acid soils [39] explains the significant correlation found between pH and SOM content (−0.80, p < 0.01 in the upper layer). The positive correlation between SOM content and BGa (0.82, p < 0.01 in the upper layer) has been described by many authors, and is the result of the participation of β-glucosidase in the mineralization of carbohydrates [40].

4.3. Response Ratio for Comparing Samples Taken in Different Seasons

In the previous section, the large effect that rainfall (an extrinsic factor) had on the BGa in a control soil under grass was shown. We subsequently revealed how BGa is affected by different management practices and organic amendment applications. Our goal then was to apply a method in order to obtain results where the effects of extrinsic factors (EFs) are minimized. In such a way, the influence of soil management on biochemical quality over time could be evaluated with less interference from extrinsic factors.
According to the Tukey hypothesis [41], the effect of a factor can be of a multiplicative nature over the variables (e.g., BGa (measured) = BGa (without_EFs) × EFs). We observed that some important extrinsic factors, such as rainfall, produced similar effects for all treatments of a field experiment. Specifically, we reported that high rainfall was related to the decrease of BGa in the grass-reference and in all treatments and controls (Figure 1 and Figure 2).
We realized, therefore, that the effects of extrinsic factors could be discerned by taking control plots as a reference, based on two main considerations: (i) control plots, such as T0 and O0 in the tillage and organic experiments, respectively, are affected by extrinsic factors, but (ii) they are not affected by the studied factors (i.e., different tillage systems or organic matter additions). The variability of BGa in the controls for different seasons could, therefore, be attributed primarily to the extrinsic factors (non-study factors that are similar for all plots at the time of sampling).
There are several possibilities for neutralizing the multiplicative effects of extrinsic factors in order to standardize the BGa results. After discarding some possibilities that poorly reduced the seasonal impact, we finally suggest calculating the percentage of response ratio of BGa (Equation (3)):
BGa - ratio = BGa ( without   EFs )   ×   EFs ´ BGa   control ( without   EFs ) × EFs × 100 BGa ( measured ) BGa   control ( measured ) × 100 .
Thus, the influence of extrinsic factors on the BGa-ratio can be eliminated (EFs; see Equation (3)), and the BGa-ratio measured in different seasons could be compared without considering the extrinsic factors. The results of this simple method will be more accurate, the greater the similarity of the effects of extrinsic factor in the control and in the treatments i.e., EFs ≈ EFs′ in Equation (3).
The BGa-ratio mitigated 91% and 95% of the average of the absolute percentage variation of BGa between the two sampling periods in the tillage experiment and in the organic experiment respectively at 0–5 cm depth (Figure 2 and Table 2). In this way, Table 2 shows that most of the treatments had no significant differences between BGa-ratio measured in the first sampling period and BGa-ratio measured in the second sampling period. This suggests that the large differences obtained in BGa between both sampling periods for each treatment were mainly due to extrinsic factors (which should not be overlooked), such as the rainfall before sampling, but not because of the treatments. Nevertheless, there was one exception where the BGa-ratio had a positive evolution: T3 (deep ploughing), which improved BGa-ratio at 10 to 15 cm depth between the first sampling period (75 ± 6.0%) and the second one (104 ± 3.3%). By contrast, T2, which also directly affected the soil at a depth of 10 to 15 cm, did not improve BGa-ratio, probably because T2 included a specific compaction treatment by wheeling the entire plot area with a tractor. Table 3 shows that BGa-ratio had more significant correlations with other selected soil parameters than BGa, and this fact reinforces the appropriateness of the suggested method. However, the downside of BGa-ratio is that it is not able to detect any change over time within the controls.

5. Conclusions

β-glucosidase enzyme activity was sensitive to meteorological conditions, soil management systems and organic amendments. The seasonal variation in the β-glucosidase activity was related to rainfall possibly due to leaching of β-glucosidase. On the other hand, the tillage experiment showed that the disruption of soil structure required to create seedbeds by ploughing impairs β-glucosidase activity, SOM content and water stable aggregates percentage. Our results show that β-glucosidase activity may be enhanced through application of dairy cattle slurry and also with zero and minimum tillage compared with conventional or deep tillage. In addition, to minimize the influence of extrinsic factors that depend on the time of sampling, the response ratio of β-glucosidase activity within a treatment is suggested (Equation (3)). This simple strategy could also be applied to improve the interpretation of other potential soil quality indicators that are sensitive to seasonal changes, such as other enzymatic activities or abundance of microbial communities. However, further research is needed to confirm the convenience of the use of the response ratio in each particulate case.

Supplementary Materials

The following are available online at https://www.mdpi.com/2571-8789/2/2/21/s1, Figure S1: Simple regression models for describing the relationship between β-glucosidase activity (BGa) and the total rainfall during the 12 days before each sampling (∑ rain 12 days) at two depths (Equation (S1) at 0–5 cm; and Equation (S2) at 10–15 cm depth). The prediction and confidence (95%) interval bands are also shown.

Acknowledgments

The research was funded by AGRISOST (S2013/ABI-2717) and the “AGL2017-83283-C2-1-R” Spanish project. We thank Magda Krol for technical assistance, Miguel Angel Ibáñez Ruiz for statistical advice and the Scottish Government’s “Rural and Environment Science and Analytical Services” for funding from the Sustainable Agriculture—Plants Program.

Author Contributions

Bruce Ball and Blair McKenzie conceived, designed and performed the experiments; Ignacio Mariscal-Sancho contributed analysis tools, analyzed the data and wrote the paper.

Conflicts of Interest

The authors declare no conflict of interest.

References

  1. Eriksson, K.; Blanchette, R.A.; Ander, P. Biodegradation of cellulose. In Microbial and Enzymatic Degradation of Wood and Wood Components; Eriksson, K., Blanchette, R.A., Ander, P., Eds.; Springer: Berlin, Germany, 1990; pp. 89–180. [Google Scholar]
  2. Lammirato, C.; Miltner, A.; Wick, L.Y.; Kästner, M. Hydrolysis of cellobiose by β-glucosidase in the presence of soil minerals–Interactions at solid–liquid interfaces and effects on enzyme activity levels. Soil Biol. Biochem. 2010, 42, 2203–2210. [Google Scholar] [CrossRef]
  3. Stege, P.W.; Messina, G.A.; Bianchi, G.; Olsina, R.A.; Raba, J. Determination of β-glucosidase activity in soils with a bioanalytical sensor modified with multiwalled carbon nanotubes. Anal. Bioanal. Chem. 2010, 397, 1347–1353. [Google Scholar] [CrossRef] [PubMed]
  4. Maurya, B.; Singh, V.; Dhyani, P.; Kumar, A. Influence of altitudes on activity of soil health bioindicators β-glucosidase and urease in agricultural soils of Almora district of central Himalaya. Res. J. Soil Biol. 2012, 4, 1–9. [Google Scholar] [CrossRef]
  5. Błońska, E.; Lasota, J.; Zwydak, M.; Klamerus-Iwan, A.; Gołąb, J. Restoration of forest soil and vegetation 15 years after landslides in a lower zone of mountains in temperate climates. Ecol. Eng. 2016, 97, 503–515. [Google Scholar] [CrossRef]
  6. Turner, B.L.; Hopkins, D.W.; Haygarth, P.M.; Ostle, N. β-Glucosidase activity in pasture soils. Appl. Soil Ecol. 2002, 20, 157–162. [Google Scholar] [CrossRef]
  7. Gil-Sotres, F.; Trasar-Cepeda, C.; Leirós, M.; Seoane, S. Different approaches to evaluating soil quality using biochemical properties. Soil Biol. Biochem. 2005, 37, 877–887. [Google Scholar] [CrossRef]
  8. Błońska, E.; Lasota, J.; Gruba, P. Enzymatic activity and stabilization of organic matter in soil with different detritus inputs. Soil Sci. Plant Nutr. 2017, 63, 242–247. [Google Scholar] [CrossRef]
  9. León, P.; Espejo, R.; Gómez-Paccard, C.; Hontoria, C.; Mariscal, I.; Renella, G.; Benito, M. No tillage and sugar beet foam amendment enhanced microbial activity of degraded acidic soils in South West Spain. Appl. Soil Ecol. 2017, 109, 69–74. [Google Scholar] [CrossRef]
  10. Dilly, O.; Munch, J.C.; Pfeiffer, E. Enzyme activities and litter decomposition in agricultural soils in northern, central, and southern Germany. J. Plant Nutr. Soil Sci. 2007, 170, 197–204. [Google Scholar] [CrossRef]
  11. Soil Survey Staff. Keys to Soil Taxonomy; USDA-Natural Resources Conservation Service: Washington, DC, USA, 2014. [Google Scholar]
  12. Newton, A.; Guy, D.; Bengough, A.; Gordon, D.; McKenzie, B.; Sun, B.; Valentine, T.; Hallett, P. Soil tillage effects on the efficacy of cultivars and their mixtures in winter barley. Field Crop. Res. 2012, 128, 91–100. [Google Scholar] [CrossRef]
  13. British Standards Institution PAS 100: Specification for Composted Materials; British Standards Institution (BSI): London, UK, 2005. [CrossRef]
  14. Paterson, E.; Neilson, R.; Midwood, A.J.; Osborne, S.M.; Sim, A.; Thornton, B.; Millard, P. Altered food web structure and C-flux pathways associated with mineralisation of organic amendments to agricultural soil. Appl. Soil Ecol. 2011, 48, 107–116. [Google Scholar] [CrossRef]
  15. Ball, B.; Watson, C.; Baddeley, J. Soil physical fertility, soil structure and rooting conditions after ploughing organically managed grass/clover swards. Soil Use Manag. 2007, 23, 20–27. [Google Scholar] [CrossRef]
  16. Hoffmann, G.; Dedeken, M. Eine Methode zur colorimetrischen Bestimmung der β-Glucosidase-Aktivität in Böden. J. Plant Nutr. Soil Sci. 1965, 108, 193–198. [Google Scholar] [CrossRef]
  17. Mariscal-Sancho, I.; Santano, J.; Mendiola, M.Á.; Peregrina, F.; Espejo, R. Carbon dioxide emission rates and β-glucosidase activity in Mediterranean Ultisols under different soil management. Soil Sci. 2010, 175, 453–460. [Google Scholar] [CrossRef]
  18. Strobl, W.; Traunmüller, M.; Schinner, F.; Öhlinger, R.; Kandeler, E.; Margesin, R. β-Glucosidase Activity. In Methods in Soil Biology; Springer: Berlin, Germany, 1996; pp. 198–200. [Google Scholar]
  19. Böhme, L.; Böhme, F. Soil microbiological and biochemical properties affected by plant growth and different long-term fertilisation. Eur. J. Soil Biol. 2006, 42, 1–12. [Google Scholar] [CrossRef]
  20. Ball, B.; Campbell, D.; Hunter, E. Soil compactibility in relation to physical and organic properties at 156 sites in UK. Soil Tillage Res. 2000, 57, 83–91. [Google Scholar] [CrossRef]
  21. Mariscal-Sancho, I.; Ball, B.; Peregrina, F. Soil quality dynamics following long-term application of poultry manure and sewage sludge on grassland. Commun. Soil Sci. Plant Anal. 2011, 42, 656–668. [Google Scholar] [CrossRef]
  22. Kemper, W.D.; Rosenau, R.C. Aggregate Stability and Size Distribution. In Methods of Soil Analysis. Part 1: Physical and Mineralogical Methods; Klute, A., Ed.; American Society of Agronomy: Madison, WI, USA, 1986; pp. 425–442. [Google Scholar]
  23. Dermott, W.; De Boodt, M. Dispersion ratio determination according to Dermott. West Eur. Methods Soil Struct. Determ. 1967, 71–72. [Google Scholar] [CrossRef]
  24. Niemi, R.; Vepsäläinen, M.; Wallenius, K.; Simpanen, S.; Alakukku, L.; Pietola, L. Temporal and soil depth-related variation in soil enzyme activities and in root growth of red clover (Trifolium pratense) and timothy (Phleum pratense) in the field. Appl. Soil Ecol. 2005, 30, 113–125. [Google Scholar] [CrossRef]
  25. Vepsäläinen, M.; Erkomaa, K.; Kukkonen, S.; Vestberg, M.; Wallenius, K.; Niemi, R.M. The impact of crop plant cultivation and peat amendment on soil microbial activity and structure. Plant Soil 2004, 264, 273–286. [Google Scholar] [CrossRef]
  26. Dick, R.P.; Kandeler, E. Enzymes in soils. In Encyclopedia of Soils in the Environment; Hillel, D., Hatfield, J.L., Eds.; Elsevier Academic Press: Amsterdam, The Netherlands, 2005; Volume 1, pp. 448–456. [Google Scholar]
  27. Gutknecht, J.L.M.; Henry, H.A.L.; Balser, T.C. Inter-annual variation in soil extra-cellular enzyme activity in response to simulated global change and fire disturbance. Pedobiologia 2010, 53, 283–293. [Google Scholar] [CrossRef]
  28. Bell, T.H.; Henry, H.A.L. Fine scale variability in soil extracellular enzyme activity is insensitive to rain events and temperature in a mesic system. Pedobiologia 2011, 54, 141–146. [Google Scholar] [CrossRef]
  29. Yan, J.; Pan, G.; Li, L.; Quan, G.; Ding, C.; Luo, A. Adsorption, immobilization, and activity of β-glucosidase on different soil colloids. J. Colloid Interface Sci. 2010, 348, 565–570. [Google Scholar] [CrossRef] [PubMed]
  30. Landgraf, D.; Klose, S. Mobile and readily available C and N fractions and their relationship to microbial biomass and selected enzyme activities in a sandy soil under different management systems. J. Plant Nutr. Soil Sci. 2002, 165, 9–16. [Google Scholar] [CrossRef]
  31. Sardans, J.; Peñuelas, J.; Estiarte, M. Changes in soil enzymes related to C and N cycle and in soil C and N content under prolonged warming and drought in a Mediterranean shrubland. Appl. Soil Ecol. 2008, 39, 223–235. [Google Scholar] [CrossRef]
  32. Dick, W. Organic carbon, nitrogen, and phosphorus concentrations and pH in soil profiles as affected by tillage intensity. Soil Sci. Soc. Am. J. 1983, 47, 102–107. [Google Scholar] [CrossRef]
  33. Soane, B.D.; Ball, B.C.; Arvidsson, J.; Basch, G.; Moreno, F.; Roger-Estrade, J. No-till in northern, western and south-western Europe: A review of problems and opportunities for crop production and the environment. Soil Tillage Res. 2012, 118, 66–87. [Google Scholar] [CrossRef]
  34. Zaman, M.; Di, H.; Cameron, K.; Frampton, C. Gross nitrogen mineralization and nitrification rates and their relationships to enzyme activities and the soil microbial biomass in soils treated with dairy shed effluent and ammonium fertilizer at different water potentials. Biol. Fertil. Soils 1999, 29, 178–186. [Google Scholar] [CrossRef]
  35. Paterson, E.; Osler, G.; Dawson, L.A.; Gebbing, T.; Sim, A.; Ord, B. Labile and recalcitrant plant fractions are utilised by distinct microbial communities in soil: Independent of the presence of roots and mycorrhizal fungi. Soil Biol. Biochem. 2008, 40, 1103–1113. [Google Scholar] [CrossRef]
  36. Griffiths, B.; Ball, B.; Daniell, T.; Hallett, P.; Neilson, R.; Wheatley, R.; Osler, G.; Bohanec, M. Integrating soil quality changes to arable agricultural systems following organic matter addition, or adoption of a ley-arable rotation. Appl. Soil Ecol. 2010, 46, 43–53. [Google Scholar] [CrossRef]
  37. Newton, A.C.; Bengough, A.G.; Guy, D.C.; McKenzie, B.M.; Hallett, P.D. Interactions between Barley Cultivars and Soil Cultivation—Effects on Yield and Disease. In Proceedings of the Crop Protection in Northern Britain, Dundee, UK, 23–24 February 2010; pp. 137–142. [Google Scholar]
  38. White, P.J.; George, T.S.; Gregory, P.J.; Bengough, A.G.; Hallett, P.D.; McKenzie, B.M. Matching roots to their environment. Ann. Bot. 2013, 112, 207–222. [Google Scholar] [CrossRef] [PubMed]
  39. James, B.R.; Riha, S.J. pH buffering in forest soil organic horizons: Relevance to acid precipitation. J. Environ. Qual. 1986, 15, 229–234. [Google Scholar] [CrossRef]
  40. Wick, B.; Kühne, R.F.; Vielhauer, K.; Vlek, P.L. Temporal variability of selected soil microbiological and biochemical indicators under different soil quality conditions in south-western Nigeria. Biol. Fertil. Soils 2002, 35, 155–167. [Google Scholar] [CrossRef]
  41. Tukey, J.W. One degree of freedom for non-additivity. Biometrics 1949, 5, 232–242. [Google Scholar] [CrossRef]
Figure 1. Temporal variation of β-glucosidase activity in soil samples taken at 0–5 cm and 10–15 cm depth in the long-term grass reference area. Different letters indicate significant differences between seasons (LSD, p < 0.05) within a depth. Vertical bars show standard errors of the means.
Soilsystems 02 00021 g001
Figure 2. β-glucosidase activity in the first and in the second sampling period at 0–5 cm and 10–15 cm depth in (a) four different tillage managements: zero (T0), minimum (T1), conventional (T2) and deep (T3) and (b) under three different organic residue treatments: control (O0), slurry (O1) and compost (O2). Different letters indicate significant differences between treatments (LSD, p < 0.05) within a depth and a sampling period. Vertical bars show standard errors of the means. * The first sampling period was three years after the beginning of the tillage experiment (and two years after the organic treatments), and the second sampling period was six years after the beginning of the tillage experiment (and five years after the organic treatments).
Soilsystems 02 00021 g002
Table 1. Study factors and variables in the three areas of study (tillage experiment, organic experiment and grass-reference).
Study Factors in Each Experiment
Tillage ExperimentOrganic ExperimentGrass-Reference
Zero (control)(T0)Control(O0)Grass-reference
Minimum(T1)Slurry(O1)
Conventional(T2)Compost(O2)
Deep(T3)
Study variables in all experiments
Soil Organic Matter content (SOM)
Electric Conductivity (EC)
pH
Dispersion ratio
Percentage of water stable aggregates
β-glucosidase activity (BGa)
Response ratio of β-glucosidase activity (BGa-ratio)
Weather variables (air and soil temperature *, solar radiation * and precipitation)
* Data not shown.
Table 2. Soil organic matter (SOM) content, electric conductivity (EC), pH, dispersion ratio and water stable aggregates percentage in (a) four different tillage management treatments (T0, T1, T2 and T3) six years after their applications, in (b) three different organic residue treatments (O0, O1 and O2) five years after their applications, and in (c) the grass-reference. The percentage of the response ratio of β-glucosidase (BGa-Ratio) measured in the first and in the second sampling periods * are also shown.
TreatmentDepthSOMECpH1:2.5Dispersion RatioWater Stable1st BGa-Ratio *2nd BGa-Ratio *
(cm)(%)(µS cm−1)Aggregates (%)(%)(%)
T0 (zero)0–55.14±0.29a†173±16a5.42±0.07c6.90±0.91a98.8±0.5a100.0±5.9a A §100.0±3.5a A
T1 (minimum)0–54.58±0.29ab143±16ab5.79±0.07b7.47±0.91a99.4±0.5a93.8±5.9a A105.0±3.5a A
T2 (conventional)0–53.83±0.29c103±16b6.11±0.07a4.60±0.91ab94.1±0.5b64.1±5.9b A63.5±3.5b A
T3 (deep)0–53.94±0.29bc98±16b6.18±0.07a2.55±0.91c95.4±0.5b58.3±5.9b A70.8±3.5b A
O0 (control)0–54.52±0.50b222±59b5.84±0.25b7.51±0.47a94.2±0.5b100.0±4.7b A100.0±4.8ab A
O1 (slurry)0–55.24±0.50b276±59b5.85±0.25b9.41±0.47a94.8±0.5b122.0±4.7a A113.8±4.8a A
O2 (compost) 0–515.18±0.50a896±59a6.74±0.25a4.78±0.47b96.9±0.5a97.7±4.7b A90.0±4.8b A
Grass-reference0–54.56±0.20 243±23 6.00±0.01 7.83±5.12 99.4±0.5 N/A N/A
T0 (zero)10–154.08±0.10a98±6a6.13±0.02b7.09±1.30a96.1±1.1ab100.0±13.9a A100.0±4.6a A
T1 (minimum)10–154.03±0.10a92±6a6.07±0.02b10.40±1.30a96.2±1.1a55.5±13.9a A113.4±4.6a A
T2 (conventional)10–153.90±0.10a84±6a6.23±0.02a8.53±1.30a92.7±1.1b83.3±13.9a A104.7±4.6a A
T3 (deep)10–153.87±0.10a78±6a6.26±0.02a9.33±1.30a93.0±1.1ab75.0±13.9a B104.0±4.6a A
O0 (control)10–154.42±0.77b133±38b5.85±0.07b6.96±0.62b94.8±1.4b100.0±2.5b A100.0±9.7a A
O1 (slurry)10–154.62±0.77b139±38b5.98±0.07b12.77±0.62a93.3±1.4b91.3±2.5c A106.1±9.7a A
O2 (compost) 10–1510.86±0.77a470±38a6.99±0.07a8.48±0.62b97.8±1.4a115.4±2.5a A107.4±9.7a A
Grass-reference10–154.26±0.11 439±66 6.25±0.04 9.81±3.21 94.8±0.8 N/A N/A
±Standard errors of estimate calculated by General Linear Model. † Within an experiment (tillage or organic) and a depth, means followed by the same letter are not significantly different according to LSD (p < 0.05). § Within a treatment and depth, means followed by the same letter are not significantly different between BGa-ratio measured in the two sampling periods according to LSD (p < 0.05). * The first sampling period was three years after the beginning of the tillage experiment (and two years after the organic treatments), and the second sampling period was six years after the beginning of the tillage experiment (and five years after the organic treatments). N/A “Not Applicable” (BGa-ratio cannot be calculated without a reference control).
Table 3. Spearman rank correlations between soil parameters, β-glucosidase activity (BGa) and BGa-ratio at 0–5 cm depth under: (a) the tillage experiment (six years after its beginning) and (b) under the organic residue experiment (five years after its beginning).
(a)
ECpHDispersion RatioWSA %BGaBGa-Ratio
SOM %0.90 **−0.80 **0.66 *0.69 *0.82 **0.68 *
EC −0.90 **0.64 *0.60 *0.85 **0.75 *
pH −0.64 *−0.60 *−0.81 **−0.68 *
Dispersion Ratio 0.67 *0.560.59
WSA % 0.77 *0.79 **
BGa 0.91 **
(b)
SOM %0.80 *0.57−0.600.94 **−0.43−0.76 *
EC 0.47−0.600.90 *−0.22−0.61−
pH −0.370.56−0.32−0.56−
Dispersion Ratio −0.640.670.92 *
WSA % −0.24−0.71 *
BGa 0.76 *
* and ** are significant at p-value < 0.05, and 0.01, respectively. WSA Water Stable Aggregates.

