Humus Forms and Soil Microbiological Parameters in a Mountain Forest: Upscaling to the Slope Scale

 , ,
, ,  and
and
Abstract
:1. Introduction
2. Materials and Methods
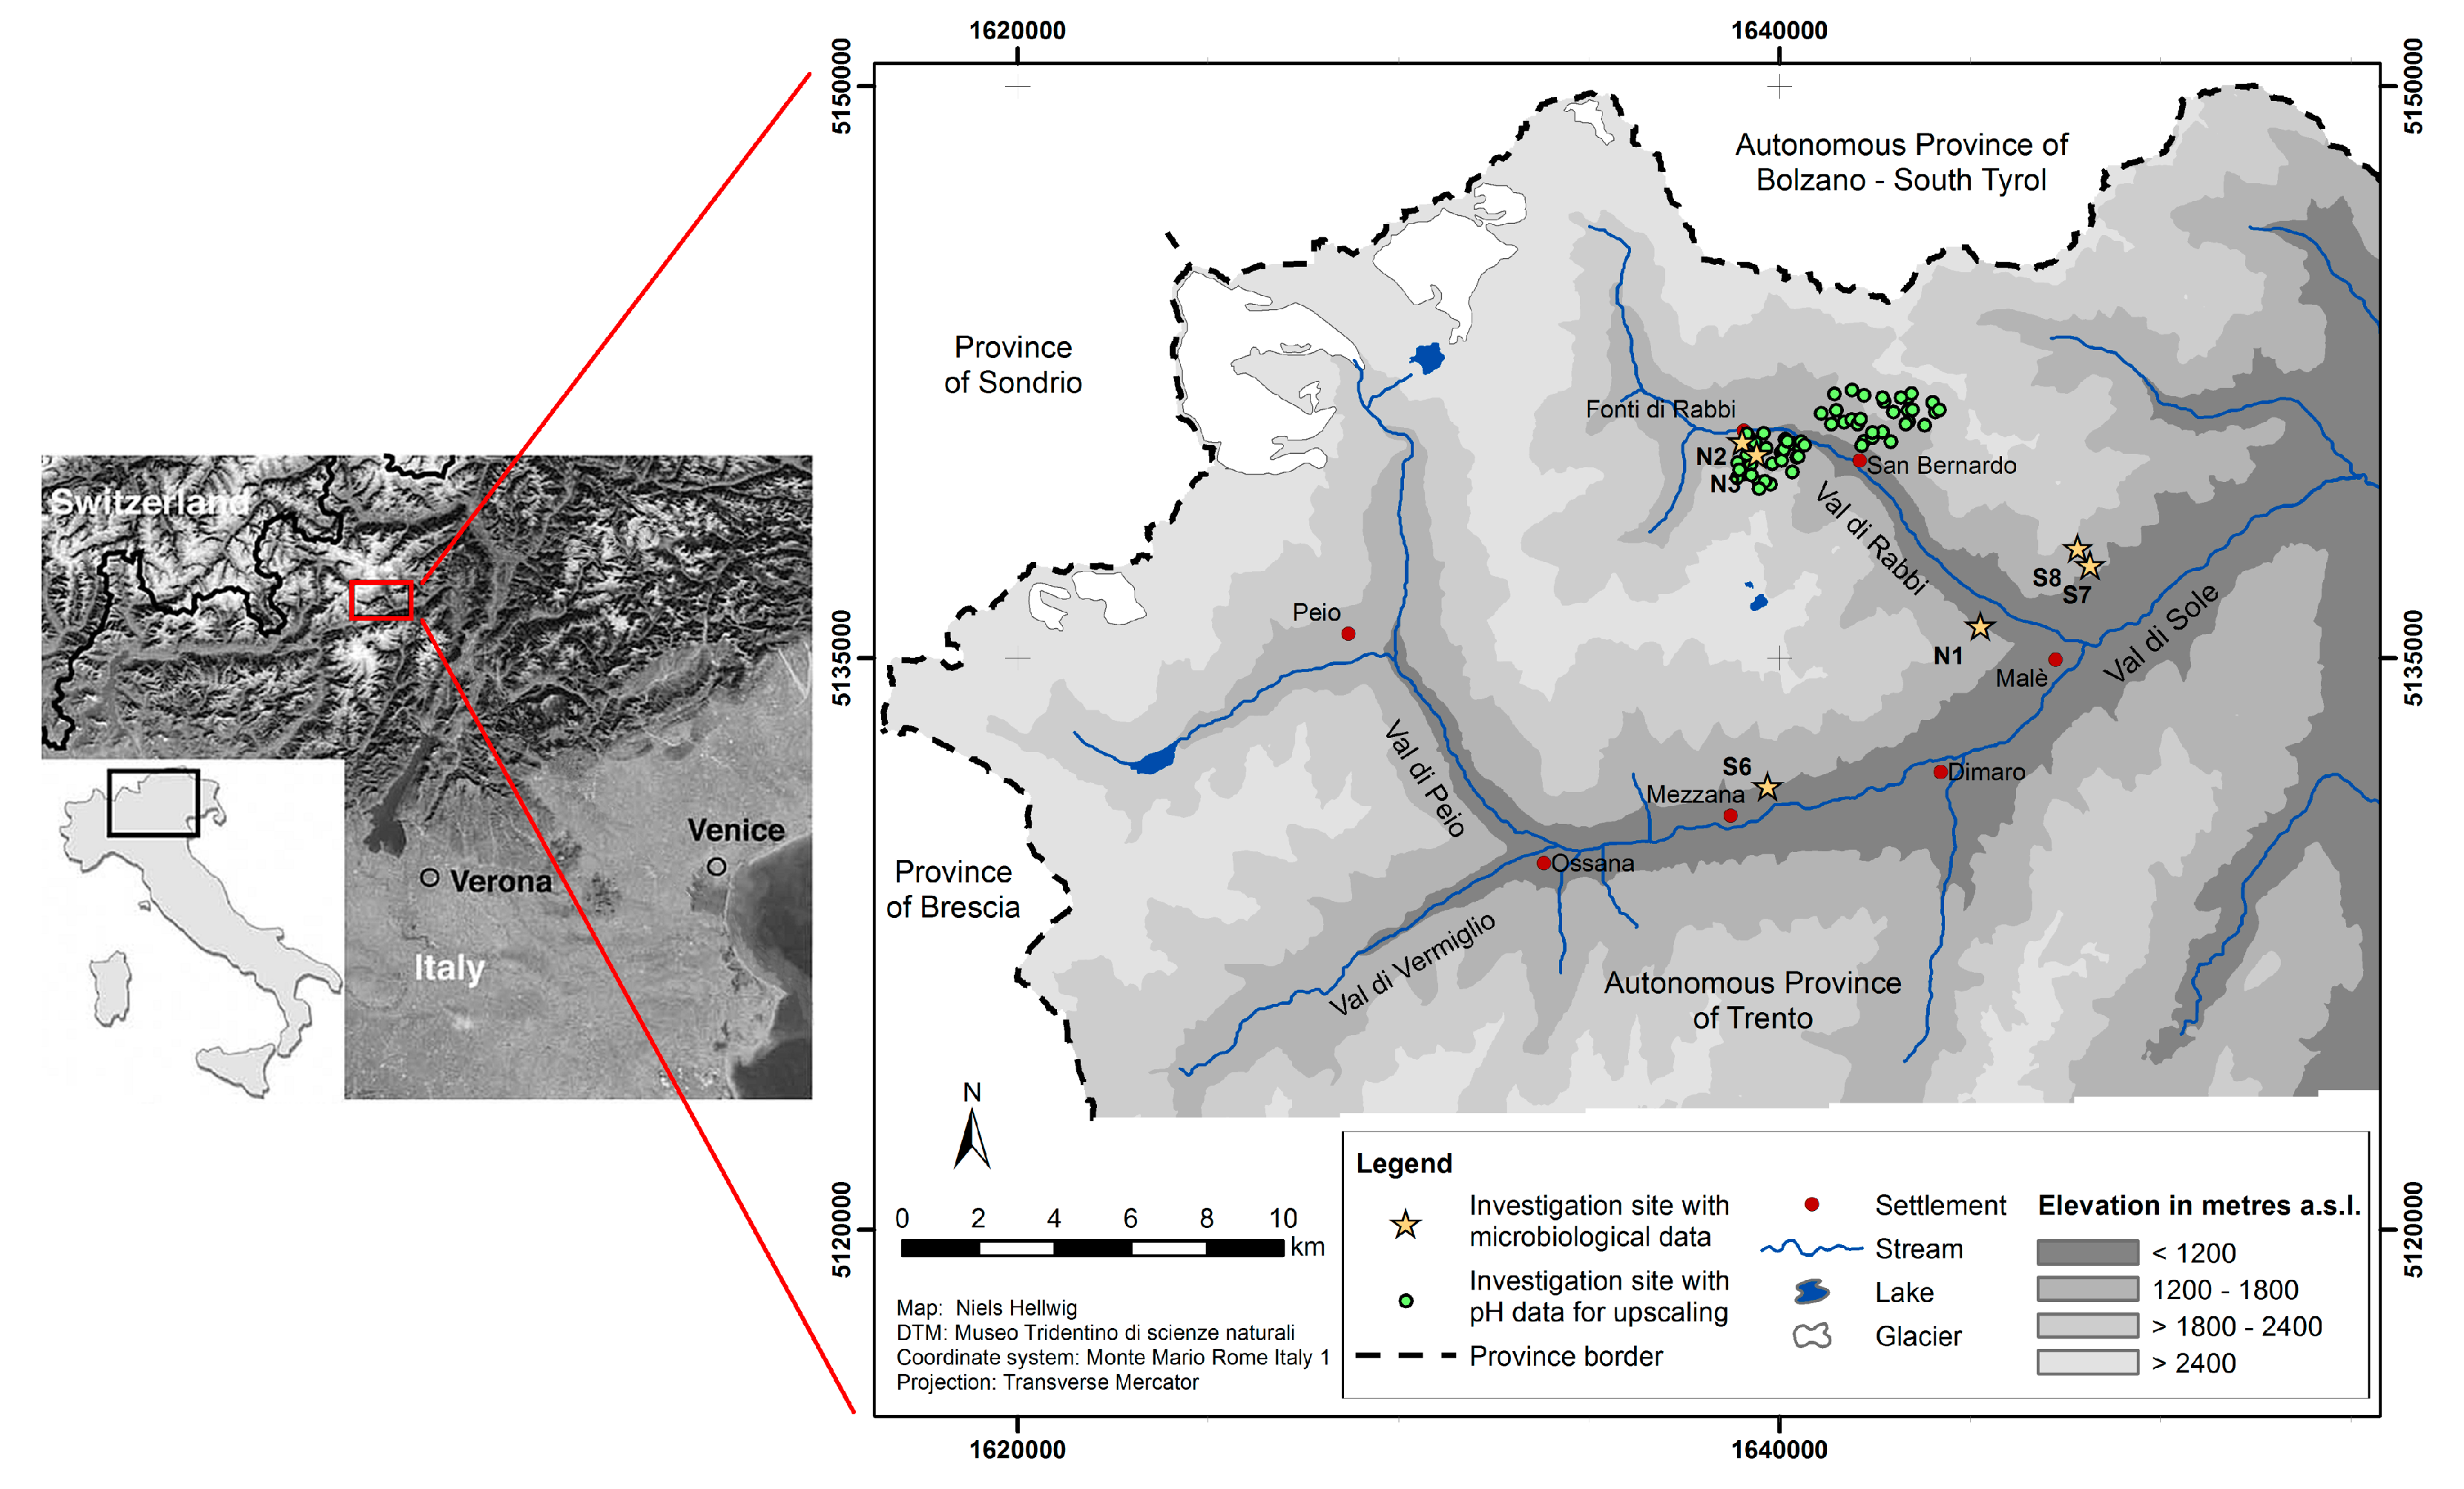
2.1. Study Area
2.2. Sampling
2.3. Soil Analysis
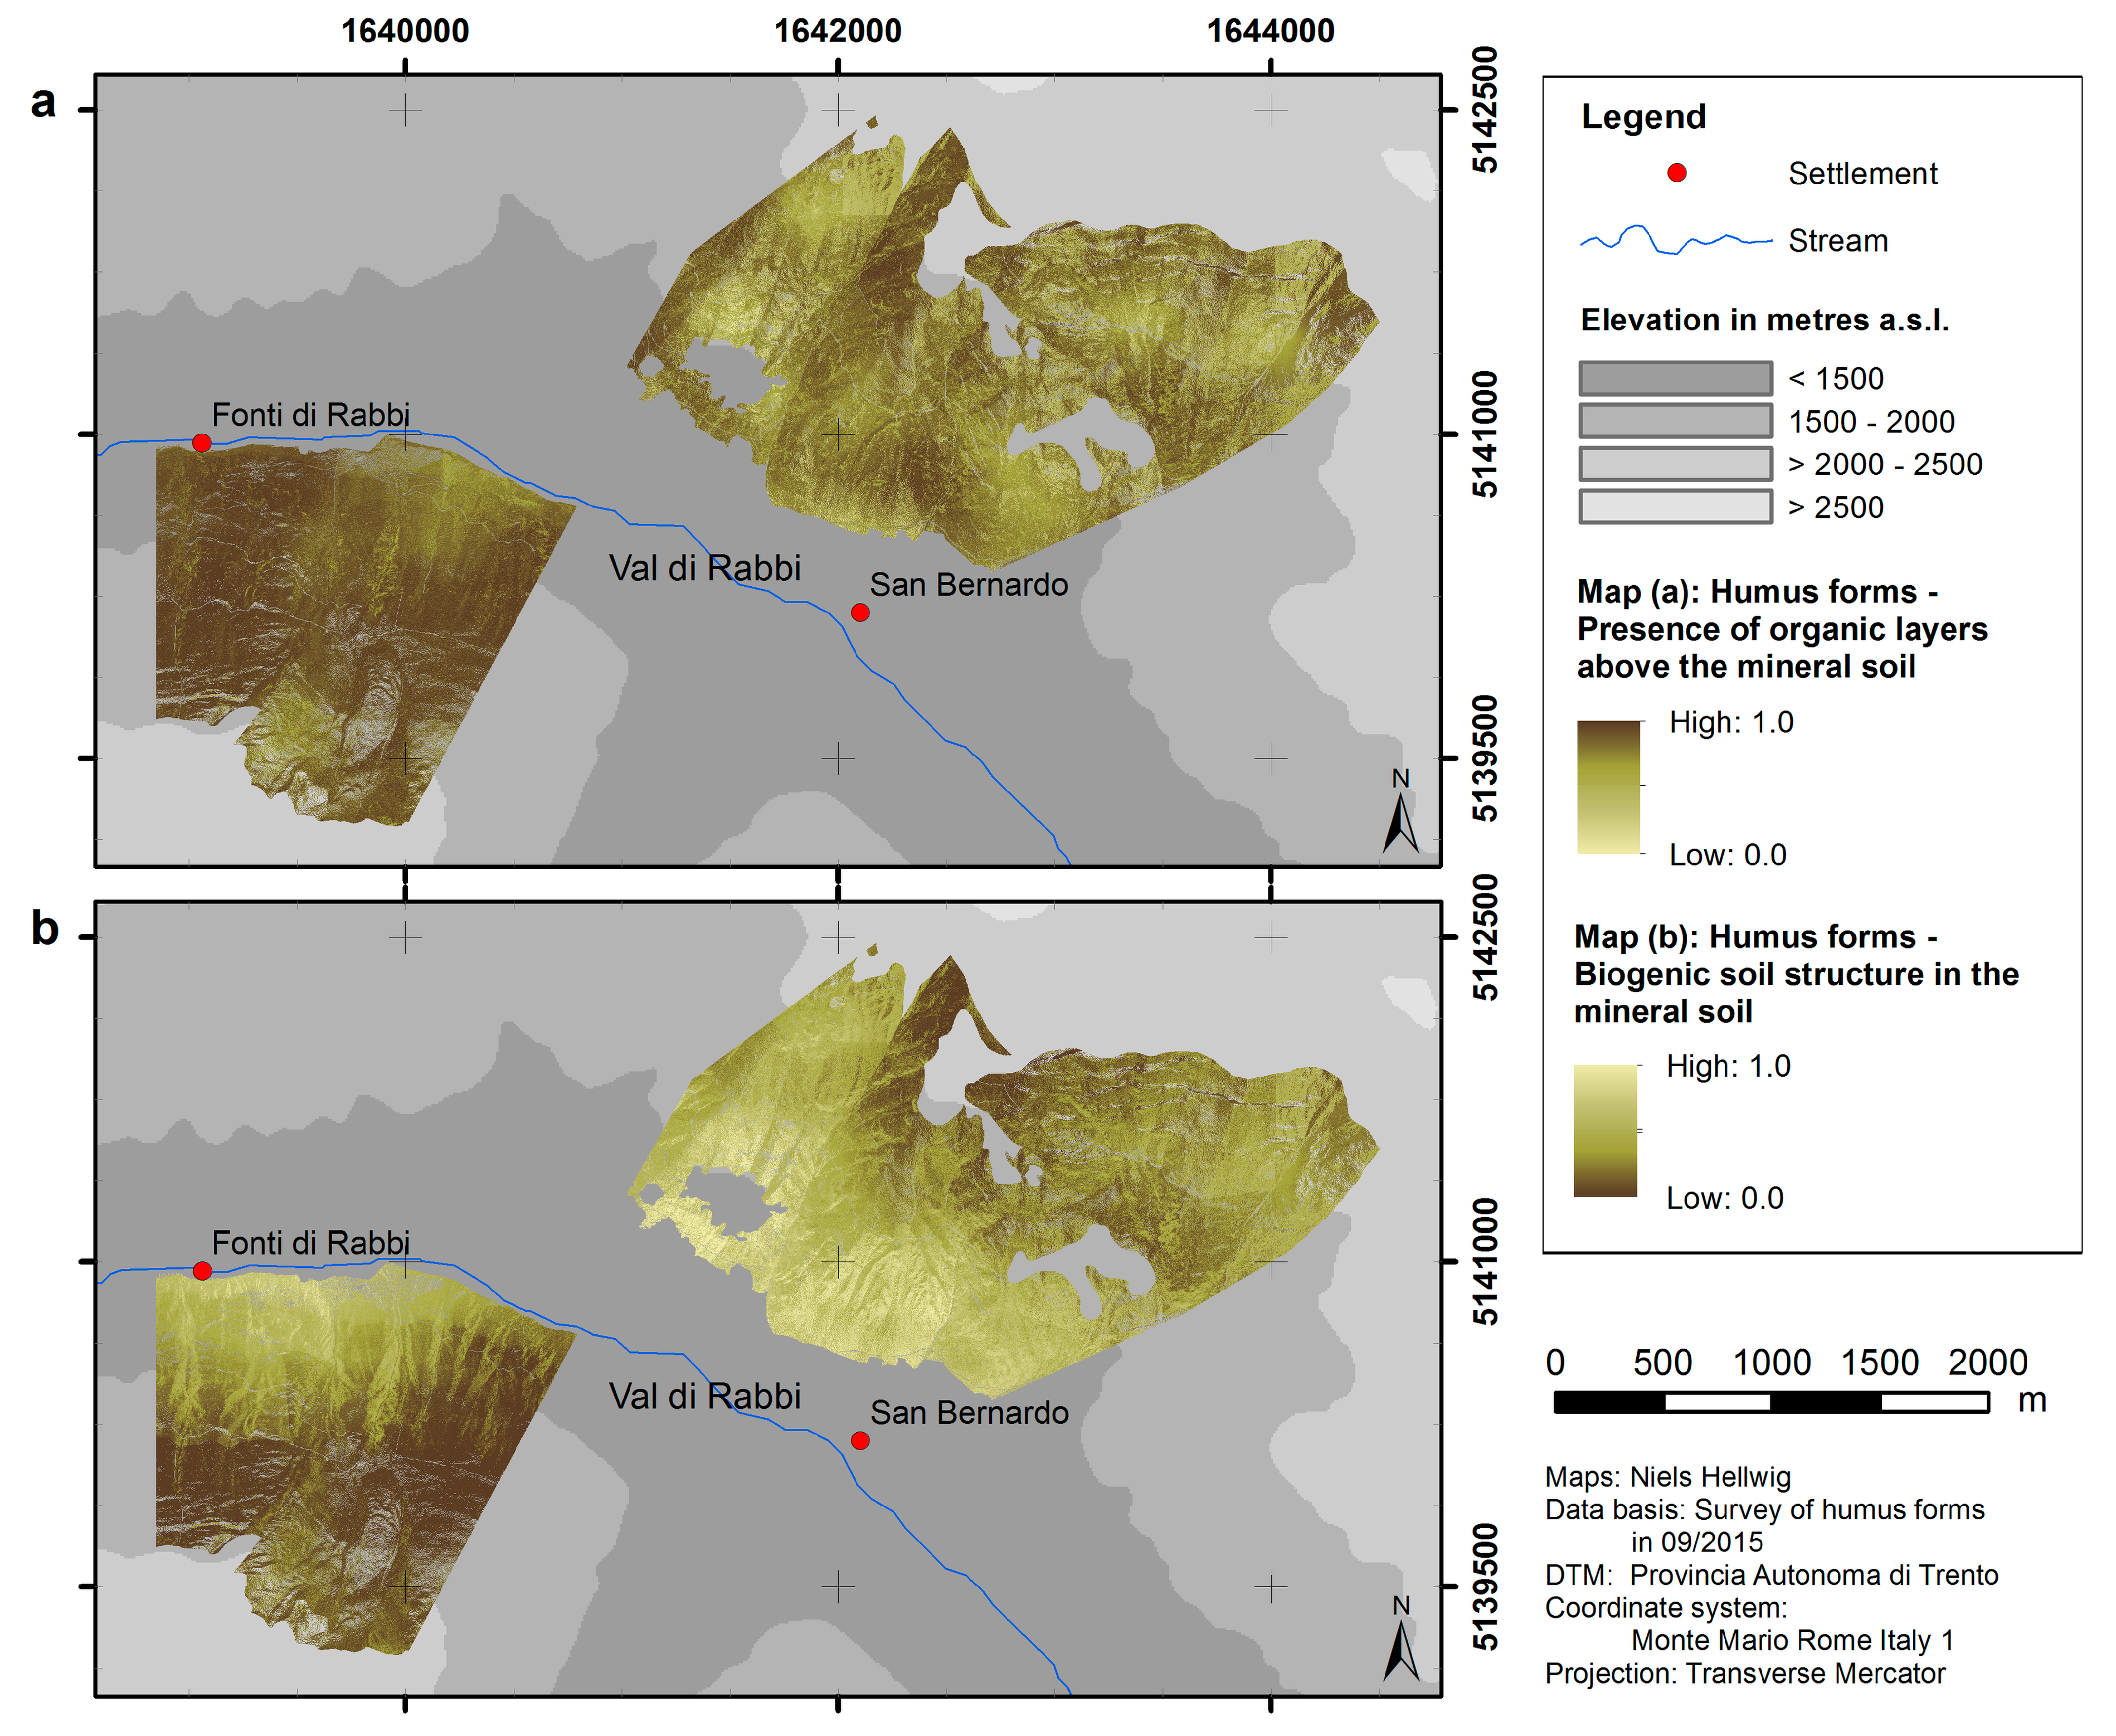
2.3.1. Humus Forms
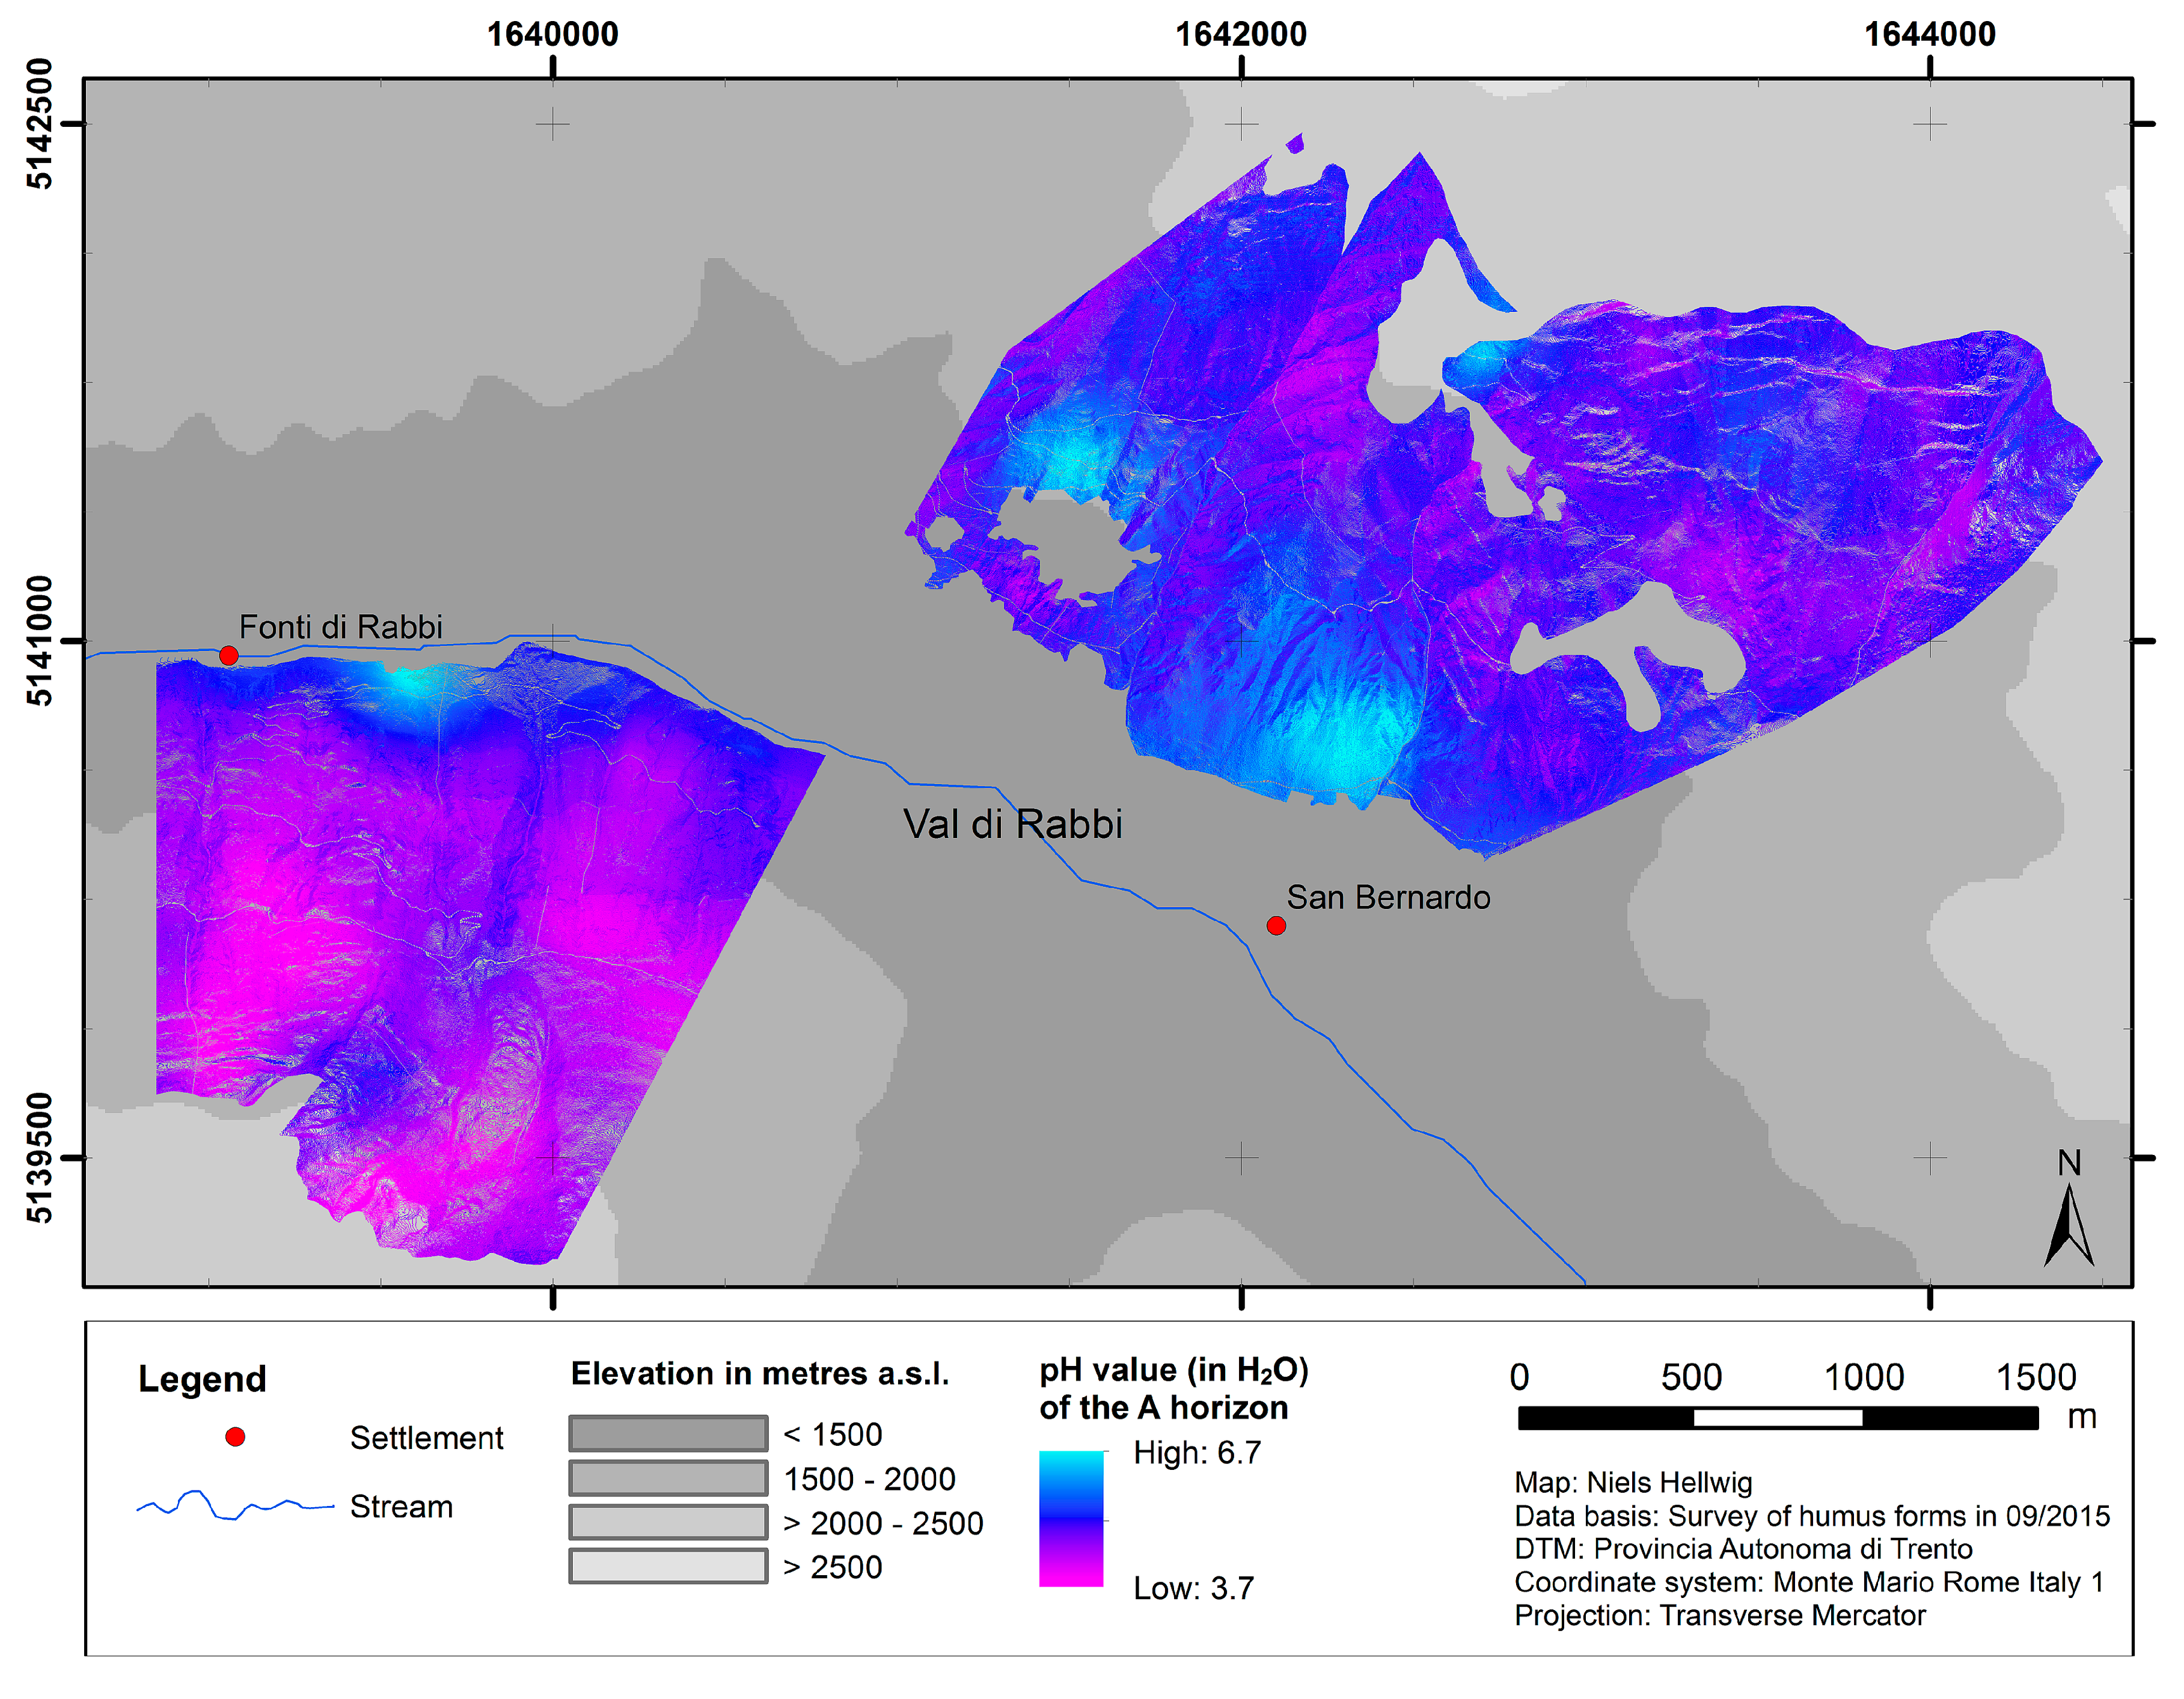
2.3.2. Topsoil Acidity
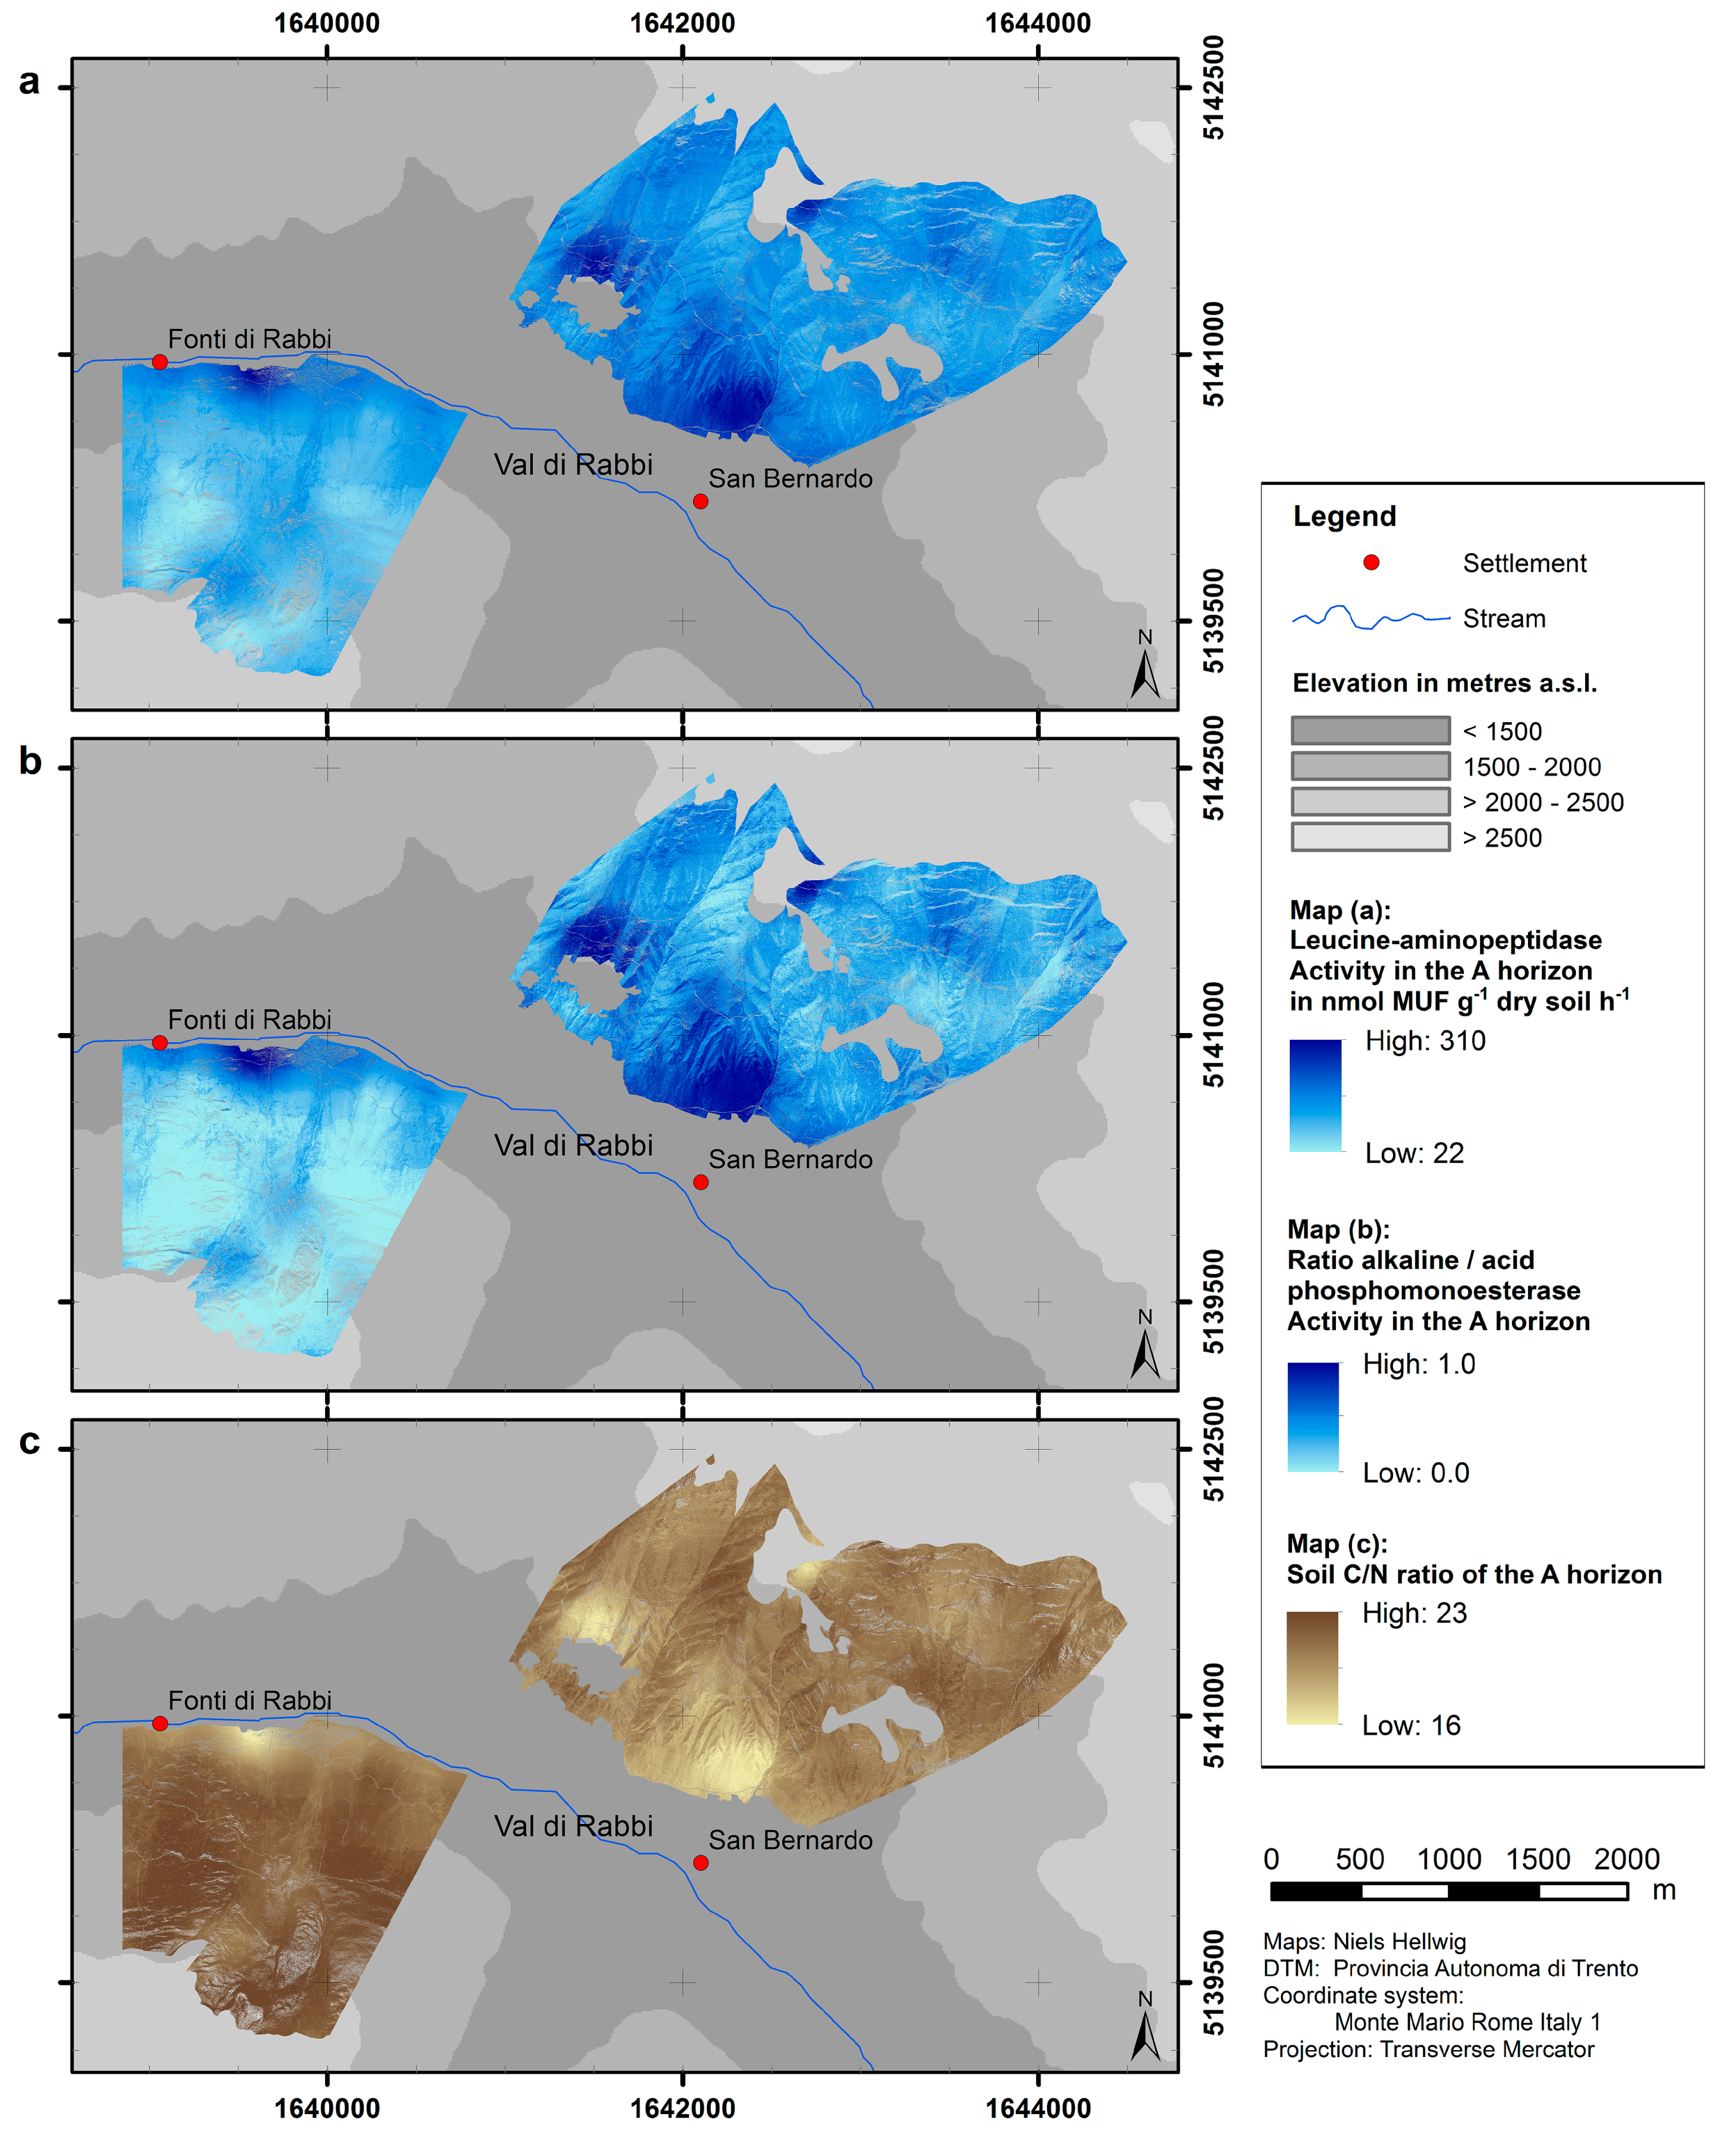
2.3.3. Soil Enzymatic Activities
2.3.4. Total C and N
2.3.5. Quantitative Real-Time PCR
2.4. Spatial Modeling
2.5. Model Assessment
3. Results
4. Discussion
4.1. Spatial Modeling of Humus Forms and Topsoil Acidity
4.2. Upscaling of Microbiological Parameters
4.3. Soil Ecological Implications
5. Conclusions
Supplementary Materials
Acknowledgments
Author Contributions
Conflicts of Interest
References
- Ponge, J.F. Plant-soil feedbacks mediated by humus forms: A review. Soil Biol. Biochem. 2013, 57, 1048–1060. [Google Scholar] [CrossRef]
- Graefe, U.; Beylich, A. Humus forms as tool for upscaling soil biodiversity data to landscape level? Mitt. Dtsch. Bodenkd. Ges. 2006, 108, 6–7. [Google Scholar]
- Ponge, J.F. Humus forms in terrestrial ecosystems: A framework to biodiversity. Soil Biol. Biochem. 2003, 35, 935–945. [Google Scholar] [CrossRef]
- Moscatelli, M.C.; Bonifacio, E.; Chiti, T.; Cudlin, P.; Dinca, L.; Gömöryova, E.; Grego, S.; La Porta, N.; Karlinski, L.; Pellis, G.; et al. Soil properties as indicators of treeline dynamics in view of anthropogenic pressure and climate change. Clim. Res. 2017, 73, 73–84. [Google Scholar] [CrossRef]
- Graefe, U.; Schmelz, R.M. Indicator values, strategy types and life forms of terrestrial Enchytraeidae and other microannelids. Newsl. Enchytraeidae 1999, 6, 59–67. [Google Scholar]
- Labaz, B.; Galka, B.; Bogacz, A.; Waroszewski, J.; Kabala, C. Factors influencing humus forms and forest litter properties in the mid-mountains under temperate climate of southwestern Poland. Geoderma 2014, 230, 265–273. [Google Scholar] [CrossRef]
- Andreetta, A.; Cecchini, G.; Bonifacio, E.; Cornolli, R.; Vingiani, S.; Carnicelli, S. Tree or soil? Factors influencing humus form differentiation in Italian forests. Geoderma 2016, 264, 195–204. [Google Scholar] [CrossRef]
- Ascher, J.; Sartori, G.; Graefe, U.; Thornton, B.; Ceccherini, M.T.; Pietramellara, G.; Egli, M. Are humus forms, mesofauna and microflora in subalpine forest soils sensitive to thermal conditions? Biol. Fertil. Soils 2012, 48, 709–725. [Google Scholar] [CrossRef] [Green Version]
- Hellwig, N.; Graefe, U.; Tatti, D.; Sartori, G.; Anschlag, K.; Beylich, A.; Gobat, J.M.; Broll, G. Upscaling the spatial distribution of enchytraeids and humus forms in a high mountain environment on the basis of GIS and fuzzy logic. Eur. J. Soil Biol. 2017, 79, 1–13. [Google Scholar] [CrossRef]
- Baldrian, P. Microbial activity and the dynamics of ecosystem processes in forest soils. Curr. Opin. Microbiol. 2017, 37, 128–134. [Google Scholar] [CrossRef] [PubMed]
- Gianfreda, L.; Rao, M.A. Enzymes in Agricultural Sciences; OMICS Group International: California, CA, USA, 2014. [Google Scholar]
- Burns, R.G.; DeForest, J.L.; Marxsen, J.; Sinsabaugh, R.L.; Stromberger, M.E.; Wallenstein, M.D.; Weintraub, M.N.; Zoppini, A. Soil enzymes in a changing environment: Current knowledge and future directions. Soil Biol. Biochem. 2013, 58, 216–234. [Google Scholar] [CrossRef]
- Matsui, M.; Fowler, J.H.; Walling, L.L. Leucine aminopeptidases: Diversity in structure and function. Biol. Chem. 2006, 387, 1535–1544. [Google Scholar] [CrossRef] [PubMed]
- Burke, D.J.; Weintraub, M.N.; Hewins, C.R.; Kalisz, S. Relationship between soil enzyme activities, nutrient cycling and soil fungal communities in a northern hardwood forest. Soil Biol. Biochem. 2011, 43, 795–803. [Google Scholar] [CrossRef]
- Bardelli, T.; Gómez-Brandón, M.; Ascher-Jenull, J.; Fornasier, F.; Arfaioli, P.; Francioli, D.; Egli, M.; Sartori, G.; Insam, H.; Pietramellara, G. Effects of slope exposure on soil physico-chemical and microbiological properties along an altitudinal climosequence in the Italian Alps. Sci. Total Environ. 2017, 575, 1041–1055. [Google Scholar] [CrossRef] [PubMed]
- Salazar, S.; Sánchez, L.E.; Alvarez, J.; Valverde, A.; Galindo, P.; Igual, J.M.; Peix, A.; Santa-Regina, I. Correlation among soil enzyme activities under different forest ecosystem management practices. Ecol. Eng. 2011, 37, 1123–1131. [Google Scholar] [CrossRef]
- Nannipieri, P.; Giagnoni, L.; Renella, G.; Puglisi, E.; Ceccanti, B.; Masciandaro, G.; Fornasier, F.; Moscatelli, M.C.; Marinari, S. Soil enzymology: Classical and molecular approaches. Biol. Fertil. Soils 2012, 48, 743–762. [Google Scholar] [CrossRef]
- Nannipieri, P.; Ascher, J.; Ceccherini, M.T.; Landi, L.; Pietramellara, G.; Renella, G. Microbial diversity and soil functions. Eur. J. Soil Sci. 2003, 54, 655–670. [Google Scholar] [CrossRef]
- Yamakura, T.; Sahunalu, P. Soil Carbon/Nitrogen Ratio as a Site Quality Index for Some South-East Asian Forests. J. Trop. Ecol. 1990, 6, 371–377. [Google Scholar] [CrossRef]
- Cools, N.; Vesterdal, L.; De Vos, B.; Vanguelova, E.; Hansen, K. Tree species is the major factor explaining C:N ratios in European forest soils. For. Ecol. Manag. 2014, 311, 3–16. [Google Scholar] [CrossRef]
- Bardgett, R.D.; Freeman, C.; Ostle, N.J. Microbial contributions to climate change through carbon cycle feedbacks. ISME J. 2008, 2, 805–814. [Google Scholar] [CrossRef] [PubMed]
- Venter, J.C.; Remington, K.; Heidelberg, J.F.; Halpern, A.L.; Rusch, D.; Eisen, J.A.; Wu, D.; Paulsen, I.; Nelson, K.E. Environmental Genome Shotgun Sequencing of the Sargasso Sea. Science 2004, 304, 66–74. [Google Scholar] [CrossRef] [PubMed]
- Prosser, J.I.; Nicol, G.W. Archaeal and bacterial ammonia-oxidisers in soil: The quest for niche specialisation and differentiation. Trends Microbiol. 2012, 20, 523–531. [Google Scholar] [CrossRef] [PubMed]
- Isobe, K.; Ohte, N. Ecological Perspectives on Microbes Involved in N-Cycling. Microbes Environ. 2014, 29, 4–16. [Google Scholar] [CrossRef] [PubMed]
- Sterngren, A.E.; Hallin, S.; Bengtson, P. Archaeal Ammonia Oxidizers Dominate in Numbers, but Bacteria Drive Gross Nitrification in N-amended Grassland Soil. Front. Microbiol. 2015, 6, 1350. [Google Scholar] [CrossRef] [PubMed]
- Bengtson, P.; Barker, J.; Grayston, S.J. Evidence of a strong coupling between root exudation, C and N availability, and stimulated SOM decomposition caused by rhizosphere priming effects. Ecol. Evol. 2012, 2, 1843–1852. [Google Scholar] [CrossRef] [PubMed]
- Rousk, J.; Bååth, E.; Brookes, P.C.; Lauber, C.L.; Lozupone, C.; Caporaso, J.G.; Knight, R.; Fierer, N. Soil bacterial and fungal communities across a pH gradient in an arable soil. ISME J. 2010, 4, 1340–1351. [Google Scholar] [CrossRef] [PubMed]
- Gómez-Brandón, M.; Ascher-Jenull, J.; Bardelli, T.; Fornasier, F.; Sartori, G.; Pietramellara, G.; Arfaioli, P.; Egli, M.; Beylich, A.; Insam, H.; Graefe, U. Ground cover and slope exposure effects on micro- and mesobiota in forest soils. Ecol. Indic. 2017, 80, 174–185. [Google Scholar] [CrossRef]
- Andreetta, A.; Macci, C.; Giansoldati, V.; Masciandaro, G.; Carnicelli, S. Microbial activity and organic matter composition in Mediterranean humus forms. Geoderma 2013, 209–210, 198–208. [Google Scholar] [CrossRef]
- Aberegg, I.; Egli, M.; Sartori, G.; Purves, R. Modelling spatial distribution of soil types and characteristics in a high Alpine valley (Val di Sole, Trentino, Italy). Stud. Trent. Sci. Nat. 2009, 85, 39–50. [Google Scholar]
- Von Seidlein, C. Petrographie und Struktur des ostalpinen Altkristallins südlich des Ultentales (Trentino, Nord-Italien). Ph.D. Thesis, Ludwig-Maximilians-Universität München, Munich, Germany, March 2000. [Google Scholar]
- Dobrowski, S.Z. A climatic basis for microrefugia: The influence of terrain on climate. Glob. Chang. Biol. 2011, 17, 1022–1035. [Google Scholar] [CrossRef]
- Sboarina, C.; Cescatti, A. Il Clima del Trentino—Distribuzione Spaziale delle Principali Variabili Climatiche, Report Centro Ecologia Alpina 33; Centro di Ecologia Alpina: Sardagna (Trento), Italy, 2004; pp. 1–20. [Google Scholar]
- Sartori, G.; Mancabelli, A. Carta dei suoli del Trentino: Scala 1:250.000. Museo Tridentino di Scienze Naturali di Trento, Centro di Ricerca per l’Agrobiologia e la Pedologia di Firenze: Trento, Italy, 2009. [Google Scholar]
- IUSS Working Group WRB. World Reference Base for Soil Resources 2006; World Soil Resources Report 103; FAO: Rome, Italy, 2006. [Google Scholar]
- Egli, M.; Mirabella, A.; Sartori, G.; Zanelli, R.; Bischof, S. Effect of north and south exposure on weathering rates and clay mineral formation in Alpine soils. Catena 2006, 67, 155–174. [Google Scholar] [CrossRef]
- Anschlag, K.; Tatti, D.; Hellwig, N.; Sartori, G.; Gobat, J.M.; Broll, G. Vegetation-based bioindication of humus forms in coniferous mountain forests. J. Mt. Sci. 2017, 14, 662–673. [Google Scholar] [CrossRef]
- Minasny, B.; McBratney, A.B. A conditioned Latin hypercube method for sampling in the presence of ancillary information. Comput. Geosci. 2006, 32, 1378–1388. [Google Scholar] [CrossRef]
- Egli, M.; Hafner, S.; Derungs, C.; Ascher-Jenull, J.; Camin, F.; Sartori, G.; Raab, G.; Bontempo, L. Decomposition and stabilisation of Norway spruce needle-derived material in Alpine soils using a 13C-labelling approach in the field. Biogeochemistry 2016, 131, 321–338. [Google Scholar] [CrossRef]
- Ad-hoc-AG Boden. Bodenkundliche Kartieranleitung, 5th ed.; E. Schweizerbart’sche Verlagsbuchhandlung: Hannover, Germany, 2005; ISBN 978-3-510-95920-4. [Google Scholar]
- Graefe, U. Gibt es in Deutschland die Humusform Amphi? Mitt. Dtsch. Bodenkd. Ges. 2007, 110, 459–460. [Google Scholar]
- Fornasier, F.; Margon, A. Bovine serum albumin and Triton X-100 greatly increase phosphomonoesterases and arylsulphatase extraction yield from soil. Soil Biol. Biochem. 2007, 39, 2682–2684. [Google Scholar] [CrossRef]
- Ascher, J.; Ceccherini, M.T.; Pantani, O.L.; Agnelli, A.; Borgogni, F.; Guerri, G.; Nannipieri, P.; Pietramellara, G. Sequential extraction and genetic fingerprinting of a forest soil metagenome. Appl. Soil Ecol. 2009, 42, 176–181. [Google Scholar] [CrossRef]
- Ferris, M.J.; Muyzer, G.; Ward, D.M. Denaturing gradient gel electrophoresis profiles of 16S rRNA-defined populations inhabiting a hot spring microbial mat community. Appl. Environ. Microbiol. 1996, 62, 340–346. [Google Scholar] [PubMed]
- Coolen, M.J.L.; Hopmans, E.C.; Rijpstra, W.I.C.; Muyzer, G.; Schouten, S.; Volkman, J.K.; Damste, J.S.S. Evolution of the methane cycle in Ace Lake (Antarctica) during the Holocene: Response of methanogens and methanotrophs to environmental change. Org. Geochem. 2004, 35, 1151–1167. [Google Scholar] [CrossRef]
- Breiman, L. Random Forests. Mach. Learn. 2001, 45, 5–32. [Google Scholar] [CrossRef]
- Heuvelink, G.B.M.; Webster, R. Modelling soil variation: Past, present, and future. Geoderma 2001, 100, 269–301. [Google Scholar] [CrossRef]
- Guo, P.T.; Li, M.F.; Luo, W.; Tang, Q.F.; Liu, Z.W.; Lin, Z.M. Digital mapping of soil organic matter for rubber plantation at regional scale: An application of random forest plus residuals kriging approach. Geoderma 2015, 237, 49–59. [Google Scholar] [CrossRef]
- Prasad, A.M.; Iverson, L.R.; Liaw, A. Newer Classification and Regression Tree Techniques: Bagging and Random Forests for Ecological Prediction. Ecosystems 2006, 9, 181–199. [Google Scholar] [CrossRef]
- Cutler, D.R.; Edwards, J.T.C.; Beard, K.H.; Cutler, A.; Hess, K.T.; Gibson, J.C.; Lawler, J.J. Random Forests for Classification in Ecology. Ecology 2007, 88, 2783–2792. [Google Scholar] [CrossRef] [PubMed]
- Grimm, R.; Behrens, T.; Märker, M.; Elsenbeer, H. Soil organic carbon concentrations and stocks on Barro Colorado Island – Digital soil mapping using Random Forest analysis. Geoderma 2008, 146, 102–113. [Google Scholar] [CrossRef]
- Heung, B.; Bulmer, C.E.; Schmidt, M.G. Predictive soil parent material mapping at a regional-scale: A Random Forest approach. Geoderma 2014, 214–215, 141–154. [Google Scholar] [CrossRef]
- Zevenbergen, L.W.; Thorne, C.R. Quantitative analysis of land surface topography. Earth Surf. Process. Landf. 1987, 12, 47–56. [Google Scholar] [CrossRef]
- Moore, I.D.; Grayson, R.B.; Ladson, A.R. Digital terrain modelling: A review of hydrological, geomorphological, and biological applications. Hydrol. Process. 1991, 5, 3–30. [Google Scholar] [CrossRef]
- R Core Team. R: A Language and Environment for Statistical Computing; R Foundation for Statistical Computing: Vienna, Austria, 2016; Available online: http://www.R-project.org/ (accessed on 20 February 2018).
- Liaw, A.; Wiener, M. Classification and Regression by randomForest. R. News 2002, 2, 18–22. [Google Scholar]
- Hellwig, N.; Anschlag, K.; Broll, G. A fuzzy logic based method for modeling the spatial distribution of indicators of decomposition in a high mountain environment. Arct. Antarct. Alp. Res. 2016, 48, 623–635. [Google Scholar] [CrossRef]
- Baruck, J.; Nestroy, O.; Sartori, G.; Baize, D.; Traidl, R.; Vrščaj, B.; Bräm, E.; Gruber, F.E.; Heinrich, K.; Geitner, C. Soil classification and mapping in the Alps: The current state and future challenges. Geoderma 2016, 264, 312–331. [Google Scholar] [CrossRef]
- Leifeld, J.; von Lützow, M. Chemical and microbial activation energies of soil organic matter decomposition. Biol. Fertil. Soils 2014, 50, 147–153. [Google Scholar] [CrossRef]
- Sinsabaugh, R.L.; Lauber, C.L.; Weintraub, M.N.; Ahmed, B. Stoichiometry of soil enzyme activity at global scale. Ecol. Lett. 2008, 11, 1252–1264. [Google Scholar] [CrossRef] [PubMed]
- Koch, O.; Tscherko, D.; Kandeler, E. Temperature sensitivity of microbial respiration, nitrogen mineralization, and potential soil enzyme activities in organic alpine soils. Glob. Biogeochem. Cycles 2007, 21. [Google Scholar] [CrossRef]
- Sanaullah, M.; Blagodatskaya, E.; Chabbi, A.; Rumpel, C.; Kuzyakov, Y. Drought effects on microbial biomass and enzyme activities in the rhizosphere of grasses depend on plant composition. Appl. Soil Ecol. 2011, 48, 38–44. [Google Scholar] [CrossRef]
- Eivazi, F.; Tabatabai, M.A. Phosphatases in Soils. Soil Biol. Biochem. 1977, 9, 167–172. [Google Scholar] [CrossRef]
- Juma, N.G.; Tabatabai, M.A. Distribution of Phosphomonoesterases in Soils. Soil Sci. 1978, 126, 101–108. [Google Scholar] [CrossRef]
- Dick, W.A.; Cheng, L.; Wang, P. Soil acid and alkaline phosphatase activity as pH adjustment indicators. Soil Biol. Biochem. 2000, 32, 1915–1919. [Google Scholar] [CrossRef]
- Badía, D.; Ruiz, A.; Girona, A.; Martí, C.; Casanova, J.; Ibarra, P.; Zufiaurre, R. The influence of elevation on soil properties and forest litter in the Siliceous Moncayo Massif, SW Europe. J. Mt. Sci. 2016, 13, 2155–2169. [Google Scholar] [CrossRef]
- Tashi, S.; Singh, B.; Keitel, C.; Adams, M. Soil carbon and nitrogen stocks in forests along an altitudinal gradient in the eastern Himalayas and a meta-analysis of global data. Glob. Chang. Biol. 2016, 22, 2255–2268. [Google Scholar] [CrossRef] [PubMed]
- Müller, M.; Oelmann, Y.; Schickhoff, U.; Böhner, J.; Scholten, T. Himalayan treeline soil and foliar C:N:P stoichiometry indicate nutrient shortage with elevation. Geoderma 2017, 291, 21–32. [Google Scholar] [CrossRef]
- Siles, J.A.; Margesin, R. Abundance and Diversity of Bacterial, Archaeal, and Fungal Communities along an Altitudinal Gradient in Alpine Forest Soils: What Are the Driving Factors? Microb. Ecol. 2016, 72, 207–220. [Google Scholar] [CrossRef] [PubMed]
- Nannipieri, P.; Ascher-Jenull, J.; Ceccherini, M.T.; Giagnoni, L.; Pietramellara, G.; Renella, G. Microbial diversity and soil functions. Eur. J. Soil Sci. 2017, 68, 12–26. [Google Scholar] [CrossRef]
- Bojko, O.; Kabala, C. Organic carbon pools in mountain soils—Sources of variability and predicted changes in relation to climate and land use changes. Catena 2017, 149, 209–220. [Google Scholar] [CrossRef]
- Oueslati, I.; Allamano, P.; Bonifacio, E.; Claps, P. Vegetation and Topographic Control on Spatial Variability of Soil Organic Carbon. Pedosphere 2013, 23, 48–58. [Google Scholar] [CrossRef]
- Prietzel, J.; Christophel, D. Organic carbon stocks in forest soils of the German Alps. Geoderma 2014, 221–222, 28–39. [Google Scholar] [CrossRef]
- Chen, L.-F.; He, Z.-B.; Du, J.; Yang, J.-J.; Zhu, X. Patterns and environmental controls of soil organic carbon and total nitrogen in alpine ecosystems of northwestern China. Catena 2016, 137, 37–43. [Google Scholar] [CrossRef]
- Davidson, E.A.; Janssens, I.A. Temperature sensitivity of soil carbon decomposition and feedbacks to climate change. Nature 2006, 440, 165–173. [Google Scholar] [CrossRef] [PubMed]
- Conant, R.T.; Ryan, M.G.; Ågren, G.I.; Birge, H.E.; Davidson, E.A. Temperature and soil organic matter decomposition rates – synthesis of current knowledge and a way forward. Glob. Chang. Biol. 2011, 17, 3392–3404. [Google Scholar] [CrossRef]
- Von Lützow, M.; Kögel-Knabner, I. Temperature sensitivity of soil organic matter decomposition—what do we know? Biol. Fertil. Soils 2009, 46, 1–15. [Google Scholar] [CrossRef]
- Klimek, B.; Jelonkiewicz, Ł.; Niklińska, M. Drivers of temperature sensitivity of decomposition of soil organic matter along a mountain altitudinal gradient in the Western Carpathians. Ecol. Res. 2016, 31, 609–615. [Google Scholar] [CrossRef]
- A’Bear, A.D.; Jones, T.H.; Kandeler, E.; Boddy, L. Interactive effects of temperature and soil moisture on fungal-mediated wood decomposition and extracellular enzyme activity. Soil Biol. Biochem. 2014, 70, 151–158. [Google Scholar] [CrossRef]
- Brockett, B.F.T.; Prescott, C.E.; Grayston, S.J. Soil moisture is the major factor influencing microbial community structure and enzyme activities across seven biogeoclimatic zones in western Canada. Soil Biol. Biochem. 2012, 44, 9–20. [Google Scholar] [CrossRef]
- Santonja, M.; Fernandez, C.; Proffit, M.; Gers, C.; Gauquelin, T.; Reiter, I.M.; Cramer, W.; Baldy, V. Plant litter mixture partly mitigates the negative effects of extended drought on soil biota and litter decomposition in a Mediterranean oak forest. J. Ecol. 2017, 105, 801–815. [Google Scholar] [CrossRef]
- García-Palacios, P.; Prieto, I.; Ourcival, J.-M.; Hättenschwiler, S. Disentangling the Litter Quality and Soil Microbial Contribution to Leaf and Fine Root Litter Decomposition Responses to Reduced Rainfall. Ecosyst. 2016, 19, 490–503. [Google Scholar] [CrossRef]
- De Long, J.R.; Dorrepaal, E.; Kardol, P.; Nilsson, M.C.; Teuber, L.M.; Wardle, D.A. Understory plant functional groups and litter species identity are stronger drivers of litter decomposition than warming along a boreal forest post-fire successional gradient. Soil Biol. Biochem. 2016, 98, 159–170. [Google Scholar] [CrossRef]
- Makkonen, M.; Berg, M.P.; Handa, I.T.; Hättenschwiler, S.; van Ruijven, J.; van Bodegom, P.M.; Aerts, R. Highly consistent effects of plant litter identity and functional traits on decomposition across a latitudinal gradient. Ecol. Lett. 2012, 15, 1033–1041. [Google Scholar] [CrossRef] [PubMed]
- Hättenschwiler, S.; Gasser, P. Soil animals alter plant litter diversity effects on decomposition. Proc. Natl. Acad. Sci. USA 2005, 102, 1519–1524. [Google Scholar] [CrossRef] [PubMed]
- Berhe, A.A.; Harden, J.W.; Torn, M.S.; Harte, J. Linking soil organic matter dynamics and erosion-induced terrestrial carbon sequestration at different landform positions. J. Geophys. Res. 2008, 113. [Google Scholar] [CrossRef]
- Egli, M.; Sartori, G.; Mirabella, A.; Favilli, F.; Giaccai, D.; Delbos, E. Effect of north and south exposure on organic matter in high Alpine soils. Geoderma 2009, 149, 124–136. [Google Scholar] [CrossRef] [Green Version]
- Bayranvand, M.; Kooch, Y.; Hosseini, S.M.; Alberti, G. Humus forms in relation to altitude and forest type in the Northern mountainous regions of Iran. For. Ecol. Manag. 2017, 385, 78–86. [Google Scholar] [CrossRef]
- Bradford, M.A.; Berg, B.; Maynard, D.S.; Wieder, W.R.; Wood, S.A. Understanding the dominant controls on litter decomposition. J. Ecol. 2016, 104, 229–238. [Google Scholar] [CrossRef]
- Prescott, C.E.; Maynard, D.G.; Laiho, R. Humus in northern forests: Friend or foe? For. Ecol. Manag. 2000, 133, 23–36. [Google Scholar] [CrossRef]
- Austin, A.T.; Vivanco, L.; González-Arzac, A.; Pérez, L.I. There’s no place like home? An exploration of the mechanisms behind plant litter-decomposer affinity in terrestrial ecosystems. New Phytol. 2014, 204, 307–314. [Google Scholar] [CrossRef] [PubMed]
- Milcu, A.; Manning, P. All size classes of soil fauna and litter quality control the acceleration of litter decay in its home environment. Oikos 2011, 120, 1366–1370. [Google Scholar] [CrossRef]
- García-Palacios, P.; Shaw, E.A.; Wall, D.H.; Hättenschwiler, S. Temporal dynamics of biotic and abiotic drivers of litter decomposition. Ecol. Lett. 2016, 19, 554–563. [Google Scholar] [CrossRef] [PubMed]
- Setiawan, N.N.; Vanhellemont, M.; De Schrijver, A.; Schelfhout, S.; Baeten, L.; Verheyen, K. Mixing effects on litter decomposition rates in a young tree diversity experiment. Acta Oecol. 2016, 70, 79–86. [Google Scholar] [CrossRef]
- Gutiérrez-Girón, A.; Díaz-Pinés, E.; Rubio, A.; Gavilán, R.G. Both altitude and vegetation affect temperature sensitivity of soil organic matter decomposition in Mediterranean high mountain soils. Geoderma 2015, 237–238, 1–8. [Google Scholar] [CrossRef]
- Dawes, M.A.; Schleppi, P.; Hättenschwiler, S.; Rixen, C.; Hagedorn, F. Soil warming opens the nitrogen cycle at the alpine treeline. Glob. Chang. Biol. 2017, 23, 421–434. [Google Scholar] [CrossRef] [PubMed]


| Soil Property | Sites | Sampled Soil Horizons/Depths |
|---|---|---|
| Humus forms: Presence of organic layers | RN1–RN30, RS1–RS30 | OL, OF, OH horizons |
| Humus forms: Soil structure | RN1–RN30, RS1–RS30 | A horizon |
| pH value (H2O) | RN1–RN30, RS1–RS30 | A horizon |
| pH value (H2O) | N1–N3, S6–S8 | 0–15 cm, depth increments of 5 cm |
| Leucine-aminopeptidase activity | N1–N3, S6–S8 | 0–15 cm, depth increments of 5 cm |
| Acid phosphomonoesterase activity | N1–N3, S6–S8 | 0–15 cm, depth increments of 5 cm |
| Alkaline phosphomonoesterase activity | N1–N3, S6–S8 | 0–15 cm, depth increments of 5 cm |
| Total C | N1–N3, S6–S8 | 0–15 cm, depth increments of 5 cm |
| Total N | N1–N3, S6–S8 | 0–15 cm, depth increments of 5 cm |
| Bacterial abundance | N1–N3, S6–S8 | 0–15 cm, depth increments of 5 cm |
| Archaeal abundance | N1–N3, S6–S8 | 0–15 cm, depth increments of 5 cm |
| Humus form (According to [40,41]) | Humus form (According to Figure 2) | Biogenic Soil Structure in the Mineral Soil (Relative Units According to Figure 2) | Presence of Organic Layers Above Mineral Soil (Relative Units According to Figure 2) |
|---|---|---|---|
| F-Mull (MUO) | Mull | 1.0 | 0.0 |
| Mullartiger Moder (MOM) | Mullmoder | 0.5 | 0.5 |
| Typischer Moder (MOA, MOR) | Moder | 0.0 | 1.0 |
| Rohhumusartiger Moder (MRA, MRR) | Moder | 0.0 | 1.0 |
| Rohhumus (ROA, ROR) | Moder | 0.0 | 1.0 |
| Amphimull (AMU) | Amphimull | 1.0 | 1.0 |
| Graswurzelfilz-Moder (GMO) | Moder | 0.0 | 1.0 |
| Hagerhumus (HMO) | Eroded Moder | 0.0 | 0.0 |
| Site | Humus form (According to Figure 2) | Biogenic Soil Structure in the Mineral Soil (Relative Units According to Figure 2) | Presence of Organic Layers above Mineral Soil (Relative Units According to Figure 2) | pH in A Horizon H2O (1:10) |
|---|---|---|---|---|
| RN1 | Amphimull | 1.0 | 1.0 | 6.06 |
| RN2 | Mullmoder | 0.5 | 0.5 | 5.18 |
| RN3 | Moder | 0.0 | 1.0 | 4.88 |
| RN4 | Amphimull | 1.0 | 1.0 | 5.20 |
| RN5 | Amphimull, Mull | 1.0 | 0.7 | 5.14 |
| RN6 | Eroded Moder, Moder | 0.0 | 0.5 | 4.63 |
| RN7 | Moder | 0.0 | 1.0 | 4.82 |
| RN8 | Moder | 0.0 | 1.0 | 4.63 |
| RN9 | Moder | 0.0 | 1.0 | 5.00 |
| RN10 | Amphimull | 1.0 | 1.0 | 4.62 |
| RN11 | Moder, Mullmoder | 0.25 | 0.75 | 4.57 |
| RN12 | Mullmoder, Moder | 0.4 | 0.6 | 4.47 |
| RN13 | Moder | 0.0 | 1.0 | 4.42 |
| RN14 | Moder | 0.0 | 1.0 | 4.45 |
| RN15 | Moder | 0.0 | 1.0 | 4.68 |
| RN16 | Moder | 0.0 | 1.0 | 4.80 |
| RN17 | Moder | 0.0 | 1.0 | 4.20 |
| RN18 | Moder | 0.0 | 1.0 | 4.25 |
| RN19 | Moder | 0.0 | 1.0 | 4.67 |
| RN20 | Moder | 0.0 | 1.0 | 4.73 |
| RN21 | Moder | 0.0 | 1.0 | 4.17 |
| RN22 | Moder | 0.0 | 1.0 | 4.24 |
| RN23 | Moder | 0.0 | 1.0 | 4.46 |
| RN24 | Moder | 0.0 | 1.0 | 4.22 |
| RN25 | Mullmoder, Moder | 0.4 | 0.6 | 4.67 |
| RN26 | Moder | 0.0 | 1.0 | 4.74 |
| RN27 | Moder | 0.0 | 1.0 | 4.02 |
| RN28 | Moder | 0.0 | 1.0 | 4.52 |
| RN29 | Mullmoder, Moder | 0.4 | 0.6 | 4.70 |
| RN30 | Moder | 0.0 | 1.0 | 4.05 |
| RS1 | Mull | 1.0 | 0.0 | 5.70 |
| RS2 | Moder | 0.0 | 1.0 | 5.80 |
| RS3 | Amphimull | 1.0 | 1.0 | 4.43 |
| RS4 | Moder, Amphimull | 0.4 | 1.0 | 4.75 |
| RS5 | Amphimull | 1.0 | 1.0 | 5.79 |
| RS6 | Mull | 1.0 | 0.0 | 5.36 |
| RS7 | Mullmoder, Mull | 0.65 | 0.35 | 4.79 |
| RS8 | Moder, Amphimull | 0.3 | 1.0 | 4.90 |
| RS9 | Amphimull | 1.0 | 1.0 | 5.45 |
| RS10 | Mull | 1.0 | 0.0 | 5.95 |
| RS11 | Mullmoder | 0.5 | 0.5 | 5.39 |
| RS12 | Mullmoder | 0.5 | 0.5 | 4.72 |
| RS13 | Mullmoder | 0.5 | 0.5 | 5.30 |
| RS14 | Moder | 0.0 | 1.0 | 4.61 |
| RS15 | Moder, Eroded Moder | 0.0 | 0.6 | 4.76 |
| RS16 | Moder | 0.0 | 1.0 | 4.66 |
| RS17 | Moder, Mull | 0.3 | 0.7 | 4.86 |
| RS18 | Moder | 0.0 | 1.0 | 4.72 |
| RS19 | Moder | 0.0 | 1.0 | 4.49 |
| RS20 | Mull | 1.0 | 0.0 | 5.30 |
| RS21 | Moder, Mull | 0.5 | 0.5 | 4.71 |
| RS22 | Mullmoder | 0.5 | 0.5 | 5.15 |
| RS23 | Mull | 1.0 | 0.0 | 5.02 |
| RS24 | Moder | 0.0 | 1.0 | 4.96 |
| RS25 | Moder | 0.0 | 1.0 | 4.78 |
| RS26 | Moder | 0.0 | 1.0 | 5.95 |
| RS27 | Moder | 0.0 | 1.0 | 4.61 |
| RS28 | Moder | 0.0 | 1.0 | 4.55 |
| RS29 | Moder | 0.0 | 1.0 | 4.67 |
| RS30 | Moder | 0.0 | 1.0 | 4.59 |
| Site | Soil Depth (cm) | pH H2O (1:10) | Leucine-Aminopeptidase Activity (nmol MUF g−1 Dry Soil h−1) | Ratio of Alkaline/Acid phospho-Monoesterase Activity | Total C Content (%) | Soil Corg/Nt Ratio | Ratio of Bacterial/Archaeal Abundance |
|---|---|---|---|---|---|---|---|
| N1 | 0–5 | 4.8 ± 0.4 | 368.9 ± 184.9 | 0.14 ± 0.1 | 24.6 ± 2.4 | 26.9 ± 3.9 | 11.8 ± 11.9 |
| 5–10 | 4.8 ± 0.4 | 85.5 ± 48.9 | 0.08 ± 0.1 | 10.6 ± 6.2 | 20.6 ± 2.2 | 6.4 ± 3.5 | |
| 10–15 | 4.8 ± 0.3 | 31.5 ± 21.9 | 0.04 ± 0.1 | 4.4 ± 1.9 | 18.1 ± 3.7 | 1.7 ± 0.4 | |
| S6 | 0–5 | 6.0 ± 0.5 | 283.6 ± 56.6 | 0.83 ± 1.0 | 10.2 ± 3.7 | 19.9 ± 3.3 | 42.6 ± 43.3 |
| 5–10 | 5.7 ± 0.6 | 94.5 ± 27.9 | 0.52 ± 0.6 | 4.0 ± 0.5 | 17.4 ± 2.8 | 20.9 ± 7.4 | |
| 10–15 | 5.6 ± 0.5 | 57.1 ± 19.5 | 0.40 ± 0.4 | 2.6 ± 0.8 | 15.4 ± 1.9 | 10.0 ± 7.8 | |
| N2 | 0–5 | 4.7 ± 0.8 | 393.7 ± 300.7 | 0.17 ± 0.2 | 42.8 ± 9.8 | 23.8 ± 4.2 | 232.4 ± 332.8 |
| 5–10 | 4.3 ± 0.6 | 115.5 ± 45.4 | 0.04 ± 0.1 | 33.1 ± 13.5 | 24.8 ± 4.0 | 55.7 ± 54.6 | |
| 10–15 | 4.5 ± 0.6 | 38.9 ± 8.8 | 0.02 ± 0.02 | 11.3 ± 8.4 | 20.0 ± 1.8 | 14.5 ± 22.2 | |
| S7 | 0–5 | 5.7 ± 0.2 | 866.8 ± 80.9 | 0.56 ± 0.2 | 23.1 ± 1.0 | 18.1 ± 2.0 | 650.2 ± 446.5 |
| 5–10 | 5.8 ± 0.2 | 207.5 ± 77.9 | 0.62 ± 0.2 | 9.0 ± 2.3 | 15.9 ± 1.5 | 250.4 ± 356.0 | |
| 10–15 | 5.8 ± 0.3 | 131.0 ± 75.5 | 0.67 ± 0.4 | 5.6 ± 1.6 | 14.9 ± 2.0 | 17.2 ± 14.9 | |
| N3 | 0–5 | 4.6 ± 0.3 | 375.3 ± 115.1 | 0.07 ± 0.04 | 46.3 ±2.3 | 22.5 ± 2.2 | 340.6 ± 548.3 |
| 5–10 | 4.2 ± 0.2 | 123.8 ± 25.8 | 0.02 ± 0.01 | 38.7 ± 12.9 | 22.0 ± 2.3 | 24.7 ± 6.1 | |
| 10–15 | 4.2 ± 0.3 | 77.4 ± 8.7 | 0.02 ± 0.01 | 18.8 ± 8.1 | 21.1 ± 1.8 | 17.2 ± 15.2 | |
| S8 | 0–5 | 5.4 ± 0.4 | 289.5 ± 144.1 | 0.16 ± 0.2 | 24.0 ± 11.4 | 21.0 ± 0.8 | 75.7 ± 94.4 |
| 5–10 | 5.4 ± 0.2 | 70.8 ± 19.9 | 0.07 ± 0.02 | 10.1 ± 5.9 | 16.7 ± 2.0 | 19.1 ± 3.6 | |
| 10–15 | 5.4 ± 0.3 | 90.9 ± 6.5 | 0.07 ± 0.1 | 6.1 ± 0.5 | 14.2 ± 1.7 | 6.8 ± 10.9 |
| Parameter | Mean Values of the Squared Residuals | Explained Variance (%) |
|---|---|---|
| Presence of organic layers above the mineral soil | 0.079 | 18.05 |
| Biogenic soil structure in the mineral soil | 0.118 | 24.18 |
| pH value (H2O) | 0.140 | 37.04 |
| Parameter | n | Linear Regression Equation | Residual Standard Error | R2 | p Value |
|---|---|---|---|---|---|
| Leucine-aminopeptidase activity | 89 | y = 98.87x − 348.57 | 171.9 | 0.1569 | <0.001 |
| Ratio of alkaline/acid phospho-monoesterase activity | 88 | y = 0.45988x − 2.05861 | 0.2882 | 0.5889 | <0.001 |
| Soil C/N ratio | 87 | y = −3.4416x + 37.2690 | 3.51 | 0.3425 | <0.001 |
| Ratio of bacterial/archaeal abundance | 18 | y = 61.08x − 258.55 | 149.5 | 0.0914 | 0.223 |
| Parameter | Linear Regression Equation | Residual Standard Error | Adj. R2 | p Value |
|---|---|---|---|---|
| pH value | y = −0.53x1 + 0.68x2 + 5.05 | 0.2156 | 0.4332 | <0.001 |
| Leucine-aminopeptidase activity | y = −60.80x1 + 67.97x2 + 159.70 | 30.54 | 0.3009 | <0.001 |
| Ratio of alkaline/acid phospho-monoesterase activity | y = −0.27x1 + 0.29x2 + 0.31 | 0.1259 | 0.3084 | <0.001 |
| Soil C/N ratio | y = 2.12x1 – 2.37x2 + 19.58 | 1.063 | 0.3009 | <0.001 |
© 2018 by the authors. Licensee MDPI, Basel, Switzerland. This article is an open access article distributed under the terms and conditions of the Creative Commons Attribution (CC BY) license (http://creativecommons.org/licenses/by/4.0/).
Share and Cite
Hellwig, N.; Gómez-Brandón, M.; Ascher-Jenull, J.; Bardelli, T.; Anschlag, K.; Fornasier, F.; Pietramellara, G.; Insam, H.; Broll, G. Humus Forms and Soil Microbiological Parameters in a Mountain Forest: Upscaling to the Slope Scale. Soil Syst. 2018, 2, 12. https://doi.org/10.3390/soilsystems2010012
Hellwig N, Gómez-Brandón M, Ascher-Jenull J, Bardelli T, Anschlag K, Fornasier F, Pietramellara G, Insam H, Broll G. Humus Forms and Soil Microbiological Parameters in a Mountain Forest: Upscaling to the Slope Scale. Soil Systems. 2018; 2(1):12. https://doi.org/10.3390/soilsystems2010012
Chicago/Turabian StyleHellwig, Niels, María Gómez-Brandón, Judith Ascher-Jenull, Tommaso Bardelli, Kerstin Anschlag, Flavio Fornasier, Giacomo Pietramellara, Heribert Insam, and Gabriele Broll. 2018. "Humus Forms and Soil Microbiological Parameters in a Mountain Forest: Upscaling to the Slope Scale" Soil Systems 2, no. 1: 12. https://doi.org/10.3390/soilsystems2010012