Article

Investigation of the Rearrangement of Reactive–Inert Particulate Structures in a Single Channel of a Wall-Flow Filter

by
Julia R. D. Thieringer
1,2,*,
Nicolas Hafen
1,2,3,
Jörg Meyer
1,2,
Mathias J. Krause
1,3,4 and
Achim Dittler
1,2
1
Karlsruhe Institute of Technology, Institute of Mechanical Process Engineering and Mechanics, Straße am Forum 8, 76131 Karlsruhe, Germany
2
Gas Particle Systems, Straße am Forum 8, 76131 Karlsruhe, Germany
3
Lattice Boltzmann Research Group, 76131 Karlsruhe, Germany
4
Karlsruhe Institute of Technology, Institute for Applied and Numerical Mathematics, Englerstr. 2, 76131 Karlsruhe, Germany
*
Author to whom correspondence should be addressed.
Separations 2022, 9(8), 195; https://doi.org/10.3390/separations9080195
Submission received: 21 June 2022 / Revised: 19 July 2022 / Accepted: 21 July 2022 / Published: 27 July 2022

Abstract

:
Wall-flow filters are a standard component in exhaust gas aftertreatment and have become indispensable in vehicles. Ash and soot particles generated during engine combustion are deposited in diesel or gasoline particulate filters. During regeneration, the soot particles are oxidized. The remaining ash particles can form different deposition patterns: a homogenous layer or plug-end filling. It has not yet been clarified whether the plug-end filling is first formed by rearrangements of agglomerates before and during the regeneration of the reactive particles. In this study, experiments are carried out with a single channel of a wall-flow filter. For the investigations, a layer of inert and reactive particles is formed. The rearrangement of agglomerates is achieved by flowing through the model filter channel and observed with a high-speed camera. The particulate structures detach at the channel inlet, are transported along the channel and deposited at the plug. The velocity of the detached agglomerates depends on their size, shape, track and the gas velocity in the channel. If the agglomerate is near the walls of the model filter channel, the gas velocity deviates from the gas velocity in the core flow. The higher the gas velocity, the higher the agglomerate velocity achieved and the larger the detached agglomerates.

1. Introduction

Wall-flow filters are, nowadays, a standard component in the exhaust gas aftertreatment of internal combustion engines, as they remove the emissions produced in the combustion process [1]. Wall-flow filters consist of parallel-arranged and alternately closed channels [2,3]. During the engine combustion, inert particles (ash) and reactive particles (soot) are formed. The aerosol flows into the inlet channel parallel to the filter wall. The particles are deposited on and in the porous filter wall [4] as the gas passes through it and exits the particulate filter through the outlet channel [2,5]. The resulting particle layer influences the separation efficiency and the pressure drop of the filter [3,6,7]. For this reason, the particulate filter is regenerated regularly. During this process, the soot particles are oxidized so that only the inert ash remains in the particulate filter [8,9]. Two limiting cases of deposition patterns are known for the ash, which are shown in Figure 1 [5,10,11].
One is the homogenous layer (Figure 1a) and the other is the plug-end filling or channel filling (Figure 1b) [11]. During the layer formation, the particles accumulate as a homogeneous layer on the complete filter wall. This increases the filtration efficiency of the filter [12].
In the case of the plug-end filling, the particles deposit at the plug of the inlet channel and fill the channel from there in the direction of the inlet. This filling reduces the filtration area and increases the flow velocity in the filter [13]. The plug-end filling can occur when agglomerates detach from the deposition pattern of the homogenous layer and are transported to the end of the channel. Sappok et al. (2013) carried out initial investigations on this topic [8]. They observed a small section of an inlet channel of a diesel particulate filter (DPF). During regeneration, the particle layer breaks up due to the oxidation of the soot particles. Even during this process, ash–soot agglomerates have detached from the front half of the inlet channel and have been transported into the view of the camera. Due to the gas flow through the channel, the agglomerates were subsequently detached again and transported out of the visible area of the camera. The breakup of the soot layer, where individual soot islands are formed over time, also enhances the effect of detachment and transport. The soot islands were detached during the regeneration process and transported out of the visible area of the camera [8]. These investigations could not determine where the agglomerates were detached and where they were transported to.
Whether particles and agglomerates are detached depends on the adhesive forces between the individual particles as well as between the particles and the surface. A differentiation can be made between two states of detachment:
  • The monolayer resuspension—in which the individual particles are resuspended from a surface covered with a small amount of deposits (particles). In that case, the interaction between the particles is negligible.
  • The multilayer resuspension—in which the particles form a complex, multilayer structure that the interactions between the particles significantly affect the resuspension of the particles and agglomerates [14,15].
In this work, the multilayer structure of the detachment is considered. A particle layer is formed in which the particles have contact with one another. This allows agglomerates of reactive and inert particles to be detached and transported. In addition, the beginning of detachment can be divided into two cases. One is the direct detachment from the surface and the other is the previous rolling or sliding of the agglomerates before they are detached [16]. A schematic drawing of the processes during the resuspension of particles is shown in Figure 2.
The forces acting on a particle are the lift force F L i f t , the drag force F D r a g , the gravitational force F G and the adhesion force F A d h . The adhesion force involves the Van der Waals force, the capillary force, the force of chemical bonding as well as the electrostatic force and the thermophoretic force [5,17]. In this study, mainly the Van der Waals forces are of relevance. For the detachment of a particle structure by flow-induced transport, the shear forces of the gas flow have to exceed the adhesive forces between the particles and the filter medium [15].
The attractive interaction forces between ash particles, soot particles as well as the two particle types themselves and a DPF surface were investigated by Kamp et al. (2014) [18]. The interparticle attractive forces between the soot particles are an order of magnitude larger than between the DPF surface and the soot particles. Furthermore, the interaction between two ash particles and ash and soot particles is higher than the attractive force between particles and the DPF surface. During the regeneration of the soot particles, on the one hand, the particle layer breaks up, and on the other hand, a shrinking of the soot agglomerates is observed [8]. This affects the adhesive forces between the particles and the filter wall.
In this investigation, the fundamental processes occurring during the rearrangement (detachment, transport and deposition) of particle structures in a single channel of a wall-flow filter will be observed. The direct detachment of agglomerates, without any visible rolling or sliding, will be considered. For this purpose, a defined particle layer is formed from reactive and inert particles. The rearrangement is achieved by flowing particle-free air through a model filter channel (see Section 2.2). The detachment, transport and deposition of the detached structures at the end of the channel are observed and analyzed without the regeneration of the reactive particles.

2. Materials and Methods

2.1. Particle Systems

At the beginning of the experiments of the detachment and the transport of agglomerates, a particle layer has to be formed. In these experiments, soot particles (Section 2.1.1) are used as reactive particles, on the one hand, and glass spheres (Section 2.1.2) as inert particles, on the other.

2.1.1. Soot Particles

The soot is produced using a commercial soot generator miniCAST 6204C (Jing Ltd., Zollikofen, Switzerland). The soot particles are produced by quenching a propane gas flame, resulting in an incomplete combustion.
The number-based particle-size distribution of the soot (a) and an SEM image (b) are shown in Figure 3. The mass flow rate of the soot is 40 mg·h 1 and the volume flow rate is 3.05 L·min 1 . The operating parameters of the soot generator used are listed in Table 1. The particle size distribution was measured at the outlet of the soot generator with a dilution of 200 L·min 1 of particle-free air using a scanning mobility particle sizing system (SMPS). The SMPS consists of an X-ray source, a Differential Mobility Analyzer (DMA 3082, TSI Incorporated, Shoreview, MN, USA) and a Condensation Particle Counter (CPC 3756, TSI Incorporated, Shoreview, MN, USA).
The number-based particle-size distribution (Figure 3a) shows a narrow distribution of the soot. The modal value is 90 nm. Figure 3b shows an SEM image of the deposited soot particles on a filter medium. It can be seen that the soot particles are present as agglomerates. Thus, the model value from the SMPS measurement does not refer to the primary particle size of the soot particles but to the agglomerates formed after generation.

2.1.2. Glass Spheres

Glass spheres “5000 CP00 Spheriglass” (Potters Industries LLC, Phoenixville Pike, West Chester, PA, USA) were used as an ash replacement system in order to reduce the loading time of the filter channel and to obtain a completely inert particle system (no reactive components). The glass spheres are spherical, similar to ash particles generated during engine combustion. They are present in a wide particle size range and their measured modal value (see Figure 4a) is <1 μ m. This is assimilable with the primary particle size range of ash particles [6] and much larger than the primary particles of the soot agglomerates.
Dispersion of the glass spheres is realized with a dust disperser SAG 410U (Topas GmbH, Dresden, Germany). The particle-size distribution is measured with an Optical Particle Counter (OPC, Promo 2000 from PALAS GmbH, Karlsruhe, Germany) and the above-mentioned SMPS to measure the size range from 0.03 to 10 μ m (size range SMPS: 0.03–0.8 μ m; size range OPC: 0.8–10 μ m). The corresponding number-based particle-size distribution is shown in Figure 4.
The number-based particle-size distribution of the glass spheres shows a wide number particle-size distribution. It is noticeable that many glass spheres are smaller than 4 μ m, which is different from the manufacturer’s specifications (size range: 4–20 μ m) here. The large proportion of fine particles can be attributed to contaminations of the glass spheres used. These contaminations as well as non-spherical particles can be seen in the SEM image in Figure 4b. The fine particles could influence the adhesive forces in the particle layer which may affect the detachment of agglomerates.
The operating conditions of the utilized dust disperser used are listed in Table 2. The mass flow rate of the dust disperser at the operating conditions is 2.6 g·h 1 .

2.2. Model Filter Channel

A model filter channel of a single channel of a wall-flow filter with one inlet and one outlet channel was used for the experiments. The schematic structure of the model filter channel is shown in cross-section in Figure 5.
The inlet and outlet channels are each 3 mm wide and 3 mm high. A sinter metal filter is mounted between the inlet and outlet channels. The plug, as well as the side walls of the channel, are made of stainless steel. The aerosol flows parallel to the filter medium into the inlet channel. The particles are deposited on the sinter metal filter and the gas passes through the filter medium to exit the model particulate filter through the outlet channel. Due to this structure and the flow through one channel wall, the particles are mainly deposited there. In order to observe the detachment and transport of agglomerates, the inlet channel is closed at the top with a transparent quartz glass plate. This allows the processes in the model filter channel to be observed with a high-speed camera. The size of the visible area (camera section) is 120 × 3 mm. The model filter channel is set up horizontally for all experiments. This causes the gravitational force to act in the negative Z-direction.

2.3. Experimental Setup and Procedure

Two experimental setups were used to run the experiments: first, for the filtration of the reactive and inert particles (layer formation), and afterward, for the observation of the detachment and transport. All experiments were performed at ambient temperature.

2.3.1. Layer Formation/Filtration

The experimental setup of the filtration of the inert and reactive particles as well as a schematic drawing of the generated particle layer are shown in Figure 6.
First, the glass spheres are loaded into the model filter channel and deposited on the sinter metal filter. The filter loading scheme is shown in Figure 6b. The glass spheres are dispersed with the dust disperser. For a reduction in the mass flow rate to 2.6 g·h 1 , a part of the aerosol flow is removed in front of the model filter channel. The deposition in the filter channel takes place for a defined time at a constant volume flow of 4 L·min 1 , which corresponds to a deposition velocity of 7.4 m·s 1 . After the glass spheres have been deposited, the soot particles are deposited at a constant volume flow rate of 3.05 L·min 1 , which corresponds to a velocity of 5.6 m·s 1 . At these two velocities, the deposition pattern of the homogenous layer is formed. The total mass of glass spheres and soot particles on the filter medium in the model filter channel after the filtration and before the rearrangement experiments is 260 mg. The process parameters of the layer formation are listed in Table 3.

2.3.2. Detachment and Transport

In the second part of the experiment, the model filter channel is flowed through with particle-free dry air to observe the detachment and transport of agglomerates, without the regeneration of the reactive particles. The schematic experimental setup is shown in Figure 7.
Particle-free air at ambient temperature was used to flow through the particle-loaded inlet channel (see Section 2.3.1 for filtration procedure) in order to achieve the detachment of agglomerates. An individual experiment was carried out for each value of the gas velocity. Therefore, each time, a new filter was loaded with the same mass in the model filter channel and was afterward challenged with a different target velocity. The gas velocity was controlled by a mass flow controller (MFC). During adjustment of the velocity, it increases approximately linear from zero to the setpoint. This procedure requires between 1 and 3 s depending on the gas velocity set (target velocity). Subsequently, the detachment and transport is observed at the defined target velocity until no more rearrangements occur. Figure 8 shows the acceleration phase of the gas velocity until the target velocity is reached. The detachments of particulate structures in the gas acceleration phase (before the target velocity is reached) were not considered for the results in Section 3. Thus, only after the target gas velocity was reached, the detached particulate structures were evaluated.
The flow velocities given in the chapter of the results refer to the gas velocity at the channel inlet. However, it should be noted that the fluid velocity decreases over the channel length. For the experiments of the detachment and transport, the gas velocity at the inlet channel was varied between 25 and 45 m·s 1 . The detachment as well as the transport of agglomerates in the model filter channel was recorded with a high-speed camera (CP90-25P-M72, Optronis GmbH, Kehl, Germany) with a frame rate of 1000 fps. The camera settings are listed in Table 4.
The selected camera angle ensures the filming of the entire channel while the camera parameters are set for the highest possible frame rate resulting in an adequate image resolution.

3. Results and Discussion

3.1. Details on Qualitative and Quantitative Analysis

The results provide a qualitative overview of the detachment and transport processes in a model filter channel of a wall-flow filter when particle-free compressed air flows through it at ambient temperature. It is not possible to determine parameters such as agglomerate density or the composition of the agglomerates (number of reactive/inert particles). Collisions of the detached agglomerates with the channel wall can be evaluated from the camera images. No definitive statement can be made as to whether collisions with the filter medium and the associated detachment of individual particles have taken place. For the evaluation of the detached agglomerates, the initial agglomerate size (time t = 0 s) was given with the width and length of the longest axes in each case. Due to just one camera perspective resulting in a 2D image, a more precise analysis is not possible. This method can be used to verify if agglomerates detach and whether they are transported to the end of the channel. This serves as a first step to characterize processes in particulate filters and to analyze a fundamental observation of rearrangement processes.

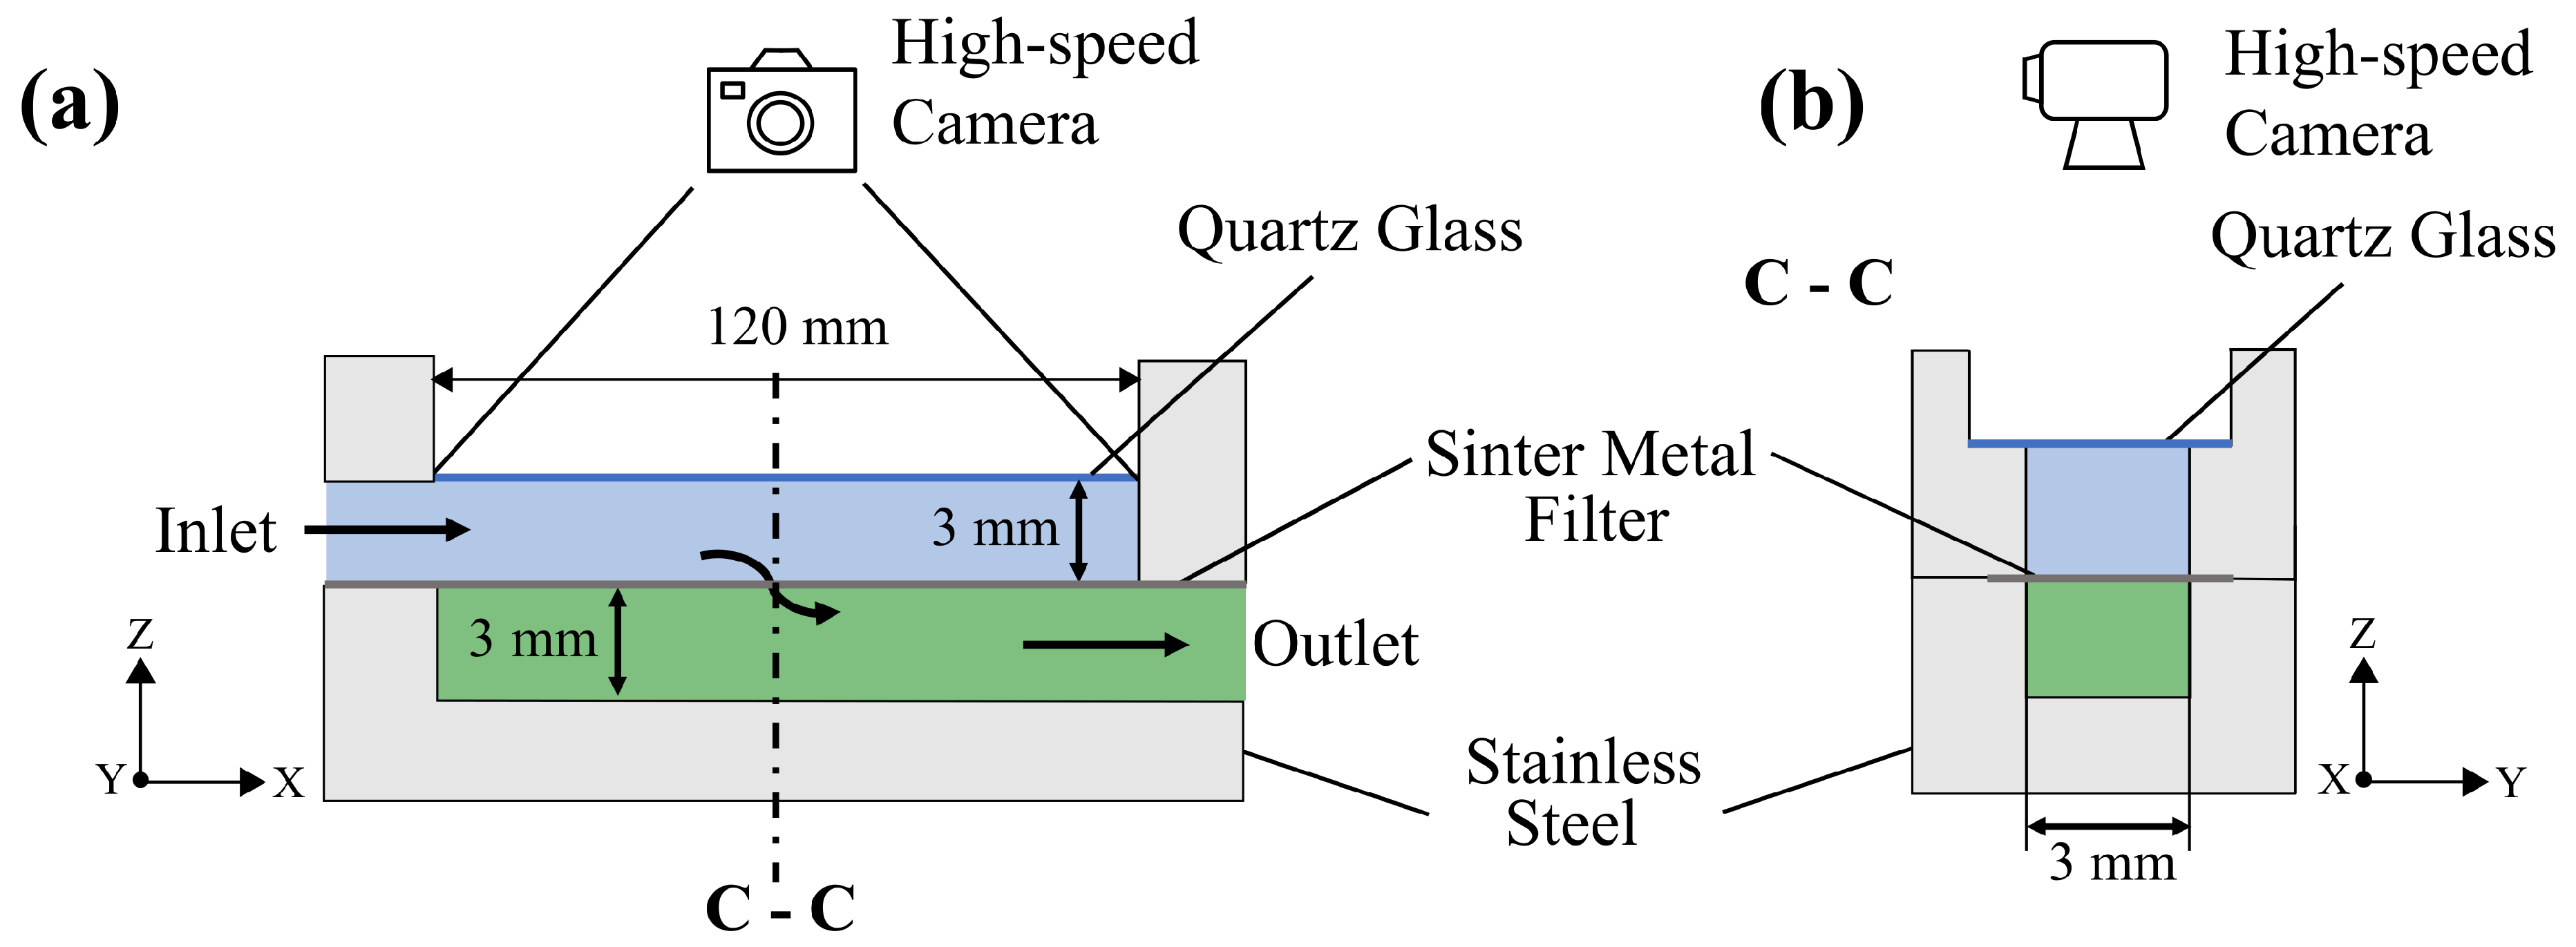
3.2. Particle Detachment—Agglomerate Tracking in the Model Filter Channel

With the model filter channel presented in Section 2.2 and the experimental setup from Section 2.3.2, it is possible to observe the detachment and transport of particle structures with high time and spatial resolution. A high-speed camera is used to methodically observe the entire length of the channel. This allows to trace the trajectory of the agglomerates (X- and Y-direction) and to determine the respective velocities subsequently. 
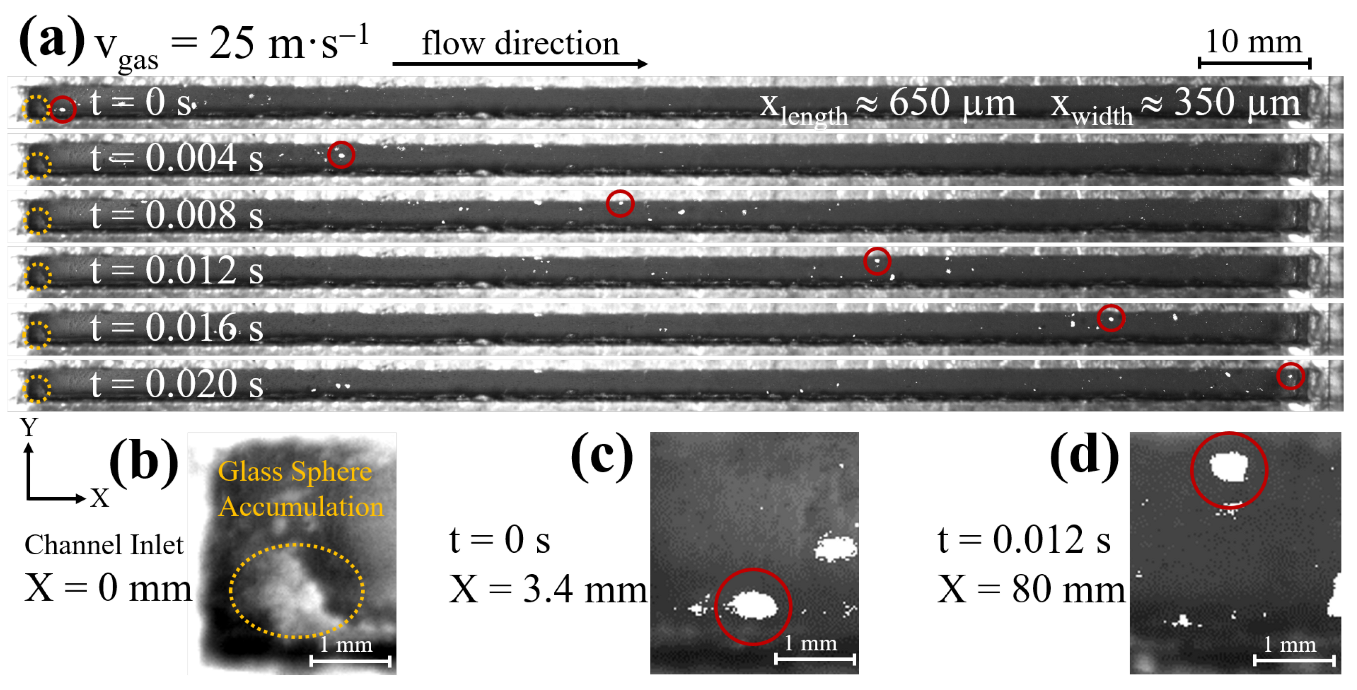
Figure 9 shows an image sequence of the transport of a reactive–inert particle structure at a gas velocity of 25 m·s 1 at the channel inlet. The time difference between the images is 0.004 s. The indicated size in Figure 9a corresponds to the largest axis of the length and width of the agglomerate after detachment.
The time period from the agglomerate’s detachment to its impact at the end of the channel, in this example, is 0.02 s. This shows that the transport takes place in a fraction of a second at a gas velocity of 25 m·s 1 . In the literature, velocities between 20 and 80 m·s 1 are defined as common values for the gas flow velocities through a wall-flow filter [19]. The experiments shown rely on these values specified in the literature.
According to current experience, the observation of a rearrangement process should be carried out with a minimum frame rate of 500 fps. With a higher frame rate, the accuracy increases and also the particle tracking becomes more conclusive. It is thus recommended to work with a frame rate of about 1000 fps to obtain accurate results, but also not to produce an overabundance of data.
The agglomerate shown in Figure 9 detaches from a glass sphere accumulation at the entrance of the channel (Figure 9b). No particle structures are detached from the closed or homogeneous particle layer. In the case of a closed particle layer, the adhesive forces between the particles are too strong that they cannot be overcome by the shear forces of the flow to lift the particles. In this investigation, the soot layer deposited on the glass sphere layer prevents particles from detaching [18]. In comparison, significantly lower shear forces are required for the inhomogeneous particle layer to detach individual particles or agglomerates. In this case, the shear force exceeds the adhesion force, and the particle structure is lifted without any rolling or sliding. According to the studies of Kamp et al. [18], the adhesive forces (Van der Waals and electrostatic interactions) between particles are stronger than between the particles and a filter medium. This increases the probability of particle structures detaching from the filter surface.
While the agglomerate is transported, it rotates. The rotation affects the translational velocity and the track of the agglomerate. Depending on how the agglomerate is shaped and how it is positioned in the gas flow, it can be accelerated or decelerated. The irregular shape of the detached particle structure is illustrated in Figure 9c,d. As already described above, due to one camera perspective, two-dimensional images will be evaluated.
The corresponding velocity of the detached agglomerate and its track is shown in Figure 10. In this first investigation, the gas velocity follows the assumption that it decreases linearly over the channel length (see Figure 10, black dashed line).
The agglomerate velocity (norm of X- and Y-direction) increases after the detachment at the beginning of the channel and reaches the maximum velocity of 6.7 m·s 1 after 30 mm of the channel length. This corresponds to 36% of the gas velocity, if a linear decrease is assumed and the gas velocity in the core flow would still be 18.8 m·s 1 at this point of the channel (main flow direction X). Afterward, the agglomerate velocity decreases steadily. After 95 mm of the channel length, the agglomerate velocity is identical to the assumed gas velocity of 5.4 m·s 1 . From this length, the agglomerate velocity remains in its higher velocity than the gas velocity until it is abruptly stopped at the end of the channel and is deposited there.
The track of the agglomerate shows that it is detached in the lower half of the channel (0–1.5 mm). This is due to the accumulation of glass spheres in this region of the filter channel (see Figure 9a,b). After the detachment, the agglomerate is transported toward the channel’s midline and exceeds it. It remains in the area of the channel width of 2.0–2.5 mm until it is deposited at the plug. Due to the irregular shape of the agglomerate as well as its rotation (see Figure 9), the agglomerate can change its flight path during its transport.
The steady decrease in the agglomerate velocity can be explained with the position of the agglomerate in the channel or to a deviation in the real gas velocity from the theoretically determined gas velocity. If the agglomerate is transported close to the side walls of the channel, the filter medium or the quartz glass plate, the velocity may differ significantly from the velocity in the center of the channel (core flow).
As already mentioned, the possible proximity of the agglomerate to the filter medium or the quartz glass plate cannot be evaluated with the experimental results.

3.3. Comparison of the Experimental Results with the Simulation of a Two-Channel Setup

In addition to the experimental investigations in the model filter channel, simulations of the gas flow through the channel were carried out using the lattice Boltzmann method in a model of a wall-flow filter. The fundamentals of the simulation with the lattice Boltzmann method can be read in the publication by Hafen et al. [20]. Further publications will follow.
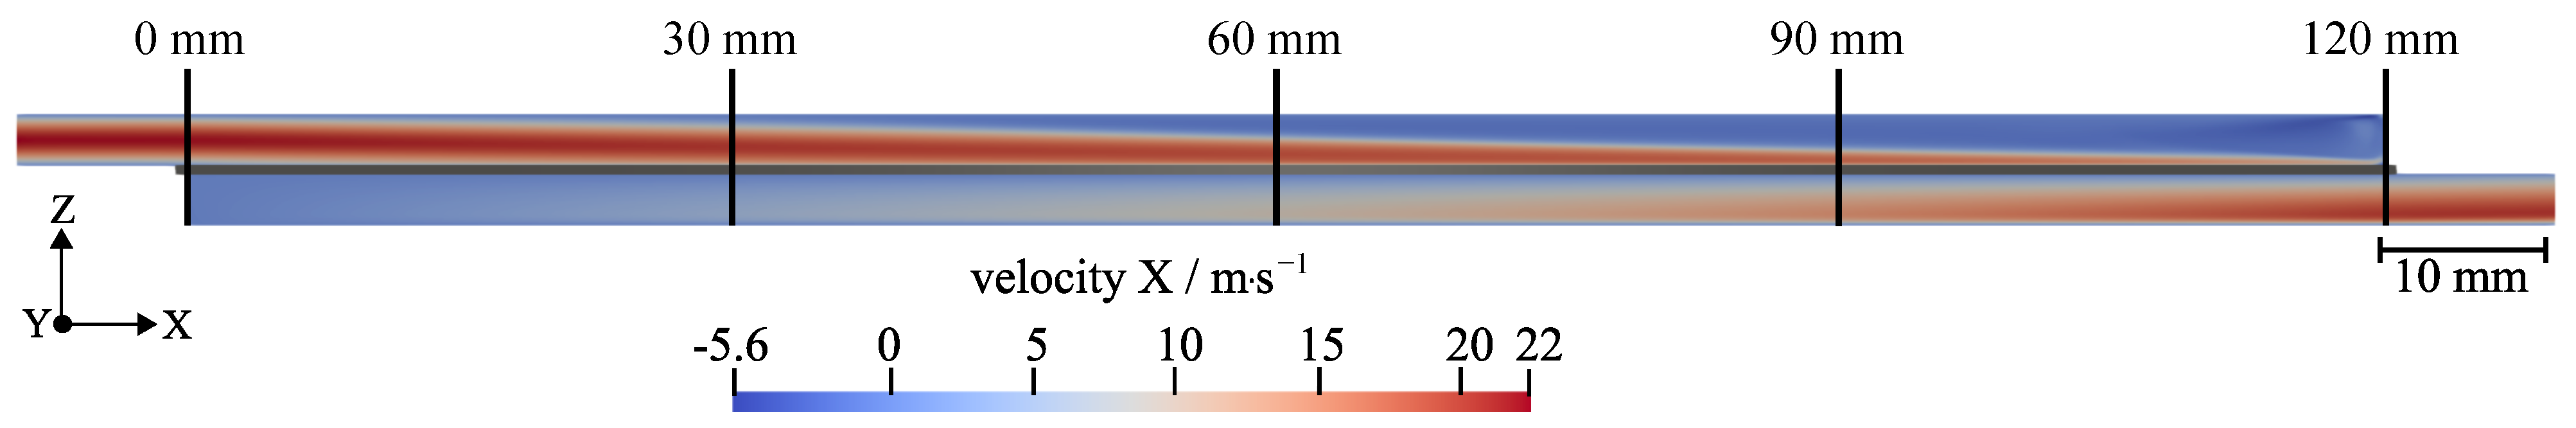
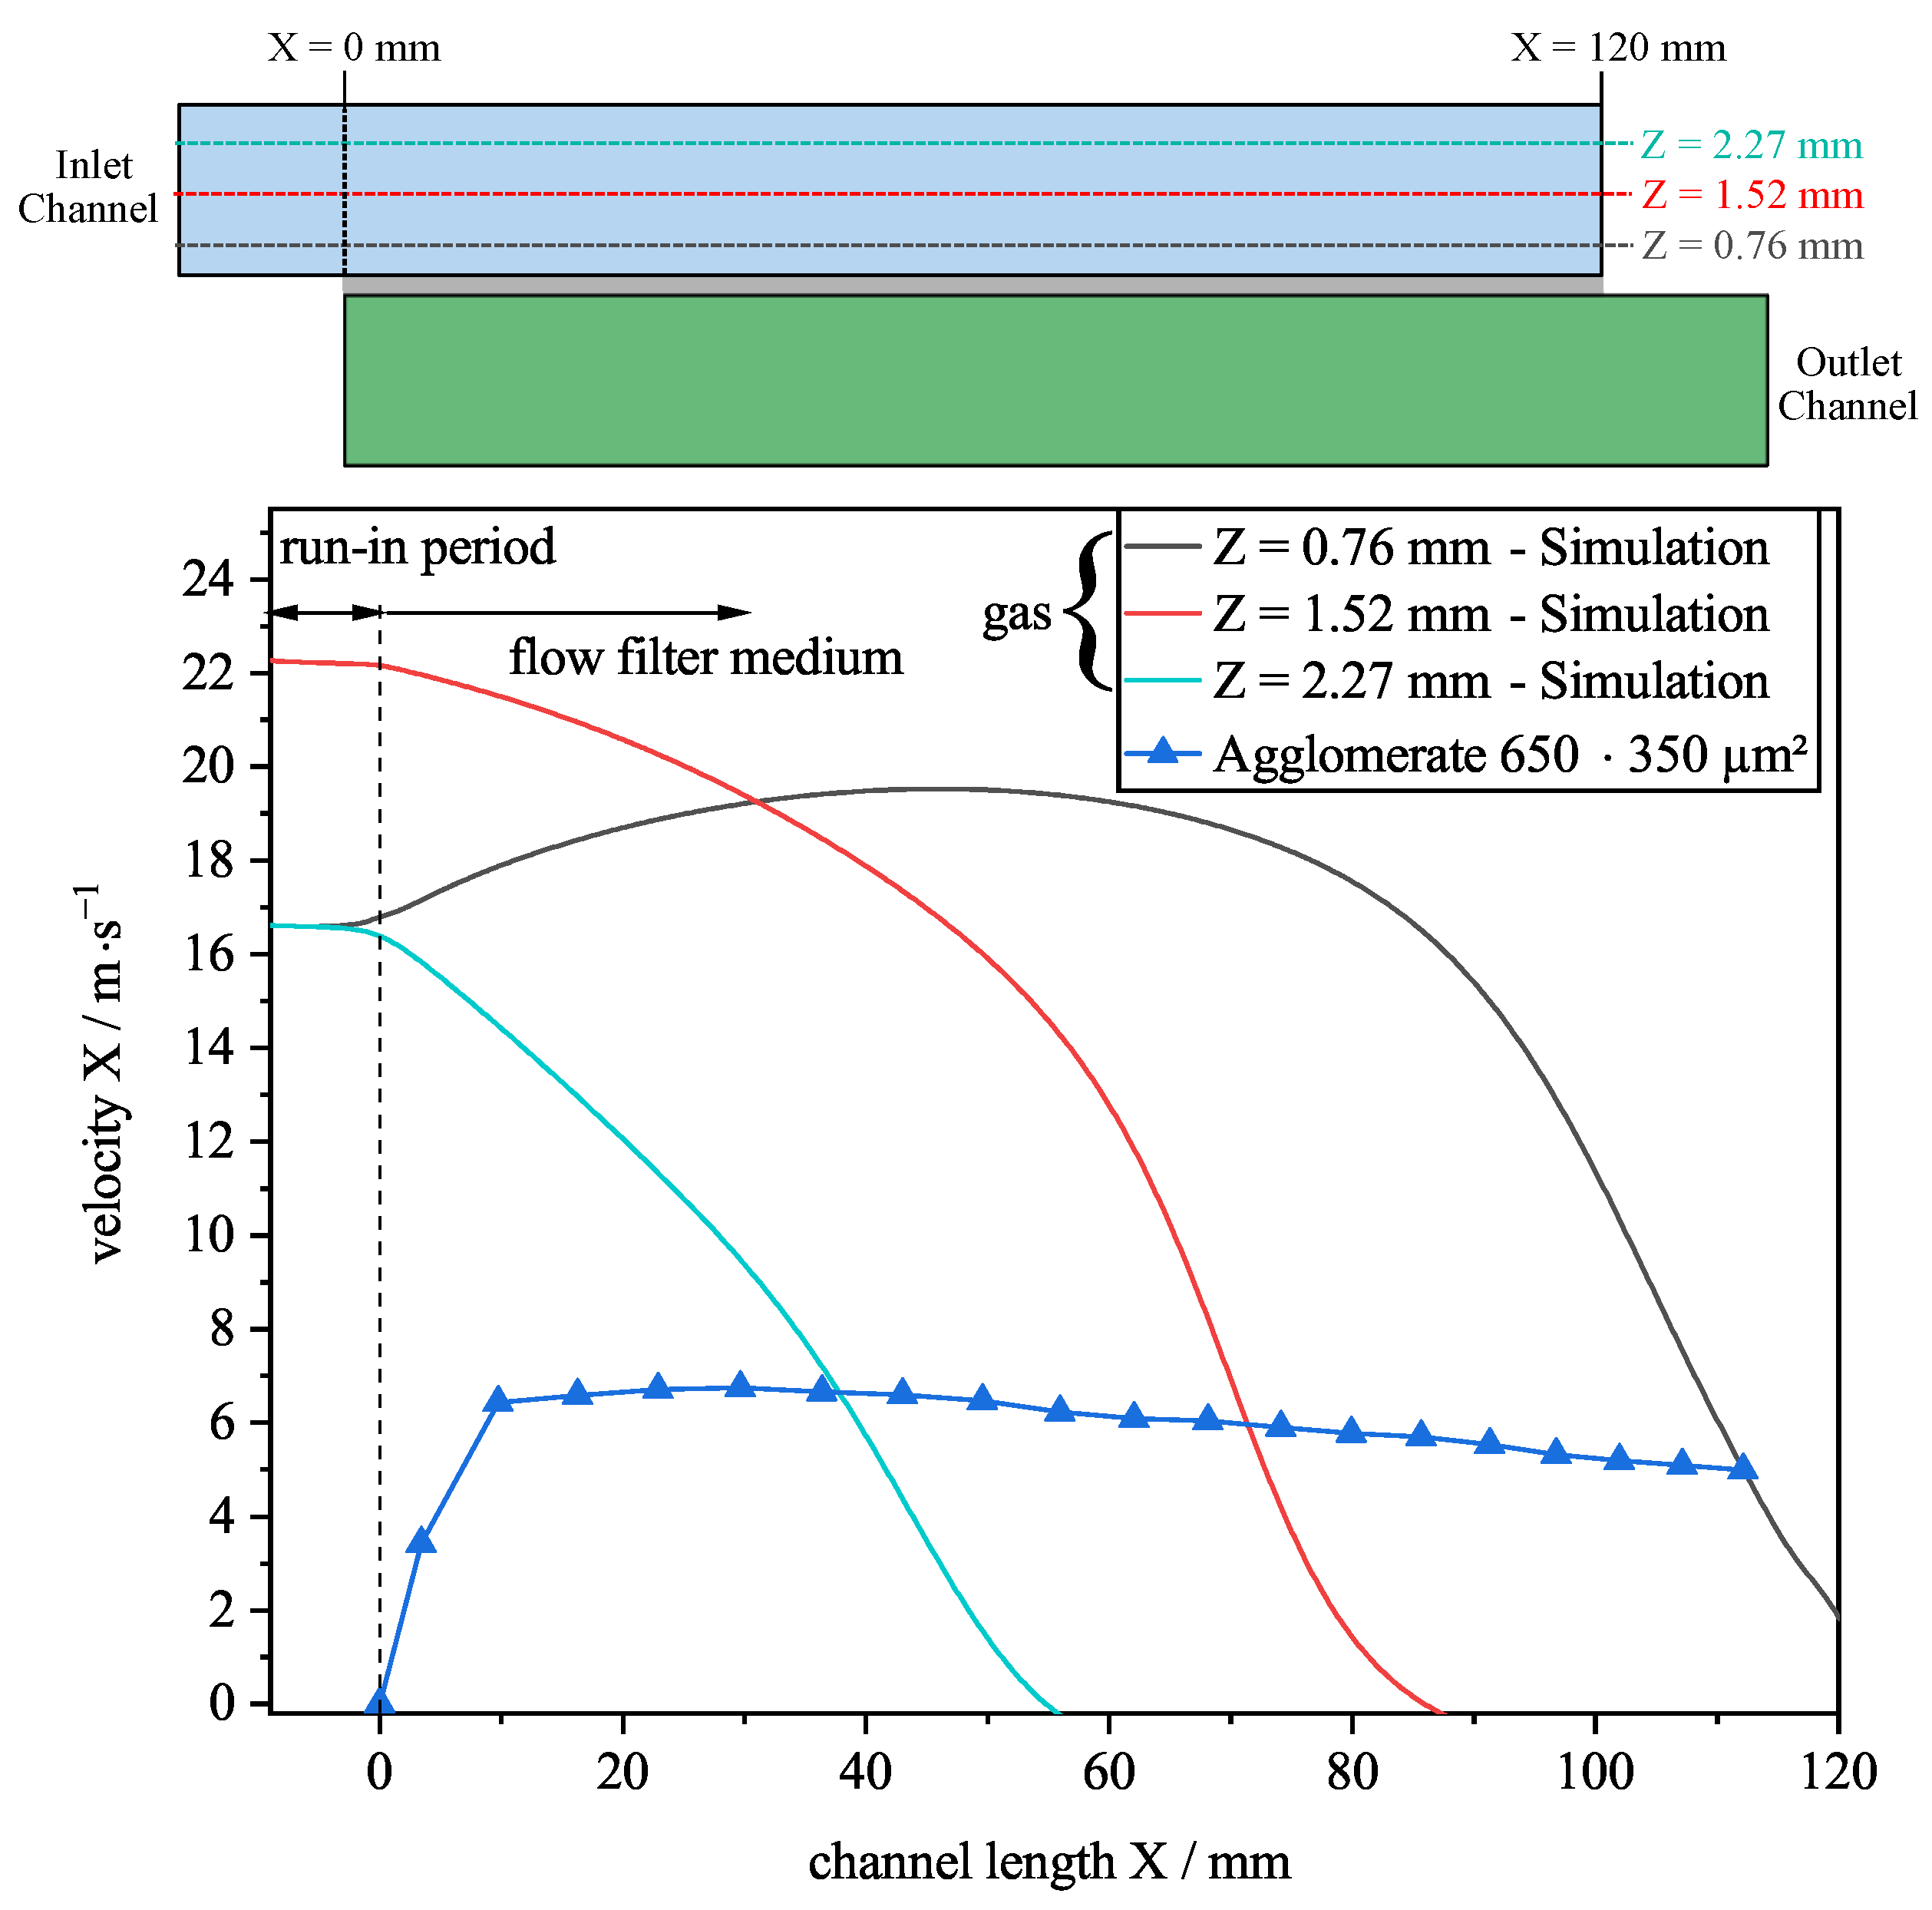
Figure 11 shows the cross-section of the inlet and outlet channel with the corresponding gas velocity in the X-direction from the simulation. The permeability is assumed with 4.3 × 10 12 m 2 , which was also obtained by aligning the simulation data with the experimental data. The average velocity is 10 m·s 1 , which corresponds to a lower velocity than in the experiments performed. For this reason, the following comparisons are to be considered qualitative. To ensure numerical stability, a resolution of N = 90 (cells/channel diameter) was selected.
The simulated gas velocity in the main flow direction X shows that it significantly decreases with the channel length. The assumption of the inflow is based on a Poiseuille profile, as a frictional flow is already present due to the inflow into the channel. Therefore, a developed flow profile is supposed. It can be seen that the height of the agglomerate is a significant factor in the possible velocity that can be achieved.
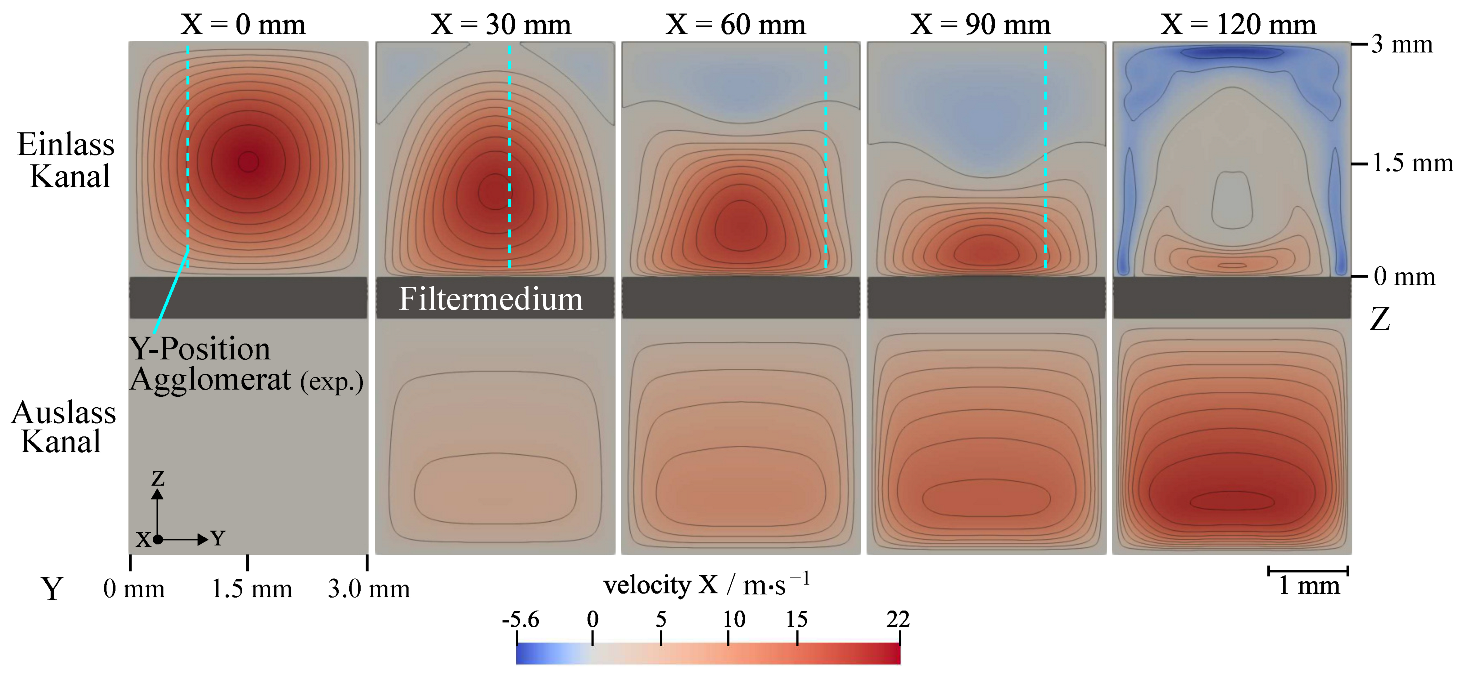
Figure 12 shows the height (Z) as well as the width (Y) of the gas velocity achieved in the main flow direction X at different channel positions X. The evaluated positions of the inlet and outlet channel are marked in Figure 11.
The core stream flows along the channel length (X-direction) in the direction of the filter medium (negative Z-direction). As a result, at the upper channel wall (Z = 3 mm), the gas velocity (X-direction) decreases rapidly. The gas flows through the filter medium into the outlet channel, where the simulated gas velocity increases with the channel length.
Additionally, the Y-positions of the detached agglomerate from the experiment shown in Section 3.2 were plotted in Figure 12 at the different channel lengths X. After the detachment of the agglomerate, it is located at a channel width Y of 1.8 mm after a channel length of 30 mm. In this area, it reaches its maximum velocity (see Figure 10). After 60 mm channel length, the agglomerate is outside the core flow where a lower gas velocity is dominant. The gas and agglomerate velocities could be similar in this region. Toward the end of the channel, after 90 mm of channel length, the agglomerate is not in the core flow either and deviates from the maximum gas velocity. Currently, it is not yet possible to determine the exact value within the scope of this work. This is planned for future investigations.
The simulation of the gas velocity in the X-direction confirms that different gas velocities occur, depending on the position of the agglomerate in the filter channel. This could be a reason that the agglomerate velocity from the experimental investigations could decrease after the first quarter of the channel length. The assumption of a linear decrease in the gas velocity has to be considered critically, because the agglomerate is not transported on a constant Y- and Z-position in the inlet channel. In the experiments performed, only the agglomerate displacement in the width of the channel (Y-direction) can be evaluated. A statement about the height of the detached agglomerates cannot be made due to the two-dimensional view of one camera perspective.
Figure 13 depicts the gas velocity at three different channel heights (Z-direction) in the inlet channel as well as the experimentally determined agglomerate velocity (see Figure 10). The evaluated positions are marked in the scheme above the graph. Supplementary to the gas flow through the filter medium (channel length 0–120 mm), the run-in distance of the gas (−10–0 mm) into the inlet channel is shown. It should be noted again that this is a qualitative comparison, as the gas velocity of the simulations do not correspond to the velocity of the experiment.
A comparison of the gas velocities in the X-direction at the different Z-positions shows that after the inlet section of 10 mm (X = 0 mm), the gas velocity is at its highest in the core flow (Z = 1.52 mm). Near the wall, where there is no flow through a wall/filter medium, the gas velocity is significantly lower in the run-in period (X-position:−10–0 mm). After the gas can pass the filter medium (X = 0 mm), there are significant differences between the three heights. The gas velocity in the core flow decreases with an increasing channel length. The decrease in the gas velocity in the X-direction is slower in the first half of the channel than in the second half. At a height of Z = 2.27 mm, the gas velocity decreases much more rapidly. This is due to the direction of the flow going in the direction of the filter medium and thereby being reduced more quickly. As a result, the gas velocity increases near the filter medium in the first half of the channel. In this area, a force vertical to the filter medium is effective which can increase the gas velocity [5].
In this comparison, the agglomerate velocity is lower than the simulated gas velocity. Based on the simulations, it can be assumed that the agglomerate is transported to the vicinity of the quartz glass plate after detachment. As a result, it is no longer sped up after the first quarter of the channel length. During transport along the inlet channel, the agglomerate can change its height. Already during the evaluation of the X-Y-track of the agglomerate (see Figure 10), it was shown that the agglomerate moves over the width of the channel. The agglomerate can also move in its third translational degree of freedom—the Z-axis—which makes it possible to change its height in the channel.
With the current evaluations and simulations, the exact height cannot be analyzed yet. In future studies, it is planned that a better approximation of the height of the agglomerate can be carried out by a simulation of particle structures. Thereby, a statement about the complete track (X-Y-Z-direction) in the filter channel will be possible.

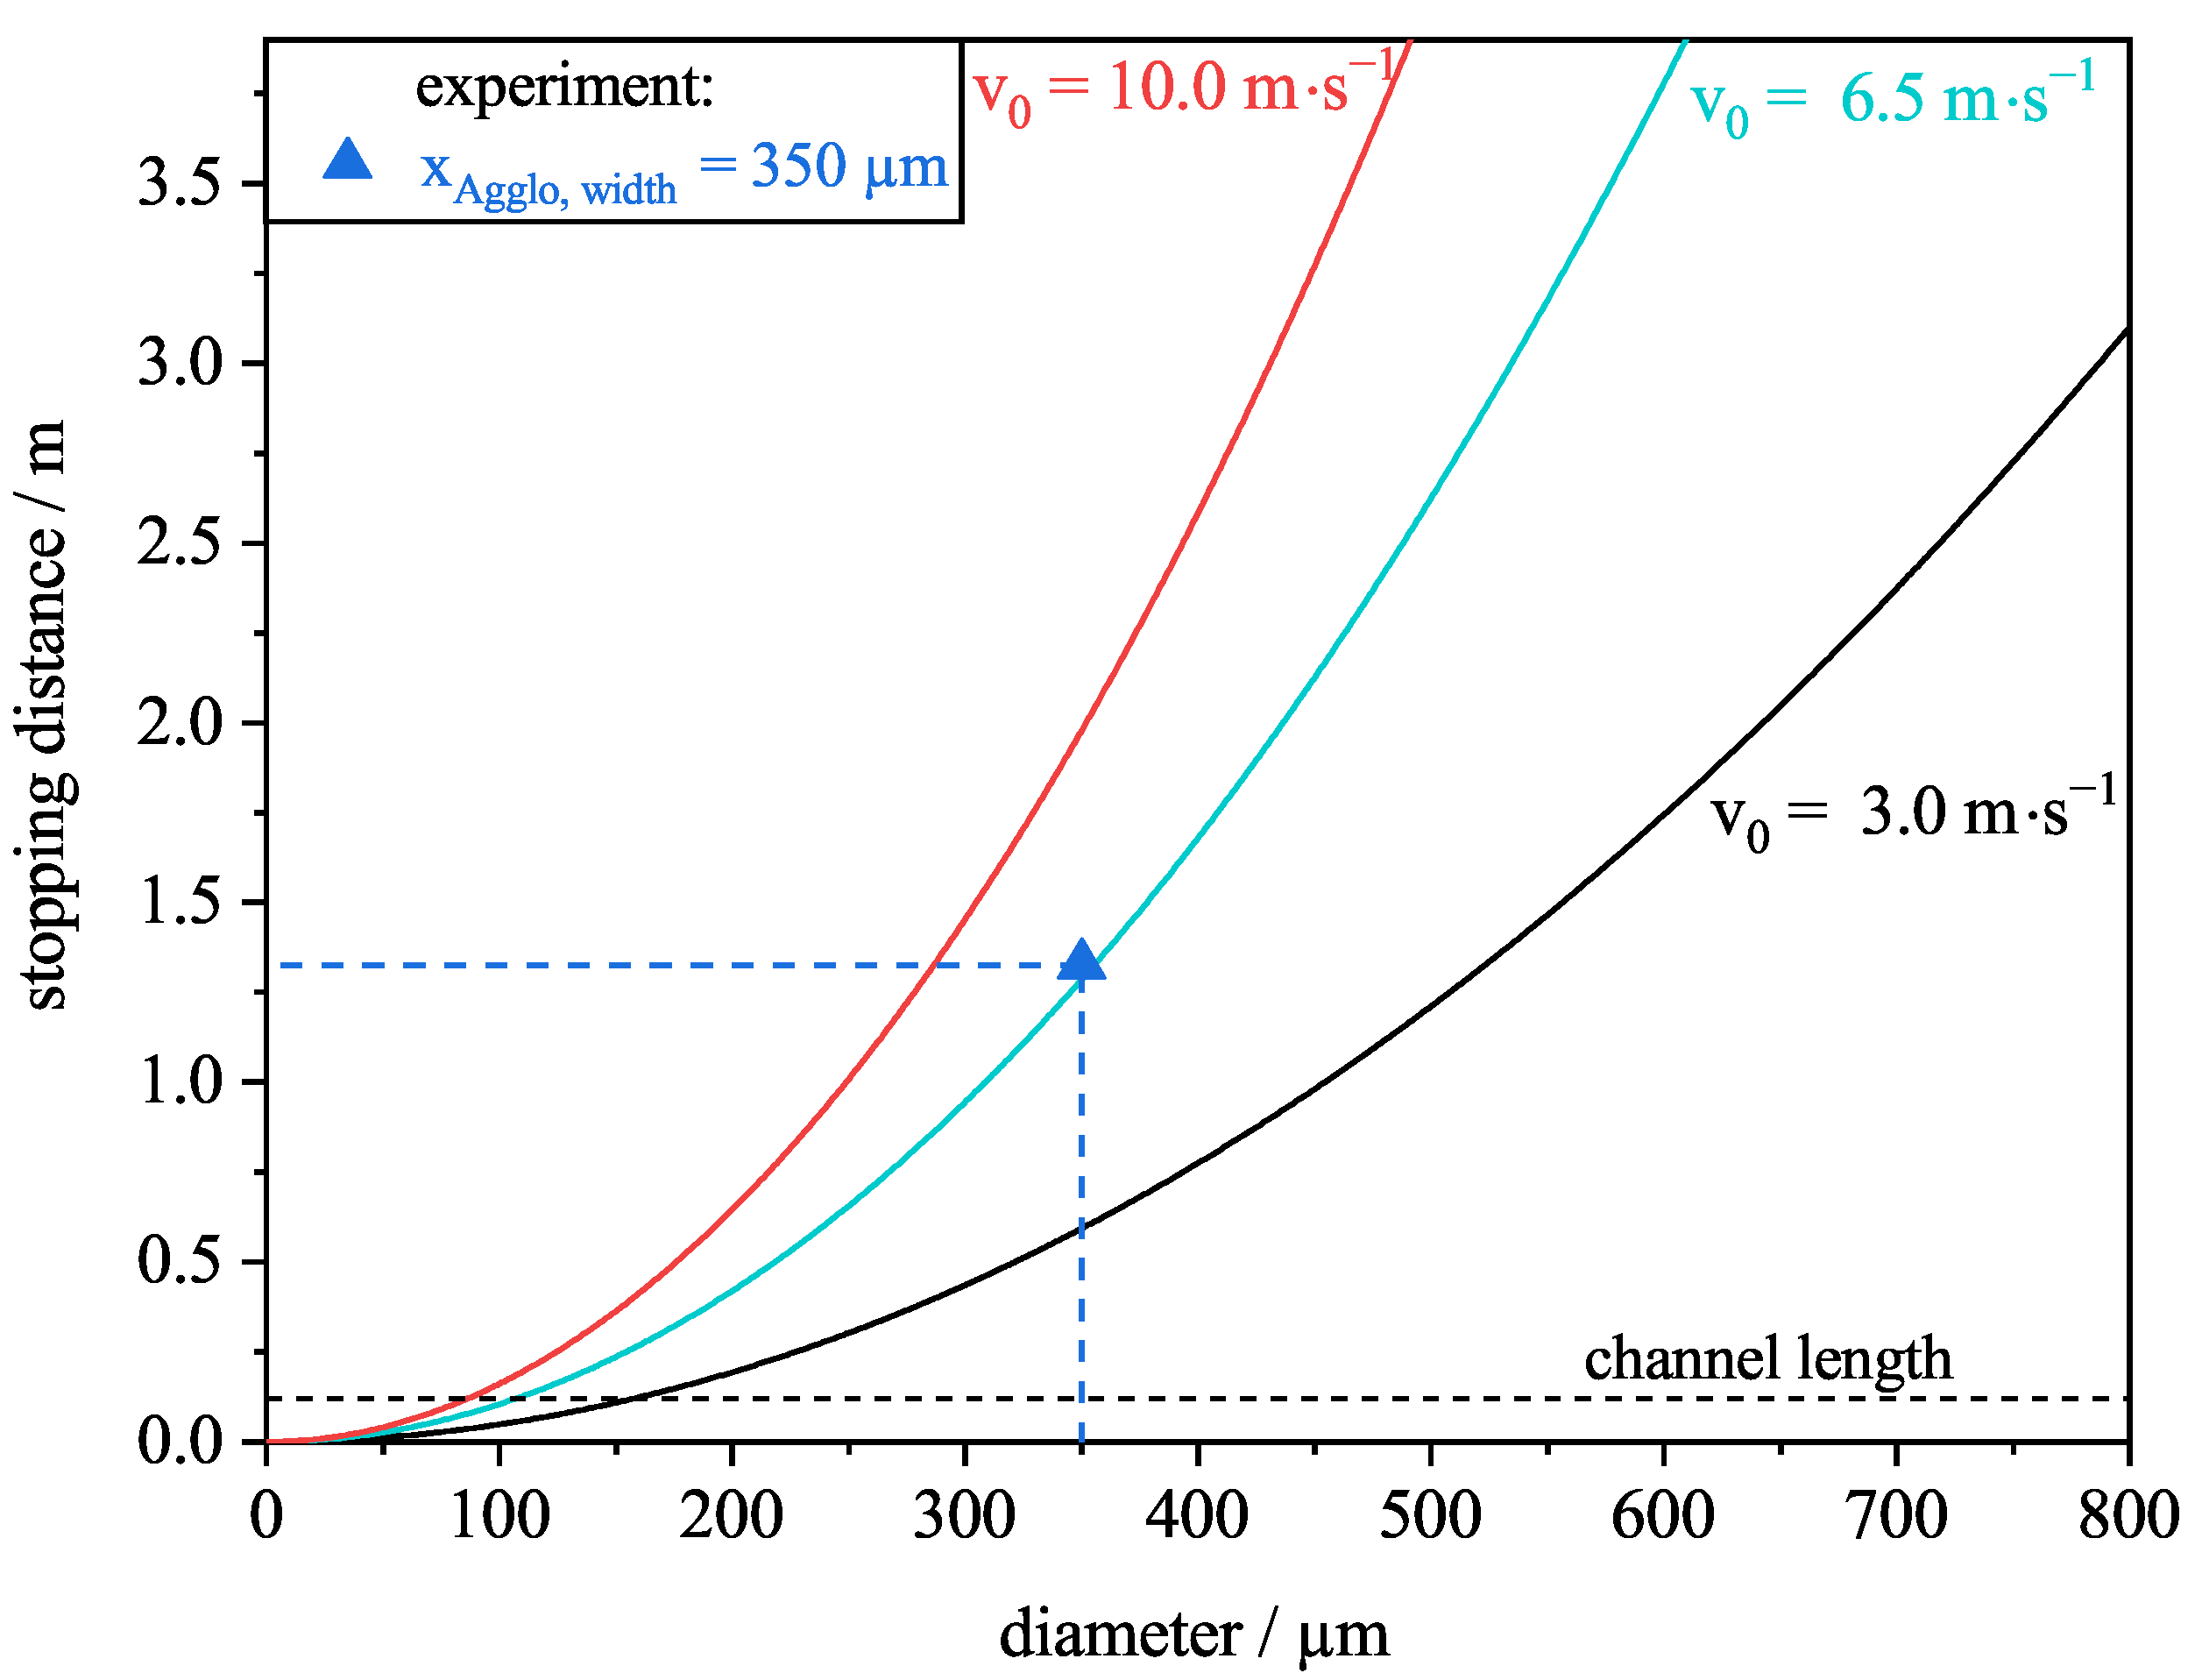
3.4. Stopping Distance

The previous evaluation from Section 3.2 shows that the agglomerate is transported to the end of the channel. To estimate the distance a detached agglomerate could be transported, the stopping distance was used. The stopping distance defines the distance a particle travels in still air when no external force is applied to the particle [21]. This engineering value is based on the assumption that a particle is given a velocity v 0 in still air. For this process, the stopping distance is defined as follows (Equation (1)):
s s t o p = τ · v 0
where s s t o p is the stopping distance (total travel distance of the particle) and τ the relaxation time (Equation (2)).
τ = x 2 · ρ P 18 · η
For the calculation of the relaxation time, an agglomerate density of ρ P = 500 kg·m 3 was assumed. The fluid used is air with a dynamic viscosity of η = 17.2 × 10 5 Pa·s, and the calculation is based on spherical particles.
The calculated stopping distance represents a lower limit, because in the case of the evaluated agglomerates in the filter channel, the gas is not still but flows through it. If the stopping distance is greater than the channel length, it can be assumed that the agglomerate, if it does not experience any collisions, is not deposited before the plug, and it is thus transported to the end of the channel. In each case, the width at the beginning of the detachment was used for the calculation. Figure 14 shows the calculated stopping distances as a function of the particle diameter for three different particle entry velocities v 0 . As an example, the stopping distance of the agglomerate shown in Section 3.2 with an entry velocity of 6.7 m·s 1 (maximum velocity reached by the agglomerate) is plotted (blue triangle).
The stopping distance for three inlet velocities indicate that particles larger than 150 μ m are transported to the end of the channel even when the gas is still. The higher the velocity and the larger the particle diameter, the further a particle is transported. The detached agglomerate from the experiment (350 μ m) has a stopping distance of 1.3 m, which is over 10 times the channel length. Without collisions of the particle structures with, e.g., the channel wall, it can be assumed that they will be transported to the end of the channel.
In flowing air, as in the experiments shown, a convective motion of the agglomerates is to be expected. As a result, the stopping distance in the experiments should be greater than the stopping distance calculated theoretically in this example.

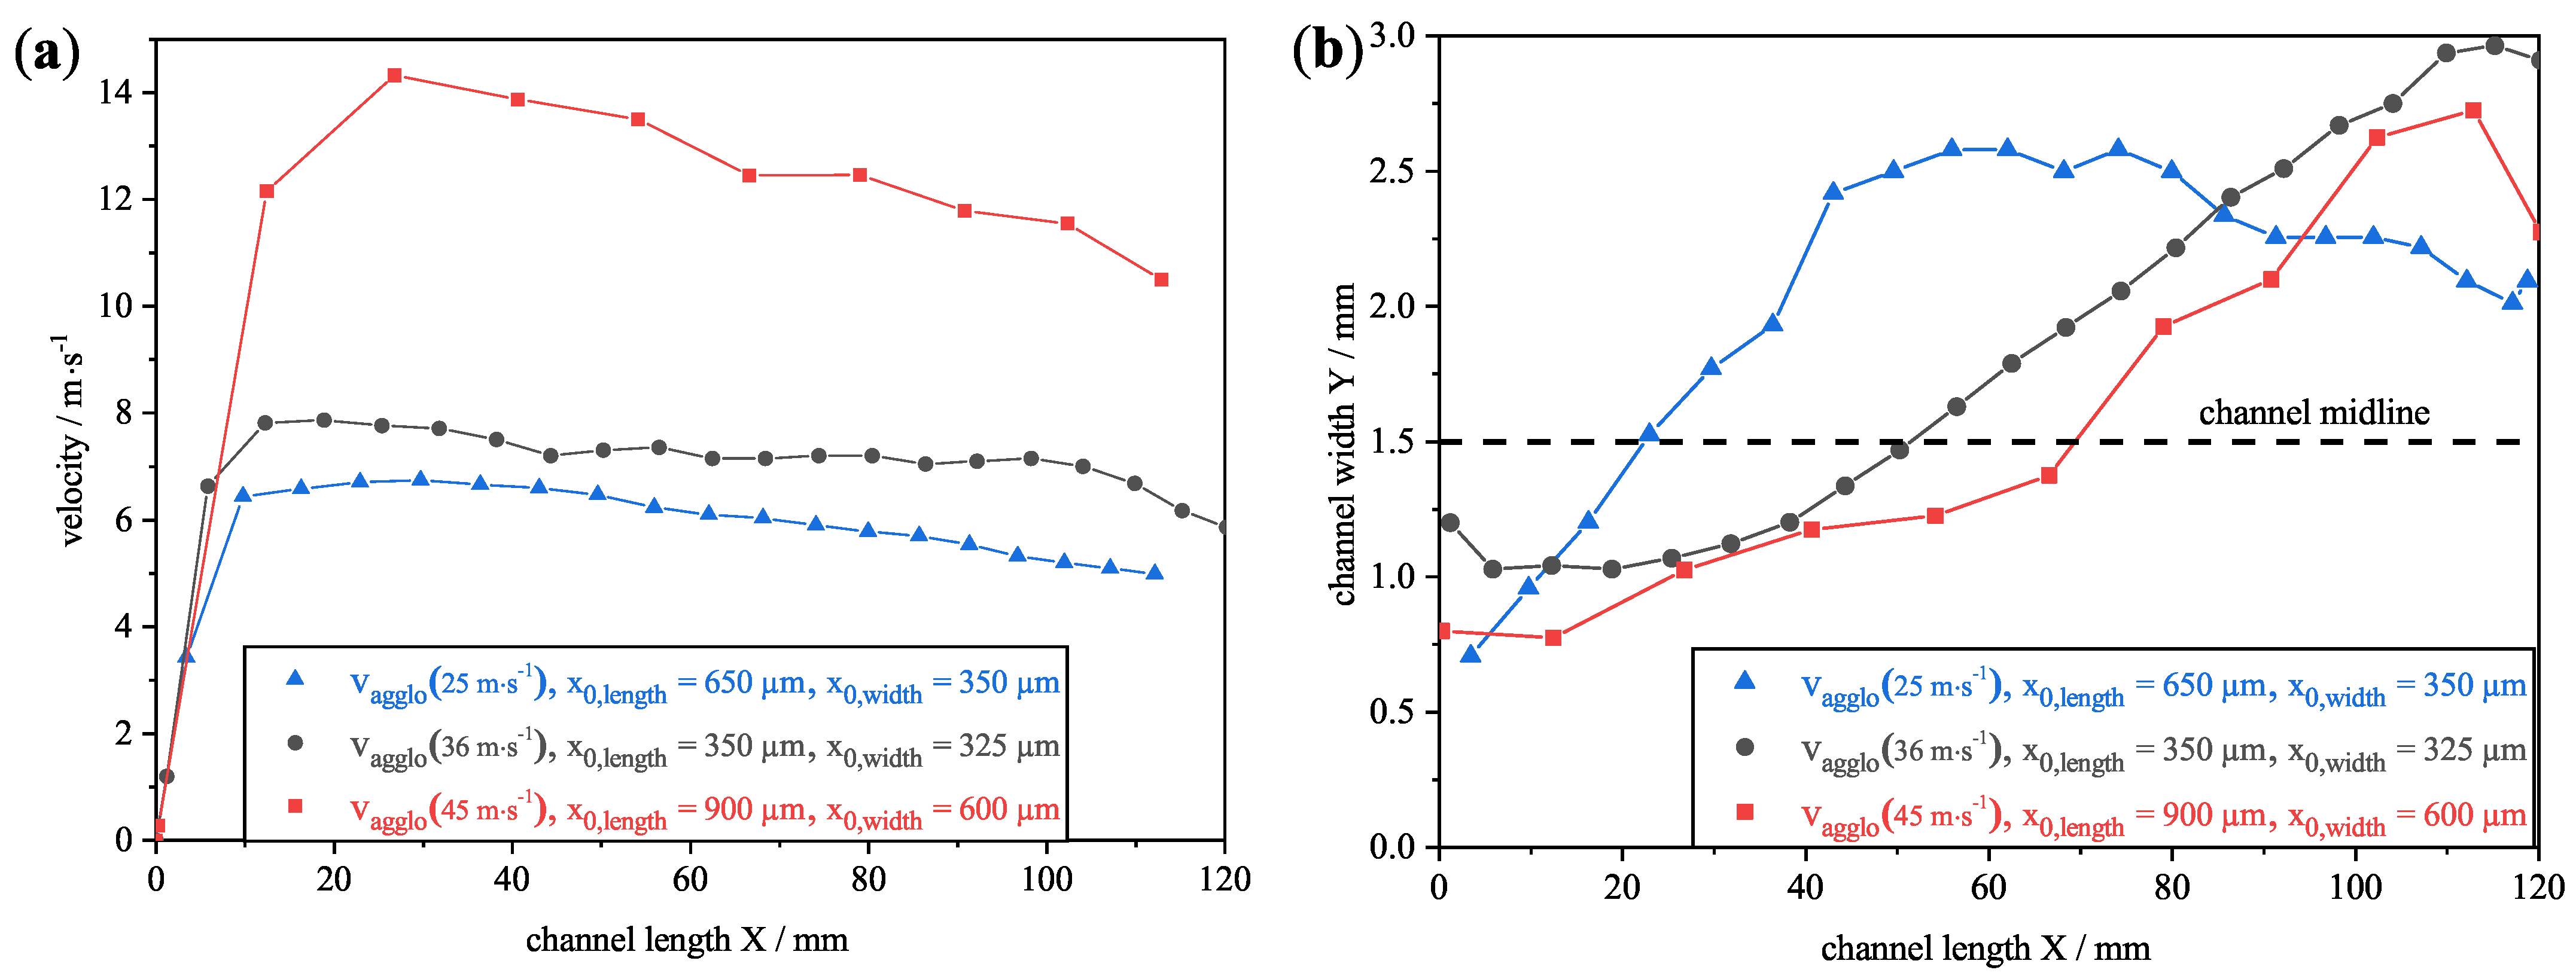
3.5. Impact of Different Gas Velocities on the Detachment and Transport

The impact of different gas velocities on the velocity, track and size of the detached agglomerates is discussed in the following section. Figure 15a shows the comparison of three gas velocities, 25, 36 and 45 m·s 1 , and its influence on the agglomerate velocities.
With increasing gas velocity, the agglomerate velocity increases. When evaluating the agglomerates, it is important to consider the different sizes and shapes of the agglomerates, which have an impact on the velocity and the tracks. The influence of the size and shape is not evaluated in more detail in this study. Even at the higher gas velocities, the maximum velocity is reached at up to about 25% of the channel length. The maximum velocity of the agglomerate at a gas velocity of 45 m·s 1 is 14.3 m·s 1 and is reached after a channel length of 27 mm. The other two agglomerates also reach their maximum velocity of 8.0 m·s 1 (gas velocity: 36 m·s 1 ) and 6.7 m·s 1 (gas velocity: 25 m·s 1 ) shortly after their detachment in the first quarter of the channel length. The small difference between the lower two gas velocities can be attributed to the smaller size of the detached agglomerate at a gas velocity of 36 m·s 1 . As a result, the maximum velocity achieved is also smaller, but the course of the agglomerate velocities along the channel length is comparable. The difference between the agglomerate velocity and the gas velocity at the channel inlet is also due to the position of the agglomerates in the inlet channel.
The tracks along the channel’s width (the cross-section) of the agglomerates are shown in Figure 15b. In this case, all the agglomerates detach in the lower half of the channel width at an accumulation of glass spheres. Even at the highest gas velocity of 45 m·s 1 , the agglomerates do not detach from the closed particle layer. After detachment, the agglomerates are transported across the midline and are deposited in the upper half of the channel at the plug. In this case, no further analysis of the stopping distance was performed, because the channel length is already significantly exceeded at a gas velocity of 25 m·s 1 . As a result, the stopping distance will also exceed the channel length at the higher gas velocities. In this experiment, the track as well as the shape of the detached particle structures have an influence on the achieved velocity. Even at higher gas velocities at the channel inlet, the detached agglomerates do not remain in the core flow. Due to their irregular shape and rotation, they change their trajectory during transport.
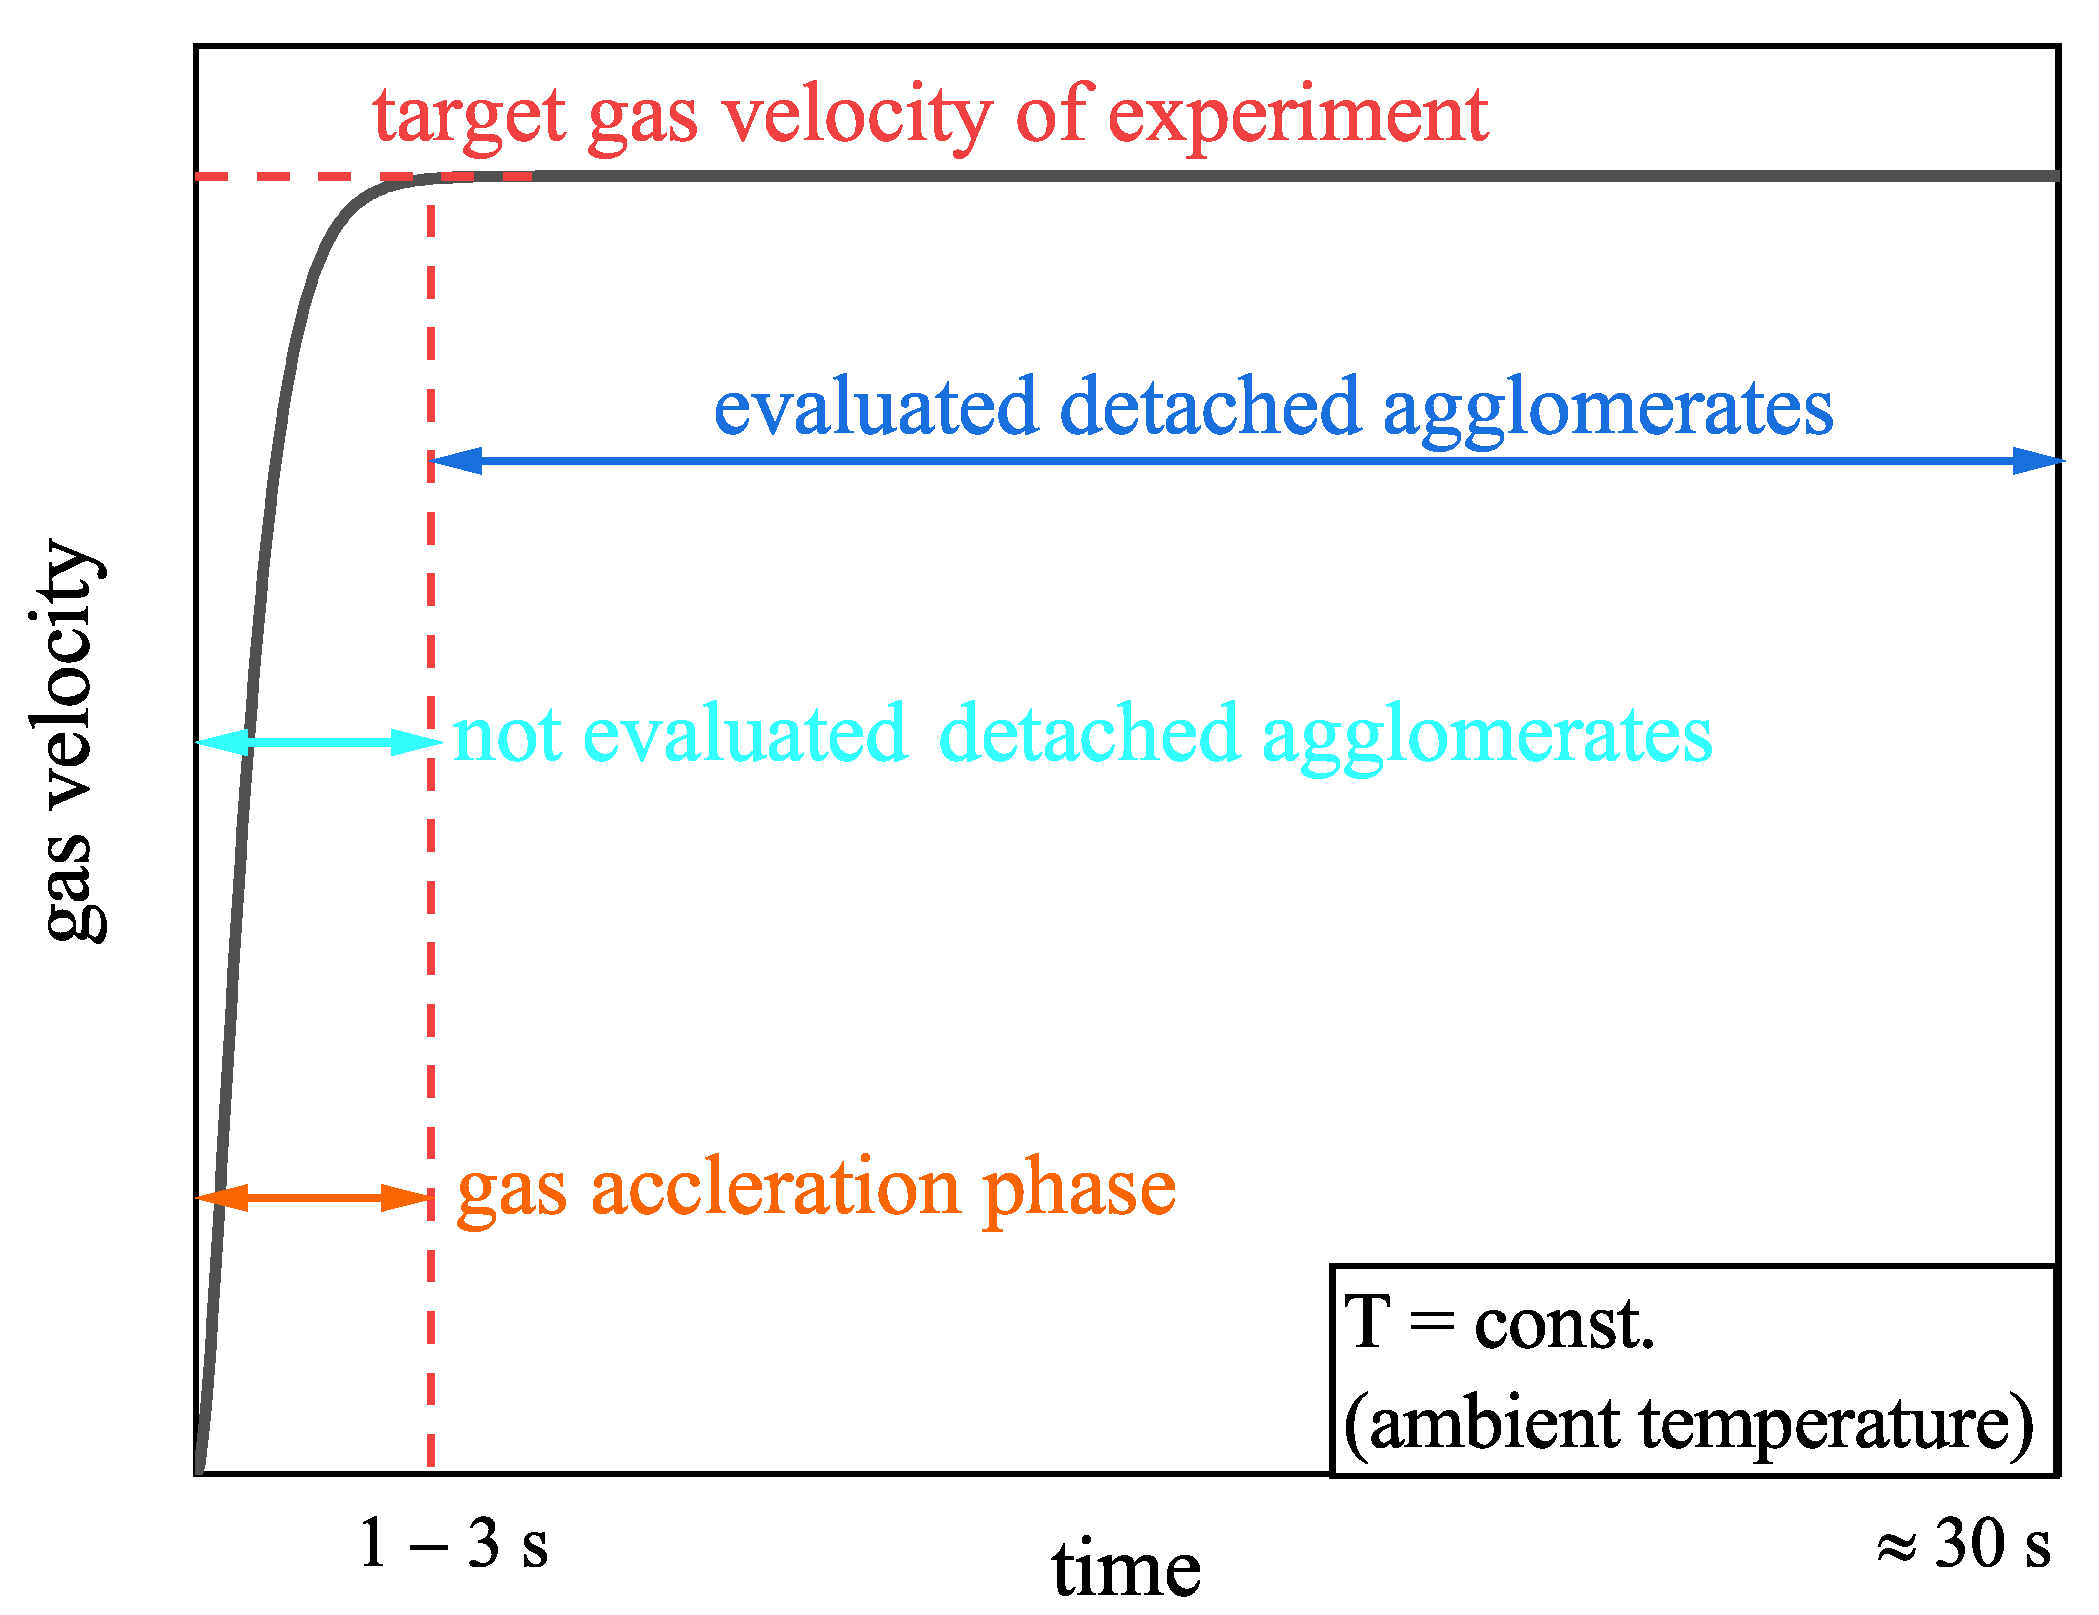
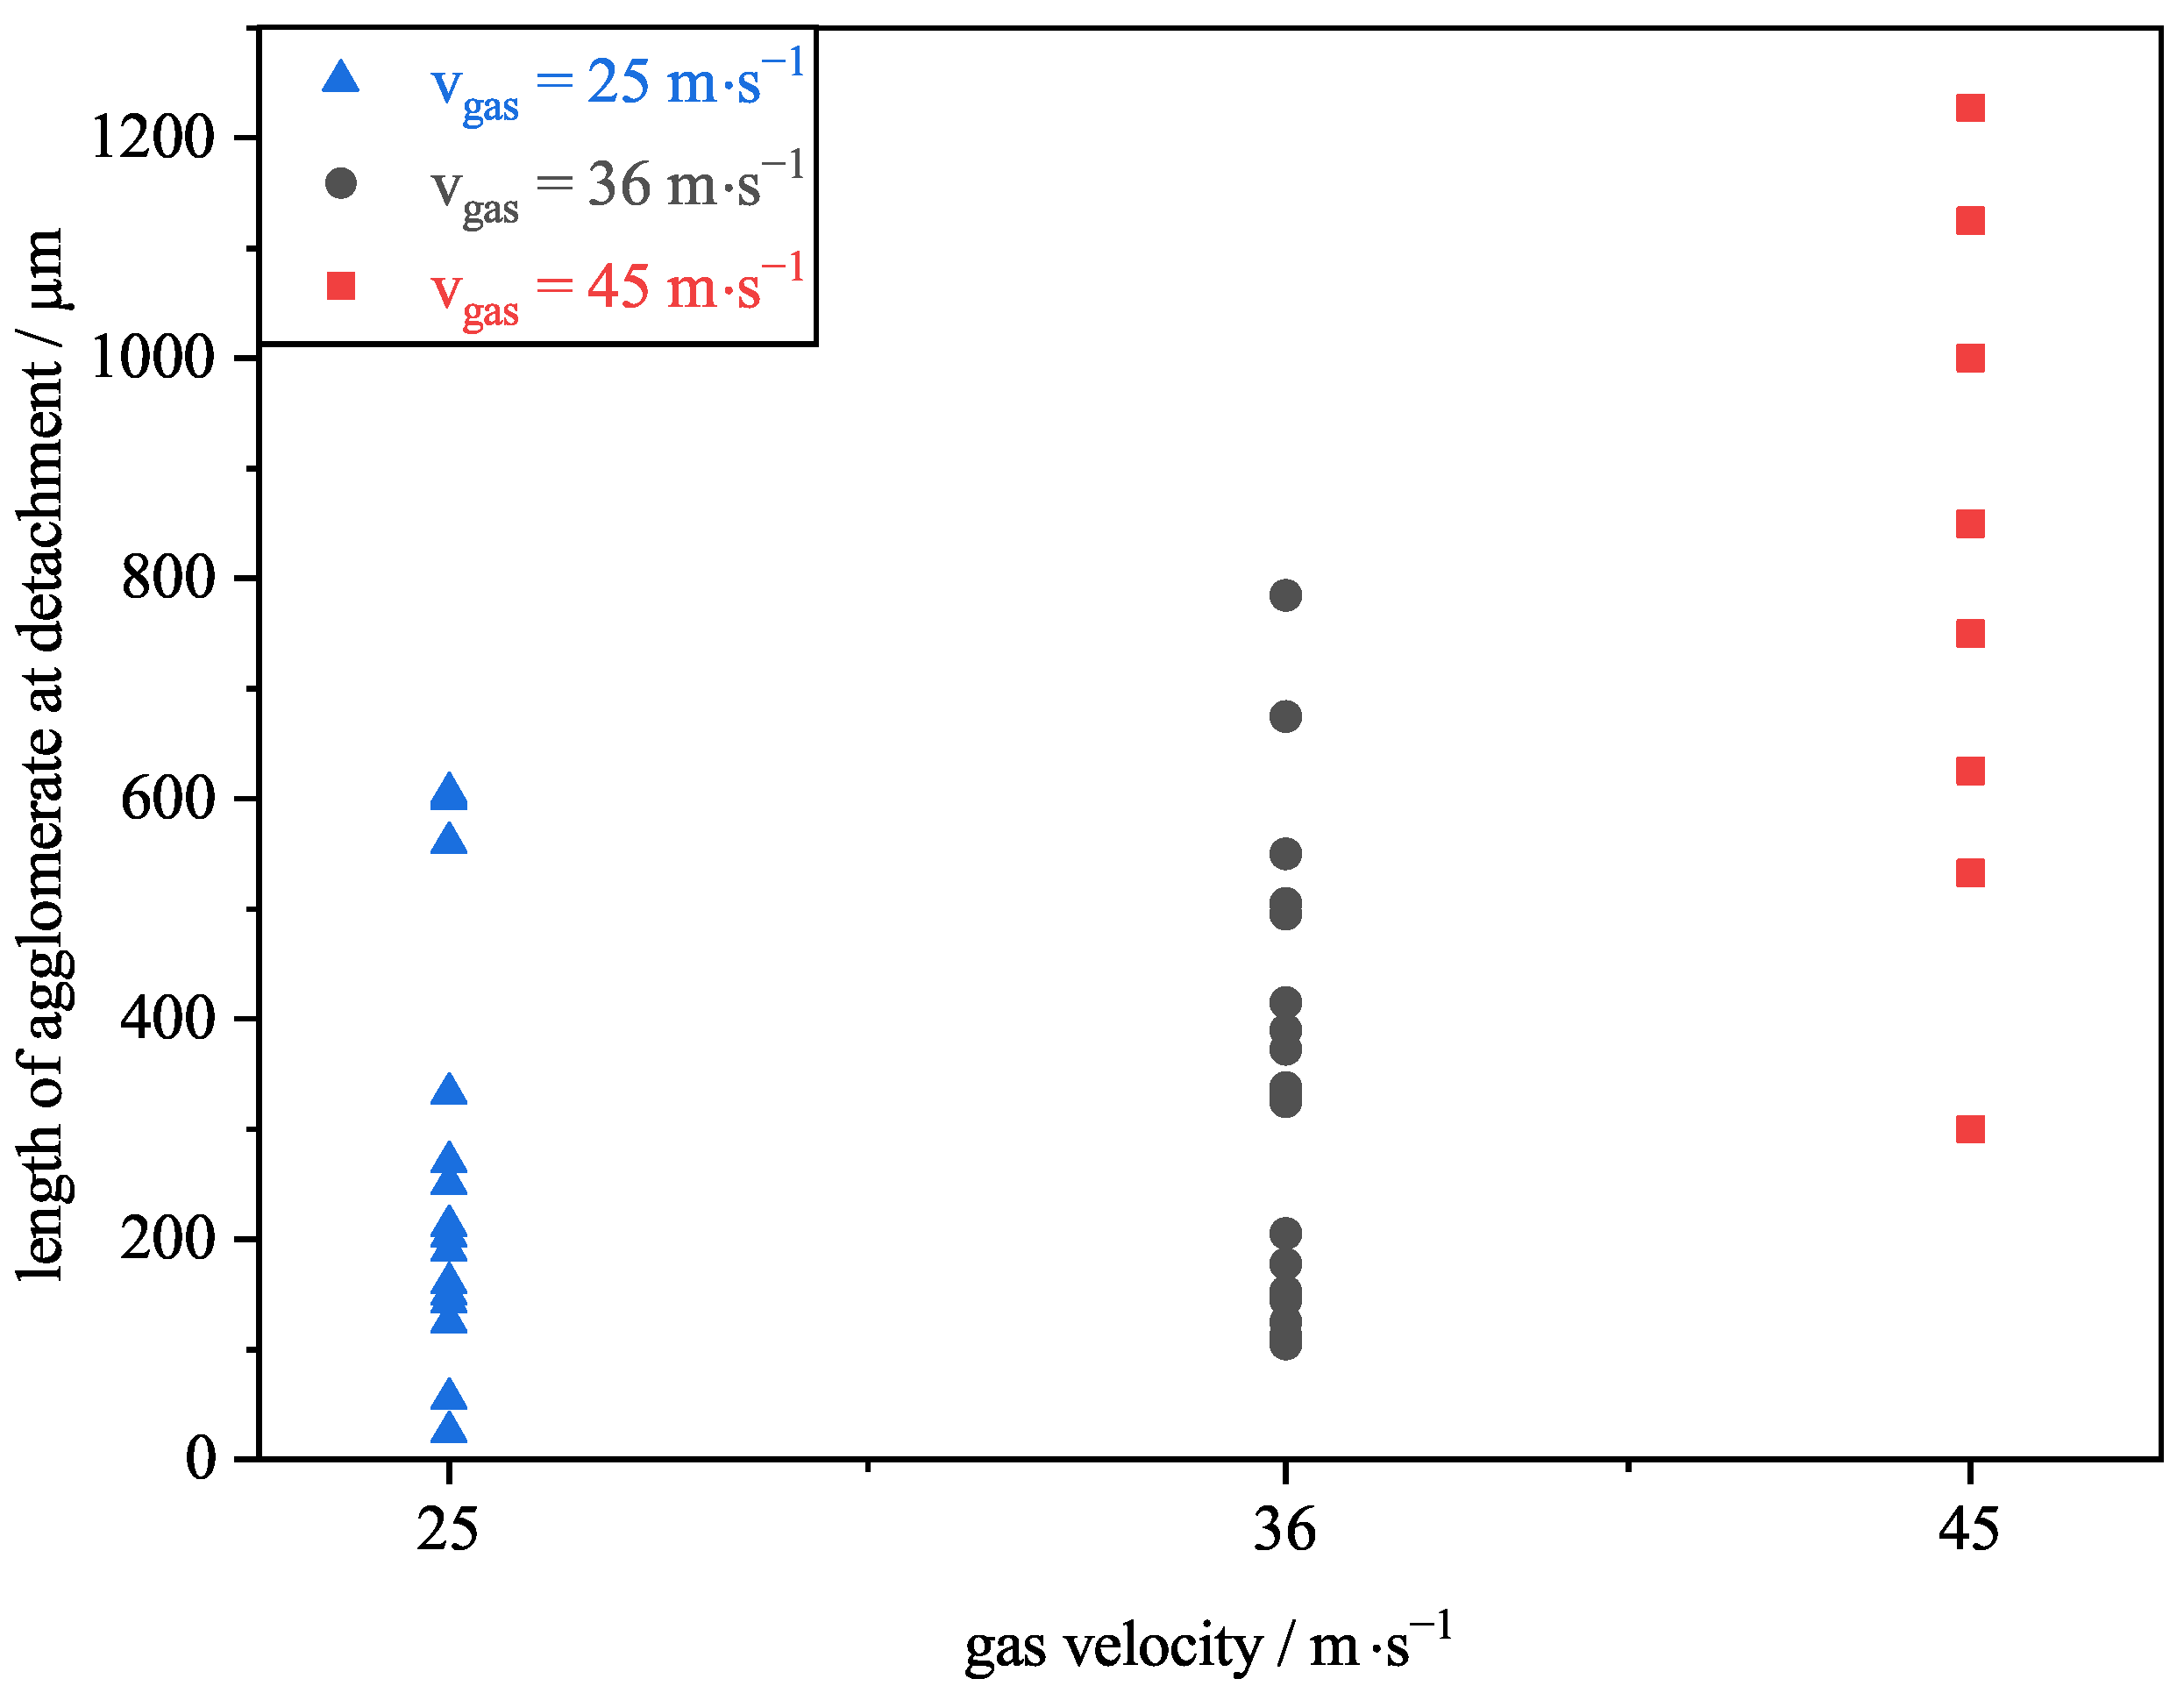
The gas velocity does not just have an influence on the velocity of the agglomerates but also on the size of the detached ones. Figure 16 shows the length of the detached agglomerates in relation to the gas velocity. During the start-up of the gas velocity in the channel, it takes the gas flow approx. 1–3 s to reach its target gas velocity (see Section 2.3.2, Figure 8). During this acceleration phase, particulate structures are already detached and are resuspended before the defined target gas velocity is reached (not shown in Figure 16). Therefore, these detached agglomerates are not taken into account in the specific evaluations of the target velocities.
At a higher gas velocity at the channel inlet, larger agglomerates are detached. At the target gas velocity of 25 m·s 1 , agglomerates up to a length of the longest axis of 600 μ m are resuspended. At a gas velocity of 45 m·s 1 , this maximum value increases to 1200 μ m. Due to the higher velocity, higher forces act on the agglomerates, which results in the resuspension of larger ones. Fundamental investigations showed that particles in a size range of 10–500 μ m can be detached by re-entrainment through flow [11]. The detachment of the larger agglomerates in these experiments could be attributed to a lower porosity of the agglomerates, their irregular shape and to low adhesive forces between the glass sphere accumulations at the channel inlet.

4. Conclusions

The visual observation of the detachment and transport process of reactive–inert particle structures inside a wall-flow filter is not possible due to the closed system. For this reason, a model filter channel was developed, which consists of a single inlet and outlet channel of a wall-flow filter. With this model filter channel, it is possible to visually observe the detachment, transport and also the subsequent deposition of particle agglomerates over the complete channel length of 120 mm.
For this purpose, a particle layer consisting of reactive and inert particles is formed. Glass spheres are used as inert particles and an ash replacement system. Soot particles are used as a reactive particle system. To achieve the rearrangement (detachment, transport and deposition) of the agglomerates, the gas flow velocity through the model filter channel is varied, and the process is observed with a high-speed camera. For the experimental observation of the detachment and transport of agglomerates, a high-speed camera with a frame rate of 1000 fps was used. The investigations show that even without the regeneration of the reactive particles, agglomerates detach from the inhomogeneous layer structures and are transported along the filter channel. Agglomerates do not detach from the closed particle layer. After detachment, the velocity of the particle structure increases until the agglomerate reaches its maximum velocity in the first 25% of the channel length. Subsequently, the agglomerate velocity decreases steadily until it is abruptly stopped by the plug where the agglomerates are deposited. Due to further rearrangement, an incipient channel plug-end filling occurs at the channel end.
The track of the agglomerates has an influence on their reached velocity. If the agglomerate is in the vicinity of the side walls, the quartz glass or the filter medium, the gas velocity differs from the gas velocity in the core flow. The height of the agglomerate (Z-direction) also has an influence on the reached velocity as the simulation of the gas velocity shows. The exact height of the agglomerate cannot be evaluated in this study.
With an increase in flow velocity, the agglomerate velocity increases and larger agglomerates detach. The detached agglomerates are in a size range between 50 and 1200 μ m for the examined gas velocities. Even at a gas velocity of 25 m·s 1 at the channel inlet, the calculated stopping distance is above the channel length, which confirms the transport of the agglomerates to the end of the channel without collisions.
In further investigations, the influence of the regeneration of the reactive particles on the rearrangement processes will be analyzed. The model filter channel will be heated, and the layer breakup and possible detachments will be observed during this process. Additionally, the experiments will be compared with simulations of particle structures in a two-channel setup with comparable gas velocities. With these simulations, the height of the agglomerates can be estimated.

Author Contributions

Conceptualization, J.R.D.T.; methodology, J.R.D.T.; validation, J.R.D.T., N.H., J.M. and A.D.; investigation, J.R.D.T.; writing—original draft preparation, J.R.D.T.; writing—review and editing, J.R.D.T., N.H., J.M. and A.D.; visualization, J.R.D.T. and N.H.; supervision, J.M., M.J.K. and A.D.; project administration, M.J.K. and A.D. All authors have read and agreed to the published version of the manuscript.

Funding

We gratefully acknowledge that this project was funded by the Deutsche Forschungsgemeinschaft (DFG, German Research Foundation)—438308378.

Institutional Review Board Statement

Not applicable.

Informed Consent Statement

Not applicable.

Data Availability Statement

Not applicable.

Acknowledgments

We acknowledge support by the KIT-Publication Fund of the Karlsruhe Institute of Technology. Furthermore, we would like to acknowledge the simulation project funded by the Deutsche Forschungsgemeinschaft (DFG, German Research Foundation—422374351) on the simulation of rearrangement processes in ceramic particulate filters using Lattice–Boltzmann methods for their support with the simulation results.

Conflicts of Interest

The authors declare that they have no known competing financial interests or personal relationships that could have appeared to influence the work reported in this paper.

Abbreviations

The following abbreviations are used in this manuscript:
CPCCondensation Particle Counter
DMADifferential Mobility Analyzer
DPFDiesel Particulate Filter
MFCMass Flow Controller
OPCOptical Particle Counter
SMPSScanning Mobility Particle Sizing System

References

  1. Dittler, A. The Application of Diesel Particle Filters—From Past to Present and Beyond. Top. Catal. 2017, 60, 342–347. [Google Scholar] [CrossRef]
  2. Hanamura, K.; Karin, P.; Cui, L.; Rubio, P.; Tsuruta, T.; Tanaka, T.; Suzuki, T. Micro- and macroscopic visualization of particulate matter trapping and regeneration processes in wall-flow diesel particulate filters. Int. J. Engine Res. 2009, 10, 305–321. [Google Scholar] [CrossRef]
  3. Karin, P.; Cui, L.; Rubio, P.; Tsuruta, T.; Hanamura, K. Microscopic Visualization of PM Trapping and Regeneration in Micro-Structural Pores of a DPF Wall. SAE Int. J. Fuels Lubr. 2009, 2, 661–669. [Google Scholar] [CrossRef]
  4. Choi, S.; Oh, K.C.; Lee, C.B. The effects of filter porosity and flow conditions on soot deposition/oxidation and pressure drop in particulate filters. Energy 2014, 77, 327–337. [Google Scholar] [CrossRef] [Green Version]
  5. Sappok, A.; Wang, Y.; Wang, R.Q.; Kamp, C.; Wong, V. Theoretical and Experimental Analysis of Ash Accumulation and Mobility in Ceramic Exhaust Particulate Filters and Potential for Improved Ash Management. SAE Int. J. Fuels Lubr. 2014, 7, 511–524. [Google Scholar] [CrossRef]
  6. Ishizawa, T.; Yamane, H.; Satoh, H.; Sekiguchi, K.; Arai, M.; Yoshimoto, N.; Inoue, T. Investigation into Ash Loading and Its Relationship to DPF Regeneration Method. SAE Int. J. Commer. Veh. 2009, 2, 164–175. [Google Scholar] [CrossRef]
  7. Tandon, P.; Heibel, A.; Whitmore, J.; Kekre, N.; Chithapragada, K. Measurement and prediction of filtration efficiency evolution of soot loaded diesel particulate filters. Chem. Eng. Sci. 2010, 65, 4751–4760. [Google Scholar] [CrossRef]
  8. Sappok, A.; Govani, I.; Kamp, C.; Wang, Y.; Wong, V. In-Situ Optical Analysis of Ash Formation and Transport in Diesel Particulate Filters During Active and Passive DPF Regeneration Processes. SAE Int. J. Fuels Lubr. 2013, 6, 336–349. [Google Scholar] [CrossRef]
  9. Seher, S.I.; Ess, M.N.; Bladt, H.; Niessner, R.; Eigenberger, G.; Nieken, U. A comparison of diesel soot oxidation rates measured with two different isothermal set-ups. J. Aerosol Sci. 2016, 91, 94–100. [Google Scholar] [CrossRef]
  10. Frank, R.W.; Hardenberg, H.O. Reduction of Particulate Emission from the Break-in Facilities of a Heavy-Duty Engine Plant by means of Ceramic Monolith Traps. In Proceedings of the SAE Technical Paper Series, SAE International400 Commonwealth Drive, Warrendale, PA, USA, 25 February 1985. [Google Scholar] [CrossRef]
  11. Dittler, A. Ash Transport in Diesel Particle Filters. In Proceedings of the SAE Technical Paper Series, SAE International400 Commonwealth Drive, Warrendale, PA, USA, 9 October 2012. [Google Scholar] [CrossRef]
  12. Jiang, J.; Gong, J.; Liu, W.; Chen, T.; Zhong, C. Analysis on filtration characteristic of wall-flow filter for ash deposition in cake. J. Aerosol Sci. 2016, 95, 73–83. [Google Scholar] [CrossRef]
  13. Gaiser, G.; Mucha, P. Prediction of Pressure Drop in Diesel Particulate Filters Considering Ash Deposit and Partial Regenerations. In Proceedings of the SAE Technical Paper Series, SAE International400 Commonwealth Drive, Warrendale, PA, USA, 8–11 March 2004. [Google Scholar] [CrossRef]
  14. Boor, B.E.; Siegel, J.A.; Novoselac, A. Monolayer and Multilayer Particle Deposits on Hard Surfaces: Literature Review and Implications for Particle Resuspension in the Indoor Environment. Aerosol Sci. Technol. 2013, 47, 831–847. [Google Scholar] [CrossRef]
  15. Schmidt, E.; Nitschke, D. Aufwirbelung von auf Oberflächen abgelagerten Partikelschichten. Chem. Ing. Tech. 2006, 78, 525–533. [Google Scholar] [CrossRef]
  16. Ibrahim, A.H.; Dunn, P.F.; Brach, R.M. Microparticle detachment from surfaces exposed to turbulent air flow: Effects of flow and particle deposition characteristics. J. Aerosol Sci. 2004, 35, 805–821. [Google Scholar] [CrossRef]
  17. Wang, Y.; Kamp, C.J.; Wang, Y.; Toops, T.J.; Su, C.; Wang, R.; Gong, J.; Wong, V.W. The origin, transport, and evolution of ash in engine particulate filters. Appl. Energy 2020, 263, 114631. [Google Scholar] [CrossRef]
  18. Kamp, C.J.; Sappok, A.; Wang, Y.; Bryk, W.; Rubin, A.; Wong, V. Direct Measurements of Soot/Ash Affinity in the Diesel Particulate Filter by Atomic Force Microscopy and Implications for Ash Accumulation and DPF Degradation. SAE Int. J. Fuels Lubr. 2014, 7, 307–316. [Google Scholar] [CrossRef]
  19. Dittler, A.; Gärtner, U. Alterung von Partikelfiltersystemen in Nutzfahrzeugen durch Ablagerung von Aschen—Ein historisches Problem? In Proceedings of the 8 Internationales Forum Abgas- und Partikel-Emissionen, Ludwigsburg, Germany, 18 February 2014; pp. 82–86. [Google Scholar]
  20. Hafen, N.; Dittler, A.; Krause, M.J. Simulation of particulate matter structure detachment from surfaces of wall-flow filters applying lattice Boltzmann methods. Comput. Fluids 2022, 239, 105381. [Google Scholar] [CrossRef]
  21. Hinds, W.C. Aerosol Technology: Properties, Behavior and Measurement of Airborne Particles, 2nd ed.; John Wiley & Sons: Hoboken, NJ, USA, 1999. [Google Scholar]
Figure 1. Boundary deposition patterns in a particulate filter: (a) homogenous layer and (b) plug-end filling.
Separations 09 00195 g001
Figure 2. Schematic illustration of the forces on a particle and the possibilities of particle detachment due to an overflow of the particle layer. Adapted from: [5,15].
Separations 09 00195 g002
Figure 3. (a) Number-based particle-size distribution of soot particles used for the layer formation in the model filter channel measured with SMPS measurement system and (b) SEM image.
Separations 09 00195 g003
Figure 4. (a) Number-based particle-size distribution of glass spheres used for the layer formation in the model filter channel measured with SMPS and OPC measurement systems and (b) SEM image.
Separations 09 00195 g004
Figure 5. Schematic drawings of the model filter channel in cross-section (a,b).
Separations 09 00195 g005
Figure 6. (a) Schematic experimental setup and (b) schematic drawing of layer formation/filtration in the model filter channel.
Separations 09 00195 g006
Figure 7. Schematic experimental setup of the detachment and transport in the model filter channel.
Separations 09 00195 g007
Figure 8. Start-up behavior of the entry velocity for the experiments on detachment and transport of particulate structures (schematic).
Separations 09 00195 g008
Figure 9. (a) Image sequence of the track of a detached agglomerate and its transport in the model filter channel at a gas velocity at the channel inlet of v g a s , i n l e t = 25 m·s 1 at ambient temperature with a magnification of (b) the glass sphere accumulation at the channel inlet (enhancement of the contrast for a better visualization) and (c) the agglomerate after 0 s and (d) after 0.012 s of the transport.
Separations 09 00195 g009
Figure 10. Velocities of detached agglomerate and gas as well as the track of the agglomerate plotted against the channel length. The lines between the data points serve as a guide to the eye.
Separations 09 00195 g010
Figure 11. Simulation of particle-free flow (gas) inside the two-channel setup (one inlet and one outlet channel) with an average inflow velocity of 10 m·s 1 , a permeability of 4.3 × 10 12 m 2 and a resolution of 90. The gray structure between the inlet and the outlet channel represents the filter medium. Color scale indicates the local velocity magnitude of the main flow direction X.
Separations 09 00195 g011
Figure 12. Width (Y) and height (Z) of different channel positions in the main flow direction X of the particle-free flow (gas) inside the two-channel setup (one inlet and one outlet channel) with an average inflow velocity of 10 m·s 1 , a permeability of 4.3 × 10 12 m 2 and a resolution of 90. The gray structure represents the filter medium. Color scale indicates the local velocity magnitude of the main flow direction X.
Separations 09 00195 g012
Figure 13. Simulation of the horizontal gas velocity (particle-free flow; X-direction) at different channel heights (Z) inside the two-channel setup (one inlet and one outlet channel) with an average inflow velocity of 10 m·s 1 , a permeability of 4.3 × 10 12 m 2 and a resolution of 90 as well as the experimentally determined agglomerate velocity over the channel length X at a gas velocity at the channel inlet of v g a s , i n l e t = 25 m·s 1 . The lines between the data points serve as a guide to the eye.
Separations 09 00195 g013
Figure 14. Calculated stopping distance as a function of particle diameter for different start velocities v 0 and estimated stopping distance of detached agglomerate from Section 3.2.
Separations 09 00195 g014
Figure 15. (a) Agglomerate velocities and (b) tracks of detached agglomerates plotted against the channel length for different gas velocities at the channel inlet. The lines between the data points serve as a guide to the eye.
Separations 09 00195 g015
Figure 16. Length of detached agglomerates (longest axis of the detached particle structure) at different target gas velocities at the channel inlet of the model filter channel.
Separations 09 00195 g016
Table 1. Operating conditions soot generator.
GasFlow Rate/L·min 1
Propane0.05
Quench gas (nitrogen)2.0
Oxidation air1.0
Mixing gas (nitrogen)0.0
Dilution air0.0
Table 2. Operating conditions dust disperser.
ParameterValue
Ring velocity/%10
Height of the scraper/mm5.74
Pre-pressure/bar1.5
Ring width/mm1.2
Rate of the screw conveyor/−4 from 6
Table 3. Process parameters layer formation.
ParameterValue
Velocity glass spheres/m·s 1 7.4
Time glass spheres loading/min6.0
Velocity soot particles/m·s 1 5.6
Time soot particle loading/min8.0
Table 4. Operating conditions of the high-speed camera.
ParameterValue
Frame rate/fps1000
Exposure time/s1/100,000
Objective/−Zeiss Makro
Image format/px5120 × 200
Publisher’s Note: MDPI stays neutral with regard to jurisdictional claims in published maps and institutional affiliations.

