Article

Rapid and Simultaneous Determination of Free Aromatic Carboxylic Acids and Phenols in Commercial Juices by GC-MS after Ethyl Chloroformate Derivatization

Department of Biochemical Sciences, “Sapienza” University of Rome, p.le A. Moro 5, 00185 Rome, Italy
*
Authors to whom correspondence should be addressed.
Separations 2022, 9(1), 9; https://doi.org/10.3390/separations9010009
Submission received: 3 December 2021 / Revised: 20 December 2021 / Accepted: 28 December 2021 / Published: 30 December 2021

Abstract

:
Natural phenol and phenolic acids are widely distributed in the plant kingdom and the major dietary sources include fruits and beverages derived therefrom. Over the past decades, these compounds have been widely investigated for their beneficial effects on human health and, at the same time, several analytical methods have been developed for their determination in these matrices. In the present paper, 19 different aromatic carboxylic acids and phenols were characterized by GC-MS using ethyl chloroformate as the derivatizing agent. This procedure occurs quickly at room temperature and takes place in aqueous media simultaneously with the extraction step in the presence of ethanol using pyridine as a catalyst. The analytical method herein developed and validated presents excellent linearity in a wide concentration range (25–3000 ng/mL), low LOQ (in the range 25–100 ng/mL) and LOD (in the range 12.5–50 ng/mL), and good accuracy and precision. As a proof of concept, ethyl chloroformate derivatization was successfully applied to the analysis of a selection of commercial fruit juices (berries, grape, apple, pomegranate) particularly rich in phenolic compounds. Some of these juices are made up of a single fruit, whereas others are blends of several fruits. Our results show that among the juices analyzed, those containing cranberry have a total concentration of the free aromatic carboxylic acids and phenols tested up to 15 times higher than other juices.

1. Introduction

Natural phenolic compounds comprise several bioactive phenols and phenolic acids whose benefits to human health are widely described [1,2]. In vitro and in vivo studies have clearly shown that these molecules may be active against a range of pathologic conditions. Several studies have indeed shown an inverse correlation of phenolic acid intake and metabolic syndrome, type-2 diabetes, hypertension [3,4,5], non-alcoholic fatty liver disease [6], and impaired cognition.
Aromatic carboxylic acids and phenols are widely distributed in nature and the major dietary sources include fruits, cereals, and legumes, as well as beverages (coffee, tea, wine, and fruit juices) [7,8]. They can be found in plants as free aglycones and bound to sugars, organic acids, and polymers mainly as esters and ethers.
From a structural point of view, phenolic acids contain a phenyl ring and a carboxylic acid moiety and are generally classified as benzoic acid or cinnamic acid derivatives. Given these basic skeletons, the number and position of hydroxyl groups generate the array of the naturally occurring phenolic acids [9,10,11,12,13].
Over the years, several analytical methods based on chromatographic (GC-MS and HPLC coupled with various detectors) and electrophoretic techniques have been developed for the determination of these compounds in food matrices [14,15,16,17,18,19,20,21]. Among these methods, those based on GC-MS are characterized by high sensitivity and have the advantage that compounds may be identified by using MS libraries and resources for structure elucidation. Given their chemical structure, derivatization before GC-MS is an essential preparatory step for the analysis of phenolic compounds: It reduces their polarity while increasing volatility and thermal stability. Silylation is perhaps the most versatile derivatization procedure. However, a major point is that these reactions are moisture-sensitive and must be carried out in an anhydrous, or water-free, environment. This requires an additional drying step of the extracts. In contrast to silylation, derivatization with alkyl chloroformates proceeds directly in aqueous media, typically in the presence of the corresponding alcohol using pyridine as a catalyst [22]. A further advantage of this derivatization procedure is that it occurs quickly at room temperature, simultaneously with the extraction step. In addition, the overall reaction requires a small amount of low-cost reagent. Nevertheless, MS information of ethoxycarbonyl derivatives of natural compounds is not adequately represented in available spectra libraries for GC-MS platforms based on electron ionization (EI). Thus, in this paper, we developed and validated a GC-MS method for the simultaneous quantitative analysis of 19 different free phenolic compounds. As a proof of concept, this method was applied to the analysis of commercial fruit juices, selected among those particularly rich in phenolic compounds. To the best of our knowledge, this study provides the first ethyl chloroformate (ECF) derivative library containing mass spectral information for the phenolic compounds tested.

2. Materials and Methods

2.1. Reagents and Standards

Standard aromatic carboxylic acids and phenols, ethyl chloroformate, n-alkane mixture (C10–C40), and organic solvents were purchased from Merck (Darmstadt, D). Standard stock solutions were prepared by dissolving aromatic carboxylic acids and phenols and internal standard in ethanol. The calibration curves were performed by diluting the stock solutions in water adjusted to pH 3.5 with diluted citric acid.

2.2. Extraction/Derivatization Procedure

A total of 0.25 mL of fruit juice (clarified as described below) containing 200 ng of methyl-heptadecanoate as internal standard were made alkaline (pH > 9) through the addition of NaHCO3 (200 μL, 1 M). Hexane (2 mL) and ECF (100 μL) were added to this solution and then 200 μL of ethanol/pyridine 1:1 were slowly added. After 2 min shaking, the organic phase was removed, and a second extraction was carried out with hexane (2 mL) and 20 μL of ECF. The hexane extracts were combined and dried under a nitrogen stream. The sample was dissolved in 75 μL of chloroform and analyzed by GC-MS.
The same procedure was applied to the standard solutions (in acidic water) used for the development of the analytical method. Non-isothermal Kovats retention indices (RI) of the derivatized standard molecules were determined according to the following equation: RIx = 100n + 100(tx − tn)/(tn+1 − tn), where tn and tn+1 are the retention times of the reference n-alkane hydrocarbons eluting immediately before and after chemical compound “X” and tx is the retention time of compound “X”
The extraction efficiency was tested with hexane, ethyl acetate, chloroform, and diethyl ether using methyl-heptadecanoate as the internal standard.

2.3. Gas Chromatography–Mass Spectrometry

GC-MS analyses were carried out using an Agilent 7890B gas chromatograph equipped with a 5977B quadrupole MS detector (Agilent Technologies, Palo Alto, CA, USA). Chromatographic separations were carried out with an Agilent HP5ms fused-silica capillary column (30 m × 0.25 mm i.d. × 0.25 μm). Injection: splitless, 260 °C. Injection volume 1 µL. Column temperature program: 70 °C (1 min) then increased to 300 °C at a rate of 15 °C/min and held for 5 min, solvent delay: 7 min. Helium (1.0 mL/min) was used as the carrier gas. The spectra were obtained at 70 eV ionization energy; ion source 280 °C; MS transfer line 280 °C; ion source vacuum 10−5 Torr. MS analyses were carried out in TIC (mass range scan: m/z 50– m/z 650; rate: 0.42 scans s−1) and SIM mode.

2.4. Method Validation

Calibrations were carried out with increasing quantity of a mixture of 19 phenolic compound standards to 0.25 mL of acidic water (1% citric acid) containing 200 ng of methyl-heptadecanoate as internal standard. These samples were extracted and derivatized with ECF as described in the previous section.
Calibration plots were carried out in the range of 25–3000 ng/mL (six calibration points). For each concentration tested, three replicate analyses were carried out. The calibration curves were obtained by plotting the ratio between the analyte and the internal standard areas versus the analyte concentration.
Accuracy and precision were evaluated using a blueberry juice spiked with 19 phenolic compounds at two different final concentrations (200 ng/mL and 2000 ng/mL), analyzing five replicates for each concentration in the same day. Spiked and unspiked fruit juice samples were derivatized with ECF and then analyzed by GC-MS.
Standard recovery experiments were used to evaluate the accuracy of the method: The recovery (%) was obtained by comparing the amount found versus the amount added. The same samples were also used to evaluate the precision of the method, expressed as % relative standard deviation (% RSD).
The limit of detection (LOD) and the limit of quantification (LOQ) were determined by the analysis of solutions with decreasing amounts of aromatic carboxylic acids and phenols. For each analyte, LOD was taken at S/N = 3, whereas LOQ was set to S/N = 10.

2.5. Fruit Juice Analysis

Aromatic carboxylic acids and phenols were measured in 12 different commercial fruit juices. Fruit juices were selected among those known to be richest in phenolic compounds: blueberry, pomegranate, apple, grape, and mixed red fruits (goji, raspberry, redberry red currant) [23].
Prior to the extraction/derivatization procedure, 2 mL of fruit juice were clarified by adding 100 mg of inert, insoluble, and highly pure diatomaceous earth (Sartorius) as a filter aid. The mixture was loaded into a 5 mL disposable syringe and filtered to obtain a clear juice. The filtered and unfiltered juices were analyzed by GC-MS to evaluate the effect of the clarification step on the phenolic compound content.

3. Results and Discussion

3.1. GC-MS Characterization of ECF Derivatives

In this paper, we developed a fast analytical method for the determination of free aromatic carboxylic acids and phenols in a selection of commercial fruit juices by using ethyl chloroformate as the derivatizing agent.
Unlike the other derivatizing agents, chloroformates are able to react directly in aqueous media during the extraction step. This derivatization, which occurs at alkaline pH values in the presence of ethanol, is typically very fast and needs pyridine as a catalyst. During the extraction/derivatization procedure, phenol hydroxyl groups are converted into ethoxycarbonyl derivative, whereas carboxyl moieties are converted into ethyl esters (Scheme 1) [24].
Mass spectra analyses of the derivatized molecules show that the molecular ion M+∙ was always present, although with very different relative abundances. This helped with the correct identification of the analyte, considering that most of these spectra are not present in the NIST2017 library, nor in other available public resources.
A typical feature of many of the reported EI mass spectra (Table 1 and Figure S1 in Supplementary Materials) was the presence of an [M-45]+ ion corresponding to the loss of OC2H5 radical from the M+∙ ions. In addition, a peak due to the loss of ethoxycarbonyl radical CO2C2H5 corresponding to the ion [M-73]+ or [M-72]+ (perhaps due to the protonated phenol cation instead of the corresponding cation radical) was also typical of many of these fragmentation patterns.
The analysis of the fragmentation profiles allowed the selection of the target ions to be used for the development of the analytical method. In this case, the selected target ions were always those that had the highest relative abundance (100%).

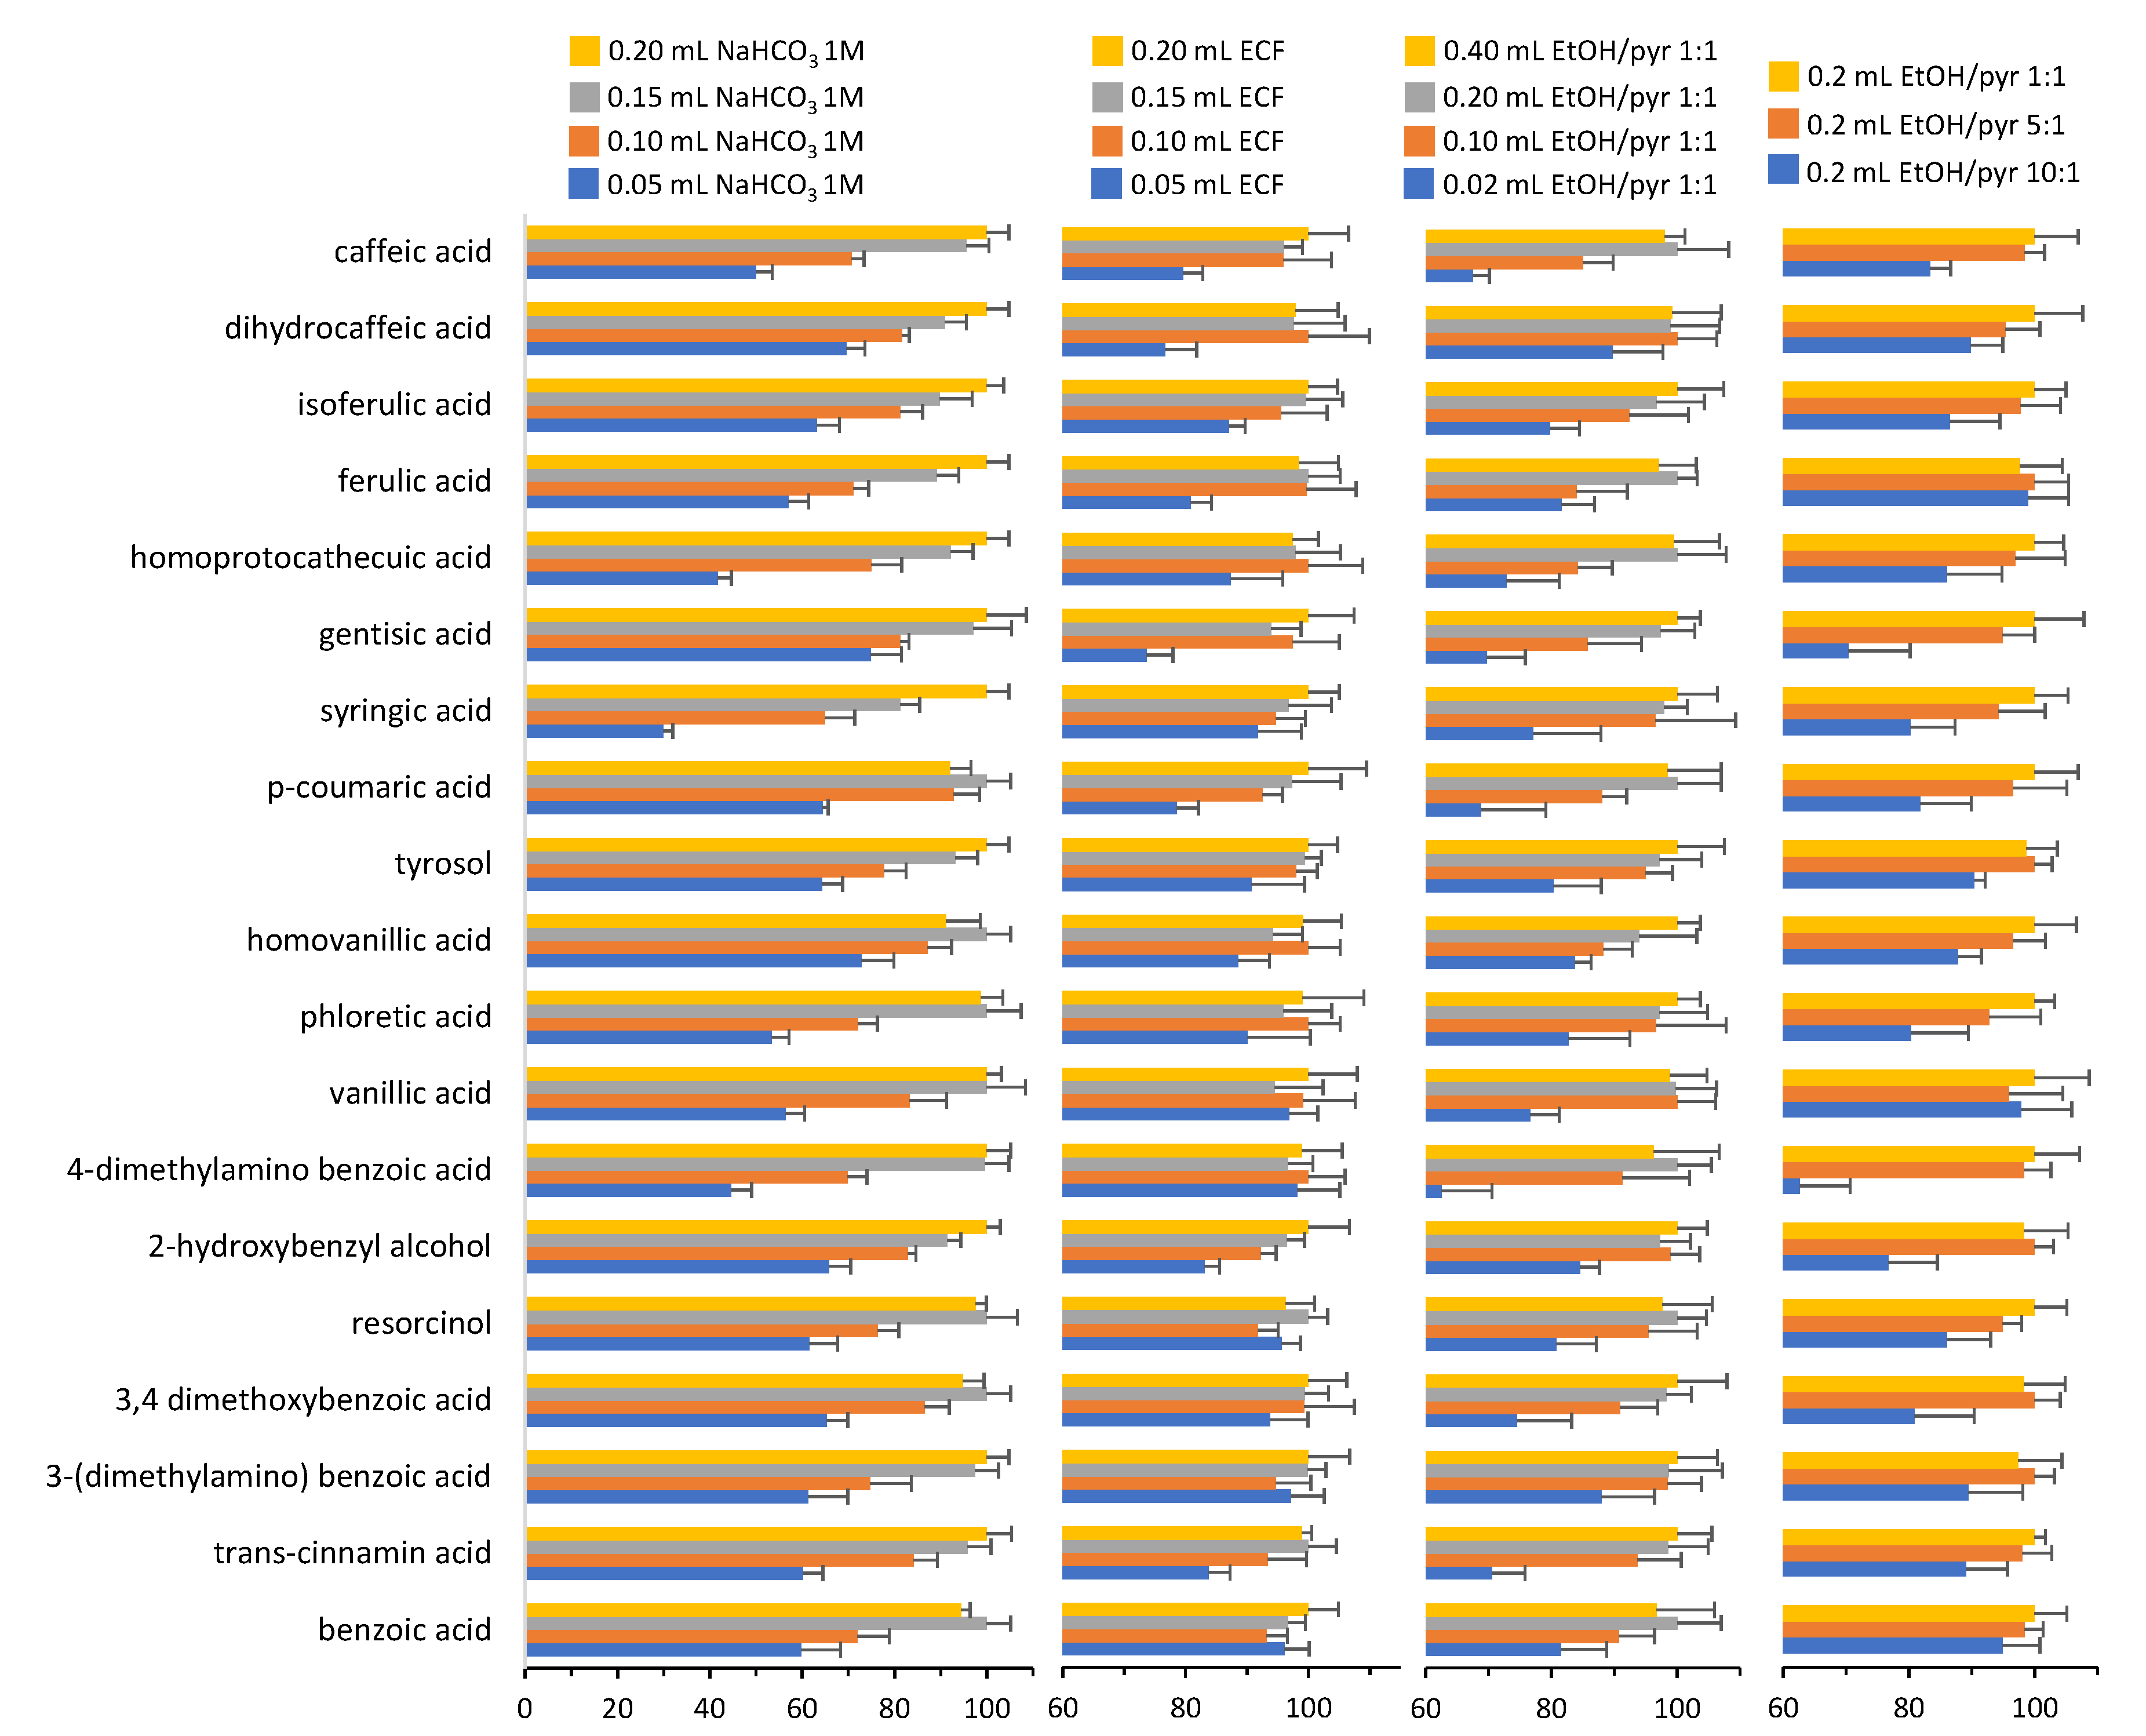
3.2. Optimization of the Method

The analytical method was developed starting from a mixture of standard molecules in the aqueous phase, to which 1% citric acid was added. Citric acid is the most abundant organic acid in fruit juices, and it can interfere in the development of the method, as it carries three carboxylic groups, each of which can react with ECF.
Derivatization with ethyl chloroformate occurs during the extraction process with the organic solvent directly in the aqueous phase at alkaline pH in the presence of pyridine (catalyst) and ethanol. For the development of the analytical method, the optimization of each of these steps was necessary. We selected the following set of conditions to be used as a starting point for method optimization: 0.25 mL aqueous standard mixture containing 1500 ng/mL of each analyte, 50 μL NaHCO3 1 M, 50 μL ethanol:pyridine (1:1), 50 μL ECF in 2 mL hexane, 50 μL IS (methyl heptadecanoate, 4 ng/μL).
Hexane was selected as the extraction solvent based on previous literature reports that clearly show it is particularly suitable for this kind of derivatization [24].
The standard mixture has a pH of approximately 3.5. Since the derivatization reaction occurs in a basic environment, we tested whether bicarbonate concentration could affect the derivatization process and the results are shown in Figure 1.
For all the analytes, the highest response was obtained by adding a four-fold amount of the starting 1 M bicarbonate solution (200 μL vs. 50 μL) (Figure 1). In the development of the method, increasing concentrations of ECF (up to 200 μL) were also tested. The results show that the lowest concentration tested (50 µL) was sufficient for complete derivatization of the analytes (Figure 1). However, considering that fruit juices can have a somewhat variable composition, we decided to use an amount of ECF of 100 μL.
Pyridine acts as a catalyst, and it is necessary for the reaction, whereas ethanol is needed for the esterification of the carboxylic group or alkylation of phenol hydroxyl groups. We tested ethanol/pyridine solutions at different ratios and concentrations and the best derivatization yields were obtained using 200 µL of ethanol/pyridine 1:1 (Figure 1).
We also tested whether a further extraction step could improve the yields. For this purpose, different solvents were used, namely, chloroform, diethyl ether, ethyl acetate, and hexane. Hexane was the best. In this step, we observed that further addition of ethyl chloroformate (20 μL) significantly improved the extraction/derivatization yields for all the tested analytes. On the other hand, no improvement was obtained with a third extraction step.
Once the derivatization method was established, the best chromatographic conditions were selected. The GC oven ramp was adjusted to ensure the best resolution and complete separation of the analytes was achieved within 16 min (Figure 2). The chromatogram shows that there were no peaks related to partially derivatized species.

3.3. Method Validation

For the validation of the analytical method, linearity, precision, and accuracy, LOD and LOQ were determined according to method performance validation guidelines [25]. The results are reported in Table 2.
The linearity of the method was assessed by analyzing standard solution mixtures at six different concentrations for each analyte. The calibration curves were obtained by plotting the ratio analyte/internal standard areas versus analyte concentration after the extraction/derivatization procedure. For most of the analytes, the calibration curves were linear in the range of 25–3000 ng/mL. For all the studied compounds, the linear regression coefficients (R2) were higher than 0.99, which indicates good linearity.
Accuracy, given as the recovery (percentage) of the expected concentration, was tested for each analyte at two concentrations (200 ng/mL and 2000 ng/mL). The recovery was always >95% except for tyrosol (>85%) (n = 3). Concerning precision, all the % RSD values obtained fell within the criteria accepted in bioanalytical method validation, being lower than 10% even when tested on different days (data not shown) [25].
LOD and LOQ were determined to test the sensitivity of the method. As reported in Table 2, LOQ was in the range 25–50 ng for all the analytes (except for p-coumaric acid), whereas the LOD value was always between 12.5 ng and 50 ng. For the following compounds—4-(dimethylamino) benzoic acid, vanillic acid, phloretic acid, tyrosol, homoprotocatechuic acid, ferulic acid, isoferulic acid, and dihydrocaffeic acid—LOQ and LOD values were the same (50 ng). In these specific cases, at S/N = 3, it was not possible to identify these molecules in a reliable way.

3.4. Fruit Juice Analysis

Fruits juices contain several health-promoting factors, including phenolic acids, flavonoids, and vitamins. It is reported that phenolic acids may provide protection against several chronic diseases. Some typical low-molecular-weight aromatic carboxylic acids and phenols have been reported to exert beneficial effects on human health as antioxidant [26,27], antitumor [1,28], anti-inflammatory [29], and anti-microbial agents [9].
According to several literature reports, the fruit juices that have the greatest concentrations of aromatic carboxylic acids and phenols are those derived from berries, pomegranate, and apple [23,30,31]. To evaluate the applicability of the method here developed, as a proof of concept, 12 of these fruit juices were investigated.
Before the extraction/derivatization procedure, all fruit juices were clarified by filtration with diatomaceous earth. This step does not alter the phenolic compound composition of the juices (Figure S2 in Supplementary Materials) but removes the particulates, making sample handling easier (especially for very dense juices such as blueberry).
As shown in Table 3, in the selected commercial juices the percentage of fruit varied from 25% to 100%. Some of them were also made up of a single fruit, whereas others were blends of several fruits. This difference in composition was reflected in the relative content of phenolic compounds. This may have been due to differences in fruit source, ripeness, storage time and conditions, and differences in fresh fruit processing. The data reported in Table 3 are in good agreement with those reported for the fresh fruits and the juices derived therefrom [23,30,31]. This was particularly clear in juices #2 and #9, which had a similar percentage of cranberry (20% and 24%, respectively), which is one of the richest fruits in benzoic and phenolic acids [31,32]. Our results show that they both had a very high quantity of benzoic acid, up to 46 times higher than all the other juices analyzed. Indeed, benzoic acid is the major aromatic carboxylic acid present in fresh cranberry fruit (up to 4.7 g/kg) [31]. To accurately measure this compound, fruit juices #2 and #9 were diluted 25 times. Similarly, other phenolic acids (vanillic acid, p-coumaric acid, syringic acid, and caffeic acid) particularly abundant in this fresh fruit were equally abundant in juices #2 and #9 [33]. Of all the juices analyzed, those containing cranberry had a total concentration of the free aromatic carboxylic acids and phenols tested up to 15 times higher than other juices (three times excluding benzoic acid).
Excluding juices #2 and #9, all the other juices tested had a quantity of free aromatic carboxylic acids and phenols ranging between 3009 and 6424 ng/mL. Some phenolic compounds (2, 3, 6, 14, and 18, Table 1) were not present in any of the juices analyzed and therefore are not reported in Table 3. Although numerous aromatic carboxylic acids and phenols were characterized in the present work, gallic acid (typically present in various fruits and derived juices) was not included, as adequate validation parameters were not met using the extraction/derivatization protocol here developed. Most likely the presence of three adjacent hydroxyl groups made the derivatization procedure of this molecule less efficient.

4. Conclusions

In this paper, we developed a fast analytical method for the analysis of aromatic carboxylic acids and phenols in a selection of commercial fruit juices based on the derivatization of these molecules with ECF. This method is sensitive, specific, and characterized by low LOD and LOQ values. Precision and accuracy are in conformity with the criteria normally accepted in methods validation: The recovery is total with RSD% lower than 10.
The method here reported provides a future blueprint for the development of new GC-MS methods based on chloroformates aimed at the characterization of beverages and food matrices.

Supplementary Materials

The following are available online at https://www.mdpi.com/article/10.3390/separations9010009/s1, Figure S1: Electron impact (70 eV) mass spectra of aromatic carboxylic acids and phenols extracted/derivatized with ECF, Figure S2: Effect of filtration with diatomaceous earth on the content of aromatic carboxylic acids and phenols in blueberry juice.

Author Contributions

Conceptualization, A.I., A.B. (Alessandra Bonamore) and A.M.; methodology, E.D.F. and A.I.; formal analysis, A.I.; investigation, E.D.F. and A.I.; data curation, E.D.F. and A.I.; writing—original draft preparation, A.I., A.M. and A.B. (Alessandra Bonamore); writing—review and editing, A.M., A.B. (Alessandra Bonamore) and A.B. (Alberto Boffi); supervision, A.B. (Alessandra Bonamore) and A.M.; project administration, A.B. (Alessandra Bonamore) and A.M.; funding acquisition, A.M. All authors have read and agreed to the published version of the manuscript.

Funding

This research was funded by Sapienza University of Rome, Ricerche Universitarie 2020, protocol number RP120172A3B1AE3E.

Institutional Review Board Statement

Not applicable.

Informed Consent Statement

Not applicable.

Data Availability Statement

All data related to the manuscript are available in the manuscript and in the Supplementary Information in the form graphs, figures, and tables.

Conflicts of Interest

The authors declare no conflict of interest.

References

  1. Kumar, N.; Goel, N. Phenolic Acids: Natural Versatile Molecules with Promising Therapeutic Applications. Biotechnol. Rep. 2019, 24, e00370. [Google Scholar] [CrossRef] [PubMed]
  2. Olas, B. Berry Phenolic Antioxidants—Implications for Human Health? Front. Pharmacol. 2018, 9, 78. [Google Scholar] [CrossRef] [PubMed]
  3. Godos, J.; Sinatra, D.; Blanco, I.; Mulè, S.; La Verde, M.; Marranzano, M. Association between Dietary Phenolic Acids and Hypertension in a Mediterranean Cohort. Nutrients 2017, 9, 1069. [Google Scholar] [CrossRef] [PubMed] [Green Version]
  4. Rienks, J.; Barbaresko, J.; Oluwagbemigun, K.; Schmid, M.; Nöthlings, U. Polyphenol Exposure and Risk of Type 2 Diabetes: Dose-Response Meta-Analyses and Systematic Review of Prospective Cohort Studies. Am. J. Clin. Nutr. 2018, 108, 49. [Google Scholar] [CrossRef] [PubMed] [Green Version]
  5. Grosso, G.; Stepaniak, U.; Micek, A.; Stefler, D.; Bobak, M.; Pająk, A. Dietary Polyphenols Are Inversely Associated with Metabolic Syndrome in Polish Adults of the HAPIEE Study. Eur. J. Nutr. 2017, 56, 1409–1420. [Google Scholar] [CrossRef] [Green Version]
  6. Salomone, F.; Ivancovsky-Wajcman, D.; Fliss-Isakov, N.; Webb, M.; Grosso, G.; Godos, J.; Galvano, F.; Shibolet, O.; Kariv, R.; Zelber-Sagi, S. Higher Phenolic Acid Intake Independently Associates with Lower Prevalence of Insulin Resistance and Non-Alcoholic Fatty Liver Disease. JHEP Rep. 2020, 2, 100069. [Google Scholar] [CrossRef] [Green Version]
  7. Neveu, V.; Perez-Jimenez, J.; Vos, F.; Crespy, V.; du Chaffaut, L.; Mennen, L.; Knox, C.; Eisner, R.; Cruz, J.; Wishart, D.; et al. Phenol-Explorer: An Online Comprehensive Database on Polyphenol Contents in Foods. Database 2010, 2010, bap024. [Google Scholar] [CrossRef]
  8. Acquavia, M.; Pascale, R.; Foti, L.; Carlucci, G.; Scrano, L.; Martelli, G.; Brienza, M.; Coviello, D.; Bianco, G.; Lelario, F. Analytical Methods for Extraction and Identification of Primary and Secondary Metabolites of Apple (Malus Domestica) Fruits: A Review. Separations 2021, 8, 91. [Google Scholar] [CrossRef]
  9. Kiokias, S.; Oreopoulou, V. A Review of the Health Protective Effects of Phenolic Acids against a Range of Severe Pathologic Conditions (Including Coronavirus-Based Infections). Molecules 2021, 26, 5405. [Google Scholar] [CrossRef]
  10. Lion, Q.; Pichette, A.; Mihoub, M.; Mshvildadze, V.; Legault, J. Phenolic Extract from Aralia nudicaulis L. Rhizomes Inhibits Cellular Oxidative Stresses. Molecules 2021, 26, 4458. [Google Scholar] [CrossRef]
  11. Abotaleb, M.; Liskova, A.; Kubatka, P.; Büsselberg, D. Therapeutic Potential of Plant Phenolic Acids in the Treatment of Cancer. Biomolecules 2020, 10, 221. [Google Scholar] [CrossRef] [PubMed] [Green Version]
  12. Jang, Y.-G.; Ko, E.-B.; Choi, K.-C. Gallic Acid, a Phenolic Acid, Hinders the Progression of Prostate Cancer by Inhibition of Histone Deacetylase 1 and 2 Expression. J. Nutr. Biochem. 2020, 84, 108444. [Google Scholar] [CrossRef] [PubMed]
  13. Godos, J.; Caraci, F.; Micek, A.; Castellano, S.; D’Amico, E.; Paladino, N.; Ferri, R.; Galvano, F.; Grosso, G. Dietary Phenolic Acids and Their Major Food Sources Are Associated with Cognitive Status in Older Italian Adults. Antioxidants 2021, 10, 700. [Google Scholar] [CrossRef]
  14. Hefni, M.E.; Amann, L.S.; Witthöft, C.M. A HPLC-UV Method for the Quantification of Phenolic Acids in Cereals. Food Anal. Methods 2019, 12, 2802. [Google Scholar] [CrossRef] [Green Version]
  15. da Rosa Neng, N.; Sequeiros, R.C.P.; Florêncio Nogueira, J.M. Combining Bar Adsorptive Microextraction with Capillary Electrophoresis-Application for the Determination of Phenolic Acids in Food Matrices. Electrophoresis 2014, 35, 2488. [Google Scholar] [CrossRef] [PubMed]
  16. Rohloff, J. Analysis of Phenolic and Cyclic Compounds in Plants Using Derivatization Techniques in Combination with GC-MS-Based Metabolite Profiling. Molecules 2015, 20, 3431. [Google Scholar] [CrossRef] [Green Version]
  17. Robbins, R.J. Phenolic Acids in Foods: An Overview of Analytical Methodology. J. Agric. Food Chem. 2003, 51, 2866. [Google Scholar] [CrossRef]
  18. Bajkacz, S.; Baranowska, I.; Buszewski, B.; Kowalski, B.; Ligor, M. Determination of Flavonoids and Phenolic Acids in Plant Materials Using SLE-SPE-UHPLC-MS/MS Method. Food Anal. Methods 2018, 11, 3563. [Google Scholar] [CrossRef] [Green Version]
  19. Farrés-Cebrián, M.; Seró, R.; Saurina, J.; Núñez, O. HPLC-UV Polyphenolic Profiles in the Classification of Olive Oils and Other Vegetable Oils via Principal Component Analysis. Separations 2016, 3, 33. [Google Scholar] [CrossRef] [Green Version]
  20. Kalogiouri, N.P.; Mitsikaris, P.D.; Klaoudatos, D.; Papadopoulos, A.N.; Samanidou, V.F. A Rapid HPLC-UV Protocol Coupled to Chemometric Analysis for the Determination of the Major Phenolic Constituents and Tocopherol Content in Almonds and the Discrimination of the Geographical Origin. Molecules 2021, 26, 5433. [Google Scholar] [CrossRef]
  21. Gackowski, M.; Przybylska, A.; Kruszewski, S.; Koba, M.; Mądra-Gackowska, K.; Bogacz, A. Recent Applications of Capillary Electrophoresis in the Determination of Active Compounds in Medicinal Plants and Pharmaceutical Formulations. Molecules 2021, 26, 4141. [Google Scholar] [CrossRef]
  22. Hušek, P. Chloroformates in Gas Chromatography as General Purpose Derivatizing Agents. J. Chromatogr. B. Biomed. Sci. App. 1998, 717, 57. [Google Scholar] [CrossRef]
  23. Mattila, P.; Hellström, J.; Törrönen, R. Phenolic Acids in Berries, Fruits, and Beverages. J. Agric. Food Chem. 2006, 54, 7193. [Google Scholar] [CrossRef]
  24. Di Fabio, E.; Incocciati, A.; Palombarini, F.; Boffi, A.; Bonamore, A.; Macone, A. Ethylchloroformate Derivatization for GC–MS Analysis of Resveratrol Isomers in Red Wine. Molecules 2020, 25, 4603. [Google Scholar] [CrossRef]
  25. Tiwari, G.; Tiwari, R. Bioanalytical Method Validation: An Updated Review. Pharm. Methods 2010, 1, 25. [Google Scholar] [CrossRef] [PubMed]
  26. Piazzon, A.; Vrhovsek, U.; Masuero, D.; Mattivi, F.; Mandoj, F.; Nardini, M. Antioxidant Activity of Phenolic Acids and Their Metabolites: Synthesis and Antioxidant Properties of the Sulfate Derivatives of Ferulic and Caffeic Acids and of the Acyl Glucuronide of Ferulic Acid. J. Agric. Food Chem. 2012, 60, 12312. [Google Scholar] [CrossRef] [PubMed]
  27. Kiokias, S.; Proestos, C.; Oreopoulou, V. Phenolic Acids of Plant Origin—A Review on Their Antioxidant Activity In Vitro (O/W Emulsion Systems) Along with Their in Vivo Health Biochemical Properties. Foods 2020, 9, 534. [Google Scholar] [CrossRef] [PubMed]
  28. Gomes, C.A.; Girão da Cruz, T.; Andrade, J.L.; Milhazes, N.; Borges, F.; Marques, M.P.M. Anticancer Activity of Phenolic Acids of Natural or Synthetic Origin: A Structure−Activity Study. J. Med. Chem. 2003, 46, 5395. [Google Scholar] [CrossRef] [Green Version]
  29. Su, X.; Zhang, J.; Wang, H.; Xu, J.; He, J.; Liu, L.; Zhang, T.; Chen, R.; Kang, J. Phenolic Acid Profiling, Antioxidant, and Anti-Inflammatory Activities, and MiRNA Regulation in the Polyphenols of 16 Blueberry Samples from China. Molecules 2017, 22, 312. [Google Scholar] [CrossRef]
  30. Cieślik, E.; Gręda, A.; Adamus, W. Contents of Polyphenols in Fruit and Vegetables. Food Chem. 2006, 94, 135. [Google Scholar] [CrossRef]
  31. Zuo, Y.; Wang, C.; Zhan, J. Separation, Characterization, and Quantitation of Benzoic and Phenolic Antioxidants in American Cranberry Fruit by GC−MS. J. Agric. Food Chem. 2002, 50, 3789. [Google Scholar] [CrossRef] [PubMed]
  32. Macheix, J.-J.; Fleuriet, A.; Billot, J. Fruit Phenolics, 1st ed.; CRC Press: Boca Raton, FL, USA, 2018; ISBN 9781351072175. [Google Scholar]
  33. Pei, K.; Ou, J.; Huang, J.; Ou, S. P -Coumaric Acid and Its Conjugates: Dietary Sources, Pharmacokinetic Properties and Biological Activities. J. Sci. Food Agric. 2016, 96, 2952. [Google Scholar] [CrossRef] [PubMed]
Scheme 1. Derivatization of p-coumaric acid with ethyl chloroformate.
Separations 09 00009 sch001
Figure 1. Effect of NaHCO3, ECF, and ethanol/pyridine concentrations on the derivatization of aromatic carboxylic acids and phenols. Values are the mean ± SD of three independent extraction/derivatization experiments. Values are reported as %.
Separations 09 00009 g001
Figure 2. GC-MS-SIM chromatogram of a standard mixture of aromatic carboxylic acids and phenols derivatized with ECF.
Separations 09 00009 g002
Table 1. Retention time (RT), retention index (RI), and main ions present in the mass spectra of ECF derivatives of phenolic compounds.
No.CompoundRT (min)RIM+∙Ions, m/z (% Relative Abundance)
1Benzoic acid5.951179.1150 (6)105 (100); 122 (50); 77 (49); 51 (17)
2Trans-cinnamic acid8.661480.2176 (32)131 (100); 103 (48); 77 (29); 147 (16)
33-(dimethylamino)benzoic acid9.821622.4193 (97)164 (100); 165 (40); 192 (32); 120 (26)
43,4-dimethoxybenzoic acid10.181670.7210 (75)165 (100); 182 (25); 79 (14); 166 (12)
5Resorcinol10.951774.0254 (3)110 (100); 82 (10); 111 (8); 81 (8); 182 (8)
62-hydroxybenzyl alcohol11.161802.4268 (1)106 (100); 78 (55); 107 (27); 77 (16); 196 (11)
74-(diethylamino)benzoic acid11.631872.0221 (31)206 (100); 178 (27); 176 (19); 150 (14)
8Vanillic acid11.891910.5268 (7)151 (100); 196 (50); 168 (36); 152 (15); 123 (12)
9Phloretic acid11.991925.3266 (11)120 (100); 107 (96); 123 (32); 135 (30); 194 (21)
10Homovanillic acid12.371981.5282 (8)137 (100); 210 (29); 138 (11); 165 (8)
11Tyrosol12.512002.4282 (1)120 (100); 107 (18); 121 (18); 192 (14); 91 (11)
12P-coumaric acid12.812051.3264 (16)147 (100); 120 (45); 192 (44); 164 (20); 91 (18)
13Syringic acid13.052090.4298 (5)226 (100); 181 (73); 198 (31); 225 (15); 211 (14)
14Gentisic acid13.552171.7326 (1)136 (100); 164 (36); 182 (28); 135 (22); 137 (18)
15Homoprotocatechuic acid13.802213.3340 (2)123 (100); 196 (43); 151 (27); 224 (13); 122 (12)
16Ferulic acid13.902230.9294 (21)222 (100); 177 (59); 150 (53); 145 (34)
17Isoferulic acid14.062258.9294 (48)222 (100); 177 (93); 150 (52); 147 (28)
18Dihydrocaffeic acid14.452327.3354 (4)136 (100); 123 (65); 210 (48); 135 (47); 164 (32)
19Caffeic acid15.192462.0352 (5)208 (100); 163 (90); 136 (56); 180 (52); 134 (44)
Table 2. Validation parameters.
CompoundRange (ng/mL)SlopeInterceptR2LOQ (LOD)
(ng/mL)
Concentration
(ng/mL)
Accuracy
(Recovery %)
Precision
(RSD %)
Benzoic acid25–30000.00010.05750.995225
(12.5)
200103.917.16
2000101.058.96
Trans-cinnamic acid50–30000.0003−0.00970.998550
(25)
200102.872.97
2000104.058.44
3-(dimethylamino)
benzoic acid
25–30000.0003−0.00180.996825
(12.5)
20098.896.38
200097.767.04
3,4-dimethoxybenzoic acid25–30000.00030.00310.999325
(12.5)
200101.828.90
200097.517.43
Resorcinol25–30000.00180.00760.999725
(12.5)
200100.944.53
200099.872.75
2-hydroxybenzyl alcohol25–30000.00120.02520.999425
(12.5)
20099.867.41
2000101.608.20
4-(dimethylamino)
benzoic acid
50–30000.0006−0.02000.998750
(50)
20096.258.47
200097.675.04
Vanillic acid50–30000.0004−0.00750.999750
(50)
200101.306.25
2000100.137.95
Phloretic acid50–30000.0004−0.03460.996550
(50)
20096.569.33
200095.161.74
Homovanillic acid50–30000.0010−0.03660.998450
(25)
20099.345.39
200095.132.44
Tyrosol50–30000.0006−0.06540.995850
(50)
20086.977.94
200085.127.46
P-coumaric acid100–30000.0003−0.05610.9932100
(50)
200102.858.35
200098.783.64
Syringic acid25–30000.00020.00150.999925
(12.5)
200102.244.13
2000104.653.46
Gentisic acid50–30000.0004−0.03200.997650
(25)
200102.648.42
2000103.969.09
Homoprotocatechuic acid50–30000.0004−0.04250.995150
(50)
20098.455.44
2000100.685.12
Ferulic acid50–30000.0001−0.01360.996750
(50)
20098.133.41
2000102.142.90
Isoferulic acid50–30000.0001−0.00980.996650
(50)
20099.685.62
2000102.163.86
Dihydrocaffeic acid50–30000.0002−0.02620.993350
(50)
200101.054.49
200098.906.32
Caffeic acid25–30000.0003−0.01860.997225
(12.5)
20098.715.80
200098.492.24
Table 3. Fruit juice analysis (values are the mean of two measurements). Juices #2 and #9 were analyzed after dilution.
Fruit Juices
Number#1#2#3#4#5#6#7#8#9#10#11#12
Fruit Content (%)4010040501002550100100100100100
Composition (%)100% Blueberry48% Red Grape
32% Blueberry
20% Cranberry
100% Blueberry51% Pomegranate
49% Apple
100% Pomegranate84% Red Grape
8.4% Raspberry
4% Strawberry
3.6% Elder
100% Red Grape100% Apple66% Red Grape
24% Cranberry
10% Goji
100% Apple100% White Grape74% Pomegranate
23% Apple
3% Red Grape
Benzoic acid133448976864542869645947210563763210114691220
3,4-dimethoxy
benzoic acid
12199nd458088nd48ndnd58nd
Resorcinolndndndndndndndndndnd8440
4-(dimethylamino)
benzoic acid
nd188ndndnd10629098247105793nd
Vanillic acid4501160199199305360183199125097167114
Phloretic acidnd408ndndnd2404922305141981223nd
Homovanillic acidndndndndndndnd98nd96ndnd
Tyrosol305323282300336328289256335274ndnd
P-coumaric acid79936318377847337309807225550599nd578
Syringic acid20161576675741175463891239011093586
Homoprotocatechuic acid365385351334379nd368361479334589365
Ferulic acidndndndndndndnd463810435474nd
Isoferulic acid392597459328385nd279nd1112nd302396
Caffeic acid64210226614032363474653021180256626258
Total (ng/mL)64245836543283009344033904682500576141460458203057
Publisher’s Note: MDPI stays neutral with regard to jurisdictional claims in published maps and institutional affiliations.

