

Water-Based Microwave-Assisted Extraction of Pigments from Madder Optimized by a Box–Behnken Design


1
Institut de Chimie Organique et Analytique, Université d’Orléans, CNRS, UMR 7311, BP6759, 45067 Orléans, France
2
Terre de Couleur, 6 rue de Châtenay, 37210 Rochecorbon, France
3
Centre de Biophysique Moléculaire, Université d’Orléans, CNRS, UPR 4311, 45071 Orléans, France
*
Author to whom correspondence should be addressed.
Separations 2023, 10(8), 433; https://doi.org/10.3390/separations10080433
Submission received: 20 June 2023
/
Revised: 26 July 2023
/
Accepted: 29 July 2023
/
Published: 30 July 2023
(This article belongs to the Special Issue Separation, Extraction and Purification of Natural Products)
Abstract
:Water is one of the greenest and most accessible solvents. To harness its potential, the water-based microwave-assisted extraction (MAE) of pigments from madder was optimized by the response surface methodology (RSM) using a Box–Behnken experimental design. The extract that presented both the highest extraction yield and the most intense color was obtained after a 30-s cycle at 1000 W using 100 mg of madder for 20 mL of water. This water-based MAE was more efficient than Soxhlet extraction and proved comparable to hydroalcoholic MAE. The optimized extract was further characterized using UHPLC-HRMS/MS to identify its main compounds. Glycosylated flavonoids and anthraquinones were putatively identified, as well as free anthraquinones, generally found in madder. The microwave-assisted extraction extended the range of polarity of the extracted compounds, making the water more versatile.
1. Introduction
The search for safe, efficient, eco-sustainable products in the cosmetic industry has led to an ever-growing interest in plant secondary metabolites. Although synthetic pigments have long been preferred for their price, resistance, and brightness [1], nowadays, natural pigments are regaining popularity as they are deemed safer for human health and the environment [2,3]. To ensure the sustainability and the quality of the ingredients, it is critical to develop efficient green extraction methods. Natural solvents and eco-responsible extraction methods can save time, energy, and solvent consumption while maintaining high extraction yields and performance [4,5].
Madder (Rubia tinctorum L.) is one of the oldest dye plants as evidence of its use dates back to Ancient Egypt [6]. Its roots give a distinctive red dye due to its high content of anthraquinones [6,7]. Madder pigments are especially suitable for the green transition as they display good stability under washing, UV, and temperature [1,8,9].
Conventionally, madder pigments are extracted by Soxhlet extraction using hydroalcoholic solvents [6,10]. The succession of extraction cycles with a recycled solvent allows the exhaustion of the plant and a high yield compared to maceration or simple reflux. However, Soxhlet extraction uses high extraction temperatures and usually lasts several hours. Due to its time, energy, and solvent consumption, it is not considered a green extraction process [11]. Moreover, the use of hot ethanol or methanol has been associated with the formation of 2-ethoxymethyl and 2-methoxymethyl artefacts, notably lucidin ethyl ether, a mutagenic compound [6,12].
Different techniques have been developed over the years to limit the use of organic solvents in the extraction process [4]. Water-based extraction is one of them, since water is accessible, inexpensive, non-toxic, and has virtually no impact on the environment [5,13]. As such, water can be considered one of the greenest and most practical solvents [4,5]. Nevertheless, water is often overlooked because of its high polarity, which limits the solubility of most secondary metabolites [5,13]. It is mainly effective to extract polar to very polar compounds when used with conventional extraction methods [3,13]. Alternative extraction methods such as subcritical water extraction or microwave-assisted extraction (MAE) have been proposed as suitable for water-based extraction [13]. It was shown that the high temperature and pressure conditions of these methods decrease the water polarity, thus enabling the extraction of lower-polarity compounds [3,14,15].
To the best of our knowledge, the only extractions of anthraquinones from Rubiaceae species carried out without any organic solvent are subcritical water extractions [14,16]. The only reports of MAE for the extraction of anthraquinones from Rubiaceae have used hydroalcoholic solvents [11].
This study aimed to develop and optimize the water-based microwave-assisted extraction (w-MAE) of Rubia tinctorum pigments. The response surface methodology (RSM) was used to develop the extraction method with the minimum time and solvent consumption. The effects of the microwave power, plant/water ratio, and extraction time were determined. The optimized extract was compared to hydroalcoholic Soxhlet extraction and MAE in order to assess the impact of the solvent on the extraction. Lastly, it was characterized using ultra-high-performance liquid chromatography coupled to high-resolution tandem mass spectrometry (UHPLC-HRMS/MS) to identify the main compounds responsible for the color. To the best of our knowledge, this is the first occurrence of w-MAE extraction for the pigments of madder.
2. Materials and Methods
2.1. Plant Material, Standards, and Chemicals
Terre de Couleur (Rochecorbon, France) provided the plant material in the form of powdered roots of Rubia tinctorum L. (reference GAR11, lot n°H21000493) from Cailleau’s herbalist store (Chemillé-en-Anjou, France).
Alizarin standard was purchased from Extrasynthèse (Genay, France). Sodium carbonate was purchased from Merck (Val de Fontenay, France). Glucose, mannose, maltotriose, maltopentose, maltoheptaose, α-naphtyl, and Folin–Ciocalteu reagent came from Sigma-Aldrich (Darmstadt, Germany). HPLC-grade ethanol absolute and formic acid were purchased from VWR (Fontenay-sous-Bois, France) and sulfuric acid from Carlo Erba (Val de Reuil, France), while acetonitrile (ACN) and gallic acid came from Honeywell (Saint-Germain en Laye, France). Milli-Q water was produced on a Milli-Q EQ 7000 water purification system from Merck (Darmstadt, Germany).
2.2. Extraction
2.2.1. Microwave-Assisted Extraction
Microwave-assisted extraction (MAE) was performed on a Milestone MicroSYNTH 56 microwave oven monitored by the easyCONTROL command. The weighed sample of plant material and 20 mL of purified water or hydroalcoholic solvent (EtOH/water 50/50) were introduced in a 50 mL reactor. The microwave power was applied in a continuous manner. The pressure and temperature limits of the reactor were 15 bar and 180 °C.
MAE was optimized using the response surface methodology (RSM). The effects of the number of cycles (X1), microwave power (X2, W), and plant/solvent ratio (X3, mg/20 mL of water) on the extraction yield Y% (Y (%) = 100 x mgextract/mgmadder) were studied simultaneously using a three-level Box–Behnken design (Table 1). Preliminary experiments (not displayed here) were run to choose the levels of each factor. The duration of each cycle was set at 30 s to avoid overheating, and the reactor was cooled in ice for 10 min between cycles. The maximum temperature for each cycle was monitored as it could have had a quantitative or qualitative impact on the composition of the extracts.
Box–Benhken was chosen over other quadratic models for its efficiency in a limited number of experiments [17]. The design was constructed, randomized, and analyzed using the Ellistat software, version 6.4 (Poisy, France). Seventeen extracts were obtained, including 4 center points (Table 2).
To predict the optimal level for each variable, a quadratic polynomial model was fitted to correlate the relationship between the variables and response. The fitness of the polynomial equation obtained was verified using the coefficient of determination (R2) and residuals. The significance of the model was tested using ANOVA. The effects were considered significant when their p-value was below 0.05.
The number of cycles (1, 3, or 5), power (200, 600, or 1000 W), and plant to water ratio (100, 550, or 1000 mg/20 mL) depended on the experimental design (Table 1). The extraction was followed by vacuum filtration on sintered glass and lyophilization to recover dried extracts and measure the extraction yields.
For comparison, an extraction was conducted with EtOH/water 50/50 using the optimized parameters from the experimental design. The extract was obtained with 5 cycles at 1000 W and 550 mg/20 mL of solvent. The extract was filtered under a vacuum on sintered glass. Ethanol was evaporated using a rotary evaporator (Buchi, Labortechnik AG, Flawil, Switzerland) with a water-bath temperature of 40 °C. The extract was then lyophilized to measure the extraction yield.
2.2.2. Reference Extractions
Soxhlet extraction was performed as a reference. First, 2.5 g of madder was extracted in a 25 × 80 mm cellulose extraction thimble using 100 mL of EtOH/water (50/50) at boiling temperature for 4 h.
Ethanol was evaporated using a rotary evaporator (Buchi, Labortechnik AG, Switzerland) with a water-bath temperature of 40 °C and the remaining water was lyophilized. The recovered dry extract was weighed and its yield was calculated.
The maceration of 2.5 g of madder in 100 mL of EtOH/water (50/50) at 30 °C for 24 h was performed. It was compared to the optimized extract to ensure that the compounds were not degraded during MAE.
2.3. UV Spectroscopy
The extracts were solubilized at 10 mg/mL in EtOH/water (50/50) and then diluted in water to 0.5 mg/mL. UV spectroscopy analysis was performed between 300 and 700 nm on a UV-1800 spectrophotometer from Shimadzu (Illkirch, France), controlled by the UVProbe 2.33 software.
2.4. Estimation of Carbohydrate Content
Carbohydrates were separated on HPTLC silica gel 60 F254 plates from Merck (Darmstadt, Germany) with an ACN/water 75/25 eluent and developed using Molisch reagent. Two solutions were prepared for the derivatization. Solution A contained α-naphtol at 2 g/100 mL in EtOH and solution B was 5% H2SO4 in EtOH. A mix of D-glucose, mannose, maltotriose, maltopentose, and maltoheptaose at 5 mg/mL was prepared in Milli-Q water. The standard mix (2 µL) and each extract (5 µL) were spotted using the automatic sampler 4 from CAMAG (Moirans, France). The plate was then eluted for 14 min until 70 mm on a CAMAG automatic developing chamber 2 (ADS 2). After drying, the plate was developed with the two solutions of Molisch reagent using the CAMAG derivatizer and then placed on the TLC plate heater for 5 min at 120 °C. Carbohydrates were revealed as blue-violet spots in visible light and glycosylated polyphenols as orange spots near the solvent front.
2.5. Quantification of Total Phenolic Content and Anthraquinones
2.5.1. Total Phenolic Content Determination
Total phenolic content (TPC) was determined using the Folin–Ciocalteu assay on a 96-well plate, as described by Grigoras et al. [18]. Extracts were solubilized in EtOH/water (50/50) at 10 mg/mL. A gallic acid standard solution was prepared at 0.6 mg/mL in EtOH to obtain calibration curve solutions ranging from 0.05 to 0.6 mg/mL. Gallic acid or extract (20 µL) was deposited in triplicate and 10 µL of Folin–Ciocalteu reagent was added. The plate was then kept in the dark at room temperature for 8 min before adding 30 µL of aqueous sodium carbonate (20%) and 140 µL of Milli-Q water. The plate was incubated for 2 h in the dark at room temperature, shaken, and then read at 760 nm on a CLARIOstar PLUS plate reader from BMG Labtech (Champigny sur Marne, France). Results are given in mg of gallic acid equivalent/g of extract using a linear equation based on the calibration curve of gallic acid (y = 25.493x − 0.0529, R2 = 0.98).
2.5.2. Total Anthraquinone Determination
The anthraquinone content of the different extracts was determined by UV spectrophotometry at 425 nm. Extracts were prepared in EtOH/water (50/50) at 0.5 mg/mL. An alizarin standard at 3 mg/mL in EtOH was diluted in water to prepare calibration standard solutions (0.01–1 mg/mL). Each solution of alizarin was then diluted 20 times in water, giving a final concentration range of 0.5–50 µg/mL. Three independent extracts were analyzed and the average was calculated. Results are given in mg of alizarin equivalent/g of extract using a linear equation based on the calibration curve of alizarin (y = 14.931x + 0.0381, R2 = 0.99).
A Tukey’s range test was used to group extracts that had flavonoid or anthraquinone content that was not significantly different at 95%. The test was conducted using the Ellistat software.
2.6. UHPLC-ESI-QTOF Analysis
Chromatographic separations were performed on an Ultimate 3000 RSLC system equipped with an autosampler, a binary pump, a thermostated column compartment, and a DAD detector (Thermo Fisher Scientific, Waltham, MA, USA). The stationary phase was a Luna® Omega C18 (150 × 2.1 mm; 1.6 µm) column (Phenomenex, Le Pecq, France). A gradient elution (3–95% B in 15 min before re-equilibrating) was achieved at 0.5 mL/min with water (A) and ACN (B) both acidified with 0.1% formic acid.
MS and MS/MS experiments were performed on a maXis UHR-Q-TOF mass spectrometer (Bruker, Bremen, Germany) with an electrospray ion source (ESI), in both negative and positive ionization modes, as they provided complementary data. The nebulizing gas pressure was set to 2 bar, and the dry gas flow rate was 9.0 L/min at 200 °C. The capillary voltage was set at 1800 V in negative ionization mode and 4500 V in positive ionization mode. Mass spectra were summed during 500 ms in the m/z range 50–1650. All the MS data were processed using the DataAnalysis software, version 4.4 (Bruker). Molecular formulae were generated using the SmartFormula algorithm with an elemental composition of C, H, O to an infinite number and N ≤ 1 with mass accuracy ≤ 3 ppm and were submitted to the SciFinder, PubChem, Lotus and Knapsack databases in order to propose compound structures.
Auto MS acquisition was used for MS/MS experiments with 3 precursors in the m/z range 150–1200. In MS/MS−, the collision energy was set to 25–35 eV. Two collision energies were applied in MS/MS+: 32.5 eV in the m/z range 150–370 to fragment flavonoids and anthraquinones and 10 eV in the m/z range 371–1200 to break the C-O glycosidic bonds in glycosylated flavonoids and anthraquinones, which are weaker than intramolecular C-C and heterocyclic bonds.
3. Results and Discussion
3.1. Optimization of Extraction Parameters
To optimize the extraction, a Box–Behnken experimental design was performed. The number of cycles, microwave power, and plant to water ratio were used as variables (Table 1). The extraction yield used as a response ranged from 12.3% to 22.9%. Table 3 shows the analysis of variance of the quadratic model. The regression model was highly significant (p = 0.0000), indicating high accuracy. The regression coefficient (R2) was 98.3%, adjusted to 96.1%, showing a satisfactory correlation between the predicted and experimental results. The model was fitted to correlate the relationship between the yield (Y) and extraction parameters (X1, X2, X3) (Equation (1)).
Yield = 0.1612 − 0.01685 × X1 − 7.43 × 10−05 × X2 + 3.466 × 10−05 × X3 + 0.003563 × X1X1 + 1.249 × 10−07 × X2X2 − 5.589 × 10−08 × X3X3 − 5.618 × 10−07 × X1X2 − 2.174 × 10−06 × X1X3 + 3.219 × 10−08 × X2X3.
The number of cycles (X1, p = 0.035) significantly affected the yield. The microwave power (X2, p = 0.0550) and plant to water ratio (X3, p = 0.2025) did not have any significant effect on the yield, while their interaction did (X2X3, p = 0.0464). Quadratic terms X1X1 (p = 0.0099), X2X2 (p = 0.0017), and X3X3 (p = 0.0272) also affected the yield. The predicted highest yield was 22.8%, obtained with five cycles, 1000 W, and 496 mg of madder for 20 mL of water. These parameters were close to those of extract 16 of the experimental design, obtained with five cycles, 1000 W, and 550 mg/20 mL, which afforded the highest yield at 22.9%.
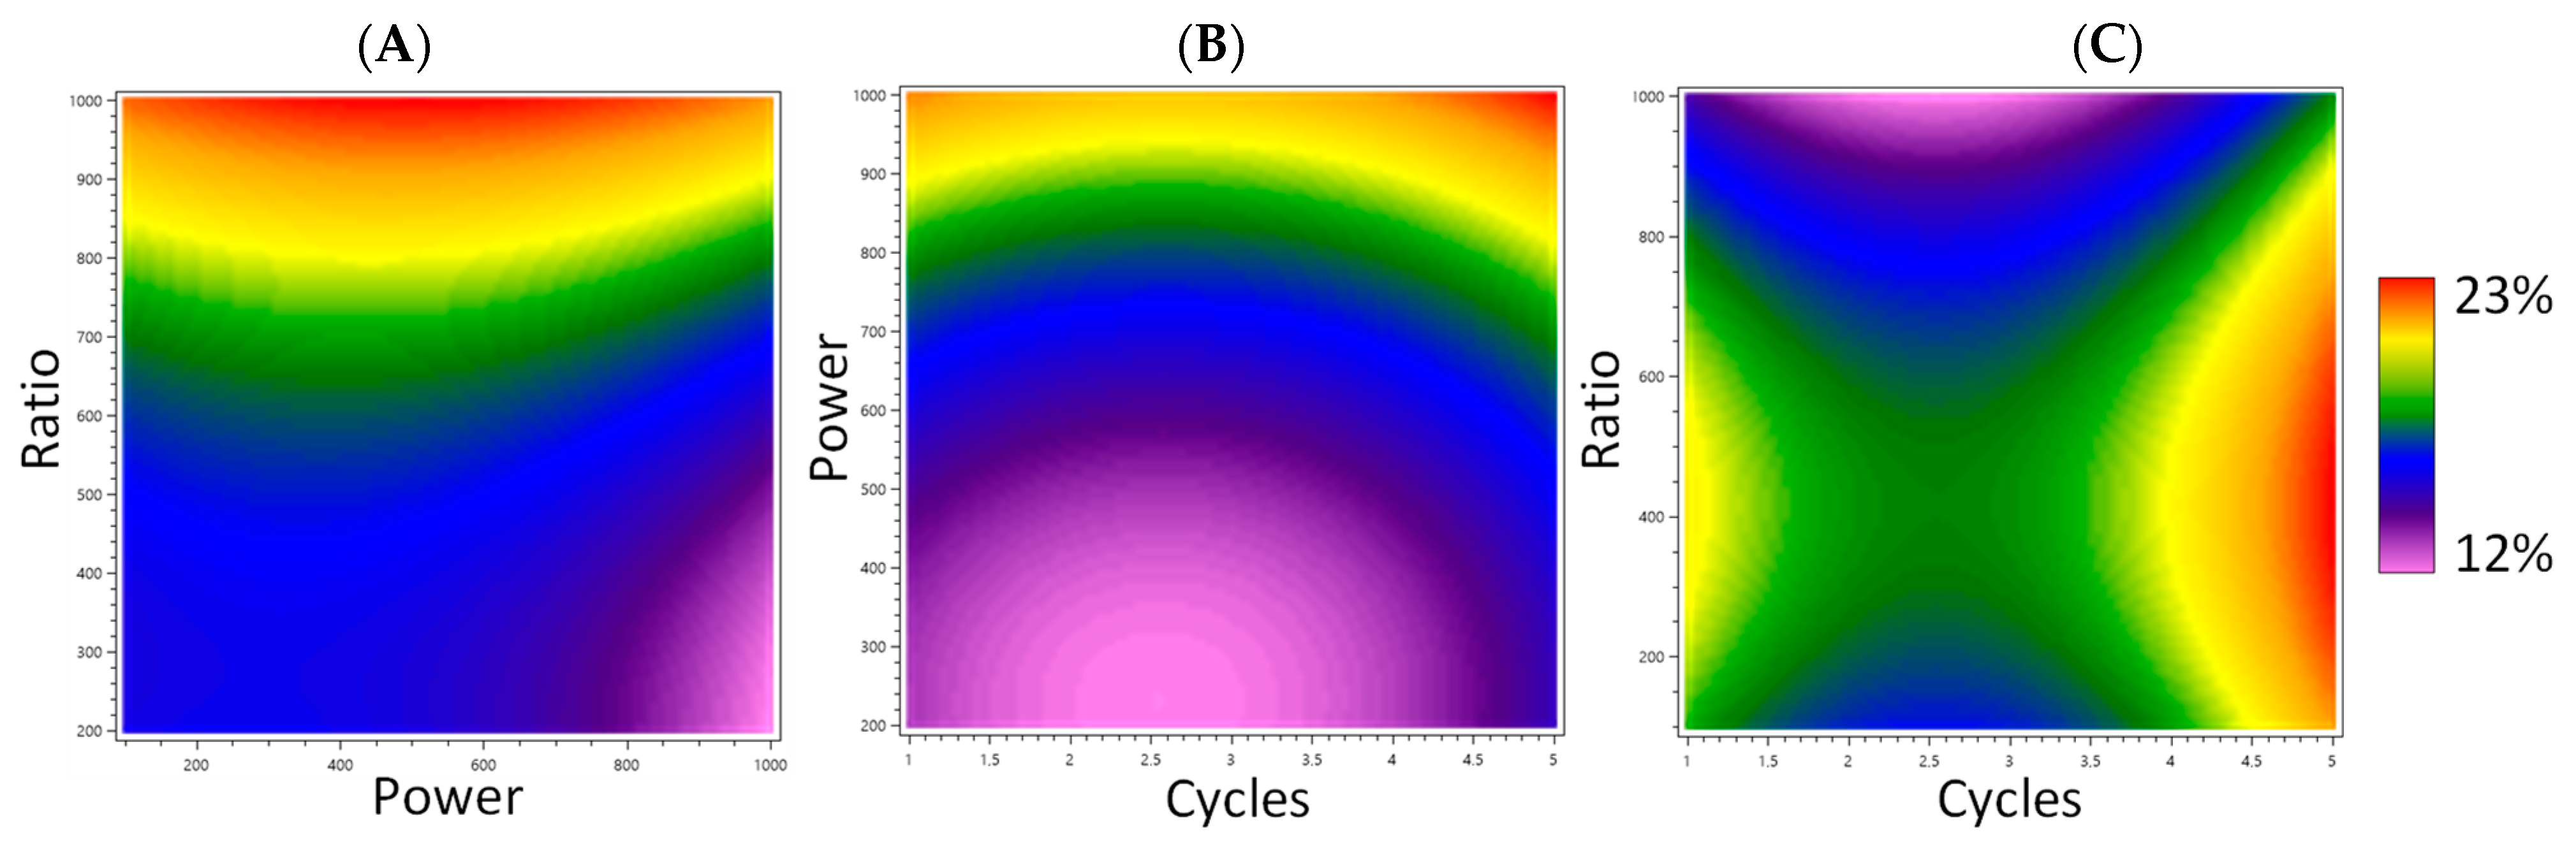
The number of extraction cycles and consequently the extraction time are generally associated with a higher yield up to a certain limit [15]. In this method, the extraction time was short (30 to 150 s) because the continuous microwave radiation caused the rapid heating of the medium. The multiplication of short cycles allows the extraction of more compounds while preventing the overheating and degradation of the compounds [15]. In the model prediction, power was not a significant parameter (p = 0.0550). However, its p-value was close to the limit of acceptability (p = 0.05) and an increase in the yield was observed when the microwave power increased. This can be explained by its correlation with the extraction temperature [15], which has been shown to have a positive influence on the yield in the MAE of anthraquinones [19,20]. To optimize the yield, a medium plant to water ratio was preferable. Water causes the plant to swell during extraction, thus increasing the surface exchange [20]. Moreover, too much plant material would hinder the homogenization of the absorption of microwaves by the medium and the solvent could be saturated [15]. This is represented in Figure 1 by the response surface plot, showing the effects of the water ratio, number of cycles, and microwave power on the extraction yield.
3.2. Influence of Extraction Parameters on the Color of Extracts
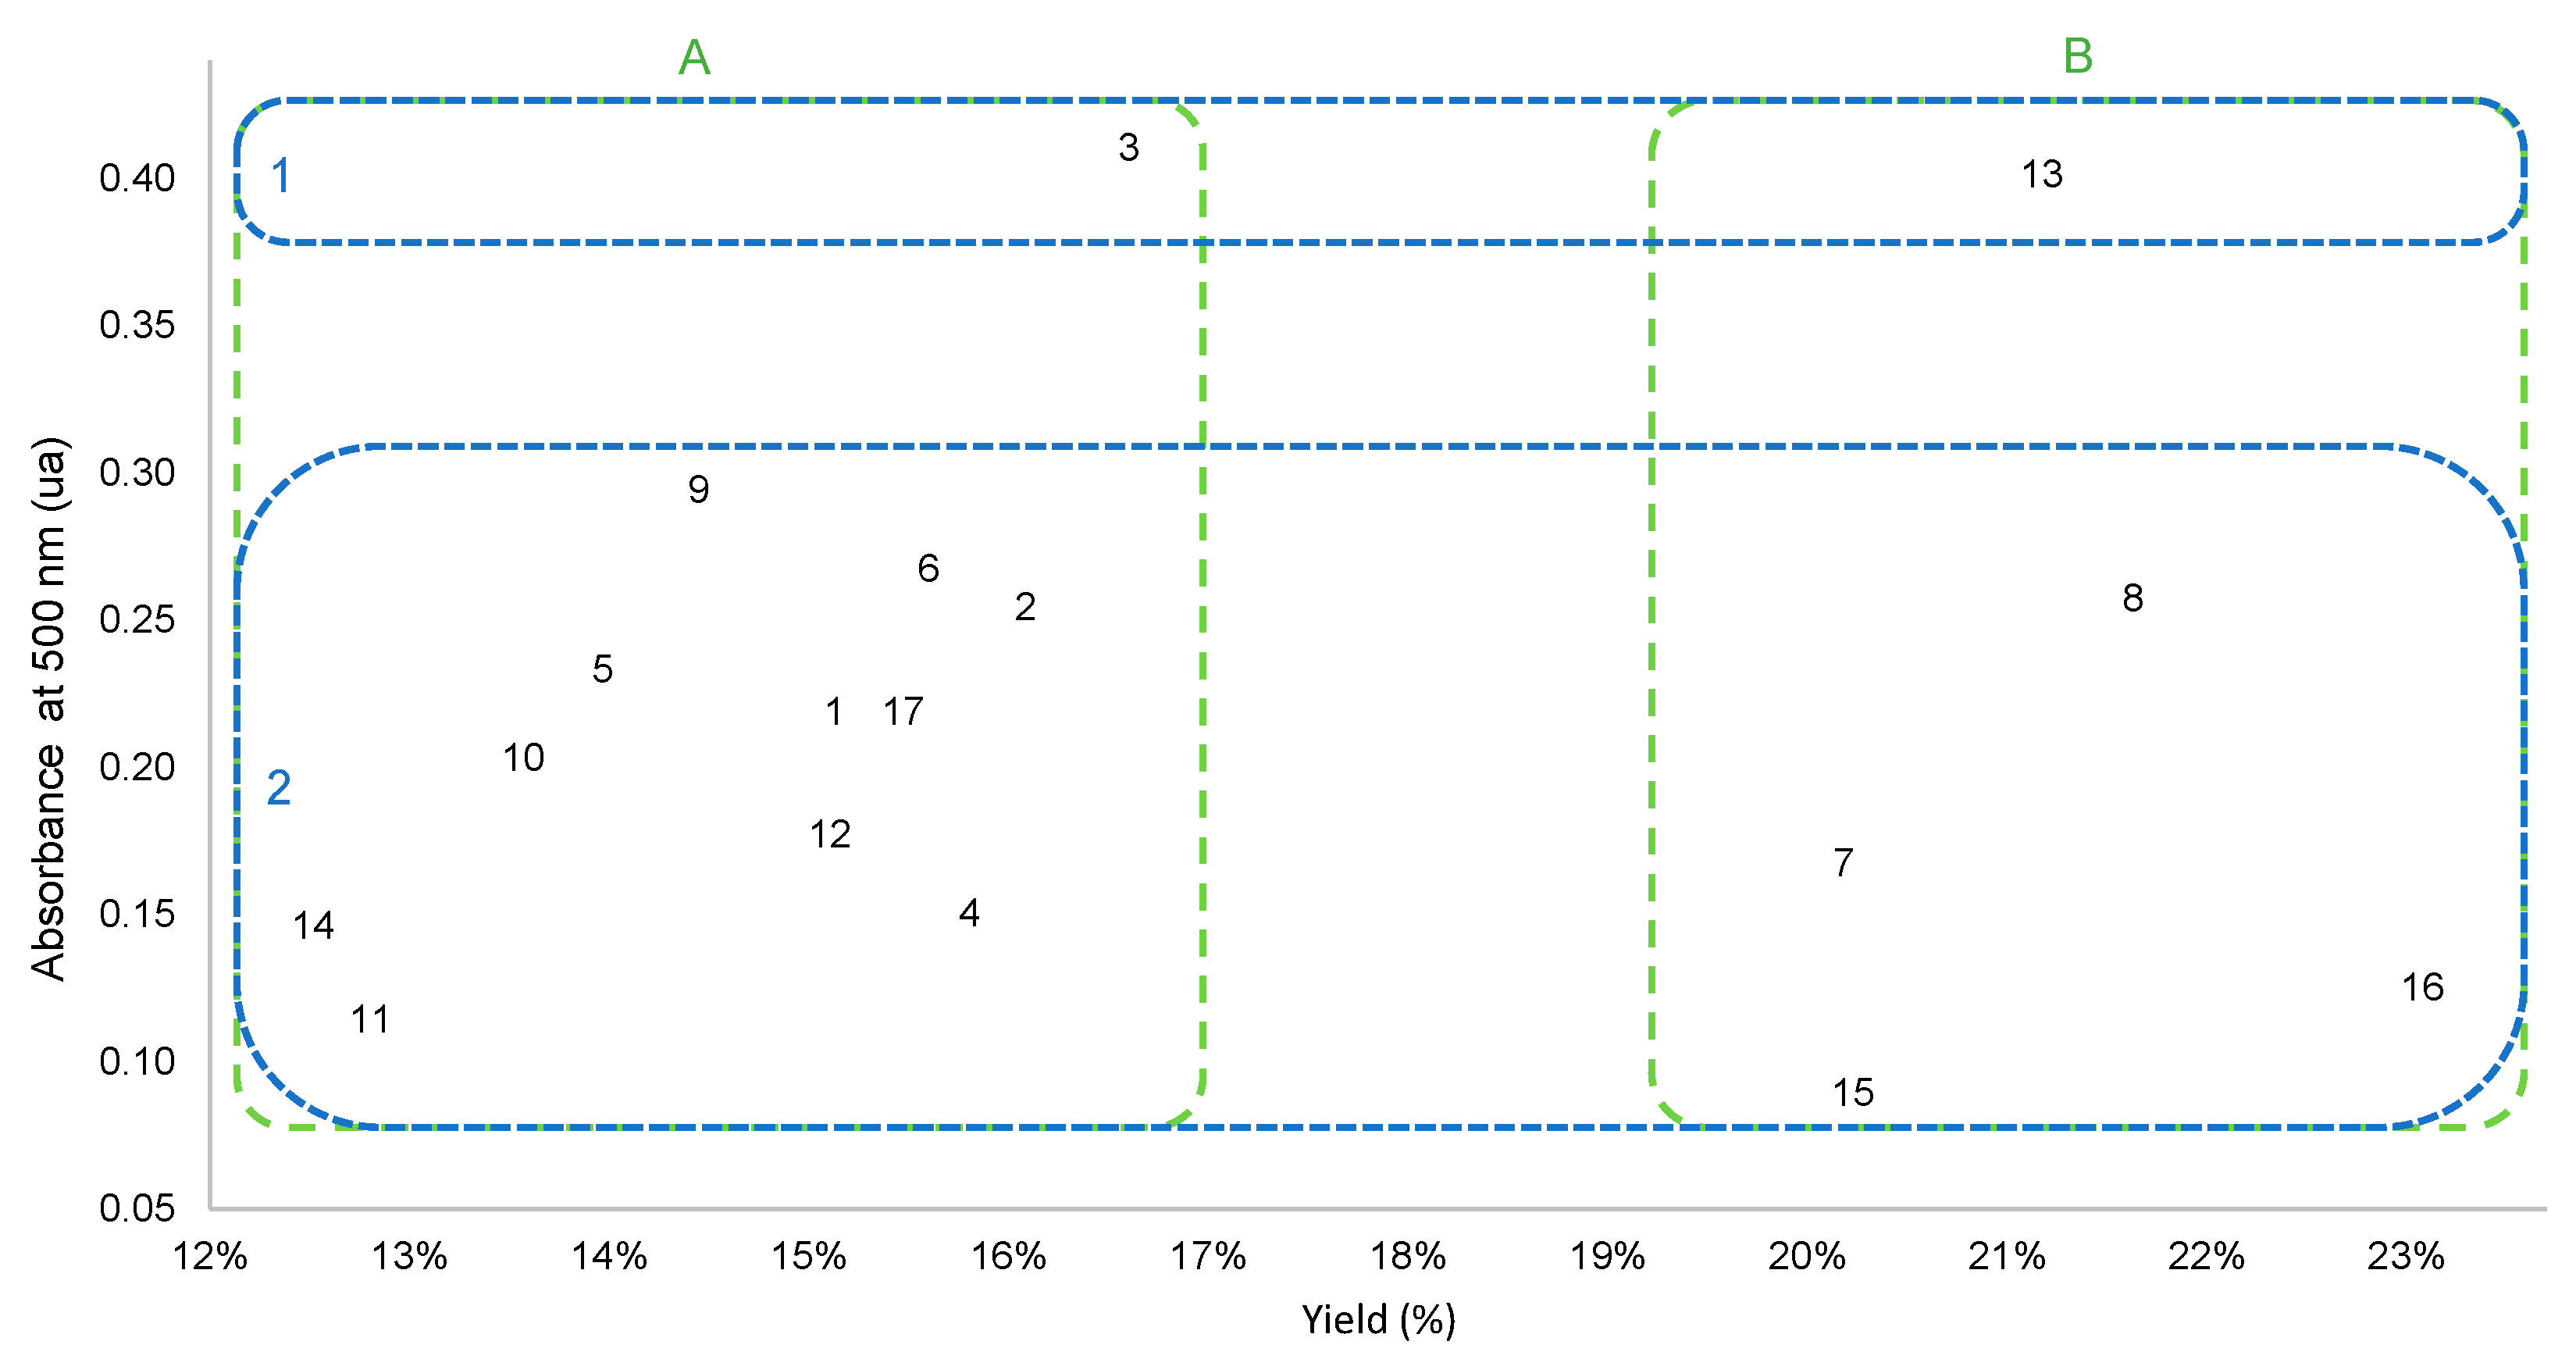
The color of the extracts varied from pale yellow to bright orange. The color intensity of each extract was compared using UV spectrophotometry at 500 nm (the characteristic wavelength of anthraquinones). A scatter plot of the yield against the absorbance of the extracts is presented in Figure 2. No correlation was observed between the two. Thus, both needed to be considered to select the optimized extraction parameters. The scatter plot highlighted four clusters.
Most extracts yielded less than 17% and had absorbance at 500 nm below 0.30 at 0.5 mg/mL (Figure 2, cluster A2). Remarkably, all extracts obtained with 1000 W power (extracts 7, 8, 13, 15, and 16; Figure 2, cluster B) gave higher yields (above 20%).
As previously mentioned, extract 16 had the best yield (almost 23%), but its absorbance was in the lower range, while two extracts (3 and 13) had higher absorbance (Figure 2, cluster 1). Extracts 3 and 13 had, respectively, absorbance of 0.411 ua and 0.402 ua, while other extracts ranged between 0.090 ua and 0.295 ua. Compared to extract 3, extract 13 had a higher yield (21.0% instead of 16.4%). It was the only extract that had both high absorbance and a high yield (Figure 2, cluster B1). The extraction parameters of extract 3 were five cycles, 200 W, and 1000 mg/20 mL, and those of extract 13 were one cycle, 1000 W, and 100 mg/20 mL. Extract 3 was obtained under low power and a high plant to water ratio. This combination of low power and a high ratio resulted in a low yield (Figure 1), most likely caused by the slower and less effective extraction. However, these parameters allowed good selectivity towards the pigments. Thus, five extraction cycles were necessary to obtain an intense color using these parameters, while extract 13 was obtained in only one cycle (30 s). Extract 13 was obtained with high power, causing harsh temperature and pressure conditions and a low plant to water ratio, which increased the surface exchange [15]. These parameters resulted in quick extraction, as only one cycle was needed. Extracts 8 and 16 were the only extracts with a higher yield than extract 13. However, their absorbances were much lower (Figure 2, cluster B). The three extracts were obtained at 1000 W, but one cycle was used for extract 13, and five cycles were used for extracts 8 and 16. This implies that a longer extraction time allowed the recovery of other non-colored compounds, probably polar primary metabolites, highly soluble in water at high temperatures. To evaluate the performance of the water-based microwave extraction in terms of yield and color, extracts 13 and 16 were compared to reference hydroalcoholic extracts.
3.3. Comparison with Hydroalcoholic Reference Extractions
The extraction yield and color of the optimized extracts were compared to those obtained by Soxhlet extraction and MAE using a hydroalcoholic solvent (EtOH/water 50/50). Soxhlet extraction was selected as the reference since it is frequently used in the literature for the extraction of madder anthraquinones [6,10]. Hydroalcoholic MAE (16 EtOH/w) was carried out under the same conditions as extract 16, which presented the highest yield, in order to assess the impact of the solvent.
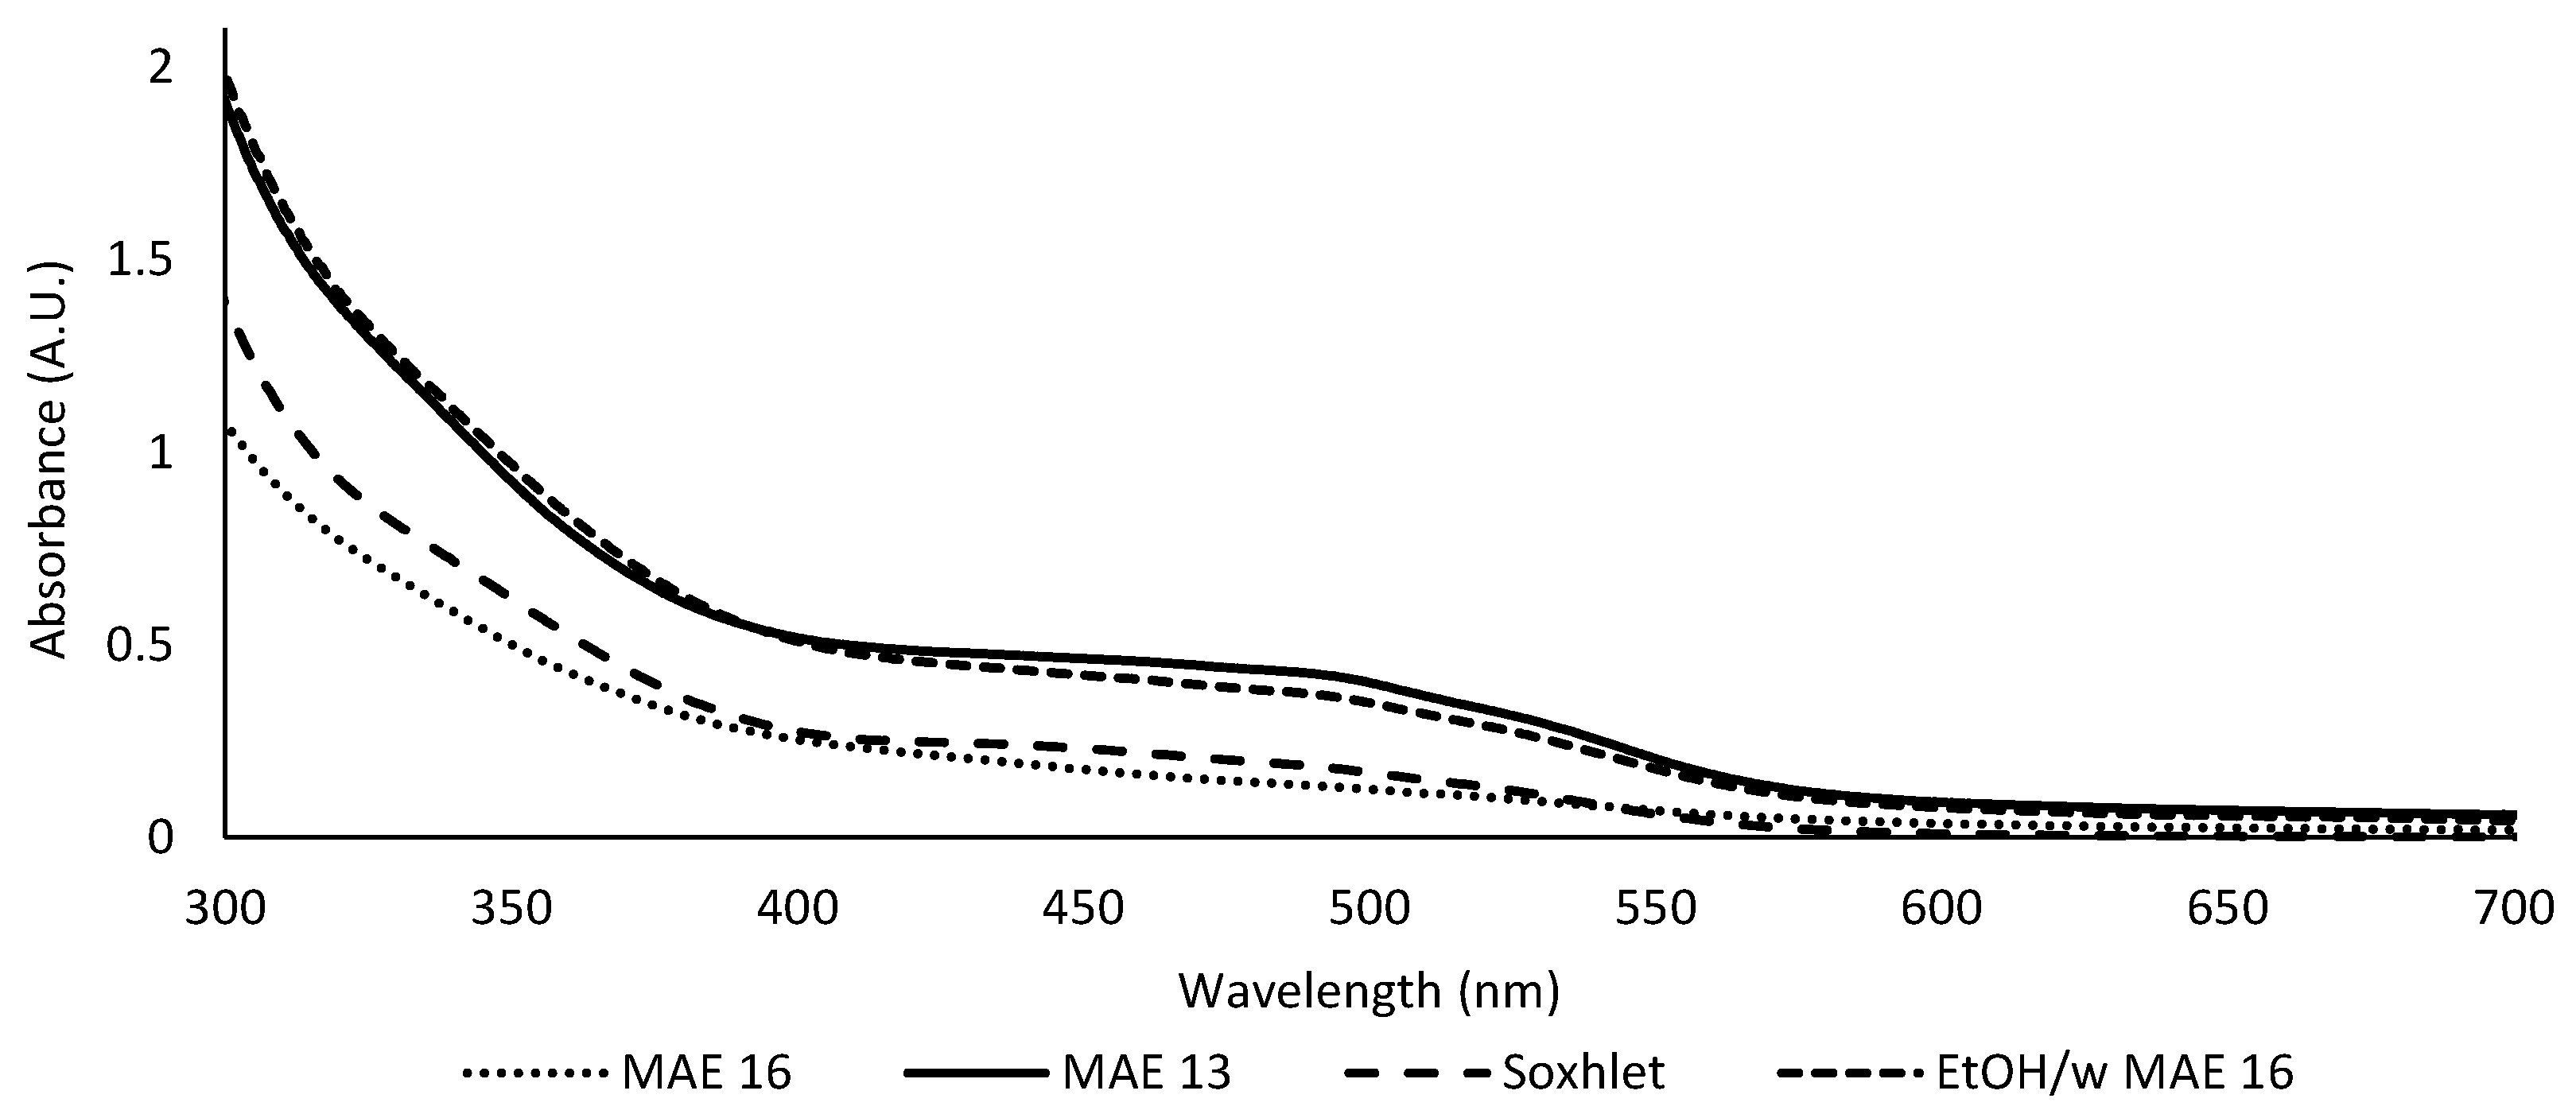
Figure 3 presents the absorbance spectrum of each extract recorded between 300 and 700 nm.
Table 4 groups the extraction yield and absorbance at 500 nm of the optimized w-MAE extracts and reference extracts. The repeatability of the MAE extraction process was also evaluated with three independent replicates of extracts 13, 16, and 16 EtOH/w. The extraction process showed suitable repeatability, with a low coefficient of variation (CV) on the yield (CV ≤ 5%), and enabled the comparison of the extracts. The Soxhlet extract yielded 14.1%, which is low compared to the range obtained in w-MAE (12.6–22.9%). In fact, the yields of 12 out of 16 MAE extracts were higher, including extracts 13 and 16. The Soxhlet extract was also weaker in terms of color, despite the hydroalcoholic solvent (Figure 3). The absorbance of the Soxhlet extract and of extract 16 was, respectively, 0.17 ua and 0.16 ± 0.01 ua (Table 4). Extract 16 EtOH/w (20.7 ± 0.4%) was comparable to extract 13 both in terms of yield (respectively, 20.7 ± 0.4% and 21.5 ± 0.5%) and absorbance at 500 nm (respectively, 0.31 ± 0.09 ua and 0.35 ± 0.05 ua) (Table 4). These results show that the hydroalcoholic solvent did not improve the extraction of pigments compared to the optimized water extraction. This may be because the extraction of most pigments had been attained. Indeed, after the extraction of extracts 13 and 16 EtOH/w, the plant residue exhibited a pale brown color instead of its original orange-red color. Moreover, extract 16 also displayed a comparable yield (21.6 ± 1.1%), but with significantly lower absorbance at 500 nm (0.16 ± 0.01 ua).
MAE was more efficient than Soxhlet extraction regardless of the solvent used. This can be explained by the properties of MAE. Microwaves cause dipole rotation and ionic conduction both in the solvent and in the sample, which help to generate heat faster and to increase the solubility and diffusivity of compounds [3,15]. Thus, in MAE, the heat transfers more rapidly and homogeneously than in Soxhlet extraction, helping the extraction process [3]. Because the pressure is higher in MAE, the boiling temperature of water is high and it is possible to reach higher extraction temperatures [15].
Moreover, as MAE is very fast, it could cause less degradation of the molecules while still increasing the extraction efficiency. To ensure that no degradation occurred during the MAE, it was also compared to hydroalcoholic maceration at 30 °C for 24 h. This maceration yielded 14%, similar to Soxhlet extraction. The chromatographic profiles of the optimized MAE extract and the hydroalcoholic maceration were compared. Similar chemical profiles were observed and no sign of degradation of the compounds was detected in MAE, most likely because of the shortness of each extraction cycle. Following these results, the phytochemical comparison focused on MAE extracts.
3.4. Detection of Metabolites
To understand the differences between the three microwave extracts, their carbohydrate, flavonoid, and anthraquinone content was evaluated. Flavonoids and anthraquinones are colored compounds present in Rubia tinctorum [6,21]. Carbohydrates, however, could increase the yield because of their high solubility in water, with no impact on the color [9].
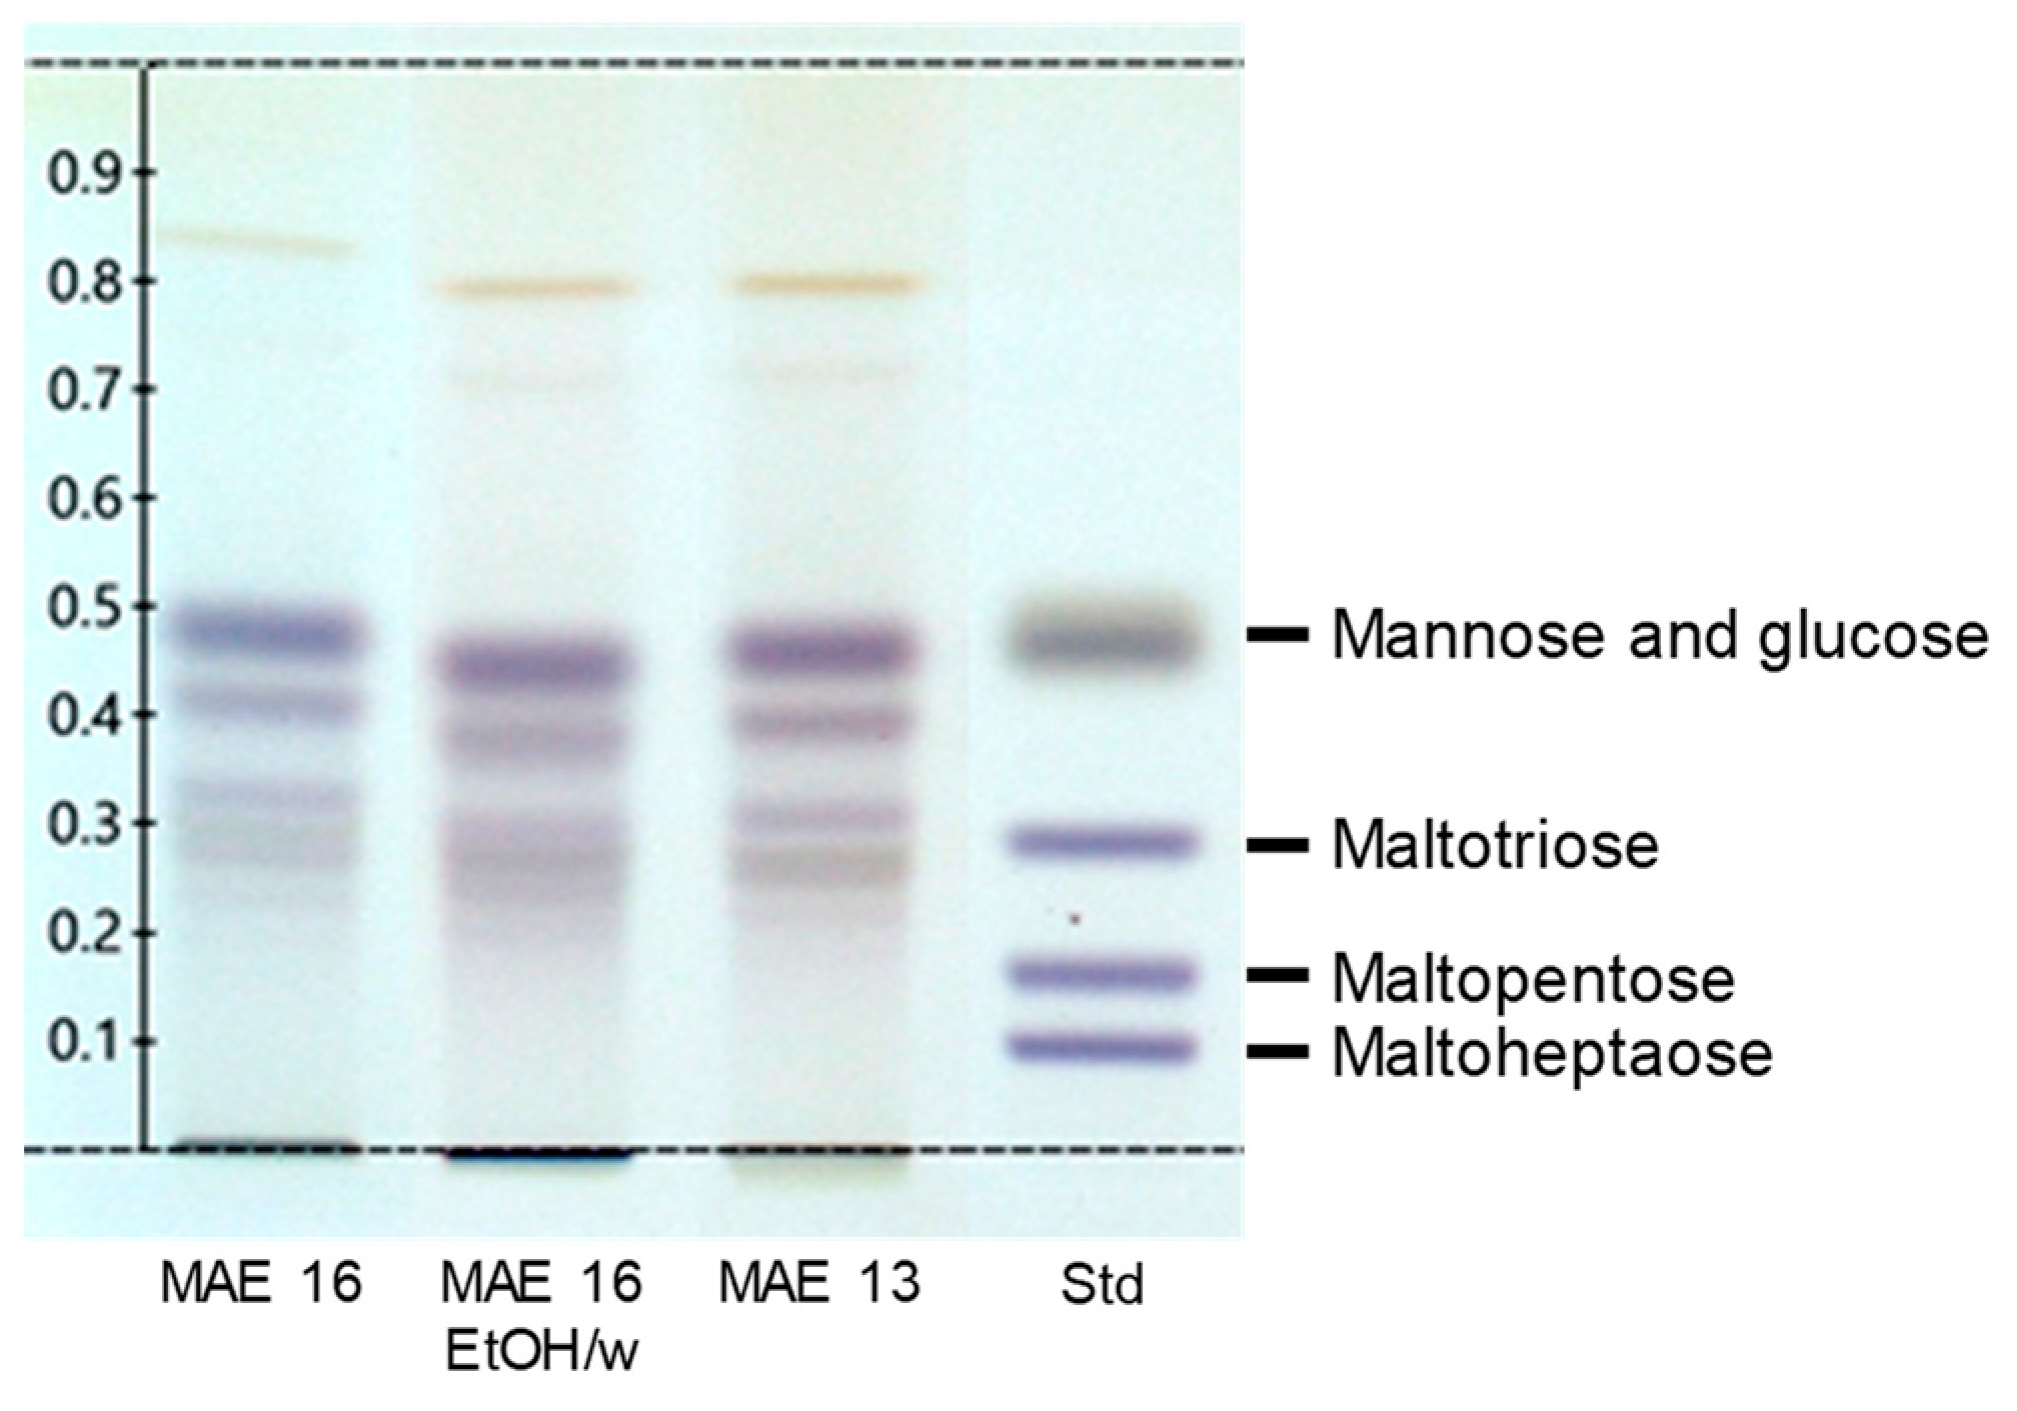
HPTLC was used to detect carbohydrates in the extracts (Figure 4). Standards of monosaccharides (glucose and mannose) were visible as a large spot at Rf = 0.47. Oligosaccharides (maltotriose, maltopentose, and maltoheptaose) were separated into three spots at Rf = 0.29, Rf = 0.17, and Rf = 0.09, respectively. The extracts had the same profile, with quite similar intensity of the TLC spots. They were rich in sugars, with a large spot of monosaccharides at Rf = 0.46, one at Rf = 0.40 that could have been a disaccharide, and two or three others at 0.32 < Rf < 0.28 that could have been trisaccharides and tetrasaccharides. There was no distinct spot at Rf < 0.2 corresponding to penta-, hexa-, or heptasaccharides. However, some non-eluted compounds were revealed on the spotting line that could have been polysaccharides. The presence of glycosylated polyphenols was also observed at Rf = 0.81, which is conventional in Rubia tinctorum extracts. Madder root contains flavonoids and anthraquinones in their glycosylated and free forms [7].
Total polyphenolic and anthraquinone content was assessed by UV–visible spectrophotometry, respectively, in gallic acid and alizarin equivalents (Table 5). Extract 16 had significantly lower content (23.9 ± 4.9 mg alizarin eq/g) of anthraquinones than extracts 13 and 16 EtOH/w (45.4 ± 11.1 mg alizarin eq/g and 48.8 ± 11.5 mg alizarin eq/g). The pale yellow color of extract 16 most likely came from this lack of anthraquinones. The same could be observed for the total phenolic content. Extracts 16 EtOH/w and 13 were significantly higher (respectively, 21 ± 2 and 21 ± 4 mg gallic acid equivalent/g) than extract 16 (15 ± 1 mg gallic acid equivalent/g). In both cases, extracts 13 and 16 EtOH/w were not significantly different from each other. Again, adding the alcohol had the same influence on the extraction as optimizing the parameters.
Extracts 13 and 16 were obtained using the same power (1000 W) but with, respectively, one cycle at 100 mg/20 mL and five cycles at 500 mg/20 mL. The difference was therefore caused either by the number of cycles or by the plant to water ratio. At 1000 W, one cycle seemed to be sufficient to extract anthraquinones without saturating the water with other compounds such as primary metabolites, while the repetition of the extraction cycle and an increase in plant quantity could improve the extraction of non-colored compounds.
3.5. Characterization of the Pigments
Extract 13, which presented the best combination of yield and color, was characterized by UHPLC-DAD-HRMS/MS to identify its main compounds. The exact masses of the molecules were obtained and molecular formulae were proposed with a 3 ppm mass tolerance for MS and 10 ppm for MS/MS or small m/z values. The [M+Na]+ adduct ion and the comparison of positive and negative ionization were used to confirm the proposed formulae. A hypothesis for the identification of each compound’s data was obtained from the literature and public databases (SciFinder, Pubchem, KNapSack, and HMBD). The retention time, m/z, fragmentation characteristics, lambda max, proposed molecular formula, and proposed identification are summarized in Table 6.
Compound 1 was detected in positive mode at m/z 355.0989. The proposed formula was C16H18O9. It corresponds to chlorogenic acid, a compound previously described in madder [22]. A characteristic fragment detected at m/z 163.0385 matched the formula C9H7O3 corresponding to the caffeic acid derivative obtained after the breaking of the ester bond.
Compounds with RT between 5 and 8 min (2–9) were identified as glycosylated compounds based on their typical fragmentation patterns. The most frequently described sugar moieties in Rubia tinctorum are xylose, rhamnose, and glucose, which correspond to losses of 132 u, 146 u, and 162 u, respectively. Disaccharides containing these three sugars, such as xylose–glucose (294 u) and rhamnose–glucose (308 u), are also frequent [22].
Compound 2 was identified in MS− at m/z 593.1135 with fragments at m/z 549.1213 and 255.0224 and corresponding, respectively, to the loss of [CO2]− (44 u) and xylose–glucose (294 u). The proposed formula was C26H26O16, which could correspond to galiosin, a glycosylated anthraquinone found in R. tinctorum [6].
Fragmentation of compounds 3 to 6 led to the same genin at m/z 301 (MS/MS−) and m/z 303 (MS/MS+). The proposed formula for this genin was C15H10O7, which corresponds to quercetin. A few quercetin glycosides have been previously described in madder [22,23].
Compound 3 was detected in negative and positive mode at m/z 741.1845 and 743.2041. The proposed formula for compound 3 was C32H38O20. Only the positive mode allowed the detection of three fragments at m/z 611.1614, 465.1093, and 303.0526 after the losses of 132 u, 146 u, and 162 u corresponding to the successive losses of xylose, rhamnose, and glucose. Based on the most prevalent glycosides found in R. tinctorum, compound 3’s sugar moiety could be formed of xylose, rhamnose, and glucose, which has never been described before in Rubia tinctorum. However, this fragmentation pattern also corresponds to Calabricoside A, a quercetin derivative found in another Rubiaceae, Putoria calabrica [24].
Compound 4 was detected in negative and positive mode at m/z 595.133 and 597.1459. The proposed formula for compound 4 was C26H28O16. Two fragments corresponding to the losses of xylose and glucose at m/z 465.0962 and 303.0471 were observed in positive mode. This form of glycosylated quercetin has not been previously found in Rubia tinctorum, but it is consistent with other glycosylated flavonoids of the plant. Moreover, compound 4 could correspond to quercetin-3-sambubioside, which was previously described in another Rubiaceae, Hedyotis diffusa [25].
Compound 5 was identified at m/z 609.1472 in negative mode and 611.1608 in positive mode, resulting in a proposed formula of C27H31O16. Fragmentation led to quercetin at m/z 301.0331 (MS/MS−) and 303.0511 (MS/MS+) after the loss of rhamnose and glucose. Compound 5 was identified as rutin, a known glycosylated quercetin of madder [22].
Compound 6 was detected in negative and positive mode at m/z 463.0874 and 465.1019 and fragmented in MS+ into m/z 303.0511 after the loss of 162 u. The proposed formula for compound 6 was C21H20O12. Quercetin glucoside has not been previously described in madder, but hyperoside, a quercetin galactoside, has [22]. In fact, hyperoside is the only compound containing galactoside that we found in the literature for this plant. Compound 6 was putatively identified as hyperoside.
Compounds 7 and 8 were identified, respectively, at m/z 563.1394 and 563.1414 in negative mode. Two fragments were detected for compound 7 at m/z 269.0399 after the loss of glucose and xylose and m/z 251.0335 after the subsequent loss of H2O (18 u). Compound 8 was fragmented into m/z 269.0432 after the loss of xylose and glucose. The proposed formula for both compounds 7 and 8 was C26H28O14. The proposed formula for the genin was C15H10O5, which was identified as either lucidin or apigenin. The lambda max of the compound was used to propose the identification of the compounds (Table 6). Compound 7 had a UV profile that corresponded to a flavonoid structure and was putatively identified as a glycosylated derivative of apigenin. Apigenin is the only flavonoid from Rubia tinctorum with this formula [23]. However, this particular glycosylated apigenin was not reported in any of the databases that we searched. Compound 8 showed a lambda max at 416 nm, corresponding to anthraquinone. It was identified as lucidin primveroside, an anthraquinone previously described in R. tinctorum [6].
Compound 9 was detected in negative and positive mode at m/z 577.1564 and 579.1695. The proposed formula for compound 9 was C27H30O14. One MS/MS- fragment was identified at m/z 269.0496 after the loss of 308 u corresponding to rhamnose and glucose. Compound 9 had the same genin and a similar λmax to compound 8 and was putatively identified as a new glycosylated form of lucidin.
Compound 10 was detected in negative and positive mode at m/z 301.0332 and 303.0503. The proposed formula was C15H10O7, which corresponds to quercetin. Numerous fragment ions were observed both in the positive and negative ionization modes, and the fragmentation pattern observed was consistent with the literature [26,27]. Quercetin has never been identified in madder, but its glycosylated forms have [22,23].
While compounds 1–9 were mostly glycosylated anthraquinones and flavonoids, compounds eluted after 8 min were mostly identified as free anthraquinones. The identification of anthraquinones was facilitated by their fragmentation pattern in negative ionization mode. Most anthraquinones displayed a loss of 28 u, corresponding to the fragmentation of the ketone ([CO]−). Those that had an acid group also displayed a loss of 44 u ([CO2]−), as described in the literature [28,29].
Compounds 11, 12, 13, 16, and 19 were identified in negative mode at m/z 299.0173, 283.0229, 267.0283, 239.0338, and 253.0495. Fragments corresponding to the consecutive loss of 44 u and 28 u in any order were detected for all these compounds. The proposed formulae for compounds 11, 12, 13, 16, and 19 were C15H8O7, C15H8O6, C15H8O5, C14H8O4, and C15H10O4. The formulae and fragments led to the identification of pseudopurpurin (11), munjistin (12), nordamnacanthal (13), a dihydroxyanthraquinone, potentially alizarin (16), and rubiadin (19) [28]. All these anthraquinones have been previously described in madder [6]. As the separation was performed on a C18 column, the elution order of compounds 11 to 13 and 16 can be explained by the decreasing number of oxygens. Moreover, rubiadin (19) has the same number of oxygens as dihydroxanthraquinone (16), but with a supplementary methyl group that makes it less polar.
Compounds 14 and 15 were detected in negative and positive mode at m/z 269.04 and 271.06. The proposed formula for these compounds was C15H10O5, which could correspond to a few compounds described in Rubia tinctorum [6]. Fragmentation patterns were used to differentiate them. Compound 14 gave fragments in negative mode at m/z 251.0295, 223.0418, and 195.0414, corresponding to the loss of H2O (18 u), followed by the losses of two CO groups (28 u). Another fragment was identified at m/z 239.0309 corresponding to the loss of [CH2O]− (30 u). This fragmentation pattern has been described for aloe-emodin in positive mode [30], as well as the loss of 30 u in negative mode [28]. Aloe-emodin has never been identified in madder to date. However, lucidin is a position isomer of aloe-emodin and has been described in madder [6]. Compound 14 was identified as lucidin. Compound 15 gave fragments in negative mode at m/z 254.0176 (-15 u, [CH3]−), 241.0456 (-28 u, [CO]), 226.0231 (-43 u [CH3-CO]−), 223.0381 (-46 u, [CO-H2O]−), 213.0187 (-56 u, [CO-C2H4]−), 211.0360 (-58 u [CO-CH2O]−), 199.0376 (-70 u, [CO-C2H2]−), 195.0418 (-74 u, [2 CO-H2O]−), and 182.0366 (-87 u, [CO2-CO-CH3]−). These are consistent with the fragmentation patterns in the literature for flavonoids [26,27]. Compound 15 was identified as apigenin, the only flavonoid with the formula C15H15O5 described in madder [23].
Compound 17 was detected in negative and positive mode at m/z 255.0277 and 257.0444. The proposed formula for this compound was C14H8O5. One fragment was detected in negative mode at m/z 227.0297 (-28 u) after the loss of [CO]−. Compound 17 was identified as purpurin, a major anthraquinone from Rubia tinctorum [6,28].
Compound 18 was detected in positive mode at m/z 287.0548. The proposed formula for this compound was C15H10O5. Fragments were detected at m/z 255.0265, 237.0150, 227.0339, and 199.0405, corresponding to the loss of CH4O (32 u), followed by the loss of H2O (18 u) or CO (28 u) and a loss of CO (28 u). Other fragments were detected at m/z 181.0287 and 155.0500, corresponding to the subsequent losses of H2O (18 u) and CO2 (44 u). Compound 18 was identified as a trihydroxy-hydroxymethyl anthraquinone. No trihydroxy-hydroxymethyl anthraquinones have been previously described in madder, but this structure is consistent with the presence of mono- and dihydroxy-hydroxymethylanthraquinones, already described in the plant [6].
The DAD chromatogram in the visible region (350–700 nm) was observed to determine the compounds mostly responsible for the color of the extract. They were identified as lucidin primveroside (8), pseudopurpurin (11), lucidin (14), and purpurin (17), with pseudopurpurin being largely prevalent. This confirms that it is mainly the anthraquinones that have an impact on the color of madder extract.
4. Conclusions
The first water-based microwave-assisted extraction of Rubia tinctorum pigments was optimized using the response surface methodology. The number of cycles was the most significant parameter influencing the yield, as well as its combination with the power and plant to water ratio. It was found that the yield and color of the extracts were not correlated. The optimized parameters for the best compromise between yield and color were one cycle, 1000 W, and 100 mg/20 mL of water. Glycosylated and non-glycosylated flavonoids and anthraquinones from Rubia tinctorum were efficiently extracted by w-MAE. The optimized w-MAE showed a higher total extraction yield and anthraquinone content and a more intense color than conventional Soxhlet extraction, in 30 s instead of 4 h. Moreover, it was comparable to hydroalcoholic MAE, showing that water was as efficient as ethanol in the extraction of the molecules of interest using the process developed here. HPTLC characterization of the optimized extract showed high content of polysaccharides. UPLC-HRMS/MS was also used to putatively identify 19 major colored compounds. The extract was mostly composed of glycosylated flavonoids and anthraquinones (logP around −2) and free anthraquinones (logP around 2).
w-MAE is faster, cheaper, and easier to develop than other green extraction techniques such as subcritical water or natural deep eutectic solvents and it can be adapted to the pilot scale. It is also less harsh than previously described extractions of madder anthraquinones as no signs of degradation or structural modification of anthraquinones were found, while these are often described in the literature for hot extractions with an alcohol or pressurized hot water extractions.
Water, which can only extract highly polar compounds (logP < 0), is often overlooked as a solvent. We demonstrate that w-MAE is an effective method to also extract compounds with medium polarity (logP around 2) in a very short time.
Author Contributions
Conceptualization, E.D.; methodology, M.C., C.C., and E.D.; validation, M.C.; formal analysis, M.C.; investigation, M.C.; resources, E.D. and C.C.; data curation, M.C.; writing—original draft preparation, M.C.; writing—review and editing, E.D.; visualization, M.C.; supervision, E.D.; project administration, E.D.; funding acquisition, E.D. All authors have read and agreed to the published version of the manuscript.
Funding
This research was funded by the Centre-Val de Loire region and BPI France through the financial support of the “EPIC” project (Contract No. 00145581) and by the French ANRT (Association Nationale de la Recherche et la Technologie) through a CIFRE grant to Marine Chambaud (No. 2021/0840). The authors also thank the projects CHemBio (FEDER-FSE 2014-2020-EX003677), Valbiocosm (FEDER-FSE 2014-2020-EX003202), Techsab (FEDER-FSE 2014-2020-EX011313), QUALICHIM (APR-IA-PF 2021-00149467), RTR Motivhealth (2019-00131403) and the Labex programs SYNORG (ANR-11-LABX-0029) and IRON (ANR-11-LABX-0018-01) for their financial support of ICOA, UMR 7311, University of Orléans, CNRS.
Data Availability Statement
The data presented in this study are available on request from the corresponding author. The data are not publicly available due to privacy.
Acknowledgments
The authors would like to acknowledge Terre de Couleur (Rochecorbon, France), who initiated the project and provided the plant material. In particular, we would like to thank Rémi Guyomarch and Christian Munchenbach for all the insightful discussions. We also thank the SALSA platform for the spectroscopic measurements and spectrometric and chromatographic (UHPLC-HRMS/MS) analyses.
Conflicts of Interest
The authors declare no conflict of interest.
References
- Aggarwal, S. Indian Dye Yielding Plants: Efforts and Opportunities. Nat. Resour. Forum 2021, 45, 63–86. [Google Scholar] [CrossRef]
- Franca, C.C.V.; Ueno, H.M. Green Cosmetics: Perspectives and Challenges in the Context of Green Chemistry. Desenvolv. Meio Ambiente 2020, 53, 133–150. [Google Scholar] [CrossRef]
- Roohinejad, S.; Nikmaram, N.; Brahim, M.; Koubaa, M.; Khelfa, A.; Greiner, R. Potential of Novel Technologies for Aqueous Extraction of Plant Bioactives. In Water Extraction of Bioactive Compounds; Elsevier: Amsterdam, The Netherlands, 2017; pp. 399–419. ISBN 978-0-12-809380-1. [Google Scholar]
- Chemat, F.; Abert Vian, M.A.; Ravi, H.K.; Khadhraoui, B.; Hilali, S.; Perino, S.; Fabiano Tixier, A.-S. Review of Alternative Solvents for Green Extraction of Food and Natural Products: Panorama, Principles, Applications and Prospects. Molecules 2019, 24, 3007. [Google Scholar] [CrossRef] [PubMed]
- Jin, Y.; Hu, D.; Chen, Q.; Shi, C.; Ye, J.; Dai, Z.; Lu, Y. Water-Based Green and Sustainable Extraction Protocols for Value-Added Compounds from Natural Resources. Curr. Opin. Green Sustain. Chem. 2023, 40, 100757. [Google Scholar] [CrossRef]
- Derksen, G.C.H.; Van Beek, T.A. Rubia tinctorum L. Stud. Nat. Prod. Chem. 2002, 26, 629–684. [Google Scholar] [CrossRef]
- Wijnsma, R.; Verpoorte, R. Anthraquinones in the Rubiaceae. In Fortschritte der Chemie Organischer Naturstoffe/Progress in the Chemistry of Organic Natural Products; Herz, W., Grisebach, H., Kirby, G.W., Tamm, C., Eds.; Springer: Vienna, Austria, 1986; Volume 49, pp. 79–149. ISBN 978-3-7091-8848-4. [Google Scholar]
- Mouri, C.; Laursen, R. Identification of Anthraquinone Markers for Distinguishing Rubia Species in Madder-Dyed Textiles by HPLC. Microchim. Acta 2012, 179, 105–113. [Google Scholar] [CrossRef]
- Willemen, H.; van den Meijdenberg, G.J.P.; van Beek, T.A.; Derksen, G.C.H. Comparison of Madder (Rubia tinctorum L.) and Weld (Reseda Luteola L.) Total Extracts and Their Individual Dye Compounds with Regard to Their Dyeing Behaviour, Colour, and Stability towards Light. Color. Technol. 2019, 135, 40–47. [Google Scholar] [CrossRef]
- Dulo, B.; Phan, K.; Githaiga, J.; Raes, K.; De Meester, S. Natural Quinone Dyes: A Review on Structure, Extraction Techniques, Analysis and Application Potential. Waste Biomass Valorization 2021, 12, 6339–6374. [Google Scholar] [CrossRef]
- Duval, J.; Pecher, V.; Poujol, M.; Lesellier, E. Research Advances for the Extraction, Analysis and Uses of Anthraquinones: A Review. Ind. Crops Prod. 2016, 94, 812–833. [Google Scholar] [CrossRef]
- Derksen, G.C.H.; van Holthoon, F.L.; Willemen, H.M.; Krul, C.A.M.; Franssen, M.C.R.; van Beek, T.A. Development of a Process for Obtaining Non-Mutagenic Madder Root (Rubia tinctorum) Extract for Textile Dyeing. Ind. Crops Prod. 2021, 164, 113344. [Google Scholar] [CrossRef]
- Chemat, F.; Abert-Vian, M.; Fabiano-Tixier, A.S.; Strube, J.; Uhlenbrock, L.; Gunjevic, V.; Cravotto, G. Green Extraction of Natural Products. Origins, Current Status, and Future Challenges. TrAC Trends Anal. Chem. 2019, 118, 248–263. [Google Scholar] [CrossRef]
- Barrera Vázquez, M.F.; Comini, L.R.; Milanesio, J.M.; Montoya, S.C.N.; Cabrera, J.L.; Bottini, S.; Martini, R.E. Pressurized Hot Water Extraction of Anthraquinones from Heterophyllaea pustulata Hook f. (Rubiaceae). J. Supercrit. Fluids 2015, 101, 170–175. [Google Scholar] [CrossRef]
- Destandau, E.; Michel, T. Microwave-Assisted Extraction. In Natural Product Extraction: Principles and Applications; Rostagno, M., Prado, J.M., Eds.; Green Chemistry Series; Royal Society of Chemistry: London, UK, 2022; ISBN 978-1-83916-589-4. [Google Scholar]
- Shotipruk, A.; Kiatsongserm, J.; Pavasant, P.; Goto, M.; Sasaki, M. Pressurized Hot Water Extraction of Anthraquinones from the Roots of Morinda citrifolia. Biotechnol. Prog. 2004, 20, 1872–1875. [Google Scholar] [CrossRef] [PubMed]
- Ferreira, S.L.C.; Bruns, R.E.; Ferreira, H.S.; Matos, G.D.; David, J.M.; Brandão, G.C.; da Silva, E.G.P.; Portugal, L.A.; dos Reis, P.S.; Souza, A.S.; et al. Box-Behnken Design: An Alternative for the Optimization of Analytical Methods. Anal. Chim. Acta 2007, 597, 179–186. [Google Scholar] [CrossRef]
- Grigoras, C.G.; Destandau, E.; Fougère, L.; Elfakir, C. Evaluation of Apple Pomace Extracts as a Source of Bioactive Compounds. Ind. Crops Prod. 2013, 49, 794–804. [Google Scholar] [CrossRef]
- Dabiri, M.; Salimi, S.; Ghassempour, A.; Rassouli, A.; Talebi, M. Optimization of Microwave-Assisted Extraction for Alizarin and Purpurin in Rubiaceae Plants and Its Comparison with Conventional Extraction Methods. J. Sep. Sci. 2005, 28, 387–396. [Google Scholar] [CrossRef]
- Hemwimon, S.; Pavasant, P.; Shotipruk, A. Microwave-Assisted Extraction of Antioxidative Anthraquinones from Roots of Morinda Citrifolia. Sep. Purif. Technol. 2007, 54, 44–50. [Google Scholar] [CrossRef]
- Sharif, S.; Nabais, P.; Melo, M.J.; Oliveira, M.C. Traditional Yellow Dyes Used in the 21st Century in Central Iran: The Knowledge of Master Dyers Revealed by HPLC-DAD and UHPLC-HRMS/MS. Molecules 2020, 25, 908. [Google Scholar] [CrossRef]
- Singh, R.; Geetanjali; Chauhan, S.M.S. 9,10-Anthraquinones and Other Biologically Active Compounds from the Genus Rubia. Chem. Biodivers. 2004, 1, 1241–1264. [Google Scholar] [CrossRef]
- Eltamany, E.E.; Nafie, M.S.; Khodeer, D.M.; El-Tanahy, A.H.H.; Abdel-Kader, M.S.; Badr, J.M.; Abdelhameed, R.F.A. Rubia tinctorum Root Extracts: Chemical Profile and Management of Type II Diabetes Mellitus. RSC Adv. 2020, 10, 24159–24168. [Google Scholar] [CrossRef]
- Çalis, I.; Heilmann, J.; Tasdemir, D.; Linden, A.; Ireland, C.M.; Sticher, O. Flavonoid, Iridoid, and Lignan Glycosides from Putoria c alabrica. J. Nat. Prod. 2001, 64, 961–964. [Google Scholar] [CrossRef]
- Lu, C.-M.; Yang, J.-J.; Wang, P.-Y.; Lin, C.-C. A New Acylated Flavonol Glycoside and Antioxidant Effects of Hedyotis diffusa. Planta Med. 2000, 66, 374–377. [Google Scholar] [CrossRef]
- Michel, T. Nouvelles Méthodologies D’extraction, de Fractionnement et D’identification: Application aux Molécules Bioactives de L’argousier (Hippophae rhamnoides). Ph.D. Thesis, Université d’Orléans, Orléans, France, 2011. [Google Scholar]
- Fabre, N.; Rustan, I.; de Hoffmann, E.; Quetin-Leclercq, J. Determination of Flavone, Flavonol, and Flavanone Aglycones by Negative Ion Liquid Chromatography Electrospray Ion Trap Mass Spectrometry. J. Am. Soc. Mass Spectrom. 2001, 12, 707–715. [Google Scholar] [CrossRef] [PubMed]
- Rafaelly, L.; Heron, S.; Nowik, W.; Tchapla, A. Optimisation of ESI-MS Detection for the HPLC of Anthraquinone Dyes. Dye. Pigment. 2008, 77, 191–203. [Google Scholar] [CrossRef]
- Derksen, G.C.H.; Niederländer, H.A.G.; van Beek, T.A. Analysis of Anthraquinones in Rubia tinctorum L. by Liquid Chromatography Coupled with Diode-Array UV and Mass. J. Chromatogr. A 2002, 978, 119–127. [Google Scholar] [CrossRef] [PubMed]
- Zhan, C.; Xiong, A.; Shen, D.; Yang, L.; Wang, Z. Characterization of the Principal Constituents of Danning Tablets, a Chinese Formula Consisting of Seven Herbs, by an UPLC-DAD-MS/MS Approach. Molecules 2016, 21, 631. [Google Scholar] [CrossRef]
Figure 1.
Response surface plot representing the effects of plant to water ratio, number of cycles, and microwave power on the extraction yield. (A) Effect of ratio and power, with the number of cycles fixed at 5 cycles. (B) Effect of cycles and power, with ratio fixed at 550 mg/20 mL. (C) Effect of cycles and ratio, with power fixed at 600 W.

Figure 2.
Scatter plot of the MAE extracts according to their yield (%) and absorbance at 500 nm. Separation of extracts into groups alongside the yield (A,B) or absorbance (1, 2) scale are highlighted. Four clusters were then constructed (dotted lines).
Figure 2.
Scatter plot of the MAE extracts according to their yield (%) and absorbance at 500 nm. Separation of extracts into groups alongside the yield (A,B) or absorbance (1, 2) scale are highlighted. Four clusters were then constructed (dotted lines).

Figure 3.
UV–visible spectra of the microwave-optimized extracts (13 and 16) and of reference extracts (Soxhlet and 16 EtOH/w).
Figure 3.
UV–visible spectra of the microwave-optimized extracts (13 and 16) and of reference extracts (Soxhlet and 16 EtOH/w).

Figure 4.
HPTLC of the extracts after revelation by the Molisch reagent. Std: mix of standard carbohydrates, namely glucose, mannose, maltotriose, maltopentose, and maltoheptaose.
Figure 4.
HPTLC of the extracts after revelation by the Molisch reagent. Std: mix of standard carbohydrates, namely glucose, mannose, maltotriose, maltopentose, and maltoheptaose.


Table 1.
Coded and uncoded variables used in the experimental design.
| X1 (Cycles) | X2 (Power in W) | X3 (Ratio in mg/20 mL) | Coded Variables |
|---|---|---|---|
| 1 | 200 | 100 | −1 |
| 3 | 600 | 550 | 0 |
| 5 | 1000 | 1000 | 1 |
Table 2.
Box–Behnken experimental design.
| Run Order | X1 (Cycles) | X2 (Power in W) | X3 (Ratio in mg/20 mL) |
|---|---|---|---|
| 1 | 3 | 600 | 550 |
| 2 | 1 | 600 | 550 |
| 3 | 5 | 200 | 100 |
| 4 | 5 | 600 | 1000 |
| 5 | 1 | 200 | 100 |
| 6 | 3 | 600 | 550 |
| 7 | 1 | 1000 | 1000 |
| 8 | 5 | 1000 | 100 |
| 9 | 3 | 600 | 100 |
| 10 | 3 | 200 | 550 |
| 11 | 1 | 200 | 1000 |
| 12 | 3 | 600 | 550 |
| 13 | 1 | 1000 | 100 |
| 14 | 5 | 200 | 1000 |
| 15 | 3 | 1000 | 1000 |
| 16 | 5 | 1000 | 550 |
| 17 | 3 | 600 | 550 |
Table 3.
Analysis of variance (ANOVA) of the quadratic polynomial model.
| Model Term | Sum of Squares | Degrees of Freedom | Mean Square | F-Value | p-Value | Significant |
|---|---|---|---|---|---|---|
| Regression | 0.0170 | 9 | 1.89 × 10−03 | 45.1054 | 0.0000 a | Yes |
| Number of cycles (X1) | 0.0003 | 1 | 2.86 × 10−04 | 6.8016 | 0.0350 a | Yes |
| Microwave power (X2) | 0.0136 | 1 | 2.22 × 10−04 | 5.2905 | 0.0550 | |
| Plant/water ratio (X3) | 0.0004 | 1 | 8.30 × 10−05 | 1.9776 | 0.2025 | |
| X1X1 | 0.0012 | 1 | 5.16 × 10−04 | 12.2858 | 0.0099 a | Yes |
| X2X2 | 0.0010 | 1 | 1.01 × 10−03 | 24.1367 | 0.0017 a | Yes |
| X3X3 | 0.0003 | 1 | 3.25 × 10−04 | 7.7453 | 0.0272 a | Yes |
| X1X2 | 0.0000 | 1 | 1.47 × 10−06 | 0.0351 | 0.8567 | |
| X1X3 | 0.0001 | 1 | 2.79 × 10−05 | 0.6654 | 0.4415 | |
| X2X3 | 0.0002 | 1 | 2.45 × 10−04 | 5.8341 | 0.0464 a | Yes |
| Residual | 0.0003 | 7 | 4.20 × 10−05 | |||
| Total | 0.0173 | 16 |
a Significant at p < 0.05.
Table 4.
Comparison of the yield and absorbance at 500 nm of optimized w-MAE extracts and reference extracts.
Table 4.
Comparison of the yield and absorbance at 500 nm of optimized w-MAE extracts and reference extracts.
| Extract | 13 | 16 | 16 EtOH/w | Soxhlet |
|---|---|---|---|---|
| n = 3 | n = 3 | n = 3 | n = 1 | |
| Yield (%) | 21.5 ± 0.5% | 21.6 ± 1.1% | 20.7 ± 0.4% | 14.1 |
| Abs at 500 nm (ua) | 0.35 ± 0.05 | 0.16 ± 0.01 | 0.31 ± 0.09 | 0.17 |
Table 5.
Anthraquinone and phenolic content of the microwave extracts.
| Anthraquinones | Total Phenolic Content | |
|---|---|---|
| (mg alizarin eq/g) | (mg gallic acid eq/g) | |
| n = 3 * | n = 3 * | |
| 13 | 49.4 ± 9.3 a | 21 ± 4 a |
| 16 | 25.2 ± 1.7 b | 15 ± 1 b |
| 16 EtOH/w | 48.0 ± 11.5 a | 21 ± 2 a |
n = 3 * independent crude extracts, a,b significantly different results for each test using Tukey’s range test (p < 0.05).
Table 6.
Characterization of the optimized w-MAE extract (extract 13) by UHPLC-DAD-HRMS/MS.
| # | Rt (min) | Meas. m/z ([M+H]+) | Error (ppm) | Meas. m/z ([M-H]−) | Error (ppm) | Molecular Formula | MS/MS+ (Intensity) | MS/MS− (Intensity) | ʎmax (nm) | Putative Identification |
|---|---|---|---|---|---|---|---|---|---|---|
| 1 | 4.55 | 355.0989 | 0 | C16H18O9 | 163.0385 (6081) | 277, 330 | Chlorogenic acid | |||
| 145.0260 (1207) | ||||||||||
| 135.0442 (1017) | ||||||||||
| 117.0353 (740) | ||||||||||
| 107.0488 (408) | ||||||||||
| 2 | 5.01 | N.D. | - | 593.1135 | 2.3 | C26H26O16 | - | 549.1213 (3075) | 252, 284, 432 | Galiosin |
| 255.0224 (1874) | ||||||||||
| 3 | 5.41 | 743.2041 | −1.1 | 741.1845 | −2.7 | C32H38O20 | 611.1614 (1054) | - | 270, 353 | Quercetin xyloside (or arabinoside) rhamnoside glucoside |
| 465.1093 (308) | ||||||||||
| 303.0526 (377) | ||||||||||
| 4 | 5.65 | 597.1459 | 0 | 595.133 | 1.6 | C26H28O16 | 465.0962 (1235) | - | 260, 355 | Quercetin xylosyl glucoside |
| 303.0471 (391) | ||||||||||
| 5 | 5.86 | 611.1608 | 0.5 | 609.1472 | −1.9 | C27H31O16 | 465.1042 (3613) | 301.0331 (668) | 257, 350 | Rutin |
| 303.0529 (559) | ||||||||||
| 6 | 6.13 | 465.1019 | 1.7 | 463.0874 | 1.8 | C21H20O12 | 303.0511 (3050) | 300.0225 (2713) | 264, 350 | Hyperoside |
| 7 | 6.78 | N.D. | 563.1394 | 2.2 | C26H28O14 | - | 269.0399 (1740) | 280, 330 (br) | Apigenin xyloside glucoside | |
| 251.0335 (334) | ||||||||||
| 8 | 7.32 | 565.1553 | −0.2 | 563.1414 | −1.3 | C26H28O14 | - | 269.0432 (1382) | 276, 305 (sh), 336, 416 | Lucidin primveroside |
| 9 | 7.39 | 579.1695 | 2.3 | 577.1564 | −0.2 | C27H30O14 | - | 269.0496 (3421) | 276, 305 (sh), 345, 416 (br) | Lucidin rhamnoside glucoside |
| 10 | 8.03 | 303.0503 | −1 | 301.0332 | 8.2 | C15H10O7 | 257.0429 (752) | 273.0346 (207) | 272, 368 | Quercetin |
| 247.0569 (309) | 257.0308 (104) | |||||||||
| 239.0195 (185) | 245.0413 (237) | |||||||||
| 229.0508 (957) | 178.9980 (470) | |||||||||
| 201.0561 (770) | 164.0093 (270) | |||||||||
| 165.0176 (947) | 151.0027 (1325) | |||||||||
| 153.0175 (1632) | 121.0285 (278) | |||||||||
| 149.0237 (376) | ||||||||||
| 137.0228 (1222) | ||||||||||
| 121.0287 (692) | ||||||||||
| 111.0079 (326) | ||||||||||
| 11 | 8.25 | 301.0347 | −1.4 | 299.0173 | 5.6 | C15H8O7 | 283.0233 (4995) | 255.0273 (56,787) | 256, 284 (sh), 328 (sh), 492 (br) | Pseudopurpurin |
| 273.0419 (1928) | 227.0347 (26,091) | |||||||||
| 245.0412 (3174) | 199.0372 (520) | |||||||||
| 231.0264 (3092) | 183.0431 (2059) | |||||||||
| 227.0300 (12,919) | 171.0444 (2032) | |||||||||
| 213.0215 (7041) | 129.0353 (812) | |||||||||
| 199.0369 (3634) | ||||||||||
| 187.0374 (4122) | ||||||||||
| 181.0328 (2458) | ||||||||||
| 175.0374 (976) | ||||||||||
| 171.0453 (1000) | ||||||||||
| 157.0259 (4415) | ||||||||||
| 143.0472 (507) | ||||||||||
| 129.0334 (1361) | ||||||||||
| 12 | 8.32 | 285.0394 | 0 | 283.0229 | 6.9 | C15H8O6 | 267.0304 (20,184) | 265.0066 (2300) | 248, 288, 432 (br) | Munjistin |
| 249.0198 (2216) | 239.0350 (66,054) | |||||||||
| 227.0337 (1135) | 211.0353 (24,985) | |||||||||
| 213.0210 (1019) | 195.0451 (21,570) | |||||||||
| 211.0387 (1316) | 167.0481 (2117) | |||||||||
| 13 | 8.95 | 269.0445 | −0.2 | 267.0283 | 5.9 | C15H8O5 | 223.0390 (211) | 223.0373 (10,478) | 276, 341, 452 (br) | Nordamnacanthal |
| 195.0357 (634) | 195.0411 (2660) | |||||||||
| 167.0558 (540) | ||||||||||
| 139.0512 (385) | ||||||||||
| 120.0807 (205) | ||||||||||
| 105.0343 (329) | ||||||||||
| 14 | 9.52 | 271.0597 | 1.6 | 269.0436 | 7.3 | C15H10O5 | - | 251.0295 (3615) | 276, 305 (sh), 340, 416 (br) | Lucidin |
| 239.0309 (265) | ||||||||||
| 223.0418 (233) | ||||||||||
| 195.0414 (384) | ||||||||||
| 179.0508 (314) | ||||||||||
| 15 | 10.63 | 271.0608 | - | 269.0438 | 6.5 | C15H10O5 | 228.0415 (151) | 254.0176 (477) | 261, 350 (br) | Apigenin |
| 215.0408 (225) | 241.0456 (512) | |||||||||
| 226.0231 (425) | ||||||||||
| 223.0381 (733) | ||||||||||
| 213.0187 (411) | ||||||||||
| 211.0360 (290) | ||||||||||
| 199.0376 (255) | ||||||||||
| 195.0418 (432) | ||||||||||
| 182.0366 (327) | ||||||||||
| 16 | 10.83 | 241.0496 | −0.1 | 239.0338 | 4.9 | C14H8O4 | - | 211.0349 (819) | 281, 339, 425 | Dihydroxyanthraquinone |
| 195.0486 (353) | ||||||||||
| 183.0426 (106) | ||||||||||
| 158.9252 (112) | ||||||||||
| 155.0532 (87) | ||||||||||
| 135.5830 (51) | ||||||||||
| 17 | 10.94 | 257.0444 | −0.2 | 255.0277 | 8.8 | C14H8O5 | 169.0335 (546) | 227.0297 (4771) | 253, 288, 480 (br), 515 | Purpurin |
| 18 | 11.35 | 287.0548 | 0.6 | N.D. | - | C15H10O6 | 255.0265 (994) | - | 255, 287, 476 (br) | Trihydroxy-hydroxymethylanthraquinone |
| 237.0150 (1104) | ||||||||||
| 227.0339 (411) | ||||||||||
| 199.0405 (811) | ||||||||||
| 181.0287 (405) | ||||||||||
| 155.0500 (427) | ||||||||||
| 115.0542 (351) | ||||||||||
| 19 | 12.07 | 255.0652 | 0.1 | 253.0495 | 4.7 | C15H10O4 | - | 225.0537 (1675) | 276, 408 (br) | Rubiadin |
| 209.0619 (424) | ||||||||||
| 181.0658 (101) |
Disclaimer/Publisher’s Note: The statements, opinions and data contained in all publications are solely those of the individual author(s) and contributor(s) and not of MDPI and/or the editor(s). MDPI and/or the editor(s) disclaim responsibility for any injury to people or property resulting from any ideas, methods, instructions or products referred to in the content. |
© 2023 by the authors. Licensee MDPI, Basel, Switzerland. This article is an open access article distributed under the terms and conditions of the Creative Commons Attribution (CC BY) license (https://creativecommons.org/licenses/by/4.0/).
Share and Cite
MDPI and ACS Style
Chambaud, M.; Colas, C.; Destandau, E. Water-Based Microwave-Assisted Extraction of Pigments from Madder Optimized by a Box–Behnken Design. Separations 2023, 10, 433. https://doi.org/10.3390/separations10080433
AMA Style
Chambaud M, Colas C, Destandau E. Water-Based Microwave-Assisted Extraction of Pigments from Madder Optimized by a Box–Behnken Design. Separations. 2023; 10(8):433. https://doi.org/10.3390/separations10080433
Chicago/Turabian StyleChambaud, Marine, Cyril Colas, and Emilie Destandau. 2023. "Water-Based Microwave-Assisted Extraction of Pigments from Madder Optimized by a Box–Behnken Design" Separations 10, no. 8: 433. https://doi.org/10.3390/separations10080433
Note that from the first issue of 2016, this journal uses article numbers instead of page numbers. See further details here.