Safety Problems in Urban Cycling Mobility: A Quantitative Risk Analysis at Urban Intersections


Department of Civil, Construction and Environmental Engineering, Sapienza University of Rome, 00184 Rome, Italy
*
Author to whom correspondence should be addressed.
Safety 2019, 5(1), 6; https://doi.org/10.3390/safety5010006
Submission received: 5 December 2018
/
Revised: 19 January 2019
/
Accepted: 21 January 2019
/
Published: 22 January 2019
Abstract
:The attention to the most vulnerable road users has grown rapidly in recent decades. The experience gained reveals an important number of cyclist fatalities due to road crashes; most of which occur at intersections. In this study, dispersion of trajectories in urban intersections has been considered to identify the whole conflict area and the largest conflict areas between cars and bicycles, and the speeds have been used to calculate exposure time of cyclists and reaction time available to drivers to avoid collision. These data allow the summary approach to the problem, while a risk probability model has been developed to adopt an elementary approach analysis. A quantitative damage model has been proposed to classify each conflict point, and a probabilistic approach has been defined to consider the traffic volume and the elementary unit of exposure. The combination of damage and probability, permitted to assess the risk of crash, at the examined intersection. Three types of urban four-arm intersection, with and without bike paths, were considered. For each scheme, the authors assessed the risk of collision between the cyclist and the vehicle. The obtained results allowed the identification of the most hazardous maneuvers and highlighted that geometry and kinematics of traffic movements cannot be overlooked, when designing an urban road intersection. The strategy proposed by the authors could have a significant impact on the risk management of urban intersections. The obtained results and the proposed hazard estimation methodology could be used to design safer intersections.
1. Introduction
User safety is one of the most important issues in road design. The Organization for Economic Co-operation and Development (OECD) demonstrated that, in the last two decades, the trend of road crashes has not been positive, all over the world [1]. Statistical data highlight that there are countries where the number of deaths and injuries is growing, especially for developing countries (e.g., India, Armenia, Bosnia, and Herzegovina). Indeed, in the countries that are becoming motorized, or in which there are high rates of cycling, collisions between cyclists and vehicles are a major problem [2].
The problem is serious, as confirmed by the attention given to it at the international level [3,4]. The United Nations General Assembly declared the years 2011–2020 as a Decade of Action for Road Safety [5]. At the European level, the trend of road fatalities, since 2001, appears to not be compliant with the Road Safety Programme pursued by the European Commission [6], which aims at reducing the number of road casualties, by half, by 2020 [7].
A non-negligible rate of road crashes (73% in Italy, according to Reference [8]) occurs in urban areas, where externalities of motorized traffic (e.g., congestion and pollution) encourage the use of “soft mobility”. Alternative private transport and public transport can provide a sustainable alternative to motorized private vehicles because their use has social, economic, and environmental advantages [9,10]. Recently, an Italian study demonstrated that the average speed of movements in urban areas is 20 km/h for private cars and 15 km/h for public transport [11]. These low values of the average speed make “soft mobility”, competitive, for small urban movements within 5–10 km distance [12]. In such conditions, different users and different vehicles share the urban road spaces [13,14]. In the literature, several studies demonstrated that cyclists and motorcyclists are the most vulnerable drivers in urban areas [15,16,17]. The Swedish Transport Administration [18] showed that cyclists are the highest percentage of severely injured road users in Sweden; pedestrians, bicyclists and motorized two wheelers constitute 75% of the total fatalities in road crashes in Delhi [19].
Isaksson-Hellman and Werneke [20] demonstrated that over more than 70% of crashes that involve cyclists, occur at road intersections. In these areas, trajectories of different users interfere—it is particularly hazardous when different types of users (cars, bicycles, and pedestrians) interact. In recent years, several models have been developed to predict trajectories of vehicles and bicycles on a road intersection [21,22,23,24]. The comparison between the results from analytical methods and images obtained from video camera [25] data has shown no significant dispersion between the predicted and observed trajectories. Therefore, predicted trajectories can be used to analyze geometrical interaction of users at road intersections. However, in such context the user behavior in a roadway cannot be overlooked because it affects the system behavior and is affected by several variables, e.g., human factors, road characteristics, weather conditions, and vehicle factors [26,27,28]. It has been observed that the geometric layout of bicycle facilities in a signalized intersection, can reduce the occurrence of traffic conflicts [29], which depend on the traffic volume at the intersection [30]. However, the number of vehicles entering the intersection, or similar summary traffic measures (e.g., the average annual daily traffic), do not ensure a correct estimation of crash risk [31]. Recently, elementary approaches for a measure of crash exposure substituted the summary ones. Elvik et al. [32] proposed a frequency method based on the Poisson curve to calculate the potential for generating a conflict. According to them, an interval of 1 s between two arrivals is short enough for there to be a real potential for a conflict to occur. This assumption has been adopted in the present study.
However, the literature does not provide a method that is useful to calculate the risk of collision between bikes and motorized vehicles. This research gap does not allow objective analyses to adopt mitigation strategies. The authors propose an original, analytical, probabilistic model useful to assess the risk of each possible conflict between cyclists and motorized vehicles, in several intersections, with different traffic levels. One symmetrical four-leg intersection was considered—three schemes have been examined in the presence, or not, of a cycling infrastructure (bicycle lane or path). For each point of conflict, the risk of crash is given by the probability of collision between the cyclist and the vehicle, and the time that the vehicle has to react and avoid the collision. The obtained results allow the identification of the most hazardous conditions, and the adoption of the best mitigation strategies to mitigate the risk. The value of applying this technique in the risk assessment of a specific urban intersection is the possibility of identifying the critical trajectories related to potential crashes between bicycles and vehicles. This, in turn, provides the information required by the road management body, to adopt a strategy, in order to guarantee a minimum safety condition. The method proposed by the authors allows an objective assessment of the risk level, at the intersection of interest, and the results of the analyses are values comparable to a target level of risk, which is to be defined during the analysis. Moreover, the method proposes permits to define guidelines for road design, with the aim of creating safer intersections for all types of users.
2. Methodology
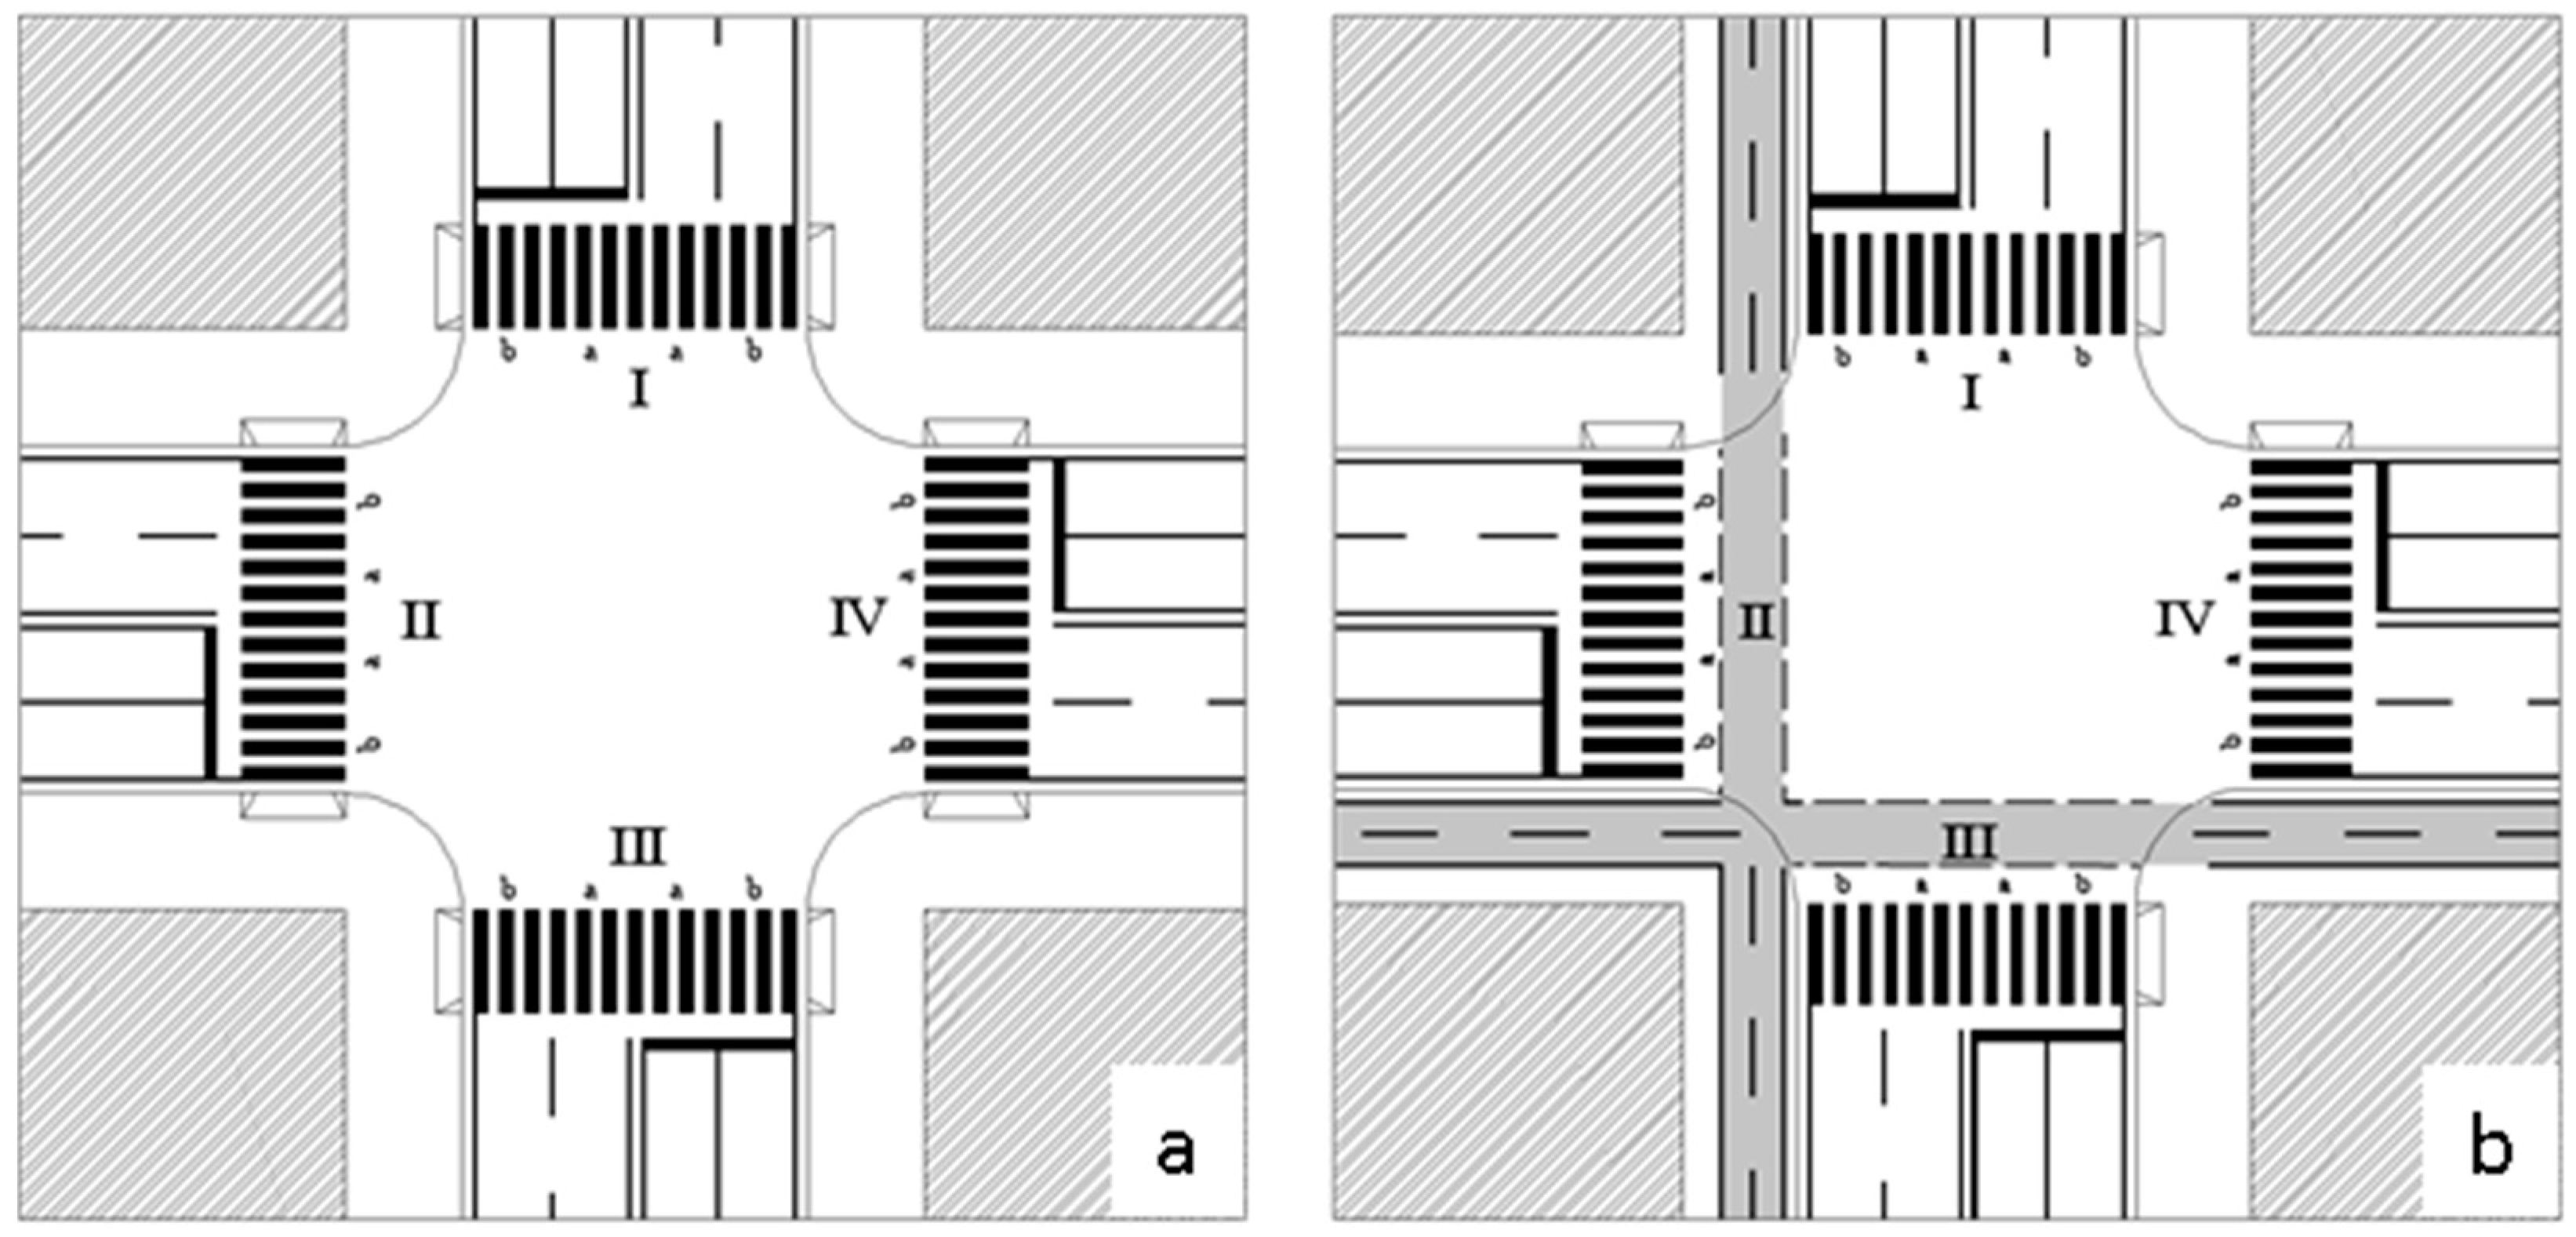
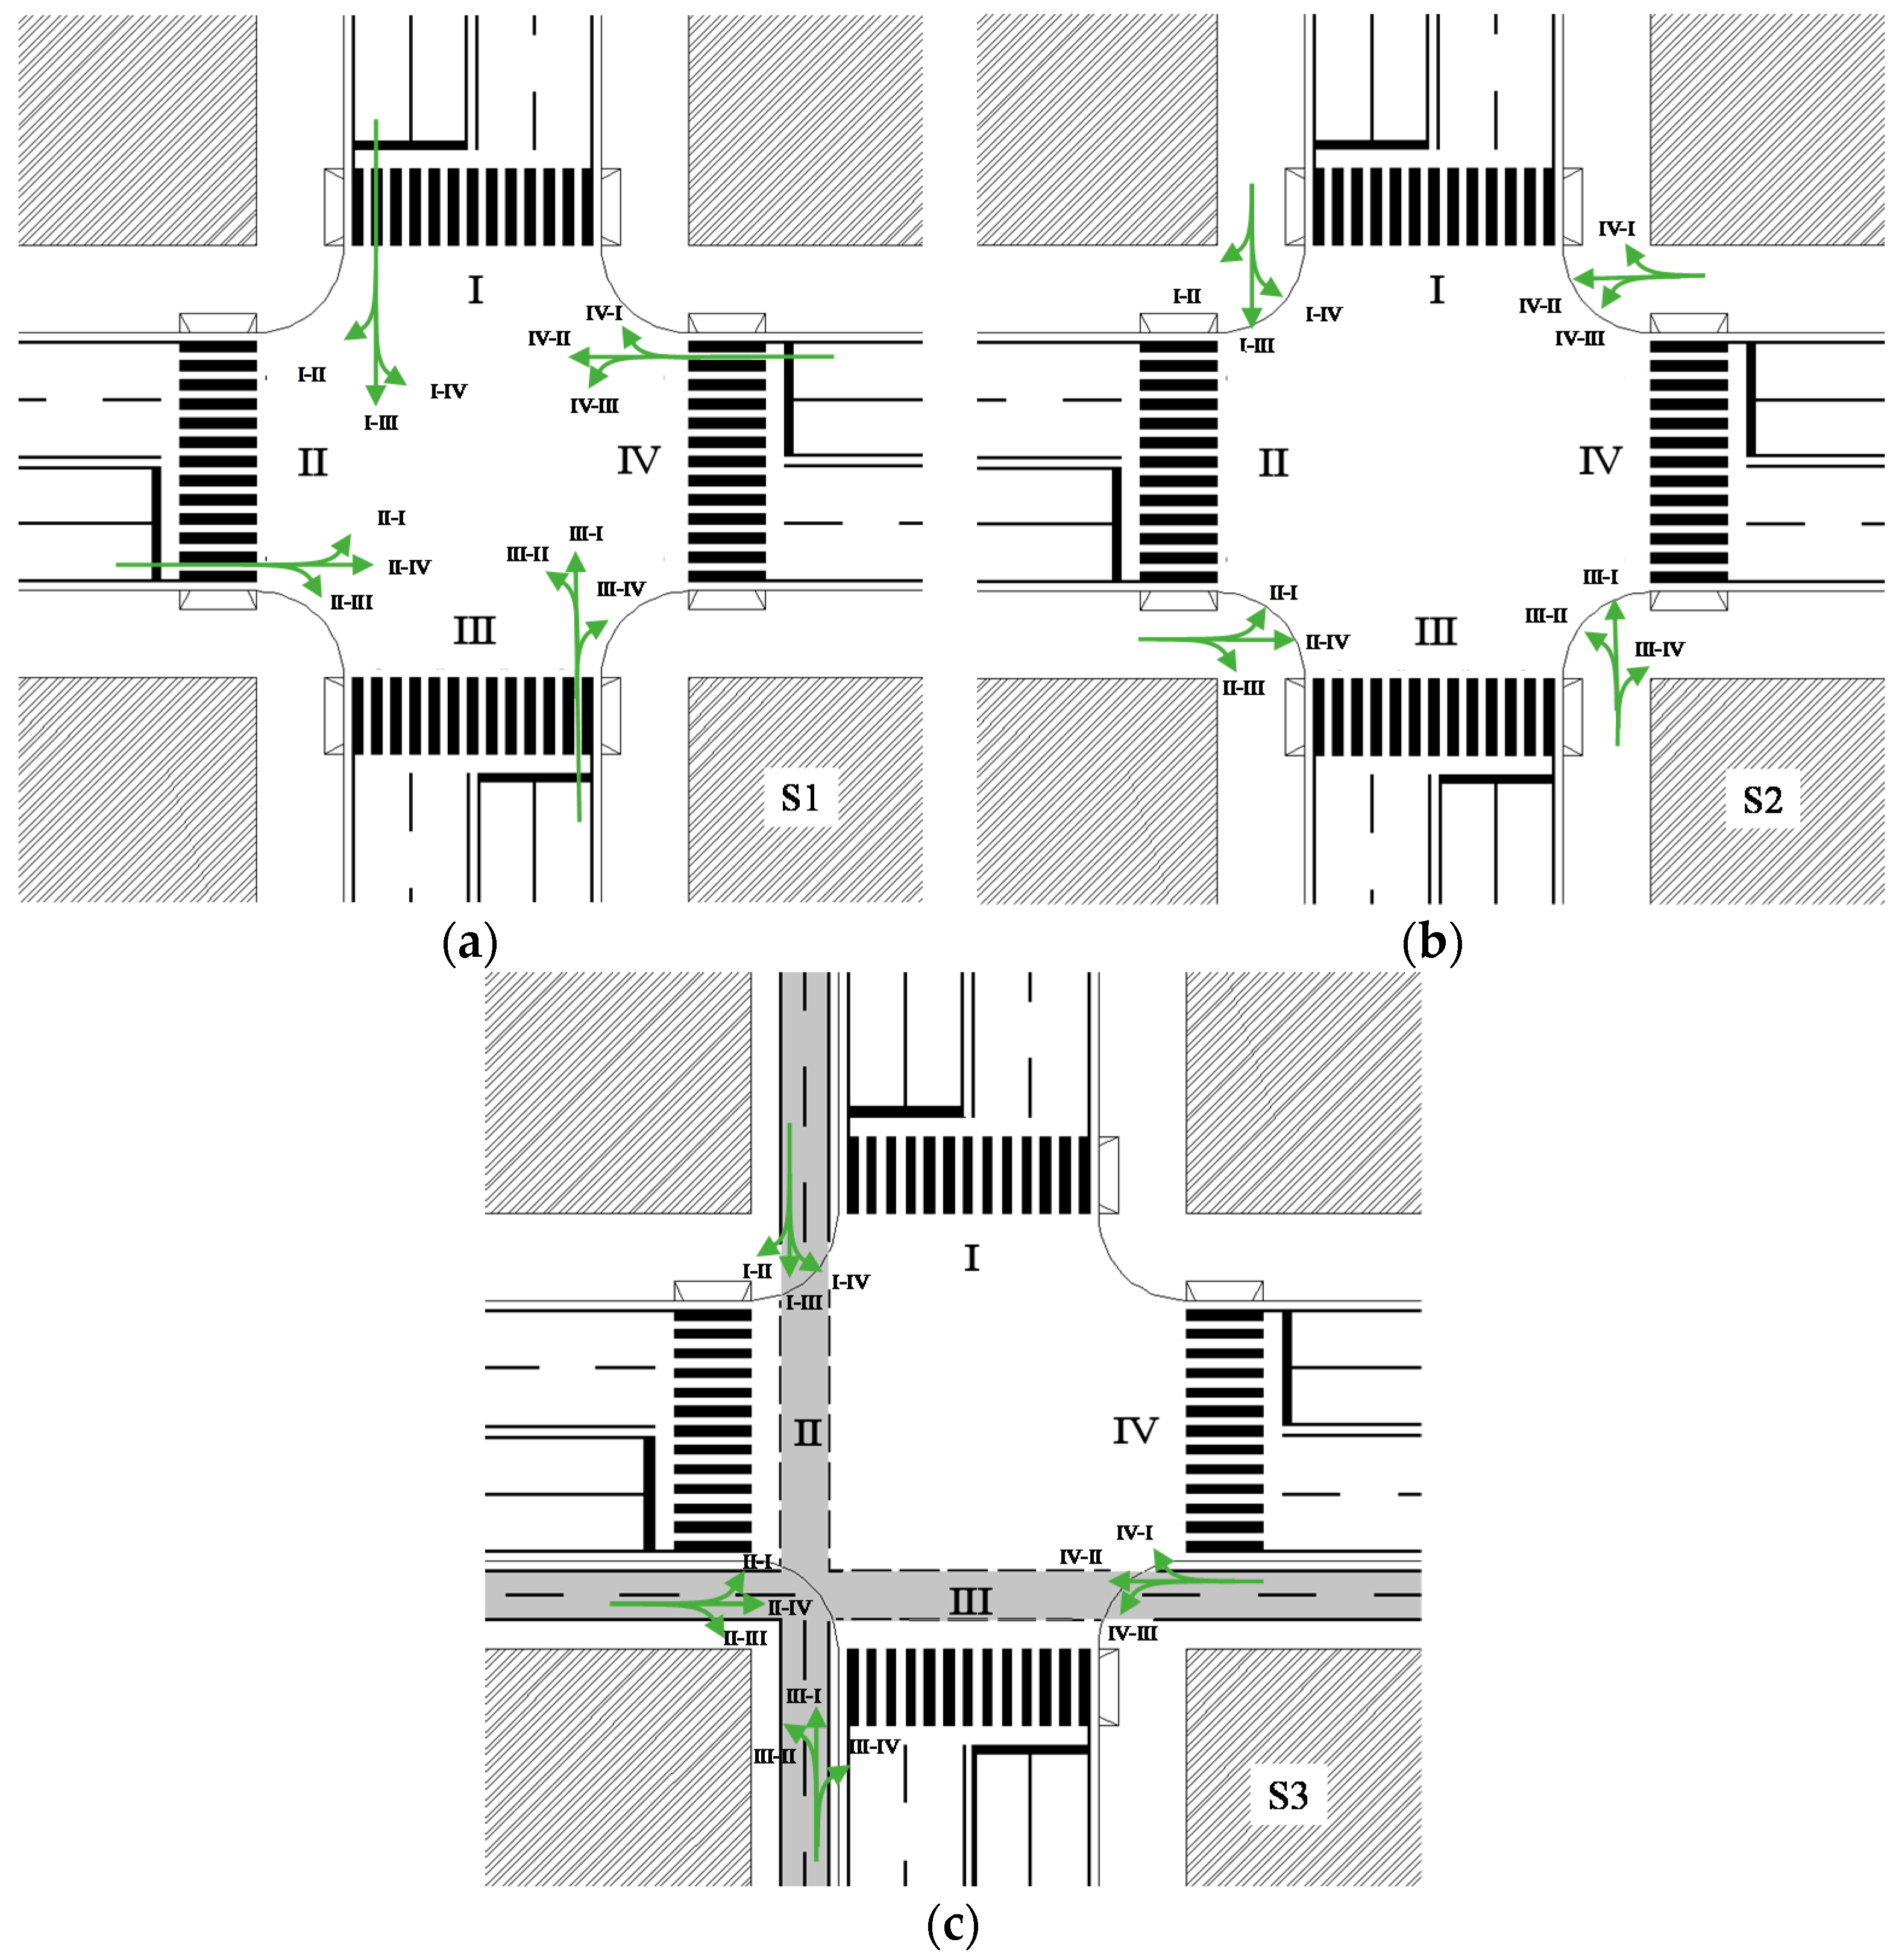
Two geometrical layouts of a four-arm urban intersection have been considered—their configurations are with (Figure 1b) and without (Figure 1a) the bicycle lane or path.
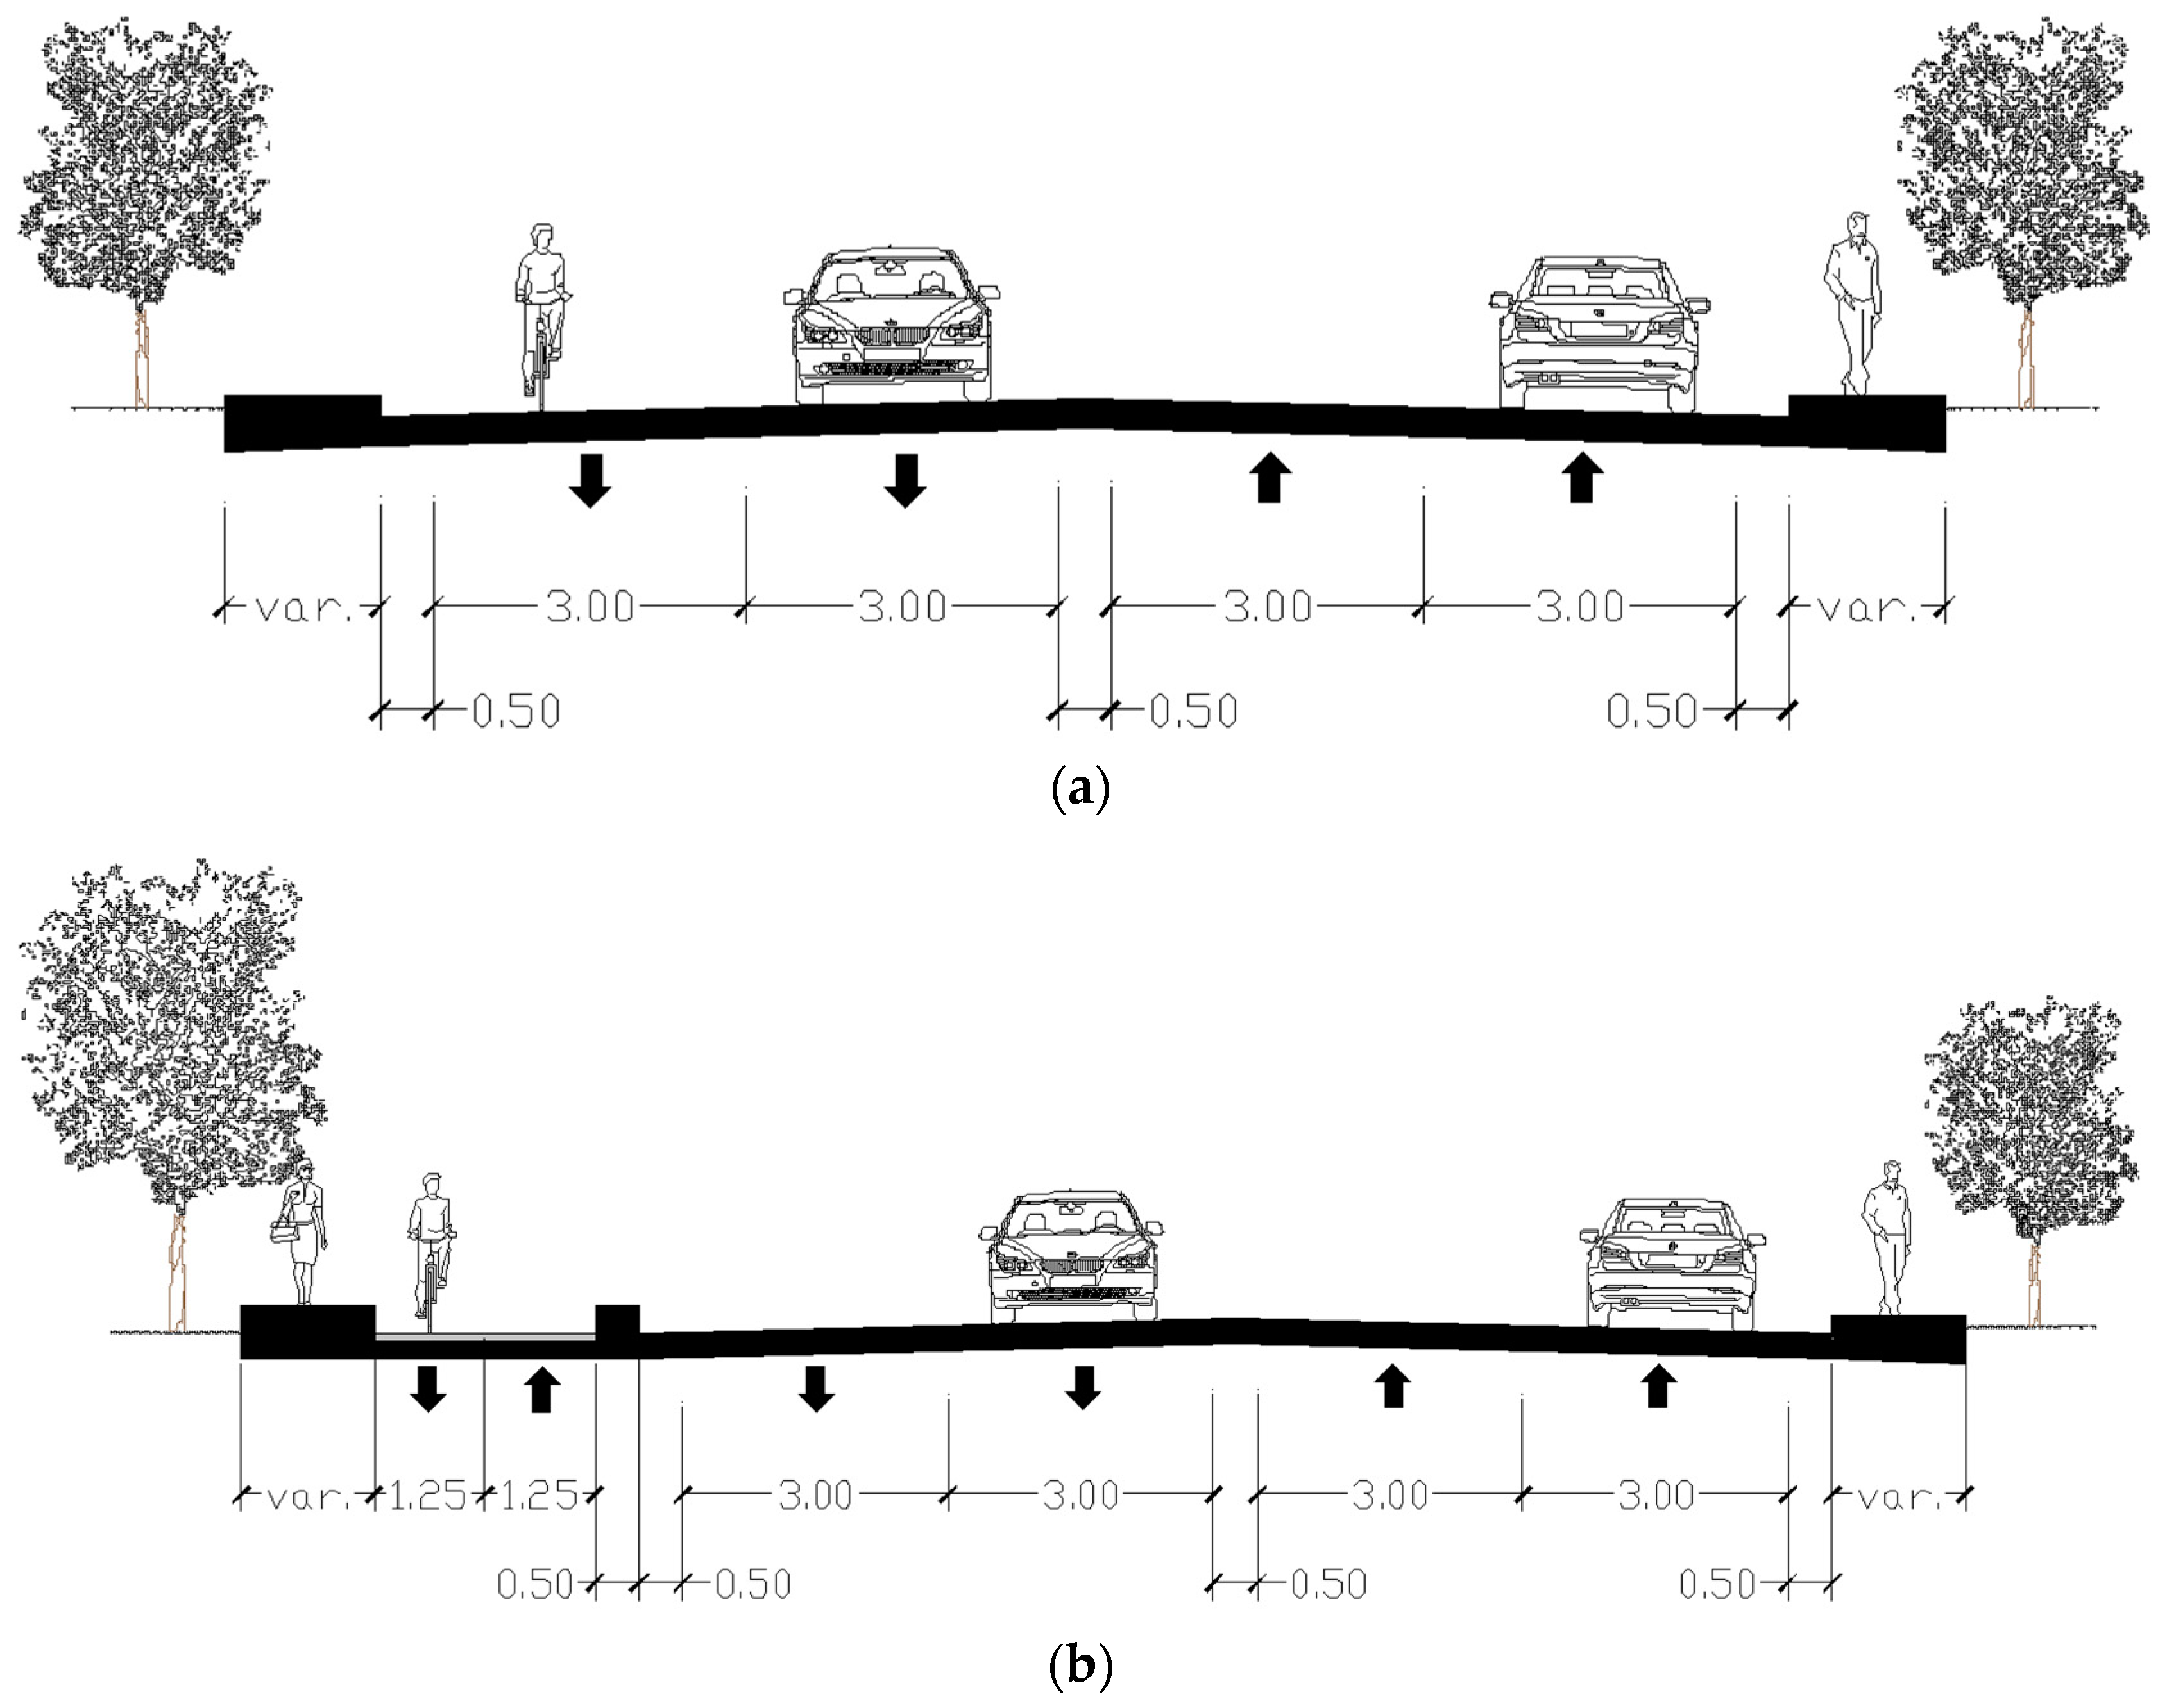
For both cross sections, vehicle lanes are 3.0 m wide, shoulders are 0.5 m wide, and medians are 0.5 m wide; cyclists run on the carriageway (Figure 1a) or on the bike path, composed of bike lanes. Each bike lane is 1.25 m wide (Figure 1b).
In all examined cases, vehicles and bicycles can perform three maneuvers—cross, right-turn, and left-turn.
With regard to random variables that could affect user behavior, for all examined cases, the authors considered:
- regular pavement, without distresses, ensuring high structural and functional performances (e.g., load bearing, adherence, regularity…);
- no adverse weather condition—the pavement is not contaminated, and the visibility is not impaired;
- efficient vehicles, both passenger cars and bicycles, with regular braking performances [37]; and
- an optimum and unobstructed view, to avoid impact.
All trajectories of users start from the stop lane and end after the pedestrian crossing; the turns are composed of three branches—a starting transition curve, a circle arc, and an ending transition curve. The clothoid spiral (n = 1, Cornu spiral) has been adopted to design paths with a variable curvature, because it ensures a good geometric assimilation of the most probable planimetric trajectories of road vehicles [25]. The users always start and arrive, centered, with respect to their lane; for intersections without a cycle path, the authors assumed that cyclists leave and arrive 0.75 m off the right-edge of the outer lane.
Different trajectories have been designed to describe different user behaviors. All turn trajectories are symmetrical (starting and ending clothoids are the same). For circular curves, the vehicular minimum radius complies with the Italian standard [35], and takes into account the geometry of the intersection for the right-turn. Therefore, it respectively varies between 10 m and 6.5 m. The minimum radius for bicycles curves is 3 m, according to the Italian standard of bike paths [38].
In the first part of the proposed method (summary approach), the envelope of interfering trajectories allowed the identification of the conflict areas, and the calculation of their extension. Moreover, the speed of cyclists, assumed to be constant and equal to 10 km/h, during the maneuver, allowed the estimation of the exposure time to the collision risk.
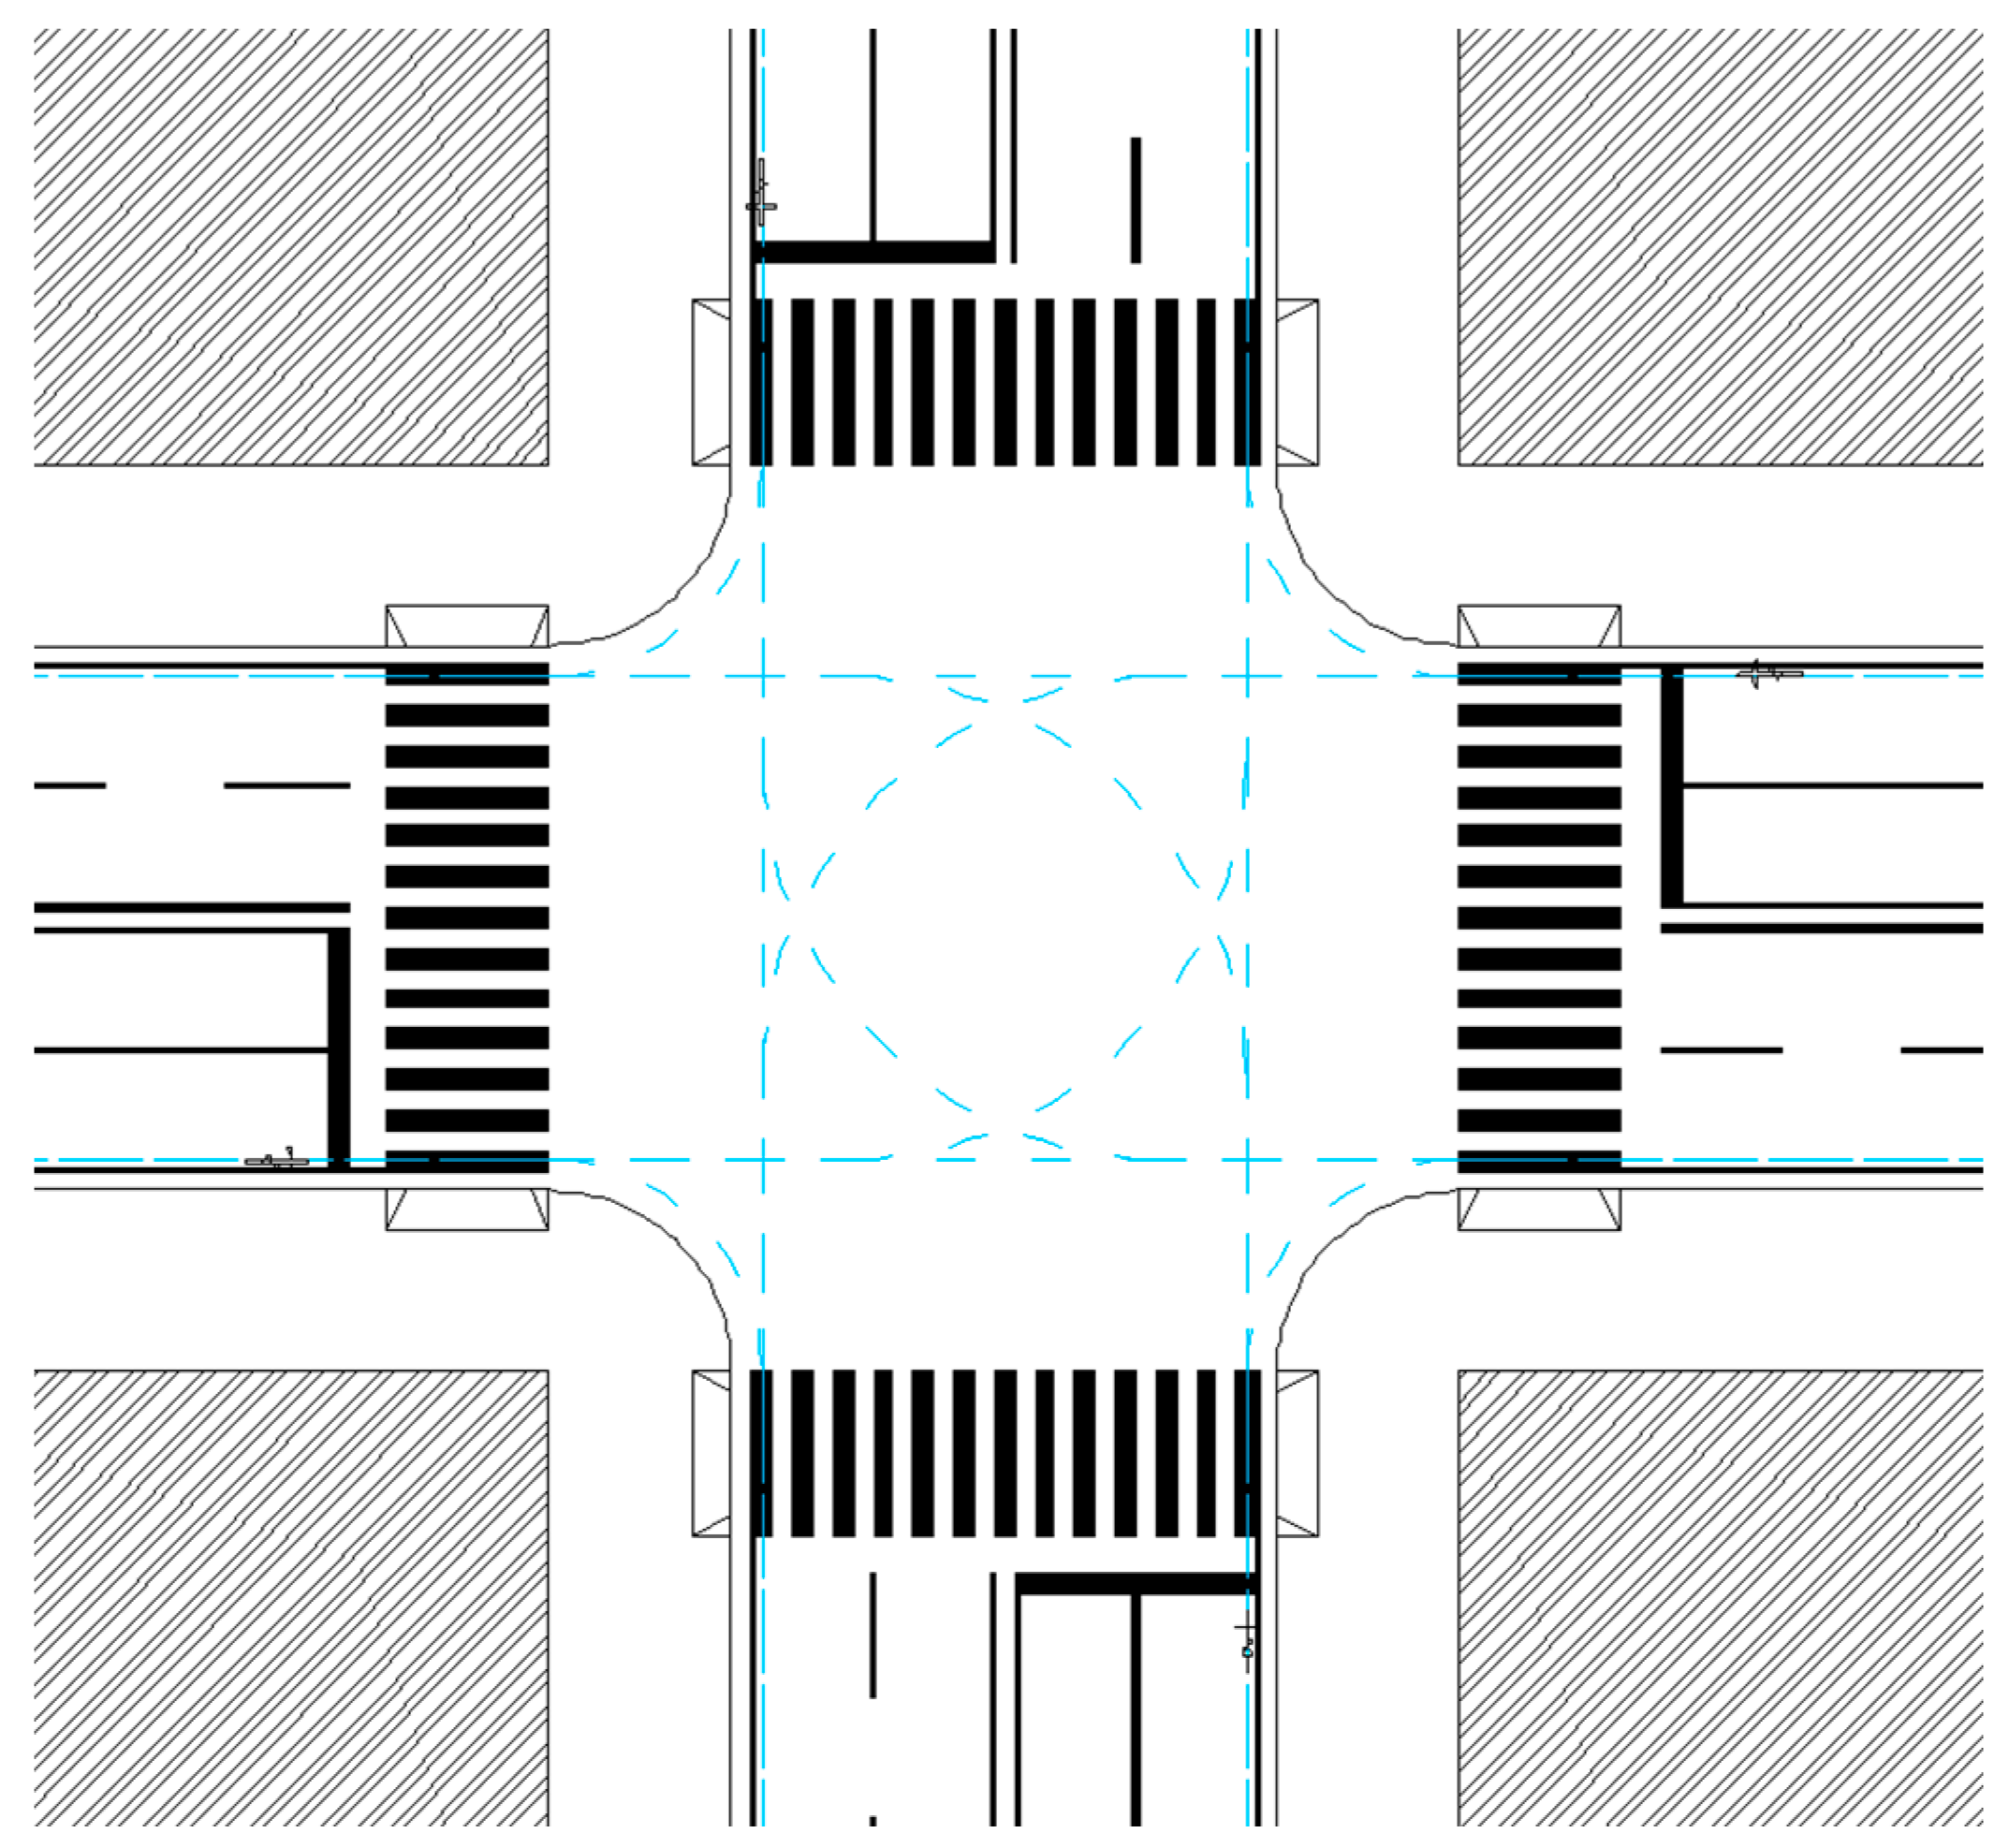
These variables allowed the road designers to identify the most critical conditions and quantify their severity, during the first step of the risk analysis. The overall risk of vehicle–bike collisions is calculated after the second step of the method (elementary approach). In this part, the elementary trajectories are considered—they represent the “average” path of a user moving from i to j. Figure 3 represents the elementary trajectory diagram of bike maneuvers, at the intersection represented in Figure 1a.
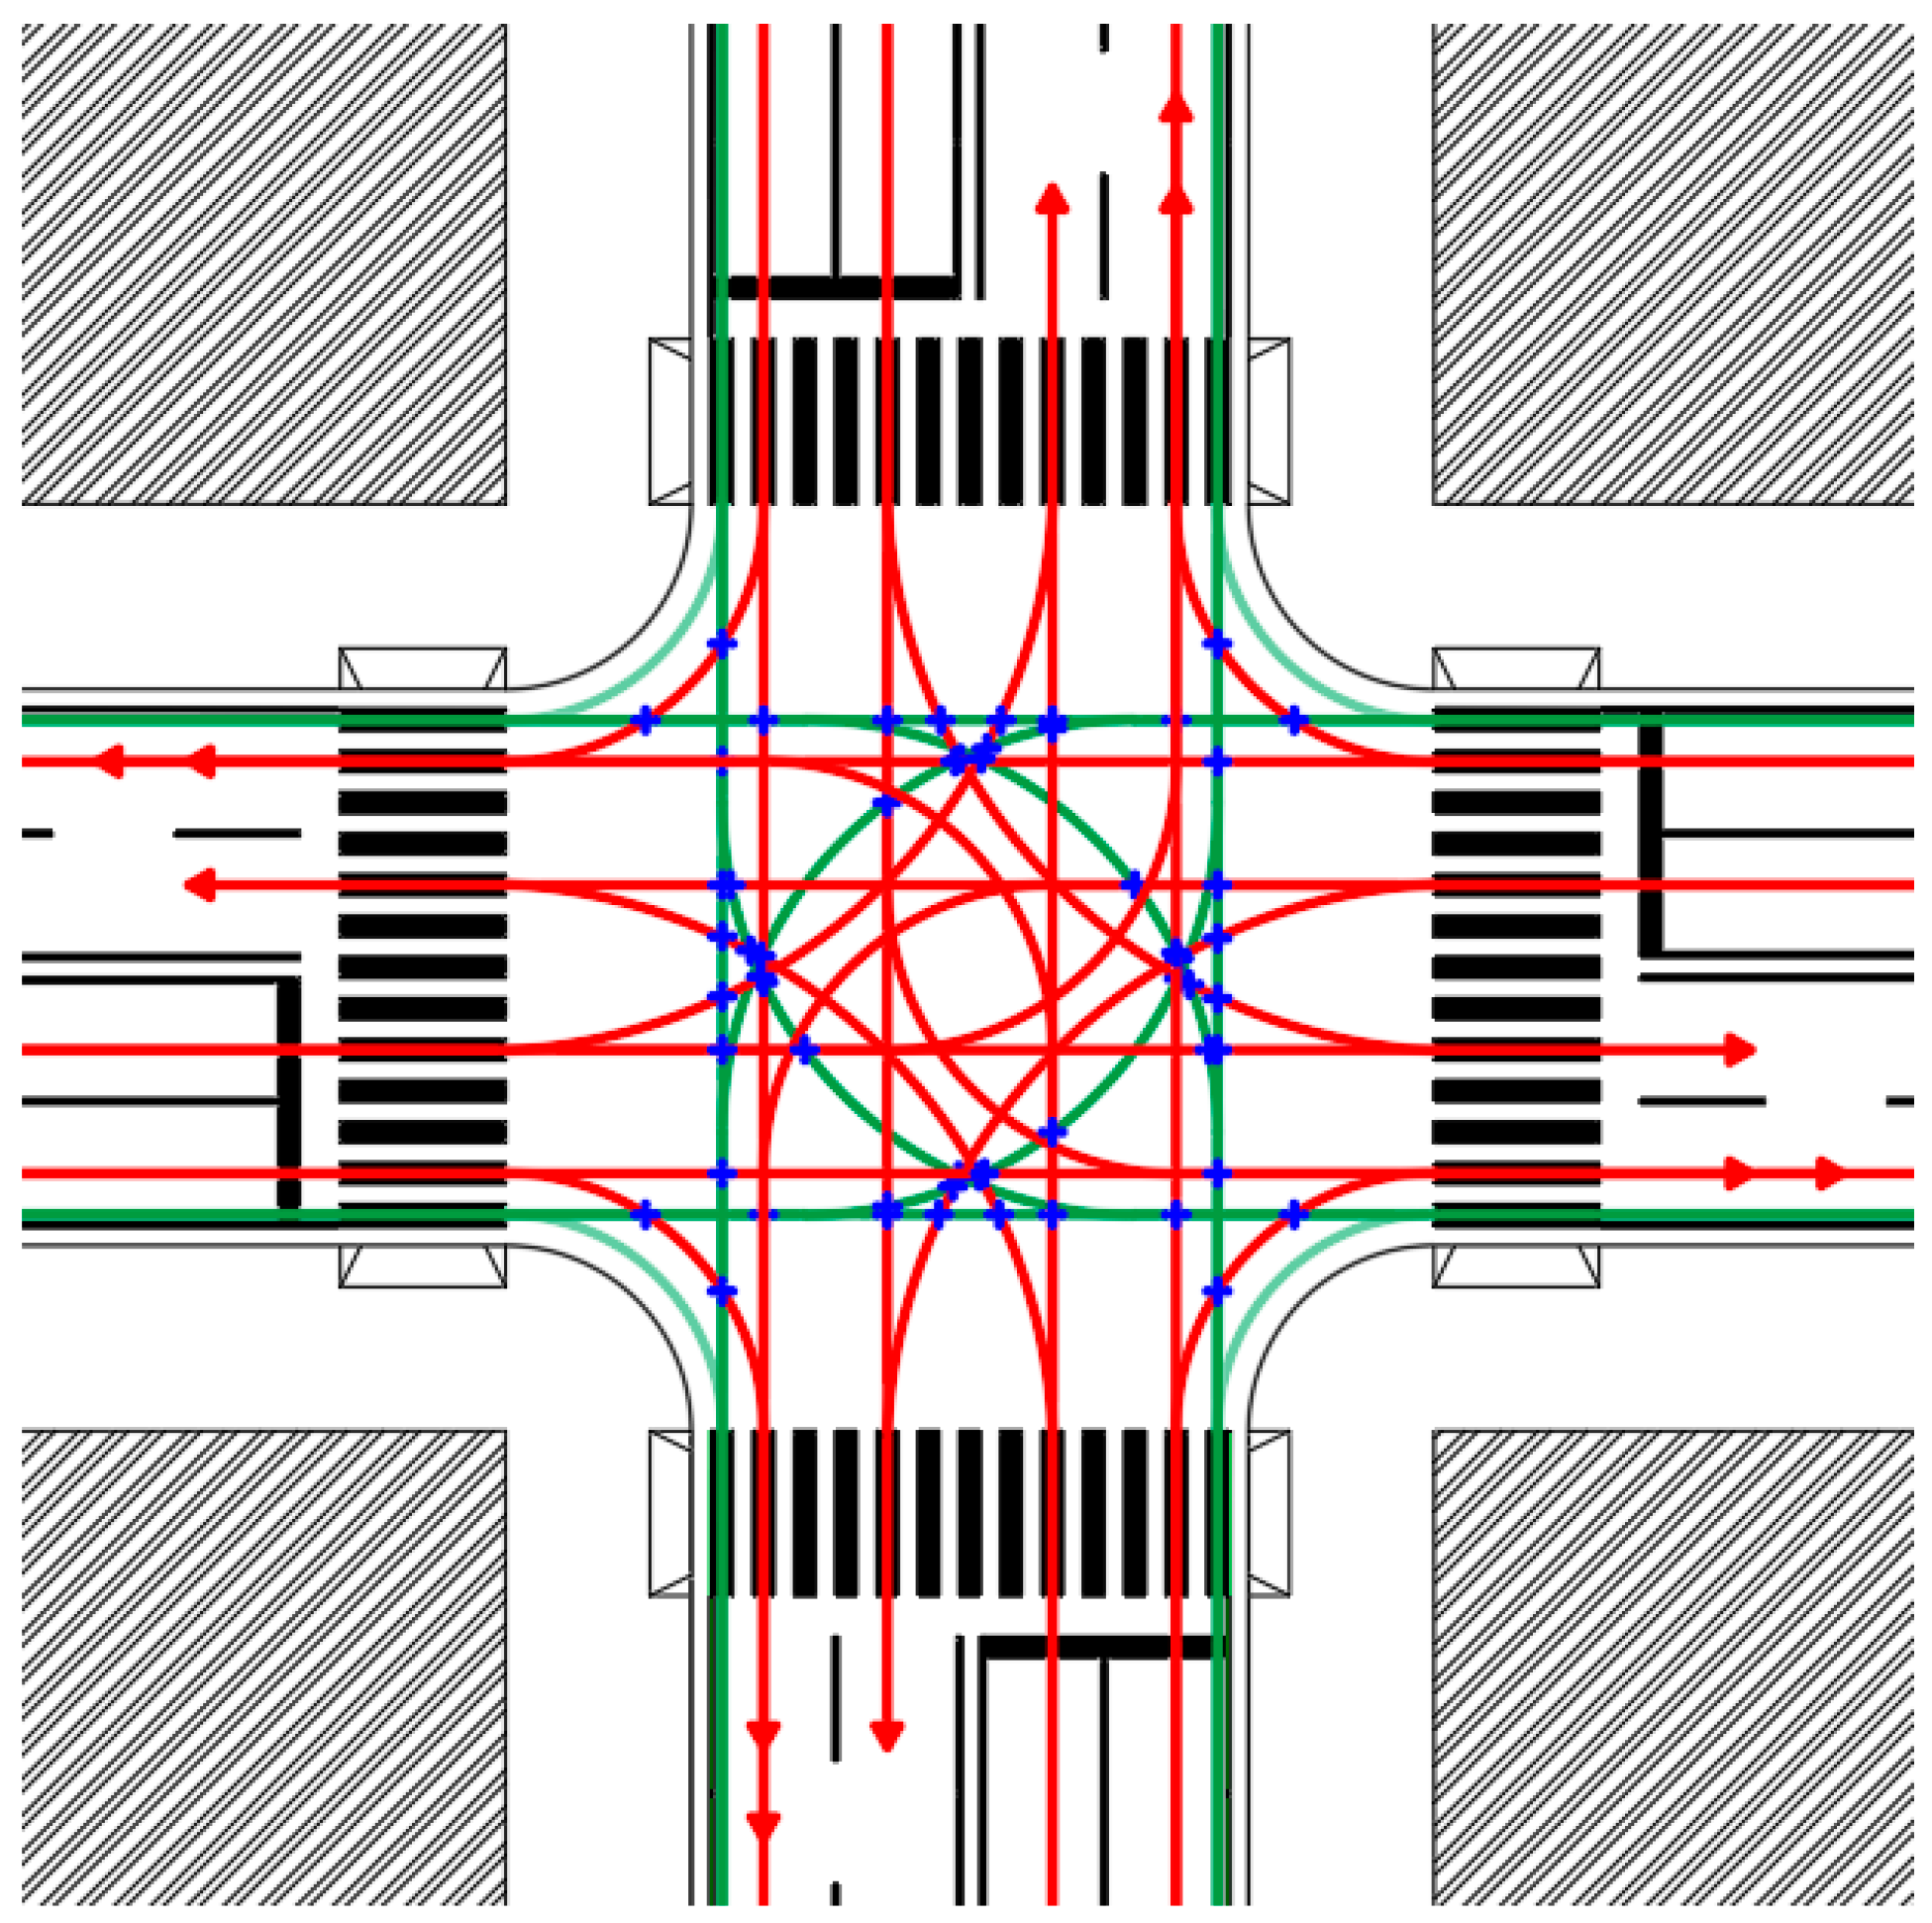
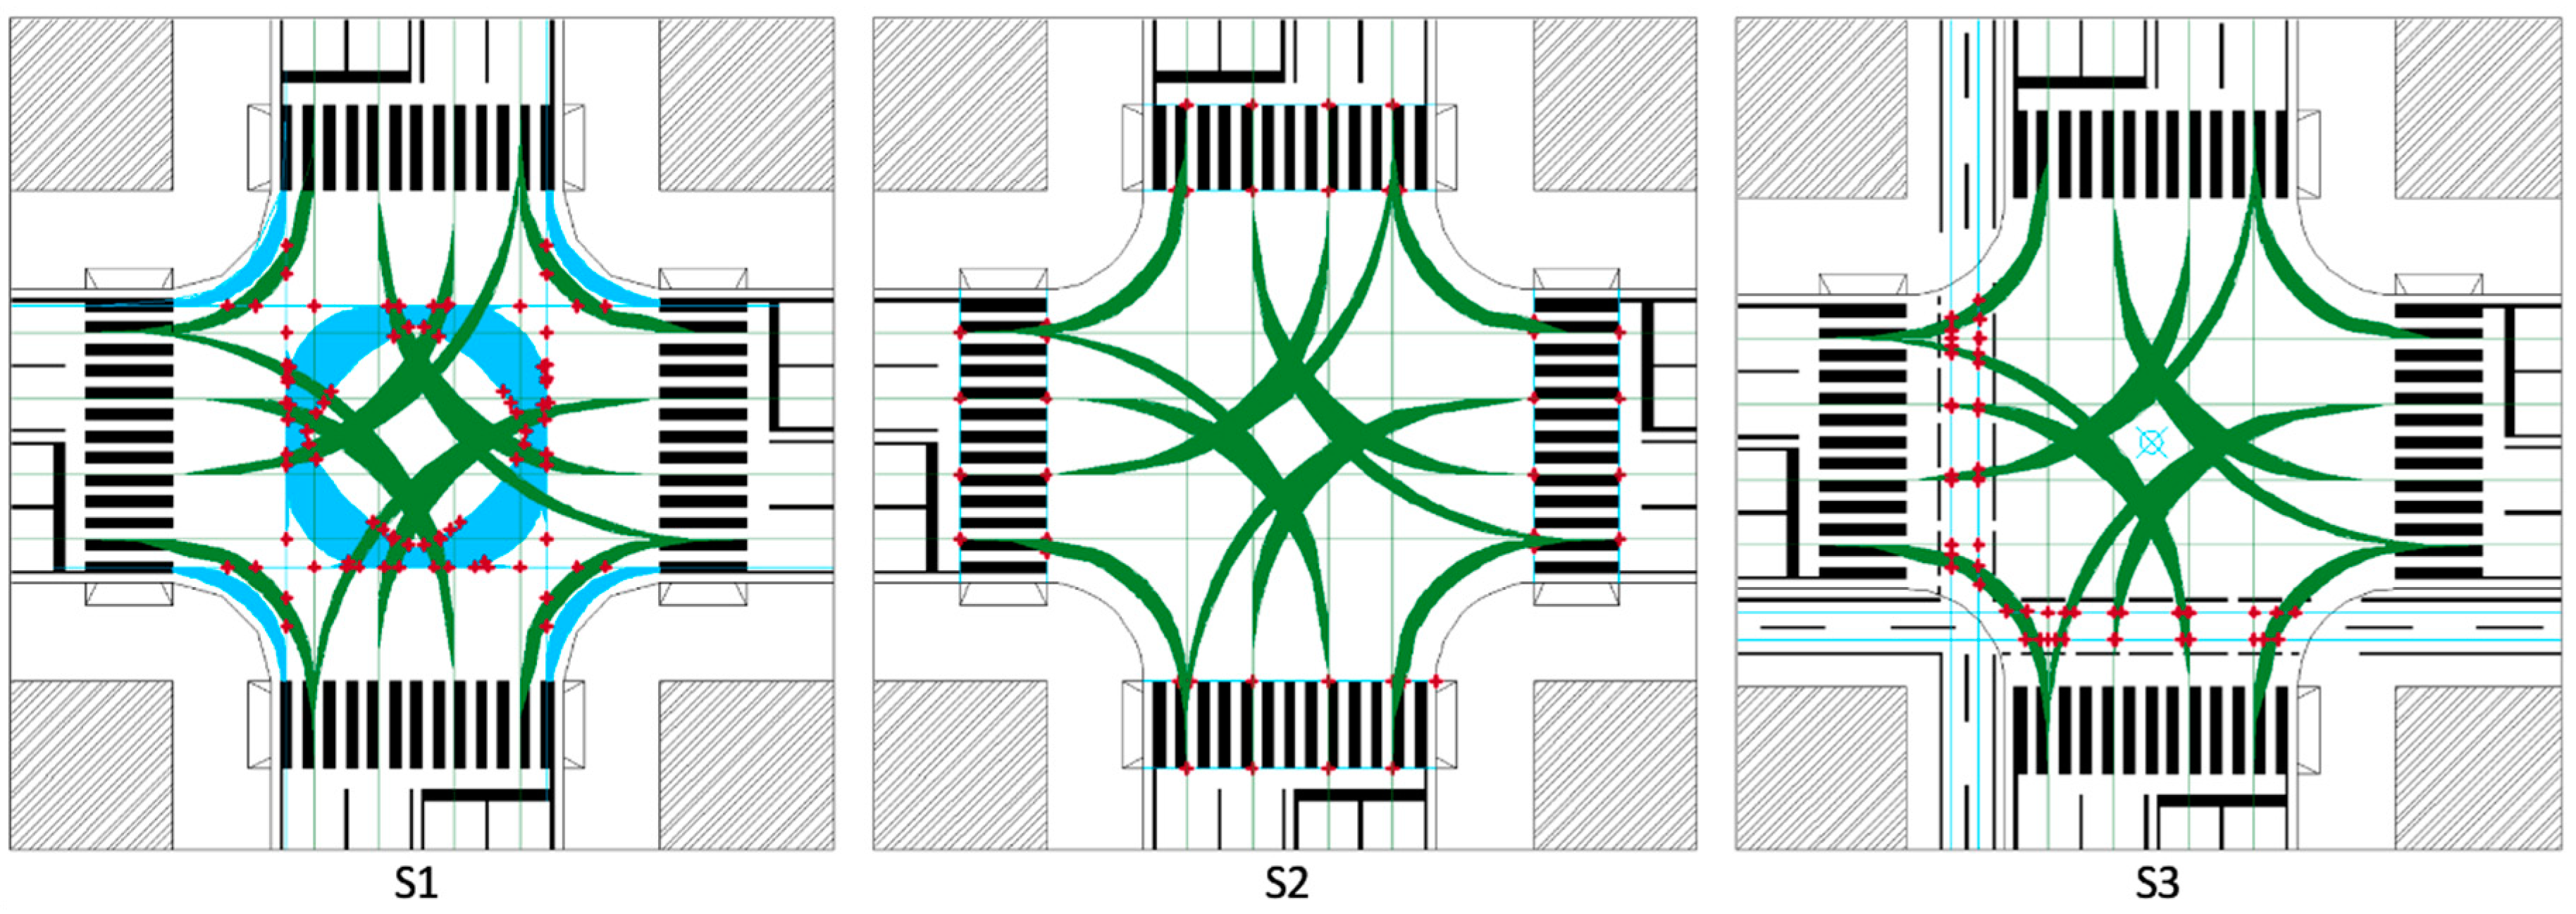
This elementary approach permits the identification of all trajectories and conflict points, at any intersection configuration, and to quantify their related risk. Indeed, an Australian study demonstrated that the probability of road incidents for cyclists, depends on the intersection scheme and the type of conflict point [39]. As a consequence, this analysis considered each conflict point detected in each scheme (Figure 4), and the trajectory length for each maneuver, until it meets up with the obstacle.
2.1. Summary Approach
In Figure 4, the bikes’ trajectories are blue, the vehicles’ trajectories are green. According to the Transportation Research Board Access Management Manual [40], traffic conflict points occur where vehicle paths cross, merge or weave, and the drivers take evasive actions to avoid collision. In this research, all possible conflict points between the motorized vehicles and bicycles, have been considered—bicycle-to-bicycle conflicts were not considered because their frequency is low in Italy [41]. In Figure 4, the detected conflict points at a four-lane four-arm intersection are red—there were 56.
The available stopping time (AST) is the time available to a user to avoid a collision—it is measured in s. It was calculated by the hypothesis that the vehicle moves from the stop line, with a constant speed of 20 km/h. AST has consequences on the users [42]—if it is at least equal to the sum of the overall response and brake times (required stopping time—RST, measured in s), then the risk of a lethal impact is negligible according to Equation (1).
AST ≥ RST
Zangenehpoura et al. [43] defined a hazard scale as a function of AST. In this study, the authors defined a hazard classification, based on the Italian standard of road design [35]. Equation (2) takes into account the required braking time (RBT, measured in s; 0.628 s covered in 3.49 m, with a constant speed of 20 km/h) and AST to obtain the available reaction time (ART). Therefore, ART is the time available to a driver for perception, reflection, reaction, and implementation:
AST − RBT = ART
Accordingly, the minimum safety condition is given by Equation (3):
where RRT is the required reaction time(s).
ART ≥ RRT
According to the Italian standard, under the above listed hypotheses, at urban intersections RRT is at least 2.6 s for drivers and 1 s for cyclists [38]. At urban intersections, RRT may be increased by 3 s. In this study, under the hypotheses regarding a regular pavement, normal psycho-physic state of users, and not adverse weather conditions, the authors assumed RRT equal to 3 s, and defined the adimensional damage level D, according to Equation (4):
Equation (4) assumes the condition stated in Equation (5) to be a necessary condition for an interaction between the vehicles and the bikes:
ART < 1.5 RRT
Table 1 lists the danger classification proposed by the authors—when ART is less than half RRT, the conflict point is assumed to be very dangerous.
2.2. Elementary Approach
Since the traffic is typically a random process [44], in order to assess the risk of a bicycle–vehicle crash, relative to each conflict point, the authors defined a procedure to evaluate the probability of collision between the two classes of users. The probabilistic approach takes the following into account:
- the events that generate an opportunity for crash are all allowed maneuvers (i.e., crossing, left-turn, and right-turn);
- the mean hourly number of arrivals is equal from each approach, but the hourly vehicle flow QV does not necessarily coincide with the hourly bikes flow QB;
- bicycles and vehicles maneuvers per unit of time occur by a Poisson process, as shown by other transport risk analysis [45], according to Equation (6):
- the elementary unit of exposure is defined by Elvik et al. [32] (i.e., 1 s); therefore, according to Equation (6), the probability of at least one arrival (vehicles or bikes) during 1 s, is given by Equation (7):λ is calculated according to Equations (8) and (9), respectively, for the vehicles (λV) and bikes (λB):
- each maneuver from different approaches is independent of each other [13]; therefore, the probability that a vehicle p(V) impacts a bicycle p(B), within the same 1 s, is calculated according to Equation (10):where both p(V) and p(B) are calculated according to the Poisson distribution;
- the binomial distribution describes the real probability P that at least one crash might occur at the intersection where N conflict points have been detected according to Equation (11):where p is the probability of occurrence calculated according to Equation (10), and q is given by Equation (12):
The results of the probabilistic approach, combined with the danger approach proposed by the authors, allow the risk assessment of the vehicle–bike collision, for the examined intersection. Indeed, Equation (13) gives a quantitative and reliable risk value.
2.3. Overall Risk of Collision
Equation (15) permits to assess the risk Rij of collision between the ith vehicle path and the jth bike path:
The proposed methodology has been applied to different intersection schemes:
- Scheme 1 (S1) is a symmetrical four-arm intersection without a bike path. The cyclists use the carriageway to cross the intersection (Figure 5a);
- Scheme 2 (S2) is a symmetrical four-arm intersection without a bike path. The cyclists use the pedestrian crossings to cross the intersection, using the shortest paths (Figure 5b);
- Scheme 3 (S3) is a four-arm intersection with a bike path (Figure 5c).
In all schemes, the four approaches are named with Roman numerals from I to IV attributed counterclockwise from the Northern arm. Therefore, the notation II-III means the right-turn from arm II to arm III; II-IV means the crossing from arm II to arm IV. In order to distinguish the vehicle maneuvers from the bike ones, the authors will use an alpha-numerical notation, e.g., (I-IV)V and (II-IV)B, respectively, mean the left-turn of vehicles from arm I to arm IV and the crossing of bicycles from arm II to arm IV.
3. Results
3.1. Summary Approach
The implementation of the first part of the proposed methodology permitted the following (Figure 6 and Table 2):
- Identification of the conflict areas: The envelope of different vehicle and bikes paths, from and to the same approaches, formed a whole conflict area. In this paper, all vehicles paths are green and all bike paths are orange.
- Calculation of the whole extension of conflict areas (ECA): ECA was the sum of the envelopes of conflict areas detected at the intersection.
- Identification of the most interfering maneuvers detected, according to the calculated conflict areas.
- Identification of the most dangerous maneuvers detected at the intersection, according to the minimum available ART.
- To calculate the cyclists’ exposure time to vehicles (ET).
The configuration S1 had the widest ECA and the shortest maximum ART of the examined schemes. With regard to ET, its minimum value referred to the right-turn, while the maximum one referred to the left-turn; this condition accounts for any combination of starting–ending approach.
In S2, the largest conflict area was lower than that of S1, but ECA was wider than that in S1. ET values were comparable to those obtained for S1, but the minimum ART was 0.0 s—the driver did not have time to avoid the collision.
In the configuration S3, the right-turn depended on the position of the bike path. According to Figure 5c, the paths (I-II)B and (III-IV)B were longer than those of S1—the cyclist should cross the intersection before turning right. However, the most disadvantaged path was (IV-I)B which required two crossings before its end. The exposure time significantly depended on the layout—for each type of maneuver, ET varied widely. Indeed, its range between the maximum and minimum values was more than 17 s, both for left and right-turns, while the crossing ETs were comparable to those of S1 and S2.
3.2. Elementary Approach and Overall Risk Calculation
The elementary approach has been applied to determine the probability of crash for each conflict point CPs and, thereafter, to assess the risk of the whole intersection. The last variable has been assessed by considering all CPs and by calculating the driver’s ARTs, for each configuration; then, according to the danger classification proposed in Table 1, the conflict points have been identified in the geometrical layouts of Figure 5, and classified according to Table 1. The results are listed in Table 3.
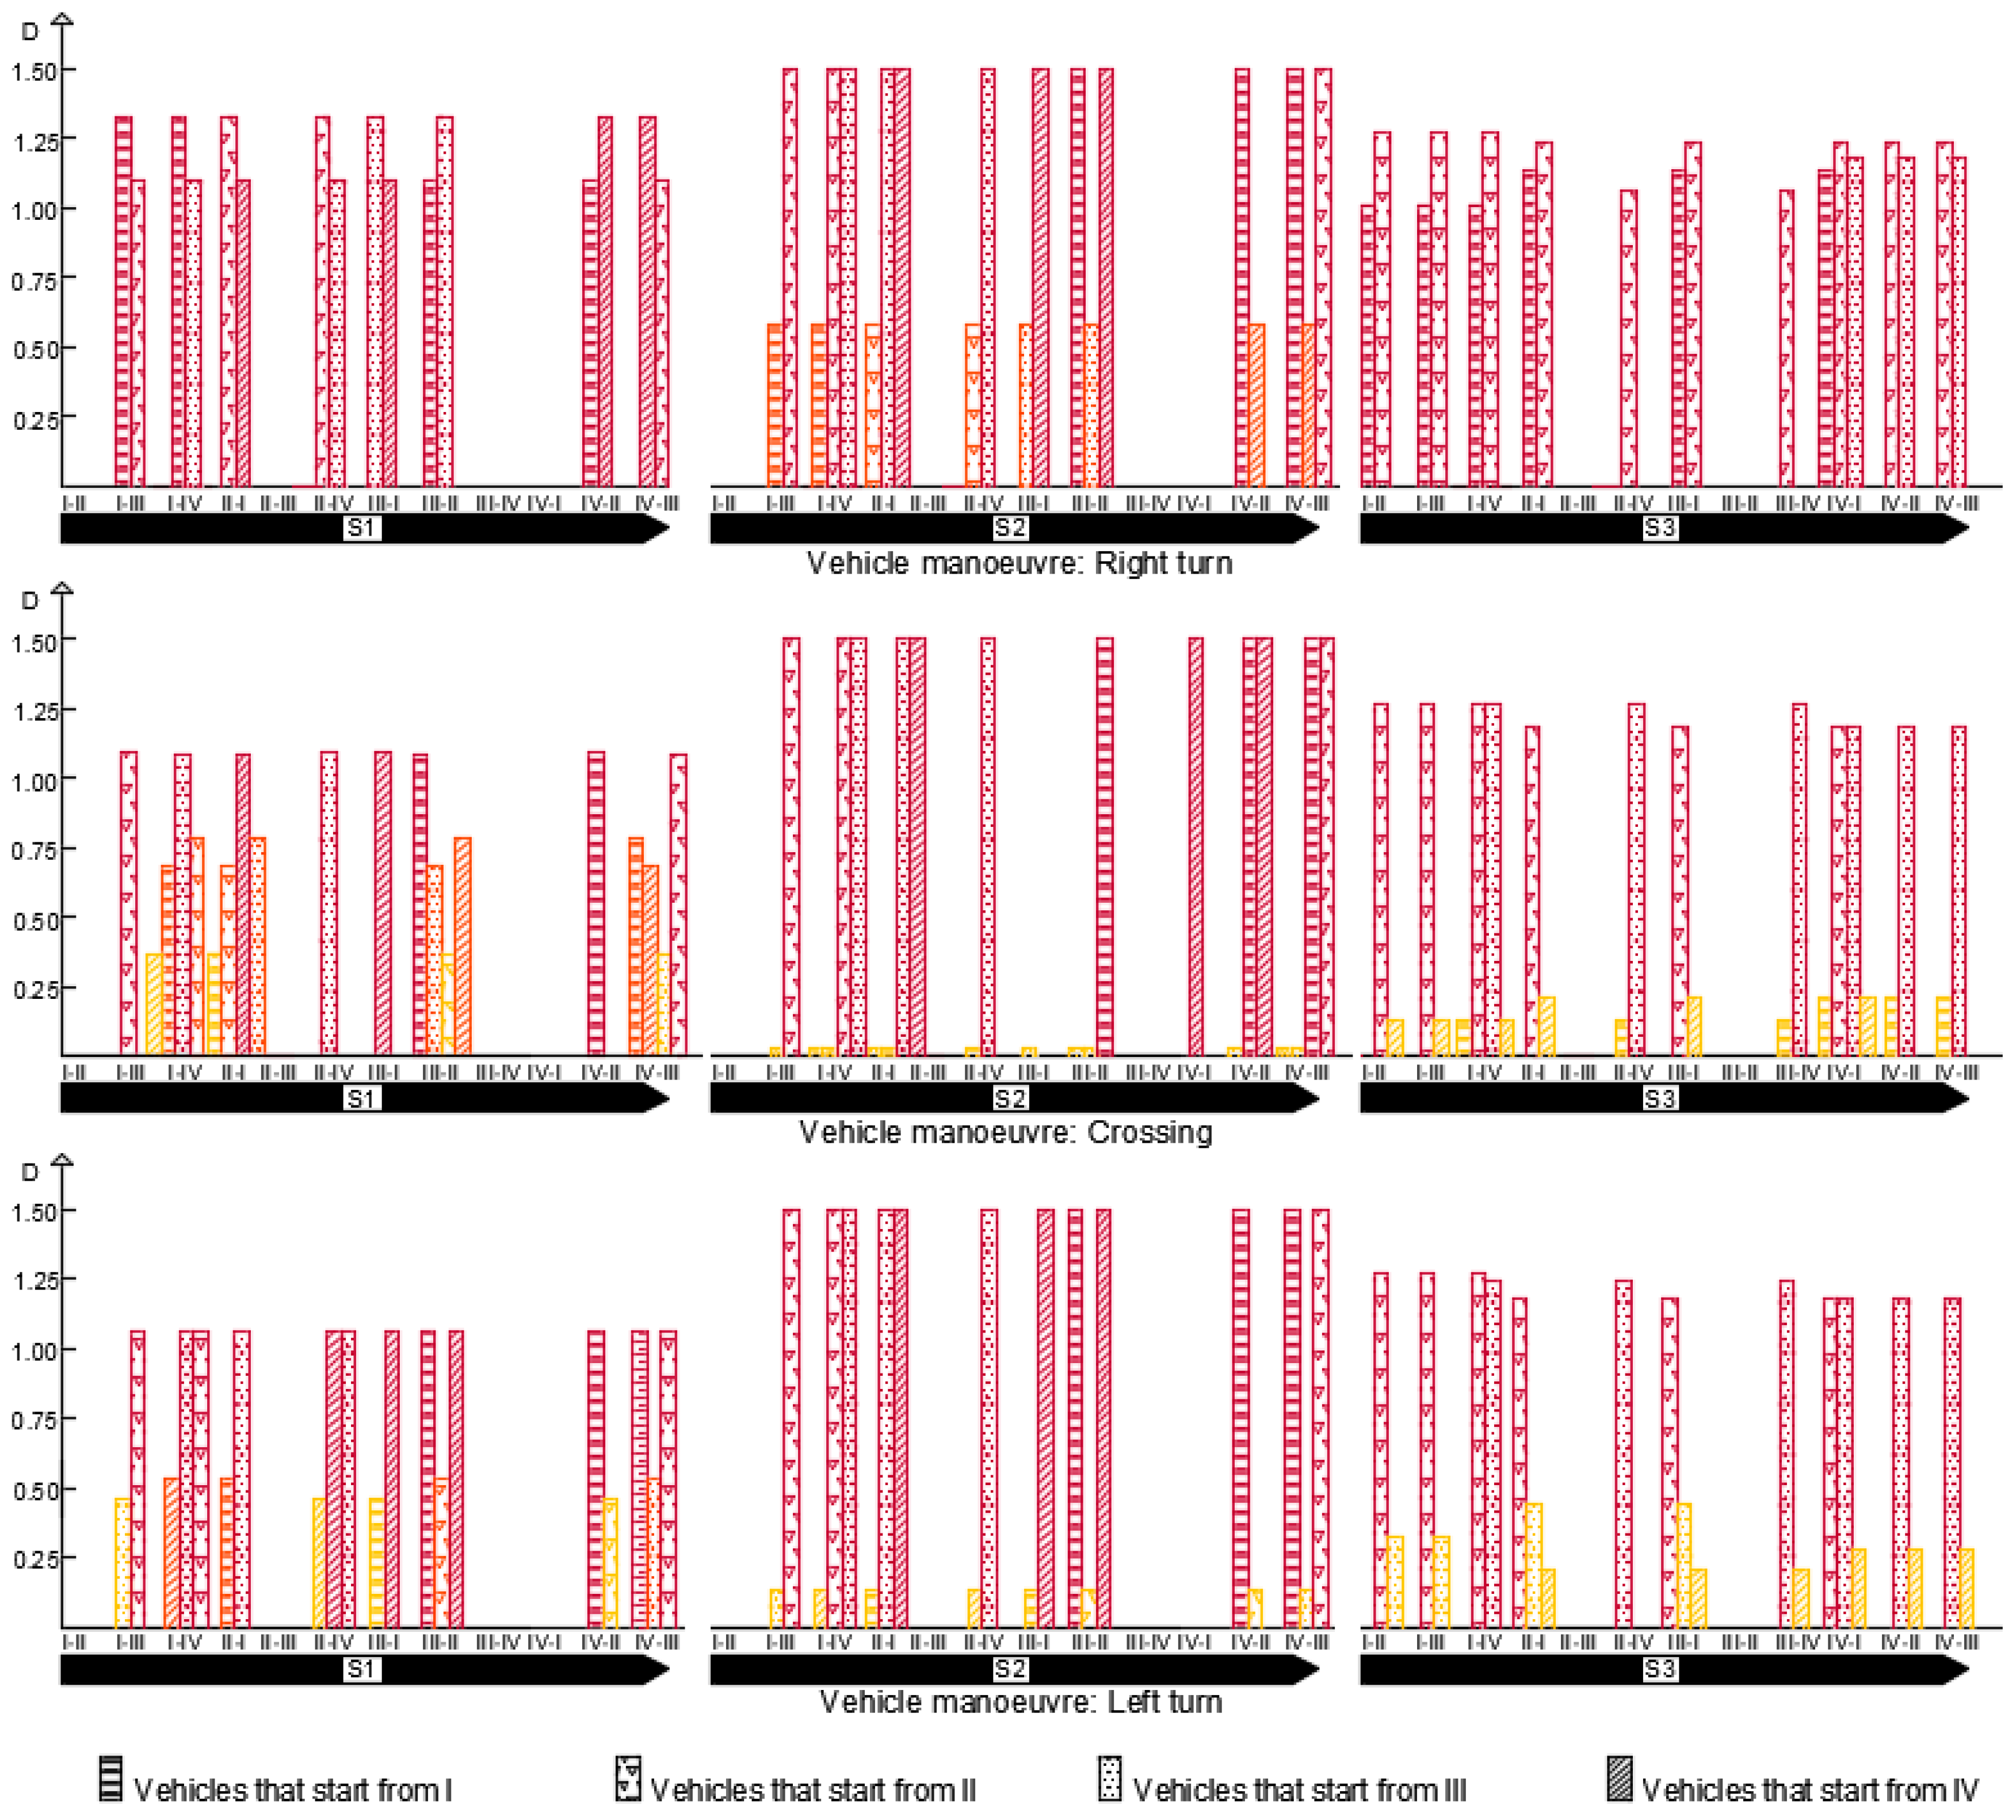
The analysis of CP, per allowed maneuver of a vehicle, provided the results in Figure 7. Each bar graph represents the damage level D, calculated for each detected CP, when vehicles turn right, cross, or turn left, and bikes move between the specified arms. The bar’s colors are compliant with those in Table 1. Therefore, the top-left bar graph represents the damage level for bike paths conflicting with vehicles turning right, at intersection S1. In contrast to the data listed in Table 3, Figure 7 represents the D values of all functional CPs, which can possibly coincide. In Table 3, coincident CPs have not been considered; Figure 7 represents the opposite of this scenario.
The bar graphs highlight:
- S1 had the lowest number of functional CPs (i.e., 56), but most of them were red, none was green. The D values did not achieve the maximum value.
- S2 had 64 functional CPs and most of them were red; right-turn was the most dangerous maneuverer because its ART was 0 s, therefore, D had the highest value (i.e., 1.5). On the other hand, when compared to the other two schemes, S2 had the lowest values of D (i.e., slight interaction) in 19 yellow CPs.
- S3 had 64 functional CPs and more than half of them were red.
Moreover, it should be noted that the most common layout (S1) implied the highest number of geometrical CPs, but the lowest number of functional CPs—the conflicts between vehicle and bicycle were spread out on the intersection (its ECA was the highest, as listed in Table 2). In S2, several CPs implied the maximum level of interaction, they were all due to the intersection of orthogonal paths—an appropriate phase for cyclist traffic might increase the intersection safety. In S3, the shared space by vehicles and bicycles changed into a shared space by pedestrian and cyclists Moreover, this scheme could not be designed without traffic lights because there was a functional problem (Figure 8)—the interaction between cyclists and vehicles could cause queuing over the calculated conflict areas (Figure 6).
Table 4 lists the values of R with hourly flows QV and QB, equal to 200 and 50 veh/h, respectively. These values complied with the average traffic flows surveyed by the authors in Rome, Italy.
Three classes of risk have been defined by the authors, taking into account the values of minimum and maximum Rij listed in Table 4—each class represent an order of magnitude, according to Table 5. Table 6 represents the Rij distribution for the examined schemes.
The results showed that, for all schemes, more than 65% of the detected CPs belonged to the highest class of risk (i.e., α), whose Rij ranged between 10−1 and 10−2. In S3, no CP belonged to the class of risk γ, while in S1 and S2, 26% and 17% of CPs belonged to it, respectively.
The most critical vehicle maneuver was the right-turn, due to the short length of the trajectories which caused a very short value of ART. Indeed, in S1 and S2, all CPs due to a vehicle right-turn belonged to α; while in S3, 2% of CPs belonged to β. Moreover, this maneuver resulted in poorly dispersed trajectories, thus, the interaction between vehicles and bikes was high.
Left-turns in S2 and S3 had similar percentage risk distribution between β and α, while in S1 it could be observed that the distribution was more erratic. Moreover, the results of crossings analysis revealed that this type of movement was highly affected by the geometric layout of the intersection.
4. Discussion
The proposed quantitative risk assessment method was useful to calculate the current level of risk for different intersection grades. It has been applied to an urban grade intersection that experiences vehicle and bike flows, respectively 200 and 50 vehicles/h. All crossing, left-turn, and right-turn maneuvers were considered, in terms of those that would be available to all users. Three geometrical configurations were considered, in the following order:
- to locate the whole extension of the conflict areas identified by the envelope of interfering trajectories;
- to identify the most dangerous maneuvers, in terms of the time available to the vehicle users to avoid a collision, and the exposure time of cyclists; and
- to assess the current crash-risk between vehicles and bicycles.
The most critical configuration was S1 (Figure 5a)—it had the highest number of conflict points (i.e., 56), the highest conflict area (i.e., 10.88 m2), and both, the maximum and minimum ETs were high (respectively, 15.76 s and 6.76 s). In addition, the vehicle might meet with cyclists coming from different directions, as shown in Figure 4. In the other two schemes, the points of conflict, between users, always formed at the cross between two perpendicular trajectories.
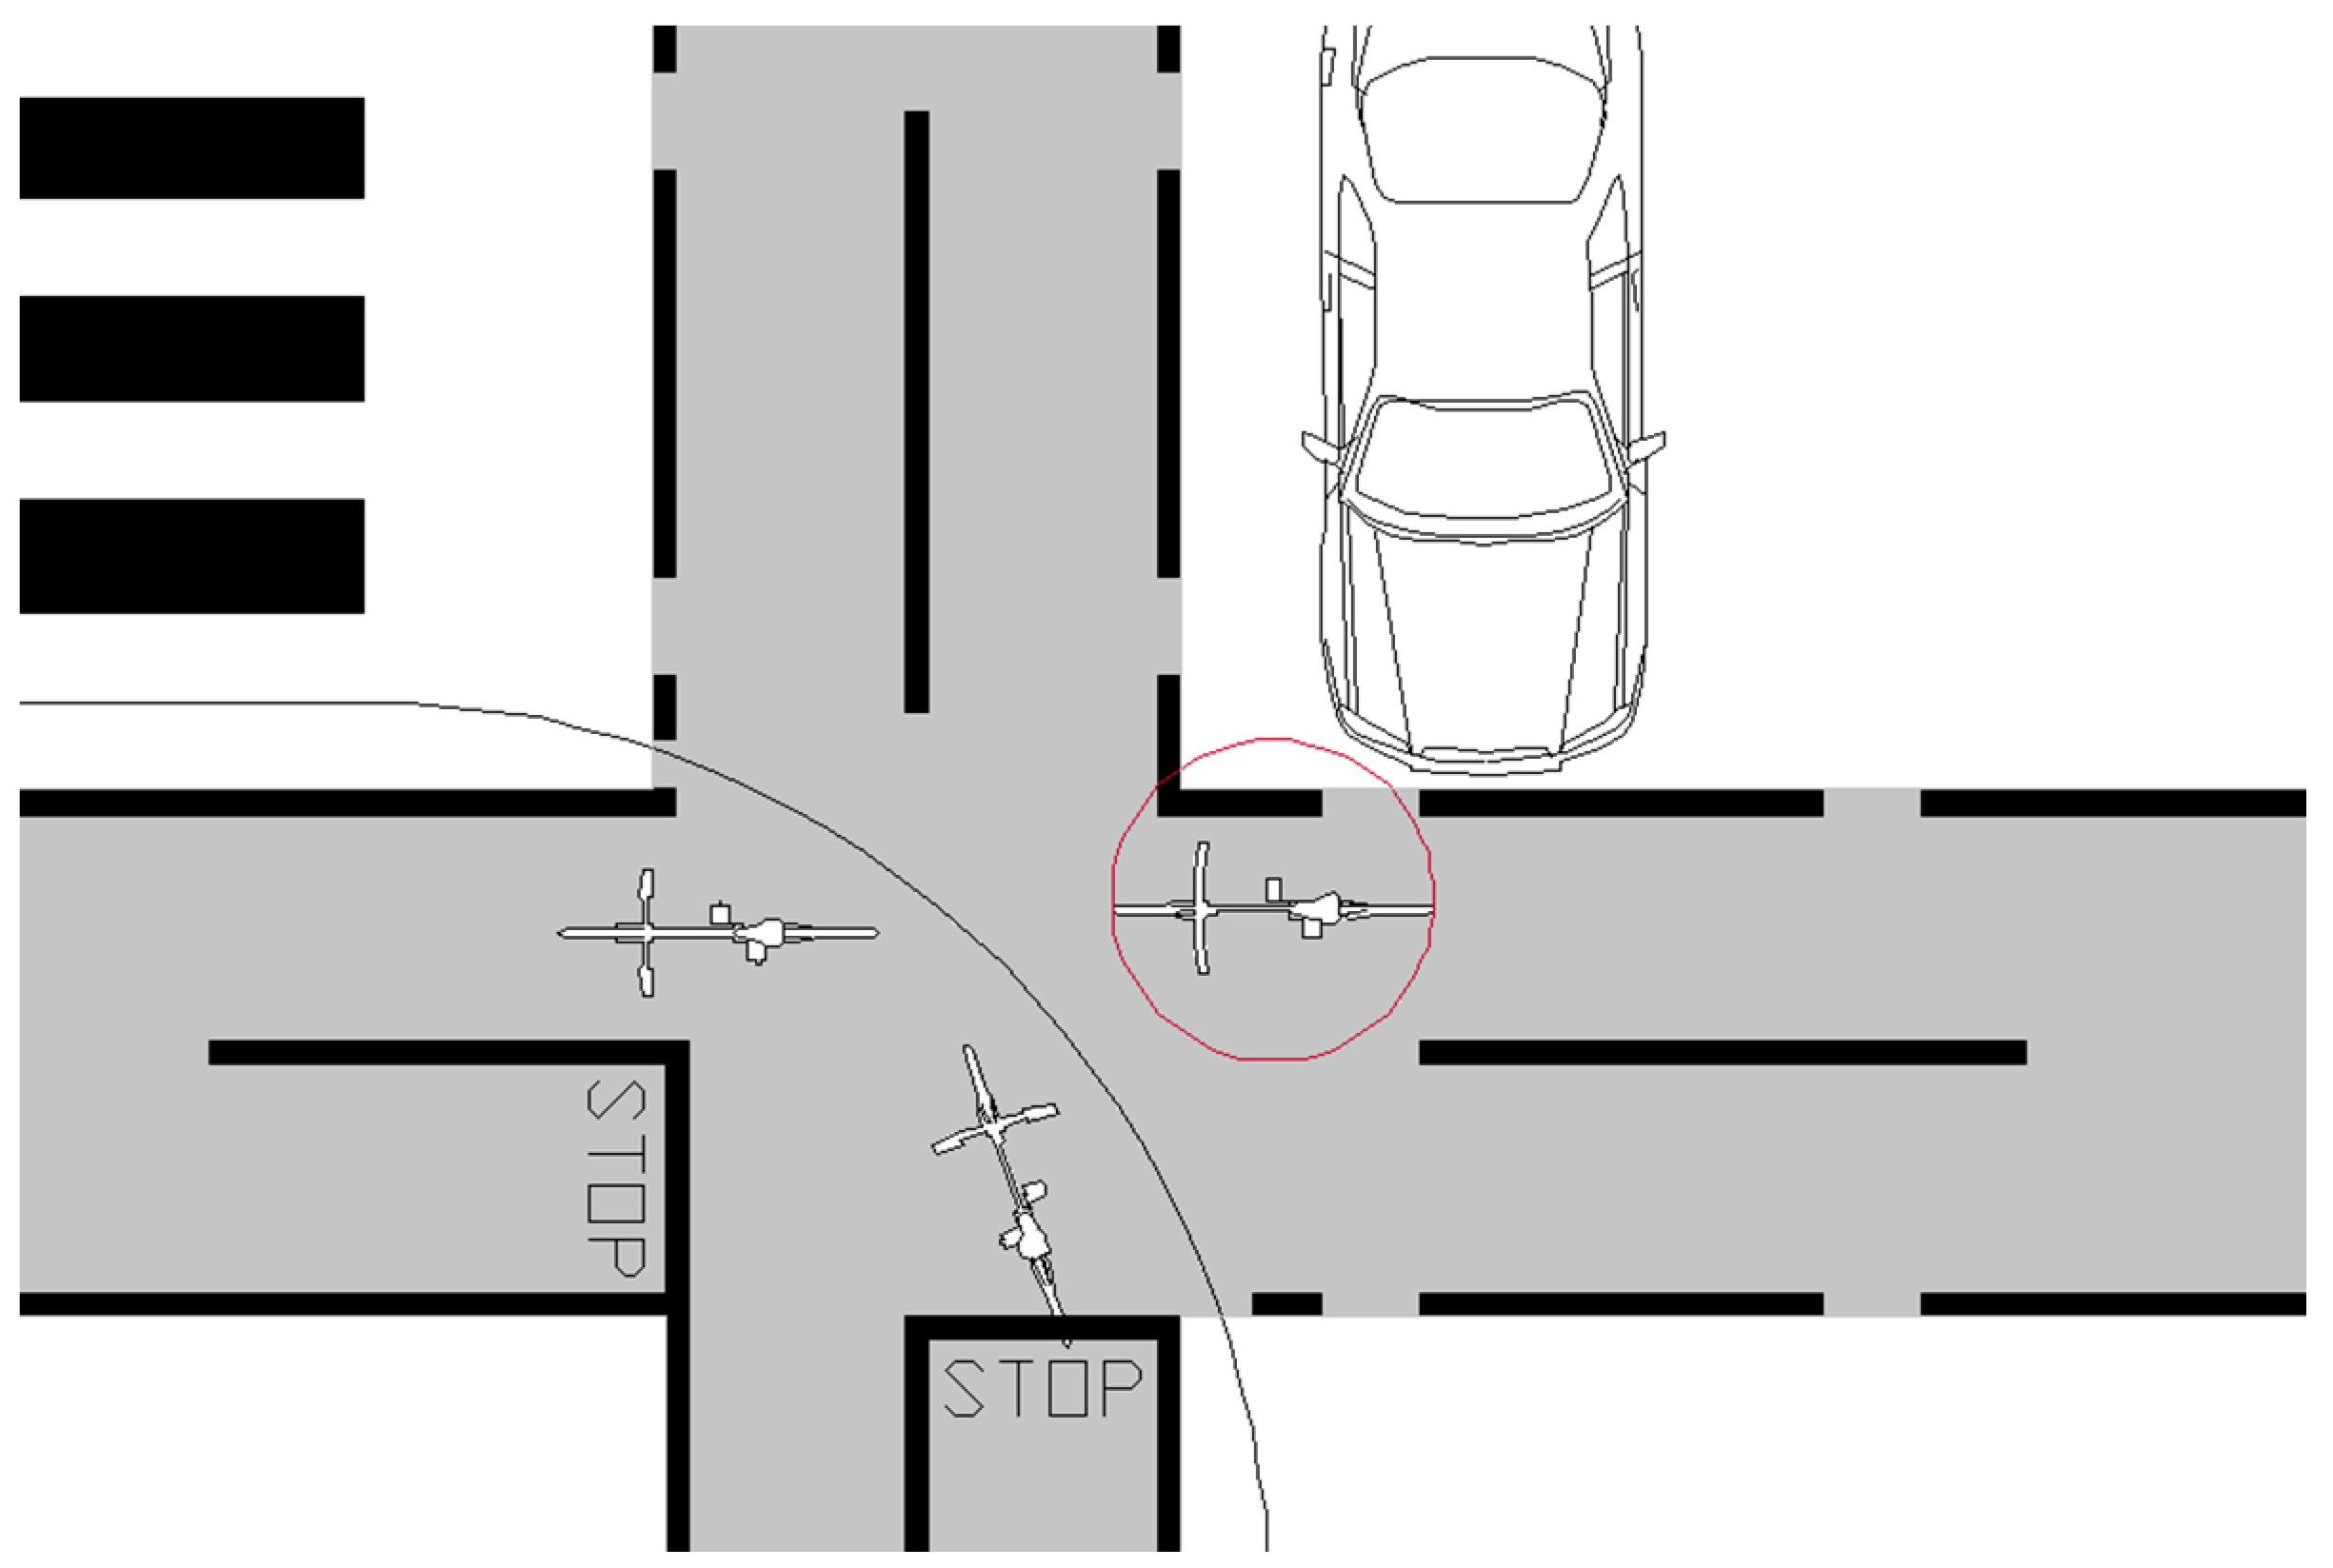
It was noted that when cyclists used pedestrian crossings to follow their travel itinerary (S2, Figure 5b) they had very dangerous conflicting points. This is because the vehicle would have to pass over the pedestrian crossing in its starting direction, so the ART in this case was null. Additionally, the area of conflict for this scheme was very large because the dispersion of the cyclist’s trajectories was throughout the pedestrian crossing area, whose width was 4 m.
On the contrary, ECA at an intersection with the cycle path was very small, compared to the other schemes. This was because the dispersion of the cyclist trajectories in a bicycle path was lower, with respect to an intersection without a cycle path. However, in S3 (Figure 5c) the conflicting points were classified as very dangerous, because the vehicles crossed the cycle path at the beginning of their intersection trajectories. These results suggest that different types of users should travel in dedicated areas to ensure their safety.
The defined approach has been implemented on two four-arm symmetrical intersections (i.e., S1 and S2) and one four-arm intersection with bidirectional bike facility adjacent to the carriageway (i.e., S3). However, the method could be implemented to different symmetrical four-arm intersections (e.g., with one lane per direction or with bike lanes in each side), or to not-perpendicular four-arm intersections and not four-arm intersections, or to intersections where not all maneuvers were permitted. Given a geometrical and functional layout, the method could evaluate the level of risk as the consequence of a modification of traffic volumes. For this purpose, the authors applied the method to three different levels of traffic (Ti), which represented possible conditions for Italian semi-peripheral intersections, in newly urbanized areas (Table 7). Particularly, T1 was representative of urban high-traffic suburban areas around major cities, where a significant two-wheel traffic volume is reflected in the proximity of places of public interest; T2 was representative of urban contexts where bicycling was encouraged; and T3 was representative of peri-urban flat areas where short journeys by bicycle were frequent and substituted motorized flow.
The obtained results allowed a comparative analysis between traffic levels and geometrical layouts—whatever the traffic volume, R of S1 was more than R of S2 and S3, and S2 and S3 had the same level of risk. These results complied with those in Table 4. The probabilistic approach underlying the proposed method did not permit the detection of significant and synthetic relations between the examined variables. However, the increase of QB (in T3, the bicycle flow was three times that of T1) implied an increase of R (in T3, the average risk of collision between the vehicles and bikes was 1.7 times that of T1).
Therefore, for each examined scenario, the method permitted the evaluation of the current level of a risk of crash, followed by a comparison to the target minimum acceptable risk level. Geometrical or functional modifications of the starting layout could be assessed in terms of the modified level of risk, in order to quantify the effectiveness of the examined strategies. The method allowed the management body to identify and decide the strategic priorities regarding interventions of safety improvement at the network level—geometric and traffic data of the network contributed to the assessment of the crash risk—which could be used in decision-making processes. The procedure can be adapted to various framework conditions by varying the input data. At the end of the risk assessment, it was possible to classify the conflict points, according their level of risk and identify the best treatments for reducing crash risks. Given a design traffic volume, modification of the geometric and functional layout of the intersection could mitigate the current risk (e.g., traffic lights setup to temporarily separate flows from different directions; stop lines retreated to extend the vehicle trajectories for a long-enough duration for them to have enough time to react, in the presence of an obstacle; design of areas reserved to cyclists and protected to eliminate the disadvantage of shared space).
5. Conclusions
The road transport sector is currently adopting growing measures to prevent crashes and reduce their consequences on people, especially when vulnerable users are involved.
This paper presents a quantitative risk analysis of urban road crashes between vehicles and bicycles. The study proposed a method to assess the real probability that at least one crash might occur as a consequence of the detected conflict points. The cinematic study of trajectories of cyclists and drivers have been considered to elaborate the quantitative damage model, which took into account the time available to the drivers, to avoid a collision. The results from the probabilistic approach, combined with the damage model, gave the quantitative risk model proposed by the authors.
The study presents the results obtained for three urban-grade intersections—a symmetrical four-arm intersection without a bike path where cyclists use the carriageway to cross the intersection; a symmetrical four-arm intersection without a bike path where cyclists use the pedestrian crossings to cross the intersection; and a four-arm intersection with bike paths.
The current risk of a vehicle–bike collision in a four-arm intersection ranged between the orders of magnitude 10−2 and 10−4, by varying the type of maneuver (i.e., crossing, left-turn, and right-turn) and the geometrical configuration of the intersection. The most dangerous maneuver was the right-turn, because it had the shortest distance and ensured the lowest reaction time to drivers, to avoid collision. On the other hand, the left-turn was the longest maneuver, which exposed the cyclist for a longer time (up to 20.7 s).
The proposed method is a valuable tool to assess the specific values of risk for different conditions (e.g., geometry of intersection, traffic volume, average speed, available maneuvers, etc.) and to propose the minimum acceptable risk levels, by comparing the obtained results. Moreover, the approach will allow the road management body that identifies and decides strategic priorities regarding interventions, to improve the safety level at urban intersections where vulnerable users are expected. The approach is reliable and flexible; therefore, it permits an assessment of the effectiveness of reducing risk, when geometrical and functional modifications are made—it provides comparable risk values; therefore, it could be efficiently used to further support and improve on-going safety efforts.
Author Contributions
Conceptualization, G.C.; Data curation, L.M.; Formal analysis, L.M. and Y.D.A.B.; Investigation, Y.D.A.B.; Methodology, G.C.; Writing—original draft, Y.D.A.B.; Writing—review & editing, G.C. and L.M.
Funding
This research received no external funding.
Conflicts of Interest
The authors declare no conflict of interest.
References
- International Transport Forum (ITF). Road Safety Annual Report 2017; OECD Publishing: Paris, France, 2017. [Google Scholar]
- Kirolos, H.; Alluri, P.; Gan, A. Analyzing Pedestrian Crash Injury Severity at Signalized and Non-Signalized Locations. Accid. Anal. Prev. 2015, 81, 14–23. [Google Scholar]
- Levulytė, L.; Baranyai, D.; Török, Á.; Sokolovskij, E. Bicycles’ role in road accidents. A review of literature. Transp. Telecommun. 2016, 17, 122–127. [Google Scholar] [CrossRef]
- Loprencipe, G.; Moretti, L.; Cantisani, G.; Minati, G. Prioritization methodology for roadside and guardrail improvement: Quantitative calculation of safety level and optimization of resources allocation. J. Traffic Transp. Eng. 2018, 5, 348–360. [Google Scholar] [CrossRef]
- United Nations (UN). Improving global road safety. In Resolution Adopted by the General Assembly; United Nations: New York, NY, USA, 2010. [Google Scholar]
- Community Road Accident Database (CARE). Community Road Accident Database; CARE: New York, NY, USA, 2016. [Google Scholar]
- European Commission. Roadmap to a Single European Transport Area—Towards a Competitive and Resource Efficient Transport System; COM: Brussel, Belgium, 2011. [Google Scholar]
- Canale, S.; Leonardi, S.; Pappalardo, G. The reliability of the urban road network: Accident forecast models. In Proceedings of the III International Congress SIIV-People, Land, Environment and Transport Infrastructures, Bari, Italy, 22–24 September 2005. [Google Scholar]
- Moretti, L.; Moretti, M.; Ricci, S. Upgrading of Florence public transport to incorporate new tramlines [Riassetto del trasporto pubblico di Firenze a seguito dell’entrata in servizio di nuove linee di tram]. Ingegneria Ferroviaria 2017, 72, 569–584. [Google Scholar]
- Di Mascio, P.; Fusco, G.; Grappasonni, G.; Moretti, L.; Ragnoli, A. Geometrical and functional criteria as a methodological approach to implement a new cycle path in an existing urban road network: A case study in Rome. Sustainability 2018, 10, 2951. [Google Scholar] [CrossRef]
- Osservatorio Utenze Deboli. L’insicurezza stradale. In Incidentalità Urbana; Osservatorio Utenze Deboli: Rome, Italy, 2011. [Google Scholar]
- Istituto Nazionale di Statistica. Rapporto ISTAT. In Incidentalità Urbana; Istituto Nazionale di Statistica: Rome, Italy, 2015. [Google Scholar]
- Cantisani, G.; Loprencipe, G.; Primieri, F. The integrated design of urban road intersections: A case study. In Proceedings of the ICSDC 2011: Integrating Sustainability Practices in the Construction Industry, Kansas, MO, USA, 23–25 March 2011; pp. 722–728. [Google Scholar]
- Mauro, R.; Cattani, M. Model to evaluate potential accident rate at roundabouts. J. Transp. Eng. 2004, 130, 602–609. [Google Scholar] [CrossRef]
- Corazza, M.V.; Musso, A.; Finikopoulos, K.; Sgarra, V. An Analysis on Health Care Costs Due to Accidents Involving Powered Two Wheelers to Increase Road Safety. Transp. Res. Procedia 2016, 14, 323–332. [Google Scholar] [CrossRef] [Green Version]
- Piantini, S.; Baldanzini, N.; Pierini, M.; Mangini, M.; Franci, A.; Peris, A. An Overview on Pedestrians and Cyclists Serious Injuries in Urban Accidents. In Proceedings of the International Research Council on Biomechanics of Injury (IRCOBI), Zurich, Switzerland, 9–11 September 2015. [Google Scholar]
- Demasi, F.; Loprencipe, G.; Moretti, L. Road Safety Analysis of Urban Roads: Case Study of an Italian Municipality. Safety 2018, 4, 58. [Google Scholar] [CrossRef]
- Swedish Transport Administration. The Swedish Transport Administration Annual Report 4689; Swedish Transport Administration: Borlänge, Sweden, 2018.
- Tiwari, G.; Bangdiwala, S.; Saraswat, A.; Gaurav, S. Survival analysis: Pedestrian risk exposure at signalized intersections. Transp. Res. Part F 2007, 10, 77–89. [Google Scholar] [CrossRef]
- Isaksson-Hellman, I.; Werneke, J. Detailed description of bicycle and passenger car collisions based on insurance claims. Saf. Sci. 2017, 92, 330–337. [Google Scholar] [CrossRef]
- Dias, C.; Iryo-Asano, M.; Oguchi, T. Predicting Optimal Trajectory of Left-Turning Vehicle at Signalized Intersection. Transp. Res. Procedia 2016, 21, 240–250. [Google Scholar] [CrossRef]
- Tran, Q.; Firl, J. Online Maneuver Recognition and Multimodal Trajectory Prediction for Intersection Assistance using Non-parametric Regression. In Proceedings of the 2014 IEEE Intelligent Vehicles Symposium (IV), Dearborn, MI, USA, 8–11 June 2014. [Google Scholar]
- Cantisani, G.; Loprencipe, G. A statistics based approach for defining reference trajectories on road sections. Mod. Appl. Sci. 2013, 7, 32–46. [Google Scholar] [CrossRef]
- Mauro, R.; Cattani, M.; Guerrieri, M. Evaluation of the safety performance of turbo roundabouts by means of a potential accident rate model. Baltic J. Road Bridge Eng. 2015, 10, 28–38. [Google Scholar] [CrossRef]
- Ma, Z.; Sun, J.; Wang, Y. A two-dimensional simulation model for modelling turning vehicles at mixed flow intersections. Transp. Res. Part C 2017, 75, 103–119. [Google Scholar] [CrossRef]
- Mathew, T.V.; Krishna Rao, K.V. Introduction to Transportation Engineering, Factors Affecting Transportation; NPTEL: New Delhi, India, 2007. [Google Scholar]
- Li, B.; Xiong, S.; Li, X.; Liu, M.; Zhang, X. The Behavior Analysis of Pedestrian-cyclist Interaction at Non-signalized Intersection on Campus: Conflict and Interference. Procedia Manuf. 2015, 3, 3345–3352. [Google Scholar] [CrossRef] [Green Version]
- Huang, L.; Wu, J. Study on the cyclist behavior at signalized intersections. IEEE Intell. Transp. Syst. 2004, 5, 317–322. [Google Scholar]
- Madsen, T.K.O.; Lahrmann, H. Comparison of five bicycle facility designs in signalized intersections using traffic conflict studies. Transp. Res. Part F 2016, 46, 438–450. [Google Scholar] [CrossRef]
- Vejregelrådet. Byernes Trafikarealer, Hæ fte 4, Vejkryds; Vejdirektoratet: Copenhagen, Denmark, 2010.
- Hauer, E. Exposure and Accident Rate. Traffic Eng. Control 1995, 36, 134–138. [Google Scholar]
- Elvik, R.; Erke, A.; Christensen, P. Elementary Units of Exposure. J. Transp. Res. Board 2009, 2103, 25–31. [Google Scholar] [CrossRef]
- Zhao, X.; Zhang, X.; Rong, J. Study of the Effects of Alcohol on Drivers and Driving Performance on Straight Road. Math. Probl. Eng. 2014, 2014, 607652. [Google Scholar] [CrossRef]
- Bates, L.J.; Davey, J.; Watson, B.; King, M.J.; Armstrong, K. Factors Contributing to Crashes among Young Drivers. Sultan Qabos Univ. Med. J. 2014, 14, 297–305. [Google Scholar]
- Ministero delle Infrastrutture e dei Trasporti. Norme Funzionali e Geometriche per la Costruzione delle Strade [Functional and Geometrical Standards for Road Construction]; Ministero delle Infrastrutture e dei Trasporti: Rome, Italy, 2001.
- Ministero delle Infrastrutture e dei Trasporti. Norme Funzionali e Geometriche per la Costruzione delle Intersezioni Stradali [Functional and Geometrical Standards for Road Constructions]; Ministero delle Infrastrutture e dei Trasporti: Rome, Italy, 2006.
- Surblys, V.; Sokolovskij, E. Research of the Vehicle Brake Testing Efficiency. Procedia Eng. 2016, 134, 452–458. [Google Scholar] [CrossRef] [Green Version]
- Ministero dei Lavori Pubblici. Regolamento Recante Norme per la Definizione Delle Caratteristiche Tecniche Delle Piste Ciclabili [Standard for Technical Characteristics of Cyle Paths]; Ministero dei Lavori Pubblici: Rome, Italy, 1999.
- Beck, B.; Stevenson, M.; Newstead, S.; Cameron, P.; Judson, R.; Edwards, E.R.; Bucknill, A.; Johnson, M.; Gabbe, B. Bicycling crash characteristics: An in-depth crash investigation study. Accid. Anal. Prev. 2016, 96, 219–227. [Google Scholar] [CrossRef] [PubMed]
- Williams, K.M.; Stover, V.G.; Dixon, K.K.; Demosthenes, P. Transportation Research Board Access Management Manual, 2nd ed.; Transportation Research Board: Washington, DC, USA, 2014; ISBN 978-0-309-29541-3. [Google Scholar]
- Prati, G.; De Angelis, M.; Marín Puchades, V.; Fraboni, F.; Pietrantoni, L. Characteristics of cyclist crashes in Italy using latent class analysis and association rule mining. PLoS ONE 2017, 12, e0171484. [Google Scholar] [CrossRef] [PubMed]
- Green, M. “How Long Does It Take to Stop?” Methodological Analysis of Driver Perception-Brake Times. Transp. Hum. Factors 2010, 2, 195–216. [Google Scholar] [CrossRef]
- Zangenehpoura, S.; Straussa, J.; Miranda-Morenob, L.F.; Saunier, N. Are signalized intersections with cycle tracks safer? A case-control study based on automated surrogate safety analysis using video data. Accid. Anal. Prev. 2016, 86, 161–172. [Google Scholar] [CrossRef]
- Mauro, R. Traffic and Random Processes; Springer International Publishing: Cham, Switzerland, 2015. [Google Scholar]
- Moretti, L.; Cantisani, G.; Di Mascio, P.; Nichele, S.; Caro, S. A runway veer-off risk assessment based on frequency model: Part I. Probability analysis. In Proceedings of the International Congress on Transport Infrastructure and Systems TIS 2017, Rome, Italy, 10–12 April 2017. [Google Scholar]
Figure 1.
Study schemes (a) four-arm junction without bike path; (b) four-arm junction with bike path.
Figure 1.
Study schemes (a) four-arm junction without bike path; (b) four-arm junction with bike path.

Figure 2.
Cross sections of the examined approaches (unit of measurement—m). (a) Cross section of Figure 1a; and (b) cross section of Figure 1b.

Figure 3.
Trajectory diagram of bikes in a four-arm junction.

Figure 4.
Example of conflict point detection at a four-arm junction.

Figure 5.
Layout of schemes 1 to 3 (S1–S3); (a) Scheme 1, (b) Scheme 2, and (c) Scheme 3.

Figure 6.
Conflict areas.

Figure 7.
Level of damage of conflict points.

Figure 8.
Conflict points.


Table 1.
Danger classification.
| ART (s) | Level of Damage | D | Chromatic Categorization |
|---|---|---|---|
| 0 < ART ≤ 1.5 | Very dangerous interaction | 1 ≤ D ≤ 1.5 | ● |
| 1.5 < ART ≤ 3 | Dangerous interaction | 0.5 < D ≤ 1 | ● |
| 3 < ART ≤ 4.5 | Slight interaction | 0 < D ≤ 0.5 | ● |
| ART > 4.5 | No interaction | - | ● |
Table 2.
Analysis of the conflict areas.
| Scheme | ECA (m2) | Analysis of Conflict Areas | Analysis of Maneuvers | Maximum ART (s) | Minimum ET (s) | Maximum ET (s) | ||
|---|---|---|---|---|---|---|---|---|
| Most Interfering Maneuvers (-) | Largest ECA (m2) | Most Dangerous Maneuvers (-) | Minimum ART (s) | |||||
| S1 | 96.08 | (I-III)V-(I-IV)B (II-IV)V-(II-I)B (III-I)V-(III-II)B (IV-II)V-(IV-III)B | 8.75 | (right-turn)V-(crossing)B (right-turn)V-(left-turn)B | 0.49 | 3.38 | 6.42 | 15.76 |
| S2 | 118.36 | (I-II)V-(I-II, I-IV, II-IV, IV-II)B (II-III)V-(II-III, II-I, III-I, I-III)B (III-IV)V-(III-IV, III-II, IV-II, II-IV)B (IV-I)V-(IV-I, IV-III, I-III, III-I)B | 8.41 | (right-turn)V-(left-turn)B (left-turn)V-(left-turn)B (crossing)V-(left-turn)B | 0.00 | 5.13 | 6.30 | 12.06 |
| S3 | 22.41 | (II-I)V-(I-II, I-III, I-IV, II-I, II-IV, III-I, III-IV, IV-I,I V-II, IV-III)B | 1.89 | (II-III)V-(I-II)B (II-III)V-(I-III)B (II-III)V-(I-IV)B | 0.68 | 4.11 | 3.48 | 20.75 |
Table 3.
Analysis of conflict points at S1, S2, and S3.
| Scheme | Total Number of CPs | Number of Red CPs | Number of Orange CPs | Number of Yellow CPs | Number of Green CPs |
|---|---|---|---|---|---|
| S1 | 56 | 32 | 12 | 12 | 0 |
| S2 | 24 | 12 | 4 | 8 | 0 |
| S3 | 24 | 16 | 0 | 8 | 0 |
Table 4.
Risk assessment of S1, S2, and S3.
| Scheme | p | P | R | Minimum Rij | Maximum Rij |
|---|---|---|---|---|---|
| S1 | 7.45 × 10⁻⁴ | 4.09 × 10⁻² | 3.71 × 10⁻² | 2.79 × 10⁻⁴ | 5.46 × 10⁻² |
| S2 | 7.45 × 10⁻⁴ | 1.77 × 10⁻² | 1.67 × 10⁻² | 5.23 × 10⁻⁴ | 2.66 × 10⁻² |
| S3 | 7.45 × 10⁻⁴ | 1.92 × 10⁻² | 1.67 × 10⁻² | 3.01 × 10⁻³ | 2.45 × 10⁻² |
Table 5.
Risk distribution of S1, S2, and S3.
| Class of Risk | Maximum Rij | Minimum Rij |
|---|---|---|
| α | 1.00 × 10⁻¹ | <1.00 × 10⁻² |
| β | 1.00 × 10⁻² | <1.00 × 10⁻³ |
| γ | 1.00 × 10⁻³ | <1.00 × 10⁻⁴ |
Table 6.
Analysis of the conflict points at S1, S2, and S3.
| Vehicle Maneuver | Percentage of CPs (%) | ||||||||
|---|---|---|---|---|---|---|---|---|---|
| Right-turn | Crossing | Left-turn | |||||||
| Class of Risk Scheme | γ | β | α | γ | β | α | γ | β | α |
| S1 | 0 | 0 | 27 | 20 | 0 | 20 | 6 | 0 | 27 |
| S2 | 0 | 0 | 30 | 17 | 2 | 19 | 0 | 13 | 19 |
| S3 | 0 | 2 | 34 | 0 | 16 | 16 | 0 | 16 | 16 |
Table 7.
Risk analyses for different traffic volumes.
| Traffic ID | Traffic Volume | R | |||
|---|---|---|---|---|---|
| QV (veh./h) | QB (veh./h) | S1 | S2 | S3 | |
| T1 | 700 | 40 | 9.40 × 10⁻² | 4.30 × 10⁻² | 4.31 × 10⁻² |
| T2 | 500 | 70 | 1.18 × 10⁻¹ | 5.47 × 10⁻² | 5.47 × 10⁻² |
| T3 | 400 | 120 | 1.59 × 10⁻¹ | 7.47 × 10⁻² | 7.47 × 10⁻² |
© 2019 by the authors. Licensee MDPI, Basel, Switzerland. This article is an open access article distributed under the terms and conditions of the Creative Commons Attribution (CC BY) license (http://creativecommons.org/licenses/by/4.0/).
Share and Cite
MDPI and ACS Style
Cantisani, G.; Moretti, L.; De Andrade Barbosa, Y. Safety Problems in Urban Cycling Mobility: A Quantitative Risk Analysis at Urban Intersections. Safety 2019, 5, 6. https://doi.org/10.3390/safety5010006
AMA Style
Cantisani G, Moretti L, De Andrade Barbosa Y. Safety Problems in Urban Cycling Mobility: A Quantitative Risk Analysis at Urban Intersections. Safety. 2019; 5(1):6. https://doi.org/10.3390/safety5010006
Chicago/Turabian StyleCantisani, Giuseppe, Laura Moretti, and Yessica De Andrade Barbosa. 2019. "Safety Problems in Urban Cycling Mobility: A Quantitative Risk Analysis at Urban Intersections" Safety 5, no. 1: 6. https://doi.org/10.3390/safety5010006
Note that from the first issue of 2016, this journal uses article numbers instead of page numbers. See further details here.