Systems and Sensors for Debris-flow Monitoring and Warning

1
CNR-IRPI, Strada delle Cacce,73, 10135 Torino, Italy
2
CNR-IRPI, Corso Stati Uniti, 4, 35127 Padova, Italy
*
Author to whom correspondence should be addressed.
Sensors 2008, 8(4), 2436-2452; https://doi.org/10.3390/s8042436
Submission received: 18 December 2007
/
Accepted: 2 April 2008
/
Published: 4 April 2008
(This article belongs to the Special Issue Sensors for Disaster and Emergency Management Decision Making)
Abstract
:Debris flows are a type of mass movement that occurs in mountain torrents. They consist of a high concentration of solid material in water that flows as a wave with a steep front. Debris flows can be considered a phenomenon intermediate between landslides and water floods. They are amongst the most hazardous natural processes in mountainous regions and may occur under different climatic conditions. Their destructiveness is due to different factors: their capability of transporting and depositing huge amounts of solid materials, which may also reach large sizes (boulders of several cubic meters are commonly transported by debris flows), their steep fronts, which may reach several meters of height and also their high velocities. The implementation of both structural and non-structural control measures is often required when debris flows endanger routes, urban areas and other infrastructures. Sensor networks for debris-flow monitoring and warning play an important role amongst non-structural measures intended to reduce debris-flow risk. In particular, debris flow warning systems can be subdivided into two main classes: advance warning and event warning systems. These two classes employ different types of sensors. Advance warning systems are based on monitoring causative hydrometeorological processes (typically rainfall) and aim to issue a warning before a possible debris flow is triggered. Event warning systems are based on detecting debris flows when these processes are in progress. They have a much smaller lead time than advance warning ones but are also less prone to false alarms. Advance warning for debris flows employs sensors and techniques typical of meteorology and hydrology, including measuring rainfall by means of rain gauges and weather radar and monitoring water discharge in headwater streams. Event warning systems use different types of sensors, encompassing ultrasonic or radar gauges, ground vibration sensors, videocameras, avalanche pendulums, photocells, trip wires etc. Event warning systems for debris flows have a strong linkage with debris-flow monitoring that is carried out for research purposes: the same sensors are often used for both monitoring and warning, although warning systems have higher requirements of robustness than monitoring systems. The paper presents a description of the sensors employed for debris-flow monitoring and event warning systems, with attention given to advantages and drawbacks of different types of sensors.
1. Introduction
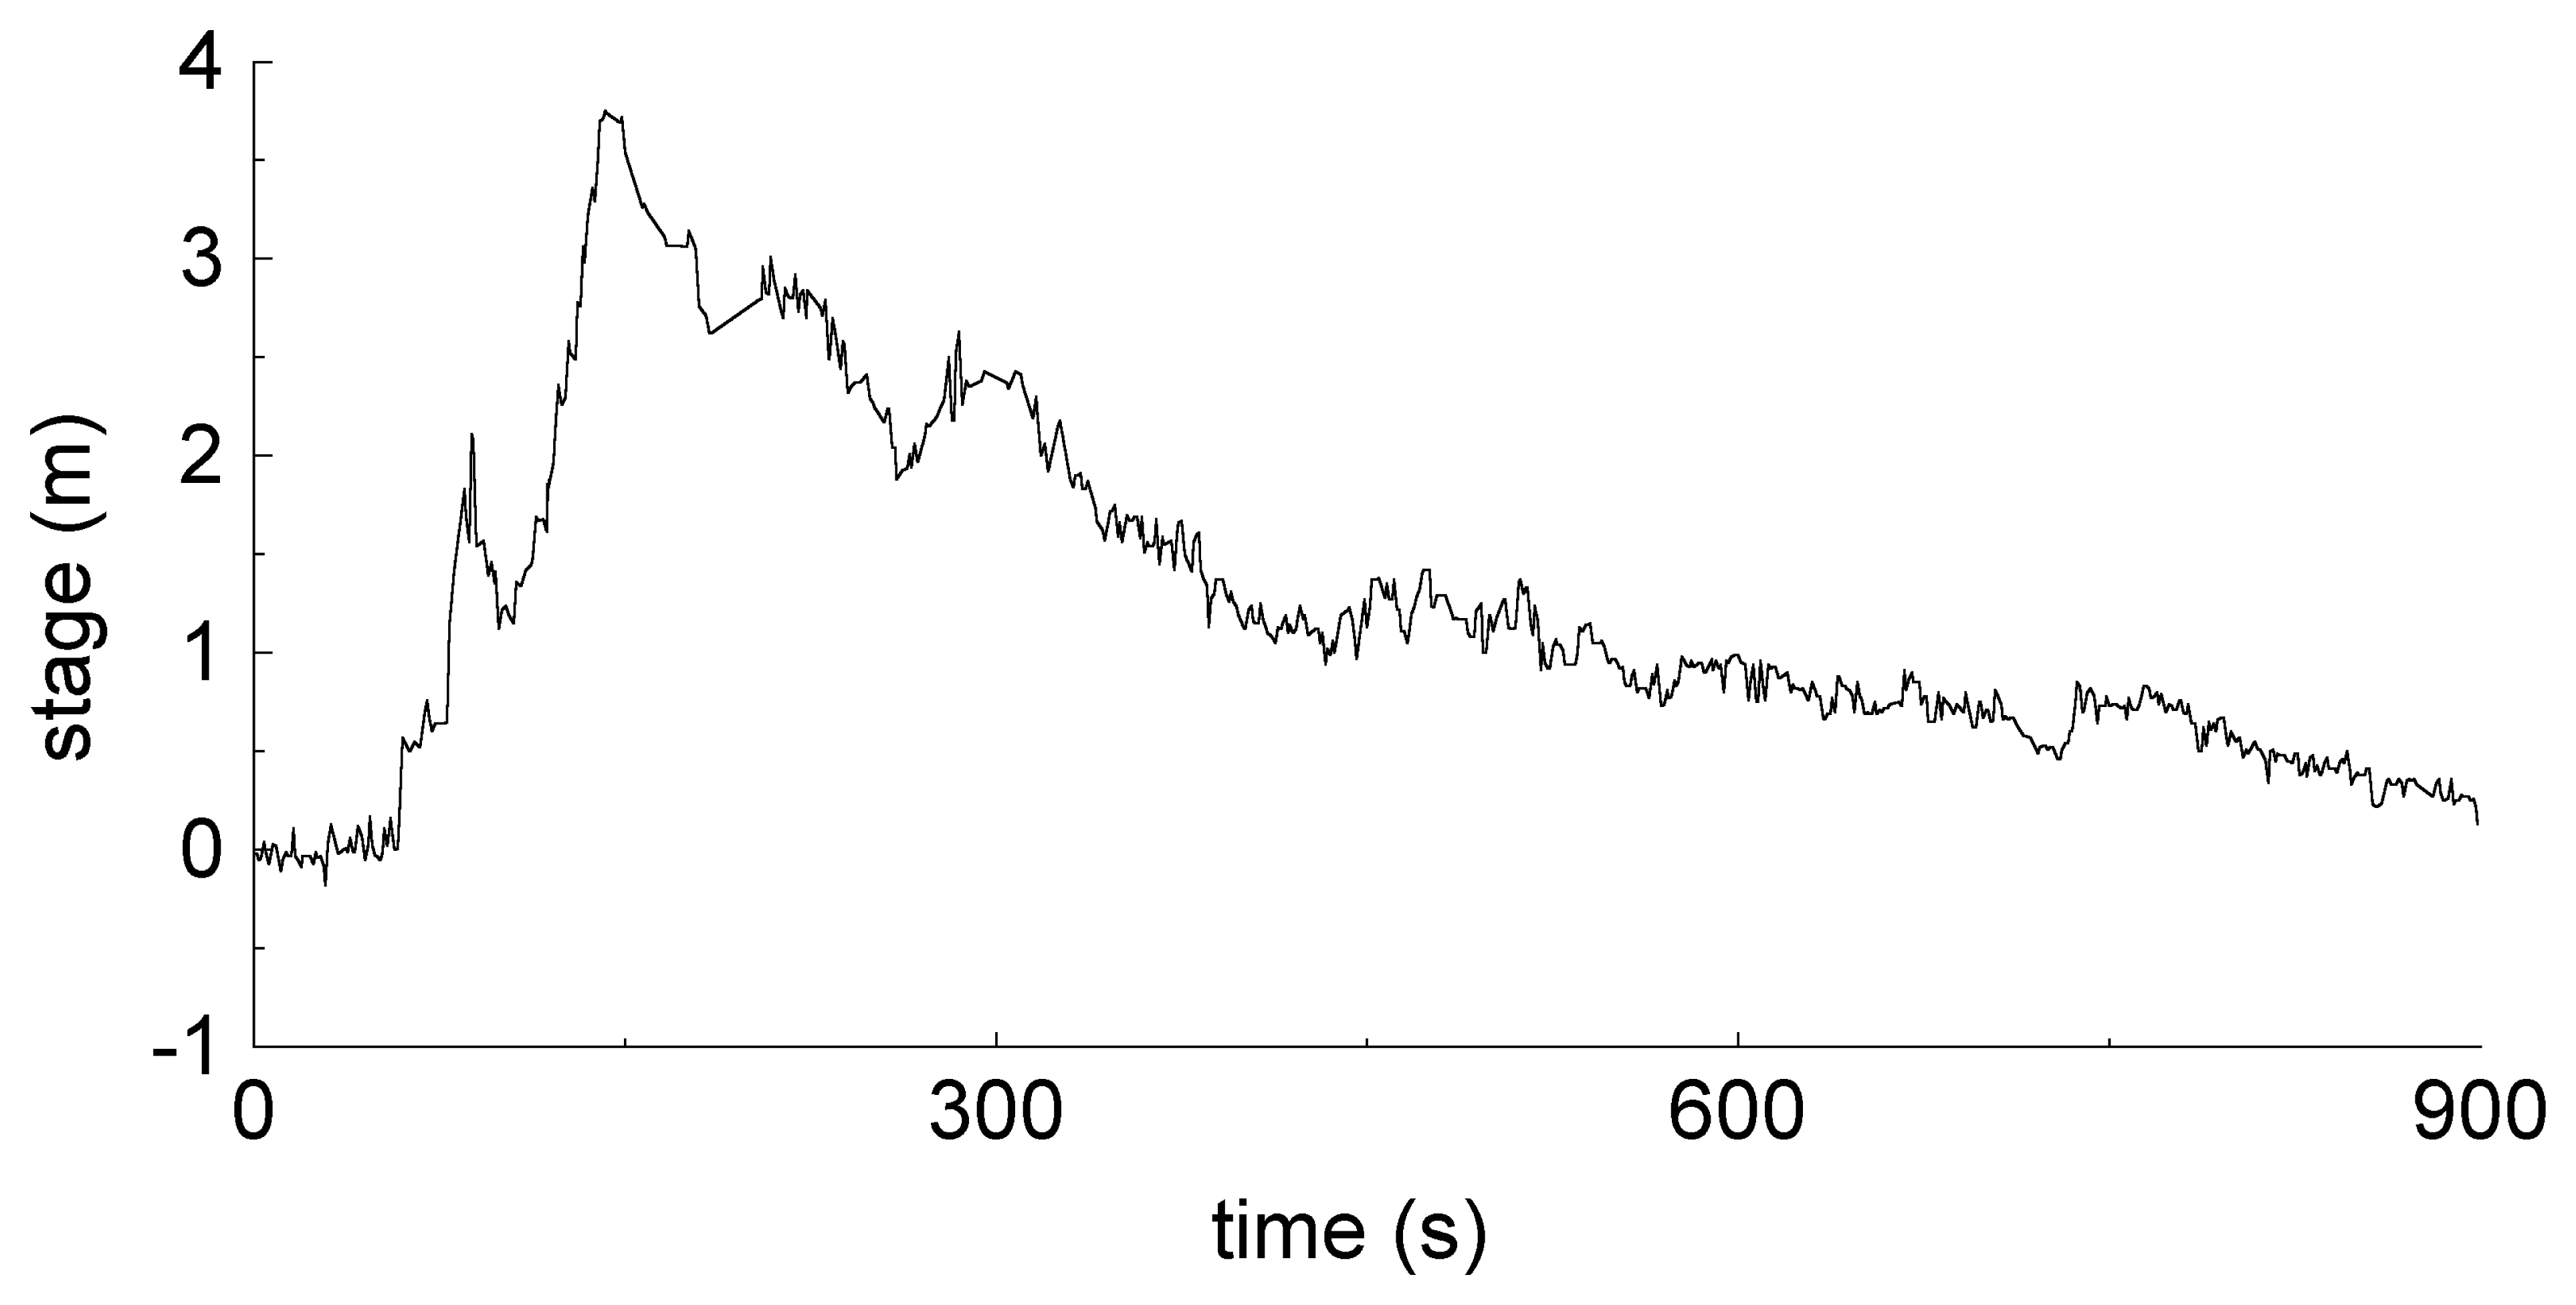
Debris flows are a type of mass movement that consist of highly concentrated dispersions of poorly sorted sediment (from clay- to boulder-sized particles) in water that may move at very high speeds and have great destructive power [1-7]. Debris flows generally appear as waves (surges) that have steep fronts consisting mostly of boulders. Behind the bouldery front, the stage height and number of boulders gradually decrease, and the surge is charged with pebble-sized fragments and then becomes more and more dilute until it finally appears as muddy water [1, 8]. Some of these features are reflected in the graphs of stage versus time (Figure 1). Because of their characteristics, debris flows are considered intermediate processes between landslides and water floods.
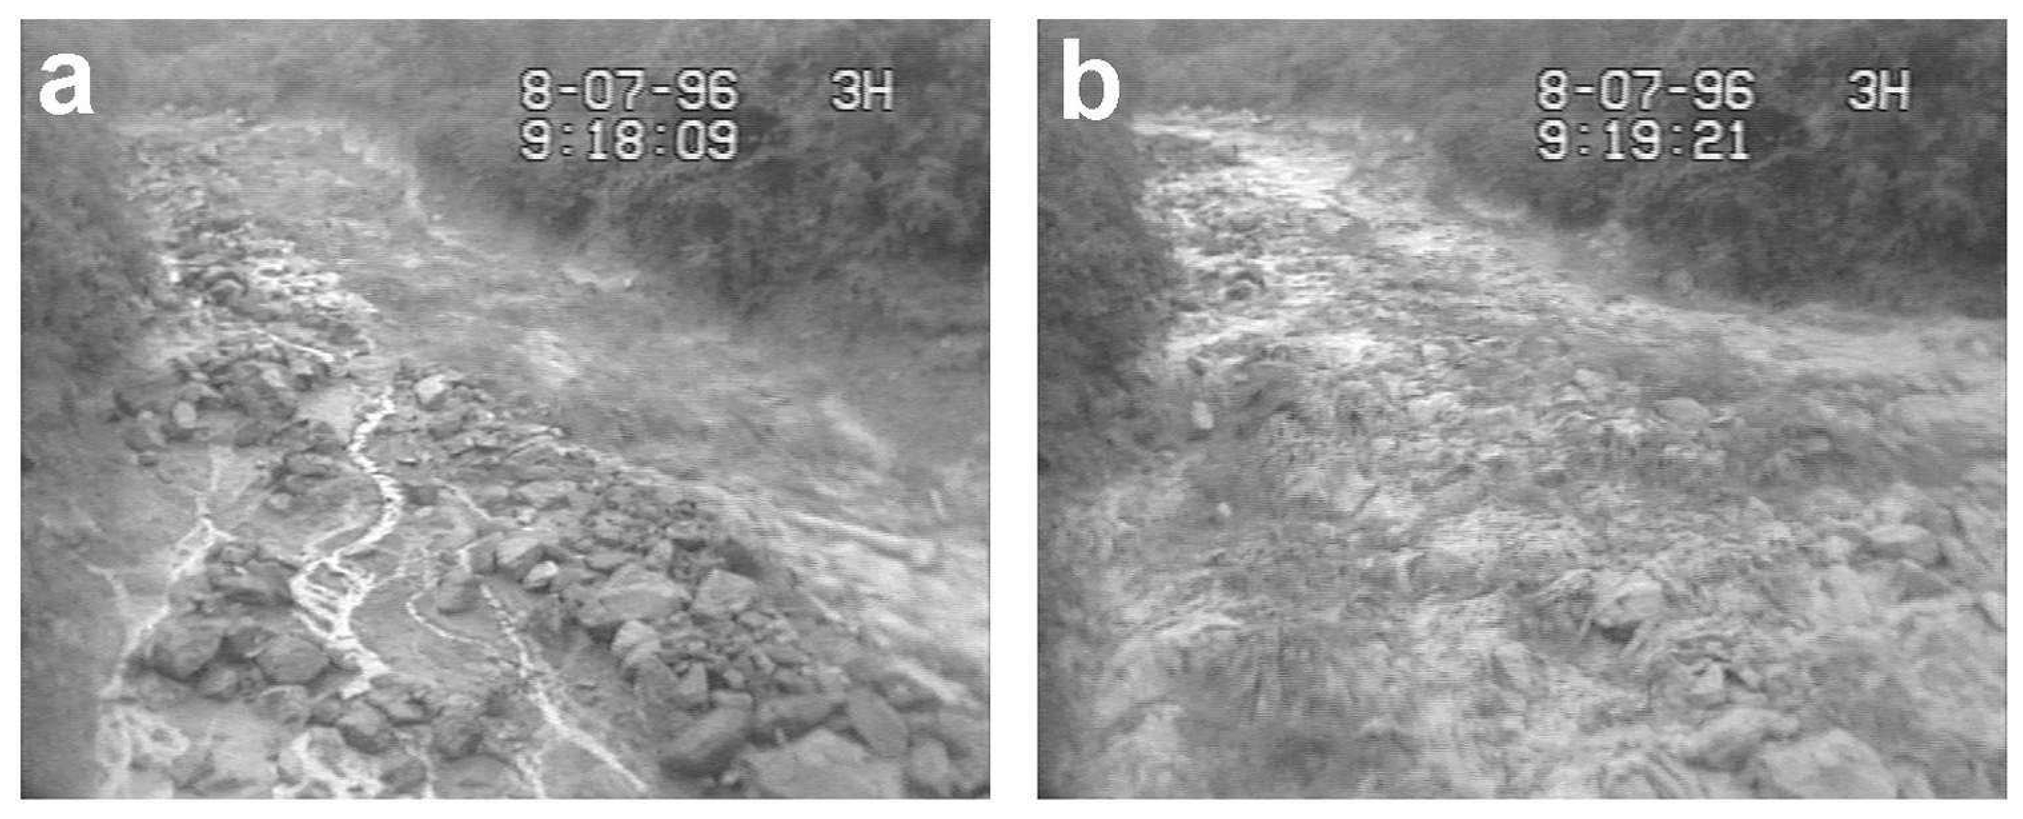
The transient behavior and the high severity of these phenomena are clearly seen in Figure 2, which shows two frames of a video recording of a debris flow that occurred in a torrent of the Italian Alps. The first appearance of the debris-flow wave is a turbulent precursory surge, mostly consisting of muddy water (Figure 2a). About one minute later, the debris flow attains its peak, with a flow depth of almost 4 m and a very high density of the flowing material (Figure 2b). The turbulence is now strongly attenuated, and large boulders are transported in the flow.
Conditions required for debris-flow occurrence include the availability of relevant amounts of loose debris, high slopes and sudden water inflows that may come from intense rainstorms, collapse of channel obstructions, rapid snowmelt, glacial lakes outburst floods, etc. These requirements are met in many mountainous basins under different climatic conditions, making debris flows a widespread phenomenon worldwide.
Debris flows can discharge large quantities of debris (with volumes up to millions of cubic meters) with high velocities (velocities of about 5 m/s are quite common, and values greater than 10 m/s have also been measured). This causes them to be highly hazardous phenomena; debris-flow hazards result in high risk particularly when they encroach urban areas or transportation routes.
The need to assess debris-flow hazards and reduce the associated risk urges a better knowledge of these processes and the implementation of effective control measures.
Monitoring and warning systems play an important role in the research on debris flows and as a non-structural measure to attenuate risks, respectively.
This paper provides a review of sensors and systems for debris-flow monitoring and warning, with focus on the equipment to measure parameters of moving debris flows. Geotechnical monitoring of debris-flow initiation, which essentially deals with slope instability processes, is not considered in this paper.
2. Debris-flow monitoring devices
Table 1 provides, in the first column, a series of parameters that are relevant for debris-flow investigation and studies. In the second column, the sensors that are commonly employed to measure each parameter are listed. Because most debris flows are triggered by intense rainfalls, a debris-flow monitoring system should also include one or more rain gauges. A number of scientific papers describe devices used for debris-flow monitoring; Itakura et al. have provided a bibliographic review on this topic [9].
Maximum debris flow depth can be measured during post-event surveys using theodolites or GPS because the presence of fine materials usually leaves clear tracks on the vegetation present along the channel or on its banks. Particular care must be taken to differentiate between the tracks left by the debris flow surface and the tracks left by the debris flow splashes [10].
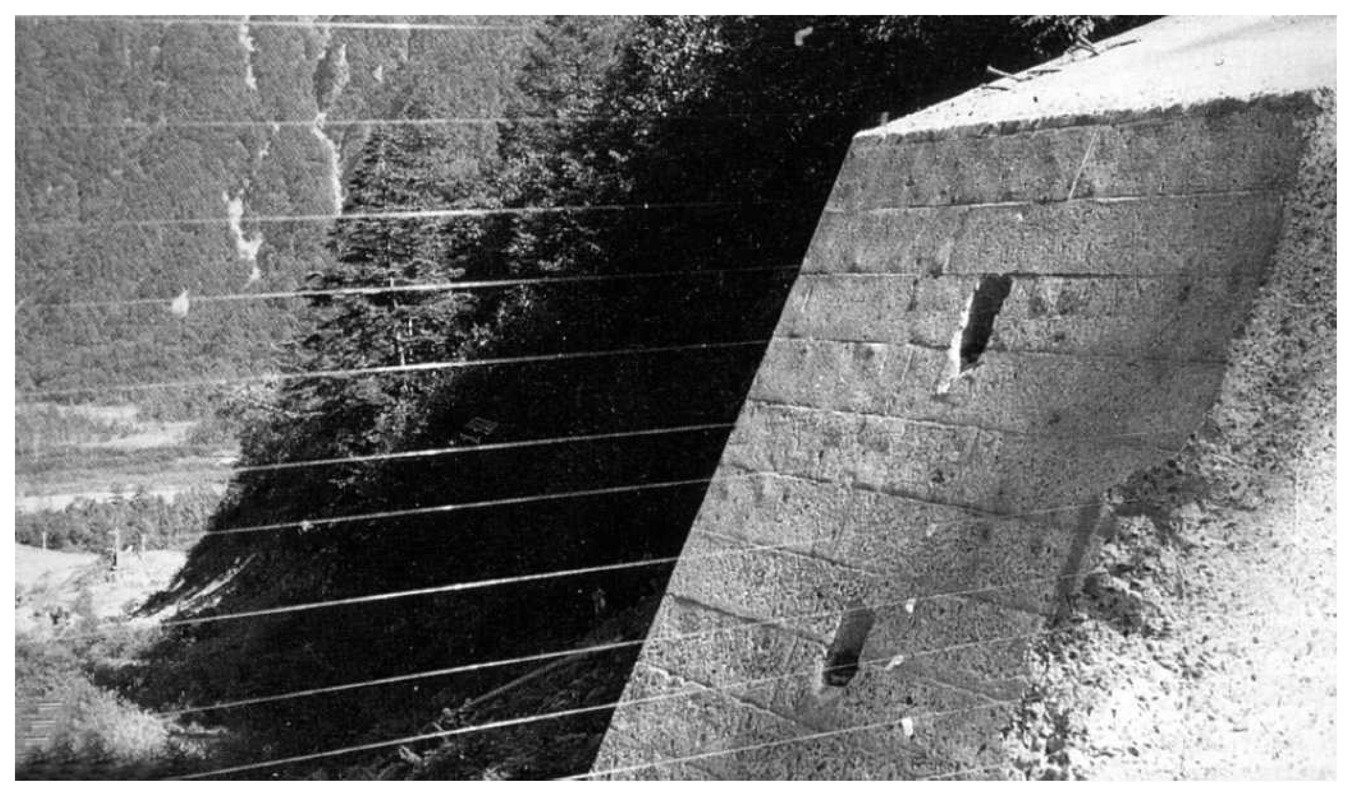
A set of wires stretched at different levels across a channel can be also employed to monitor maximum depth of debris flows (Figure 3). These wires can detect the maximum depth according to the level of the highest wire that has been broken by the flow and also make it possible to record the time of occurrence of the surge at the instrumented site. However, after they have been broken, these devices cannot provide information about the height of further surges that follow the main one or about subsequent debris flows; they need to be reset each time after a debris flow.
Photocells and infrared photobeam sensors can be utilized as a tool to detect debris flows [11]. The flowing mass interrupts the beams emitted by the sensors, making it possible to detect the passage of the wave. If several sensors are installed at different heights at the same cross-section, it is also possible to approximately measure the peak flow stage.
Ultrasonic gauges are probably the most commonly used device for continuous monitoring of debris flow level [2, 13-15]. In addition to recording stage hydrographs, the ultrasonic sensors provide a way to measure channel erosion or aggradation at the site where they are installed.
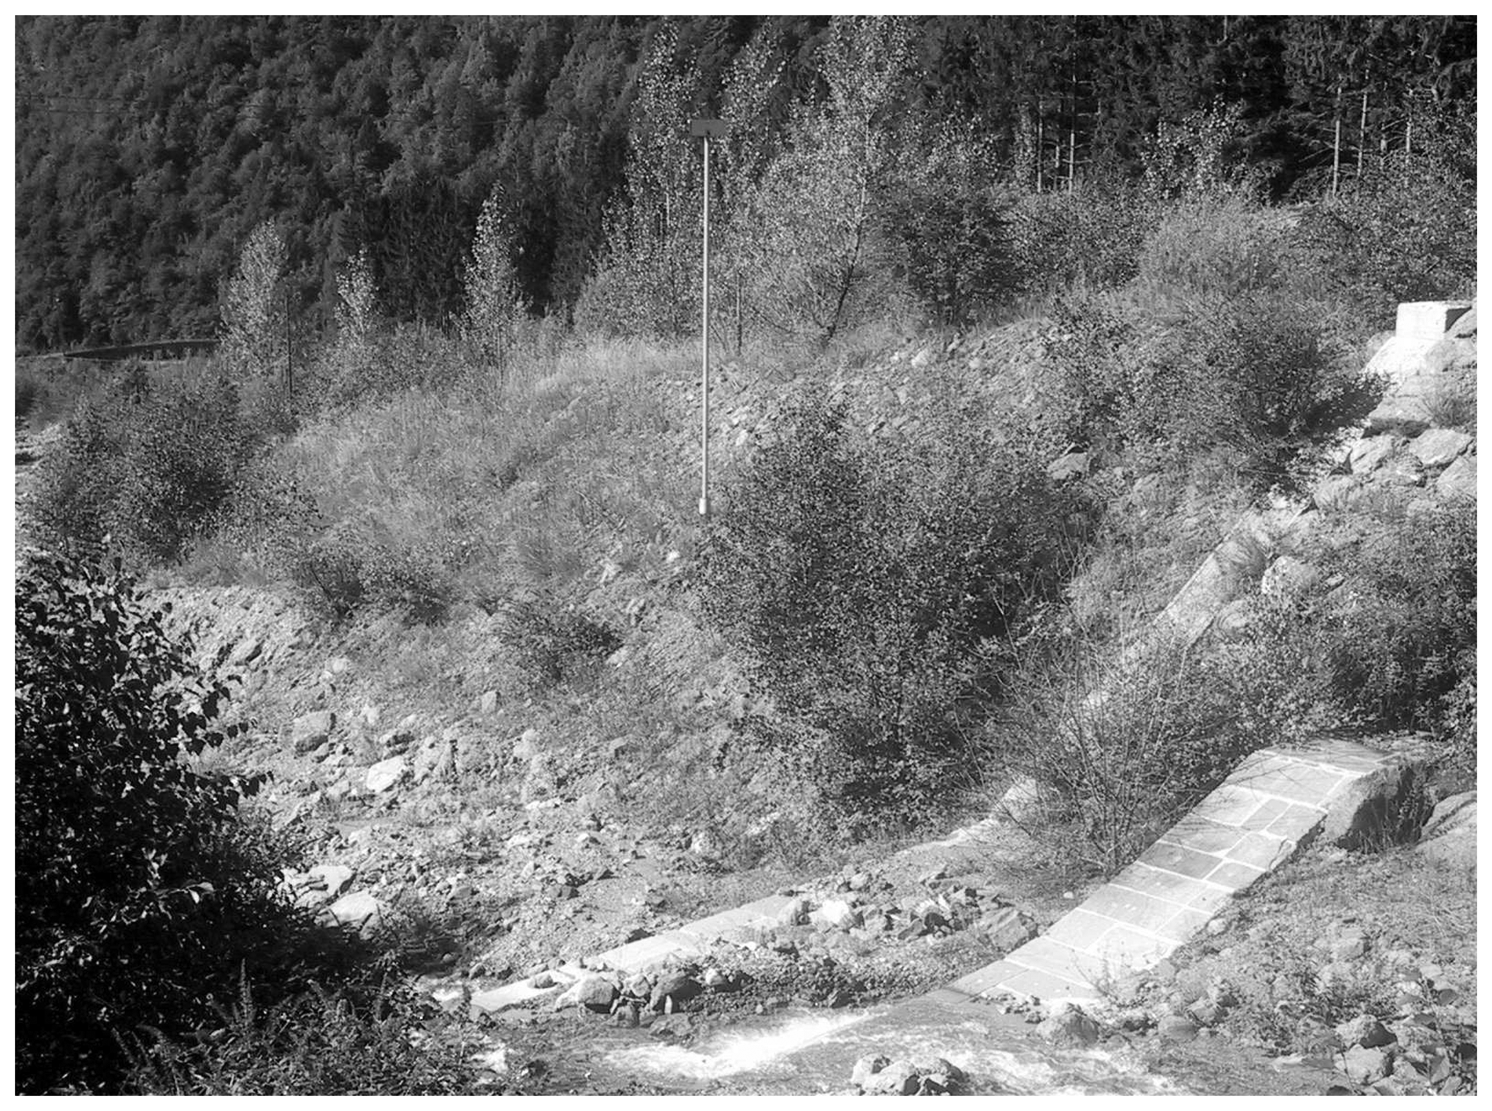
Ultrasonic sensors hung over the channel (Figure 4) measure the distance between the flow surface and the sensor itself, making it possible to record debris-flow hydrographs (Figure 5). These sensors are also used to measure the water level in rivers; however, the strong and rapid variability of flow height with time in debris flows requires much shorter logging intervals between two consecutive recordings (typically 1 second). Radar and laser sensors have also been used, similarly to ultrasonic sensors, to measure flow depth and record stage hydrographs of debris flows [16, 17].
The passage of a debris flow wave induces strong ground vibrations and underground sounds, which can be recorded by different types of sensors (accelerometers, velocimeters, microphones) [13, 16, 18-20].
An important advantage of ground vibration sensors is that they can be installed at a safe distance from the channel bed. This overcomes an important shortcoming of other types of sensors, like the ultrasonic gauges, which need to be hung over the channel and thus are more prone to damage.
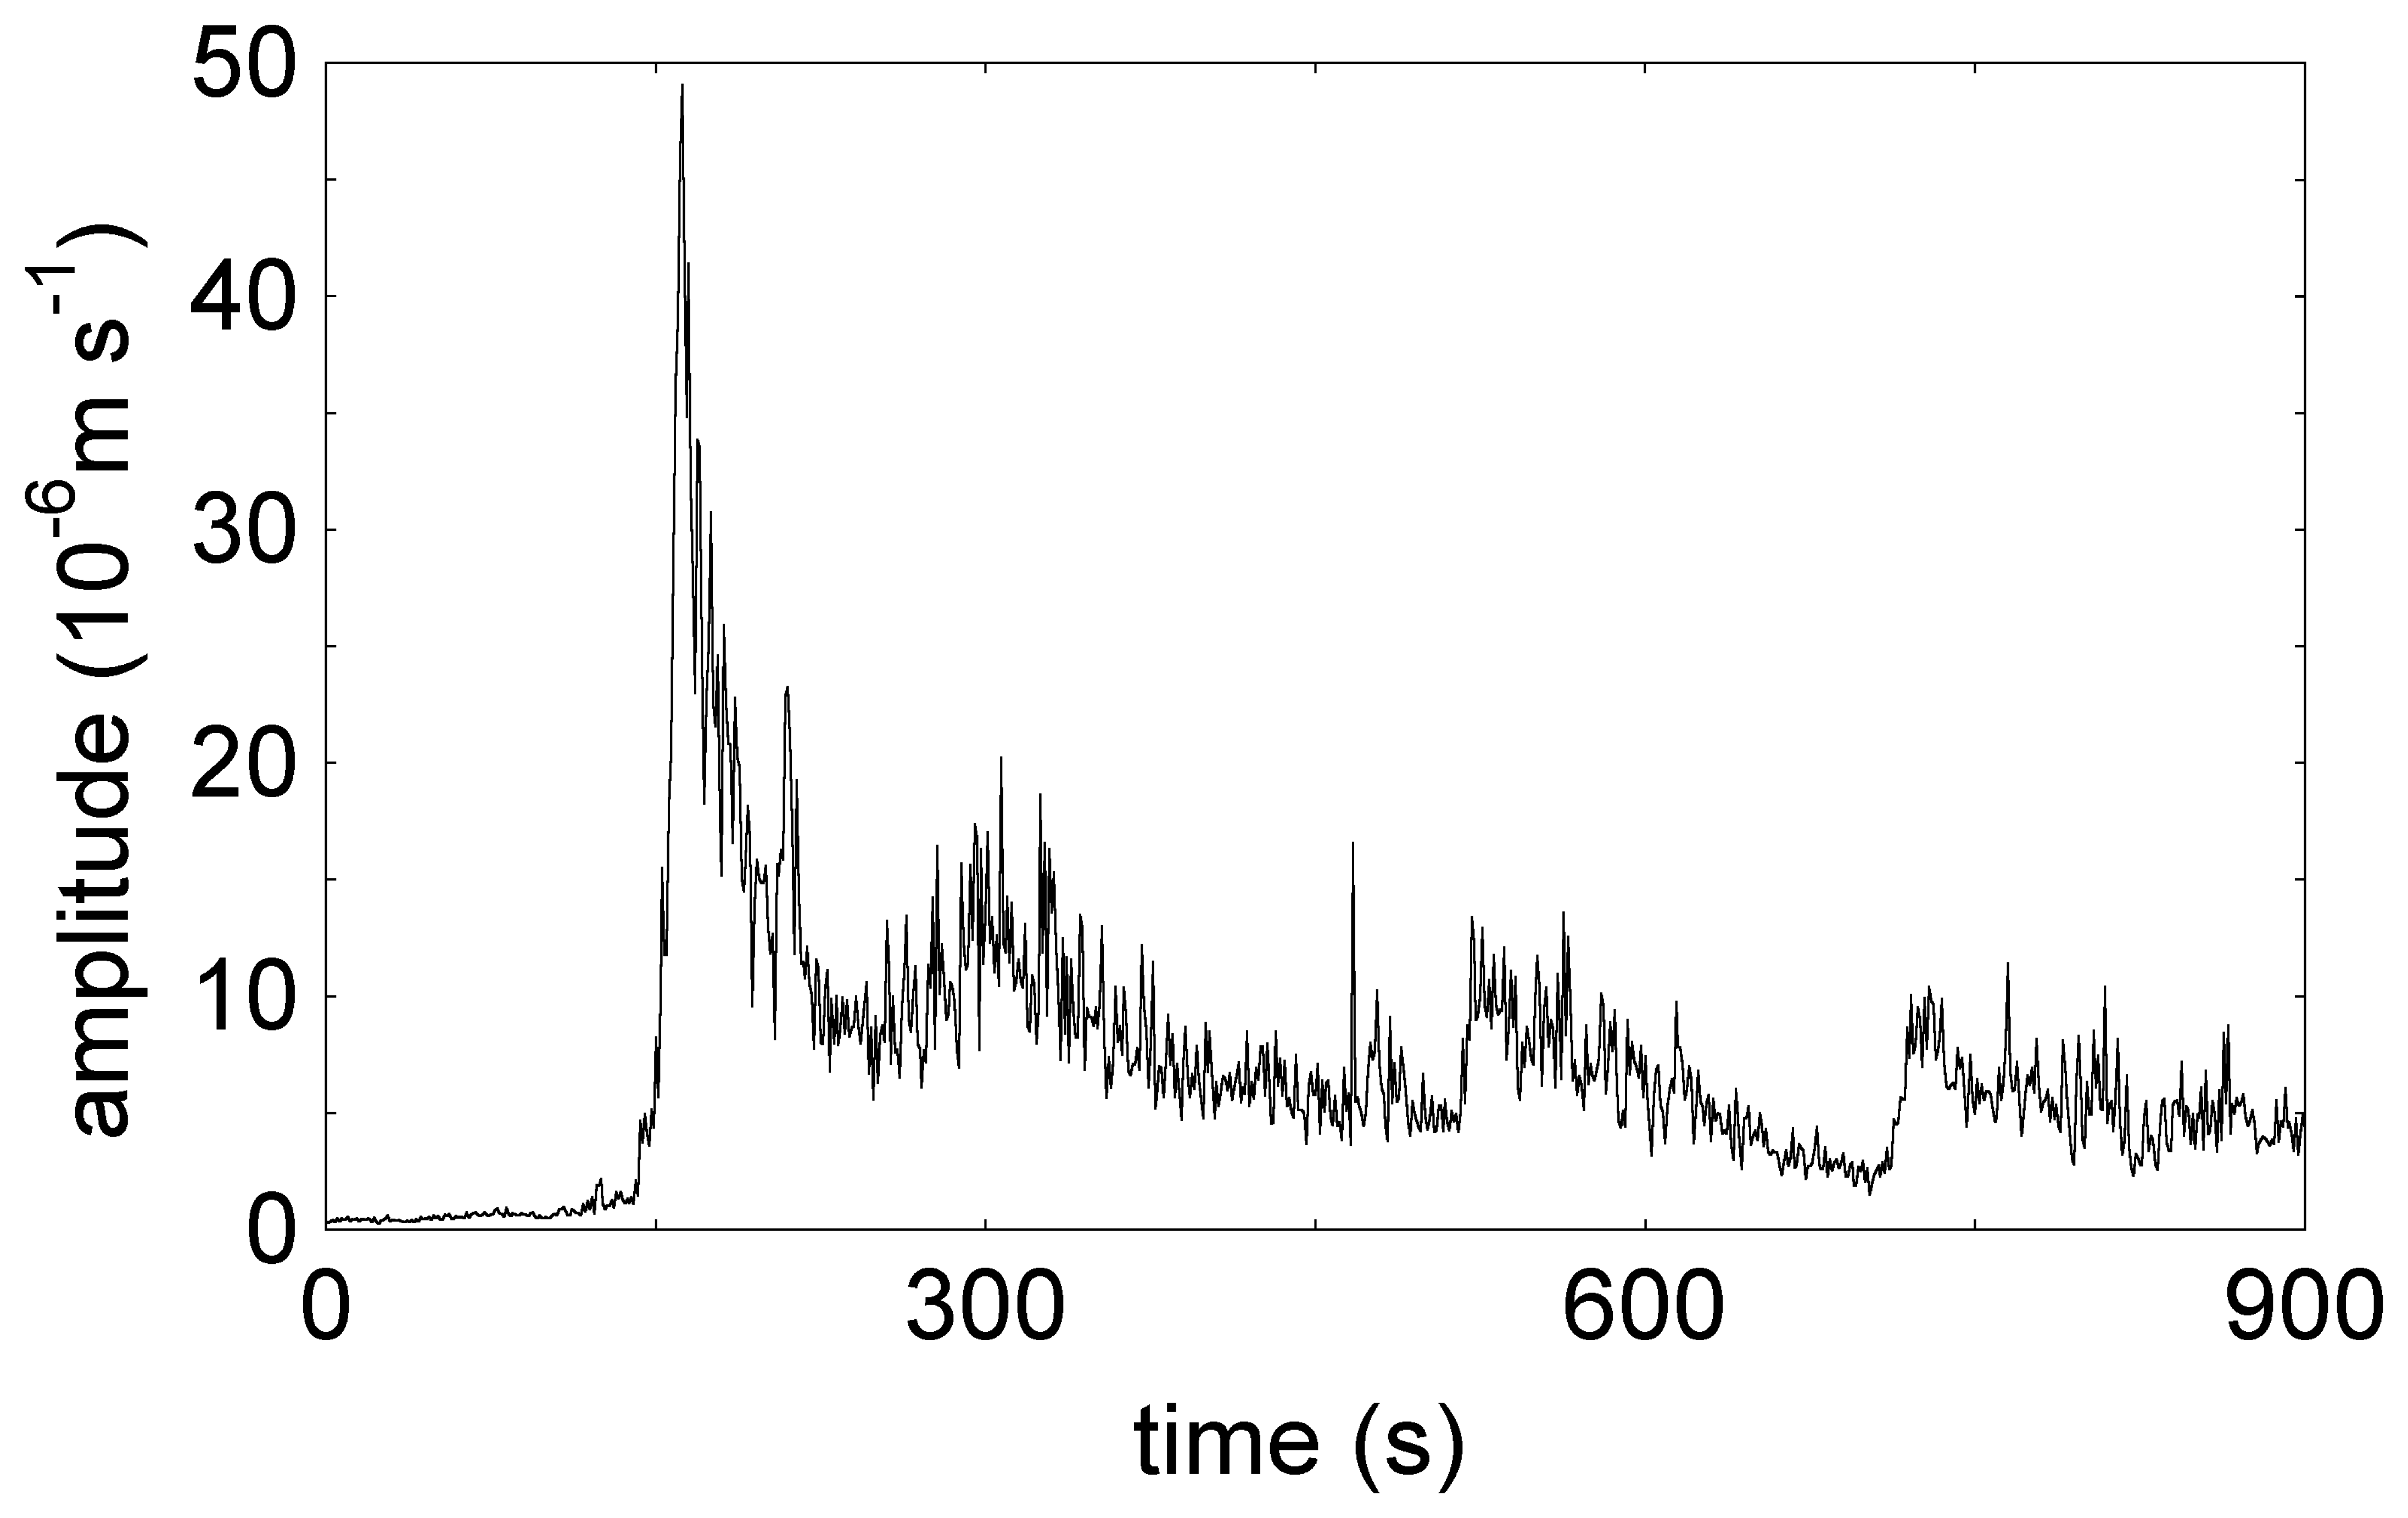
The output signal of the seismic sensors (velocimeters) is a voltage proportional to the ground oscillation velocity [20]. Plots of the amplitude of the oscillations versus time are a suitable way to represent seismic recordings of debris flows (Figure 6).
The amplitude (Amp) can be calculated as:
where vgi is the ground oscillation velocity, and n is the number of digital samples in each interval of recording.
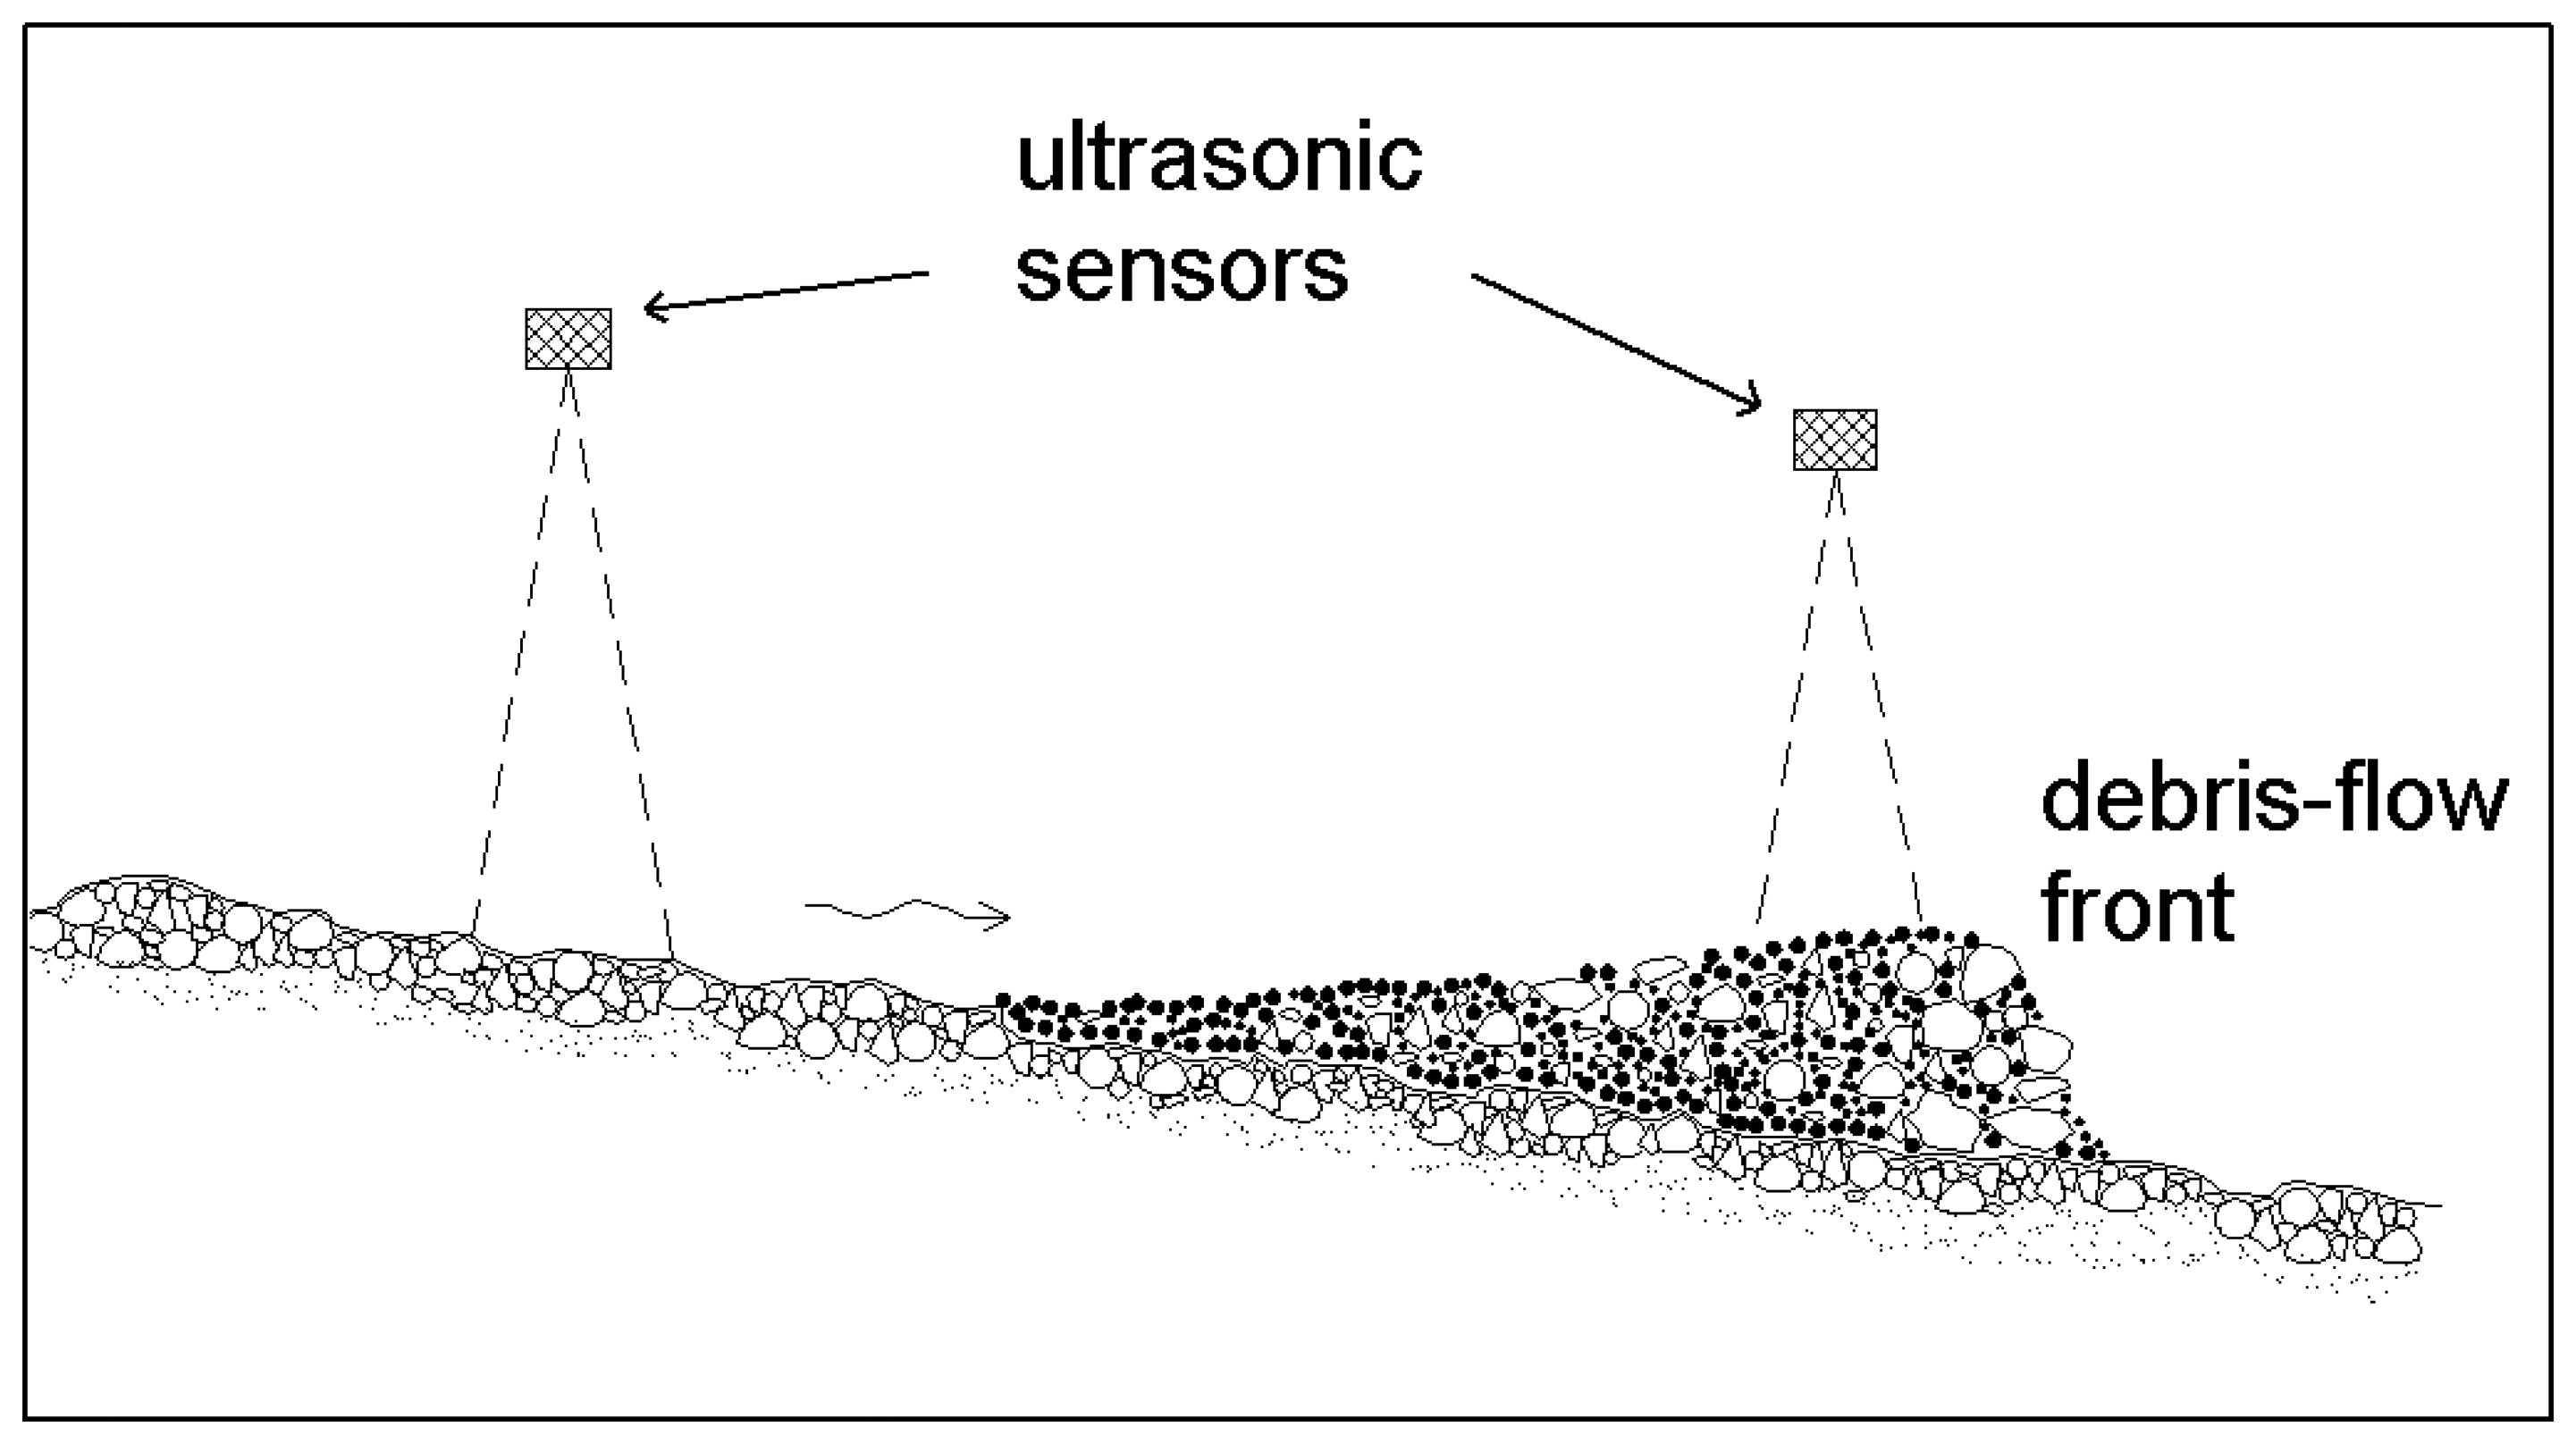
The characteristic feature of debris flows to present a steep front that can be easily detected and recognized both in their hydrographs (Figures 1 and 5) and in plots of amplitude versus time (Figure 6) allows us to easily perform mean front velocity measurements. By placing a pair of ultrasonic sensors or geophones at a known distance along a torrent (Figure 7), mean front velocity can be measured as the ratio between the distance between the sensors and the time interval elapsed between the appearance of the front at the two gauging sites. Figure 7 refers to a channel stretch monitored with ultrasonic sensors, but mean velocity could also be computed from the records of other sensors using the same principle (e.g., wire detectors, photocells, microphones, etc.).
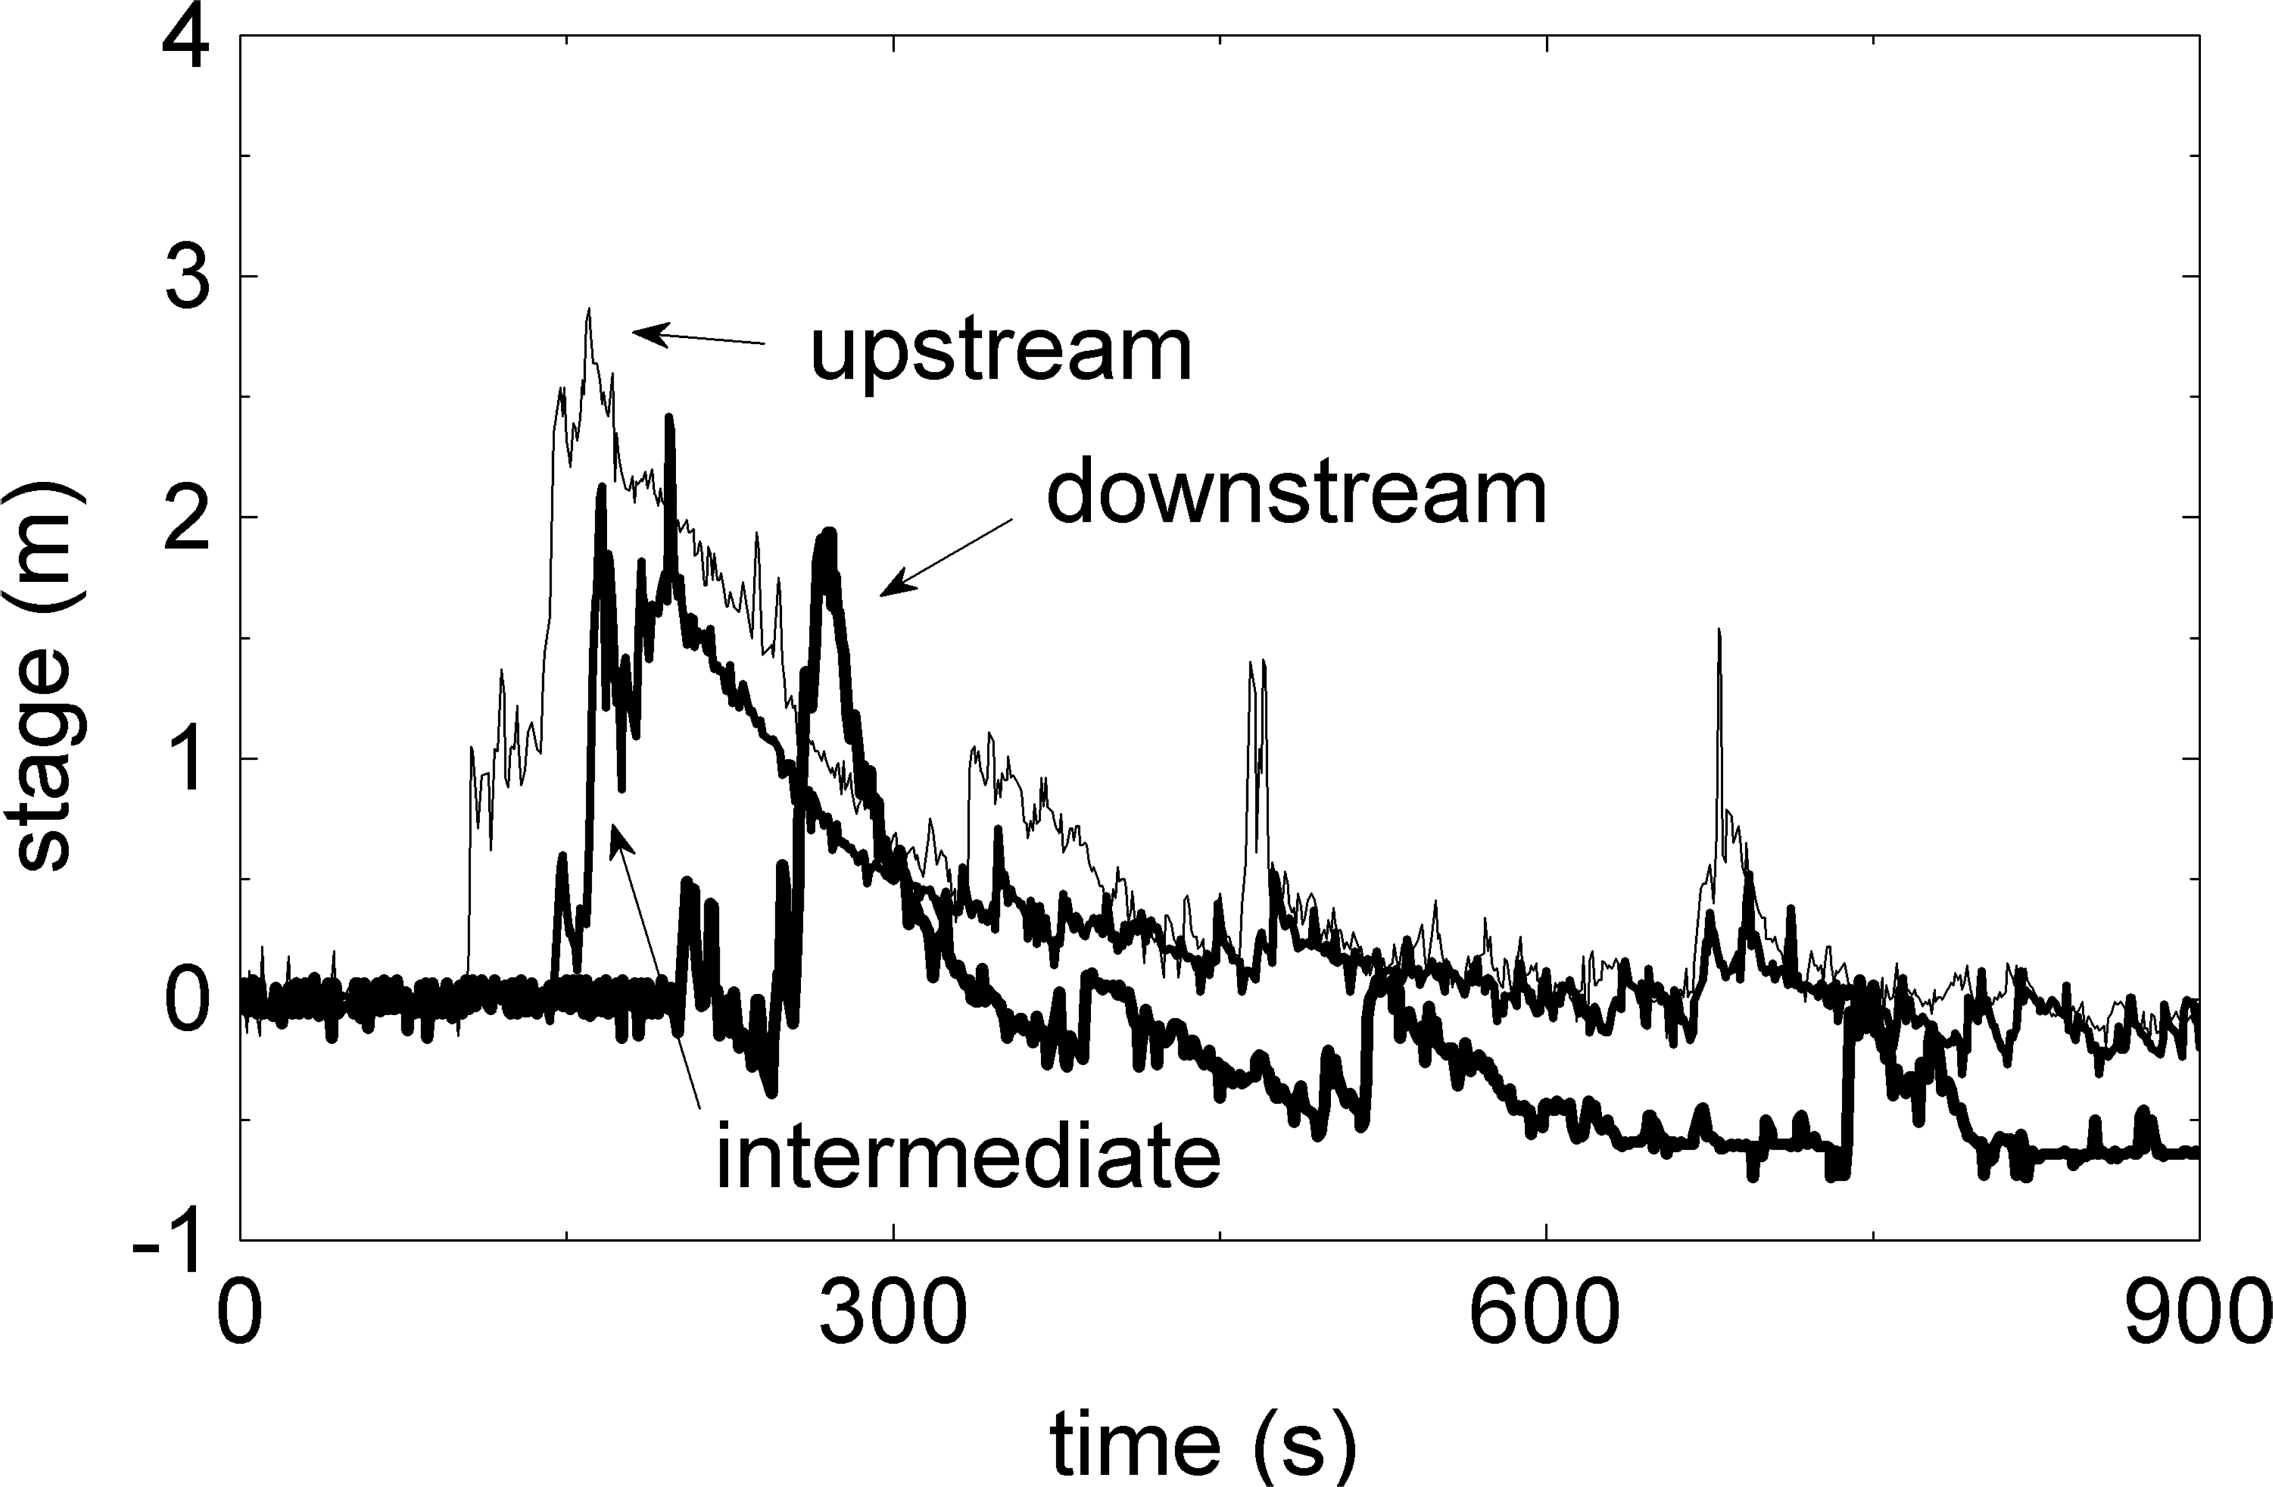
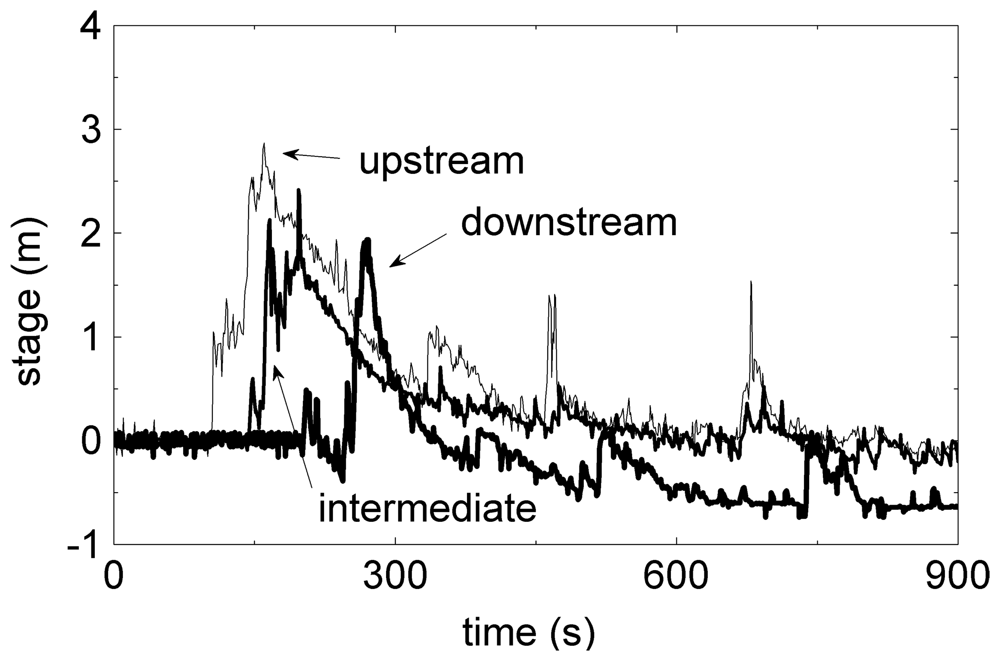
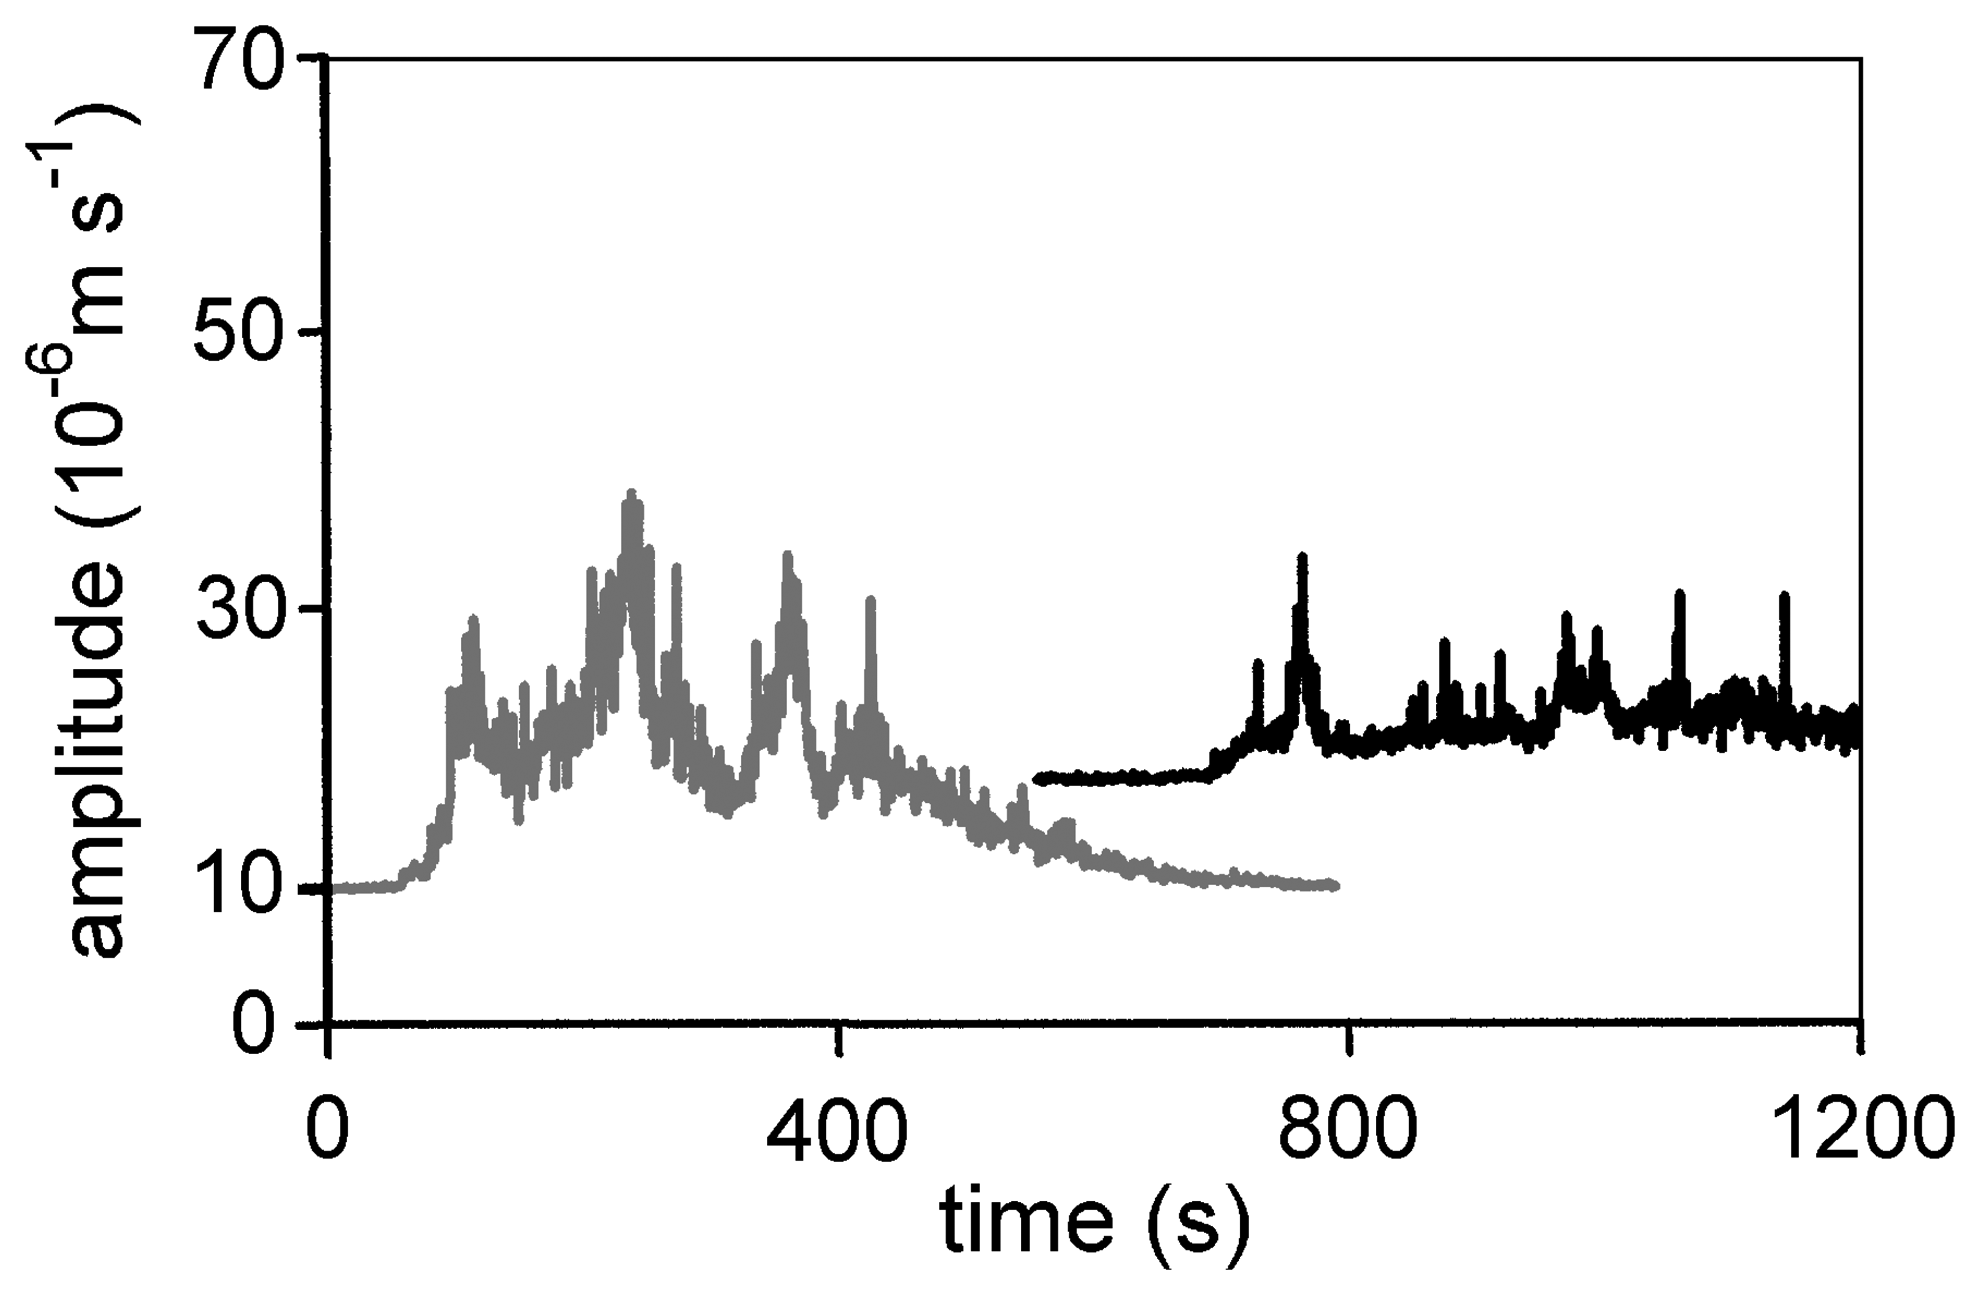
In some debris-flow waves, a univocal recognition of the main front or other common, well-defined features (e.g., secondary waves) in the signals recorded at two monitoring stations is not feasible. In particular, a main debris flow front is not always present upstream of the alluvial fan apex [21]. In these cases, the recorded graphs, both from ultrasonic and seismic sensors, do not show well-defined peaks that can be used for velocity measurements (Figure 8).
In order to use such graphs for velocity measurement purposes, the use of cross-correlation technique may provide a satisfactory solution. In general, cross-correlation can be defined as the correlation of a series with another series, shifted by a particular number of observations; this technique is commonly used in signal processing. Given a certain phenomenon that produced a recorded signal (in our case an ultrasonic or seismic signal) at two different locations, the cross-correlation analysis allows to determine, with an objective method, the time interval elapsed between the appearance of that phenomeon at the first and at the second location. If the distance between the two locations is known, the velocity can then be assessed. Arattano and Marchi have applied cross-correlation of ultrasonic and seismic data to assess debris-flow mean velocity [22].
Doppler speedometers can measure surface velocity of a debris flows. The operating principle of Doppler speedometers is based on measuring the frequency of radio waves reflected by a moving object. The object can be the front of a debris flow, a surface wave, a coarse particle or a piece of woody debris moving on the surface of the debris flow. If the transmitter is placed on a fixed position above a torrent, with the path of the emitted radio wave forming an angle θ with the moving surface, the surface velocity is given by:
where c is the radio propagation speed, fd is the Doppler frequency and f0 is the transmission frequency. The Doppler frequency fd is given by the difference between the received frequency and the transmission frequency (fd = fr – f0).
Itakura et al. [23] and Itakura and Suwa [24] employed speed sensors based on spatial filtering velocimetry to obtain surface velocity measurements of debris flows. Several other methods exist to measure surface velocity based on image processing techniques [25-27].
The load of the debris-flow mass can be measured by installing load cells at the channel bottom [14]. Vertical and horizontal load cells mounted on a force plate make it possible to measure normal and shear stresses [17]; pressure transducers installed at the bottom of the channel make it possible to measure basal pore fluid pressure [17, 28].
Debris flows exert huge impact forces on all obstacles in their path, such as bridge piles, defensive walls and buildings. Assessing impact force is important in designing hydraulic works for debris-flow control. The impact force of debris flows consists of two components: the dynamic pressure of fluid and the collisional force of single boulders. The latter often causes damage to engineering structures. Several devices have been developed to measure the impact force of debris flows [19, 29]. Pressure mark gauges, set on dam walls or large boulders, were employed by Okuda et al. on Mt. Yakedake (Japan). They consist of an aluminum plate and a steel cone attached to a steel plate. The impact on the steel plate causes the sharp apex of the cone to penetrate the aluminum plate; the size of the mark engraved on the plate can be correlated to the impact force. However, this type of gage needs to be reset each time a debris flow occurs. Strain sensors are more sophisticated gauges for monitoring the impact forces of debris flows and can take continuous measurements [19].
Debris flows transport huge masses of water and sediment mixture at high velocities. Because of the destructiveness of these phenomena, sensors that do not require a direct contact with the fluid are normally preferred for their measurement. Amongst the sensors listed in table 1, wire sensors, load cells, pressure gauges and the gauges to measure impact force are contact sensors: their operation intrinsically requires contact with the flowing mass. Wire sensors are among the simplest and cheapest devices used to detect debris flows, and the remaining, more sophisticated gauges are often preferred for continuous recording of debris-flow surges.
Hanisch et al. devised a particular type of contact sensor for debris-flow research [30]. These authors have developed artificial instrumented boulders that are placed inside debris flows to monitor their internal dynamics. The artificial boulders consist of steel casings bearing different types of sensors that are aimed at measuring parameters and variables, such as translational acceleration, impacts from collision, internal fluid pressure. The paper by Hanisch et al. provides a description of the instrumented boulders and outlines their possible use for in-situ measurement of debris flows. A similar principle is used by Chang [11], who developed an “artificially induced composite block”, with magnetic switches inside, that is expected to be entrained and transported by the flow.
Videocameras are mentioned in Table 1 as devices to assess the surface velocity of debris flows. However, their use in debris-flow monitoring is not limited to this task: video recordings give an invaluable contribution to the recognition and interpretation of flow processes and effectively support quantitative monitoring performed by other sensors, such as ultrasonic gauges and ground vibration sensors.
The measurement of the flow parameters listed in Table 1 provides the ground for deriving more parameters relevant for quantitative analysis of debris flows, such as peak discharge and total transported volume. In particular, monitoring debris flow stage and measuring mean flow velocity is a suitable base for assessing discharge and total debris flow volume. The flow area occupied at different times along a debris-flow wave is obtained from stage measurements and topographic surveys of the cross-section geometry. Discharge can be computed as the product of the mean flow velocity by the flow area. Total discharged volume is then computed by integrating debris flow discharge on the hydrograph:
where Vol is the volume of the flowing mass (water and solid particles), v is the mean flow velocity, which is often surrogated by the mean front velocity [31], A(t) is the cross section of area occupied by the flow at the time t and is known from topographic surveys, the ultrasonic data, t0 is the time of arrival of the surge at the gauging site, and tf is the time at the end of the debris flow wave.
The approach to computing the flowing volume presented in eq. 3 assumes that the material flows through the considered section at a constant velocity during the surge. Since mean velocity may vary remarkably during the surge, debris-flow volumes assessed using eq. 3 should be considered as approximate estimates [32]. If flow velocity measurements are available for various phases of the event, they can be used to refine the volume assessment.
When analyzing the downstream evolution of a debris flow, variations of total volume discharged at different gauging stations are suitable indicators of erosion or deposition phenomena [32].
Deposited volume measurements of debris flows can also be carried out through topographic surveys as part of post-event observations. However, pore fluids escape rapidly from the debris flow mixture during deposition, so the measurement of debris flow deposits is not homogeneous with those measurements of the volume of the total flowing material, which include solids and water.
Measuring the bulk density of the flowing debris is extremely difficult, because samplers are easily crushed and washed away. The average bulk density of flowing debris can be assessed by measuring flow depth and load. These quantities can be measured by installing a load cell at the channel bottom and mounting an ultrasonic sensor above the load cell; by computing the ratio of normal stress to flow depth, it is possible to evaluate the mean bulk density of the moving debris flow and its variation with time [17].
3. Debris-flow warning devices
Debris flow warning systems can be classified into two main classes: advance warning and event warning [33]. Advance warning systems predict the possible occurrence of a debris flow event before its occurrence by monitoring predisposing conditions. Event warning systems, or event-triggered warning systems as coined by Davies [34], detect a debris flow while it is already in progress and provide an alarm; eventually a public warning is issued. Hungr et al. also mention an additional class: post-event warning systems, which is intended to detect the fact that a debris flow has occurred and allow appropriate measures (e.g., stopping the traffic on a railway) [33].
3.1. Advance warning systems
The most common pre-event warning systems for debris flows are based on empirical correlations between rainfall and debris flow occurrence. The sensors adopted in debris-flow advance warning systems are those normally used for hydrometeorological monitoring and usually consist of telemetry networks of rain gauges and weather radar.
The simplest way to express these relations is a plot of average rainfall intensity versus time, in which a critical rainfall line is drawn (Figure 9). Other variables, such as cumulative event rainfall, the ratio of cumulative rainfall to mean annual precipitation and maximum rainfall intensity for given duration are also used for identifying critical rainfall thresholds for landslide and debris flow occurrence. Some critical rainfall lines are essentially intended to predict the occurrence of debris flows [32], whereas others do not discriminate between debris flows and other landslides. Critical rainfall thresholds are obtained on the basis of past rainfall records and correspond to the lower-bound lines of rainfall conditions that have triggered debris flows. In the example presented in figure 9, the average rainfall intensity exceeds the critical threshold line after about 7 hours from the beginning of the rainstorm: the availability of a reliable precipitation forecast that could give the predicted intensity of the rainfall some hours in advance would allow the issue of an effective warning.
As far as the space scales are concerned, both global (i.e., based on data collected worldwide) and regional critical rainfall thresholds have been developed. Caine carried out a pioneering study on critical rainfall thresholds for landslides and debris flows using data from different morphoclimatic areas of the world [35]. A number of rainfall thresholds have been proposed since then for various regions. Guzzetti et al. listed 52 intensity-duration thresholds for the initiation of landslides and proposed new thresholds based on 853 rainfall events in central and south-eastern Europe [36]. Advance warning based on critical rainfall thresholds could be refined accounting for antecedent precipitation, which influences soil saturation. Quantitative precipitation forecasts obtained by weather radar would also make it possible to extend the available warning time before expected debris-flow initiation. As a storm begins, rainfall intensities are monitored through a network of rain gauges and meteorological radar; observed rainfall amounts are combined with the estimates contained in the quantitative precipitation forecast and then compared to the critical thresholds.
Critical rainfall thresholds for advance debris-flow warnings are prone to a high probability of false alarms because not all the storms that exceed the critical rainfall thresholds actually trigger debris flows. This is due to the complexity of the debris-flow initiation processes, which cannot be explained by simple rainfall-related variables (as an example, the availability of mobilisable debris is a limiting factor for debris-flow initiation in some basins). As a consequence, advance alarm systems based on rainfall thresholds are suitable for issuing warnings to the staff involved in emergency management, whereas they are generally unsuitable for issuing alarms to the general public. An example of use of advance alarm system to issue a general public warning is given by Wilson et al. [37]. The system was developed by the United States Geological Survey (USGS) and the National Weather Service (NWS) and applied during severe rainstorms in the San Francisco Bay region between 1986 and 1992. The NWS made quantitative forecasts of precipitation and then, for storms with rainfall levels above pre-established thresholds, issued a warning through its radio broadcast system. The warnings were intended to advise motorists that roadways might be obstructed by rock falls or debris flows and that people living in areas at risk should stay alert and be prepared to evacuate.
However many critical thresholds for debris-flow initiation are based on a priori rainfall variables. The implementation of a model that identifies and ranks the factors influencing debris-flow initiation can contribute to an improved identification of hydroclimatic thresholds for warning systems. Jakob and Weatherly have applied discriminant function analysis to identify the most meaningful hydrometeorological variables that allow separating landslide-triggering storms from storms that did not trigger landslides in a coastal area of British Columbia (Canada) [38]. It is worth noting that, in addition to rainfall variables, the discharge in one of the streams of the study area also proved to be a significant parameter in assessing critical conditions for shallow landslides. Stream discharge was included in the analysis to represent the hydrological result of rain, rain on snow, snowmelt and soil moisture.
3.2 Event warning systems
The purpose of an event warning system is to provide an alarm when a debris flow is in progress. The sensors used for event warning systems are often the same adopted in debris-flow channels monitored for research purposes.
Table 2 presents advantages and drawbacks of the most commonly used sensors for debris-flow warning. In addition to the sensors already described in the section 2 of this paper, also pendulums, commonly used for snow avalanches, are used in debris-flow warning systems. One or more pendulums are hanged over the channel. The tilting of the pendulum, caused by the passage of the debris flow, triggers a signal, which can be used for issuing a warning.
The sensors for detecting debris flows are only one component of event warning systems. Further components include a data acquisition and processing unit and devices to spread the alarm (Figure 10). The data acquisition and processing unit, installed in a safe position, receives data from debris-flow sensors, elaborates them and forwards the signals to the alarm devices.
Alarms are disseminated to address both the public, by means of sirens and traffic lights, and the personnel in charge of disaster management, by means of signals in emergency rooms and short messages on mobile phones. Rugged and instable terrain in debris-flow basins makes cable connections between the components of debris-flow warning systems prone to fail due to cable breaking. Wireless connections are thus often preferred [39]. Because single sensors may more easily give false alarms, integrated systems that employ different types of sensors connected to each other for cross checking are recommended [11, 39].
An adequate warning time, i.e., the time between the issuing of the alarm and the arrival of the debris flow to the areas at risk, is a basic requirement when designing a warning system. Debris flows are fast mass movements that take place in short, steep mountainous channels. As a consequence, warning times for event alarm systems seldom exceed 3-5 minutes. This causes important limitations in the use of event warning systems, which can be suitable for protecting transportation routes by stopping the traffic, whereas they are normally unfit to effectively protect inhabited areas because warning times are too short to evacuate people from endangered areas.
It is obviously of the utmost importance to minimize the risk of system failure when issuing an alarm in the event of a debris flow. It is then advisable to adopt redundancy criteria into the design of an event warning system for debris-flows; the various components of the system (sensors, powering, data transmission, processing unit) should all be duplicated.
At the same time, it is imperative to minimize false alarms; this can be achieved through a wise choice of sensors and installation sites. As previously mentioned, the use of integrated systems might also greatly help.
4. Conclusions
This paper has presented an overview of the sensors and systems most commonly employed for debris-flow monitoring and warning. Debris-flow monitoring has made important contributions to the understanding of these hazardous natural processes. Despite the valuable results obtained, monitoring debris flow in instrumented areas has had rather limited development as compared to other approaches to debris-flow research, like physical or numerical modelling, which are more broadly applied. This is probably due to the fact that in many mountainous regions, like the European Alps, debris flows are locally quite rare events. This means that, although several debris flows occur every year in a given region (with area of some hundred of km2), the frequency of these phenomena in individual drainage basins is usually much lower. In these regions, debris flows are frequent enough to cause problems to the public safety, but their frequency is too low to ensure a fruitful collection of data in instrumented areas.
It is not surprising that debris-flow monitoring has had a remarkable development where debris flows have high frequency, as in some areas of Japan and China [19, 29, 39, 40].
The sensors employed for debris flow monitoring are mostly the same used for warning. Debris flow warning systems may have an important role in the frame of non-structural control measures for these hazardous phenomena. An integrated warning system can include sub-systems for both advance warning and event warning.
Advance warning systems can detect the approach of hydrometeorological conditions that are favorable to debris-flow occurrence on a regional scale. Event warning systems can be installed on debris flow channels that have a high likelihood of debris-flow occurrence and where even a short warning time can reduce risks (typically by stopping traffic on transportation routes).
Finally, the need for a careful management and maintenance of debris-flow warning systems must be stressed. The presence of a debris-flow warning system could actually induce a feeling of safety, which is justified only if proper and continuous operation of the system is ensured.
Acknowledgments
This work was supported by the Italian National Research Council as part of the Research Commission TA-P05.010 “Development and application of characterization and monitoring innovative technologies for the prediction, mitigation and management of phenomena of geo-hydrological instability or related to large works and infrastructural networks” and by the European Commission (Project HYDRATE, Sixth Framework Programme, Contract no. 037024).
References
- Johnson, A.M. Debris Flows. In Physical Processes in Geology: a method for interpretation of natural phenomena, intrusion in igneous rocks, fractures and folds, flow of debris and ice; Freeman Cooper and co.: San Francisco, 1970; pp. 433–534. [Google Scholar]
- Pierson, T.C. Flow behavior of channelized debris flows, Mount St. Helens, Washington. In Hillslope Processes; Abrahms, A. D., Ed.; Allen & Unwin: Boston, 1986; pp. 269–296. [Google Scholar]
- Takahashi, T. Mechanical characteristics of debris flow. Journal of the Hydraulic Division ASCE 1978, 104, 1153–1169. [Google Scholar]
- Takahashi, T. Debris flow.; IAHR Monograph; A. A. Balkema: Rotterdam, 1991. [Google Scholar]
- Arattano, M.; Savage, W.Z. Modelling debris flows as kinematic waves. Bulletin of the International Association of Engineering Geology 1994, 49, 3–13. [Google Scholar]
- Coussot, Ph.; Meunier, M. Recognition, classification and mechanical description of debris flows. Earth-Science Reviews 1996, 40, 209–227. [Google Scholar]
- Iverson, R.M. The physics of debris flows. Reviews of Geophysics 1997, 35, 245–296. [Google Scholar]
- Costa, J.E.; Williams, G.P. Debris flow dynamics; U.S. Geological Survey Open File Report 84-606; 1984; video tape, 23 min. [Google Scholar]
- Itakura, Y.; Inaba, H.; Sawada, T. A debris-flow monitoring devices and methods bibliography. Natural Hazards and Earth Systems Sciences 2005, 5, 971–977. [Google Scholar]
- Aulitzky, H. The debris flows of Austria. Bulletin of the International Association of Engineering Geology 1989, 40, 5–13. [Google Scholar]
- Chang, S.Y. Evaluation of a system for detecting debris flows and warning road traffic at bridges susceptible to debris flow hazard. Proceedings of the Third International Conference on Debris-flow Hazards Mitigation: Mechanics, Prediction, and Assessment, Davos, 10-12 September, 2003; Rickenmann, D., Chen, C. L., Eds.; Millpress: Rotterdam, 2003; pp. 731–742. [Google Scholar]
- Arattano, M.; Marchi, L.; Genevois, R.; Berti, M.; Simoni, A.; Tecca, P.R.; Bonte, M. Field monitoring and real time management of debris flows. European Project “Debris Flow Risk” (N. ENV4960253), Final Report. 1999, 30. [Google Scholar]
- Arattano, M.; Deganutti, A.M.; Marchi, L. Debris Flow Monitoring Activities in an Instrumented Watershed of the Italian Alps. Proceedings of the First International Conference on Debris-flow Hazards Mitigation: Mechanics, Prediction, and Assessment, San Francisco, August 7-9, 1997; Chen, C., Ed.; Water Resources Engineering Division - ASCE: New York, 1997; pp. 506–515. [Google Scholar]
- Genevois, R.; Tecca, P.R.; Berti, M.; Simoni, A. Debris-flow in the Dolomites: Experimental data from a monitoring system. Proceedings of the Second International Conference on Debris-flow Hazards Mitigation: Mechanics, Prediction, and Assessment, Taipei, 16-18 August, 2000; Wieczorek, G., Naeser, N., Eds.; A.A. Balkema: Rotterdam, 2000; pp. 283–291. [Google Scholar]
- Suwa, H.; Yamakoshi, T.; Sato, K. Relationship between debris-flow discharge and ground vibration. Proceedings of the Second International Conference on Debris-flow Hazards Mitigation: Mechanics, Prediction, and Assessment, Taipei, 16-18 August, 2000; Wieczorek, G., Naeser, N., Eds.; A.A. Balkema: Rotterdam, 2000; pp. 311–318. [Google Scholar]
- Hürlimann, M.; Rickenmann, D.; Graf, C. Field and monitoring data of debris-flow events in the Swiss Alps. Canadian Geotechnical Journal 2003, 40, 161–175. [Google Scholar]
- McArdell, B.; Bartelt, P.; Kowalski, J. Field observations of basal forces and fluid pore pressure in a debris flow. Geophysical Research Letters 2007, 34, L07406. [Google Scholar] [CrossRef]
- Suwa, H.; Okuda, S. Measurement of debris flows in Japan. Proceedings of the Fourth International Conference and Field Workshop on Landslides, Tokyo, 23-31 August, 1985; pp. 391–400.
- Zhang, S. A comprehensive approach to the observation and prevention of debris flows in China. Natural Hazards 1993, 7, 1–23. [Google Scholar]
- Arattano, M. On the use of seismic detectors as monitoring and warning systems for debris flows. Natural Hazards 1999, 20, 197–213. [Google Scholar]
- Arattano, M. Monitoring the presence of the debris flow front and its velocity through ground vibration detectors. Proceedings of the Third International Conference on Debris-flow Hazards Mitigation: Mechanics, Prediction, and Assessment, Davos, 10-12 September, 2003; Rickenmann, D., Chen, C. L., Eds.; Millpress: Rotterdam, 2003; pp. 719–730. [Google Scholar]
- Arattano, M.; Marchi, L. Measurement of debris flow velocity through cross-correlation of instrumentation data. Natural Hazards and Earth System Sciences 2005, 5, 137–142. [Google Scholar]
- Itakura, Y.; Ogawa, K.; Suwa, H.; Mizuhara, K. Trends and fluctuation of the surface-velocity of debris flow measured by a non-contact speed sensor with a spatial filter. In Fluid control and measurement; Harada, M., Ed.; Pergamon Press: Tokyo, 1985; pp. 781–786. [Google Scholar]
- Itakura, Y.; Suwa, H. Measurement of surface velocity of debris flows by spatial filtering velocimetry. Proceedings of the Japan-China Symposium on Landslides and Debris Flows, Tokyo; 1989; pp. 199–203. [Google Scholar]
- Inaba, H.; Uddin, M.S.; Itakura, Y.; Kasahara, M. Surface velocity vector field measurement of debris flow based on spatio-temporal derivative space method. Proceedings of the First International Conference on Debris-flow Hazards Mitigation: Mechanics, Prediction, and Assessment, San Francisco, August 7-9, 1997; Chen, C., Ed.; Water Resources Engineering Division - ASCE: New York, 1997; pp. 757–766. [Google Scholar]
- Arattano, M.; Grattoni, P. Using a fixed video camera to measure debris-flow surface velocity. Proceedings of the Second International Conference on Debris-flow Hazards Mitigation: Mechanics, Prediction, and Assessment, Taipei, 16-18 August, 2000; Wieczorek, G., Naeser, N., Eds.; A.A. Balkema: Rotterdam, 2000; pp. 273–281. [Google Scholar]
- Arattano, M.; Marchi, L. Video-derived velocity distribution along a debris flow surge. Physics and Chemistry of the Earth Part B 2000, 25, 781–784. [Google Scholar]
- Berti, M.; Simoni, A. Experimental evidences and numerical modelling of debris flow initiated by channel runoff. Landslides 2005, 2, 171–182. [Google Scholar]
- Okuda, S.; Suwa, H.; Okunishi, K.; Yokoyama, K.; Nakano, M. Observations on the motion of a debris flow and its geomorphological effects. Zeitschrift für Geomorphologie N.F., Suppl. Bd. 35 1980, 142–163. [Google Scholar]
- Hanisch, J.; Ergenzinger, P.; Bonte, M. Dumpling-an “intelligent” boulder for studying internal processes of debris flows. Proceedings of the Third International Conference on Debris-flow Hazard Mitigation: Mechanics, Prediction, and Assessment, Davos, 10-12 September, 2003; Rickenmann, D., Chen, C.L., Eds.; Millpress: Rotterdam, 2003; pp. 843–849. [Google Scholar]
- Arattano, M. On debris flow front evolution along a torrent. Physics and Chemistry of the Earth Part B 2000, 25, 733–740. [Google Scholar]
- Marchi, L.; Arattano, M.; Deganutti, A.M. Ten years of debris-flow monitoring in the Moscardo Torrent (Italian Alps). Geomorphology 2002, 46, 1–17. [Google Scholar]
- Hungr, O.; Morgan, G.C.; Van Dine, D.F.; Lister, R.D. Debris flow defenses in British Columbia. In Debris Flows / Avalanches: Process, Recognition, and Mitigation; Costa, J.E., Wieczorek, G.F., Eds.; Geological Society of America, Reviews in Engineering Geology, 1987; Volume 7, pp. 201–222. [Google Scholar]
- Davies, T.R.H. Using hydroscience and hydrotechnical engineering to reduce debris flow hazards. Proceedings of the First International Conference on Debris-flow Hazards Mitigation: Mechanics, Prediction, and Assessment, San Francisco, August 7-9, 1997; Chen, C., Ed.; Water Resources Engineering Division - ASCE: New York, 1997; pp. 787–810. [Google Scholar]
- Caine, N. The rainfall intensity-duration control of shallow landslides and debris flows. Geografiska Annaler 1980, 62A, 23–27. [Google Scholar]
- Guzzetti, F.; Peruccacci, S.; Rossi, M.; Stark, C.P. Rainfall thresholds for the initiation of landslides in cantral and southern Europe. Meteorology and Atmospheric Physics 2007, 98, 239–267. [Google Scholar]
- Wilson, R.C.; Mark, R.K.; Barbato, G. Operation of a Real-time warning system for debris flows in the S. Francisco Bay Area, California. Proceedings of the ASCE 1993 National Conference on Hydraulic Engineering and International Symposium on Engineering Hydrology, San Francisco, 25-30 July 1993; Shen, H. W., Su, S.T., Wen, F., Eds.; ASCE: New York, 1993; pp. 1592–1597. [Google Scholar]
- Jakob, M.; Weatherly, H. A hydroclimatic threshold for landslide initiation on the North Shore Mountains of Vancouver, British Columbia. Geomorphology 2003, 54, 137–156. [Google Scholar]
- Liu, K.F.; Chen, S.C. Integrated debris flow monitoring system and virtual center. Proceedings of the Third International Conference on Debris-flow Hazard Mitigation: Mechanics, Prediction, and Assessment, Davos, 10-12 September, 2003; Rickenmann, D., Chen, C. L., Eds.; Millpress: Rotterdam, 2003; pp. 767–774. [Google Scholar]
- Suwa, H.; Okunishi, K.; Sakai, M. Motion, debris size and scale of debris flows in a valley on Mount Yakedake; Japan; IAHS Publ. no. 217, 1993; pp. 239–248. [Google Scholar]
Figure 1.
A typical debris flow hydrograph (Moscardo Torrent, Italy, 8 July 1996). The debris flow appears as a wave, with a steep front, behind which the stage gradually decreases. It is possible to note the short duration of the event.
Figure 1.
A typical debris flow hydrograph (Moscardo Torrent, Italy, 8 July 1996). The debris flow appears as a wave, with a steep front, behind which the stage gradually decreases. It is possible to note the short duration of the event.

Figure 2.
Two pictures from video recording of a debris-flow wave: a) precursory surge; b) debris flow peak.
Figure 2.
Two pictures from video recording of a debris-flow wave: a) precursory surge; b) debris flow peak.

Figure 3.
Wire sensors installed on a check dam [12].
Figure 3.
Wire sensors installed on a check dam [12].

Figure 4.
An ultrasonic sensor installed to monitor debris flows in an alpine stream.

Figure 5.
Debris flow hydrographs recorded at three monitoring sites in the same stream (Moscardo Torrent, Italy, 22 June 1996). The distances between the sensors are 144 m and 226 m, respectively.
Figure 5.
Debris flow hydrographs recorded at three monitoring sites in the same stream (Moscardo Torrent, Italy, 22 June 1996). The distances between the sensors are 144 m and 226 m, respectively.

Figure 6.
Debris flow recording detected by ground vibration sensors: amplitude versus time (Moscardo Torrent, Italy, 22 June 1996).
Figure 6.
Debris flow recording detected by ground vibration sensors: amplitude versus time (Moscardo Torrent, Italy, 22 June 1996).

Figure 7.
Flow depth measurement at two monitoring stations makes it possible to assess mean front velocity (the horizontal scale is shortened with regard to both the distance between the sensors and the debris flow profile).
Figure 7.
Flow depth measurement at two monitoring stations makes it possible to assess mean front velocity (the horizontal scale is shortened with regard to both the distance between the sensors and the debris flow profile).

Figure 8.
Debris-flow signals recorded along a channel from upstream (left) to downstream (right), which do not show a unique, well-defined intensity peak (Moscardo Torrent, Italy, 8 July 1996 [22]).
Figure 8.
Debris-flow signals recorded along a channel from upstream (left) to downstream (right), which do not show a unique, well-defined intensity peak (Moscardo Torrent, Italy, 8 July 1996 [22]).

Figure 9.
Example of critical rainfall thresholds for debris-flow initiation.

Figure 10.
Sketch of the components of a debris-flow warning system.


| Parameter | Sensor employed for the measurement |
|---|---|
| Peak flow depth | Direct post-event observation through theodolite or GPS, wire sensors, photocells, ultrasonic sensors |
| Flow depth as function of time | Ultrasonic sensors, radar sensors |
| Ground vibration | Seismometer or geophones (velocimeters, accelerometers) |
| Underground sound | Microphones |
| Mean flow velocity | Ultrasonic sensors, geophones |
| Surface velocity | Electromagnetic doppler speedometers, video recordings, speed sensors based on spatial filtering velocimetry |
| Basal forces (normal and shear stress) | Load cells |
| Fluid pore pressure | Pressure sensors |
| Impact force | Pressure mark gauges, piezoelectric sensors |
| Sensors | Operation | Advantages | Limitations |
|---|---|---|---|
| Ultrasonic, radar and laser sensors. | Measurement of the flow stage. | Easy to set warning thresholds. | Ultrasonic sensors have to be hung over the channel; installation can prove difficult if the channel banks are unstable. |
| Geophones and seismometers. | Measurement of ground vibrations caused by debris flow. | Easy and safe installation (the sensors are buried in safe places on stream banks). | Setting warning thresholds can be quite complicated. Risk of false alarms due to other sources of ground vibration (passage of trains or trucks, rockfalls, etc.). The need to filter the signal may increase system complexity. |
| Pendulums. | Detection of the debris-flow from the tilting of the pendulum. | Simple and robust device. | The pendulum must be hung over the channel; installation can prove difficult if the channel banks are unstable. |
| Wire sensors. | Detection of the debris-flow from wire breaking. | Simple and robust device. | Need for restoration after activation. Risk of false alarms due to accidental circumstances (passage of animals, falling trees, etc.). |
| Photocells (infrared photobeams, etc.). | Detection of debris-flow passage. | Non-contact detectors: do not need restoration after activation. | A careful installation is needed to avoid having the sensors come into contact with the flow. |
| CCD camera for machine-vision detection. | Recognition of debris flows. | Safe installation (the camera can be placed beside the channel). | The presence of fog or the occurrence of debris flow at night may complicate the use of the system and its workability. |
© 2008 by MDPI (http://www.mdpi.org). Reproduction is permitted for noncommercial purposes.
Share and Cite
MDPI and ACS Style
Arattano, M.; Marchi, L. Systems and Sensors for Debris-flow Monitoring and Warning. Sensors 2008, 8, 2436-2452. https://doi.org/10.3390/s8042436
AMA Style
Arattano M, Marchi L. Systems and Sensors for Debris-flow Monitoring and Warning. Sensors. 2008; 8(4):2436-2452. https://doi.org/10.3390/s8042436
Chicago/Turabian StyleArattano, Massimo, and Lorenzo Marchi. 2008. "Systems and Sensors for Debris-flow Monitoring and Warning" Sensors 8, no. 4: 2436-2452. https://doi.org/10.3390/s8042436